availability, distribution and ... - spb.kerala.gov.in
TRANSCRIPT

AVAILABILITY, DISTRIBUTION AND UTILISATION OF HEALTH CARE SERVICES IN KERALA
Achutha Menon Centre for Health Science Studies (AMCHSS) Sree Chitra Tirunal Institute for Medical Sciences and Technology, Trivandrum
Dr Manju R Nair, Dr Ravi Prasad Varma

1

2
ACKNOWLEDGEMENTS
We are happy to present the report of the research project titled “Availability, Distribution
and Utilisation of health care services in Kerala” funded by the Kerala State Planning Board.
We are deeply indebted to Dr Jayakumar K, Director, Sree Chitra Tirunal Institute for Medical
Sciences & Technology for his support, which was the single most important factor that made
the execution and completion of this project possible. We are thankful for the unwavering
support that the head of our department Dr P Sankara Sarma had provided us through all
the hurdles that we faced.
We gratefully acknowledge the guidance and insights of the members of the planning board,
especially Dr B Ekbal in shaping this study.
We take this opportunity to extend our special thanks to the Ms Rekha V Dev, Chief (i/c),
Evaluation Division, Kerala State Planning Board for her consistent support throughout the
period of this project
We appreciate the support of the officials of the Department of Health Services, Dr K
Sandeep, Deputy Director, DHS, Department of Economics and Statistics, Ms Resmi C P,
Deputy Director, MCCD, Department of Economics and Statistic and others who helped us
with the collection of secondary data.
We thank the assistance and support of the team at SOMA, Triandrum for providing us with
their data and also organising and conducting our training and data collection efficiently.
Special thanks is due to Mr Manas Chacko, Ms Chaithanya Dhanraj and Ms Rajalakshmi for
their research support
Dr Manju Nair R, Scientist C
Dr Ravi Prasad Varma, Associate Professor
AMCHSS, SCTIMST
17/3/2021

3
1.Background
Kerala’s development experience has drawn considerable interest and discussions from
diverse fields and perspectives in the last four decades. Despite continuing debates on its
determinants and sustenance, there is a fairly unanimous agreement that a strong public
sector presence in the social sector including health was one of its main drivers.
A relatively well funded public health care sector that ensured the availability and the
accessibility to a wide network of government health care facilities formed an integral
element of the ‘good health at low cost’ model of the state.
However, a gradual shift in the growth and provision of health care services that happened
in the State since the 1990s led to an inexorable growth and dominance of the private sector
in healthcare. The period also had a cut down on government spending on health which led
to a fall in investment particularly on medical supplies and capital building. Detailed analysis
has clearly indicated that the public sector spending on health significantly reduced and
private sector vastly outstripped the public sector in the late 1990s. The fundamental
foundation of the concept of ‘good health at low-cost model’ that the state was famed for,
was threatened and raised concerns about the issues of quality, access and exclusion in the
health sector and a larger fear of a potential increase in health inequities. These concerns
seemed justified when Kerala topped the nation in out-of-pocket expenditure on health
across the socioeconomic strata with catastrophic health expenditure highly concentrated
among the poor.
The people of the state are also known for their high health care seeking which is most likely
due to the presence of a wide network of health care infrastructure and a strong culture of
traditional and indigenous system of health care seeking.

4
Consequently, the focus of policy making for health in the state has lately shifted to major
strategies and plans to ensure universal health coverage in the State. The stress is currently
on improving the quality of services, strengthen the role of the government in the provision
and regulation and financing of health care and the protection of the people from
catastrophic health expenditures. The key underlying elements are that of ensuring
equitable health access as a right and ensuring financial protection for health care to the
poor. This resonates with the efforts that are currently on in Kerala, through the programmes
of Aardram and specific health protection schemes to strengthen the health care systems at
all levels of health care and deliver comprehensive health care for all. The aim is to revive
the presence of the public sector in health to achieve ‘population coverage, service coverage
and cost/financial coverage’ – the three dimensions of Universal Health Care as described by
the World Health Organisation. Therefore, providing access to effective and affordable
health care services of sufficient quality is the crux of any effort to move towards universal
health coverage
1.1Healthcareaccessandutilisation
World Health Organization’s (WHO) definition of its priority goal of universal health
coverage as “….ensuringthatallpeoplehaveaccesstoneededpromotive,preventive,curative
andrehabilitativehealthservices,ofsufficientqualitytobeeffective,whilealsoensuringthat
peopledonotsufferfinancialhardshipwhenpayingfortheseservices.” The core aim of health
policy and planning, globally has been to provide their people equitable' access to health care
resources.
The term ‘access’ to health care resources has more than one definition and is a complex
concept with multiple dimensions; the four main dimensions being availability, accessibility

5
affordability and acceptability. Many have equated accessibility to physical or geographical
access to health care, whereas others have defined it as one’s ability to utilize health care
when needed and some consider ‘access’ and ‘use’ as synonymous.
Access to health care is often presumed to naturally happen when health care services are
made available. However, there is considerable literature relevant to South Asia indicating
that the availability of health care services does not automatically translate to access for
many sections of a population. The ability of individuals or groups who are affected by single
or multiple axes of inequalities and deprivation could limit their access even if services are
made available.
Access is a reality when people use the services when they need them and therefore
utilisation of health care services is often considered a surrogate measure of the population’s
access to health care services. Making available health care services and ensuring access
without exclusion involves the creation of structures and processes that are inclusive as well
as enabling. A body of scholarship further theorize that health access is best understood as
shaped by supply and demand side factors to tackle it more effectively. The conceptual
differences around the definitions of health access and its measurements raise considerable
challenges for health systems globally; to find appropriate interventions as well as indicators
to measure their outcomes.
Health access is known to be heavily influenced by various factors that range from
individual to larger political economy factors. Availability of health facilities is seen to
positively impact on health care seeking among people. Even more than the quantum of
facilities their pattern of distribution is more likely to influence people’s health care
utilization. Studies from several regions of the world substantiate the fact misdistribution of

6
facilities results in increased distances, time of travel and cost involved to seek care in times
of need. These factors also account largely for the differentials in health care utilization
between the rural and remote regions and urban areas. It is further complicated by the
finding that geographical distribution indicating skewness in one particular dimension of
access may not be deficient in another and highlights the risk of broad and incorrect
categorizations of areas based on mapping related to any one dimension.
Considerable sections of the population do not seek care for their illnesses due to fact
that those services are unaffordable for them. Lower social and economic entitlements are
known correlates of lower access to health care. People from economically weaker sections
of the society, lower caste and class have been consistently found to receive less health care
compared to others across countries. Health facilities made available do not necessarily
translate into functioning, effective and acceptable health care, due to insufficient human and
other resources, poor skills and attitude of the providers, lack of accountability and poor
quality of care. Perception of poor quality of services erodes people’s confidence in these
institutions and negatively impact on their health access.
In addition, utilization of health care services is a multifactorial outcome which is
influenced not only by the four dimensions of access (availability, accessibility affordability
and acceptability) related ‘supply side’ factors but also certain ‘demand side’ factors that
shape people decisions to seek care. Demand for health care is thought to be dependent
heavily on people’s perception of diseases and their cure, the prevailing culture of illnesses
and health care seeking in their environments; as well as the autonomy, freedom and the
sense of entitlement that individuals and groups have to choose and seek care. Gendered
differences in health care utilization especially in the developing countries, lower reported

7
rates of morbidity among the poor and the most marginalized sections are borne out of these
differences.
It has been well documented that access to health care and utilisation rates have wide
differentials within populations and several factors like geographic location of residence,
racial and cultural differences, social and economic status and physical distances contributes
to them. Differential utilisation of health care services in a society can be an effective pointer
to the inequities in the provision and access of services and help identify pockets of exclusion
1.2 Healthcareaccess–thecontextandchallengesinKerala
The fame that Kerala has gained globally is an outcome of a long process of evolution of a
society with several historical advantages of having a systematic indigenous health care
system, traditional cultural practices, progressive rulers, early contact with foreign traders,
missionaries and modern medical systems; catalyzed by progressive social, cultural and
political movements to a position of comparative advantages already at the time of the
independence. The dominant discourse of the cultural, social and political movements in the
state from the late 19th century has been for transformative based on principles of social
justice, human rights and inclusion. As a result, this formed the framework for policy making
and governance by the democratically elected governments post-independence.
The indication for the commitment of the successive governments of Kerala in ensuring
social equity according to scholars, is in the pattern of investments in social sectors
particularly health, and education. As a result, a rapid growth in the educational and health
facilities occurred in the state till the mid-1980s.
The State was always ahead of the rest of the country in terms of provision of health care to
its population. More than 90% of the villages in Kerala had access to a health dispensary and

8
about half of the villages had a health centre within two kilometres and 78% of the villages
had access to a hospital within five kilometres from the late 1970s. (RWFranke&BHChasin,
Kerala:RadicalReformasDevelopmentinanIndianState). Along with a strong social and public action
it was the reasonably well distributed and well-functioning public health care institutions
that enabled the state to deliver preventive and curative services effectively, reduce its
mortality rates and attain impressive health indicators.
Despite the impressive achievements, there were concerns even from the late 1980s, about
certain trends that could potentially derail the state's achievements. Studies from as early as
1984 brought to discussion the high prevalence of reported morbidity in the state despite
the low mortality rates. (P.G.K.PanikarandC.R.Soman,HealthStatusofKerala:TheParadoxofEconomic
BackwardnessandHealthDevelopment.CentreforDevelopmentStudies,Trivandrum,1985.). In the decade
from 1986-1996, the private sector has outstripped the public sector in its growth in terms
of the number of facilities as well as beds as well as quality (KuttyVR) The demographic and
epidemiologic transition that happened in the state, the consequent non-communicable
disease burden, increased demand for care and expectations of people for quality of care
were challenges that the public health care sector in Kerala were not prepared for.
The availability and the accessibility to a dominant and wide network of government health
care facilities which was considered an integral element of the ‘Kerala model' of
development.1 The gradual shift in the growth and provision of health care services in the
state has been documented in the state since the 1990s with a steady growth and dominance
of the private sector in health care provision. The stagnation in the public health care sector
and the unregulated growth of the private sector and the escalation in the out-of-pocket

9
health care expenses that followed, raised concerns about the sustenance of the
achievements that the state had made.
Studies indicated the that the decadal growth of hospital beds (1986-96) was only 5% in the
government sector compared to almost 40% in the private sector and the difference was
significantly marked in the availability of newer and advanced diagnostic and therapeutic
facilities.2Around 82% of the hospitals, 86% of the doctors and almost 58% of hospital beds
were in the private sector in the early 2000s.3
Evidence also indicate that the shift from the government to the private sector for outpatient
care happened even among the poor sections of the population4 . Factors like availability of
health care services, accessibility and affordability were also found to create variations in
morbidity and hospitalizations among population sub groups and regions within Kerala.5
Kerala also tops the country in terms of reported morbidity as well as health care seeking.
High literacy, low rural-urban differentiation, culturally habituation to traditional health
care healing practices of the Ayurveda, notions of health, illnesses and cure borne out of it,
high consciousness of their right to health etc. are some of the drivers of the demand for
health care in the state. This has given rise to a challenging situation where high demand
paralleled by a high growth of private sector in health care has escalated the cost of health
care.
The consequence of such a high utilization of private health care has been an increase in the
out-of-pocket health care expenditure in Kerala. Kerala topped the country in 2013-14 in
terms of private per capita expenditure on health. A recent study revealed that Kerala has
the highest per capita expenditure on health in India and households pay more than seventy
five percent of those expenses. This increases the possibility of large proportions of the

10
population being impoverished due to catastrophic health expenditure. Around three
fourths of all the health care expenses in the State was borne by households, while the
government contribution was only about 20 percent.6,7 The increase in health care spending
in the state is also partly due to higher health care seeking behaviour and the demographic
and epidemiologic transition in the state. The escalation of out-of- pocket expenditure and
the high reliance on the private sector even for outpatient care are causes of concern because
of the potential it has in creating inequities in access for the poorer and the marginalized
sections of the population.8 Health care expenditure has been documented as the reason for
about 12 % of rural households and 8 % of urban household in Kerala to be pushed below
the poverty line.9
The private sector continues to surpass the once dominant publicly funded health care
facilities. Kerala has the highest density of health facilities in India; with the majority of
doctors, hospitals and beds in the private sector. There also exists wide regional inequalities
in terms of availability of facilities and coverage.
In the light of the above concerns, there has been a conscious effort on increasing the public
spending on health; the government expenditure has increased from about 9 percent to 19
percent.6 It has been estimated that the increased public spending has contributed to
bringing down to out-of-pocket spending in Kerala by about 2 percent.6
A study carried out by the Kerala Sasthra Sahitya Parishad indicated that utilization of public
health facilities has increased from around 25 percent to about 45 percent in the past few
years. In this context, Government of Kerala has clearly stated in the 13th Five year plan its
intention10“to restore the centrality of the public sphere in health and education, and to
create people-friendly systems of health” In tune with this commitment, it has also launched

11
the ‘Aardram’ mission to transform the public health sector at the primary, secondary and
tertiary levels.
Rationaleforthestudy:
Although there exist conceptual differences in the definitions of health access and utilization,
there is a dominant view that the ‘rate of utilization of effective health care among the
population’ is a good indicator for a health system performance. Though there are important
demand side factors that affect utilization of health care services, supply side factors like
availability and quality of health care are also crucial for policy makers to remove such
barriers.
The current study is proposed in this context to document the distribution of health facilities,
patterns of utilization of health care in the modern medicine sector and identify key factors
that influence their provider choices, in order to aid health care policy making.

12
Chapter2
Methodology
2.1Objectives
The objectives of the research were
1. To document the existing distribution and coverage of modern health care facilities*
including public, private & community-based health facilities in Kerala
2. To study the patterns of health services utilization in the state and factors that
influence the differential use of public and private services
*Health care facilities to include all public, private and other sectors in the modern system of
medicine.
*Definition of health facilities: Health facilities include all public, private, non-governmental
and community-based health facilities defined as a static facility (i.e., has a designated
building) in which general health services are offered. Health posts can be counted as static
facilities, but because they are generally small with minimal supplies, they may need to be
disaggregated for interpretation purposes. The indicator does not include mobile service
delivery points and non-formal services such as traditional healers. (Source: WHO, 2010,
monitoring the building blocks of health systems: a handbook of indicators and their measurement
strategies,Geneva:WHO.)
2.2Methods
a) To document the existing distribution and coverage of health care facilities in the
state

13
Secondary data analysis: Using all sources of publicly available secondary data
sources including reports and from the relevant departments of health, medical
education and economics and statistics and other sources.
b) To study the patterns and correlates of health services utilization in the state
Crosssectionalsurvey:
The results of a Cross sectional survey among 1200 households selected using multi
stage random sampling was used for this study
Samplesizeandsampling:
A sample of around 1200 households; 200 households from six randomly
selected districts using a multi stage stratified random sampling
Districts were first ranked according to the ratio of the number of hospital
beds per 100,000 in the public sector to that in the private sector and
categorized into high, medium and low categories. Two districts were
randomly selected each category totalling to six districts
From each district, a total of one panchayat and one corporation/municipality
were randomly selected
From each panchayat/municipality, wards were selected using simple random
sampling. The number of rural and urban wards selected was proportionate
to the rural and urban population in the particular district
From each ward, twenty households were selected for the survey. With the
help of the panchayat members, a list of households in the selected ward was
sought and was used to randomly identify the first household. Two data
collectors in each ward were assigned two different households for the

14
purpose. From the assigned first household, each of them will visit every third
house till ten households each are completed, thus completing a total of twenty
households per ward
One respondent from each household (head of the household or a willing adult
who is knowledgeable and capable of answering about the members of the
household) will be the respondent. Data required for the completion of the
questionnaire was collected from her/him.
The proportion of the rural and urban samples in each district was
proportionate to the rural and urban population of the individual districts
(Table1.1)
Table1.1.Samplingfromtheselecteddistricts–ruralandurban
Study Tool: The household survey was carried using a structured questionnaire that
explored the health care seeking practices for tracer chronic and acute morbidity (e.g.
hypertension/diabetes, fever in the previous two weeks, in patient stays in the last six
months etc.). An adapted version of the questionnaire used in the NSSO 71st round of
National Sample Survey Organisation related to social consumption including health was
used for this study11
District Population Rural (%)
Population Urban (%)
Sample - Rural No. of wards * No of households
Sample -Urban Total
Thiruvananthapuram 46 54 5 *20 =100 5*20 =100 200 Thrissur 33 67 3*20=60 7*20=140 200 Pathanamthitta 89 11 9*20=180 1*20=20 200 Alappuzha 46 54 5*20=100 5*20=100 200 Idukki 95 5 9*20=180 1*20=20 200Kannur 35 65 3*20=60 7*20=140 200 Total 1200

15
Chapter3
Resultsfromsecondarydataanalysis
3.1Resultsfromthesecondarydata
Secondary data was collected and analysed to understand the availability and distribution of
modern medical health care institutions in the state. Reports and studies from the
directorate of health services, department of economics and statistics, govt of Kerala, reports
from the state and central governments and smaller studies looking at utilisation of health
care services in the state. The information collated from the different sources is collated in
tables provided below.
The information regarding the infrastructure (no. of institutions, beds, facilities were
sourced from various government departments, agencies and reports. However, the data
regarding the exact number of private hospitals, beds, personnel etc were not available
readily. This information was captured mainly from estimates made by various agencies and
indirect sources.
The availability of medical institutions for health care in each district was assessed based on
the data related to the medical institutions and beds published by the Directorate of Health
services, data related to private medical facilities from the reports published by the
Department of Economics and Statistics and the Government of India from time to time.
Though statistics regarding the number of medical facilities are published regularly, it
includes only the data related to the facilities and services under the Directorate of Health
services.

16
According to the World Health Organisation (WHO) a hospital bed is “a bed that is regularly
maintained and staffed for the accommodation and full-time care of a succession of
inpatients and is situated in wards or a part of the hospital where continuous medical care
for inpatients is provided.” A sanctioned bed capacity is the bed capacity that is officially
permitted whereas functional bed capacity reflects the actual functional status of them.
Medicalinstitutionsandbedcapacity:
There is a total of 1280 institutions under the Directorate of Health Services with a total bed
strength of 43183 according to the report published by the Health information cell of the
Directorate of Health Services in 2018.
Table3.1ModernmedicineinstitutionsundertheDirectorateofHealthServices2016‐17
Source:Healthataglance.2018,HealthInformationCell.Directorateofhealthservices.
Sl.no Institutions Number Beds 1 General Hospitals 18 6920 2 District Hospitals 18 5167 3 Speciality Hospital 22 5557 4 Taluk Hospital 81 8438 5 Community Health Centers 232 6571 6(a) Primary Health Centers 680 2034 (b) 24X7 Primary Health Centers 168 3145 Total PHC [6 (a+b)]f 848 5179 7 T.B. Centers/Clinics 14 24 8 Other Institutions 47 148 Total Govt. Modern Medicine Institutions 1280 34008 Speciality Hospital Category wise
1 W & C Hospitals 7 1639 2 Mental Health Center 3 1342 3 T.B. 4 622 4 Leprosy Hospital 3 1690 5 Others 5 264 Total 22 5557 Subcentres 5408

17
As per the National Health Profile (NHP) 2018 for the reference period of 2017, the average
population served by a government hospital in Kerala was 27873 and the average population
served per government hospital bed was 939 (TheestimateoftheNHP2018wasbasedon
thehospitalsundertheDirectorateofhealthservicesonly,sinceitwascalculatedwithatotal
of1280hospitals,38004bedsandaprojectedpopulationof3,56,77000(mid‐yearpopulation)
forthereferenceperiodof1/1/2017fromtheRegistrarGeneralofIndia)
Health facility density is an indicator that is recommended by the WHO to assess health care
availability and it primarily indicates access to outpatient care; however, by definition health
care facility is defined as including both public and private hospitals, health centres, district
and rural hospitals specialized and teaching hospitals. Most figures published for Kerala at
the state and national levels are based on facilities under the Directorate of health services
and is an underestimate of the real scenario.
Table3.2Bed(underDHS)‐PopulationRatio–districtwiseinKerala–2016‐17
Sl.No. District Populationcensus2011
No.ofbeds‐modern
medicine‐GovtPopulationtobedratio
Hospitalbeds(DHS)/10,000population
1 Wayanad 817420 1367 598 17 2 Pathanamthitta 1197412 1948 615 16 3 Alappuzha 2127789 3424 621 16 4 Thiruvananthapuram 3301427 4879 677 15 5 Kottayam 1974551 2817 701 14 6 Ernakulam 3282388 4544 722 14 7 Kannur 2523003 2990 844 12 8 Thrissur 3121200 3519 878 11 9 Idukki 1108974 1096 1012 10
10 Palakkad 2809934 2622 1072 9 11 Kozhikode 3086293 2820 1094 9 12 Kollam 2635375 2388 1104 9 13 Kasaragod 1307375 1087 1203 8 14 Malappuram 4112920 2503 1643 6
State 33406061 38004 879
11.4 Source:Healthataglance.2018,HealthInformationCell.Directorateofhealthservices.

18
From the table above, there are inter district variations in the beds/10,000 population (beds
in the institutions under the Directorate of health services.). The population to bed ratio
provided above by the Directorate of Health Services, is based on the population of 2011
census. However, iftheprojectedpopulationoftheRGIason1/1/2017(356,77,000)isusedin
forthecalculationas,theoverallpopulationtobedratioinKeraladuringthereferenceperiod
is939andhospitalbeds(undertheDHS)/10,000populationwas10.7.
While there is no global fixed norm for this indicator, comparative national level figures for
India (5 in 2018) are Srilanka (35.1 in 2010), Sweden (24.4 in 2015) and Cuba (52.4 in 2017).
The distribution of the number of the institutions (1280) and beds (38004) available per
district is provided in Table 3.3
Table3.3BedStrength–districtwiseinKerala–underDirectorateofHealthServices
Source:Healthataglance.2018.HealthInformationCell.DirectorateofHealthServices
Doctor to bed ratio (Table 3.4) is another indicator provided by the Directorate of Health
Services; where three districts fall far behind the other districts, namely Malappuram,
Sl.no District RuralBed Institutions(rural)
UrbanBed Institutions(urban)
1 Thiruvananthapuram 1364 82 3515 36 2 Kollam 884 60 1504 28 3 Pathanamthitta 1059 62 889 5 4 Alappuzha 1679 82 1745 8 5 Kottayam 1575 76 1242 8 6 Idukki 922 60 174 3 7 Ernakulam 1630 89 2914 26 8 Thrissur 2094 99 1425 19 9 Palakkad 1418 104 1204 10 10 Malappuram 905 105 1598 19 11 Kozhikode 767 75 2053 17 12 Wayanad 560 33 807 9 13 Kannur 1075 85 1915 23 14 Kasaragod 433 51 654 6 16365 1063 21639 217

19
Kasaragod and Idukki. Palakkad, Kannur and Pathanamthitta also have a doctor bed ratio
that is below the state average.
A better indicator of the health care services functioning would be the doctor – population
ratio, since it can aid the policy makers to identify the maldistribution/ inefficient use of the
human resources component and gauge regional disparities.
Table3.4DoctorBedRatio(Government‐ModernMedicine)undertheDepartmentofHealthServices(2017‐2018)Sl.No. District No.of
BedsNo.ofDoctors Doctorbedratio
2016‐171 Ernakulam 4544 492 9.2 2 Alappuzha 3424 374 9.2 3 Thiruvananthapuram 4879 543 9.0 4 Kozhikode 2820 335 8.4 5 Thrissur 3519 429 8.2 6 Kollam 2388 307 7.8 7 Wayanad 1367 177 7.7 8 Kottayam 2817 367 7.7 9 Palakkad 2622 369 7.1 10 Kannur 2990 425 7.0 11 Pathanamthitta 1948 280 7.0 12 Malappuram 2503 452 5.5 13 Kasaragod 1087 198 5.5 14 Idukki 1096 219 5.0 State 38004 4967 7.7 Source:Healthataglance.2018,HealthInformationCell.Directorateofhealthservices.
Most indicators for the state in terms of human resources, bed capacity, doctor population
ratio is calculated based on the most regularly updated and updated information regarding
the infrastructure and human resources under the Directorate of health services. These
indicators would be underestimates of the real situation since services and human resources
in the various medical colleges and dispensaries and hospitals under the State government
ESI and ESI corporations are not collated.

20
From Table 3.4, there exists 33 medical colleges in Kerala; close to fifteen thousand beds
available in the public and an almost similar number of beds in the private sector colleges.
Only one third of the medical colleges in Kerala are in the government sector
Fig3.5MedicalcollegesinthepublicandprivatesectorinKeralawithbedcapacity‐2018
Public*Public-
beds Private*Private-
beds Total
Colleges Total Beds
1 Kannur 1 1200 1 750 2 1950 2 Ernakulam 1 700 3 2950 4 3650 3 Kottayam 1 910 0 0 1 910 4 Kozhikode 1 3080 2 915 3 3995 5 Malappuram 1 501 1 630 2 1131 6 Idukki 1 300 1 380 2 680 7 Kollam 1 500 2 1000 3 1500 8 Thrissur 1 2350 2 2190 3 4540 9 Palakkad 1 750 2 850 3 1600
10 Thiruvananthapuram 1 3250 4 1950 5 5200 11 Alleppey 1 1051 0 0 1 1051 12 Pathanamthitta 0 0 3 2000 3 2000 13 Wayanad 0 0 1 700 1 700 14 Kasaragod 0 0 0 0 0 0
Kerala 11 14592 22 14315 33 28907*Public – does not include GMC, Konni and Private‐ does not include Kerala Medical College, Palakkad Source: Based on National Health Profile 2019 and secondary data collected from several sources
Table3.6.Totalbedsinthegovernmentsector–Kerala‐2017 No of hospitals Beds Directorate of Health Services
1280 38004
ESI Corporation 23 1240
Medical Colleges 22 14592
Grand Total 1325 53836 Source:NationalHealthProfile2019
From this table, the bed density (government sector) per 10000 population in Kerala
considering a population of 35677000 is 15.1
In Kerala, under the Employees State Insurance Scheme of India medical facilities are provided
through 4 ESI Corporation (GOI) and 9 state ESI hospitals, 1 ESI annexe at Government Chest disease
sanatorium, Pulayanarkottah and 145 full time dispensaries

21
Doctorpopulationratio:
According to the figures reported by the National Health profile, 2019, the doctor population
ratio (working in the government sector) for Kerala as on 1/1/2017 is presented below.
Table3.7aDoctortopopulationratio(Govt)–KeralaState‐2017Doctors – Modern medicine
5239 Population (as on 1/1/2017)
Doctor/1000 population
Dental surgeons 172 Total 5411 356,77,000 1.5 Source:NationalHealthProfile2019
Table3.8aRegisterednurses,midwivesandLHVs–KeralaState‐asonJanuary31,2018 Number Auxillary nurse midwives 30530 Registered nurses and midwives 261,951 Lady Health Visitors 8507 Total 300,988 Source:NationalHealthProfile2019
Table3.7a.TotalnumbersofdoctorsregisteredwiththestatemedicalcouncilinKeralaasonJanuary31,2018
NumberRegistered up to 2010 40007 Registered from 2011-18 59353 Total 99360 Source:NationalHealthProfile2019
Assuming 80% availability of doctors and 75% availability of nurses, as is usually estimated
by the medical council, 79,488 doctors and 225,741 nursing personnel would be available
for active services. This would equal to about 8.6 doctors, nurses and midwives per 1000
population in Kerala.
The density of private medical institutions under modern medicine per 100,000 is provided,
in the table below. The data provided below is from a survey on private medical institutions
done by the Department of Economics and Statistics, but does not specify whether medical
colleges in the respective districts are included.

22
Table3.9.Numberofprivatemedicalinstitutionsprovidingmodernmedicalcareper100,000population–Kerala‐2017‐18
Fig3.1Privatemedicalinstitutions(ModernMedicine)per100,000population‐districtwiseSource: ReportonSurveyonPrivateMedicalInstitutionsinKerala:2017‐18.DepartmentofEconomicsandStatistics
30.2
25.123.5
22.3 21.5 21 20.6 19.7 19 19 18.8 18.2 18.2
14.4
0
5
10
15
20
25
30
35
District
No. of private hospitals providing modern medical care Population
Density of private hospitals/100,000 population
Ernakulam 991 3282388 30.2 Idukki 278 1108974 25.1 Kottayam 464 1974551 23.5 Kozhikode 687 3086293 22.3 Pathanamthitta 257 1197412 21.5 Kasaragod 275 1307375 21 Kannur 519 2523003 20.6 Kollam 519 2635375 19.7 Malappuram 780 4112920 19 Thiruvananthapuram 628 3301427 19 Alappuzha 400 2127789 18.8 Wayanad 149 817420 18.2 Thrissur 569 3121200 18.2 Palakkad 404 2809934 14.4 Total 6920 33406061 20.7 Source: Report on Survey on Private Medical Institutions in Kerala: 2017‐18. Department of Economics and Statistics

23
According to the survey of private medical institutions conducted by the Department of
Economics and Statistics during 2017-18, there were 12363 registered private medical
institutions in Kerala, with some providing services of more than one system of medicine.
Out of the 12363 institutions, 56% (6920) provide modern medicine services.
Table3.10 Hospitalsintheprivateandpublicsector–KeralaandIndia
Number of hospitals in public sector
Number of hospitals in private sector
Total number of hospitals (public & private)
Hospitals 1280 (38.3%) 2062 (61.7%) 3342 (100%) Beds 38004 (38.3%) 61223 (61.7%) 99227 (100%) Source:KapoorG,SriramA,JoshiJ,NandiA,LaxminarayanR.Covid‐19inIndia:state‐wiseestimatesofcurrenthospitalbeds,intensivecareunit(ICU)bedsandventilators.CenterForDiseaseDynamics,Economics&Policy.21Apr2020.*ThenumberofhospitalsintheprivatesectorisanestimatedfigurewhereasthatinthepublicsectorarefromprimarydataprovidedbyStatereports The above data is from an estimate done to assess the infrastructure available to manage Covid 19
in India by the Center For Disease Dynamics, Economics & Policy, USA; in which the numbers in the
public sector are from state reports and the private sector figures are estimated. The estimated
figures indicate that more than 60% of the hospitals in Kerala are in the private sector. The state
reports are based on only the institutions under the DHS (1280) whereas as per Table 3.6 it totals
to 1325.
Fig:3.2Numberofhospitalsintheprivateandpublicsector–Indianstates

24
Fig:3.3Numberofhospitalbedsintheprivateandpublicsector–Indianstates Source:KapoorG,SriramA,JoshiJ,NandiA,LaxminarayanR.Covid‐19inIndia:state‐wiseestimatesofcurrenthospitalbeds,intensivecareunit(ICU)bedsandventilators.CenterForDiseaseDynamics,Economics&Policy.21Apr2020.*ThenumberofhospitalsintheprivatesectorisanestimatedfigurewhereasthatinthepublicsectorarefromprimarydataprovidedbyStatereports
SpecialistservicesTable3.11. ICUbedsintheprivateandpublicsector–KeralaandIndia
Number of ICU beds in public sector
Number of ICU beds in private sector
Total number of ICU beds (public& private)
Kerala 1900 (38%) 3061 (62%) 4961 (100%) India 35699 59262 94961 Source:KapoorG,SriramA,JoshiJ,NandiA,LaxminarayanR.Covid‐19inIndia:state‐wiseestimatesofcurrenthospitalbeds,intensivecareunit(ICU)bedsandventilators.CenterForDiseaseDynamics,Economics&Policy.21Apr2020.*ThenumberofhospitalsintheprivatesectorisanestimatedfigurewhereasthatinthepublicsectorarefromprimarydataprovidedbyStatereports
According to the State wise estimates done to assess the infrastructure available to manage
Covid 19 by CDDEP, USA; among the seven states where most of the beds and ventilators in
India were concentrated, Kerala figured as the seventh with 5.2% of the national facilities
Table3.12.Deliveriesbytypeofinstitution–Kerala–districtwise–2017‐18

25
District Public Private Home Institutionaldelivery
Totaldeliveries
%Public
%Private
Thiruvananthapuram 20648 19804 17 40452 40469 51 49 Alleppey 7802 9237 16 17039 17055 45.8 54.2 Kozhikode 21604 31705 9 53309 53318 40.5 59.5 Kottayam 8288 14119 3 22407 22410 37 63 Kollam 8674 17091 22 25765 25787 33.7 66.3 Wayanad 4137 9469 135 13606 13741 30.4 69.6 Idukki 3295 7822 51 11117 11168 29.6 70.4 Pathanamthitta 3753 9900 14 13653 13667 27.5 72.5 Palakkad 8147 26854 49 35001 35050 23.3 76.7 Kannur 9497 31993 17 41490 41507 22.9 77.1 Thrissur 8098 32681 15 40779 40794 19.9 80.1 Kerala 45896 214075 336 259971 260307 17.7 82.3 Ernakulam 6545 31911 25 38456 38481 17 83 Kasaragod 3125 15960 22 19085 19107 16.4 83.6 Malappuram 10484 74676 208 85160 85368 12.3 87.7 Kerala 169993 547297 939 717290 718229 23.7 76.3Source:HealthataGlance.DirectorateofHealthServices2018
Data published by the Directorate of Health Services indicate a huge divide in the proportion
of deliveries that happen in the government and private sector. It indicates that more than
three fourths of the deliveries in the State happened in the private sector (76.3%) and less
than a quarter happened in the public sector, in the year 2017-18. According to the reports
from the Sample Registration System it was 45% and 55% in the public and private sectors
respectively
Table3.11Percentageoflivebirthsbytypeofmedicalinstitution‐Kerala Percentage of live births Government sector 44.8 % Private sector 54.8% SRSstatisticalreport2017
Table3.13.Birthsdeliveredbycaesareansection–Kerala–districtwise‐2015‐16
District
BirthsinprivatehealthfacilitiesdeliveredbyCsec(%)
BirthsinapublicfacilitydeliveredbyCsec(%)
BirthsdeliveredbyCsec(%)
Thiruvananthapuram 53.6 28.6 41 Kollam 60.2 53.3 57
Pathanamthitta 51.4 52.9 52.1 Alappuzha 49.9 35.9 43.6 Kottayam 43.2 13 28.3

26
Idukki 45.8 48.7 47.1
Ernakulam 39.2 43.3 40 Thrissur 34.4 32.5 33.7 Palakkad 38.3 26.6 34.4
Malappuram 24.2 23.9 24 Kozhikode 40.6 25.7 33.8 Wayanad 21.9 23.9 22.8
Kannur 32.1 35.8 33.6 Kasaragod 28.4 21.1 26.3 Kerala 38.6 31.4 35.8
Source:HealthataGlance.DirectorateofHealthServices2018(datacompiledfromNFHS2015‐16) According to the National Family Health Survey 2015-16, one thirds (36%) of births were
delivered by Caesarean section. Emergency caesarean sections formed about 36% of them,
accounting for about 13% of all births.
Table3.14.BloodbanksinKerala–GovtandPrivate
Number Frequency Govt blood banks (including defence, cooperative sector) 45 25.7 Private blood banks 130 74.3 Total 175 100
It is evident that the private sector dominates in the provision of blood bank services. Table3.15PercutaneousCoronaryInterventions(PCI)doneduringtheyear2018Typeofinstitution No.ofPCIsdone PercentagePrivate 27095 63% Government 16073 36% Co-operative 435 1% Total 44413 Source:InterventionalCardiologyCouncilofKerala
Among the more specialised procedures like the (previously termed angioplasty with stent),
about 40% of the interventions are carried out in the government sector. (Table 3.14)
Table3.16RenaltransplantsdoneinKerala‐2018&2019Typeofinstitution 2018 2019Private 657 (89.6) 713 (91.6) Government 76 (10.4) 65 (8.4)

27
Total 733 (100) 778 (100)
Table3.17LivertransplantsdoneinKerala–2018&19Typeofinstitution 2018 2019Private 169 (100%) 153 (100%) Government 0 0 Total 169 153
Dialysis
In a study on an assessment of Out-Of-Pocket expenditure Incurred by dialysis patients and
its impact, a major proportion of patients attended private facility (53.7 percent) and the rest
were spread between public (35.8) and standalone facilities (10.5).
Among the 190 patients, 105 (55.3 percent) patients have had to change the facility since
dialysis was started. Among those who had had to change the facility, 90.5 percent were
initiated on dialysis at a private facility and at the time of interview, only 19.0 percent were
undergoing the procedure at private facility. When need arose for hospital admissions for
any illness since dialysis, 74.2 percent had required hospital admissions of which 98.5
percent sought care from a private facility
TBreporting:As per the RNTCP reports of 2017, out of a total of 14522 reported cases,
8232 (57%) were from the private sector
Emergency trauma services: A study on clustering of emergency trauma services in a
buffer of 5 km around the Trivandrum city in 2017, 20 out of the 83 facilities were in the
government sector and 63 were in the private facilities But mean distance from the road
traffic accident (RTA) hotspot to nearest facility was almost the same for government facility
(1.26 km) and private facility (1.23 km)
Healthcareseeking–PublicandPrivatesector

28
Evidencefromsmallerstudies
In a study carried out in Kollam district on Diabetes and complementary and
alternative medicine use (2015), close to sixty percent (59.3%) of the sample
sought treatment. Around 60 percent exclusively modern medicine, 30%
modern medicine and CAM and 9% exclusively CAM.
A study done among elderly with fall, 67% of the elderly who had a fall in the
previous year had approached a government facility for care, 29% sought care
from a private hospital and four percent from the nearest general practitioner
immediately after the fall
Another study on self-reported Diabetes in Kozhikode (2016), among those
who reported diabetes, 54% preferred private hospitals and clinics whereas
around one fourth (n=26%) took treatment from a government facility
A study on postpartum screening in mothers with gestational diabetes in
Malappuram district in 2016, only 11% of the total deliveries in the district
had happened in the public facilities and among those who had tested for their
blood sugar post-partum, 50.4% had utilised private hospitals, 11.3% had
utilised public hospitals and 34% directly approached the laboratories for
testing
A study that explored the breastfeeding pattern among mothers in Palakkad
in 2016 found that 41.2% of the deliveries in the previous year had happened
in a government hospital and 58.8% in a private hospital.

29
A similar study on perinatal care in Kozhikode in 2015 found that 57.8% of the
deliveries took place in private hospitals compared to the government
facilities
Study on gynaecological morbidity in perimenopausal women in Kollam in
2017, 52 percent of them sought treatment in private secondary or tertiary
hospital. There were 268 participants among 420 who were reported to have
at least one of the chronic medical conditions such as hypertension, diabetes
mellitus, high cholesterol or other medical conditions including cancers and
among them, 268 women of which 32.1 percent had sought care in private
clinic.
Table3.18.KarunyaArogyaSurakshaYojana–preauthorisationsbypublicandprivatesectorsinthefinancialyear2019‐20
Pre authorisations (number) Pre authorisations (amount in INR ) Public 7,44,800 (76%) 547.5 crores (79%) Private 2,35,200 (24%) 145.5 crores (21% 9, 80,000(100%) 693 crores (100%)
The preauthorisations reflect the fact that roughly a quarter of the preauthorised claims
were for treatments that were done in the private sector.
Among the number of preauthorisations, 72% were for medical purposes and 26% for
surgical procedures. Similarly, among the preauthorised amounts, 60% were for surgical
procedures.
Table3.19.Percentageofdeathswheremedicalattentionwasreceivedathospitals(Govt/Private)‐2018
Rural Urban TotalIndia 43.2 60.4 47.8 Kerala 86.2 73 79.6Andhra Pradesh 43.9 60 47.2 Assam 33.9 46.6 35.6 Bihar 29.6 50.6 32.1

30
Chhattisgarh 35 61.2 40.1 Delhi 41.5 67.4 66.7 Gujarat 38.2 59 44.8 Haryana 36.3 40.1 37.3 Himachal Pradesh 66.7 69.3 66.8 Jammu & Kashmir 49.1 75.8 56.8 Jharkhand 30.7 60.2 34.8 Karnataka 44.7 66.8 50.8 Madhya Pradesh 51.1 73 55.9 Maharashtra 44.2 63 49.9 Odisha 46.4 56.2 47.7 Punjab 51.7 65.1 56.4 Rajasthan 47 55.6 49.1 Tamil Nadu 38 57 46.9 Telangana 39.8 57 44.9 Uttar Pradesh 48 56.3 49.8 Uttarakhand 54.4 57.1 55 West Bengal 38.8 59.3 45.6 Source:SRSStatisticalReport2018 The table above is another indication of the high health care seeking behaviour among the
people in Kerala across the rural urban divide. Eighty percent of all people who had died in
Kerala in a particular year had received medical attention in a hospital (government or
private) before their death. Among the rural population, it was higher than eighty five
percent.
Healthsystemfunctioning‐someindicators
Fig3.4.VacancyofmedicalofficersatPrimaryhealthcentres–KeralaandIndia

31
Source:GovernmentofIndia.HealthyStatesProgressiveIndia:ReportontheRanksofStatesandUnionTerritories,2019.NITIAayog.GovernmentofIndia
Fig3.5.Vacancyofspecialistsatdistricthospitals–Kerala&IndiaThe
The figures above indicate that the vacancy of medical officers at primary health centres as
well as specialists at district hospitals, in Kerala are the lowest in India which is an indicator
of its better health system functioning.

32
Table3.20.Indicatorsofpublichealthcareinstitutionalfunctioning‐vacanypostions–Kerala‐2017‐18
Vacancy of ANMs at subcenters (%)
Vacancy of Staff nurses at PHC/CHC (%)
Vacancy of MOs at PHCs (%)
Vacancy of specialists at District hospitals (%)
5.3 3.6 2.4 13.5 Was 21.5 in the year 2015-16
Source:GovernmentofIndia.HealthyStatesProgressiveIndia:ReportontheRanksofStatesandUnionTerritories,2019.NITIAayog.GovernmentofIndia
Table3.21.Indicatorsofpublichealthcareinstitutionalfunctioning–functionalinstitutionsKerala‐2017‐18
Functional FRUs (%
Functional CCU per district (%)
CHC grading (%)
Quality accreditation of District/Subdistrict hospitals (%)
Quality accreditation of CHC/PHC (%)
Functional Cardiac care units per district
107.5 78.6 0.4 7.6 4.6
Source:GovernmentofIndia.HealthyStatesProgressiveIndia:ReportontheRanksofStatesandUnionTerritories,2019.NITIAayog.GovernmentofIndia
Unfilled vacancies of staff at subcentres and primary health care centres including JPHNs
staff nurses and medical officers are less than five percent in Kerala. Kerala was one of the
three states with less than five percent vacancies in the country; the other being Uttar
Pradesh and Karnataka
Vacancies of specialists at district hospitals has fallen from 21.5 percent in 2015 to 13.5
percent in 2018. However, such vacancies in the district hospitals may affect the poorer
sections of the populations negatively and force them to travel greater distances or incur
more expenditure to access care from tertiary centres or from private hospitals.

33
Chapter4
Resultsfromthecross–sectionalsurvey
Baselineinformation Data was collected from six districts mentioned above covering a total of 1208 households. Around
56 percent of the households surveyed were in the rural areas and about 44 percent from the urban
areas.
Table4.1BaselineinformationregardingthestudypopulationDistrict Frequency PercentAlappuzha 201 16.6 Idukki 201 16.6 Kannur 201 16.6 Pathanamthitta 201 16.6 Thiruvananthapuram 200 16.6 Thrissur 204 16.9 Total 1208 100.0
Areaofresidence
Frequency Percent Rural 682 56.4 Urban 526 43.5 Total 1208 Variables Rural Urban Totaln(%)Ration Card APL 376 311 687 (57%)
BPL 271 191 462 (38%)
Anthyodaya 27 19 46 (4%)
Nil 7 3 10 (1%) 1205 (100) * Caste Scheduled Caste 63 (75.9) 20 (24.1) 83 (6.9)
Scheduled Tribes 21 (36.8) 36 (63.2) 57 (4.7)
OBC 335 (53.4) 292 (46.6) 627 (52.2)
General 243 (62.3) 147 (37.7) 390 (32.3)
Others 18 (64.3) 10 (35.7) 28 (2.3)
Do not want to disclose 2 (10) 18 (90) 20 (1.7) 1205 (100) * Religion Hindu 405 (57.8) 296 (42.2) 701 (58.1)
Christian 153 (63.2) 89 (36.8) 242 (20.1)
Muslim 120 (46.5) 138 (53.5) 258 (21.4)
Buddhist 1 (50) 1 (50) 2

34
Others 2 (100) 0 (0) 2
No religion 1 (100) 0 (0) 1 1206 (100*) Source of drinking water Bottled water 0 (0) 1 (100) 1
Tap or Pipe 111 (44.8) 137 (55.2) 248 (20.5)
Tube well 149 (68.3) 69 (31.7) 218 (18.1)
Tanker Lorry 6 (100) 0 (0) 6
Pucca Well 325 (53.5) 283 (46.5) 608 (50.5)
Tank or Pond reserved for drinking 8 (100) 0 (0) 8
River or Canal 1 (100) 0 (0) 1
Public well or tap 58 (67.4) 28 (32.6) 86 (7.1)
Others 24 (82.8) 5 (17.2) 29 1205 (100) * Type of toilets
Pit 40 (70.2) 17 (29.8) 57 (4.7)
Septic Tank or Flush System 627 (55.7) 499 (44.3) 1126 (93.5)
Public Toilet 0 (0) 1 (100) 1
Shared Toilet 3 (60) 2 (40) 5
Others 1 (100) 0 (0) 1
No Toilets 10 (75) 2 (25) 12 (1%) 1202 Cooking fuel Firewood 275 (64.1) 154 (35.9) 429 (35.6%)
LPG 403 (52.4) 366 (47.6) 769 (63.9%)
Kerosene 3 (100) 0 (0) 3 (0.2%)
Electricity 1 (50) 1 (50) 2 (0.2%)
Others 0 (0) 1 (100) 1 (0 ) 1204
*Thedenominatorsarenotaddingupto1208duetomissingdata
About 12% of the participantss belonged to SC/ST groups and more than 50% belonged to
OBC groups. More than 50 percent of the households belonged to the hindu community and
20% each to christian and muslim communities
The mean age of the population was 38.4 (SD 21.5) and the median was 38 years (range from
1-98 years). The mean age of women was 38.9 and that of men was 38 (S D 21.2)

35
Drinkingwater : Only about one in five households had taped water in their homes and
another one fifths sourced water from their own tube wells. More than half of the households
had well as their main source of drinking water and though small, close to 10 percent of the
households’s main water source were of potentially low quality like tanker, rivers and open
ponds.
Comparable figures from other surveys indicate that well water continues to be the main
source of water (65.1% - KSSP survey in 1996 and 63.1% - NFHS 4 2015-16), a large
increase in the number of households with taped water (4.2% -KSSP 1996 and 19.5% NFHS
4 2015-16) and that a similar proportion of households resorted to other potentially unsafe
water sources. It is also noted that tube well being used as the main source of drinking
water was only 4.4% in 2015-16 in contrast to almost one fifths of the households in this
survey
Toilets: Majority of the households had their own toilets (98%) of which about 94% had
toilets with septic tank or flush system. However, there were about 1.6% who had no or
shared toilets. The proportion of those who had no toilets/shared toilets was also reported
to be 1.6% in the large scale National Family Health Survey (NFHS) 4 survey done in 2015-
16 period. The corresponding figure reported by the survey carried out in 1996 by the Kerala
Sasthra Sahithya Parishad was 28%.
Around 64% of the households used LPG, a cleaner fuel as the main cooking fuel. More than
one third of the households still used firewood as the main cooking fuel.
Individualcharacteristicsofthehouseholdmembers

36
Table4.2.CharacteristicsoftheindividualmemberswithinthehouseholdsVariables Total n(%) Sex Male 2449 (48.9)
Female 2561 (51.1) Total 5010 (100) Marital status Never married 1756
Currently married 2857
Widowed 346
Divorced or Separated 25 Total 4984 (100) *
Education Not literate 369
Below Primary 383
Primary 572
Upper Primary or Middle 747
Secondary 1182
Higher Secondary 664
Diploma or degree 1086 Total 5003(100) * *doesnotaddupto5010duetomissingvalues
There were a total of 5010 individual members in the 1208 households that were included in the survey. Of them, slightly more than fifty percent of the members were female and about 49% were male. Figure4.1.Populationpyramidoftheparticipants

37
The population pyramid of the participants reflects the less bottom heavy population scenario that
is expected of a state with low fertility rates.
Fig4.2.Educationalsstatusoftheparticipants–sexdisaggregated
Hospitalisation
Among the participants, 447 (8.6%) had a history of hospitalization in the last 1 year
preceding the date of interview
Table4.3:Demographicsandhospitalisation Sample size Hospitalization P value (Chi
square for trend)Agegroup,n(%)Under 10 years of age 501 35 (7) <0.001* Adolescents (10-19 years) 684 23 (3.4) Adults (20-59 years) 2870 204 (7.1) Elderly (60 years and above) 953 171 (17.9) Gender,n(%)Male 2449 226 (9.2) 0.152 Female 2559 207 (8.1) Educationalstatus,n(%)Not literate 369 56 (15.2) <0.001* Below Primary 383 42 (11) Primary 572 65 (11.4)

38
Upper Primary or Middle 747 76 (10.2) Secondary 1182 102 (8.6) Higher Secondary 664 44 (6.6) Diploma or degree 1086 46 (4.2) Insurancecoverage,n(%) Government funded insurance including ESI/CGHS
1891 190 (10) 0.013*
Employer supported health protection
148 7 (4.7)
Private Insurance Company 192 21 (10.9) Others 11 0 (0) Not covered 2755 215 (7.8)
*Significant There was a significant difference in hospitalisation across the age groups. As expected,
people belonging to older age groups (60 years and above) reported more hospitalisations
followed by those under 10 years of age. Similarly, a significant difference in hospitalisation
was observed across the insurance coverage categories There was no significant difference
between males and females in terms of hospitalisation in the previous 365 days.
Hospitalisationepisodes
Among those who were hospitalised about 70 percent were hospitalized once, 16 percent
were hospitalized twice and around 15 percent were hospitalized thrice or more. Seven of
the admissions were due to health problems caused due to floods. There was no significant
difference in terms of hospitalisation episodes between males and females
Table4.4Frequencyofhospitalisationintheprevious365days
Number of times hospitalized in the previous 365 days Frequency Percent Once 299 69.7 Twice 68 15.8 Thrice 28 6.5 >Thrice 34 8 429 100

39
Fig4.3.Agedistributionandnumberofhospitalizationsinthepreviousyear(sexdisaggregated)
When the number of hospitalisations in the previous year was considered, more than one admission
was mainly among the older groups
Hospitalisationinthelastoneyear:otherfindings
There were 447 hospitalisation events in the previous 365 days, 433 (97%) were in the modern
medicine institutions. An analysis of the medical system where the hospitalisations occurred and the
type of medical institutions where they were admitted are provided in the tables below
Table4.5.Hospitalisationsandchoiceofthesystemofmedicine
Frequency Percent Allopathy 433 96.9 Ayurveda 11 2.5 Homeopathy 1 0.2 Yoga & Naturopathy 1 0.2 Siddha 1 0.2 Total 447 100

40
Modern medicine was the system of medicine under which, almost ninety seven percent of the
hospitalisation occurred.
Table4.6.Hospitalisationeventsinthelast365daysandthetypeofhospital
Frequency Percent Public 199 44.5 Private 248 55.5 Total 447 100.0
Among last 365 days, 44.5 percent were in a public hospital and 55.5 percent in private hospitals
Table4.7.Typeofwardinthecaseofthehospitalisations Frequency Percent Free 194 43.6 Paid general 141 31.7 Paid special 110 24.7 Total 445 100
Around 45% of the hospitalisations were in wards that provided free care and fifty five percent of
them were in paid general or special wards
Hospitalisationsinthelast365daysbySESquintilesLast 365 days
1st quintile
2nd quintile
3rd quintile
4th quintile
5th quintile
Total
Public, n (%)
67 (33.7) 41 (20.6) 36 (18.1) 32 (16.1) 23 (11.6) 199 (100)
Private, n (%)
42 (16.9) 44 (17.7) 55 (22.2) 47 (19) 60 (24.2) 248 (100)
When the hospitalisation episodes and the type of institution was analysed by SES quintiles it was
observed that a larger proportion of the hospitalisation episodes in the government facilities were
among those who belonged to the lower quintiles; compared to a higher proportion of those from the
higher quintiles in the private hospital hospitalisations
Durationofstayduringhospitalisation
The median duration of admission was 7 days, (inter-quartile range 4-12 days).

41
Reasonsforhospitalisationinprivatehospitals: The commonest reasons that were stated by
those who sought admission at a private institution was “the required service was not
available” followed by “satisfactory quality but long waiting time” in the government
hospitals About 20 % of the respondents reported their perception of low-quality services
as the reason for seeking care from the private sector
Table4.8.ReasonsfornotavailingservicesatagovernmentfacilityRequired specific services not available 66 27.2 Quality satisfactory but involves long waiting time 56 23.1 Available but quality not satisfactory 49 20.2 Quality satisfactory but facility too far 35 14.4 Others 36 14.8 Total 242 100
Table4.9.Morbidityduetoachronicillness Number Percent Has a chronic illness Yes 813
16.3
No 4189 83.7
Total 5002 100 Almost one fifths of the participants (13.7) reported some form of chronic illness. The distribution
of reported chronic illnesses across age groups and sex of the participants is provided in Fig 3.
Some form of chronic illness was reported by 929 (16.7) persons.
Fig4.4Distributionofchronicillnessacrossagegroupsandsexoftheparticipants

42
Among both the sexes, the distribution of chronic illnesses indicates that it is the highest in the 60
plus age group followed by those in the age group between 20-59
Table4.10:Chronicillnessandinsurancecoverandhospitalisation
Hospitalized p value Chronicillness No 259 (5.6%) <0.001 Yes 216 (23.3%) InsurancecoverageGovt schemes/CGHS/ESI 211 (10.3%) Employer provided coverage 9 (5.6%) Private health insurance 25 (11.7%) Others 0 (0.0%) None 211 (7.4%)
Hospitalisation among those with chronic illness was significantly higher than those who did not
report any such illness.
However, there were no difference in hospitalisation the type of insurance coverages that the
participants had.
Acuteillnessinthefifteendayspriortointerview

43
The reported prevalence of an acute illness in the 15 days prior to the date of the interview was
13.1% among the participants
Table4.11.Reportedmorbidityduetoanacuteillnessinthepast15daysAcute illness Number Percent
Yes 679 13.6
No 4328 86.4
5007 100 Prevalence of reported acute illness in the previous 15 days was highest among children under 10
years followed by older people aged 60 years and above. There was no significant difference between
the two sexes. (Fig 4.5)
Illnessinthelast15days
Information was available on 696 episodes of acute illness in the last 15 days prior to the survey. Of
these, 72.2% were conditions of acute onset while the rest were ongoing chronic conditions. Among
those who reported an illness 47.7% mentioned complete recovery on or before the date of the
survey. Health care was sought for 662 episodes and 34 resorted to self -medication or local
pharmacies.
The commonest conditions reported were:
Table4.12.Commonestreportedacuteillnessinthelast15daysDiagnosis Percent Fever 60.0 Diabetes related 9.6 Asthma/Breathing problem 4.7 Heart attack 2.5 Fig4.5.:Distributionofacuteillnessacrossagegroupsandsexoftheparticipants

44
Prevalence of reported acute illness in the previous 15 days was highest among children under 10
years followed by older people aged 60 years and above. There was no significant difference between
the two sexes
Table4.13.Healthcaresoughtforepisodesforacuteillnessinthelast15days Frequency PercentPublic 402 60.7Private 260 39.3Total 662 100.0
More than 60 percent of the 662 episodes of acute illness was treated at a public facility (PHC or
other public institutions) and close to 40 percent of the episodes were treated at a private facility
Table4.14.Careseekingforacuteillnessinthelast15daysbySESquintiles

45
The highest proportion of treatment of acute illness at the public facilities were of those
who belonged to the lowest quintile in contrast to the care seeking in the private sector
where those related to the lowest quintile was the lowest.
Table4.15.Systemformedicineinthecareseekingforacuteillnesses
System of medicine Percent Modern medicine 90.4 Ayurveda 3.5 Homoeopathy 2.8 Missing 3.3 Total 100.0
Around 90 percent of the care seeking for acute illnesses were from the modern medical system. Table4.16.Sourcesofcareseekingforacuteillnesses
Percent JPHN/ Anganwadi/ ASHA 1.9PHC/CHC/FHC 21.7 Government Hospital 39.7 Private doctor 9.7 Private hospital 23.6 Missing 3.3 Total 100.0
In the case of acute illness episodes, primary health centre and government facilities are
the most commonly approached (around 63%)
Table4.17.Financialprotection‐insurance Insurance coverage
Government funded insurance 1891
38.0
1st quintile
2nd quintile
3rd quintile
4th quintile
5th quintile Total
Public, n (%)
134 (33.3) 85 (21.1) 73 (18.2) 68 (16.9) 42 (10.4) 402 (100)
Private, n (%) 39 (15) 58 (22.3) 46 (17.7) 51 (19.6) 66 (25.4)
260 (100)

46
Employer supported health protection 148 3
Private Insurance Company 192
3.8
Others 11 0.2
Not covered 2755 55.1 4997* 100 *doesnotaddupto5010duetomissingvalues Among those who responded, only 45 percent had some kind of financial protection in the
form of insurance schemes. About 85 percent of those who had an insurance coverage were
covered by a government funded insurance including the ESI/CGHS etc. However more .than
half of the respondents did not have any insurance coverage for health conditions
Fig:4.6.Financialprotectionbyagegroup–sexdisaggregated
Chapter5
Discussion
The study was done to understand the availability, distribution and utilisation of the modern
medical health care institutions in Kerala. Data regarding the availability and distribution of
the institutions, secondary data primarily from the Directorate of Health Services and the
Department of Economics and Statistics was used for the purpose.

47
The average population served by a government hospital in Kerala was 27873 and
the average population served per government hospital bed was 939 during the
reference year 2017.
The overall population to bed ratio in Kerala during the reference period was 939 and
hospital beds (under the DHS)/10,00 population was 1.1
This is better when compared to the other states in India and While, according to the WHO
there are no global standards for these indicators, comparative world average is 3.98
beds/1000 population, India (0.5 in 2018) Srilanka (3.5 in 2010), Sweden (2.4 in 2015),
Brazil (2.6), China (2.5) and Cuba (5.2 in 2017).
The health facility density and the inpatient bed density are the commonly used indicators
for this purpose by the WHO for national and regional comparisons. Bed population ratio or
hospital beds per 10,000 population is an indicator recommended by the WHO to assess the
health care services availability and in particular in-patient facility Health facility density is
often used as an indicator to assess outpatient service. These are measures that enables the
policy makers to gauge the access of a populations to inpatient services and to identify
regional disparities in terms of service provision.
These indicators are used by the WHO routinely to make regional and country level health
system performance, but advises caution in its interpretation at smaller subnational units
like districts. When applied to smaller units like the districts, variations in terms of the size
of the hospitals (in terms of the number of beds) and geographical clustering of the
institutions influences these indicators and therefore can lead to erroneous conclusions
about the availability of services and inter district comparisons that may not be useful.

48
Health facility density is an indicator that is recommended by the WHO to assess health care
availability and it primarily indicates access to outpatient care; however, by definition health
care facility is defined as including both public and private hospitals, health centres, district
and rural hospitals specialized and teaching hospitals.
Most figures published for Kerala at the state and national levels are based only on the
facilities under the Directorate of health services and could be an underestimate of the real
scenario. It will seriously underestimate the available services since there are close to 29,000
beds in the government and private medical colleges as per our finding and there are no
reliable official figures regarding the number of beds in the private sector.
Data regarding the inpatient beds available in the medical facilities are published on the basis
of the sanctioned beds and not functional beds. Better indicators like average length of stay
during hospitalisation and bed occupancy rate to assess the efficiency of health care services
provided is not generated routinely. Having achieved the basic requirements of health care
infrastructure in Kerala, efforts must now stress on generating valid and routine data
regarding functional bed density, bed occupancy rate, average length of stay during
hospitalisation etc through the health management information system (HMIS) from all
levels of institutions, public and private. This alone shall routinely inform policy makers on
the genuine inter and intra district variations in availability as well as access to health care
services.
A better bed/10,000 population in a district do not translate to better access and utilisation
of these services, because there could be issues related to geographical location, terrain,
clustering, travel time and even client preferences for facilities outside the district based on
their socio-cultural preferences, perceptions of quality or convenience.

49
If global positioning system coordinates of all the health care service delivery facilities are
available for all the districts, it could be regularly analysed. In order to avoid estimating the
physical /geographical distance to the nearest health services point, functional services
available in each facility and actual travelling time are estimated in countries where it is
routinely practiced.
The conventional indicators that are available and reported are not useful to gauge regional
disparities within and between districts, in terms of actual access and identify the
marginalised groups in terms of availability and access to care.
From the number of doctors, nurses and midwives registered with the state councils, around
8.6 doctors, nurses and midwives per 1000 population in the State; the ‘Sustainable
Development Goals index threshold’ for the minimum density of health workers is 4.45 per
1000.
Morbidity rates: The morbidity rate for acute illnesses during the two weeks
preceding the date of the interview was 135.6 per 1000 population and chronic
diseases was 162.5 per 1000 population. In comparison, the percentage of persons
who reported as ailing in the last two weeks was 240.5 per 1000 persons in the NSSO
2017-18. As per the KSSP survey in 1996 it was 121.9 for acute diseases and 114.9
for chronic diseases. The increase in chronic diseases morbidity rate could be
indicative of the growing burden of non-communicable diseases in the state.
Healthservicesutilisation
Private sector has been the dominant provider for inpatient as well as outpatient curative
services in Kerala as well as in India since the 1990s.

50
Surveys carried out by the National Sample Survey Organisation (NSSO) during 2017-18
indicated that 62% of the inpatient care were provided by the private health care sector in
Kerala and the percentage share of the government hospitals in the hospitalisation cases was
only 38 percent. However as per this survey (2019), among the hospitalisation episodes in
the previous 365 days, 55.5 percent was in the private sector and 45.5 percent in the public
hospitals. There seems to be a distinct increase in the percentage share of the government
hospitals in terms of hospitalisations. When the hospitalisation episodes and the type of
institution was analysed by SES quintiles it was observed that a larger proportion of the
hospitalisation episodes in the government facilities were among those who belonged to the
lower quintiles.
The commonest reasons that were stated by those who sought admission at a private
institution was “the required service was not available” followed by “satisfactory quality but
long waiting time” in the government hospitals, perception of low-quality services in the
government sector as well as distance to the facility were the other reasons for seeking care
from the private sector. These reasons have been consistent from studies from 1989 (Kutty
1989). This points to the fact that focused efforts on improvement of the quality of services
in the government sector especially for inpatient services and making them client centred is
required.
In terms of acute illnesses in the previous 15 days, it was found that 61% of the people had
approached a government source or facility (PHC/CHC/Government hospital). PHC/CHC
was the most common facility used.
It was also observed that only about 45% of the households had any form of insurance
coverage and about eighty four percent of those who were insured were covered by a

51
government insurance scheme. However, data related to the preauthorisations of the
Karunya Arogya Suraksha Yojana indicates that 24% of the claims were from the private
sector. This also needs to be taken into account when public sector contribution to health
care is considered.
In terms of speciality care like, cardiology, nephrology, delivery care and services like the
blood bank, the private sector continues to dominate over the public sector by a large share
in Kerala. In the light of the fact that a considerable section of the population has no financial
protection, this raises concerns of impoverishment due to catastrophic health expenditure
in the State

52
References
1. Panikar PGK, Soman CR.1984. Health Status of Kerala, the Paradox of Economic
Backwardness and Health Development. Trivandrum: Centre for Development
Studies
2. Kutty V R. 1989. ‘Rationing of Medical Care in Kerala- Price and Non price
Mechanisms’, Economic and Political Weekly 9:1922-1933.
3. Raman Kutty, V. 2000. Historical analysis of the development of health care facilities
in Kerala State, India. Health Policy and Planning 15(1):103-109.
4. Varatharajan D, Sadanandan R, Thankappan KR et al. 2002. Idle capacity in resource
strapped government hospitals in Kerala:size, distribution and determining factors.
Thiruvananthapuram,India: Achuta Menon Centre for Health Science Studies,Sree
Chitra Tirunal Institute for Medical Sciences andTechnology
5. Levesque JF, Haddad S, Narayana D, Fournier P. 2006. Outpatient care utilization in
urban Kerala, India. Health Policy Plan, 21 (4):289–301
6. Dileep TR. 2002. Understanding levels of morbidity and hospitalization in Kerala,
India. Bulletin of world Health Organization, 80(9) 746-51. 26
7. Public Health Foundation of India.2016. Kerala Health Accounts 2013-14
8. Government of India. 2003. Health information of India. Delhi:Central Bureau of
Health Intelligence, Directorate Generalof Health Services, Ministry of Health and
Family Welfare.
9. Thankappan KR. 2001. Some health implications of globalization in Kerala; India.
Bulletin of World health Organization, 79 (9)
10. Peter berman& Rajeev Ahuja.2008. Increased health care spending in India:

53
Opportunities and risks. Health for Millions; 2: 16-19
11. Approach paper – Thirteenth Five-year Plan. 2017. State Planning Board,
Government of Kerala
12. NSSO. 2014. Key Indicators of Social Consumption in India: Health, 71st Round
(January-June 2014). New Delhi: Ministry of Statistics and Programme
Implementation, Government of India
13. Government of Kerala. Report on the survey of private medical institutions in Kerala
2004. Thiruvananthapuram: Department of Economics and Statistics, 1996
14. Government of Kerala. Report on the survey of private medical institutions in Kerala
1995. Thiruvananthapuram: Department of Economics and Statistics, 1996
15. Government of Kerala. Economic Review 1996. Thiruvananthapuram: State Planning
Board, 2020
16. Government of Kerala. Health at a glance. Health Information Cell, Directorate of
Health Services, 2016
17. Jana, A. & Basu, R. (2017) Examining the changing health care seeking behavior in
the era of health sector reforms in India: evidences from the National Sample
Surveys 2004 & 2014. Global Health Research and Policy. 26.
18. Vijayan, S.M., Puliyakkadi, S. & Chalil, S. (2020) Health care utilization and out of
pocket expenditure in a rural area of Kerala: a cross sectional study. International
Journal Of Community Medicine And Public Health. 7 (8), 3081.
19. National Health Profile (NHP) of India and the relative proportions of public and
private health care facilities from the National Sample Survey (NSS) 75th round
(2017-2018)

54
AVAILABILITY, DISTRIBUTION AND UTILISATION OF HEALTH CARE SERVICES IN KERALA
[0] Descriptive identification of sample household
1.District:
2.Panchayat/Municipality
3.Ward No: 4. Name of the ward: 5. Rural Urban
6. Name of the head of the household:
7. Address:
8. Name of the informant:
9. Relation to the head of the household: (Code)
Codes for 9: Relation to the head of the household: self ‐ 1, spouse of head ‐ 2, married child ‐ 3, spouse of married child ‐ 4, unmarried chiId ‐ 5, grandchild ‐ 6, father/mother/father‐in‐law/mother‐in‐law ‐ 7, brother/sister/brother‐in‐law/sister‐in‐law/nephew/niece/other relatives ‐ 8, servant/employees/other non‐relatives – 9
Serial no

55
CODES FOR BLOCK 2
Col.3: Relation to the head of the household: self ‐ 1, spouse of head ‐ 2, married child ‐ 3, spouse of married child ‐ 4, unmarried chiId ‐ 5, grandchild ‐ 6, father/mother/father‐in‐law/mother‐in‐law ‐ 7, brother/sister/brother‐in‐law/sister‐in‐law/other relatives ‐ 8, servant/employees/other non‐relatives – 9 Col. 6.: Marital status: never married ‐ 1, currently married ‐ 2, widowed ‐ 3, divorced/separated – 4 All members mentioned by the respondent as members of the household. Col. 7.: Education: not literate ‐01, below primary‐02, primary‐03, upper primary/middle‐04, secondary‐05, higher secondary ‐06, diploma/certificate course (up to secondary)‐07, diploma/certificate course (higher secondary)‐08, diploma/certificate course (graduation & above)‐09, graduate‐10, postgraduate and above‐11. Col. 14.: Whether covered by any scheme for health expenditure support: government funded insurance scheme (e.g. RSBY, Arogyasri, CGHS,ESIS, etc.) ‐1, employer supported health protection (other than govt.) ‐2, arranged by household with insurance companies‐3, others‐4, not covered‐5.
[2] Demographic particulars of household members
Sl.No Name of member* (See the explanation below)
Relation to head (code 3)
Sex (male-1, female-2)
Age (Yrs)
Marital status (code 6)
Education (code7)
Occupation
During the last 365 days
Whether it was related to the floods that happened in Kerala in of 2018 (Yes-1, no-2
Whether suffering from any chronic illness (Yes-1, no-2)
Whether suffering from any other illness anytime during the last 15 days (Yes 1 No 2 )
Whether covered by any scheme for health expenditure support Yes – 1 No – 2
Reporting of columns 10-12 (Self-1, Proxy-2)
Whether hospitalised (Yes-1, no-2)
If YES in col 9, no. of times hospitalised
1 2 3 4 5 6 7 8 9 10 11 12 13 14 15

56
[1] Household characteristics
1. Type of ration card APL BPL Anthyodaya
2. Social Category: Scheduled Castes -1, Scheduled Tribes-2, Other Backward Classes -3, General – 4, Others -5 Do not want to disclose - 6
3. Religion
Hinduism -1, Christianity -2, Islam-3, Buddhism -
4, Others- 5, No religion – 6
4. Major source of drinking water:
Bottled water–1, tap–2, tube-well/hand pump-3, tankers - 4, pucca well -5, tank/pond reserved
for drinking – 6, river/canal - 7, others – 9
5. Type of latrine: latrine: service -1, pit -2, septic
tank/ flush system -3, Common latrine – 4, Shared
latrine – 5, others – 6, no latrine -7
6. Primary source of energy for cooking past days
Coke/coal–01, firewood and chips -02, LPG -03, Gobar gas -04, kerosene -05, electricity -06,
others -07, no cooking arrangement -8
7. What was your last electricity bill amount?
[3] Particulars of the last episode of medical treatment received as in-patient of a medical institution during the last 365 days
1 Serial no. of the hospitalisation episode 1 2 3 4 5
2 Serial no. of member (as in col. 1, block 2) hospitalised
3 Age (years) (as in col.5, block 2)
4 Nature of the illness
5 System of medicine
Allopathy‐1 Ayurveda ‐2 Homeopathy – 3Unani – 4Sidha ‐ 5
Yoga & Naturopathy – 6 Others 7 (specify)……………..
6 Type of provider

57
JPHN/ASHA/Anganwadi worker -1 PHC/dispensary/CHC/mobile medical unit -2 Public hospital (including ESI, Co-operative hospital etc) -3Private doctor/clinic-4Private hospital-5
7 Type of ward (free -1, paying general -2, paying special -3)
8 Duration of stay in hospital (days)
9 If treatment was from private doctor/private clinic or private hospital What was the reason for not availing government sources?
required specific services not available -1 available but quality not satisfactory -2 quality satisfactory but facility too far - 3 quality satisfactory but involves long waiting - 4 financial constraint - 5 other – 6 Others: specify ………………………………………………………………………..
Details of medical services received (not received -1; received: free -2, partly free -3, on payment -4)
10 surgery
11 medicine
12 X-ray/ECG/EEG/Scan – CT, MRI, Ultrasound
13 other diagnostic tests
14 Whether any medical service provided free
15 Medical expenditure for treatment in Rs (including doctors/surgeons fee, hospital staff/other specialists, medicines, diagnostic tests, bed charges other medical expenses like blood, oxygen, attendant charges, physiotherapy, personal medical appliances etc.
16 Non-medical expenditure incurred by the household (Rs.) (food, transport for others, expenditure onescort, lodging charges if any, etc.)

58
17 Total amount reimbursed by medical insurance or employer (Rs) Mark zero if not reimbursed
18 Whether any medical services were provided free Mark only if answer is yes. Government – 1, Private – 2
19 What is the major source of finance for medical expenses Household income/ savings-1,borrowings-2,sale of physical assets-3 contributions from friends and relatives-4, other sources-5
20 What is the second major source of finance for medical expenses Household income/ savings-1,borrowings-2,sale of physical assets-3 contributions from friends and relatives-4, other sources-5
[4] Particulars of illness episodes of household members during the last 15 days (including hospitalisation)1 Serial no. of the illness episode 1 2 3 4 52 Serial no. of member reporting ailment (as in col.1 of block 2) 3 Age (years) (as in col.5, block 2) 4. No. of times within the reference period the person was ill 5 Nature of illness specify……………………… 6 Whether chronic (yes‐1, no‐2) 7 Status of the illness
started more than 15 days ago and is continuing ‐1
started more than 15 days ago and has ended ‐2
started within 15 days and is continuing ‐3
started within 15 days and has ended ‐4
8 Total duration of the illness (days) 9 Whether treatment was taken on medical advice Yes 1 No 2
If no, skip to 14 & 15
10 If treatment was taken which system of medicine was used Allopathy‐1 Ayurveda ‐2 Homeopathy – 3Unani – 4Sidha ‐ 5 Yoga & Naturopathy – 6 Other – 7

59
Other …………………………………………..(specify)
11 Whether hospitalised Yes 1 No 2 12 Type of provider
JPHN/ASHA/Anganwadi worker ‐ 1 Primary health centre/dispensary/Community health centre/mobile unit ‐2 Public hospital ( ESI,Co‐operative, taluk, district, govt medical college etc) ‐3 Private doctor/clinic‐4 Private hospital ‐5
13 If treatment was from private doctor/private clinic or private hospital What was the reason for not availing government sources?
required specific services not available -1 available but quality not satisfactory -2 quality satisfactory but facility too far - 3 quality satisfactory but involves long waiting - 4 financial constraint - 5 other – 6 Others: specify ………………………………………………………………………..
14 If treatment was not taken on medical advice, what are the reasons for not seeking medical advice?
no medical facility available in the neighbourhood ‐ 1
facility of satisfactory quality not available ‐ 2
facility of satisfactory quality too expensive ‐ 3
facility of satisfactory quality involves long waiting ‐ 4
ailment not considered serious ‐ 5
other – 6 Others: specify ………………………………………………………………………..
15 Instead of seeking medical advice who was consulted Self care : 1, Household members/friends : 2, Medical shop – 3 Others ‐ 4
[5] Particulars of pre-natal and post-natal care for women of age 15-49 years during the last 365 days

60
serial. no. (as in block 2/1)
age (years) (as in block 2/5)
whether pregnant any time during last 365 days (yes-1, no-2)
If pregnant in the last 365 days,
serial no. of preg- nancy (1/2)
whether received tetanus toxoid vaccine during pregnancy (yes-1, no-2)
whether taken Iron tablets during pregnancy (yes-1, no-2)
whether any other pre- natal care received yes, from HSC/ANM/ASHA/AWW -1 yes, from PHC/dispensary/CHC/mobile medical unit -2 yes, from public hospital -3 yes, from private doctor/clinic -4 yes, from private hospital -5 No -6
if 1-5 in col. 7
Out- come of preg- nancy live birth normal delivery-1,live birth caesarean-2 stillbirth -3, abortion-4, pregnancy continuing 5
if 1-4 in col. 9 if 1-5 in col. 12
nature of pre-natal care (AYUSH- 1, non- AYUSH- 2, both-3)
Place of delivery/ abortion in PHC/dispensary/CHC/mobile medical unit -1 in public hospital -2 in private clinic -3 in private hospital -4 at home -5
Expenditure incurred on delivery care (Rs.)
Whether any post- natal care received yes, from HSC/ANM/ASHA/AWW -1 yes, from PHC/dispensary/CHC/mobile medical unit -2 yes, from public hospital -3 yes, from private doctor/clinic -4 yes, from private hospital -5
Nature of post-natal care (AYUSH- 1, non- AYUSH- 2, both-3)
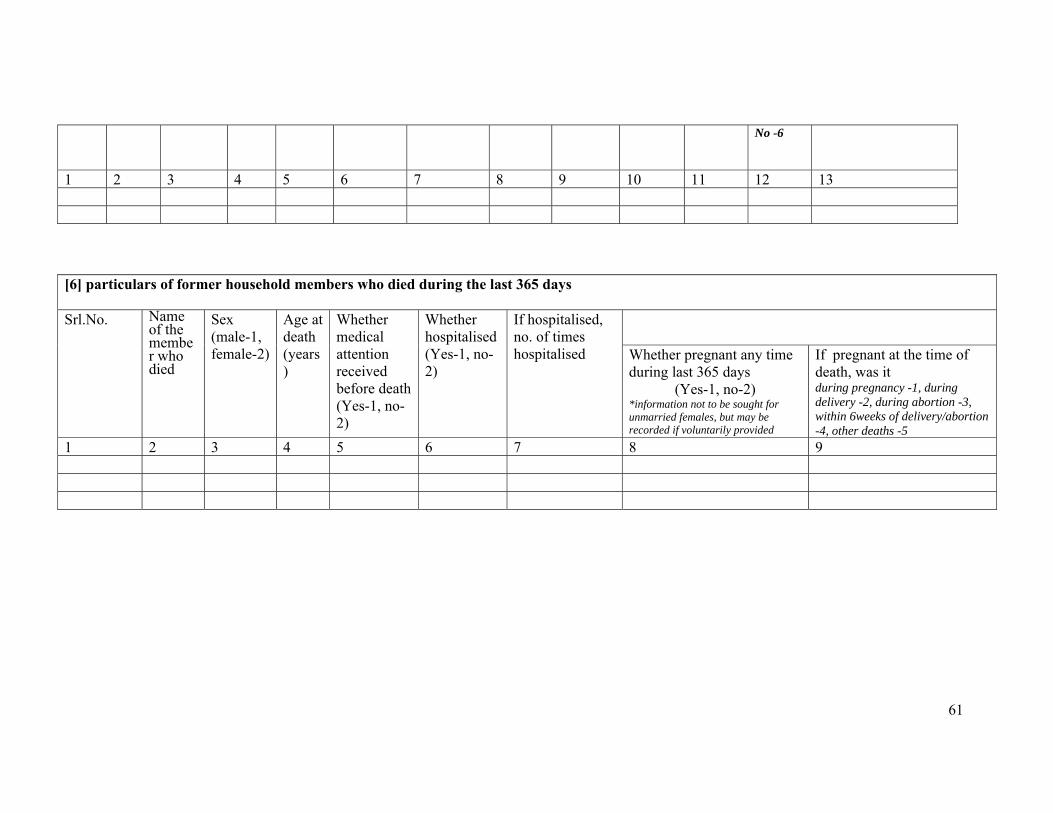
61
No -6
1 2 3 4 5 6 7 8 9 10 11 12 13
[6] particulars of former household members who died during the last 365 days Srl.No. Name
of the member who died
Sex (male-1, female-2)
Age at death (years)
Whether medical attention received before death (Yes-1, no-2)
Whether hospitalised (Yes-1, no-2)
If hospitalised, no. of times hospitalised
Whether pregnant any time during last 365 days
(Yes-1, no-2) *information not to be sought for unmarried females, but may be recorded if voluntarily provided
If pregnant at the time of death, was it during pregnancy -1, during delivery -2, during abortion -3, within 6weeks of delivery/abortion -4, other deaths -5
1 2 3 4 5 6 7 8 9