labour and employment - spb.kerala.gov.in
TRANSCRIPT
Labour and Employment
CHAPTE
R

80
Kerala State Planning Board

81
Generation of productive and gainful employment with decent working conditions is viewed as a crucial strategy for ‘Inclusive Growth’ (Planning Commission 2010). Indian labour market is character-ised by complex situations which arise due to many reasons such as full time and part time workers, variations in the availability of work during different seasons of a year, workers engaging themselves in multiple jobs, workers ready to work at low wages, social and cultural factors restricting large number of women workers to participate in the labour market etc.
5.2 Productive employment and Decent work are key elements to achieve a fair gloablisation and the ���������� ������������������������� �����������������������������������������������-cent Work Agenda into practice is achieved through four strategic pillars: job creation, rights at work, social protection and social dialogue, with gender equality as a crosscutting objective.
��!�"���������������������������������������#�������������$�#������������������������%&&���'������� ������������#����������������*���������������#�����������������!���%&&��������������������������������������������������#����������������������������������set out the domestic workers around the world who care for families and households, must have the same basic labour rights as those available to other workers: reasonable hours of work, weekly rest of at least 24 consecutive hours, a limit on in-kind payment, clear information on terms and conditions of employment, as well as respect for fundamental principles and rights at work including freedom of association and the right to collective bargaining.
��+�/�������������������#��������������������������������%%3��������6� �����������#���of domestic workers at around 53 million. The fact is that this kind of work is often hidden and unreg-istered; the total number of domestic workers could be as high as 100 million. Around 83 percent of ��������������������������������������������������������������������9�������<���domestic work as work performed in or for a household or households.
��������++���'������������������#���9�������=��9>�����������?�#�����6�@&%%����B�����E����6�F����������������������������������������������������6���H6�=�>�"������������=��>�'�����Security and (iii) Employability and Employment. The Key recommendations of 44th Session of Indian Labour Conference is given in the box No. 5.1
������������� ��������������������������������������������� ���������
M� "������O�����$���9��������������Q� �����M� /����������������������������Q� ��������������?��6�Q����������
Pension, under Employees Pension Scheme 95, Portability of Provident Fund Account, Reduction in the Requirement of Minimum continuous Service etc
Labour and Employment
Economic Review 2011
82
M� '�������"�����������������������'��������������������������������������-ber of openings in the Area of Employment
M� "�������������������"��������E��<��$���#�� ��������� ���� ���� ������level of 12 weeks to 24 weeks
5.6 The Government has given top priority to accelerate industrial growth and a major area that re-Z����������������������[�\�����������]����������������������� ����"����� ������6���������#-lished institutions are more concerned about the organised sector, and the entire gamut of unorgan-ised labour is ignored.
5.7 The State has a work force of around 83 lakh of which 19 lakh are women workers. The vast majority of the workforce in the unorganised or informal sector; sometimes in conditions of partial em-ployment, often without adequate wages or Social security protection. The attention of Government has been largely focused on protecting of workers in the organised sector.
5.8 Unemployment is one of the basic problems of the State. Government has to create new employ-ment opportunities. Productive employment is being created in the State’s economy at very low rates. Despite the relatively high skill and adaptability levels of the State’s workforce, labour market has not been perceived as a positive factor by prospective investors in Kerala.
�����������!��������������"���#� ���������#�
M� �������������������� ���������������� �����M� ��������������� ����������� ������������M� ����� �����������������������������������M� ���� ���� ����������������#����������M� ��������Z������������������������������������M� �������<����������������'�����'�������� ���������
5.9 The competitive market reform policies have turned some industries unviable. The forces of globalisation, the dismantling of trade barriers, the new production paradigm in ‘sunrise’ areas like information technology and biotechnology, the practice of home working, intangible value addition and other phenomena are making their presence felt in India also. The organised sector worldwide is moving away from an employment security regime, towards an income security regime. The new ���������������������������������� ��#���������\�`�#��������������#����������
Social Security��%&����������������������������������������� ���������������#��� �������B�������������social security schemes are already in operation for workers in organised sector. But the unorganised ����������������������������������������������/����H����������������������������������6�*�-ernment has taken several initiatives to safeguard the interest of unorganised sector workers. 5.11 Kerala has made considerable progress in extending Social Security coverage through the mech-anism of welfare fund boards. However, many of these schemes lack clear perspective, and need to #���������������������������������������������������<���������` ��������Q`������������������of the social security net to cover vulnerable workers in the unorganised sector is one of the major priorities of the Government. New welfare schemes will be introduced for domestic workers, self em-ployed workers in the service sector and other unprotected categories. These new schemes will be ���������#�������H����`����������������������������������������������������������#���� �����H������������������<��������#�������|������������������������������#�����������������������������������-cess and to prevent leakage and malpractice.
5.12 The fund management of the welfare fund boards will be improved by deploying professional expertise, keeping in view the twin objectives of fund security and income generation. An investment ����������#����������������`���H������������������` ������������������#����������
Kerala State Planning Board
83
� ����#���������E�������$��� ������������#����� �������<����������������#��������������������welfare fund boards to identify and eliminate fraudulent registrations.
��%!�����<�����������������*�������������#������� ������������������������������������������*������������������������ ������H����������������������������������������#������������������������������#��<����������������������������#���������������������#������}��������6�drawing upon the resources of community and non governmental organisations.
Unorganised Workers’ Social Security Act, 20085.14 An important initiative to safeguard the interest of unorganised workers has been the enactment of the Unorganised Workers’ Social Security Act, 2008. The Act provides for constitution of National Social Security Board, which will recommend for formulation of social security schemes for unorgan-ised workers. Accordingly, the National Board was constituted in 2009, and the Board has recom-������������������������������������H6�/���������'�������E����~����=/'E~>� ��������������insurance, Janasree Bima Yojana (JBY) providing death and disability cover and Indira Gandhi Na-���������$��������'������=�*F�$�'>� �������������� ��������#���`��������E�������and other construction workers, MGNREGA workers, Asha workers, Anganwadi workers & helpers etc. The National Social Security Fund for Unorganised Sector Workers with initial allocation of ` 1000 crore has been set up.
Plantation Sector5.15 Kerala accounts for 71% of production of plantation crops in the country. About 14.5 lakh families are dependent on plantation sector for livelihood. Excluding the marginal farmers the labour employed in the plantation sector comes to about four and a half lakh, while the total number of factory workers in the industrial sector is 4.51 lakh. Problems faced by plantation sector are mainly due to unremunera-����� ��������� ����������������� ���������������������� ������������� ���������������<�������-ment, technological innovations can only salvage the plantation sector from ruin.
Labour Welfare5.16 Kerala is a model State for labour welfare measures. About 28 labour welfare fund boards are ��������������������������������� �������������������6�%������������������������#�����-partment. Major welfare measures provided by different labour welfare fund boards are the following.
M� "��������E��<�M� "��������E��<�M� "�������E��<�M� ������/�����M� ������?����������M� '� ��������E��<��M� $������������������������#�����M� Q���������$��������M� �����E�������$����������
5.17 In Kerala, 30 lakh families have joined the scheme RSBY – CHIS, out of which 11.79 lakh fami-lies come under RSBY and the balance under CHIS. During 2011-12, ` 10.00 crore has been provided in the State Budget for the scheme RSBY as 25% state share and ` 150.00 crore has been provided for the scheme CHIS. Premium for a family during the year 2011-12 is ` 748.00. For the RSBY portion, 75% of the premium will be borne by Government of India. Balance premium and the administrative expenses are met by the State Government. For CHIS, the entire premium of ` 748/- per family along with administrative expenses is borne by the State Government. Apart from that there is expenditure for CHIS PLUS scheme through additional free treatment upto ` 70000/- is being provided to the /'E~}9��'�#��<���������������������������6��������������������������������������������������being implemented through non insurance route and payments to the hospitals are being paid directly
Economic Review 2011

84
by CHIAK (Comprehensive Health Insurance Agency Kerala). Expenditure for this scheme is also be-��������������� �����������9��'�������������� ������9��'������ �����������<����������������RSBY/CHIS for the period 2008 – 2011 are given in the table 5.1
Table 5.1 %������#�����&�������#�'����(� ��������� �)*�+�
Year ���������� ���� ���������������������� Private ���� ������ Private ����
2008-2010 47858 94842 142700 18.09 27.76 45.852010-2011 143791 216437 360228 51.52 61.06 112.58
Total 191649 311279 502928 69.61 88.82 158.43��������� ��
Child Labour 5�%��������������#��������H���������������@+�������������������������������%3�������-������ �������� ��#�����������%3%������������ ������� �����������#�� ���������� �����H��������their safety, physical or mental health and moral development. 8.4 million children were engaged in ���������[��������]���������������������#��6����������������������������\���6�����<�����in children and commercial sexual exploitation. The proportion of child labour varies from country to country. 61% in Asia, 32% in Africa and 7% in Latin America, to 1% in US, Canada, Europe and other wealthy nations in Asia. The proportion of child labour varies a lot among countries and region inside those countries and region.
��%��������#����������������%%���������������������%�������������H���������6�����������-dling chemicals, carrying heavy loads, and mining, quarrying or enduring long hours. Almost 70% of child labour is in unpaid work within extended family networks. In the developing countries, about 60% �������������������������������������������<��������
5.20 The rights of child domestic workers-who may contribute as much as 30% of global domestic ��#����������}�����#�������������������������������� �������@&%%���$������}#������ ���������������#��6�������������������������������6���������������#�������<���������������������#������������������������������������������������� ����������������������������������������labour. Unfortunately, the Millennium Development Goal (MDG) for primary school enrolment aims for ������������<������������������6������������������������ �����#������"������$���9��-tion. The integration of child labour concerns into national development strategies, backed by effective legislation, is therefore the preferred route to lasting solution.
5.21 The magnitude of child labour problem could be considerably reduced through rehabilitation ���������������������� ������ ��������#�� �����H������������� ������� �#���6�#������������(Eg:- Slavery) and indirectly (Eg:- Compulsory labour that results in denial of the right to education). The National Policy of Child Labour enforces legal actions to protect the interests of children, makes ����� ���� ����������������#��<������������#������ �������#����� ����������������������of high concentration of child labour. The need for awareness generation among the public has to be highlighted. Currently the magnitude of child labour in India is estimated to be approx. 10 million.
5.22 In Kerala, special attention was paid to the Programme on eradication of child labour from the so-��������������=�>�������H���� ������������������������������������������������=#>�/�}�������of dropout students in to formal education. As a result of State’s intervention, the number of working children has been decreased considerably (i.e. 76.6 %) from 111801 in 1971 to 26156 in 2001.
5.23 Decreasing tendency in the distribution of working children in Kerala during the last four Cen-suses are shown in the table 5.2
Kerala State Planning Board
85
,��#��������!���������-��/��0����#���������� ����������� ������������
���� ���1 1971 1118012 1981 92854
3 1991 348004 2001 26156
�������������������
Welfare of Non Resident Keralites (NRK’s)��@+���������������<������������������������ ����� �������� ������������������������F}/�������Indians hailing from the State. Government of Kerala has launched the department of Non Resident ���������]�$�������=F�/�$>�����������#���%���6������������������������������������������������F�/�$��������������������������������������� ������������������������6�����������������������property of those who are left back at home, tracing of missing persons abroad, compensation from sponsors, harassment from sponsors, cheating by recruiting agents, educational facilities for children ��F/��6���������������\����������
��@�� � � � �F�/�$���/���'�����<������������F�/�$��� ����������������������� ��� ����}��������������������� ������������������������������������������������"����������������F�/�$}/���'����
M� $��������������������������<�����������������������������9����<�����$�����������9�������������&������<�����������#�������������������������� ` 16.00 crore collected as regis-tration fees during the period under review.
M� '�������������������� �������<������������������F/���=��������>������������-come is below ` 25,000/-, for cases like marriage of children, medical assistance, death etc and %@�&� ����������#��<������������� ����� �����
M� ���}�� ������� ��������� ���������� ����� �������� �� %&� ������� � �� �� ���� �������awareness about the adopted country of employment, their culture and prevailing labour laws, matters relating to visa stamping, immigration, baggage, customs clearance etc in which 800 ����������#��<�������������� ��� �����@���3����9���������� �����
M� ����������F/����������9���������������������������#������������������`���������������-ance coverage.
M� '������ ��������������������� �������������������������������������������������������-lenges in the overseas employment market through 8 districts in Kerala
M� [�$/�F$~$"]����������������������` ������������������� �������������������������the NRKs who die abroad or those who die outside the State. Seven such cases were assisted during the period under review.
M� $����������� ������ ������ �����6������������������������������������������illegal migration by making the people aware of the procedure involved in the emigration process.
M� F�/�$�FQO'����������������� �#����H���������������������������������#������F�/�$���-partment
M� /� ������������������������������������������������#������~���M� '������� ���F�/�$}/���'�9����������������9����������M� %��������� ������������������������������������������������������F/��M� �#���������/���������
Industrial Relations 5.26 The main function of the Labour department is to maintain or improve the welfare of the working people of Kerala, through enforcement of various labour laws, settlement of industrial disputes through conciliation and administration of various welfare measures. All the activities of this department are
Economic Review 2011
86
focused on to ensure fair working and living conditions of the workers in the State and maintaining cordial relationship between the employer and employee to develop a harmonious industrial economy.
5.27 During 2011, the Department had taken adequate steps to face the challenges of economic re-cession and its impact on the production, producers and labourers. The Government has announced a draft Labour Policy augmenting revival and development of industries to make Kerala an investor friendly state. The highlights of Labour Policy are given in Box No.5.3
����������2�������%�#����+�0�#�0���
M� 9��������������������������� �#������� ���������������M� %�����������#�������������<��������M� $���<���������������������������������������������������M� F��������������������������������������������������������M� '�����'��������9��������������M� ��<������#��<�����������������������O�������E����M� /� ������������������������������#��<��������#���������M� "������ ����}�� �������������� �M� �������������������#������ ����������M� B����������������������#��������������������[ �#�������������]�M� ' ��������������������������� �������������������������%��&������������M� ���������������������������������������M� Q� ������#������` �����������������Z���������������������������#����������������
tune with the timesM� /�������������������������������M� '���������������������` ��������������������������������������#�������������M� �$����������������������� �����$�����������������������M� Q�<�����������������#����� ������M� "�����#����������������������O�����$��M� 9�������#���������#���������������������M� "��������������������������������M� /���#�������� �������������� ������������M� /�������������������������� �������`������6��� �������������� ����� of data baseM� /���� ������������������������������������������������M� �������������#����� �������������������������������������M� ��������������������#�����Q� ��������#��� ������M� ������ ���������������������������� ����������� ��������� ����
5.28 The Department has taken initiatives to ensure a better employer- employee relationship result-��������� �����������������������$��������������������������#��������#����<������������������committee a good labour relation have been evolved and rights of workers protected. The industrial atmosphere is calm and the workers and Trade Unions have contributed their share in production. During 2010-11 2357 industrial disputes were settled. The details of strikes, lockouts, layoffs and industrial accidents are given in the Table No. 5.3
,��#����2� ���/���( Numbers)Items 2006 2007 2008 2009 2010 !"##���$���
30.09.2011)Pending 0 1 0 4 3 3Arose 6 2 22 18 12 11
Total 6 3 22 22 15 14Man-day lost 86977 86746 394198 177494 173044 77038
���������������������������
Kerala State Planning Board
87
Table 5.4���/�����(Numbers)
Items 2006 2007 2008 2009 2010 !"##���$���30.09.2011)
Pending 23 27 4 8 10 13Arose 6 0 5 13 10 7
Total 29 27 9 21 20 20Man-day lost 1811755 1505370 758144 506606 741221 428698
���������������������������
Table 5.5��������(Numbers)
Items 2006 2007 2008 2009 2010 !"##���$���30.09.2011)
Pending 8 6 2 4 4 6Arose 3 3 9 12 6 4
Total 11 9 11 16 10 10Man-day lost 564669 533872 64316 41809 23820 31,240
���������������������������
Table 5.6 ���������#�'���������!3378!33 ( Numbers)
���� ��� 2006 2007 2008 2009 2010 !"##�%$���30.09.10)
Fatal 62 115 173 256 196 40Non Fatal 355 524 964 830 730 36
���������������������������
5.29 Kerala is acclaimed nationally for Social security and Welfare measures it has extended for the past so many years. Almost 45 lakh of labour force in the State are protected under any one of the social security schemes. During 2010-11 Government have spent ` 321.79 crore through different O�������?���E��������#��<�������������������������� ����������*������������������������������������� ��������������������#������<����'�����������������������������������������scheme for the migrant labourers ensuring their pay, welfare, health, educational aid etc to their fami-lies through Kerala Building and other Construction Workers Welfare Fund Board with assistance of the ���������������� ������������������H�������� �����������������������������������'�����
5.30 There were no strikes or disputes in Coir/Fisheries/Handloom industry in Kerala in spite of the ba-���� �#�����#�����������������"�����H���������#�� ���������������������������} ������of labourers without affecting labour opportunities. Government has declared an income support ���������������������������� �������������������������������<���������������������������support to workers engaged in traditional sector activities who have an annual income of ` 25000/- or less. Beedi workers, Khadi workers, Fish processors, Coir workers, Fishermen, Basket and mat work-ers are some of the categories of workers included under this scheme during 2011-12. An income support of not less than ` 1250/- per annum has been given to each such worker engaged in these activities. The scheme will be in addition to the MGNREGS. A major joint welfare activity taken up by the Central and State government is the implementation of an insurance scheme, Rastriya Swastya E����~����=/'E~>���������#��<���������������������������������������������������������CHIAK. The scheme provides treatment assistance upto ` 30,000 from the empanelled hospitals in the State. The Scheme Aam Admi Bima Yojana (AABY) is also implemented through Labour Depart-
Economic Review 2011
88
ment with the assistance of Central Government. The workers in the rural area holding 5 cents of land or below is eligible to enrolee in the scheme and get insurance claims of ` 75000 and scholarship to the students of 9th standard and above @` 100 per month. Another Insurance Schem called Compre-hensive Health Insurance Scheme (CHIS) to the labourers who come above the poverty line is also implemented through CHIAK. It is estimated that 35 lakh of labourers have got enrolled in the scheme. Major achievements of labour department is detailed in the Box. No. 5.4.
���������9�:��������(� ���������������;�"��� ���������0�!338
M� �� �������������������������#���E������$�������������������9��$�M� ���������$$E~������'�����9������B�����������������������������������������M� �� �������������������������������� ����������M� �� ������������ ������������������������������� ����M� ���������������������������#�������M� �������������������������������������������������������������M� $������������������������� ��������/9��������������������#����M� $������������������������������#��M� ��� ���"������O������#���<��������������������M� "������ ������� �������� ������� ��� ������� *��� O������ O������� ?��� E����
were approved and started functioning
5.31 The industrial Disputes Arose, Handled, Settled etc in Kerala is given in the table. No. 5.7
,��#�������<���������#�;��"�����'����=�������=� ���#������=��������#�������0�!338
���No
��� ������ 2005-06 2006-07 2007-08 2008-09 2009-10 2010-11
1 No. of disputes pending at the begin-ning of the year
2658 2749 2904 2819 2770 2765
2 No. of disputes that arose during the year
3405 3376 3482 3143 2352 2246
3 No. of disputes handled during the year 6063 6125 6386 5962 5122 5011
4 No. of disputes settled during the year
a By voluntary negotiation between par-ties
374 341 484 831 626 423
b By conciliation 1124 1361 1644 1675 1008 905
c By withdrawal 1290 1066 795 426 497 366
d Referred for adjudication 526 453 644 260 226 136
e referred for Arbitration 0 0 0 0 0 5
f Total No. of disputes settled 3314 3221 3567 3192 2357 1935
5 No. of disputes pending at the end of the year
2749 2904 2819 2770 2765 3176
6 No. of disputes led toa Strike (including pending previously) 7 8 7 27 20 14
b Lockout (including pending previously) 29 29 23 15 21 20
7 No. of workers affected due
a strike 446144 25926 697 69114 14108 2165
Kerala State Planning Board

89
���No
��� ������ 2005-06 2006-07 2007-08 2008-09 2009-10 2010-11
b Lockout 7301 7910 6410 5150 25239 4452
8 Man days lost
a strike 3224163 172177 23192 413037 186897 133098
b Lockout 1807511 1821036 1192022 833535 652891 504804���������������������������
Safety of Workers 5.32 The goal of all occupational safety and health programmes is to foster a safe work environment. ��'$'�%�&&&�����������������������H�������������� ���<����������� ����������������safety management systems. The enforcement of laws & measures like the Factories Act and Rules �������������� �������������������������#������������ ��������H����������������������#��made more effective. Enforcement of Acts relating to industrial safety and prevention of pollution would be strengthened.
5.33 Department of Factories and Boilers, under the Department of Labour is the statutory Authority to ensure safety, health and welfare of workers in factories and the general public living in the vicinity of factories through the implementation of various laws. The Department is in the pursuit of prevention of industrial accidents and creation of an environment conducive to industrial hygiene as well as preven-tion of occupational diseases by inspection and advisory services. During 2010- 2011, priority inspec-������"$����������6������������������������H��������������6������ �������� �����������������������������6��� ����������H���������������#��� ����������� �����6�����������`����-tion of factory workers etc were the major activities of the Department. License Adalat was conducted ��� ������ �#���� ����������������<�������� ���������������� �� ���� �#����� �"���� ���������conducted by the Department during 2009-10, 2010-11 and 2011-12 (upto 30.09-2011) are given in the Table 5.8
Table 5.8%��0�� ����������������&����������������#����;�"��� ���
����No
Programmes 2009-10 2010-11 !"##&#!���$��30.09.2011)
1 Priority inspection at MAH factories 37 41 612 $���"������������������H�������������� 2 30 45
3 Workshop/training programmes for workers/managers 10 12 424 �� ����������H���������������#��� ����������-
spectors8 10 15
Total 57 93 163�����������������������������������t
5.34 Medical Examination of factory workers has not been carried out by the Department during the last three years. As per the Factories Act, the periodical medical examination of factory workers should #����������#�������������"���������<������������� ���������"���������<����������������������-�������9���������'������������� �������������������������������������<�����������#�������#������������6�����"���������<����������������� ���������Z�����������������������������������������A total of 6.40 lakh workers of 19081 establishments are coming under the control of various acts enforced by the Department during 2011 (upto 30.09.2011). Table No.5.9 shows the number of Estab-lishments and Workers coming under the purview of various Acts enforced by Factories and Boilers.
Economic Review 2011
90
,��#�������?@����#��� ���������A��/������ ��0�����������"��(��A����(�������'����������������
&����������������#���Year '������������� ������
2007 18160 5793482008 18131 497326
2009 18740 6,24,3882010 19055 6,39,2862011 (upto 30.09.2011) 19081 6,40,208
������������������������������������5.35 Recent Amendments in Labour Laws for promoting Equity and welfare are given in Box No. 5.4
�����������������' ��� �����������������A�
M� �������������O�����$��6�%�!����������������������������������������� ����#�������������� ��������<`������` 10,000/- per month
M� �������������E���$��6�%����������������������������#������������������` 3,500/- per month to ` 10,000/- and calculation ceiling from ` 25,000 to ` 3,500/- per month while making employees employed through contractors on building operations eligible for payment of bonus under the Act
M� ����$ �������$��6�%��%�������6����������6��� ����������������������������E��������Classes
M� ����"��������E��<��$��6�%��%����������������������������#����������` 250/- to `2500/-and also empowering the Central Government to increase it from time to time before �����������������6�#����������<�������������<�����*�H����6���#�����������`�������/��20,000/-
M� ����Q� ������'�������������$��6�%�+������������� ��������Z��������������������#�-�<���������������������������#���Q'������������������#��������� ��������������������workers of the unorganised sector
M� �������������*��������$��6�%�3@�������������������������������*������������� ��������the private sector to ` 10.00 lakh from ` 3.5 Lakh
M� ��������������#���$��6�%��%���������� ������������������� ��������������������plantation workers
International Labour Migration5.36 International labour migration has emerged as a major global issue that affects most of the na-tions in the world and ranks high on the international, regional and national policy agendas. Migration ����� ������ ��������������� ������ ������#����������� ���� ������������#������������6�which is based on the vision of Decent work for all and expressed in its 2008 Declaration on Social Justice for a Fair Globalisation.
5.37 According to the UN Department of Economic and Social Affairs, in 2010 there were 200 million international migrant workers and their families. The majority of migrants live in the richer countries of Europe and North America, including about 40 million in the US and 10 million in Germany. In Europe, one in eight people of working age is a migrant; in North America this ratio is one in four. In most of the *������������� ���&����������#�����������<�������������������������������������#����` �����countries are Philippines, Indonesia, Sri Lanka, Nepal and Bengladesh. Even though the percentage of the global population who migrate internationally is small (about 3 percent per year), the total num-#����������������������������������#���������%��&���������F�<���������������������������������%��&6���\����������#������ ��������''/��������#�������� ������������6��������������#���27 million people to the total international migrant stock.
Kerala State Planning Board
91
��!���$�������������@&%%�����*�#���/� ���������������6������������������������������-nation on a daily basis. The report says that while many of them are already at risk of all kinds of �#���6����������#����������<������������������<����������������������������������� ��������the Russian Federation which has been the biggest receiving, sending and transit country for migrant workers in Eastern Europe and Central Asia since early 1990’s.
Migration of Women5.39 According to the United Nations Population Division (UNPD), global migration rates for women have remained high since the 1960s. In developed regions, women migrants, estimated at 51.6 per-cent of all migrants in 2010, outnumber their male counterparts. The average emigration rate of uni-versity educated women is 17.6 percent, as compared to 13.1 percent for men, in spite of the fact that women still face unequal access to university education in many less developed countries. The growth rates form skilled women migrants are larger than the growth rates for either low skilled women or skilled men for the vast majority of source regions.
Globalisation and Migration5.40 Migration has occurred throughout history, and current trends certainly indicate that it will con-tinue to increase in the future. While the forces of globalisation have created opportunities for greater integration of labour markets, a complex web of national immigration laws and border controls has restricted the mobility of people across borders. Yet growing disparities in wealth, incomes, human security, human rights and demographic trends across the countries are all exerting upward pressure
Economic Review 2011
92
on migration. Every year, many millions of young men and women enter the labour force in develop-ing countries where jobs are not created fast enough to absorb them. The impact of demographic trends in the form of population decline and ageing is being felt most profoundly in advanced destina-tion countries, where scarcities of labour are emerging in many sectors. The shrinking of labour force in the countries has generated a demand for workers in many sectors of the economy, particularly in ��������6�����������#���������������<�����`����#������������F��������������������������people to acquire the information they need to access the global labour market.
Migration and economic growth��+%�"�����������#�������������������������������}#��<�������#���������������������}�����������}��������������������������6���������������� �����6��� �������#������������<-ciency, promoting entrepreneurship, spurring urban renewal, and injecting dynamism and diversity into destination countries and societies.5.42 The World Bank has used a general equilibrium model to estimate overall economic gains to the global economy through international migration. Assuming a modest increase in migration from developing countries to high income countries (14.2 million workers, consisting of 4.5 million skilled and balance low skilled), the share of migrants in the stock of workers in high income countries will increase by 3 percent by the year 2025.
5.43 The current emphasis on migration and development projects a positive image of international �������������������������������������������������} ����������`���H������ ��������� �������������H�����������������������������������*������������ ����H��6����������������������protection of migrant rights are indeed inseparable. Migrant workers can make their best contribution to host and source countries when they enjoy decent working conditions, and when their fundamental human and labour rights are respected’’.
Migration in Kerala��++�$�������������������� ������������������'�������������\�����������������������#������������'�����������O����E����6�E����6�������6�9����������6�������������6�#�����������������������States. Higher wages for unskilled labour in the State, large opportunities for employment and short-age of local labour, paradoxically, despite the high unemployment rate in the State, led to massive �\�`������������#���������'������������������������������������������� ���������#����������working for a subsistence living. Even though a comprehensive data on migrant labour is not available, different micro studies indicated that the incidence of migrant labour is increasing in the State. Since they are not engaged through a contractor or an intermediary, the legal protections envisaged under the Interstate Migrant Workmen (Regulation of Employment and Conditions of Service) Act, 1979 are alien to them in their employment. According to Census, 2001, among the districts, Ernakulam district, ���������������������\���������������������'���������#���F�����'��������������#��������-grants from other States/ Union Territories in the districts of Kerala 5.10
,��#��������3;���������������9�0��������� ������� �����*�B,��������������������������#�
(�������� ����*������� ������������������
Ernakulam 55977 13.56Idukki 53056 12.85
Thiruvananthapuram 48575 11.77Palakkad 47955 11.62Kasaragod 31884 7.72Kannur 28115 6.81
Kerala State Planning Board
93
(�������� ����*������� ������������������
Thrissur 25358 6.14�H����� 23118 5.60Malappuram 22092 5.35Wayanad 18710 4.53Kollam 16797 4.07Kollam 16349 3.96Pathanamthitta 13683 3.31Aleppey 11180 2.71Total 412849 100
������������������������������� !!"#�������
5.45 The migrant labourers get much higher monetary wages than in their native places and they work for longer hours and their real wages may be lower. They live in shanty houses/rooms in slums like localities often on a sharing basis. They have limited access to sanitation facilities and safe water and the working and living conditions and habits make them suffer from a number of diseases. But their access to public services like health and education is limited and they enjoy very limited protection from labour laws. They also face problems of social integration in Kerala.
5.46 Though these workers are predominantly engaged in the construction, plywood and steel in-dustries, their presence is noticeable in almost all employments including service sector in the State. E��������������������������������������������|����������������������H����������������������[����]6���������������������������������������� ������������#��|��� ��������������<����of constructions. Since measures had not been developed to improve the weak conditions of these labour, Social Security, compensation in case of job loss, health problems etc, the State Government ���������������������������������������'������"������O������O��������'����������������������E����������������9���������O������O��������?���E����
5.47 A pertinent issue here is the cause of migrant labour. Kerala hitherto known for outbound migra-tion is faced with a new phenomenon called inbound migration which has been creating ripples not only in the labour market but also has its impact on the social fabric of the society. Attack against migrant workers in several parts of the State has been increasing. Two such recent instances of brutal and senseless attack by locals on migrant labourers were reported from Kayamkulam and Ernakulam. ���������������������������������H����'�������6���������������������������������������instances as `routine’ and not even treat as a new item worth carrying.
Kerala Institute of Labour and Employment (KILE)5.48 Kerala Institute of Labour and Employment (KILE) is an autonomous institution functioning under Ministry of Labour, Government of Kerala for conducting Training, Workshop, Seminar and Research of labour and allied subjects. In addition, it is conducting memorial lecture series in the names of prom-inent Trade Union leaders of Kerala, women development initiatives and special training programmes for unorganised sectors and interstate migrant workmen in construction sector and industries in Ker-�����������@&%%������������������ �#�����������"�����������������[��#���������]�}@&%%6�[��H����meghalayum Keralavum 2011 in the period under review. During the year 2011-12 the Institute has ��������������������� ��������6�@!��������6�������� 6������������ �����������published a book . It is also conducted two days residential seminar on Pottery Industry and problems faced by Pottery workers, besides demonstration cum Exhibition for pottery workers named ‘Kalimon Mela 2011’. The activities of KILE during 2010-11 are given in the Table No. 5.11
Economic Review 2011

94
,��#�������'���(������������@������0�!338
���� Programmes ������ ��������+�������
1 Training Programme 2 3472 Workshop 1 100
3 Seminars 23 174 ��������������������� 3 93
Total 29 715����������$
5.49 As part of 100 days programme, KILE has conducted 22 awareness seminars for Interstate Mi-�����O��������������� ��������$#�����&&��������������������������������#��<�������������seminars.
Fire and Rescue Services5.50 The primary function of the department is to save life and property of people. The Fire and Res-cue Services Department has saved human lives, animal life and properties to the tune of `1358.00 ��������������������<����������������������������������#���F���%@
,��#�������!��,���(�#������"��"�����������#�(�����(������&��������������� ��(�����;�"��� ���
Year����,����������$�$��-
�����,� ��/�4�������- ����:��
����������
����+�������
2006-07 117.75 Crore 621 2602007-08 132.56 ,, 762 328
2008-09 329.87 ,, 822 3782009-10 382.94,, 928 3912010-11 2?�C2== 1053 428
�����������������������%��������������
5.51 In addition to the services, the Department earn revenue by way of standby duty charges, pump-����������6�������������������#��������������6������������������F��#������9����<������������rise buildings, Industries, Petrol Bunks etc under various Acts and Rules like Explosive Acts, Arms and Ammunition Rules, Kerala Municipalities Building Rules etc. The earnings of the Department for the last three years are given in the Table No5.13
,��#��������2��(�����������0���������;�"��� ������������#���������������
Year '��������;��<����
2008-09 325.162009-10 350.17
2010-11 518.34 �����������������������%��������������
5.52 Eight new Fire and Rescue Stations were opened during 2010 – 11 as detailed in the Table No.5.14
Kerala State Planning Board

95
��,��#���������A�&��������������� ���������"����������0�!338
���� 4������ �;��������� �� (�������
1 Kottarakkara Kollam2 Iritty Kannur
3 Koduvally �H�����4 Mala Thrissur5 Puthukadu Thrissur6 Kuttikkol Kasaragod7 Eloor Ernakulam8 ���� ���6���H��������� Thiruvananthapuram
�����������������������%��������������
Industrial Training Institutes5.53 Industrial Training Department implements Craftsman Training Scheme through Government and private ITIs and Apprenticeship Training Scheme through the RI Centres of the State. Industrial Train-ing Institutes are rendering service by imparting Craftsman training to trainees to make them skilled labour force. There are 118 Government ITIs ( 71 ITIs under Industrial Training Department, 44 ITIs under Scheduled Caste Development Department and 3 ITIs under Scheduled Tribes Development �� ������>������E������������9����6����$B�'6���'������������������������+�3���������ITIs. The present sanctioned seat capacity of these ITIs is 75,218 approximately. The Apprenticeship Training Scheme under Apprenticeship Act 1961 is implemented through 9 RI Centres and 5 ITIs (Total 14 Centres).
5.54 71 Industrial Training Institutes (including 15 new ITIs which began functioning in August 2010) �����E������������9��������������������� �������F9B�������#���������������������'�������$�total of 16503 seats are available in these ITIs 30% of the seats are reserved for women candidates. The new ITIs during 2010-11 is given in the Table No. 5.6.
���������7��A��,��������0�!338
%�������"��������H�� 9. ITI Cheriyamundam2. ITI Thevalakkara 10. ITI Maniyoor
3. ITI Ranni 11. ITI Thiruvampady+�������$���B������ %@�������B���������������B��� %!�������������6�B�������6. ITI Cherppu 14. ITI Seethmgoli7. ITI Manaloor 15. ITI Maradu/Palluruty8. ITI Kollengode
Advanced Vocational Training System (AVTS)�����$B�'����������������� ��������������������������� �������������������� ������������������ �����������������������������$B�'����������������������������������%�33�������F������
Economic Review 2011
96
����������$B�'��������������� �����������������������%��&������O����E������������������������������������B�������������$���Q����������������6�������+���%+���������������
High – Tech training Scheme���������������������������������������������������$�������B��������������'������=$B�'>�Kalamassery is an Institution started under World Bank Aided Skill Development Project during 2000. Short term High-Tech Courses in the following areas are given
�� Auto CADD� �� PC maintenance� �� Industrial Automation
�� Analogs Digital Electronics
Placement Cell���3��������������9����������������������������$���#����������������� �����������������<����through these cells. In addition to this regular Job Fairs are being arranged.
Finishing School�������O��������#������������ ���������������������������������<���������������� ��������6������������ ���������<����������� ��������������������������������#����������������Training Department. Initially 14 ITIs are selected for the implementation of this programme and this is a state sponsored programme for which an amount of ` 00.00 lakh was provided in the budget 2010-11. The training under the scheme is continuing.
Centres of Excellence5.59 Government of India through DGE& T has introduced a Centrally Sponsored Scheme for Upgra-dation of ITIs into Centres of Excellence in order to produce world class work force which can keep pace with the technological demands of the industry. With this view, Government of India decided to upgrade 500 ITIs in the country into ‘Centres of Excellence’ in a phased manner at the rate of 100 ITIs in a year. Government of India has upgraded 12 ITIs in Kerala into ‘Centres of Excellence’ with World Bank assistance (7 ITIs) and domestic funding (5 ITIs) and eight ITIs under the scheme of Upgradation of 1396 government ITIs through Public Private Partnership.
Skill Development5.60 Skill and knowledge is the driving force of economic growth and social development. Skill de-velopment is a major focus in the programmes and policies of all developing nations. Productive skills ������������ ��������� �����������������������������������#�������������H��������������for national development. A large reserve of unskilled people may be perceived as a problem, but a large population of skilled workers is a huge asset. The Government is giving more importance to skill development which has to be strengthened. More funds should be allocated to Industrial Training Department for improving the infrastructure facilities of the institutions. New ITIs should be opened during 2011-12, as the National Skill Development Mission aims at providing 500 million trained work forces by 2022. The Government also proposes to strengthen the placement activities of ITI train-ees by conducting Job Fairs and Skill Fest in different regions periodically. The department has also planned to upgrade all existing ITIs into Centres of Excellence with the assistance of Government of India and Public Private Partnership Mode
Kerala State Planning Board
97
Employment5.61 After three years of continuous crisis conditions in global labour markets and against the pros-pect of a further deterioration of economic activity, the world enters the year 2012 facing a serious �#������������������� �����������������<������������#����������#������ ��������@&&���������������������@3���������������������������������������������������������������������������annual publication, Global Employment Trends 2012; released on 24th January 2012. It is estimated that more than 400 million new jobs will be needed over the next decade to avoid a further increase in unemployment. Hence, to generate sustainable growth while maintaining social cohesion, the world must rise to the urgent challenge of creating 600 million productive jobs over the next decade.
5.62 For the fourth consecutive year, global unemployment remained elevated in 2011, with more than %�3���������� ������������������6���<��������������������������#��������������������@3�million more than in 2007. The number of unemployed around the world increased by 5.8 million in @&&�����������������������#����������@%���������@&&���$�������������������������� ��-ticularly hard hit by the crisis. In 2011, 74.7 million youth aged 15–24 were unemployed, an increase of ��������+������������@&&3��������#������ ������<���������#����������#�����%��
Table 5.15B�� "#�� �����������-��#��G �##����H
Year *��� 4����� ����(2+3)
���� � ���
(1) (2) (3) (4) (5) (6)2000 101.80 73.60 175.40 73.40 102.00
2005 106.20 81.30 187.50 78.70 108.802006 103.10 76.90 180.00 75.50 104.502007 97.60 73.00 170.60 70.70 99.992008 101.40 75.00 176.40 71.60 104.802009 115.30 82.40 197.70 76.30 121.402010 113.20 84.10 197.30 75.80 121.502011* 113.50 83.70 197.20 74.70 122.50
* Preliminary Estimates �������'�����$����(����)�����# !" *��+
���!��$�� �������<���������������#���������6���#������ ������������������������������������6.0 per cent, despite rapid economic growth of 5.1 per cent in 2010 and 4 per cent in 2011. The un-employment rate in South Asia is estimated to have been just 3.8 per cent in 2011, down from 3.9 per cent a year before. Similar to other regions, the unemployment rate in South Asia is higher for youth (9.9 per cent in 2011) and women (4.8 per cent). At the country level in South Asia, the unemployment rate fell fastest in Sri Lanka in recent years, from 8.5 per cent in 2004 to 4.9 per cent in 2010. The unemployment rate by sex, world and regions are given in Appendix 5.6.
���+������� ����������������������#������������������������������������������6�����������pace of increase has slowed in recent years. After an average increase in global employment of 52 mil-lion workers each year over the four years from 2004 to 2007, job expansion decelerated sharply to an average of only 33 million over the crisis years from 2008 to 2011. In 2008, it reached a record low of only 14.2 million, which is the lowest level of global employment growth ever recorded (with estimates available since 1991). The number of workers around the world grew by 38.1 million in 2009, the year in which global economic growth contracted by 0.7 per cent. Despite the sharp upturn in global economic growth in 2010, to a rate of 5.1 per cent, the number of employed around the world increased by only 37.5 million – still well below the pre-crisis trend. While employment growth picked up somewhat in 2011, thus far the world has failed to return employment generation to the levels achieved before the crisis.
Economic Review 2011

98
5.65 The Eleventh Plan (2007-12) of Govt. of India aims at generation of 58 million work opportunities in twenty-one high growth sectors so that the unemployment rate falls to 4.83 per cent by the end of the Plan.
5.66 The overall impact of the economic slowdown is not considered to be acute in India as experi-enced in most of the countries in recent years. However it had moderate impact on the Indian labour ����������#���E�����6�������H���������"�����������#������Q� ������=*��>6���������<���Z��������������������������#���@&&���������#���@&&������������������������������������impact of economic meltdown on job loss. The estimated employment in the selected sectors has experienced a net addition of 12.8 lakh employment during the study period; which indicates that job ����������������$������������������������#��B�B�*����F��������#�����������6�F������@&&���������"���������9����������������6�*������������������������������������������#�������������������������������������� ������������H��������������������H��������6������#���������minimal as indicated by the Labour Bureau study.
5.67 In Kerala from the decade of 1970’s onwards there has been a rapid rise in the labour supply be-cause of the increase in the number of women seeking wage employment. Though the supply of work seekers increased, the demand for them did not increase. As a consequence there was an alarming increase in unemployment rate from time to time.
5.68 The unemployment problem in Kerala is not only about educational unemployment of the general category but also about unemployment of skilled, professional, semi-skilled, and unskilled workers. ����� ��������������� ������������������ ����������������������Q��������������������������#�������� ��������������*������������\���������������������������'�������������������-tion is because of lack of employment opportunity within the State. However over the last one decade Kerala has been witnessing large number of inmigration of labour force to Kerala from other parts of the country.
5.69 Unemployment and under employment among workers in traditional sectors are indeed of major ���������������������� �������� ������������������������������������������������������$�-cording to the 2001 Census, the number of agricultural workers in Kerala was around 16.20 lakh and this is more than twice the number of cultivators (7.20 lakh) and more than four times the number in the household industry (3.70 lakh). Close to three-fourth of workers in the household industry is in rural areas and nearly half of them are female workers.
5.70 As the economy developed, the demand for unskilled and less skilled labour seems to have de-���������������������6������������������������#��6�������������������������� �������upgradation and changes in the organisation of work has begun to increase.
Employability and Skill Development5.71 Skills and knowledge are the driving forces of economic growth and social development of any country or region. As India moves progressively towards becoming a Knowledge Economy it becomes increasingly important to focus on skill development to make it relevant in the emerging economic development. The target group for skill development comprises all those in labour force including ������������������#�����������������<��������6�������� ���������������H����������������������������������H����������$��������������������������� ���������������������� �������-ity leading to higher employability, higher levels of earnings and income and thereby helping poverty reduction in the country. It is with this perspective that India has initiated National Skill Development Initiatives and set an overall target of creating 500 million skilled workers by 2022 to cater to the need and productivity of the country and also for the reduction in the global market. A three tier institutional structure consisting of Prime Minister’s National Council on Skill Development, Skill Development Co-ordination Board and National Skill Development Corporation has been set up to take forward the skill development agenda.
Kerala State Planning Board
99
������<I���������� /�##�;�(�#�" ������������
Against the various challenges, a National Skill Development Policy has been formulated in February, 2009 which targets creating 500 million skilled people by 2022 with the fol-lowing vision:
M� Skill development should harness inclusivity and reduce economic and social divi-sions among Indian workforce particularly across rural-urban, male-female, orga-�H��}������H��������������������� ������
M� Matching the emerging demands for skills across various industries and economic enterprises.
M� Q������ F������ B������� �����<����� ?�������� �� ���#��� ����� �����-tional standards.
M� ����� ����������������<������������#�������H��������������Z��������������acquired through any informal system of learning.
M� *����������������������������������]�����H����6��������6�������������6���-chayati Raj Institutions and other professional bodies.
M� Greater reduction of poverty through enhanced earnings of skilled workers
Employment Generation Programmes at the National Level5.72 Government of India have been implementing several employment generation and poverty re-duction programmes with a view to generate more employment and to address poverty. The important among these are the National Rural Employment Guarantee Scheme (NREGS), SGSY, PMEGP and SJSRY. The scheme NREGS have enhanced the livelihood of the rural population to a great extent. During the year 2010-11, 5.57 crore households have been provided employment under the NREGS ����������+�!+�����������������@&&�}%&��������������@�3�%������� ������������� ������generated in 2010-11, the percentage of participation on SC, ST and Women are 30.6%, 20.9% and 47.7% respectively.
Employment and Unemployment Survey conducted by NSSO��3!�F������'�� ���'����������������=F''�>�����������������������������������#�������Employment-Unemployment in India at periodic intervals with the aim of getting estimates on level of parameters of various employment and unemployment characteristics at national and state level. The results of the latest survey, eight in the series, conducted during the period July 2009- June 2010 as �����������������F''��������� ����������������������������@&%%��
��3+�Q����������������������� ������������ ����������#������#������F''�������������������� ���������������������<����������������������������������� �������������
(i) number of persons usually unemployed based on usual status approach: which itself worked out in two different methods – one principal status (PS) method indicates the numerical mag-nitude of the persons unemployed for a relatively longer period during a reference period of 365 days and the other Usual status (adjusted) or Usual status (ps+ss) method – here the number of unemployed is arrived at excluding those employed in a subsidiary capacity during the reference period. The number arrived in second method will be lower than the former as ���� ������������H��������� �������������������<����������������#������������subsidiary capacity and this persons are excluded in the second method)
(ii) number of persons unemployed on an average in a week, based on the current weekly status (CWS) approach and
(iii) number of persons-days unemployed on an average, on a day during the reference period of seven days preceding the date of survey, based on the current daily status (CDS) approach.
5.75 As per the survey conducted in 2009-10 the Unemployment Rate (UR) in India is estimated at
Economic Review 2011

100
6.6% in Current Daily Status (CDS) approach. Unemployment Rate was found to be higher in rural areas than those in urban areas; it was 6.8 per cent in rural areas compared to 5.8% in urban areas. Unemployment rate among rural female was 8% compared to 6.4% of rural male and urban female Unemployment Rate was 9.1% compared to 5.1% for urban male.
��3��Q���������������� ����������������\���������� ������������� ���������� ������in India based on the surveys conducted in 2004-05 and 2009-10 are given in Appendix 5.7. As per the survey conducted in 2009-10 the Unemployment Rate in India is 6.6% in CDS approach as against 8.2%based on the 2004-05 survey. In the rural areas, the Unemployment Rate among male was 8.0 per centasper the 2004-05 sample survey. This rate diminished to 6.4 per cent as per the 2009-10 sample sur-vey.And in the urban areas, the unemployment rate among male decreased from 7.5 per cent to 5.1 per��������������<��}����� ������$���������������6�������� ���������������������������3� ������to 8.0 per cent and among urban female, from 11.6 per cent to 9.1 per cent during the same period.
5.77 2009-10 survey reveals that among the Indian States, Kerala (16.7%) has highest Unemployment Rate based on Current Daily Status approach; followed by Nagaland (15%). In Kerala UR among male was 12.7% and that of female 25.9% based on CDS approach. In the rural area, the UR is estimated at 17.3% (male -12.9% and female -27.4); whereas in urban area it is estimated at 14.8% (male -12.1% and female -21.3%). The unemployment rate according to Current Daily Status approach based on 2009-10 survey for each State/UT is given in the Appendix 5.8.
5.78 Some important indicators on employment/ unemployment in Kerala as per the surveys con-ducted in 2004-05 and 2009-10 are given in Table 5.16 which shows that the number of unemployed �������������������'���������������<�������� ������������� ������/����#������9�'�approach among male in rural area was 21.1 per cent in 2004-05. This rate diminished to 12.9 per cent as per the 2009-10 sample survey. And in the urban areas, the unemployment rate among male ��������������%3�+� ���������%@�%� �����������������<��}����� ������$���������������6�����unemployment rate decreased from 34.6 per cent to 27.4 per cent and among urban female, from 42.3 per cent to 21.3 per cent during the same period. This trend may be attributed to the poverty allevia-tion and employment generation programmes like NREGS, vibrant functioning of the Kudumbasree movement, and the stress given to traditional industries over the years.
Table 5.16 � ��� "�������@ "#�� ��������B�� "#�� ���������������G"���333H�������#�
G����������������(�����������������!3383������!33?83HAge:All Ages
�� �����
;���� Urban*��� 4����� *���?�
4�����*��� 4����� *���?�
4�����(1) (2) (3) (4) (5) (6) (7)
NSS 61st round (July 2004-June 2005)usual principal status
LFPR 572 258 407 565 260 410WPR 524 178 343 514 149 329UR 83 309 158 90 429 199
usual status (ps+ss)LFPR 589 321 448 583 301 440WPR 559 256 400 547 200 371UR 51 201 107 62 334 154
current weekly statusLFPR 568 285 420 560 260 408
Kerala State Planning Board
101
�� �����
;���� Urban*��� 4����� *���?�
4�����*��� 4����� *���?�
4�����WPR 512 211 354 510 165 335UR 98 260 156 91 365 180
current daily statusLFPR 548 246 390 544 240 390WPR 432 161 290 450 139 292UR 211 346 256 174 423 252NSS 66th round (July 2009-June 2010)
usual principal statusLFPR 572 223 389 553 213 375WPR 550 176 354 534 171 344UR 38 210 90 34 198 83
usual status (ps+ss)LFPR 583 260 414 564 233 391WPR 564 218 383 547 194 363UR 32 161 75 29 168 73
current weekly statusLFPR 566 238 394 555 218 379WPR 539 191 357 526 179 344UR 47 199 95 52 181 91
current daily statusLFPR 541 213 370 534 201 360WPR 471 155 306 469 158 307UR 129 274 173 121 213 148
�������������������,�-��+�������.$����(�������/������(�������������������� !!0#!12���.��(������������$����(�������/������(����������� !!3#"!2
Economic Review 2011

102
��#���?����������� ����/����=�?�/>���?�/������<������������#����� ����� ���}�������the labour force per 1000 persons/person-days
O������ ������/����=O�/>��O�/������<������������#����� ����� ���}������� �����per 1000 persons/person-days
��� ������/����=�/>����/������<������������#����� ����� ���}�������� ����� ���1000 persons/person-days in the labour force (which inclued both the employed and unemployed.)
Employment in the Organised Sector5.79 The number of persons employed in the organised sector; which comprises public and private sector in India as on March 2000 was 279.60 lakh. It declined to 264.59 lakh in March 2005 and ��������������������� �������������Q� ����������������������H�������������"�����@&&&�was 49.23 lakh constituting 17.6 per cent of the total organised sector employment in the country. This number moderately increased to 50.16 lakh in March 2005 and again increased to 55.12 lakh ��"�����@&&��=@&�&������������������������ �����>��$������}����������������������H���sector employment in India is in the public sector. Analysis shows that the employment in the public sector is decreasing over the years. The details of organised sector employment in India are given in Appendix -5.9.
���&���������6������� ����������������H��������������������������������������������������-#����� ������� ���������������H�����������@&&&�=�������>�����%@��%������ �����������-clined to 11.02 lakh persons in 2005 and then increased to 11.17 lakh in 2009. In 2010 it declined to 11.00 lakh; of which 4.92 lakh persons were in private sector and 6.08 lakh persons in public sector. Details on employment in organised sector in Kerala are given in Appendix 5.10 and Figure 5.1.
&�0����
6.51 6.46 6.38 6.19 6.15 6.10 6.07 6.1 6.07 6.15 6.08
6.00 5.88 5.825.50 5.31
4.93 5.04 4.945.25
5.01 4.924
4.5
5
5.5
6
6.5
7
2000 2001 2002 2003 2004 2005 2006 2007 2008 2009 2010
����
����
��<�
���
Year
'�$�/������������@�����A� ������- B�����
Public
Private
��������������������$����(����*'�%�4��������* !""
Kerala State Planning Board
103
������C-� ���@ "#�� ����������� �����J�(���
The percentage of women employed in the State Government is lower as compared to the percent-����������� ������������������ ������� �����������'�����*�����������!%���"�����2011 only 38.57 % are women.
��������������������$����(����*'�%�4��������* !""
���%�����������������H����������� ��������%%�&&������ ���������!%��������#���@&%&�����share of women employees is 39.91%. The share of women in public sector in Kerala is about 31.3 percent; where as in the case of private sector it is 50.6% (See Table 5.17).
Table 5.17@ "#�� �������L�0������� �������������#��8�%��#���M�%��(����G������;��� ����!33H
��� ������ <�����$����� %
Public SectorMale 4.18 68.75Female 1.90 31.25Total 6.08 100.00
Private SectorMale 2.43 49.39Female 2.49 50.61Total 4.92 100.00
TotalMale 6.61 60.09Female 4.39 39.91Total 11.00 100.00
��������������������$����(����*'�%�4��������* !""5.82 The total employment in the public sector in Kerala as on 31st December 2000 was 6.51 lakh. It declined to 6.09 lakh in 2005 and then increased to 6.15 lakh in 2009. However as on December 2010 it declined to 6.08 lakh; of which 0.60 lakh Central Government employees, 2.64 lakh State Govern-ment employees, 2.58 lakh Quasi Government employees and 0.26 lakh Local Government Employ-ees. The percentage distribution of employment in public sector is shown in the following graph. (Fig. 5.2)
&�0���!
��������������������$����(����*'�%�4��������* !""
Economic Review 2011
104
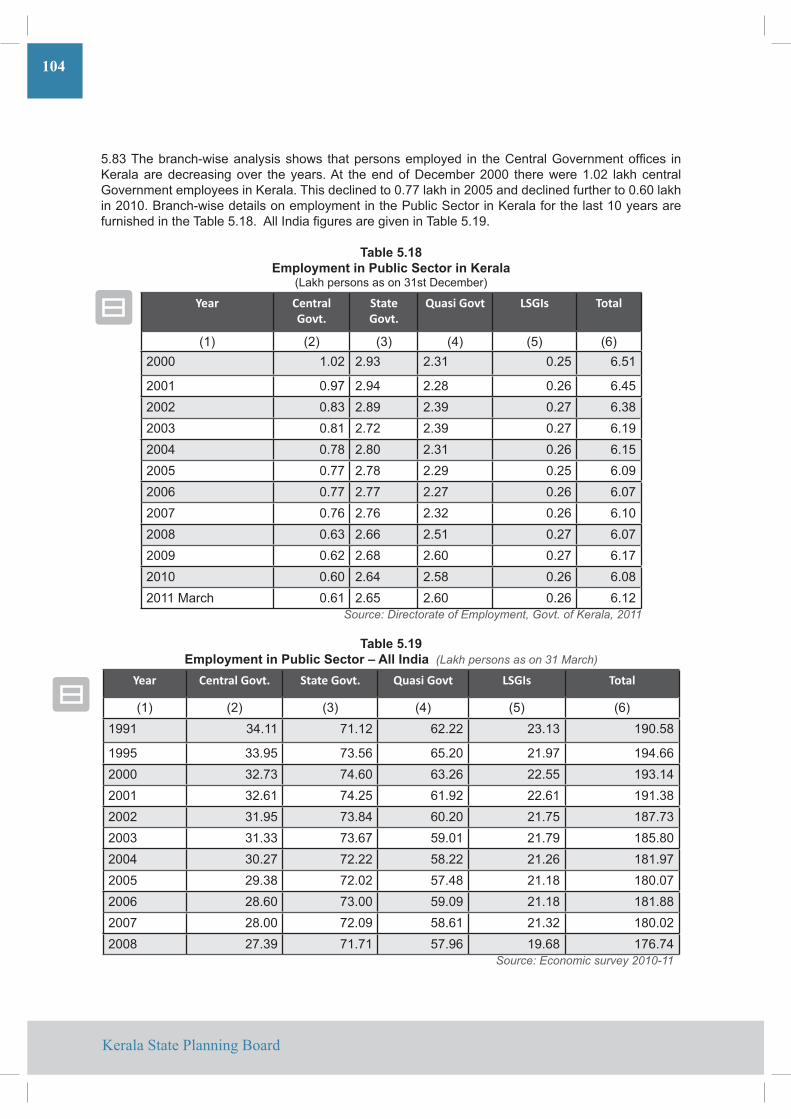
���!�����#����}������������������ ����� ������� ����� �� ����9������*��������<���� ��Kerala are decreasing over the years. At the end of December 2000 there were 1.02 lakh central Government employees in Kerala. This declined to 0.77 lakh in 2005 and declined further to 0.60 lakh in 2010. Branch-wise details on employment in the Public Sector in Kerala for the last 10 years are �����������������#�����%����$��������<�������������������#�����%��
Table 5.18@ "#�� �������%��#��� �������������#�
(Lakh persons as on 31st December)
Year ��������Govt.
State Govt.
E�����F,� LSGIs ����
(1) (2) (3) (4) (5) (6)2000 1.02 2.93 2.31 0.25 6.51
2001 0.97 2.94 2.28 0.26 6.452002 0.83 2.89 2.39 0.27 6.382003 0.81 2.72 2.39 0.27 6.192004 0.78 2.80 2.31 0.26 6.152005 0.77 2.78 2.29 0.25 6.092006 0.77 2.77 2.27 0.26 6.072007 0.76 2.76 2.32 0.26 6.102008 0.63 2.66 2.51 0.27 6.072009 0.62 2.68 2.60 0.27 6.172010 0.60 2.64 2.58 0.26 6.082011 March 0.61 2.65 2.60 0.26 6.12
��������������������$����(����*'�%�4��������* !""
Table 5.19@ "#�� �������%��#��� ��������'##�������6��7,�����������8"9���,:
Year ��������F,�� State Govt. E�����F,� LSGIs ����
(1) (2) (3) (4) (5) (6)1991 34.11 71.12 62.22 23.13 190.58
1995 33.95 73.56 65.20 21.97 194.662000 32.73 74.60 63.26 22.55 193.142001 32.61 74.25 61.92 22.61 191.382002 31.95 73.84 60.20 21.75 187.732003 31.33 73.67 59.01 21.79 185.802004 30.27 72.22 58.22 21.26 181.972005 29.38 72.02 57.48 21.18 180.072006 28.60 73.00 59.09 21.18 181.882007 28.00 72.09 58.61 21.32 180.022008 27.39 71.71 57.96 19.68 176.74
�������$����������%�( !"!#""
Kerala State Planning Board
105
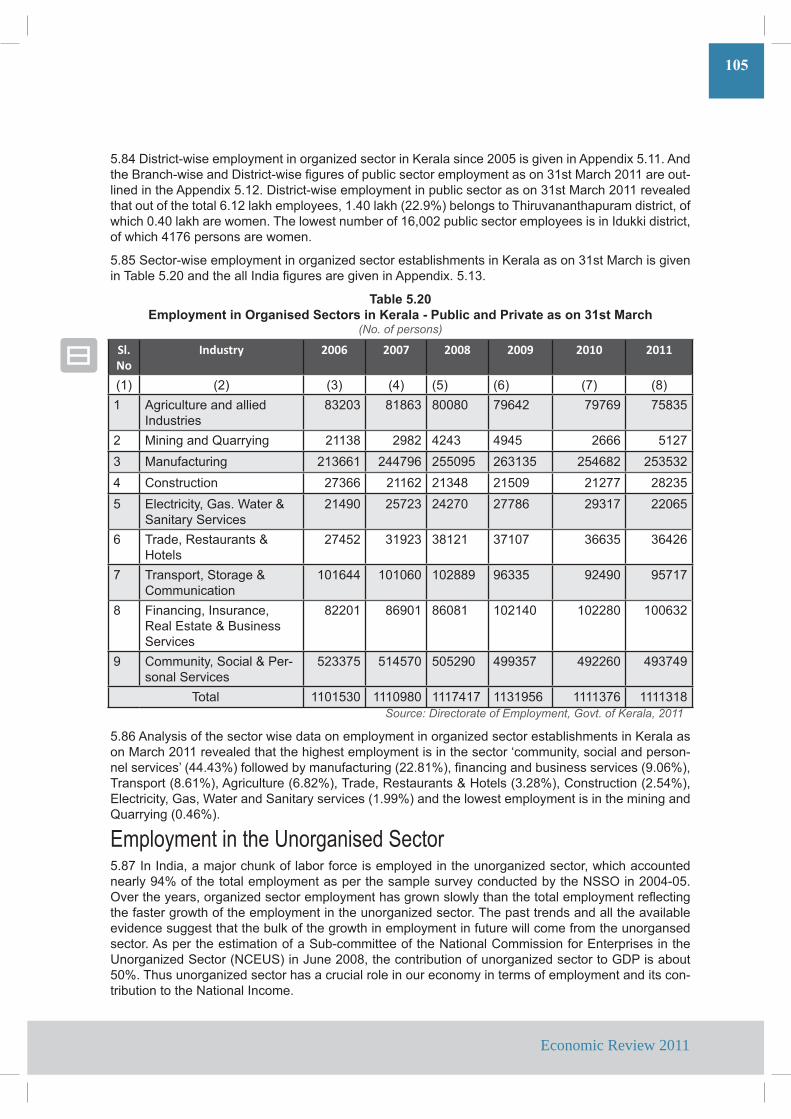
���+���������}������� ������������H�����������������������@&&������������$ ���`���%%��$������E����}����������������}�����<�������� �#������������ ����������!%���"�����@&%%�������-lined in the Appendix 5.12. District-wise employment in public sector as on 31st March 2011 revealed that out of the total 6.12 lakh employees, 1.40 lakh (22.9%) belongs to Thiruvananthapuram district, of which 0.40 lakh are women. The lowest number of 16,002 public sector employees is in Idukki district, of which 4176 persons are women.
�����'����}������� ������������H�������������#����������������������!%���"�����������������#�����@&�����������������<�����������������$ ���`����%!�
Table 5.20@ "#�� �������L�0������� ��������������#��8�%��#�������%��(����������2���9������
6-�4���������:
����No
H� ����/ 2006 2007 2008 2009 2010 2011
(1) (2) (3) (4) (5) (6) (7) (8)1 Agriculture and allied
Industries83203 81863 80080 79642 79769 75835
2 Mining and Quarrying 21138 2982 4243 4945 2666 51273 Manufacturing 213661 244796 255095 263135 254682 2535324 Construction 27366 21162 21348 21509 21277 282355 Electricity, Gas. Water &
Sanitary Services21490 25723 24270 27786 29317 22065
6 Trade, Restaurants & Hotels
27452 31923 38121 37107 36635 36426
7 Transport, Storage & Communication
101644 101060 102889 96335 92490 95717
8 Financing, Insurance, Real Estate & Business Services
82201 86901 86081 102140 102280 100632
9 Community, Social & Per-sonal Services
523375 514570 505290 499357 492260 493749
Total 1101530 1110980 1117417 1131956 1111376 1111318 ��������������������$����(����*'�%�4��������* !""
�����$�������������������������������� ������������H�������������#���������������������on March 2011 revealed that the highest employment is in the sector ‘community, social and person-�����������]�=++�+!�>��������#��������������=@@��%�>6�<��������#����������������=��&��>6�Transport (8.61%), Agriculture (6.82%), Trade, Restaurants & Hotels (3.28%), Construction (2.54%), Electricity, Gas, Water and Sanitary services (1.99%) and the lowest employment is in the mining and Quarrying (0.46%).
Employment in the Unorganised Sector���3�������6�����������������#������������ ����������������H��������6����������������������+��������������� ��������� ���������� ������������������#������F''����@&&+}&�����������������6�����H����������� ����������������������������������� ��������\������������������������������� �����������������H�������������� ���������������������������#���evidence suggest that the bulk of the growth in employment in future will come from the unorgansed sector. As per the estimation of a Sub-committee of the National Commission for Enterprises in the �����H���'�����=F9Q�'>�������@&&�6���������#�����������H�����������*�������#����&�������������H������������������������������������������������� ��������������-tribution to the National Income.
Economic Review 2011

106
�����$������������������������������ ������������ �����������������#������F''����the 66th round of NSS during July 2009 – June 2010 it is estimated that the self employed workers in India constituted 51.0% of the total workers. Whereas the percentage share of regular wage/salaried employee accounted for 15.5% and that of casual labour 33.5%. In the case of Kerala the shares are as follows: self-employed-38.4%, regular wage/salaried employee-23.2% and casual labour – 38.4%. �����E���������������������������@&&�}%&6�F''�� �#����������� ������������@&%@���H|�[���-mal Sector and Conditions of Employment in India’; which provides estimates of workforce in respect of certain characteristics of the enterprise where the workers worked with reference to those engaged in the informal sector. (Informal Sector in India is broadly charactarised as consisting of units engaged in the production of goods and services with the primary objectives of generating employment and incomes to the persons concern)
5.90 The report reveals that among self-employed workers in Kerala about 99 per cent in the rural ar-eas and 97 per cent in urban areas reported to have worked in the informal sector. In the case of work-ers in casual labour in other than public works about 82% in the rural areas and 86% in the urban areas reported to have worked in the informal sector. Table 5.21 depicts proportion (Per 1000) of informal sector (Proprietary & Partnership) workers among workers engaged in AGEGC (Agriculture excluding growing of crops, market gardening, horticulture and growing of crops combined with farming of ani-mals) and non-agriculture sectors for different statuses in employment in respect of Kerala and India.
Table 5.21%���333���������������������� �#��������G%�M�%H�A��/����� ��0�A��/����G"�O��H���0�0���
���'J@J���������8�0����#���������������������������������������� "#�� ����8�����#�����������
���No
����������'�$�/����
;���� Urban ;�����?�%����
*���� 4����� *����?�4�����
*���� 4����� *����?�4�����
*���� 4����� *����?�4�����
A) Kerala1 Self Employed 986 992 988 969 960 967 981 984 982
2 Regular wage/ salariedemployees
460 361 423 397 293 356 437 334 398
3 Casual labour in other than public work
862 642 817 893 672 857 870 649 828
All categories 809 662 765 759 560 703 793 633 746
B) India
1 Self Employed 922 960 935 949 967 953 935 962 942
2 Regular wage/ salaried em-ployees
417 274 390 427 288 402 423 283 398
3 Casual labour in other than public work
748 697 740 760 623 737 751 674 739
All categories 742 744 742 685 616 673 715 698 711�������.����������������������������$����(�����������2������,���(-��+��;�����( !" �������
!!3#"!���%�(4
Kerala State Planning Board
107
Employment Generation Programmes implemented by the Department of Employment and Training, Govt. of Kerala�H�����#�� ����� �#��@ "#�� ���� ��� ��������0��������B�� "#�� ����G�@ �BH�
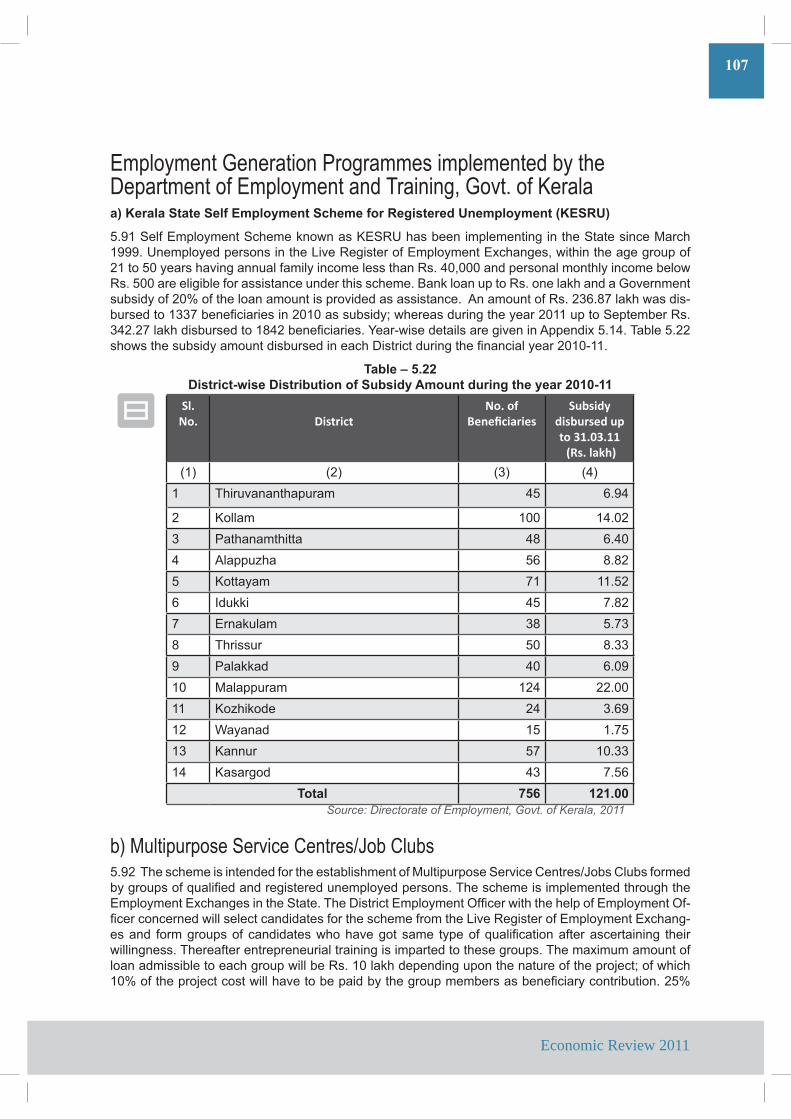
5.91 Self Employment Scheme known as KESRU has been implementing in the State since March 1999. Unemployed persons in the Live Register of Employment Exchanges, within the age group of 21 to 50 years having annual family income less than Rs. 40,000 and personal monthly income below Rs. 500 are eligible for assistance under this scheme. Bank loan up to Rs. one lakh and a Government subsidy of 20% of the loan amount is provided as assistance. An amount of Rs. 236.87 lakh was dis-#��������%!!3�#��<����������@&%&������#����|������������������������@&%%�� ���'� ���#���/���!+@�@3���������#��������%�+@�#��<���������~���}������������������������$ ���`���%+����#�����@@������������#�������������#��������������������������������<�����������@&%&}%%�
Table – 5.22;�������8A����;��������������� �������' ����������0����������!338
����No. (�������
����J���+��������
����� /� ������� ��$�to 31.03.11��;��������
(1) (2) (3) (4)1 Thiruvananthapuram 45 6.94
2 Kollam 100 14.023 Pathanamthitta 48 6.404 $�� �H�� 56 8.825 Kottayam 71 11.526 Idukki 45 7.827 Ernakulam 38 5.738 Thrissur 50 8.339 Palakkad 40 6.0910 Malappuram 124 22.0011 �H����� 24 3.6912 Wayanad 15 1.7513 Kannur 57 10.3314 Kasargod 43 7.56
,���# 756 121.00��������������������$����(����*'�%�4��������* !""
b) Multipurpose Service Centres/Job Clubs5.92 The scheme is intended for the establishment of Multipurpose Service Centres/Jobs Clubs formed #����� ����Z����<�������������������� ����� ���������������������� �������������������Q� ������Q`�������������'�������������������Q� ��������<���������������� ���Q� ��������-<������������������������������������������������������������/����������Q� ������Q`����-������ ������� ������������������������������ �� ����Z����<���������������������� ������willingness. Thereafter entrepreneurial training is imparted to these groups. The maximum amount of loan admissible to each group will be Rs. 10 lakh depending upon the nature of the project; of which %&�������� ����������������������#�� ����#��������� ����#�������#��<����������#�����@���
Economic Review 2011

108
of the loan amount subject to a maximum of Rs. 2.00 lakh will be given as subsidy. Altogether 65 job clubs were granted a total subsidy of Rs. 94.78 lakh in 2010-11. (See Table 5.23)
������?����#�� �����@����"�������;�(�#�" ����9������
������@&%%}%@�*������������������������������������ ����������H|��������'�����Q��� ��-neur Development Mission, aimed at providing self-employment to one lakh youths through 10,000 new ventures. It aims to launch 2,000 ventures every year and providing employment to 20,000 persons annually. Kerala Financial Corporation (KFC) is the nodal agency for the scheme.
Salient FeaturesM� ����#�������������#������������������������ �����������#��������� �������� �������������
the youth of the State.M� �������������� � ������#���� ����������������� ������ ��������#���6���������'���������������-
ats.M� ���� �� ����������� ������������#�����������#�������������� �#��������� �������������M� 9��������]��������Z����<��������������������������������������M� ��������� �������������� #������H��� ��� ���� ������������ ����������E���6���������6�"���� �����6�
Corporation levels to explain the features and eligibility criteria of the scheme.M� ����� ������������#�������������������� ������6�Z����<����6������6� �����������6� �����������#���������
available infrastructure facilities.M� $������������6����� �������� �������������#������H�����#�������������#������������������������
���������������Q��� �������� ������ ������������6����9�6�/'Q���=����� �#��F$E$/�>6�9��������Management Development etc.
M� � �������������� �������������6���� ������������������#�������#������<����������������������������������������������������������������������� ���<��� ����������#�������������&�������������project cost subject to the ceiling of Rs.20 lakh. The ceiling will be reduced for smaller groups on pro rata basis.
M� ����<������#�����������������������������#��#���#������*�������������������������������#��������� �������#����������������������#������������`�����<������������������/��%&�lakh.
M� ������������#���� ���#���������`����� �������������������������������������������������M� ����*������������#����������������������#�������������� ��������������������������������
entrepreneurs under the mission who set up the units successfully.M� ?��<��������� ���� ��������6�������������#���6�F$E$/����������<���������������������#��
������*������������ ������������������������?�������9� ������������������������<������institutions.
M� ?���������������������������� �����6���������������#���#���H���������������������������F$E-ARD, National Skill Development Corporation, SC/ST Development Department, Labour Department and other similar institutions. Balance amount will be provided by the Government.
Table 5.23 ���������#���������9�#��"��"���� ��(����������*P����#���������0�!338
(District wise Statistics)
������(�������
����K��������
����� /� ������� � ������!"#"&##�;���<����
(1) (2) (3) (4)1 Thiruvananthapuram 4 6.312 Kollam 11 13.123 Pathanamthitta 1 1.634 $�� �H�� 2 1.025 Kottayam 7 9.54
Kerala State Planning Board
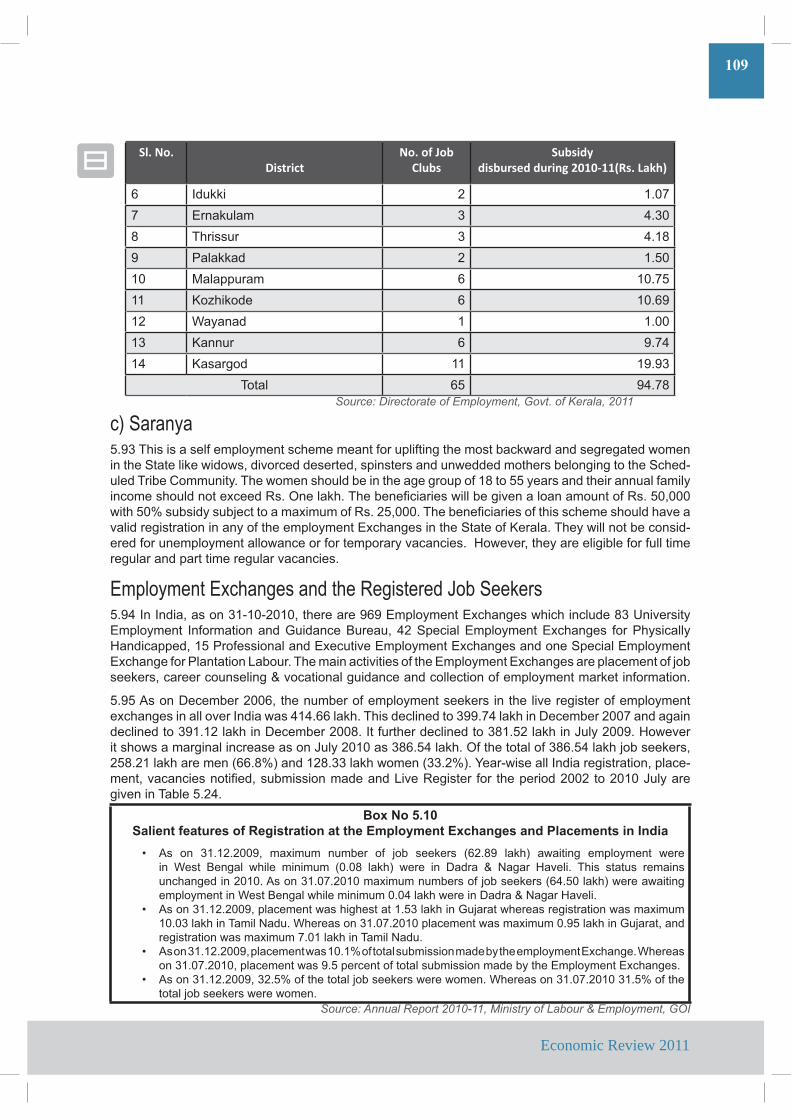
109
������(�������
����K��������
����� /� ������� � ������!"#"&##�;���<����
6 Idukki 2 1.077 Ernakulam 3 4.308 Thrissur 3 4.189 Palakkad 2 1.5010 Malappuram 6 10.7511 �H����� 6 10.6912 Wayanad 1 1.0013 Kannur 6 9.7414 Kasargod 11 19.93
Total 65 94.78��������������������$����(����*'�%�4��������* !""
c) Saranya5.93 This is a self employment scheme meant for uplifting the most backward and segregated women in the State like widows, divorced deserted, spinsters and unwedded mothers belonging to the Sched-uled Tribe Community. The women should be in the age group of 18 to 55 years and their annual family ��������������`�����/����������������#��<�������������#�������������������/����&6&&&�������&����#�������#�����������`�������/���@�6&&&������#��<�����������������������������������valid registration in any of the employment Exchanges in the State of Kerala. They will not be consid-ered for unemployment allowance or for temporary vacancies. However, they are eligible for full time regular and part time regular vacancies.
Employment Exchanges and the Registered Job Seekers 5.94 In India, as on 31-10-2010, there are 969 Employment Exchanges which include 83 University Employment Information and Guidance Bureau, 42 Special Employment Exchanges for Physically Handicapped, 15 Professional and Executive Employment Exchanges and one Special Employment Exchange for Plantation Labour. The main activities of the Employment Exchanges are placement of jobseekers, career counseling & vocational guidance and collection of employment market information.
5.95 As on December 2006, the number of employment seekers in the live register of employment exchanges in all over India was 414.66 lakh. This declined to 399.74 lakh in December 2007 and again declined to 391.12 lakh in December 2008. It further declined to 381.52 lakh in July 2009. However �����������������������������������@&%&����!����+���������������������!����+�������#��������6�258.21 lakh are men (66.8%) and 128.33 lakh women (33.2%). Year-wise all India registration, place-���6������������<��6���#�������������������/�������� ��� ���� �����@&&@���@&%&����������given in Table 5.24.
���������3 �#�������������������0�����������������@ "#�� ����@�����0�������%#��� �������������
M As on 31.12.2009, maximum number of job seekers (62.89 lakh) awaiting employment were in West Bengal while minimum (0.08 lakh) were in Dadra & Nagar Haveli. This status remainsunchanged in 2010. As on 31.07.2010 maximum numbers of job seekers (64.50 lakh) were awaiting employment in West Bengal while minimum 0.04 lakh were in Dadra & Nagar Haveli.
M As on 31.12.2009, placement was highest at 1.53 lakh in Gujarat whereas registration was maximum 10.03 lakh in Tamil Nadu. Whereas on 31.07.2010 placement was maximum 0.95 lakh in Gujarat, and registration was maximum 7.01 lakh in Tamil Nadu.
M As on 31.12.2009, placement was 10.1% of total submission made by the employment Exchange. Whereason 31.07.2010, placement was 9.5 percent of total submission made by the Employment Exchanges.
M�� As on 31.12.2009, 32.5% of the total job seekers were women. Whereas on 31.07.2010 31.5% of the total job seekers were women.
������� ����������� !"!#""*9������(��������<$����(����*'+�
Economic Review 2011

110
Table 5.24;����#�����)���8A������0���������=�%#��� ����������(����0��������'##������
6��),�������:
Year ;������� � ��������� M���������� -+�
�����������*� �
Live Register
(1) (2) (3) (4) (5) (6)2002 5064.0 142.6 220.3 1748.8 41171.2
2003 5462.9 154.9 256.1 1917.3 41388.72004 5373.0 137.7 274.6 1801.4 40457.62005 5437.1 173.2 349.2 2402.0 39347.82006 7289.5 177.0 358.2 3029.5 41466.02007 5434.2 263.5 525.8 3666.1 39974.02008 5315.9 305.0 570.8 3344.0 39112.42009 5693.7 261.5 419.5 2589.3 38152.22010(Upto July)
3353.6 139.9 283.2 1872.0 38653.8
�������9������(�����������$����(����*'�%�4�������
5.96 In Kerala, the Industrial Training Department and the Employment Department play comple-mentary roles in providing employment to the unemployed registered labour force in the State. The former undertake skill training to make the manpower marketable and the latter looks after the needs of the work seekers. All categories of employment seekers above the age of 14 are allowed to reg-ister in the Employment Exchanges. The Employment Service in Kerala has a network of 3 Profes-��������Q`��������Q� ������Q`��������������������� ����6�Q�������6�����H�����6�%+����������Q� ������Q`������6����/�����Q� ������Q`�����6��&����Q� ������Q`����-es, 6 Special Employment Exchanges for Physically Handicapped, 2 Coaching Cum Guidance Cen-tres for SC/ST, 7 University Employment Information & Guidance Bureau and 6 Employment Informa-tion and Assistance Bureau.
5.97 According to the Employment Directorate 43.42 lakh of employment seekers are there in the Live Register of Employment Exchanges in Kerala as on 31.08.2011; of which 25.68 lakh (59.1%) are female. The details of registered job seekers in Employment Exchanges are given in Table 5.25.
Table 5.25��0��������:������/�������@ "#�� ����@�����0���8�����#��
G'�����2���'�0����!3H������ ������/ �������
(1) (2) (3)1 Illiterate 98
2 Below SSLC 5,85,7313 SSLC 27,29,9374 Higher Secondary 7,18,1965 Degree 2,60,8316 Post Graduates 47,474
Total 43,42,267��������������������$����(����*'�%�4��������* !""
Kerala State Planning Board
111
5.98 In Kerala, the total number of work seekers registered in the employment exchanges as on 31st December 2001 was 44.31 lakh. It declined to 36.70 lakh in 2005 and thereafter the number has been increasing every year. The number of job seekers increased to 41.44 lakh in 2008 and again increased to 43 lakh in 2009. It rose slightly to 43.10 lakh in 2010 and now stood at 43.42 lakh as on August 2011. The number of general work seekers increased from 34.93 lakh in 2005 to 41.54 lakh in 2009. It slightly increased to 41.60 lakh in 2010 and again increased to 41.88 lakh as on August 2011. Whereas the registered number of professional and technical work seekers declined from 1.77 lakh in 2005 to 1.46 lakh in 2009. But then it marginally increased to 1.50 lakh in 2010 and again increased to 1.55 lakh as on August 2011. Details of work seekers both general and professional & technical from 2001 to 2011 are given in Appendix 5.15.
5.99 The number of work seekers below SSLC is on a declining trend. It declined from 9.67 lakh in 2001 to 6.29 lakh in 2005. It further declined to 5.94 lakh in 2010 and again declined to 5.86 lakh as on August 2011. The total number of work seekers who possess SSLC and above are increased from 30.41 lakh in 2005 to to 37.16 lakh in 2010. It again increased to 37.56 lakh in 2011 (as on August 2011). The percentage of work seekers who possess below SSLC to the total work seekers is also showing a decreasing trend. Whereas the percentage of work seekers who possess SSLC and above is showing an increasing trend. The trend of work seekers in Kerala since 2001 is shown in Fig.5.3.
&�0Q���2,���������-��/����/�����������#�
��������������������$����(����*'�%�4��������* !""
Economic Review 2011

112
��%&&�������#������'9�Z����<����������������������������������������� �������`����������increased from 5.75 lakh in 2005 to 7.08 lakh in 2009. It increased to 7.18 lakh in 2010 and remains ����������@&%%��������������������������������������� �����������������<���������������������<����������������������@&%%��������� �����������������������#��������������������������������������������������� ���������@&&%���@&%%�����������$ ���`���%����������������� ��-ment seekers as on Auguest 2011, 13.49 percent is below SSLC, 62.87 percent SSLC, 16.54 percent HSC or equivalent, 6.01 percent graduates and 1.09 percent postgraduates. The percentage share of work seekers in various levels of education is given in Table 5.26.
Table 5.26%�������0�� ��������@ "#�� ���� ��/������������0����#�(�#����@�������������#��
����� <�,����' ��� ����������������
2008 2009 2010 8/2011
(1) (2) (3) (4) (5) (6)1 Below SSLC 15.00 14.50 13.78 13.49
2 SSLC 61.53 62.23 62.41 62.873 HSC or equivalent 16.54 16.46 16.65 16.544 Degree 5.66 5.57 6.05 6.015 Post Graduate 1.28 1.24 1.10 1.09
Total Work Seekers 100.00 100.00 100.00 100.00��������������������$����(����*'�%�4��������* !""
5.101 The number of professional and technical work seekers as on Aug 2011 is 1.55 lakh. The ���������� ������������������� ���������������������Z����<���������#����������#������@3�����������$������@&%%������ ����� ���������<����������������� ����������� �����������������92.6% of the total professional and technical work seekers.
Table 5.27%�������0�� ��������%����������#�����,�������#�A��/����/�����������#�
����� ' ��� ����E����+�� �
���������������
2008 2009 2010 8/2011
(1) (2) (3) (4) (5) (6)1 Medical Graduates 1.55 1.66 1.38 1.43
2 Engineering Graduates 5.54 6.49 5.41 5.393 Diploma holders in Engineering 22.21 24.80 23.37 23.124 ����9����<������������ 69.85 66.25 69.30 69.515 Agricultural Graduates 0.46 0.40 0.27 0.276 B���������*�������� 0.40 0.41 0.27 0.27
Total 100.00 100.00 100.00 100.00��������������������$����(����*'�%�4��������* !""
5.102 The number of job seekers with engineering degree in 2006 was 8466. It declined to 7941 in @&&�|�#��������������<�������������������`�����������+�����������������#��������������%+!�in 2010; but the trend again reversed and increased to 8341 in August 2011. Engineering diploma holders who had registered their names in employment exchanges increased from 35,164 in 2010
Kerala State Planning Board

113
��!�63+����@&%%��������������������F�9�9����<���������������������������������!%��� �������the year 2011. The number of medical graduates who had registered their names in the employment exchanges increased from 2070 in 2010 to 2211 in 2011. The number of veterinary graduate work seekers has also increased from 411 in 2010 to 419 in 2011. Agricultural graduates who had registered at the employment exchanges increased from 411 in 2010 to 419 in 2011. Data on professional and technical work seekers for the period from 2001 to 2011 are given in Appendix 5.17.
5.103 Women outnumber men seeking employment through employment exchanges. This position �����\����������������%+��������������������������������������#�����+@�++����������������������March 2011, women number 25.12 lakh (59.18%). The district-wise unemployment of women and men in 14 districts of Kerala as on 31.03.2011 is shown in the following graph (Fig.5.4).
&�0���
��������������������$����(����*'�%�4��������* !""
��%&+������������ ����� ��������� ����� <���� �� ���� ��#��� �� ���� �������� �� #��� ������� ���professional categories as on 31.3.2011. The total number of work seekers in Thiruvananthapuram district is 6.26 lakh of which 3.81 lakh are women and 2.44 lakh men. The second largest number of �������������������$�� �H�����������������������+�@@�������#�����������$�� �H����������������March 2011, out of which 2.39 lakh are women and 1.83 lakh men. The lowest number of work seekers is in Wayanad district preceded by Kasargod District. In Wayanad, there are 0.94 lakh work seekers, whereas in Kasargod the number is 1.05 lakh as on March 2011. Details of district-wise distribution of work seekers are given in Appendix 5.18.
Placement through Employment Exchanges in Kerala��%&�� ���� <������ ��������� #�� ���� �������� �� Q� ������ �� ������� ���� ����� ����� ��������through Employment Exchanges in Kerala is declining since 2008. Total placement declined from 18,099 in 2008 to 15,612 in 2009 and further declined to 12,643 in June 2010, which shows 30% re-duction in a span of two years. The placement through employment exchanges in Kerala since 2000 is illustrated through following graph Fig.5.5.
Economic Review 2011
114
&�0�����%#��� ���������0��@ "#�� ����@�����0���8����#�
��������������������$����(����*'�%�4��������* !""
Unemployment Allowance Scheme (UAS)5.106 Unemployment Allowance Scheme, started in 1982, is an important social security scheme implemented by Government of Kerala with the aim of providing a monthly allowance of Rs. 120 to ������������������ �������9��Z�������������������H������ ��������������#��*�������������in accordance with 73rd and 74th constitutional amendments this scheme was transferred to Grama Panchayats in rural areas and Municipalities/Corporations in urban areas with effect from 1998. The #��<��������������#���#�������������%����������������������!���������������������������in any of the Employment Exchanges in the State. The upper age limit is 35 years and educational Z����<���������� ������''�9���������������������������������������� ���''�9����'9�'��candidates. Physically handicapped candidates need only a seniority of two years of continuous reg-istration. As per the revised norms, an eligible candidate can submit his application to the concerned �����'����*��������������$��������/���+&���������������#������#��������@��+������#��<���-�������@&%&|�������������������<�����������������������@&%%�/��@�&��3����������#��������!�&+������#��<�������������������������#���������$ ���`���%+�
Placement through ODEPC��%&3� �������������� �������Q� ������������9����������������=��Q�9>�������-��#���������%�33���������������������������������������������������H����������� ���������Q�9������������/�������������� ����� ��� ��������/������3����������%��&6�������������������������������-tion from the International Air Transport Association (IATA) was established with Government approval. ��Q�9������������������������������������������������������������������������������������������������������������������������������������������#������������������F����Q�9�������������������� �����������/���������������������H�������#� ���������������#������������ �����������������<����
Kerala State Planning Board
115
��%&�� ��Q�9� ��� ������� ���������������� �� ����*�������'����� �������� ������ ������� ���� �� ���������������9������}������� �������� ������#����Q�9������� ����<��������������������<�����������@&%&}%%�������������#�����@��
Table -5.28����0���8A������"#�� �������%�������#����L;@%�������
G������2�3�!3H������/ ��������$������
�$�/�
Nurse 44Teacher 8
Doctor 7Driver 4Engineer 4Sales Executive 5Administration Staff 2Total 74
�������+$=$* !""
��%&�� F��#��������������������������������������������������Q�9�����������������+3����2008-09 (up to 30-11-2009) to 228 in 2009-10. It further declined to 74 during 2011 (up to 31-10-2011). As in the previous years, during 2010-11 also the highest number of recruitment was in the category ��F�����=++� ����>��$�� �����������������������#����Q�Q96��������������� ������������'�����$��#���=�%>��������#��������=�>6��$Q�=3>����'��������������=3>�
Migration��%%&�"�����������#���������<���������� ����� ���������� �����6���� ������������������deprivation in Kerala. For over three decades there has been steady migration from the State of Kerala to countries in the Gulf and different parts of India and the world. It is estimated that today over 10% of the population of Kerala lives outside the State, in various parts of India and abroad particularly in the Gulf region, the US and Europe. 5.111 According to the latest study ‘Kerala Migration Survey 2011’ conducted by Shri.K.C.Zahariah and Shri.S.Irudaya Rajan of the Centre for Development Studies, Thiruvananthapuram, 22.8 lakh Kerala emigrants are living abroad in 2011. The number of Kerala migrants living in other States of India in 2011 is estimated at 9.31 lakh.
������+�0�#�0�����������������S�����#��9�0������� ��(���!3U��������/������
�����������;�(�#�" ������� ������=�,����(�������"���
����@&%%��������������<��������������������� �������������������������������������������-tion from Kerala since 1998 and it is based on primary data collected from 15,000 households selected ��������#����������<���������������������� ���������Z�������������������!��������������������
External Migration��It is estimated that the number of Kerala emigrants living abroad in 2011 is 2.28 mil lion, up
from 2.19 million in 2008, 1.84 million in 2003 and 1.36 million in 1998.��The number of Kerala emigrants who returned and living in Kerala in 2011 is estimated to be
1.15 million. It was 1.16 million in 2008, 0.89 million in 2003 and 0.74 in 1998. ��on-Resident Keralites (EMI+REM) numbered 3.43 million in 2011, 3.35 million in 2008, 2.73 mil-
lion in 2003 and 2.10 million in 1998.
Economic Review 2011
116
�������#���%��@� ���������������������������������������������@&%%�������@3�%� ���cent had an NRK. The vast majority of the households – nearly 82 per cent – did not have an emigrant member. Nearly three-fourths had neither an emigrant nor a return emigrant.
��The vast majority of the emigrants from Kerala in 2011 were Muslims (about 45 per cent), al-though their share in the total population was only about 26 per cent. They retained their lead ���������������������������������������6���������������������������!3��� ������������total, although their share in the total population is about 56 per cent. However, over the years, the Hindus have improved their share, from 29.5 per cent in 1998 to 37.5 per cent in 2011. The gain among the Hindus was mostly at the expense of the Christians whose share shrank from 25.1 in 2003 to 17.9 by 2011.
��The largest number of emigrants originated from Malappuram district, a position it retained from the beginning. However, its share has shrunk somewhat in recent years, from 21.8 per cent in 1998 to 17.9 per cent in 2011.
��The principal countries of destination of Kerala emigrants have remained more or less un-changed over these years, with 90 per cent of the Kerala emigrants going to one or other of the Gulf countries. Within the Gulf region, the UAE retained its number one rank, with Saudi Arabia coming in the second position. Nearly 40 per cent of Kerala’s emigrants live in the UAE and 25 per cent in Saudi Arabia. In the last 3 years, especially, after global crisis, Saudi Arabia has gained about 2 percentage points and UAE has lost out by the same proportion.
Internal Migration�� ������#�����������������������������������������������=�"�>���@&%%����������������#��
��!%�����6�� �������%+��������@&&������@&&!6�������#������"������������6�����6�%%%�%������6�though in 1998, however, it was only 6.91 lakh. There was no substantial increase in out-migra-tion from Kerala since 2008. More and more Keralites are opting for external migration in place of internal migration.
� The number of Kerala out-migrants who returned and are now living in Kerala (return out-mi-grants) in 2011 is estimated to be 5.11 lakh. The corresponding number was 6.86 lakh in 2008, 9.94 lakh in 2003 and 9.59 lakh in 1998. There was a consistent decline in the number of return out-migrants. More and more Kerala migrants in the other states in India tend to stay back in their host state or move abroad instead of returning to their native state.
�� ������������������=�'">�=����/�>���#�����%�++���������@&%%6�%��&���������@&&�6�@�%%�million in 2003 and 1.65 million in 1998.
� The vast majority of the out-migrants from Kerala (59.7 percent in 2011) were Hindus, a little �������������������������� ������=��� ������>����������������6�����9��������������about 26.7 per cent of the total, much higher than their share in the total population which was about 19 per cent. Muslims were only 13.7 per cent of the out-migrants, much lower than their share in the total population, which stood at about 26 per cent. Between 2008 and 2011, the share of the Hindu out-migrants declined from 61.7 per cent to 59.7 per cent, the share of the Christian out-migrants also declined from 30.9 per cent to 26.7 per cent, but the share of the Muslim out-migrants increased from 7.4 per cent to 13.7 per cent.
� Palakkad district accounted for the largest number of out-migrants from Kerala, a position it re-tained from the beginning. Thus the Palakkad-Malappuram corridor is the most migration-prone ����������������6���������������� ���������<��������}�����������"��� ����������������of emigration. Kottayam district comes second in the order of out-migration followed by Kannur district. Pathanamthitta district, which led all districts in 1998 in the matter of out-migration, is almost at the bottom of the list in 2011.
� What Pathanamthitta has gone through in the last 10-15 years in the matter of migration transi-tions can be expected to be replicated in many of the other districts in the state in coming years.
��The principal states of destination of Kerala’ out-migrants remained more or less unchanged over these years. Karnataka was number one in 2008; it is number one in 2011 also, with 29 per
Kerala State Planning Board
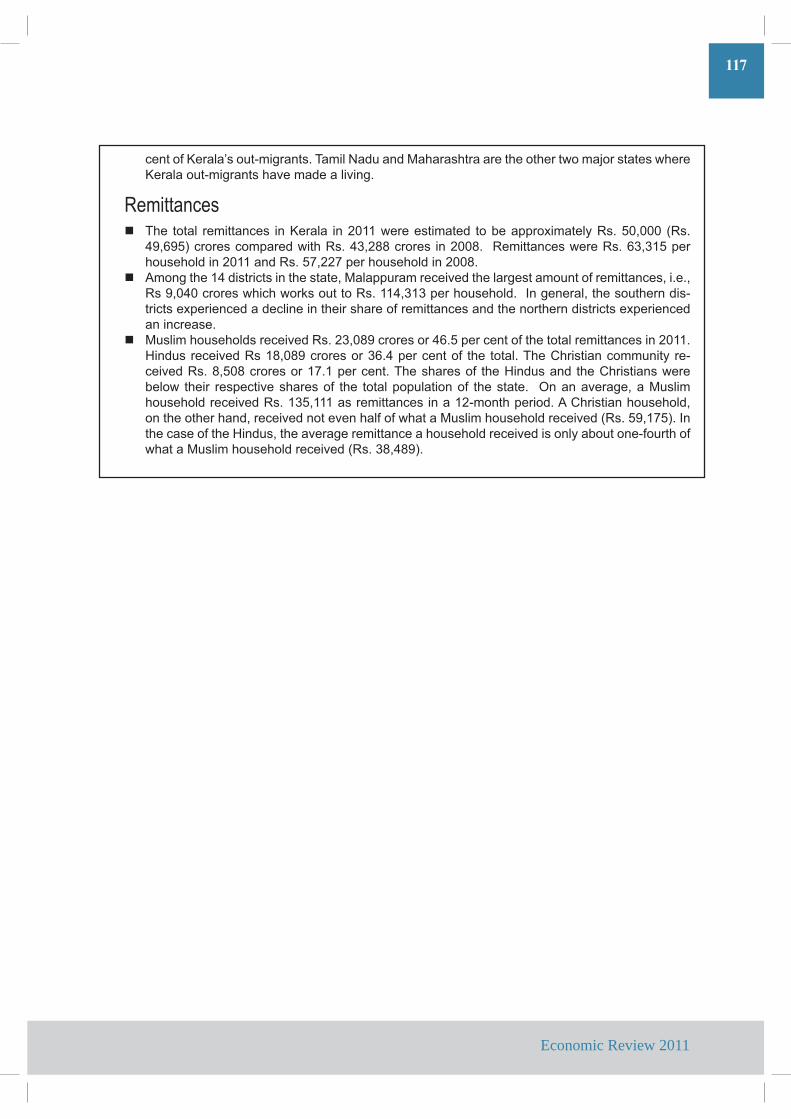
117
cent of Kerala’s out-migrants. Tamil Nadu and Maharashtra are the other two major states where Kerala out-migrants have made a living.
Remittances� The total remittances in Kerala in 2011 were estimated to be approximately Rs. 50,000 (Rs.
49,695) crores compared with Rs. 43,288 crores in 2008. Remittances were Rs. 63,315 per household in 2011 and Rs. 57,227 per household in 2008.
� Among the 14 districts in the state, Malappuram received the largest amount of remittances, i.e., Rs 9,040 crores which works out to Rs. 114,313 per household. In general, the southern dis-tricts experienced a decline in their share of remittances and the northern districts experienced an increase.
� Muslim households received Rs. 23,089 crores or 46.5 per cent of the total remittances in 2011. Hindus received Rs 18,089 crores or 36.4 per cent of the total. The Christian community re-ceived Rs. 8,508 crores or 17.1 per cent. The shares of the Hindus and the Christians were #���� ������ ��� ���������������� ���� ����� �������� ����������� ������������6���"������household received Rs. 135,111 as remittances in a 12-month period. A Christian household, on the other hand, received not even half of what a Muslim household received (Rs. 59,175). In the case of the Hindus, the average remittance a household received is only about one-fourth of what a Muslim household received (Rs. 38,489).
Economic Review 2011