avalon advanced materials inc. the east ... › _resources › 1811 east...900 – 390 bay street,...
TRANSCRIPT
900 – 390 BAY STREET, TORONTO ONTARIO, CANADA M5H 2Y2 Telephone +1 416 362 5135 Fax +1 416 362 5763
AVALON ADVANCED MATERIALS INC.
THE EAST KEMPTVILLE TIN PRODUCTION
AND SITE REMEDIATION PROJECT
PRELIMINARY ECONOMIC ASSESSMENT
NOVA SCOTIA, CANADA
Report Date: August 30, 2018
PEA Effective Date: July 24, 2018
Updated Mineral Resources Effective Date: May 7, 2018
Report By
Richard Gowans, P.Eng.
Christopher Jacobs, CEng., MIMMM
Dayan Anderson, M.S., MMSA
Jane Spooner, P.Geo.
William Mercer P. Geo.
Donald H. Hains, BSc, MBA, P. Geo.
Reid Smith, M.A.Sc. P.Geo.
Page
i
Table of Contents
1.0 SUMMARY ................................................................................................................... 1 1.1 EAST KEMPTVILLE PROPERTY ........................................................................... 1
1.2 HISTORY ................................................................................................................... 2 1.3 GEOLOGY AND MINERALIZATION .................................................................... 2 1.4 EXPLORATION ........................................................................................................ 3
1.4.1 Avalon 2014 Drilling Program ........................................................................... 3 1.4.2 Avalon 2015 Drilling Program ........................................................................... 3
1.5 SAMPLE PREPARATION, ANALYSES AND SECURITY ................................... 4 1.5.1 Avalon 2014 Drilling Program ........................................................................... 4
1.5.2 Avalon 2015 Drilling Program ........................................................................... 4
1.5.3 Low Grade Stockpile Surface Sampling Program .............................................. 5 1.6 DATA VERIFICATION ............................................................................................ 5 1.7 MINERAL PROCESSING AND METALLURGICAL TESTING .......................... 6 1.8 MINERAL RESOURCE ESTIMATES ..................................................................... 8
1.9 MINERAL RESERVE ESTIMATES ........................................................................ 9 1.10 MINING METHODS ................................................................................................. 9
1.11 RECOVERY METHODS......................................................................................... 10 1.12 PROJECT INFRASTRUCTURE ............................................................................. 11
1.12.1 Power, Fuel and Water ...................................................................................... 12
1.12.2 Buildings, Communication and Waste Handling .............................................. 12 1.12.3 Concentrate Storage and Shipping .................................................................... 12
1.13 MARKET STUDIES AND CONTRACTS .............................................................. 12 1.14 ENVIRONMENTAL STUDIES, PERMITTING AND SOCIAL OR
COMMUNITY IMPACT ......................................................................................... 13 1.15 CAPITAL AND OPERATING COSTS ................................................................... 14
1.15.1 Capital Cost Estimate ........................................................................................ 14 1.15.2 Operating Cost Estimate ................................................................................... 14
1.16 ECONOMIC ANALYSIS ........................................................................................ 15
1.16.1 Macro-Economic Assumptions ......................................................................... 15 1.17 RISKS AND OPPORTUNITIES.............................................................................. 16
1.17.1 Head Grade to Mill ........................................................................................... 16
1.17.2 Resources .......................................................................................................... 16 1.17.3 Tin Price ............................................................................................................ 17
1.17.4 Tin Recovery ..................................................................................................... 17 1.17.5 Mining ............................................................................................................... 17 1.17.6 Stockpile Grade ................................................................................................. 17 1.17.7 Operating Life ................................................................................................... 18 1.17.8 Purchasing Used/Refurbished Equipment ........................................................ 18
1.17.9 Revenue from By-products ............................................................................... 18 1.17.10 Foreign Exchange Rate ..................................................................................... 18 1.17.11 Environmental Liability .................................................................................... 18
1.18 CONCLUSIONS ...................................................................................................... 18 1.19 RECOMMENDATIONS .......................................................................................... 19

Page
ii
1.19.1 Recommendations for the Next Phase of Project Development ....................... 19 1.19.2 Budget ............................................................................................................... 21
2.0 INTRODUCTION....................................................................................................... 22 2.1 SCOPE OF THE REPORT ....................................................................................... 22
2.1.1 Mineral Resource Estimate ............................................................................... 22 2.1.2 Preliminary Economic Assessment................................................................... 23
2.2 QUALIFIED PERSONS AND SITE VISITS .......................................................... 24 2.2.1 Site Visits .......................................................................................................... 24
2.3 USE OF REPORT .................................................................................................... 24
2.4 UNITS ....................................................................................................................... 25 2.5 LIST OF ABBREVIATIONS ................................................................................... 25
3.0 RELIANCE ON OTHER EXPERTS........................................................................ 30
4.0 PROPERTY DESCRIPTION AND LOCATION ................................................... 31
4.1 PROPERTY TENURE ............................................................................................. 32 4.2 SURFACE RIGHTS AND ACCESS ....................................................................... 34 4.3 OTHER MINERAL CLAIMS .................................................................................. 35
4.4 OPERATING PERMITS .......................................................................................... 36
5.0 ACCESSIBILITY, CLIMATE, LOCAL RESOURCES, INFRASTRUCTURE
AND PHYSIOGRAPHY ............................................................................................ 37 5.1 ACCESSIBILITY ..................................................................................................... 37
5.2 CLIMATE ................................................................................................................. 37 5.3 LOCAL RESOURCES ............................................................................................. 39
5.4 INFRASTRUCTURE ............................................................................................... 40 5.5 PHYSIOGRAPHY .................................................................................................... 40 5.6 VEGETATION ......................................................................................................... 41
6.0 HISTORY .................................................................................................................... 43
7.0 GEOLOGICAL SETTING AND MINERALIZATION ......................................... 47 7.1 REGIONAL GEOLOGY .......................................................................................... 47
7.2 LOCAL AND PROPERTY GEOLOGY .................................................................. 49 7.3 MINERALIZATION ................................................................................................ 52
7.3.1 Modal Abundance and Grain Size .................................................................... 53
7.3.2 Cassiterite Liberation ........................................................................................ 54 7.3.3 Mineralogical Summary.................................................................................... 56
8.0 DEPOSIT TYPES ....................................................................................................... 58
9.0 EXPLORATION ......................................................................................................... 59
9.1 EXPLORATION POTENTIAL ............................................................................... 59
10.0 DRILLING .................................................................................................................. 61 10.1 2014 AVALON DRILLING PROGRAM ................................................................ 61
Page
iii
10.1.1 2014 Drill Program Results .............................................................................. 62 10.1.2 Drill Hole Summaries ....................................................................................... 64
10.2 CONCLUSIONS ...................................................................................................... 65 10.3 2015 AVALON DRILLING PROGRAM ................................................................ 65
10.3.1 2015 Drill Program Results .............................................................................. 67 10.3.2 Drill Hole Summaries ....................................................................................... 71
11.0 SAMPLE PREPARATION, ANALYSES AND SECURITY ................................. 77 11.1 SAMPLE PREPARATION ...................................................................................... 77
11.1.1 2014 Drill Program ........................................................................................... 77
11.1.2 2015 Drill Program ........................................................................................... 79 11.1.3 Low Grade Stockpile Surface Sampling Program ............................................ 80
11.2 SAMPLE ANALYSIS .............................................................................................. 81
11.2.1 ALS ................................................................................................................... 82 11.2.2 SGS Canada Assays .......................................................................................... 83 11.2.3 Actlabs Assays .................................................................................................. 84
11.3 LABORATORY CERTIFICATIONS ...................................................................... 85
11.4 SAMPLE SECURITY .............................................................................................. 86
12.0 DATA VERIFICATION ............................................................................................ 87
12.1 DATA VERIFICATION – HISTORICAL DATA AND 2014 DRILL PROGRAM87 12.2 QUALITY ASSURANCE/QUALITY CONTROL PROTOCOLS – 2014 DRILL
PROGRAM ............................................................................................................... 90
12.3 QUALITY ASSURANCE/QUALITY CONTROL ANALYSIS – 2014 DRILL
PROGRAM ............................................................................................................... 91 12.3.1 Quarter Core Duplicates ................................................................................... 91 12.3.2 Check Assays .................................................................................................... 94
12.3.3 Standards ......................................................................................................... 100 12.3.4 Blanks ............................................................................................................. 103
12.4 QA/QC SUMMARY – 2014 DRILL PROGRAM ................................................. 103 12.5 QUALITY ASSURANCE QUALITY CONTROL 2015 DRILL PROGRAM ..... 104
12.5.1 QA/QC Protocols ............................................................................................ 104
12.5.2 Core Duplicates ............................................................................................... 105 12.5.3 Check Assays .................................................................................................. 106 12.5.4 Standards ......................................................................................................... 107
12.6 QA/QC SUMMARY – 2015 DRILL PROGRAM ................................................. 112
12.7 HISTORIC SHELL AND RAL SAMPLING PROGRAMS ................................. 113
12.7.1 Atlantic Analytical Services Ltd. .................................................................... 114 12.7.2 X-Ray Assay Laboratories .............................................................................. 115 12.7.3 Bondar Clegg .................................................................................................. 116
12.8 UNDERGROUND BULK SAMPLING ................................................................ 117 12.9 SHELL AND RAL CHECK ASSAY PROGRAMS .............................................. 118
12.9.1 Pulp Check Assays (Shell) .............................................................................. 118 12.9.2 BQ Check Assays (RAL) ................................................................................ 118
12.10 VERIFICATION OF HISTORIC SAMPLING AND ASSAY DATA .................. 119
12.10.1 Pulp Check Assays .......................................................................................... 119

Page
iv
12.10.2 RAL BQ Check Assays .................................................................................. 120 12.10.3 RAL BQ Core Pulp Re-Sample ...................................................................... 121 12.10.4 RAL HQ Core Check Samples ....................................................................... 122 12.10.5 RAL HQ Core ¼-in Rejects ............................................................................ 123
12.11 CONCLUSIONS – SHELL AND RAL SAMPLING METHODS, SAMPLE
PREPARATION AND ASSAYS – HISTORIC EXPLORATION DRILLING.... 124 12.12 AVALON HISTORIC DRILL CORE RE-SAMPLING PROGRAM ................... 124
12.12.1 Sample Preparation and Analysis: 2007 and 2008 Re-Sample Program ........ 126 12.12.2 QA/QC Re-Sample Program ........................................................................... 127
12.12.3 Avalon Drill Core Re-Sampling Program Results .......................................... 127
13.0 MINERAL PROCESSING AND METALLURGICAL TESTING .................... 129
13.1 INTRODUCTION .................................................................................................. 129
13.2 SGS UK 2015 TESTWORK ................................................................................... 129 13.2.1 Metallurgical Samples .................................................................................... 129 13.2.2 Heavy Liquid Testing ..................................................................................... 130 13.2.3 Bond Rod and Ball Mill Grindability Testwork ............................................. 131
13.2.4 Test Results – Gravity Separation Using Mozley Concentrators ................... 132 13.2.5 Test Results – Gravity Separation Using Shaking Tables .............................. 133
13.2.6 Test Results – Tin Flotation ............................................................................ 135 13.2.7 Gravity Concentrate Cleaning Tests ............................................................... 136 13.2.8 Gravity Cleaner Concentrate Upgrading ........................................................ 137
13.2.9 Conclusions and Recommendations from the SGS UK Test Program ........... 140 13.3 MET-SOLVE LOW GRADE STOCKPILE TESTWORK .................................... 141
13.3.1 Metallurgical Sample ...................................................................................... 141 13.3.2 Phase I – Gravity Concentration ..................................................................... 142
13.3.3 Phase II – Gravity and Flotation Testwork ..................................................... 143 13.3.4 Phase III – Locked Cycle Tests ...................................................................... 143
13.3.5 Concentrate Upgrading by Flotation to Remove Base Metal Sulphides ........ 145 13.3.6 Sulphide Removal from Gravity Tailings ....................................................... 146
13.4 CONCLUSIONS .................................................................................................... 147
14.0 MINERAL RESOURCE ESTIMATES .................................................................. 148 14.1 MINERAL RESOURCE DATABASE .................................................................. 149 14.2 DATABASE VALIDATION ................................................................................. 152
14.3 GEOLOGICAL INTERPRETATION .................................................................... 152
14.4 TOPOGRAPHY ...................................................................................................... 153
14.5 SUBDIVISION OF ZONES IN THE DEPOSIT ................................................... 155 14.6 ROCK DENSITY ................................................................................................... 157 14.7 TIN ASSAY STATISTICS .................................................................................... 159 14.8 CAPPING ............................................................................................................... 161 14.9 COMPOSITES ........................................................................................................ 162
14.10 TIN GRADE VARIOGRAPHY ............................................................................. 163 14.11 BLOCK MODEL AND GRADE ESTIMATION .................................................. 167
14.11.1 Block Model Dimensions ............................................................................... 167
14.11.2 Block Model Parameters ................................................................................. 169

Page
v
14.12 TIN GRADE ESTIMATION METHODOLOGY ................................................. 169 14.13 RESOURCE CLASSIFICATION .......................................................................... 171 14.14 BLOCK MODEL VALIDATION .......................................................................... 171
14.14.1 Validation of the Volume Assignment ........................................................... 171
14.14.2 Validation in Cross-Sections and Level Plans ................................................ 171 14.14.3 Comparison to the Composite Data ................................................................ 178 14.14.4 Comparison between Kriging and GEMS “Assign Grade from Drill Holes”
Function .......................................................................................................... 179 14.14.5 Comparison Between Kriging and Inverse Distance Weighting Tin Grade
Interpolation ................................................................................................... 179 14.14.6 Comparison of the Interpolated Grade to the Mined Material ........................ 180 14.14.7 Grade-Tonnage Curves and Cut-Off Grade .................................................... 181
14.15 MINERAL RESOURCES BY ZONE .................................................................... 184 14.16 COMPARISON WITH HISTORIC RESOURCE ESTIMATES .......................... 186 14.17 ADDITIONAL MINERAL RESOURCES ............................................................ 188
14.17.1 Reporting Standards for Stockpiles ................................................................ 188
14.17.2 East Kemptville Waste Piles and Stockpiles .................................................. 188 14.17.3 Grade and Tonnage Verification ..................................................................... 189
14.17.4 Low Grade Stockpile Mineral Resources ....................................................... 190
15.0 MINERAL RESERVES ESTIMATES ................................................................... 192
16.0 MINING METHODS ............................................................................................... 193
16.1 INTRODUCTION .................................................................................................. 193
16.2 PIT OPTIMIZATION ............................................................................................. 193 16.3 PIT DESIGN ........................................................................................................... 194
16.3.1 Parameters ....................................................................................................... 194
16.3.2 Life-of-Mine Design ....................................................................................... 196 16.4 PIT EXTRACTION AND BACKFILL SEQUENCE ............................................ 196
16.5 PRE-PRODUCTION SCHEDULE ........................................................................ 200 16.6 MINE PRODUCTION SCHEDULE...................................................................... 201 16.7 MINE INFRASTRUCTURE .................................................................................. 202
17.0 RECOVERY METHODS ........................................................................................ 204 17.1 INTRODUCTION .................................................................................................. 204 17.2 PROCESS FLOWSHEET DEVELOPMENT ........................................................ 204
17.3 PROCESS DESIGN BASIS ................................................................................... 204 17.4 PROCESS DESCRIPTION .................................................................................... 205
17.4.1 Overview ......................................................................................................... 205 17.4.2 Crushing Circuit .............................................................................................. 206 17.4.3 Milling and Classification Circuit ................................................................... 206 17.4.4 Gravity Circuit ................................................................................................ 207 17.4.5 Sulphide Removal Circuit ............................................................................... 207
17.4.6 Tin Shaking Tables Circuit ............................................................................. 207 17.4.7 Bulk Sulphide Flotation .................................................................................. 207 17.4.8 Tailings and Sulphide Concentrates Storage .................................................. 208
Page
vi
17.4.9 Flotation Reagents .......................................................................................... 208 17.5 METALLURGICAL ACCOUNTING ................................................................... 209 17.6 PLANT SERVICES ................................................................................................ 209
17.6.1 Compressed Air .............................................................................................. 209
17.6.2 Raw Water ...................................................................................................... 209 17.6.3 Process Water.................................................................................................. 209
18.0 PROJECT INFRASTRUCTURE............................................................................ 218 18.1 ACCESS ................................................................................................................. 218 18.2 SITE FACILITIES .................................................................................................. 219
18.2.1 Power, Fuel and Water .................................................................................... 219 18.2.2 Buildings, Communication and Waste Handling ............................................ 219
18.3 CONCENTRATE STORAGE AND SHIPPING ................................................... 220
19.0 MARKET STUDIES AND CONTRACT ............................................................... 221
19.1 TIN HISTORIC PRICES ........................................................................................ 221 19.2 TIN CONTRACT TERMS ..................................................................................... 223 19.3 ZINC/INDIUM AND COPPER CONCENTRATES ............................................. 224
19.4 CONTRACTS ......................................................................................................... 224
20.0 ENVIRONMENTAL STUDIES, PERMITTING AND SOCIAL OR
COMMUNITY IMPACT ......................................................................................... 225 20.1 ENVIRONMENT AND SOCIOECONOMIC CONDITIONS .............................. 226
20.1.1 Environmental Setting .................................................................................... 226
20.1.2 Socio-economic Setting .................................................................................. 227
20.1.3 Indigenous Communities ................................................................................ 228 20.2 ENVIRONMENTAL REGULATORY REQUIREMENTS .................................. 228
20.2.1 Provincial ........................................................................................................ 228
20.2.2 Federal............................................................................................................. 229 20.3 WATER MANAGEMENT .................................................................................... 230
20.4 MINE CLOSURE, WASTE MANAGEMENT AND PROGRESSIVE
REHABILITATION ............................................................................................... 233 20.4.1 Progressive Rehabilitation .............................................................................. 236
21.0 CAPITAL AND OPERATING COSTS ................................................................. 239 21.1 CAPITAL COSTS .................................................................................................. 239
21.1.1 Concentrator Direct Capital Costs .................................................................. 240 21.1.2 Concentrator Indirect Capital Costs ................................................................ 242 21.1.3 Bulk Sulphide Flotation Circuit ...................................................................... 242
21.1.4 Tailings ........................................................................................................... 242 21.1.5 Infrastructure ................................................................................................... 242 21.1.6 Owners Costs .................................................................................................. 243 21.1.7 Contingency .................................................................................................... 243
21.2 OPERATING COSTS ............................................................................................ 244 21.2.1 Stockpile Reclaim and Mining........................................................................ 246 21.2.2 Concentrator .................................................................................................... 246

Page
vii
22.0 ECONOMIC ANALYSIS ........................................................................................ 249 22.1 MACRO-ECONOMIC ASSUMPTIONS .............................................................. 249
22.1.1 Exchange Rate, Inflation and Discount Rate .................................................. 249 22.1.2 Expected Metal Prices..................................................................................... 249
22.1.3 Taxation Regime ............................................................................................. 249 22.1.4 Royalty ............................................................................................................ 250 22.1.5 Selling Expenses ............................................................................................. 250
22.2 TECHNICAL ASSUMPTIONS ............................................................................. 250 22.2.1 Plant Feed and Tin Concentrate/Metal Production Schedule ......................... 250
22.3 COSTS .................................................................................................................... 251 22.3.1 Operating Costs ............................................................................................... 251 22.3.2 Capital Costs ................................................................................................... 251
22.3.3 Base Case Cash Flow ...................................................................................... 251 22.4 SENSITIVITY STUDY .......................................................................................... 253
22.4.1 Capital, Operating Costs, Tin Price and Recovery Sensitivity ....................... 253 22.5 CONCLUSION ....................................................................................................... 255
23.0 ADJACENT PROPERTIES .................................................................................... 256
24.0 OTHER RELEVANT DATA AND INFORMATION .......................................... 257
25.0 INTERPRETATION AND CONCLUSIONS ........................................................ 258 25.1 INTERPRETATION .............................................................................................. 258 25.2 RISKS AND OPPORTUNITIES............................................................................ 258
25.3 CONCLUSIONS .................................................................................................... 261
26.0 RECOMMENDATIONS .......................................................................................... 263 26.1 OVERVIEW ........................................................................................................... 263 26.2 RECOMMENDATIONS FOR THE NEXT PHASE OF PROJECT
DEVELOPMENT ................................................................................................... 263 26.2.1 Resources ........................................................................................................ 263 26.2.2 Mining ............................................................................................................. 263
26.2.3 Processing Plant .............................................................................................. 264 26.2.4 Project Implementation ................................................................................... 264
26.3 BUDGET ................................................................................................................ 264
27.0 DATE AND SIGNATURE PAGE ........................................................................... 266
28.0 REFERENCES .......................................................................................................... 267
29.0 CERTIFICATES....................................................................................................... 270
Page
viii
List of Tables
Table 1.1 Updated Mineral Resource Estimate for the Main and Baby Zones ..................8
Table 1.2 Low Grade Stockpile Estimated Inferred Mineral Resource .............................9
Table 1.3 Pit Optimization Criteria East Kemptville Tin Project ....................................10
Table 1.4 Initial Capital Cost Estimate ............................................................................14
Table 1.5 Summary of Operating Costs ...........................................................................15
Table 1.6 Final Tin Concentrate Analysis ........................................................................19
Table 1.7 Budget for the Next Phase of Project Development ........................................21
Table 2.1 List of Abbreviations........................................................................................25
Table 4.1 East Kemptville Tin-Indium Project – Claims within Special Licence
50462................................................................................................................33
Table 4.2 Avalon Exploration Licences Adjacent to East Kemptville (as of
August, 2018) ...................................................................................................35
Table 6.1 Historic Preproduction Geological and Mineable Ore Reserves (1983) ..........44
Table 6.2 Historic Mine Production (Dry Tonnes) ..........................................................45
Table 7.1 Modal Abundance of Minerals (Percentage by volume) .................................53
Table 7.2 Cassiterite Grain Size Percent Distribution – Main and Baby Zones ..............54
Table 10.1 Details of Drill Holes – 2014 Drill Program ....................................................61
Table 10.2 Summary Drill Hole Intercepts, 2014 Drill Program .......................................63
Table 10.3 Drill Hole Details .............................................................................................66
Table 10.4 Drill Intercepts Baby Zone – 2015 Drilling .....................................................69
Table 10.5 Drill Intercepts Main Zone West – 2015 Drilling ............................................69
Table 10.6 Drill Intercepts Main Zone East – 2015 Drilling .............................................70
Table 10.7 Drill Intercepts Duck Pond Zone – 2015 Drilling ............................................71
Table 10.8 Abbreviations Used in Drill Hole Summaries .................................................72
Table 10.9 Summary of Initial 10 Holes Drilled in the Baby Zone ...................................72
Table 10.10 Summary of Drill Holes at the Duck Pond Zone .............................................74
Table 10.11 Summary of 7 Holes Drilled on the Main Zone ...............................................75
Table 11.1 Summary of Samples for 2014 Drill Program .................................................78
Table 11.2 Total Sample Count .........................................................................................80
Table 11.3 Standard Insertion Statistics .............................................................................80
Page
ix
Table 11.4 Comparison of Avalon (2015) and RAL (1993) Estimated Grades for
the Low-Grade Stockpile .................................................................................81
Table 11.5 Limits of Detection for Method ME-MS81 .....................................................82
Table 11.6 Limits of Detection for Method ME-4ACD81 ................................................83
Table 11.7 Limits of Detection SGS Method GE-ICM90A ..............................................84
Table 12.1 Due Diligence Check Samples, Stellarton Historic Drill Core Storage
Library..............................................................................................................88
Table 12.2 Due Diligence Sample Assay Results ..............................................................89
Table 12.3 QA/QC Protocols – 2014 Drill Program ..........................................................90
Table 12.4 Statistical Analysis – Avalon Produced Blanks and Standards –
2007/8 Re-Sample Program .............................................................................91
Table 12.5 Quarter Core Duplicate Assay Results – 2014 Drill Program .........................92
Table 12.6 Inserted Standards Counts ..............................................................................104
Table 12.7 Duplicate Sample Analyses Counts ...............................................................105
Table 12.8 Core Duplicate Analyses for Tin....................................................................105
Table 12.9 Comparison of Actlabs (Sn1) and ALS (Sn2) on Pulp Duplicates ................107
Table 12.10 Standard Analyses for Tin from 2015 Drill Program Compared to
Certified Values for Standards .......................................................................108
Table 12.11 Standard Analyses for Zinc from 2015 Drill Program Compared to
Certified Values for Standards .......................................................................112
Table 12.12 Summary of Shell and RAL Drill Core Sampling, Sample Preparation
and Analytical Techniques .............................................................................114
Table 12.13 Statistical Summary of Round Robin Data – Shell Bulk Sampling
Program ..........................................................................................................118
Table 12.14 Avalon Drill Core Re-Sample Program Summary.........................................124
Table 12.15 Summary Results – Comparison of RAL Assays with Avalon Re-
Sample Assays ...............................................................................................127
Table 13.1 List of Testwork Relevant to Stockpile Flowsheet Development ..................129
Table 13.2 SGS UK Metallurgical Composite Head Assay Results ................................130
Table 13.3 Grinding Test Results .....................................................................................131
Table 13.4 200-Micron Grind Flotation Tailings Gravity Separation Results .................132
Table 13.5 50-micron Grind – Gravity Separation Results ..............................................132
Table 13.6 200 Micron Primary Gravity Separation Shaking Table Test Results ...........134
Table 13.7 100 Micron Scavenger Gravity Test Results After Regrinding 200
Micron Rougher Test Tailings .......................................................................134

Page
x
Table 13.8 50 Micron Secondary Scavenger Gravity Testwork Results After
Regrinding 100 Micron Scavenger Test Tailings ..........................................134
Table 13.9 Tin Flotation Conditions ................................................................................135
Table 13.10 50 Micron Gravity Separation Tailings Tin Flotation Results .......................136
Table 13.11 50 Micron Tin Flotation Without Gravity Separation....................................136
Table 13.12 200 Micron Grind Cleaner Gravity Separation Results .................................136
Table 13.13 100 Micron Grind Cleaner Gravity Separation Results .................................136
Table 13.14 50 Micron Grind Cleaner Gravity Separation Results ...................................137
Table 13.15 Tin Dressing Results ......................................................................................139
Table 13.16 Final Tin Concentrate Analysis ......................................................................141
Table 13.17 Tin Head Assay of Various Met-Solve Testwork Samples ...........................142
Table 13.18 Locked Cycle Test 2 Results ..........................................................................145
Table 13.19 Summary of Results from Met-Solve Gravity Tailings Sulphide
Removal Test .................................................................................................147
Table 13.20 Basic Process Design Criteria from Metallurgical Testwork .........................147
Table 14.1 Updated Mineral Resource Estimate for the Main and Baby Zones ..............148
Table 14.2 Low Grade Stockpile Estimated Inferred Mineral Resource .........................149
Table 14.3 Assay Statistics – East Kemptville Project Database .....................................151
Table 14.4 Density Measurement Statistics .....................................................................158
Table 14.5 Statistics for Tin Assays in the Entire Database and in the Subset of
Intervals within the Granite Geology Solid ...................................................159
Table 14.6 Evaluation of the Effect of Capping on the Sn assay Statistics .....................161
Table 14.7 Evaluation of the Effect of Compositing on the Sn Assay Statistics .............162
Table 14.8 Main Zone and Baby Zone Block Model Dimensions...................................168
Table 14.9 Block Model Parameters ................................................................................169
Table 14.10 Interpolation Parameters for the Main Zone ..................................................170
Table 14.11 Interpolation Parameters for the Baby Zone ..................................................170
Table 14.12 Comparison Between the Mean Block Model and Composites Tin
Grades ............................................................................................................178
Table 14.13 Comparison Between the Tin Grades (in wt. % Sn) of the Block
Model and Those Assigned to the 3D Outline of All Resource
Categories ......................................................................................................179
Table 14.14 Comparison Between the Tin Grades Interpolated Using IDW2 and
OK in the Main Zone at Variable Cut-Off Grades ........................................179

Page
xi
Table 14.15 Comparison Between the Tin Grades Interpolated Using IDW2 and
OK in the Baby Zone at Variable Cut-Off Grades ........................................180
Table 14.16 East Kemptville Mineral Resource Estimate, Main and Baby Zones,
Based on Percentage Tin Cut-off Grade and Constrained by a
Preliminary Pit Design, as at 7 May, 2018 ....................................................184
Table 14.17 Historical Mineral Resource Estimate of Wardrop (2010) for the Main
and Baby Zones..............................................................................................187
Table 14.18 Resource Estimate of Avalon (2014) for the Main and Baby Zones
Combined. ......................................................................................................188
Table 14.19 Low Grade Stockpiles and Waste Piles Characteristics, Rio Algom
(1993) .............................................................................................................189
Table 14.20 Volume and Tonnage Estimates, Low Grade Stockpile ................................190
Table 14.21 Low Grade Stockpile Estimated Inferred Mineral Resource .........................190
Table 16.1 Pit Optimization Criteria East Kemptville Tin Project ..................................193
Table 16.2 Conceptual Pit Design Parameters .................................................................195
Table 16.3 Available Storage Capacity for Waste Rock and Tailings .............................200
Table 16.4 Production Schedule.......................................................................................203
Table 19.1 East Kemptville Tin Project Historic Tin Concentrate Assay .......................223
Table 21.1 Initial Capital Cost Estimate ..........................................................................239
Table 21.2 Detailed Breakdown of Initial Capital Cost Requirements ............................241
Table 21.3 Breakdown of Owners Costs Provision .........................................................243
Table 21.4 Summary of Operating Costs .........................................................................244
Table 21.5 Detailed Breakdown of Estimated Annual Operating Costs ..........................245
Table 21.6 Breakdown of Operating Labour & Costs .....................................................247
Table 22.1 Life of Mine Annual Cash Flow ....................................................................252
Table 25.1 Final Tin Concentrate Analysis ......................................................................262
Table 26.1 Budget for the Next Phase of Project Development ......................................265
Page
xii
List of Figures
Figure 1.1 Simplified Flowsheet .......................................................................................11
Figure 1.2 Annual Cash Flow ............................................................................................16
Figure 4.1 Property Location Map ....................................................................................31
Figure 4.2 Site Facilities Map ...........................................................................................32
Figure 4.3 East Kemptville Property Claim Map ..............................................................33
Figure 5.1 Monthly Average Precipitation ........................................................................38
Figure 5.2 Daily Average High and Low Temperatures for Yarmouth Airport................38
Figure 5.3 Average Daily Wind Speed with Percentile Bands for Yarmouth
Airport ..............................................................................................................39
Figure 5.4 Land Classification in the Project Area ...........................................................42
Figure 7.1 Simplified Geological Map of Southwestern Nova Scotia ..............................47
Figure 7.2 Local Geology, East Kemptville Area .............................................................50
Figure 7.3 Geological Plan of East Kemptville Deposit at 94-m Elevation ......................51
Figure 7.4 Geological Plan of the East Kemptville Deposit Showing Subzones ..............52
Figure 7.5 Grain Size Distribution of Cassiterite – Main and Baby Zones .......................54
Figure 7.6 2008 Cassiterite Liberation (PMA Analysis) Main and Baby Zones ..............55
Figure 7.7 2009 Cassiterite Liberation (PMA Analysis) Main and Baby Zones ..............55
Figure 10.1 Drill Plan, Summer 2014 .................................................................................62
Figure 10.2 2015 Drill Plan .................................................................................................67
Figure 12.1 Quarter Core Duplicate Assays – 2014 Drill Program.....................................92
Figure 12.2 Check Assay Results, ALS vs SGS Lakefield .................................................95
Figure 12.3 Check Assay Results, ALS vs Actlabs .............................................................97
Figure 12.4 Check Assay Results, SGS Lakefield vs Actlabs.............................................99
Figure 12.5 Standards Assay Results – ALS .....................................................................101
Figure 12.6 Scatterplot of 1st and 2nd Halves of Drill Core Analyses for Duplicate
Core Samples (ICP for Sn) ............................................................................106
Figure 12.7 Scatterplot of 1st and 2nd Halves of Drill Core Analyses for Duplicate
Core Samples (XRF for Sn) ...........................................................................106
Figure 12.8 Regression Plot of Pulp Duplicates from Actlabs (Original Sn ppm)
and ALS (Check Assay Sn ppm) ...................................................................107
Figure 12.9 Run Chart for Tin Analysis of Standard EK-LG1 (ICP and XRF) ................109
Figure 12.10 Run Chart for Tin Analysis of Standard EK-AG1 (ICP and XRF)................110
Page
xiii
Figure 12.11 Run Chart for Tin Analysis of Standard EK-HG1 (ICP and XRF)................111
Figure 12.12 Run Chart for Tin Analysis of Standard EK-VG1 (XRF)..............................112
Figure 12.13 Bulk Sample Processing Scheme – Shell .......................................................117
Figure 12.14 Pulp Check Assays, Shell Minerals Analyses ................................................119
Figure 12.15 RAL BQ Core Check Analyses......................................................................121
Figure 12.16 BQ Core Pulp Re-sampling, Rio Algom ........................................................121
Figure 12.17 RAL HQ Core Check Samples ......................................................................122
Figure 12.18 RAL HQ Core ¼-in Reject Check Samples ...................................................123
Figure 12.19 Drill Core Re-Sample Program 2007 .............................................................125
Figure 12.20 Drill Core Re-Sample Program 2008 .............................................................126
Figure 13.1 Tin Mass Pull Recovery .................................................................................130
Figure 13.2 Heavy Liquids – Tin Loss to Floats ...............................................................131
Figure 13.3 Picture of a 200 Micron Gravity Separation Test ..........................................133
Figure 13.4 Final Concentrate Tin Release Curve ............................................................138
Figure 13.5 Falcon Rougher Gravity Recoveries at Various Grind Sizes .........................142
Figure 13.6 Open Circuit Gravity-Flotation Flowsheet ....................................................143
Figure 13.7 Phase III LCT Testwork Flowsheet ...............................................................144
Figure 13.8 Met-Solve Gravity Tailings Sulphide Removal Flowsheet ...........................146
Figure 14.1 Plan Showing Post-Mining (1992) Topography with the Traces of the
Holes Drilled by Avalon Between 2014 and 2015 Projected to the
Surface. ..........................................................................................................150
Figure 14.2 Plan Showing the 1992 Topographic Model and the Traces of All
Drill Holes in the Database ............................................................................151
Figure 14.3 Three-Dimensional View Showing the 3D Wireframes for the Granite
(Pink) and the Metasediment (Brown) – Both Pre-Mining and the
Drill Hole Traces............................................................................................153
Figure 14.4 1983 Digital Topographic Model with Resource Model Boundaries ............154
Figure 14.5 1992 Digital Topographic Model with Resource Model Boundaries ............155
Figure 14.6 Post-Mining Topography (1992) with the Two Open Pits, Both
Currently Flooded ..........................................................................................156
Figure 14.7 The Pre-Mining Granite 3D Wireframe and the Drill Hole Traces
Projected to the Surface .................................................................................156
Figure 14.8 Histograms for the Density of the Granite in the Main and Baby
Zones ..............................................................................................................158
Page
xiv
Figure 14.9 Combined Histogram for the Density of the Metasediment in the Main
and Baby Zones..............................................................................................159
Figure 14.10 Combined Histogram for the Tin Assay Data Limited to a Maximum
of 3 wt. % Sn ..................................................................................................160
Figure 14.11 Cumulative Probability Plot for the Sn Assays ..............................................160
Figure 14.12 Histogram for the Sn Assays in the Granite Geology 3D Solid after
Capping at 1 wt.% Sn.....................................................................................161
Figure 14.13 Plan Map Showing the Composites, Drill Hole Traces and the Surface
Projection of the Granite ................................................................................162
Figure 14.14 Linear Downhole Semi-Variogram for the Tin Composites (Main
Zone) ..............................................................................................................163
Figure 14.15 Empirical and Modeled Variograms for Sn Composites in the Granite
of the Main Zone ............................................................................................164
Figure 14.16 Linear Downhole Semi-Variogram for the Tin Composites in the
Baby Zone ......................................................................................................165
Figure 14.17 Empirical and Modeled Variograms for Sn Composites in the Granite
of the Baby Zone ............................................................................................166
Figure 14.18 Plan of the two Main and Baby Zones Block Models ...................................168
Figure 14.19 Main Zone, Level 6 Plan View Showing Wt.% Sn of In-situ Blocks
and Drill Hole Composites.............................................................................172
Figure 14.20 Main Zone, Level 8 Plan View Showing Wt.% Sn of In-situ Blocks
and Drill Hole Composites.............................................................................172
Figure 14.21 Main Zone, Level 10 Plan View Showing Wt.% Sn of In-situ Blocks
and Drill Hole Composites.............................................................................173
Figure 14.22 Main Zone, Column 67 Section Showing Wt.% Sn of In-situ Blocks
and Drill Hole Composites.............................................................................173
Figure 14.23 Main Zone, Column 74 Section Showing Wt.% Sn of In-situ Blocks
and Drill Hole Composites.............................................................................174
Figure 14.24 Main Zone, Column 92 Section Showing Wt.% Sn of In-situ Blocks
and Drill Hole Composites.............................................................................174
Figure 14.25 Main Zone, Row 43 Section Showing Wt.% Sn of In-situ Blocks and
Drill Hole Composites ...................................................................................175
Figure 14.26 Main Zone, Row 47 Section Showing Wt.% Sn of In-situ Blocks and
Drill Hole Composites ...................................................................................175
Figure 14.27 Main Zone Row 53 Section Showing Wt.% Sn of In-situ Blocks and
Drill Hole Composites ...................................................................................176

Page
xv
Figure 14.28 Baby Zone, Level 10 Plan Showing Wt.% Sn of In-situ Blocks and
Drill Hole Composites ...................................................................................176
Figure 14.29 Baby Zone, Level 18 Plan Showing Wt.% Sn of In-situ Blocks and
Drill Hole Composites ...................................................................................177
Figure 14.30 Baby Zone, Row 59 Section Showing Wt.% Sn of In-situ Blocks and
Drill Hole Composites ...................................................................................177
Figure 14.31 Baby Zone, Row 62 Section Showing Wt.% Sn of In-situ Blocks and
Drill Hole Composites ...................................................................................178
Figure 14.32 Grade-Tonnage Curve for the Interpolation of Mined Blocks in the
Main Zone ......................................................................................................181
Figure 14.33 Grade-Tonnage Curve for Blocks in All Resource Categories in the
Main Zone ......................................................................................................182
Figure 14.34 Grade-Tonnage Curve for Blocks in Measured and Indicated
Categories in the Main Zone ..........................................................................182
Figure 14.35 Grade-Tonnage Curve for Blocks in All Resource Categories in the
Baby Zone ......................................................................................................183
Figure 14.36 Grade-Tonnage Curve for Blocks in Measured and Indicated
Categories in the Baby Zone ..........................................................................183
Figure 14.37 Overview of the Main Zone Block Model at a Cut-off Grade of 0.10
wt. % Sn in 3D ...............................................................................................185
Figure 14.38 Overview of the Baby Zone Block Model at a Cut-off Grade of 0.10
wt. % Sn in 3D ...............................................................................................186
Figure 16.1 Pit Slope Inter-Ramp Design Angles .............................................................195
Figure 16.2 Ultimate Pit Design (Based on Revenue Factor 0.70 Pit) ..............................196
Figure 16.3 Years 2 through 6 – Baby and Main Pit South Waste Rock Shipped to
Waste Zone A ................................................................................................197
Figure 16.4 Years 7 through 10 – Main Pit West Waste Rock Shipped to Waste
Zone A, B, and Lift 70 of Zone C ..................................................................197
Figure 16.5 Years 11 through 14 – Main Pit North Waste Production to Waste
Zone C and D .................................................................................................198
Figure 16.6 Tailings Backfill Elevations – Years 4(Q4) through 12(Q3) .........................198
Figure 16.7 Tailings Backfill Elevation – Years 12(Q4) through 13 ................................199
Figure 16.8 Tailings Backfill Elevation – Years 14 through 17(Q3) ................................199
Figure 16.9 Final Backfill Elevation for Tailings and Other Legacy Waste Piles ............200
Figure 17.1 Simplified Flowsheet .....................................................................................206
Figure 17.2 Flowsheet and Mass Balance for the Crushing Circuit ..................................211

Page
xvi
Figure 17.3 Flowsheet showing Milling, HSCC Concentrator and Sulphide
Removal Circuits ...........................................................................................212
Figure 17.4 Flowsheets Showing Shaking Table and Tin Concentrate Dewatering
Circuits ...........................................................................................................213
Figure 17.5 Flowsheets Showing Bulk Sulphide Flotation Circuits .................................214
Figure 17.6 Flowsheets Showing Tailings Area ................................................................215
Figure 17.7 Flowsheets Showing Reagents Area ..............................................................216
Figure 17.8 Flowsheets Showing Clean and Process Water .............................................217
Figure 18.1 Mine Location Map ........................................................................................218
Figure 18.2 Aerial View of Ship-loading Facilities at Shelburne .....................................220
Figure 19.1 LME Average Annual Tin Prices ...................................................................222
Figure 19.2 Tin Stocks ......................................................................................................222
Figure 22.1 Annual Plant Feed Production Schedule ........................................................250
Figure 22.2 Annual Tin Production Schedule ...................................................................251
Figure 22.3 Annual Cash Flow ..........................................................................................253
Figure 22.4 NPV Sensitivity Diagram ...............................................................................254
Figure 22.5 IRR Sensitivity Diagram ................................................................................254

OVERVIEW OF THE EAST KEMPTVILLE PROJECT
Micon International Limited (Micon) has been retained by Avalon Advanced Materials Inc.
(Avalon) to prepare a Technical Report under Canadian National Instrument (NI) 43-101
which discloses the results of the preliminary economic assessment (PEA) for the East
Kemptville Tin Project (East Kemptville Project), Yarmouth Co., Nova Scotia.
Avalon intends to recommence operations at the East Kemptville tin mine in Nova Scotia,
Canada and in so doing will concurrently rehabilitate the mine site by remediating the
existing environmental liability.
The re-development model, as presented in this PEA, is essentially an environmental
remediation project that will be financed through the sale of conflict-free tin concentrates
recovered in large part from previously-mined mineralized material on the site. From Day 1
of operations, it is Avalon’s intent to continually reduce the long-term environmental liability
and eventually result in the full rehabilitation of this brownfields site.
The PEA mine plan as developed by Micon is based on the updated mineral resource
estimate disclosed in the Company’s new release dated June 28, 2018. The redevelopment
model primarily involves processing of the 5.87 million tonne (Mt) stockpile of previously-
mined oxidized low-grade mineralization, supplemented by the selective mining of 9.2 Mt of
near-surface fresh higher-grade tin mineralization from the Main and Baby Zone deposits.
The development model utilized by the PEA contemplates a production schedule averaging
1,300 tonnes per annum of a 55% tin concentrate for 19 years, with tin concentrates being
sold and shipped for treatment in international markets. The PEA concludes that the small-
scale re-development model is economically viable at current tin prices in the range of
USD20,000 to USD22,000/t. Assuming an average go-forward tin price of USD21,038/tonne
(as forecast by the World Bank Commodity Price outlook for 2020), and an exchange rate of
CAD1.30/USD, the Project has an indicated pre-tax IRR of 15.0% and an NPV of CAD17.9
million at an 8% discount rate. This is after taking into account all costs associated with the
proposed environmental rehabilitation process. The initial capital cost is estimated at
CAD31.5 million and average annual revenues from sales are calculated as CAD17.75
million vs. annual production costs of CAD11.6 million.
The rehabilitation plan involves both the removal of acid generating surface stockpiles
together with the concurrent sealing of the existing tailings storage facility (TMF) to prevent
further acid generation. The freshly mined tin mineralization from the Main and Baby Zones
will serve an important purpose in the site rehabilitation concept by allowing for the
generation of clean tailings (by froth flotation) free of sulphide minerals. These clean tailings
will be used to create the cover for the existing TMF which once rehabilitated can then be
returned to beneficial use. The zinc/indium/copper/iron sulphide mineralization removed by
the flotation will be appropriately disposed of underwater within one of the mined-out pits
although recent rises in prices for some of these metals could result in the material becoming
a source of additional revenue once up-graded.

Micon understands that Avalon anticipates that through the utilization of an existing TMF
and site infrastructure as well as the focus on environmental remediation, the permitting and
approvals process for the project will be much shorter than for a new, greenfield mine
development. There is strong community support for the Project, as well as from local
politicians, First Nations and environmental NGOs. Avalon is also in discussions with a
number of local businesses towards collaboration on future opportunities during project
development, throughout the operating life and for utilization of the site once rehabilitated.
While the results of the PEA indicate economic potential, there are a number of opportunities
that Avalon is pursuing that could further improve Project economics. One of the most
promising of these is the potential to upgrade the feed material to the processing plant
through ore-sorting. Results from an initial evaluation were very encouraging and the results
from a second evaluation are currently awaited. If these results reflect those of the earlier
work, then further testwork or a piloting program is being considered.
Successful application of the ore-sorting process technology offers a number of benefits to
the Project model. By rejecting non-mineralized waste rock ahead of the mill, the capacity of
the processing plant can be reduced and both capital and operating costs lowered. It may also
open the door for economic recovery of tin from other mineralized materials close-by that are
presently considered too low in grade to justify processing. Alternatively, ore-sorting could
provide the means to significantly increase annual tin production from the same sized
processing facility over a shorter operating life.
It is Micon’s understanding that prior to completing this PEA, the East Kemptville Project
already attracted strong interest from a number of potential partners as well as others
interested in securing off-take of the tin concentrates (which are in short supply from non-
conflict sources). Avalon has already signed an indicative off-take agreement in the form of a
non-binding Memorandum of Understanding (MOU) with a well-known, large tin smelting
company for all of the forecast East Kemptville tin production.
1
1.0 SUMMARY
Micon International Limited (Micon) has been retained by Avalon Advanced Materials Inc.
(Avalon) to prepare a Technical Report under Canadian National Instrument (NI) 43-101
which discloses the results of the preliminary economic assessment (PEA) for the East
Kemptville Tin Project (East Kemptville Project), Yarmouth Co., Nova Scotia.
This PEA has been prepared by Micon under the terms of its agreement with Avalon. As
discussed in the relevant sections of the report, Micon has prepared a mine plan and
schedule, has reviewed the metallurgical testwork carried out on the property, the mineral
processing flowsheet, has reviewed infrastructure requirements, prepared capital and
operating cost estimates and an economic analysis of the project.
The PEA is based on the open pit mining and processing of mineral resources contained
within two existing pits and an existing low-grade stockpile to produce a tin concentrate
only. One important aspect of this relatively small-scale mining project is that it provides for
a reduction in the long-term environmental liability and eventual full rehabilitation of the
brownfield site.
The effective date of the mineral resource estimate on which this PEA is based, is 7 May,
2018 (see Avalon press release dated 28 June, 2018). This resource estimate was prepared by
Avalon and is considered not to be materially different from the previous mineral resource by
Hains Engineering Company Limited (Hains Engineering), which is described in an Avalon
press release dated 31 October, 2014. Hains Engineering is independent of Avalon.
The Qualified Persons for this Technical Report are the following:
• Dayan Anderson, M.S., MMSA (Micon).
• Christopher Jacobs, CEng., MIMMM (Micon).
• Richard Gowans, P.Eng. (Micon).
• Jane Spooner, P.Geo. (Micon).
• William Mercer P. Geo. (Avalon).
• Donald H. Hains, P.Geo. (Hains Engineering)
• Reid Smith P.Geo. (Stantec)
1.1 EAST KEMPTVILLE PROPERTY
The East Kemptville tin-indium project is located on NTS map sheet 21A/04A and /05B in
Yarmouth County, southwestern Nova Scotia. The property is located approximately 180 km
southwest of Halifax, the provincial capital, and 55 km northeast of the town of Yarmouth.
The site accessed from Yarmouth via Nova Scotia paved Highways 340 to Carleton and then
203 to the site. Yarmouth lies on Highways 103 and 101, approximately 300 km by road
from Halifax.

2
Avalon holds a 100% interest in the property via Special Licence 50462. The area covered by
Special Licence 50462 includes the Closure Area represented by the former East Kemptville
Tin Mine property, which is currently under the management of Rio Algom Ltd (RAL), the
surface rights holder. The Special Licence 50462 issued to Avalon on 24 April, 2015 by the
Government of Nova Scotia, is for a term of three years, renewable twice for one year. While
Avalon’s Special Licence 50462 is active, the Mineral Resources Act provides protection
against competing applications to parties with active applications under consideration. As of
the date of this report, the Special Licence 50462 has been renewed by the Government of
Nova Scotia to 2 February 2019.
1.2 HISTORY
Significant, greisen-style tin mineralization was discovered in granitic outcrop in the East
Kemptville area, in 1978, by Shell Canada Resources Limited (Shell). Shell initially drilled a
total of 136 diamond drill holes for a total of 12,450 m during 1979 and 1980, followed by a
further 23 diamond drill holes totalling 1,840 m in the centre of the deposit to test for grade
continuity between existing holes. Subsequently, an additional four diamond drill holes
totalling 490 m were drilled as part of an underground exploration and bulk sample program
conducted between September, 1981 and February, 1981.
The south-central part of the deposit was also tested by 975 m of underground drifting during
the period from September, 1980 to February, 1981. The ramp access tested an area of
approximately 500 m by 350 m to a vertical depth of 50 m. A total of 31,600 t of material
was extracted as a bulk sample and four underground diamond drill holes totalling 490 m
were drilled for comparative purposes. (RAL, 1983)
In 1982, the East Kemptville Deposit and surrounding claims were purchased from Shell by
Riocanex, the Canadian exploration arm of RAL. During 1982 to 1983, RAL conducted a
detailed due diligence of Shell’s work and drilled a total of 15 drill holes totalling 1,305 m
during 1983 in preparation for a feasibility study and production decision also completed in
1983.
The open-pit operation at East Kemptville commenced in the fall of 1985 with a reported
planned 17 years of production at rates of 9,000 t/d of plant feed material and 5,000 t/d of
waste. This operation produced high (50% Sn) and low (21.4% Sn) grade tin concentrates a
copper concentrate (25% Cu) and a zinc concentrate (50% Zn). Shortly after commencing
production, the operation ran into serious problems related to the recovery of tin by gravity
methods. A dramatic price decline of approximately 50% for tin on world markets in the fall
of 1985 put added pressure on the operation. Continued poor tin prices resulted in cessation
of operations in early 1992.
1.3 GEOLOGY AND MINERALIZATION
The East Kemptville Project is located within the Cambro-Ordovician aged, Meguma
Terrane of mainland Nova Scotia. The East Kemptville deposit is a greisen hosted Sn-Cu-Zn-

3
Ag-In deposit with the alteration and mineralization mostly affecting the East Kemptville
leucogranite (EKL).
Tin and base metal (Zn-Cu-Ag-W) mineralization within the deposit is primarily fine to
medium-grained and is associated with northeast-trending, sub-vertical and zoned, quartz-
topaz, sulphide-bearing greisens, veins, and stockworks that occur primarily in the sericite-
silica-topaz altered portions of the EKL near where the East Kemptville Shear Zone (EKSZ)
meet the roof zone in contact with surrounding metasediments.
The overall gross dimensions of the original potential economic mineralization at the Main
and Baby Zones based on a cut-off grade of approximately 0.05% Sn are in the order of
1,500 m long, 350 m wide and 75 m to 150 m deep. Most of this volume is represented by
the larger, Main Zone. The smaller and discrete Baby Zone occurs a few hundred metres
southwest of the Main Zone within what is believed to be a structurally controlled, satellite
intrusion. Mineralization between the Main Zone and the Baby Pit is referred to as the
Southwestern Extension of the Main Zone and is not exposed at surface but intersected in
drilling.
Cassiterite accounts for most (>90%) of the tin mineralization with stannite accounting for
the remainder. Zinc is primarily found as sphalerite and indium is associated with the
sphalerite. Copper is primarily present as chalcopyrite and other copper sulphide minerals.
1.4 EXPLORATION
Prior to the 2014 and 2015 drill programs, exploration by Avalon has been limited to regional
reconnaissance geochemical sampling and limited diamond drilling on the exploration
licences outside of the Special Licence area.
1.4.1 Avalon 2014 Drilling Program
Avalon completed an in-fill/twin hole program consisting of seven HQ diamond drill holes
totalling 986 m in 2014. The purpose of Avalon’s 2104 drill program was to investigate
mineralization between the Main Zone pit and Baby Pit, referred to as the Southwestern
Extension of the Main Zone, and at depth, and to twin some selected historic holes as part of
a due diligence program to validate the historical drill results.
In general, the geology and polymetallic Sn + Zn + Cu zones encountered in the drilling are
considered to be typical of historic drill results reported by Shell and RAL in the Baby and
Southwest Extension Zone Areas. Drilling was successful in confirming the known geology
and the mineralization associated with the Southwest Extension of the Main Zone
1.4.2 Avalon 2015 Drilling Program
In 2015, Avalon completed the drilling of twenty-two HQ diamond drill holes totalling
4,514 m. The objectives of this program were to further definition of mineral resources,
4
obtain additional geotechnical information for mine planning and geochemical information
for waste rock handling planning, and obtain a bulk sample for potential pilot scale
metallurgical testing.
The drill hole sample preparation and assays conducted under best practice QA/QC
procedures with insertion of blanks and standards, as well as duplicate coarse sample
analyses at a secondary laboratory and core duplicates.
1.5 SAMPLE PREPARATION, ANALYSES AND SECURITY
1.5.1 Avalon 2014 Drilling Program
Core was placed in numbered and marked core boxes at the drill site and a quick log
prepared. Avalon personnel transferred boxes to the core logging area where drill core was
logged in detail and marked for sampling and all core photographed prior to sampling.
Sampling was typically undertaken on 1.5 m intervals within mineralized sections. Core was
split using a manual core splitter, with the remaining ½-core reassembled in order in the core
box. Sample material was placed in plastic sample bags with sample number marked on the
outside of the bag and a sample tag stapled to the inside fold of the bag. A duplicate tag was
placed in the core box. Duplicate samples were obtained from drill core by splitting core in
half, with one half noted as the main sample and the other half noted as the duplicate in the
sample log. Standards and blanks were inserted in the sample list on a pre-determined basis.
Bagged samples were placed in 20-L plastic pails. The pails were sealed with secure lids and
taped closed and the sample numbers noted on the outside of the pail. Once a sufficient
number of samples had been prepared, samples were shipped by courier to ALS Canada Ltd.
(ALS) in Sudbury for initial sample preparation. After initial sample preparation, ALS
shipped the samples to its Vancouver facility for assaying. Check sample splits were shipped
by ALS to SGS Canada in Lakefield, Ontario, and to Activation Laboratories Ltd. (Actlabs)
in Ancaster, Ontario.
A total of 404 samples (excluding the 57 duplicates, standards and blank samples) were
submitted to ALS for multi-element analyses. Sixteen blanks, 15 standards and 13 field
duplicates were inserted into the three sample shipments to monitor contamination, accuracy
and precision.
1.5.2 Avalon 2015 Drilling Program
For the 2015 drill program, the sample treatment at the core logging facility was similar to
2014, with the exception that the samples were shipped to Actlabs’ sample preparation
facility in either New Brunswick or Ontario, with the New Brunswick facility utilized except
in some cases where a backlog had built up in New Brunswick. In the latter case, the samples
were shipped direct to the Actlabs laboratory in Ancaster, Ontario.

5
For the 2014 program, only a limited amount of sampling was undertaken in non-mineralized
sections (limestone and greywacke). However, in 2015, in light of the occurrence of
mineralization to the boundary of sampling, prior to the start of the 2015 drill program,
additional sections of unsampled 2014 core were split and assayed and, in some cases,
contained significant mineralization that was contiguous with existing known mineralization.
The initial sample processing and analysis was completed by Actlabs (Ancaster, Ontario) and
the check samples sent to ALS (Vancouver, BC) for analysis.
1.5.3 Low Grade Stockpile Surface Sampling Program
In order to verify the metal grade of the low-grade stockpile, a surface sampling program was
completed in 2015. A program was completed with two samplers to reduce sample bias, each
independently taking a sample at points at 50 m intervals across the length and width of the
low-grade stockpile, plus samples around one side of the bottom of the pile. The two samples
from the two individuals from each site were kept separate for analysis in order to investigate
any sampling bias on the part of one or other sampler. A total of approximately 270 kg was
collected with each sample being about 5 kg.
Samples collected from each site were shipped to Actlabs for analysis. Comparing these
analyses with the RAL Closure Plan (RAL, 1993) showed that the Avalon estimates for Sn
and Zn grades are within 11% of the surface samples quoted by RAL.
1.6 DATA VERIFICATION
Data verification for the 2014 drill program and the resource database included the
following:
1. Comparison of 2014 drill core sample numbers against assay sample shipment lists
and sample receipt list.
2. Survey of drill collar coordinates by a qualified Nova Scotia land surveyor.
3. Site visit and inspection of 2014 drilling procedures, core logging, and sampling by
Hains Engineering.
4. Collection of due diligence ¼-core samples and independent assaying of samples by
Hains Engineering.
5. Comparison of 2014 drill core assays against assay certificates.
6. Comparison of historic drill logs and assay certificates against the historic Excel
database used in the resource estimate.
7. Verification of historic Rio Algom Limited (RAL) QA/QC data.
8. Inspection of selected historic drill core stored at the NSDNR Core Library in
Stellarton, Nova Scotia and verification of descriptions in historic drill logs by Hains
Engineering.

6
9. Collection of due diligence ¼-core samples and independent assaying of samples
from selected drill core intervals of historic drill core stored at Stellarton by Hains
Engineering.
In the opinion of author, the 2014, sampling and assay data and the historic drill hole and
assay data, as represented in the resource database, are reliable and can be used in resource
estimation.
QA/QC measures employed for the 2014 drill program included the following:
1. Insertion of standards and blanks in the main sample batches.
2. Assays of coarse duplicates to check sample preparation procedures and laboratory
precision.
3. Assays of pulp duplicates to laboratory analytical precision.
4. Coarse check samples assayed at two separate laboratories to check sample
preparation procedures and analytical bias.
5. Insertion of certified standard reference materials in check sample assay batches.
6. Internal laboratory QA/QC protocols incorporating the use of certified standards and
blanks and duplicate and repeat assays.
The review of the QA/QC data indicates no significant issues with respect to sample
preparation, assaying and laboratory precision.
Similar QA/QC protocols were followed in the 2015 drill program as previously used in
2014. The results on the standards and duplicates suggest that Actlabs may have a slight
negative bias in analyses in tin. As all biases present are indicated at levels below 10% and in
most cases less than 5%, the analytical data is considered acceptable for resource estimation.
Data verification of the historic sampling and assay data consisted of checking the reported
assay values contained in the QA/QC appendix of the RAL feasibility study against the
current assay data base and the available drill logs. The current assay data base is a
compilation undertaken by Avalon of all available assay certificates, drill logs and survey
data. The Shell and RAL drill core assays are considered as acceptable for resource
estimation purposes.
1.7 MINERAL PROCESSING AND METALLURGICAL TESTING
Avalon has conducted a number of testwork programs on samples representing the East
Kemptville deposit. Work began with SGS UK in Cornwall, UK, to develop a comprehensive
flowsheet to produce tin, copper, and zinc/indium concentrates using mineralized samples
from the Baby Zone deposit. This set the baseline for a subsequent test campaign, in 2016, at
Met-Solve, who investigated recovering tin (only) from the existing low-grade stockpile.
7
Testwork was undertaken by SGS UK using a 290 kg blended composite from 1,140 kg of
material comprising 394 split drill core from the Baby Zone. The testwork completed
included heavy liquid sink/float tests, Bond rod and ball mill grindability tests, gravity
separation tests and flotation tests.
SGS UK was able to develop a flowsheet for the East Kemptville deposit to produce copper,
zinc and tin concentrates. Copper recovery was estimated at 86.4% into a 20.7% grade
copper concentrate, zinc recovery was estimated at 84.5% into a 51.4% grade zinc
concentrate and tin recovery into a 50.5% Sn concentrate was estimated at 76.8%.
Using the SGS UK test results as a basis, Avalon contracted Met-Solve in Langley, BC (Met-
Solve), in 2016, to undertake further flowsheet development testwork to recover tin from
East Kemptville mineralization. The testwork program was divided into three phases:
• Phase I: Use of falcon gravity concentrators at 3 different grind sizes (200, 150 and
100 µm) to determine the sample’s response to gravity concentration for the recovery
of tin.
• Phase II: Grind material to 200 µm for the gravity rougher stage, followed by a
regrind to 100 µm for gravity scavenging. Gravity tailings were then floated to
attempt to recover additional tin.
• Phase III: Locked Cycle tests of the best flowsheet configuration previously identified
in Phases I and II.
The sample provided by Avalon for the Met-Solve testwork comprised approximately 178 kg
of crushed samples from the East Kemptville low-grade stockpile.
The testwork resulted in the development of a flowsheet capable of producing a tin
concentrate containing up to 55% Sn with a tin recovery of approximately 60%. The material
will be milled to P80 ±80 microns before being put through a series of centrifugal gravity
concentrators. The gravity concentrates will feed a magnetic separation circuit followed by a
simple sulphide flotation circuit to remove sulphides. The non-sulphide flotation tailings will
be cleaned using final shaking table gravity circuit, the concentrates from which will be
collected and dewatered before being shipped to potential customers.
Testwork also showed that tailings from the gravity circuit can be treated through a bulk
sulphide flotation process to reduce contained sulphur to approximately 0.05% S, making it a
suitable material for capping of the tailings dam

8
1.8 MINERAL RESOURCE ESTIMATES
An updated mineral resource estimate for the East Kemptville project was completed on
7 May, 2018 (see Avalon news release dated 28 June, 2018). The mineral resource estimate
is based on a block model prepared by Avalon and is summarized in Table 1.1. The deposit
was subdivided into the Main Zone and the Baby Zone, which were interpolated separately.
The in situ unmined tin resources were estimated using historic drill holes, data from drill
holes completed by Avalon in 2014 and 2015, and a post-mining topographic model. A tin
cut-off grade of 0.10% was considered as reasonable based on current mine plans and
historic cut-off grade used at the East Kemptville mine.
Table 1.1
Updated Mineral Resource Estimate for the Main and Baby Zones
Classification
Cut-off
grade Sn
(%)
Main Zone NE Baby Zone Total
Tonnes (Mt) Sn (%) Tonnes (Mt) Sn (%) Tonnes
(Mt) Sn (%)
Measured 0.08 0.40 0.173 0.22 0.241 0.61 0.197
0.10 0.38 0.177 0.20 0.251 0.58 0.203
0.12 0.32 0.188 0.19 0.259 0.51 0.214
Indicated 0.08 27.89 0.133 1.72 0.194 29.61 0.137
0.10 20.91 0.148 1.48 0.211 22.39 0.152
0.12 14.84 0.163 1.27 0.228 16.11 0.168
Measured +
Indicated
0.08 28.28 0.134 1.93 0.199 30.22 0.138
0.10 21.29 0.148 1.68 0.216 22.97 0.153
0.12 15.16 0.164 1.46 0.232 16.62 0.170
Inferred 0.08 18.54 0.125 0.90 0.153 19.43 0.126
0.10 13.56 0.137 0.69 0.172 14.25 0.139
0.12 8.11 0.156 0.51 0.193 8.62 0.158
Notes:
1. CIM Definition Standards for Mineral Resources, 2014, were followed.
2. The Qualified Person for this Mineral Resource estimate is William Mercer, Ph.D., P. Geo. (Nova Scotia). The
mineral resources are current as of May 7, 2018.
3. The mineral resource estimate is based on 194 drill holes totalling 21,456 m drilled between 1979 and 1991 by
previous operators and 23 holes totalling 4190 m drilled by Avalon in 2014 and 2015.
4. Drill data were organized in Maxwell DataShed and for estimation purposes were transferred to the Geovia GEMS
6.8.1 software, wherein the block model was developed.
5. Resources were estimated by interpolating composites within block models of 24 m by 24 m by 12 m blocks in the
Main Zone and 6 m by 6 m by 6 m in the Baby Zone. Interpolation used the Ordinary Kriging method.
6. In the Main Zone, Measured material was defined as blocks interpolated with a search ellipse with radii of 40x20x15
m using 18-36 samples, corresponding to 3-6 drill holes, indicated material with a 120x40x18 m search ellipse and
the same number of samples, and inferred material with a 315x85x18 m search ellipse using 12-24 samples
corresponding to 2-4 drill holes. In the Baby Zone, Measured material was defined as blocks interpolated with a
search ellipse with radii of 30x20x8 m using 6-12 samples, corresponding to 3-6 drill holes, indicated material with
a 48x33x12 m search ellipse and the same number of samples, and inferred material with a 95x65x24 m search
ellipse using 4-8 samples corresponding to 2-4 drill holes (see Section 1.12 Resource Classification).
7. Prior to compositing, the assays were capped at 1% Sn, which corresponds to the 99th percentile of the tin assay
data, reducing the length-weighted mean of the tin assays by 9.4%.
8. Mean density values of available data of 2.728 t/m3 and 2.784 t/m3 were used for the Main and Baby Zones,
respectively.
9. The resource estimate has been constrained using the Whittle pit described previously (Avalon News Release 15-02,
February 25, 2015).
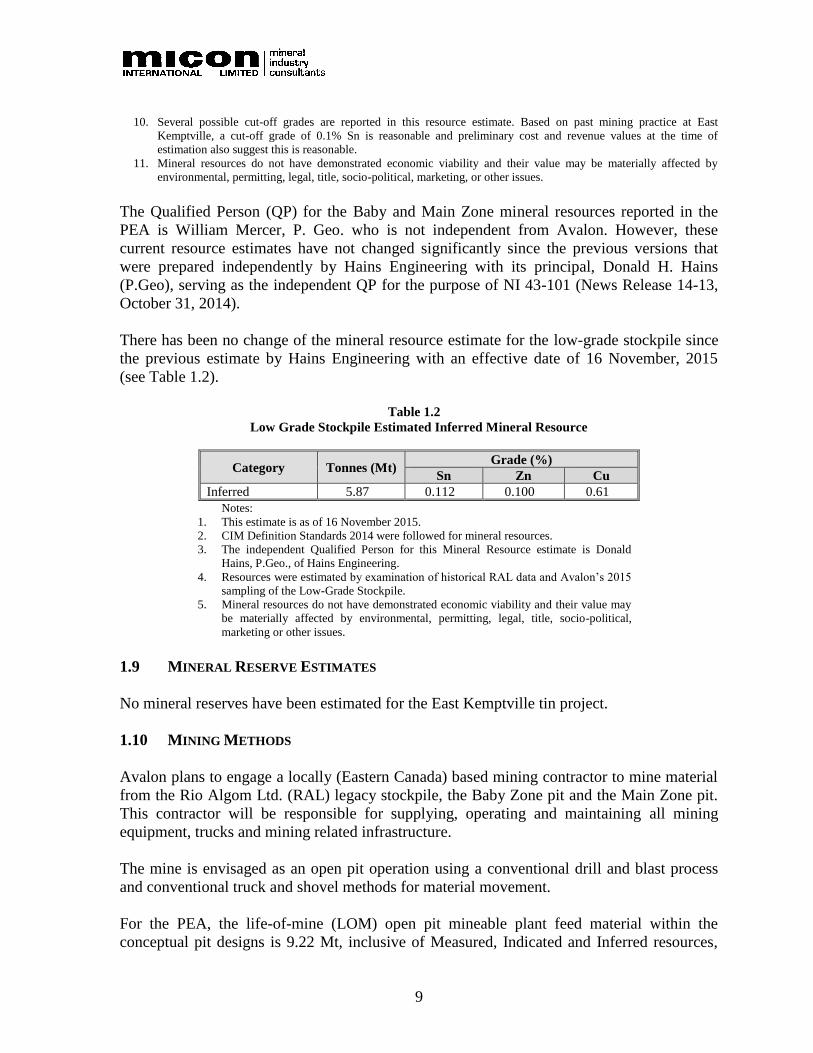
9
10. Several possible cut-off grades are reported in this resource estimate. Based on past mining practice at East
Kemptville, a cut-off grade of 0.1% Sn is reasonable and preliminary cost and revenue values at the time of
estimation also suggest this is reasonable.
11. Mineral resources do not have demonstrated economic viability and their value may be materially affected by
environmental, permitting, legal, title, socio-political, marketing, or other issues.
The Qualified Person (QP) for the Baby and Main Zone mineral resources reported in the
PEA is William Mercer, P. Geo. who is not independent from Avalon. However, these
current resource estimates have not changed significantly since the previous versions that
were prepared independently by Hains Engineering with its principal, Donald H. Hains
(P.Geo), serving as the independent QP for the purpose of NI 43-101 (News Release 14-13,
October 31, 2014).
There has been no change of the mineral resource estimate for the low-grade stockpile since
the previous estimate by Hains Engineering with an effective date of 16 November, 2015
(see Table 1.2).
Table 1.2
Low Grade Stockpile Estimated Inferred Mineral Resource
Category Tonnes (Mt) Grade (%)
Sn Zn Cu
Inferred 5.87 0.112 0.100 0.61
Notes:
1. This estimate is as of 16 November 2015.
2. CIM Definition Standards 2014 were followed for mineral resources.
3. The independent Qualified Person for this Mineral Resource estimate is Donald
Hains, P.Geo., of Hains Engineering.
4. Resources were estimated by examination of historical RAL data and Avalon’s 2015
sampling of the Low-Grade Stockpile.
5. Mineral resources do not have demonstrated economic viability and their value may
be materially affected by environmental, permitting, legal, title, socio-political,
marketing or other issues.
1.9 MINERAL RESERVE ESTIMATES
No mineral reserves have been estimated for the East Kemptville tin project.
1.10 MINING METHODS
Avalon plans to engage a locally (Eastern Canada) based mining contractor to mine material
from the Rio Algom Ltd. (RAL) legacy stockpile, the Baby Zone pit and the Main Zone pit.
This contractor will be responsible for supplying, operating and maintaining all mining
equipment, trucks and mining related infrastructure.
The mine is envisaged as an open pit operation using a conventional drill and blast process
and conventional truck and shovel methods for material movement.
For the PEA, the life-of-mine (LOM) open pit mineable plant feed material within the
conceptual pit designs is 9.22 Mt, inclusive of Measured, Indicated and Inferred resources,
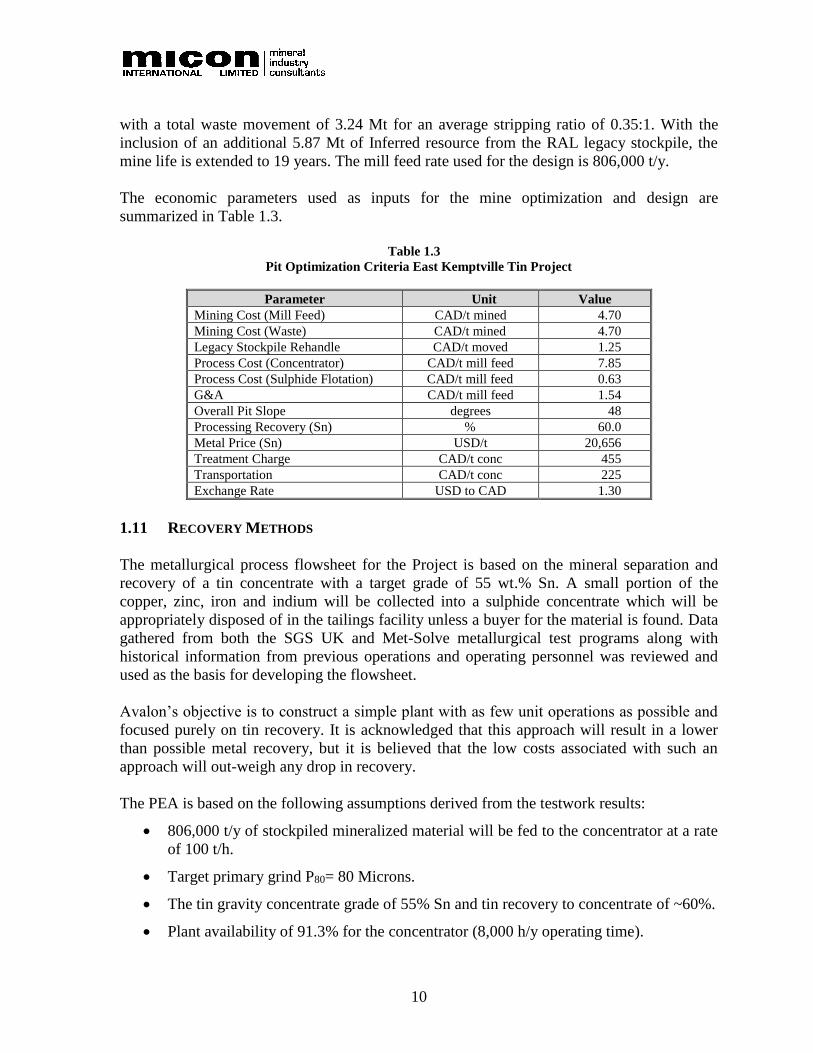
10
with a total waste movement of 3.24 Mt for an average stripping ratio of 0.35:1. With the
inclusion of an additional 5.87 Mt of Inferred resource from the RAL legacy stockpile, the
mine life is extended to 19 years. The mill feed rate used for the design is 806,000 t/y.
The economic parameters used as inputs for the mine optimization and design are
summarized in Table 1.3.
Table 1.3
Pit Optimization Criteria East Kemptville Tin Project
Parameter Unit Value
Mining Cost (Mill Feed) CAD/t mined 4.70
Mining Cost (Waste) CAD/t mined 4.70
Legacy Stockpile Rehandle CAD/t moved 1.25
Process Cost (Concentrator) CAD/t mill feed 7.85
Process Cost (Sulphide Flotation) CAD/t mill feed 0.63
G&A CAD/t mill feed 1.54
Overall Pit Slope degrees 48
Processing Recovery (Sn) % 60.0
Metal Price (Sn) USD/t 20,656
Treatment Charge CAD/t conc 455
Transportation CAD/t conc 225
Exchange Rate USD to CAD 1.30
1.11 RECOVERY METHODS
The metallurgical process flowsheet for the Project is based on the mineral separation and
recovery of a tin concentrate with a target grade of 55 wt.% Sn. A small portion of the
copper, zinc, iron and indium will be collected into a sulphide concentrate which will be
appropriately disposed of in the tailings facility unless a buyer for the material is found. Data
gathered from both the SGS UK and Met-Solve metallurgical test programs along with
historical information from previous operations and operating personnel was reviewed and
used as the basis for developing the flowsheet.
Avalon’s objective is to construct a simple plant with as few unit operations as possible and
focused purely on tin recovery. It is acknowledged that this approach will result in a lower
than possible metal recovery, but it is believed that the low costs associated with such an
approach will out-weigh any drop in recovery.
The PEA is based on the following assumptions derived from the testwork results:
• 806,000 t/y of stockpiled mineralized material will be fed to the concentrator at a rate
of 100 t/h.
• Target primary grind P80= 80 Microns.
• The tin gravity concentrate grade of 55% Sn and tin recovery to concentrate of ~60%.
• Plant availability of 91.3% for the concentrator (8,000 h/y operating time).

11
• Preliminary tin recovery will be by centrifugal concentrators with shaking tables used
to produce the final product.
• Concentrate cleaning will include magnetic separation and flotation to remove iron,
copper and zinc sulphides.
A copy of the simplified flowsheet is included in Figure 1.1. The flowsheet consists of
several conventional processes to produce a tin concentrate. This includes crushing, milling
and classification, a series of gravity circuits using high-speed centrifugal concentrators
(HSCCs), magnetic separation and flotation to remove the metal sulphide before going
through a series of shaking tables. A bulk sulphide flotation circuit is also included in Year 6
of the operation to remove sulphides from the gravity tailings.
Benign flotation tailings will be filtered and used for capping the tailings facility. The bulk
sulphides concentrate removed from the gravity tailings will be combined with the sulphide
concentrate from the tin gravity circuit and stored under a cover of water to prevent
oxidation.
Figure 1.1
Simplified Flowsheet
1.12 PROJECT INFRASTRUCTURE
Existing roads on site allow easy access to the entire site for operations and maintenance. A
new haul road will be required from the mine pits to the processing plant. There is sufficient
infrastructure in the area to support the labour force required for the project operations and
no need is seen for accommodations at site.
12
1.12.1 Power, Fuel and Water
Primary power to the site will be provided by Nova Scotia Power via an existing line which
will feed a new substation at site. Emergency/back-up power will be provided by a diesel
generator.
Diesel storage and fueling stations will be provided on site for mobile equipment.
Raw water from the Tusket River will supply potable, fire and process water requirements.
Process water will be recycled to keep make-up water requirements to a minimum. Process
water will also be extracted from the 2 existing pits or recycled from the TMF in order to
minimize raw water consumption and to also make the pits accessible for mining.
The existing water treatment facility which treats run-off from the tailing facility will be
maintained for ongoing operations and modified as required to meet the new project
demands, although minimal changes are anticipated to be required.
1.12.2 Buildings, Communication and Waste Handling
The intention is to erect a single pre-engineered and pre-fabricated building that can house
the main processing plant (excluding crushing circuit), stores and workshop areas all under a
single roof.
Proven, reliable and state-of-the-art telecommunications systems will be provided at the site
for permanent operations and maintenance.
Waste materials (organic waste, hazardous and recyclable wastes, etc.) will be sorted on site
and disposed of off-site using local contracting companies or existing municipal handling
facilities.
1.12.3 Concentrate Storage and Shipping
Concentrate will be bagged, containerized and stored at site before shipment on a regular
basis to the laydown area at the port in Shelburne or Halifax. On average, approximately
120 t of concentrate will be produced per month requiring the transportation of 4-5
truckloads per month from the site to the port.
1.13 MARKET STUDIES AND CONTRACTS
For the purposes of the PEA, Avalon has undertaken an in-house analysis of the markets for
tin concentrates during the course of which it has consulted with industry participants and
specialist consultants.
13
A tin price of USD21,038 /tonne has been used for the PEA, which is not only the World
Bank forecast for 2020, but also is consistent with the LME price for tin during the first
quarter of 2018 (USD21,187).
1.14 ENVIRONMENTAL STUDIES, PERMITTING AND SOCIAL OR COMMUNITY IMPACT
Following the completion of an environmental baseline study, impact assessment and
permitting, the East Kemptville mine operated between 1983 and 1992 at a production rate
approximately 4 times higher than that envisioned for this project. The overall site is
currently considered a brownfields site with ongoing perpetual treatment of runoff water.
The East Kemptville site has long term environmental liabilities that are the result of sulphide
minerals that remain in the pit walls, low grade and waste rock stockpiles, and tailings, all of
which generate acid mine drainage (AMD) to greater or lesser extents. At this time, these
liabilities are being effectively managed by the surface rights holder through the collection,
treatment and release of treated water.
An agreement between Avalon, the surface rights holder and the Government of Nova Scotia
will be required, prior to development of this project, which details how and when Avalon
will assume care and custody of the closed site. A letter describing this requirement was
signed by the Ministry of Natural Resources (now Nova Scotia Energy and Mines).
The start of operations is not anticipated to be subject to approvals under the Canadian
Environmental Assessment Act 2012 (CEAA) as the mine does not exceed any of the CEAA
triggers, including mine and mill tonnages. The project is not anticipated to have any new
impacts to terrestrial, fish or fish habitat, and will not impact any federally designated
wildlife conservations areas. The project will be subject to the Nova Scotia Environment Act
and associated regulations (including the Environmental Assessment Regulations), via the
provincial “One Window” approach to mineral resource development chaired by Nova Scotia
Energy and Mines.
Planned operations are an integral component of the overall mine rehabilitation strategy and
to mitigate the present and ongoing sources of environmental liability. The brownfields site
has known sources of AMD to both surface and groundwater. These are now well understood
by Avalon and appropriate mitigations and closure plans identified for these historical
impacts have been developed, as well as for any impacts anticipated from future operations.
Avalon is recognized for its leadership in Indigenous Engagement. It has already reached out
to the Mi’kmaq First Nation to make them aware of recent small drill programs and to initiate
dialog with them. Avalon has also initiated engagement with the local community.
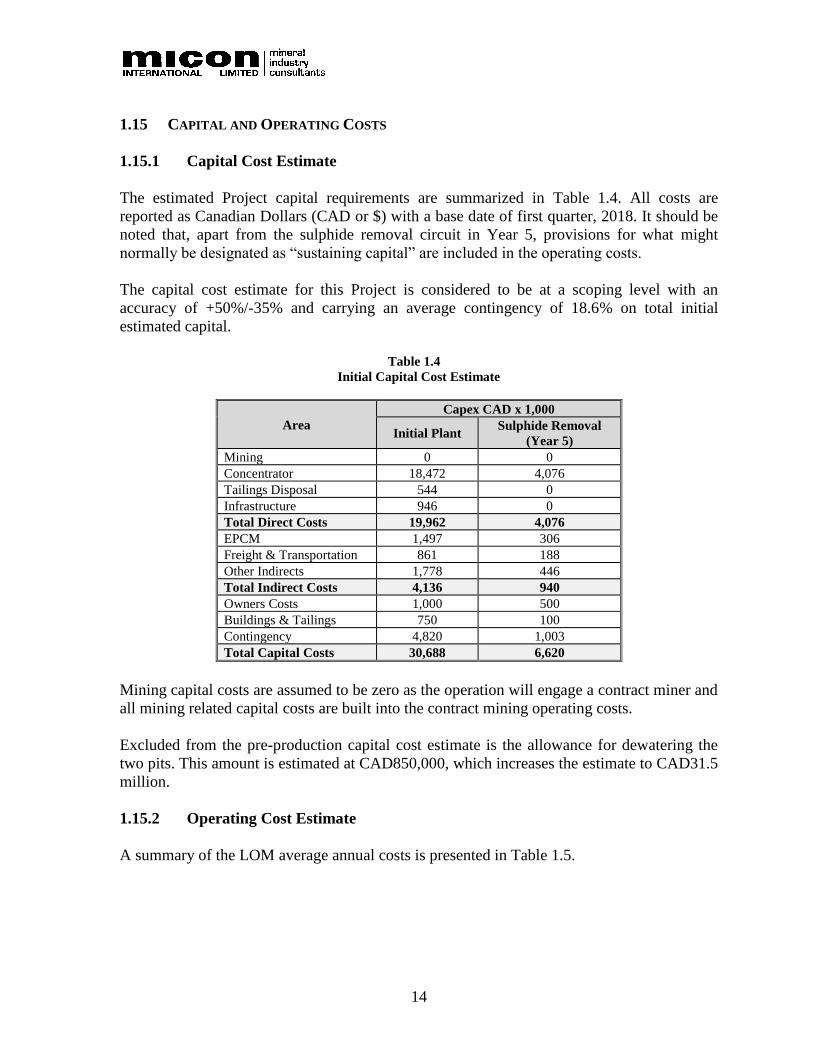
14
1.15 CAPITAL AND OPERATING COSTS
1.15.1 Capital Cost Estimate
The estimated Project capital requirements are summarized in Table 1.4. All costs are
reported as Canadian Dollars (CAD or $) with a base date of first quarter, 2018. It should be
noted that, apart from the sulphide removal circuit in Year 5, provisions for what might
normally be designated as “sustaining capital” are included in the operating costs.
The capital cost estimate for this Project is considered to be at a scoping level with an
accuracy of +50%/-35% and carrying an average contingency of 18.6% on total initial
estimated capital.
Table 1.4
Initial Capital Cost Estimate
Area
Capex CAD x 1,000
Initial Plant Sulphide Removal
(Year 5)
Mining 0 0
Concentrator 18,472 4,076
Tailings Disposal 544 0
Infrastructure 946 0
Total Direct Costs 19,962 4,076
EPCM 1,497 306
Freight & Transportation 861 188
Other Indirects 1,778 446
Total Indirect Costs 4,136 940
Owners Costs 1,000 500
Buildings & Tailings 750 100
Contingency 4,820 1,003
Total Capital Costs 30,688 6,620
Mining capital costs are assumed to be zero as the operation will engage a contract miner and
all mining related capital costs are built into the contract mining operating costs.
Excluded from the pre-production capital cost estimate is the allowance for dewatering the
two pits. This amount is estimated at CAD850,000, which increases the estimate to CAD31.5
million.
1.15.2 Operating Cost Estimate
A summary of the LOM average annual costs is presented in Table 1.5.
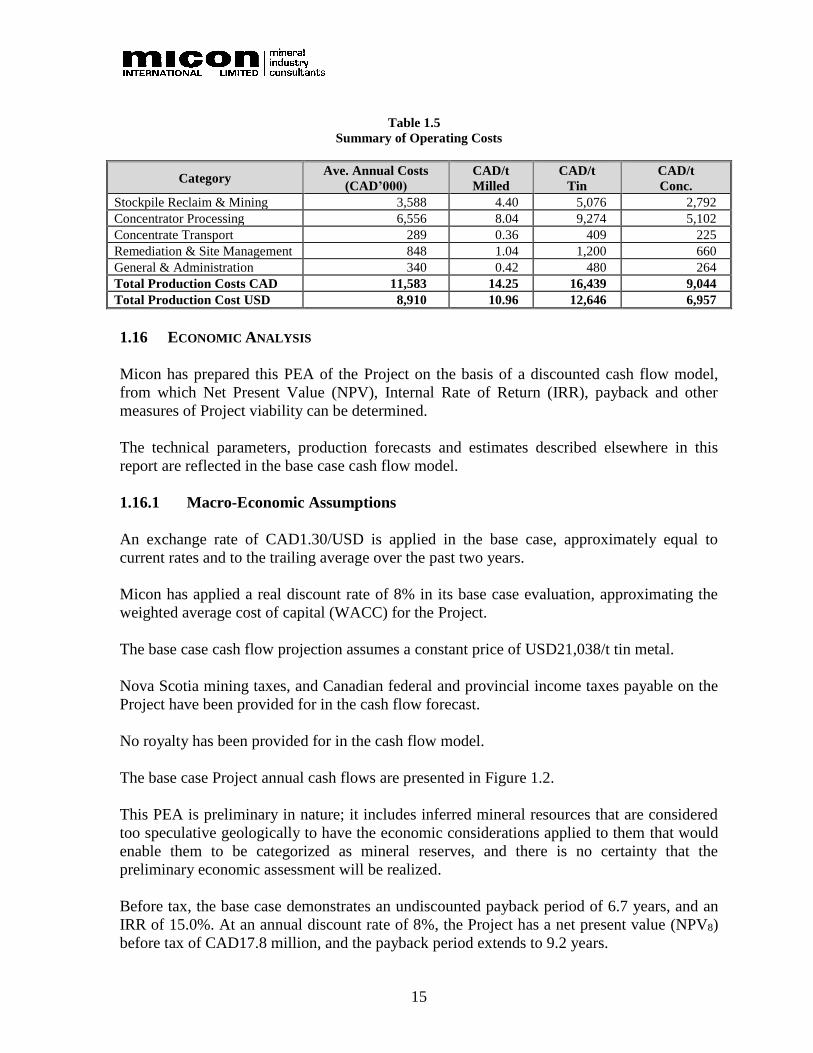
15
Table 1.5
Summary of Operating Costs
Category Ave. Annual Costs
(CAD’000)
CAD/t
Milled
CAD/t
Tin
CAD/t
Conc.
Stockpile Reclaim & Mining 3,588 4.40 5,076 2,792
Concentrator Processing 6,556 8.04 9,274 5,102
Concentrate Transport 289 0.36 409 225
Remediation & Site Management 848 1.04 1,200 660
General & Administration 340 0.42 480 264
Total Production Costs CAD 11,583 14.25 16,439 9,044
Total Production Cost USD 8,910 10.96 12,646 6,957
1.16 ECONOMIC ANALYSIS
Micon has prepared this PEA of the Project on the basis of a discounted cash flow model,
from which Net Present Value (NPV), Internal Rate of Return (IRR), payback and other
measures of Project viability can be determined.
The technical parameters, production forecasts and estimates described elsewhere in this
report are reflected in the base case cash flow model.
1.16.1 Macro-Economic Assumptions
An exchange rate of CAD1.30/USD is applied in the base case, approximately equal to
current rates and to the trailing average over the past two years.
Micon has applied a real discount rate of 8% in its base case evaluation, approximating the
weighted average cost of capital (WACC) for the Project.
The base case cash flow projection assumes a constant price of USD21,038/t tin metal.
Nova Scotia mining taxes, and Canadian federal and provincial income taxes payable on the
Project have been provided for in the cash flow forecast.
No royalty has been provided for in the cash flow model.
The base case Project annual cash flows are presented in Figure 1.2.
This PEA is preliminary in nature; it includes inferred mineral resources that are considered
too speculative geologically to have the economic considerations applied to them that would
enable them to be categorized as mineral reserves, and there is no certainty that the
preliminary economic assessment will be realized.
Before tax, the base case demonstrates an undiscounted payback period of 6.7 years, and an
IRR of 15.0%. At an annual discount rate of 8%, the Project has a net present value (NPV8)
before tax of CAD17.8 million, and the payback period extends to 9.2 years.
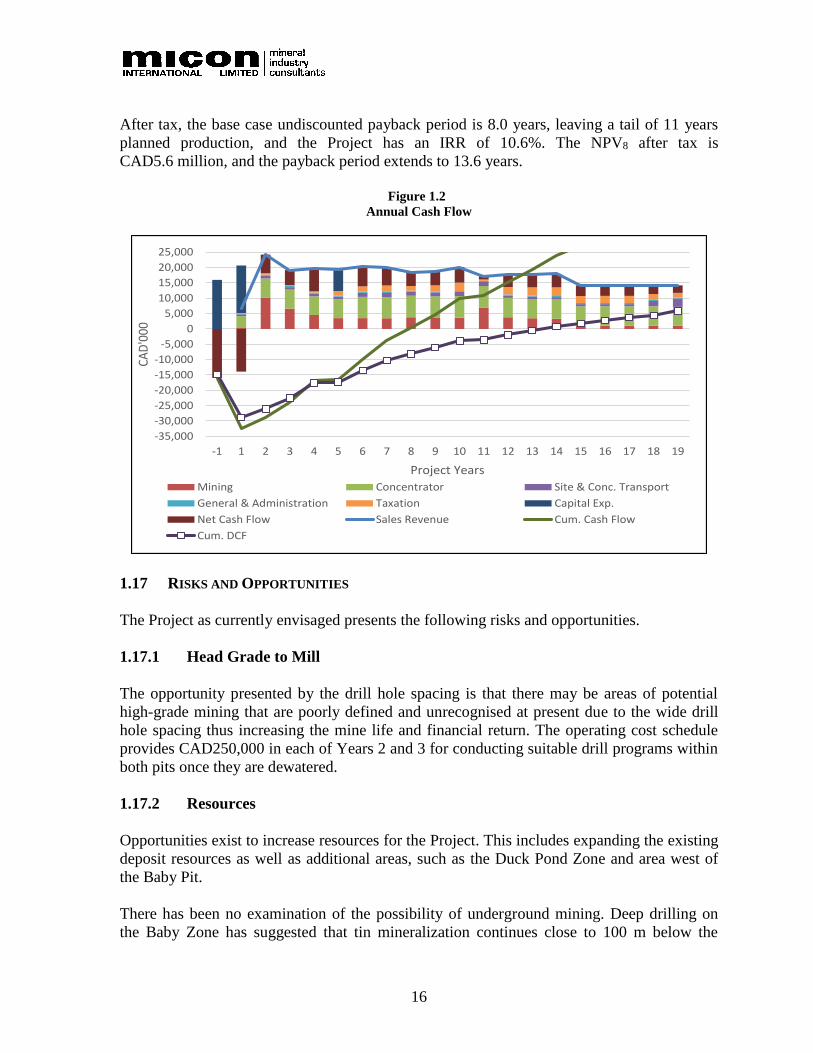
16
After tax, the base case undiscounted payback period is 8.0 years, leaving a tail of 11 years
planned production, and the Project has an IRR of 10.6%. The NPV8 after tax is
CAD5.6 million, and the payback period extends to 13.6 years.
Figure 1.2
Annual Cash Flow
1.17 RISKS AND OPPORTUNITIES
The Project as currently envisaged presents the following risks and opportunities.
1.17.1 Head Grade to Mill
The opportunity presented by the drill hole spacing is that there may be areas of potential
high-grade mining that are poorly defined and unrecognised at present due to the wide drill
hole spacing thus increasing the mine life and financial return. The operating cost schedule
provides CAD250,000 in each of Years 2 and 3 for conducting suitable drill programs within
both pits once they are dewatered.
1.17.2 Resources
Opportunities exist to increase resources for the Project. This includes expanding the existing
deposit resources as well as additional areas, such as the Duck Pond Zone and area west of
the Baby Pit.
There has been no examination of the possibility of underground mining. Deep drilling on
the Baby Zone has suggested that tin mineralization continues close to 100 m below the
-35,000
-30,000
-25,000
-20,000
-15,000
-10,000
-5,000
0
5,000
10,000
15,000
20,000
25,000
-1 1 2 3 4 5 6 7 8 9 10 11 12 13 14 15 16 17 18 19
CAD
'000
Project Years
Mining Concentrator Site & Conc. Transport
General & Administration Taxation Capital Exp.
Net Cash Flow Sales Revenue Cum. Cash Flow
Cum. DCF

17
bottom of the presently planned pits. A detailed examination of this data may reveal
underground mining potential in this and other areas of the property.
There are additional very low-grade stockpiles on surface which could potentially be
processed if methods such as ore-sorting are demonstrated to have the ability to pre-
concentrate the tin prior to the milling circuit.
1.17.3 Tin Price
An analysis of recent historical tin prices indicates that the LME listed price for tin has been
above that value virtually continuously for more than the past 10 years. The LME listed price
as of 1 May 2018 is USD21,395 and the World Bank Commodity Price forecast indicates tin
a long-term price forecast of USD20,169 for 2025.
1.17.4 Tin Recovery
The tin recovery of 60% is based on the testwork program by Met-Solve, and Avalon
believes that once the plant is up and running, this figure can be improved upon. With bench
scale testwork, it is difficult to simulate the impact of recirculating streams and to optimize
recovery over time so material that would be captured from such streams often reports to
tailings during bench testing. With an operating plant, these streams are fully recycled, and
operators have the opportunity to optimize recovery.
1.17.5 Mining
The forecast mining costs represent almost 30% of total production costs and are estimated
using typical industry contractor rates for open pit operations of this size. Upon completion
of the proposed drilling to update the resource model, further mine design work and haulage
analyses are required before costing of the final tonnages of material (plant feed plus waste)
to be mined can be more accurately defined.
1.17.6 Stockpile Grade
The grade of the material in the stockpile has been estimated by two surface sampling
programs and by reviewing historical information, all of which produced similar results, and
as a consequence an “inferred” resource has been determined by an external consultant. It is,
however, planned to complete a drill program of the stockpile as soon as financing is
available, partly to confirm the overall grade, but more importantly to map the internal grade
distributions and produce a more representative schedule of feed grades shipped to the
processing plant from this source.

18
1.17.7 Operating Life
The current operating life is 18.5 years; however, Avalon is confident that additional feed
sources will be identified, and that the operating life will be extended.
1.17.8 Purchasing Used/Refurbished Equipment
The capital cost estimate has assumed all equipment is purchased new, but there are
significant opportunities to reduce equipment costs, particularly for the crushers and mill, by
purchasing used/refurbished items. Avalon is also aware of a number of used screens and
gravity concentrators that could potentially be acquired.
1.17.9 Revenue from By-products
No provision has been made for up-grading the sulphide concentrate into marketable copper
and zinc/indium concentrates for sale.
1.17.10 Foreign Exchange Rate
A lot of the mechanical equipment is being sourced from outside Canada and is priced in
American dollars. Similarly, all revenue is in USD. An exchange rate of CAD1.30:USD1 has
been used. Should the Canadian dollar strengthen this would be positive in terms of initial
capex, but then negative with respect to subsequent revenue once in production.
1.17.11 Environmental Liability
By re-activating the Project, Avalon will be inheriting a number of (currently) long term
environmental liabilities. However, by removing the low-grade stockpile, capping the tailings
facility and depositing the balance of the tailings along with waste rock into the two pits,
Avalon believes a “walk-away” closure strategy has been developed, eliminating these long-
term liabilities.
1.18 CONCLUSIONS
Avalon has the opportunity to re-commence commercial tin production from the East
Kemptville mine by establishing a small-scale operation processing an on-surface, low-grade
stockpile and higher grade, near surface occurrences within the existing pits.
Avalon considers the tin concentrate produced (see Table 1.6) to be highly marketable. In
early 2018, Avalon has entered into a non-binding MOU for the sale of all its forecast
production with a well-known company that owns a large tin smelter. The formula used by
this customer for determining concentrate pricing has been used by Avalon in the financial
model.
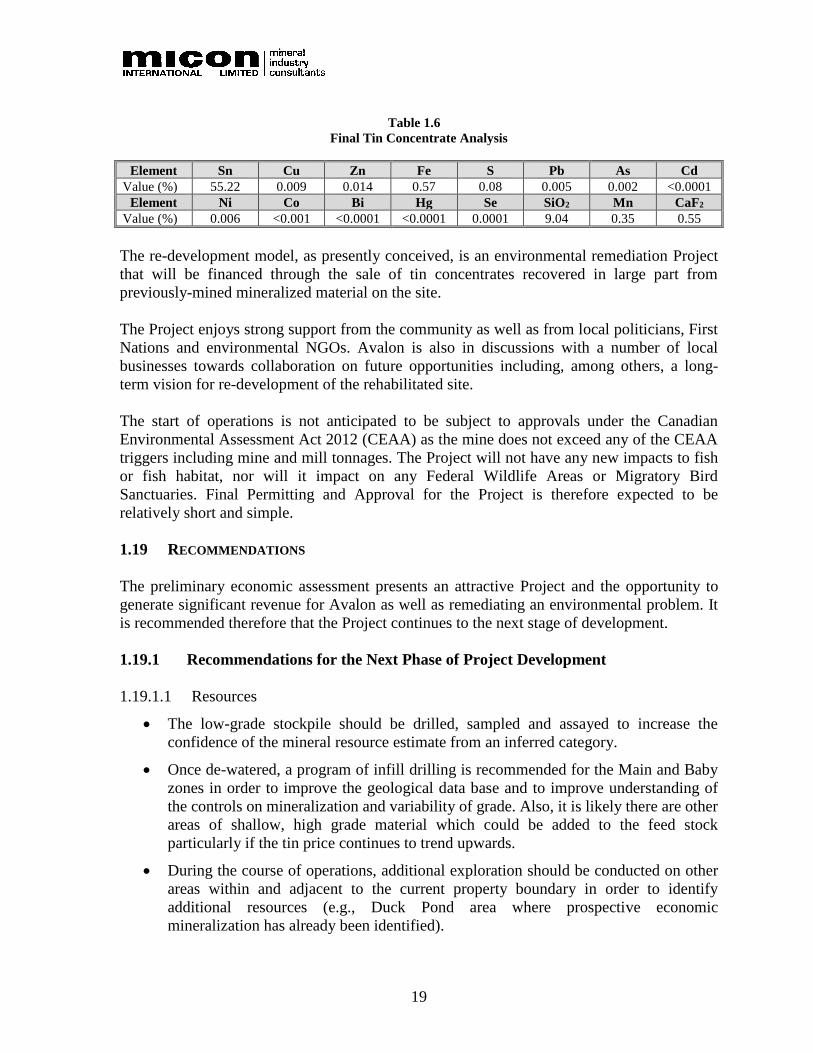
19
Table 1.6
Final Tin Concentrate Analysis
Element Sn Cu Zn Fe S Pb As Cd
Value (%) 55.22 0.009 0.014 0.57 0.08 0.005 0.002 <0.0001
Element Ni Co Bi Hg Se SiO2 Mn CaF2
Value (%) 0.006 <0.001 <0.0001 <0.0001 0.0001 9.04 0.35 0.55
The re-development model, as presently conceived, is an environmental remediation Project
that will be financed through the sale of tin concentrates recovered in large part from
previously-mined mineralized material on the site.
The Project enjoys strong support from the community as well as from local politicians, First
Nations and environmental NGOs. Avalon is also in discussions with a number of local
businesses towards collaboration on future opportunities including, among others, a long-
term vision for re-development of the rehabilitated site.
The start of operations is not anticipated to be subject to approvals under the Canadian
Environmental Assessment Act 2012 (CEAA) as the mine does not exceed any of the CEAA
triggers including mine and mill tonnages. The Project will not have any new impacts to fish
or fish habitat, nor will it impact on any Federal Wildlife Areas or Migratory Bird
Sanctuaries. Final Permitting and Approval for the Project is therefore expected to be
relatively short and simple.
1.19 RECOMMENDATIONS
The preliminary economic assessment presents an attractive Project and the opportunity to
generate significant revenue for Avalon as well as remediating an environmental problem. It
is recommended therefore that the Project continues to the next stage of development.
1.19.1 Recommendations for the Next Phase of Project Development
1.19.1.1 Resources
• The low-grade stockpile should be drilled, sampled and assayed to increase the
confidence of the mineral resource estimate from an inferred category.
• Once de-watered, a program of infill drilling is recommended for the Main and Baby
zones in order to improve the geological data base and to improve understanding of
the controls on mineralization and variability of grade. Also, it is likely there are other
areas of shallow, high grade material which could be added to the feed stock
particularly if the tin price continues to trend upwards.
• During the course of operations, additional exploration should be conducted on other
areas within and adjacent to the current property boundary in order to identify
additional resources (e.g., Duck Pond area where prospective economic
mineralization has already been identified).
20
1.19.1.2 Mining
• The mine designs and Project schedules should be completed to a more detailed level
using the revised mineral resources resulting from the work recommended above.
• Mining contractors should be requested to provide a more detailed mining contract
proposal using these updated detailed mine plans and schedules.
• The economic potential of mining deeper (either through open pit or underground
methods) should be investigated for the Main and Baby Zone mineralization.
1.19.1.3 Processing Plant
• During the next phase of engineering, the proposed modular off-site fabrication and
assembly philosophy should be adhered to as it will not only keep the up-front capital
cost lower than normal but will also facilitate either future expansion or plant
relocation to elsewhere once the East Kemptville resources have been exhausted.
• There is an opportunity to run a short pilot campaign to assess and optimize the initial
“rougher” tin recovery performance. The purpose of this will be predominantly to
fully optimize the grinding and classification circuit as minimizing over-grinding of
the cassiterite is a key operating component. The rougher circuit operation will also
provide an opportunity to optimize performance and confirm the expectation that a
recovery >60% is achievable.
• The potential for using ore-sorting to upgrade the plant feed should be further
investigated. This could have significant impacts on capital and/or operating costs
either through the use of a smaller, cheaper processing plant or by significantly
increasing the tin output through the same plant but over a shorter time frame. The
pre-treatment by ore-sorting, of the “very low” grade stockpiles may also generate a
suitably graded material to allow plant operations over a longer period.
1.19.1.4 Project Implementation
• The current 16-18-month implementation schedule is tight, and where possible,
development activities should continue whilst Project funding is being secured. Such
activities could include finalizing fixed equipment prices, confirming fabricators to be
used and negotiating various service and supply contracts.
• There are various minor permitting studies which still need to be completed in order
to gain site access for initiating construction activities. These studies should be
completed as soon as possible in order to prevent any potential impact on the
implementation schedule.
• Securing a final agreement with BHP still needs to be completed but this must be
subject to finalizing a mutually beneficial transition arrangement to minimize
Avalon’s up-front exposure to the existing environmental liability.
• The start of operations is not anticipated to be subject to approvals under the
Canadian Environmental Assessment Act 2012 (CEAA) as the mine does not exceed

21
any of the CEAA triggers including mine and mill tonnages. The Project will not
have any new impacts to fish or fish habitat, nor will it impact on any Federal
Wildlife Areas or Migratory Bird Sanctuaries. Final Permitting and Approval for the
Project is therefore expected to be relatively short and simple.
1.19.2 Budget
The budget prepared by Avalon for the next phase of work to develop the East Kemptville
Project towards production is presented in Table 1.7 below.
Table 1.7
Budget for the Next Phase of Project Development
Proposed Work Estimated Cost
(CAD)
Drilling and Resources Update
Drilling Stockpile 250,000
Economic Study Update
Mini Pilot Plant Trial 100,000
Preliminary Engineering and detailed cost estimates 300,000
Updated economic study and NI 43-101 report 100,000
Environmental
General studies and permitting applications 100,000
Total Proposed Budget (all items) 850,000
Micon has reviewed Avalon’s budget for the next phase of work on the East Kemptville
Project and considers it to be reasonable.

22
2.0 INTRODUCTION
Micon International Limited (Micon) has been retained by Avalon Advanced Materials Inc.
(Avalon) to prepare a Technical Report under Canadian National Instrument (NI) 43-101
which discloses the results of the preliminary economic assessment (PEA) for the East
Kemptville Tin Project (East Kemptville Project), Yarmouth Co., Nova Scotia.
2.1 SCOPE OF THE REPORT
2.1.1 Mineral Resource Estimate
The mineral resource estimate on which this PEA is based is dated 7 May, 2018. This
resource estimate was prepared by Avalon and is considered not to be materially different
from the previous mineral resource by Hains Engineering Company Limited (Hains
Engineering), which is described in an Avalon press release dated 31 October, 2014.
The mineral resource estimates in this PEA have been prepared in accordance with the
requirements of Canadian securities laws, which differ from the requirements of United
States securities laws. Unless otherwise indicated, all mineral resource estimates included in
this PEA have been prepared following CIM Definition Standards in accordance with NI 43-
101. The NI 43-101 is a rule developed by the Canadian Securities Administrators which
establishes standards for all public disclosure an issuer makes of scientific and technical
information concerning mineral projects. No reserves have been determined.
Canadian standards, including NI 43-101, differ significantly from the requirements of the
United States Securities and Exchange Commission (the SEC), and reserve and resource
information contained in this Technical Report may not be comparable to similar information
disclosed by United States companies. In particular, and without limiting the generality of the
foregoing, the term “resource” does not equate to the term “reserve”. Under the SEC
standards, mineralization may not be classified as a “reserve” unless the determination has
been made that the mineralization could be economically and legally produced or extracted at
the time the reserve determination is made. The SEC’s disclosure standards normally do not
permit the inclusion of information concerning “measured mineral resources”, “indicated
mineral resources” or “inferred mineral resources” or other descriptions of the amount of
mineralization in mineral deposits that do not constitute “reserves” by United States
standards in documents filed with the SEC. United States investors should also understand
that “inferred mineral resources” have a great amount of uncertainty as to their existence and
as to their economic and legal feasibility. It cannot be assumed that all or any part of an
“inferred mineral resource” exists, is economically or legally mineable, or will ever be
upgraded to a higher category. Under Canadian rules, estimated “inferred mineral resources”
may not form the basis of feasibility or pre-feasibility studies. Disclosure of the amount of
minerals contained in a resource estimate is permitted disclosure under Canadian regulations;
however, the SEC normally only permits issuers to report mineralization that does not
constitute “reserves” by SEC standards as in-place tonnage and grade without reference to
unit measures. The requirements of NI 43-101 for identification of “reserves” are also not the

23
same as those of the SEC, and reserves reported by Avalon in compliance with NI 43-101
may not qualify as “reserves” under SEC standards. Accordingly, information concerning
mineral deposits set forth herein may not be comparable with information made public by
companies that report in accordance with United States standards.
2.1.2 Preliminary Economic Assessment
This PEA has been prepared by Micon under the terms of its agreement with Avalon. As
discussed in the relevant sections of the report, Micon has prepared a mine plan and
schedule, has reviewed the metallurgical testwork carried out on the property, the mineral
processing flowsheet, has reviewed infrastructure requirements, prepared capital and
operating cost estimates and an economic analysis of the Project.
Avalon owns the mineral rights to the East Kemptville Project and has been investigating
various conceptual re-development plans and economic assessments to evaluate the potential
for re-starting tin production at the mine.
Avalon initially investigated re-starting the East Kemptville tin mine in Nova Scotia based on
the concept of returning the Project to its previous scale of production processing 10,000
tonnes per day (t/d) of material to generate tin, copper and zinc concentrates. Once it became
apparent that the necessary capital for such an operation would likely prove difficult to
source, Avalon continued the study assuming only the mining and processing of mineral
resources contained within a low-grade stockpile and some shallow, relatively high-grade
zones close to the surface of the two existing pits (the Main Zone Pit and the Baby Zone Pit).
This new operation would target treating these plant feed sources at an annual rate of 806,000
tonnes to produce a tin concentrate only.
In addition to producing tin, the Project has expanded to include the key objective of
remediation of the existing site through the treatment and sub-aqueous deposition of the acid
generating Low Grade Stockpile and capping of the existing tailings facility with low
sulphide tailings generated by the processing plant. This has the significant benefit of
reducing the existing site environmental risk and long-term economic liability associated
with the Project. The mining of the high-grade mineralization ensures subaqueous deposition
of all tailings and waste rock as well as helps to ensure the economic return to incentivize
investors, government and the present surface rights owner to support the Project.
The capital and operating cost estimates were developed from first principles and generated a
production profile based on the mineralization available and metallurgical performance
indicators from various testwork programs. This data was consolidated into a cash flow
model which generated IRR and NPV figures used for assessing the likely economic viability
and performance of the Project.
This report documents the findings and economic evaluation of Avalon’s East Kemptville
Project.

24
2.2 QUALIFIED PERSONS AND SITE VISITS
The Qualified Persons for this Technical Report are the following:
• Richard Gowans, P.Eng.
• Christopher Jacobs, CEng., MIMMM
• Dayan Anderson, M.S., MMSA(QP).
• Jane Spooner, P.Geo.
• William Mercer P. Geo.
• Donald Hains P.Geo.
• Reid Smith. P.Geo.
2.2.1 Site Visits
Site visits have been carried out by the Qualified Person as follows:
William Mercer P. Geo. Various occasions during 2014-2016
Donald H. Hains, P.Geo. 23-25 July and 3 September, 2014.
2.3 USE OF REPORT
This report is intended to be used by Avalon subject to the terms and conditions of its
agreement with Micon. Subject to the authors’ consent, that agreement permits Avalon to file
this report as an NI 43-101 Technical Report on SEDAR (www.sedar.com) pursuant to
Canadian provincial securities legislation. Except for the purposes legislated under provincial
securities laws, any other use of this report, by any third party, is at that party’s sole risk.
The requirements of electronic document filing on SEDAR necessitate the submission of this
report as an unlocked, editable PDF (portable document format) file. Micon accepts no
responsibility for any changes made to the file after it leaves its control.
The conclusions and recommendations in this report reflect the authors’ best judgment in
light of the information available to them at the time of writing. The Authors have relied on
data available in published and unpublished reports, information supplied by the various
companies that have conducted exploration on the property, and information supplied
directly by Avalon. Micon has no reason to doubt its validity.
The authors and Micon reserve the right, but will not be obliged, to revise this report and
conclusions if additional information becomes known to them subsequent to the date of this
report. Use of this report acknowledges acceptance of the foregoing conditions.
Some of the figures and tables for this report were reproduced or derived from reports written
for Avalon and Rio Algom Ltd (RAL).

25
2.4 UNITS
Units in this PEA are in the Système International d’Unités (SI), unless otherwise noted.
Cost estimates and other inputs to the cash flow model for the Project have been prepared
using constant money terms, i.e., without provision for escalation or inflation. All costs are
presented in Canadian dollars (CAD) unless otherwise noted. Prices for metals are given in
United States dollars (USD) unless otherwise noted.
The CAD:USD exchange rate assumption of 1.3:1 has been used for cost estimates and the
financial analysis.
2.5 LIST OF ABBREVIATIONS
Table 2.1 provides a list of the abbreviations used in this report.
Table 2.1
List of Abbreviations
Abbreviation Term
° Degree(s)
°C Degree(s) Centigrade
°F Degree(s) Fahrenheit
< Less than
> Greater than
μm Micrometre(s) (micron = 0.001 mm)
% Percent, percentage
%RSD Percent relative standard deviation
A Ampere(s)
AA Atomic absorption
ABA Acid Base Accounting
Actlabs Activation Laboratories Ltd.
Ag Silver
ALS ALS Canada Ltd.
AMD Acid mine drainage
ANFO Ammonium Nitrate and Fuel Oil
As Arsenic
Avalon Avalon Advanced Material Inc.
B Billion
BMA Bulk mineral analysis
BQ Diamond drill core size 36.5 mm (inside diameter of core tube)
Btu British thermal units
C Carbon
ca. Circa, approximately
CAD Canadian dollar(s)
CAD/t Canadian dollars per tonne
CANMET CANMET Mining and Mineral Sciences Laboratories
CEAA Canadian Environmental Assessment Act
CDN CDN Resource Laboratories Limited
cfm Cubic feet per minute
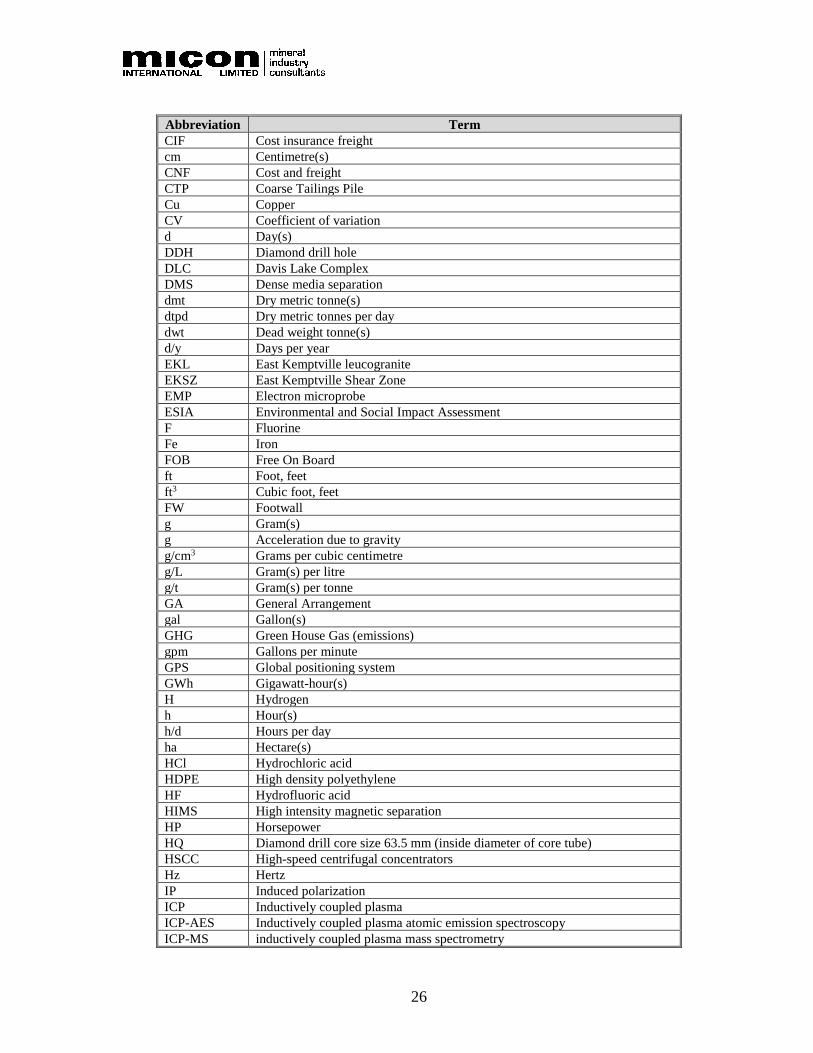
26
Abbreviation Term
CIF Cost insurance freight
cm Centimetre(s)
CNF Cost and freight
CTP Coarse Tailings Pile
Cu Copper
CV Coefficient of variation
d Day(s)
DDH Diamond drill hole
DLC Davis Lake Complex
DMS Dense media separation
dmt Dry metric tonne(s)
dtpd Dry metric tonnes per day
dwt Dead weight tonne(s)
d/y Days per year
EKL East Kemptville leucogranite
EKSZ East Kemptville Shear Zone
EMP Electron microprobe
ESIA Environmental and Social Impact Assessment
F Fluorine
Fe Iron
FOB Free On Board
ft Foot, feet
ft3 Cubic foot, feet
FW Footwall
g Gram(s)
g Acceleration due to gravity
g/cm3 Grams per cubic centimetre
g/L Gram(s) per litre
g/t Gram(s) per tonne
GA General Arrangement
gal Gallon(s)
GHG Green House Gas (emissions)
gpm Gallons per minute
GPS Global positioning system
GWh Gigawatt-hour(s)
H Hydrogen
h Hour(s)
h/d Hours per day
ha Hectare(s)
HCl Hydrochloric acid
HDPE High density polyethylene
HF Hydrofluoric acid
HIMS High intensity magnetic separation
HP Horsepower
HQ Diamond drill core size 63.5 mm (inside diameter of core tube)
HSCC High-speed centrifugal concentrators
Hz Hertz
IP Induced polarization
ICP Inductively coupled plasma
ICP-AES Inductively coupled plasma atomic emission spectroscopy
ICP-MS inductively coupled plasma mass spectrometry
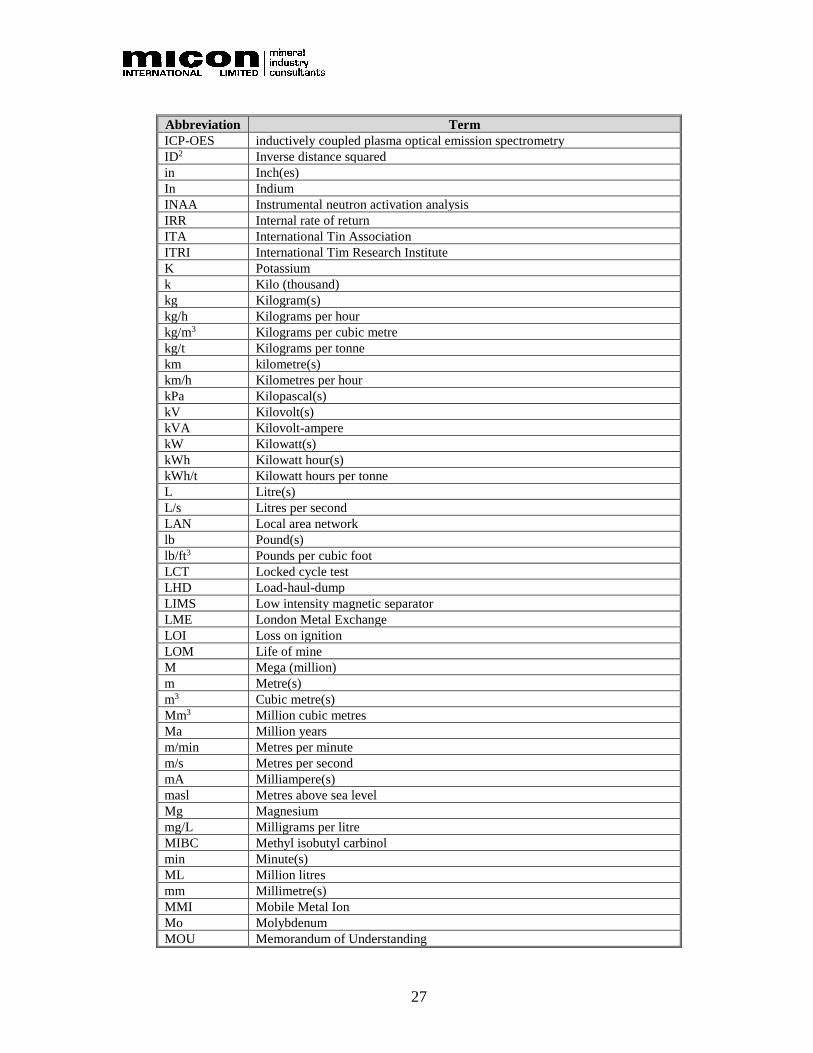
27
Abbreviation Term
ICP-OES inductively coupled plasma optical emission spectrometry
ID2 Inverse distance squared
in Inch(es)
In Indium
INAA Instrumental neutron activation analysis
IRR Internal rate of return
ITA International Tin Association
ITRI International Tim Research Institute
K Potassium
k Kilo (thousand)
kg Kilogram(s)
kg/h Kilograms per hour
kg/m3 Kilograms per cubic metre
kg/t Kilograms per tonne
km kilometre(s)
km/h Kilometres per hour
kPa Kilopascal(s)
kV Kilovolt(s)
kVA Kilovolt-ampere
kW Kilowatt(s)
kWh Kilowatt hour(s)
kWh/t Kilowatt hours per tonne
L Litre(s)
L/s Litres per second
LAN Local area network
lb Pound(s)
lb/ft3 Pounds per cubic foot
LCT Locked cycle test
LHD Load-haul-dump
LIMS Low intensity magnetic separator
LME London Metal Exchange
LOI Loss on ignition
LOM Life of mine
M Mega (million)
m Metre(s)
m3 Cubic metre(s)
Mm3 Million cubic metres
Ma Million years
m/min Metres per minute
m/s Metres per second
mA Milliampere(s)
masl Metres above sea level
Mg Magnesium
mg/L Milligrams per litre
MIBC Methyl isobutyl carbinol
min Minute(s)
ML Million litres
mm Millimetre(s)
MMI Mobile Metal Ion
Mo Molybdenum
MOU Memorandum of Understanding

28
Abbreviation Term
MPa Megapascal(s)
Mt Million tonnes
MW Megawatt(s)
MWh Megawatt hour(s)
n.a. Not applicable
Na Sodium
NAD North American Datum
NAG Net acid generating
NDB Non directional beacon
NGO Non-Government Organization
NI 43-101 Canadian National Instrument 43-101
NN Nearest neighbour
NPV Net present value
NTS National topographic system
NSDNR Nova Scotia Department of Natural Resources
NSR Net smelter return
NQ Diamond drill core size 47.6 mm (inside diameter of core tube)
ORE Ore Research & Exploration Pty Ltd.
oz Ounce(s)
PAG Potentially acid generating
P&ID Process and instrument diagram
Pa Pascal(s)
Pa.s Pascal-second
PAX Potassium amyl xanthate
Pb Lead
PMA Particle mineral analysis
ppb Parts per billion
ppm Parts per million
QA Quality assurance
QA/QC Quality assurance/quality control
QEMSCAN Quantitative Evaluation of Minerals by Scanning electron microscopy
QC Quality control
RAL Rio Algom Limited
RC Refining charge
RMA Reduced major axis
RNAV Random area navigation
ROM Run-of-mine
RQD Rock quality designation
RSD Relative standard deviation
s Second(s)
S Sulphur
SAG Semi-autogenous grind
Sb Antimony
SD Standard deviation
SEM Scanning electron microscope
SG Specific gravity
SI International system of units
Si Silicon
SIPX Sodium isopropyl xanthate
SMB South Mountain Batholith
Sn Tin
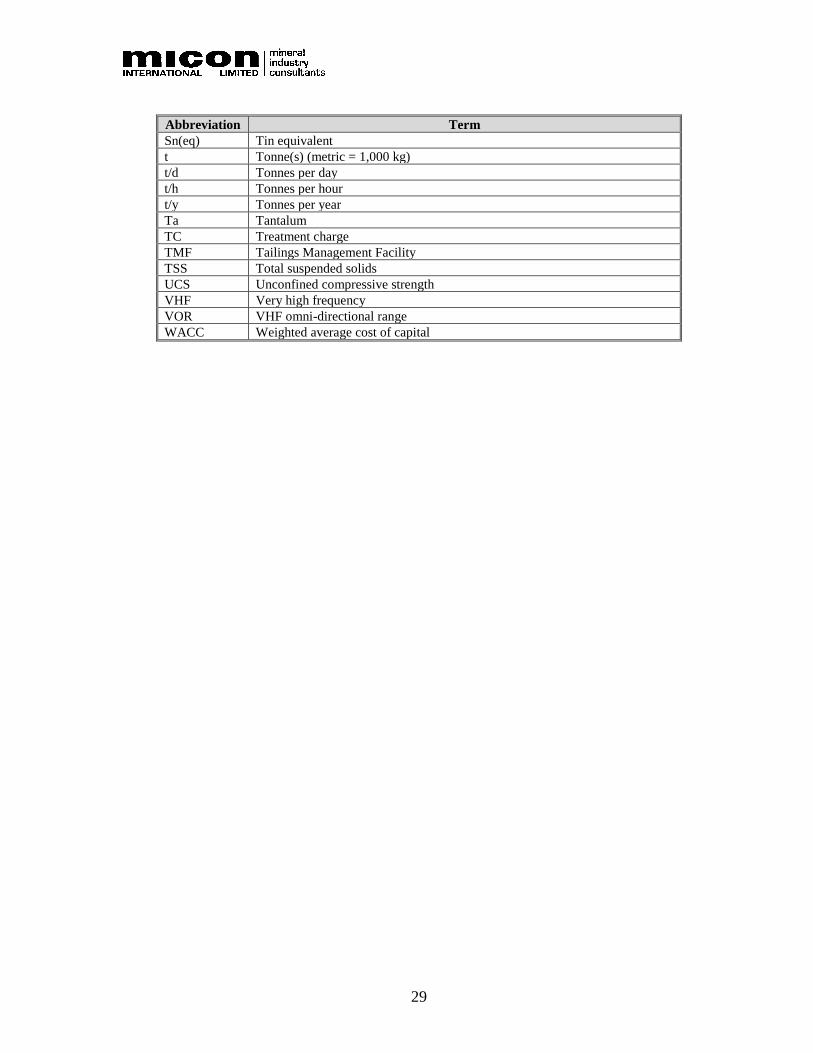
29
Abbreviation Term
Sn(eq) Tin equivalent
t Tonne(s) (metric = 1,000 kg)
t/d Tonnes per day
t/h Tonnes per hour
t/y Tonnes per year
Ta Tantalum
TC Treatment charge
TMF Tailings Management Facility
TSS Total suspended solids
UCS Unconfined compressive strength
VHF Very high frequency
VOR VHF omni-directional range
WACC Weighted average cost of capital
30
3.0 RELIANCE ON OTHER EXPERTS
Micon has reviewed and analyzed data provided by Avalon and its consultants and has drawn
its own conclusions therefrom. Micon has not carried out any independent exploration work,
drilled any holes or carried out any sampling and assaying on the property.
While exercising all reasonable diligence in checking, confirming, and testing it, Micon has
relied upon Avalon’s presentation of the Project data from previous operators and from
Avalon’s exploration experience at the East Kemptville Project in formulating its opinion.
Micon has not reviewed any of the documents or agreements under which Avalon holds title
to the East Kemptville Project or the underlying mineral concessions and Micon is not
qualified to comment as to the validity of the mineral titles claimed. A description of the
properties, and ownership thereof, is provided for general information purposes only. The
existing environmental conditions, liabilities and remediation have been described where
required by NI 43-101 regulations. These statements also are provided for information
purposes only and Micon is not qualified to comment in this regard.
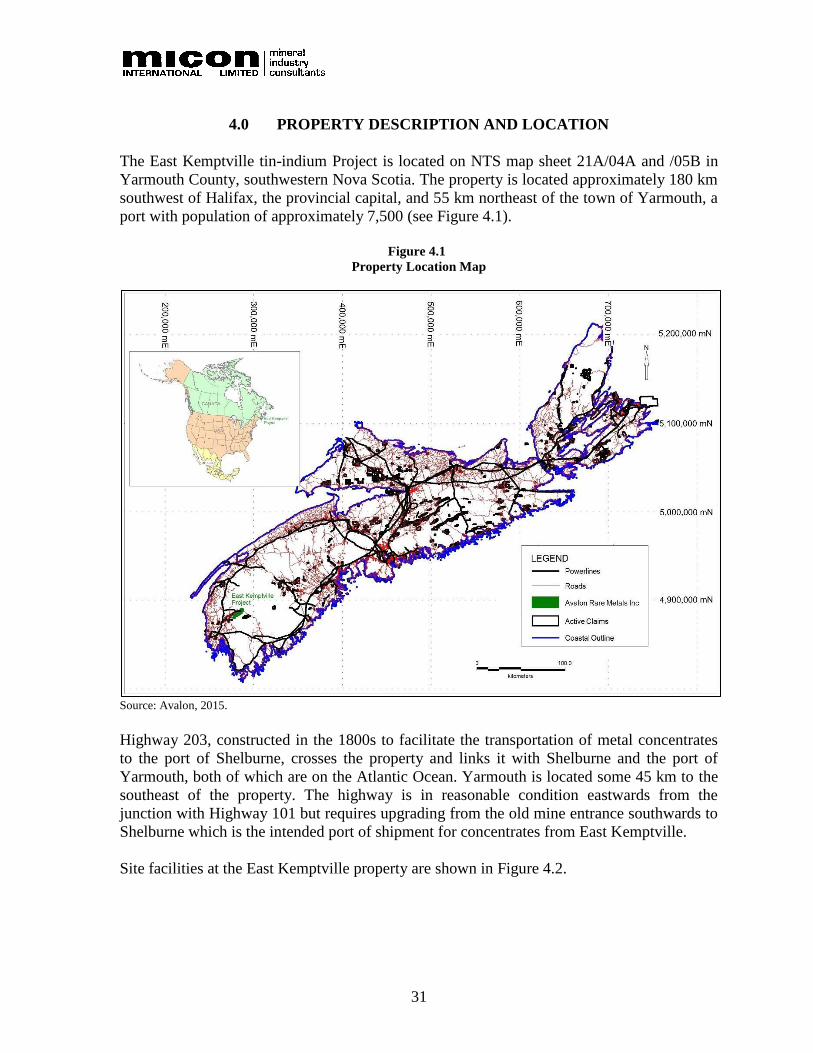
31
4.0 PROPERTY DESCRIPTION AND LOCATION
The East Kemptville tin-indium Project is located on NTS map sheet 21A/04A and /05B in
Yarmouth County, southwestern Nova Scotia. The property is located approximately 180 km
southwest of Halifax, the provincial capital, and 55 km northeast of the town of Yarmouth, a
port with population of approximately 7,500 (see Figure 4.1).
Figure 4.1
Property Location Map
Source: Avalon, 2015.
Highway 203, constructed in the 1800s to facilitate the transportation of metal concentrates
to the port of Shelburne, crosses the property and links it with Shelburne and the port of
Yarmouth, both of which are on the Atlantic Ocean. Yarmouth is located some 45 km to the
southeast of the property. The highway is in reasonable condition eastwards from the
junction with Highway 101 but requires upgrading from the old mine entrance southwards to
Shelburne which is the intended port of shipment for concentrates from East Kemptville.
Site facilities at the East Kemptville property are shown in Figure 4.2.

32
Figure 4.2
Site Facilities Map
Source: Stantec Report, 2016.
4.1 PROPERTY TENURE
Avalon holds a 100% interest in the property via Special Licence 50462, which combines
Special Licence 1/12 (now expired) and supersedes Application 40032. The area covered by
Special Licence 50462 includes the Closure Area represented by the former East Kemptville
Tin Mine property, which is currently under the management of RAL, the surface rights
holder.
Figure 4.3 shows the location of Special Licence 50462.

33
Figure 4.3
East Kemptville Property Claim Map
Source: Avalon, 2018.
The details of the claims within Special Licence 50462 are summarized in Table 4.1.
Table 4.1
East Kemptville Tin-Indium Project – Claims within Special Licence 50462
Map Number Tract
Number
Special Licence 50462
Claim Designation Units
21A/4A 81 M,N,O,P 4
21A/4A 82 A,B,C,E,F,G,H,J, K,L,M,N,O,P,Q 15
21A/4A 83 J,Q 2
21A/4A 86 A,B,G,H,J,K,P,Q 8
21A/4A 87 A to Q 16
21A/4A 88 A to Q 16
21A/4A 105 A,B,C,D,E 5
21A/4A 106 A,B,C,D 4
21A/4A 107 A,B 2
Total Claim Units 72
Ha 1,165.5
Acres 2,880
Except for claims 81M and 82A, B and C, the property is located on the site of a former tin
mine with existing closure and reclamation activities carried out by the private surface rights
owner. Given the closure and reclamation activities at the site, the lands were deemed
withdrawn by the Government of Nova Scotia and exploration rights permitted only by way
of a special licence or special lease granted by the Minister with the approval of the Governor

34
in Council in accordance with Section 22 of the Mineral Resources Act, SNS 1990, c 18 (the
East Kemptville Closure Area). The East Kemptville Closure Area is that property
withdrawn by the Government of Nova Scotia, with the boundaries clearly indicated on the
mineral licence maps of the government NOVAROC online map system.
Pursuant to Section 22 of the Mineral Resources Act, the mineral rights covering a portion of
the East Kemptville Closure Area were first acquired by Avalon (then Avalon Ventures Ltd.)
as Special Licence 1/06 dated 1 August, 2006 and approved by Order in Council on 21
September, 2006 (Special Licence 1/06). Special Licence 1/06 was for a three-year term
ending 31 July, 2009, with allowance for two subsequent renewals of one year each with the
approval of the Minister of Natural Resources. Special Licence 1/06 covered the area
described in NTS 21A4A, tracts 81, 82, 87, 88 for a total of 880 acres or 356 ha. Renewal
was contingent on Avalon undertaking work acceptable to the Minister. The work program
for Special Licence 1/06 totalled CAD2,250,000 to be completed by 31 July, 2009.
Due to time required to achieve agreement with RAL in order to gain access to the site,
Avalon was granted a renewed mineral licence from the Government of Nova Scotia in the
form of Special Licence 1/12 dated 14 December 2012. Special Licence 1/12 covered the
same area as Special Licence 1/06 and included the same expenditure requirements. Special
Licence 1/12 had a two-year term commencing 1 October, 2012 and ending 30 September,
2014. Due to extended access negotiations, the Government of Nova Scotia granted an
extension for submitting work statements to 1 November, 2014.
As of 24 April, 2015, the Government of Nova Scotia issued Special Licence 50462 to
Avalon covering the entire East Kemptville Closure Area. The new Special Licence is for a
term of three years, renewable twice for one year. While Avalon’s Special Licence 50462 is
active, the Mineral Resources Act provides protection against competing applications to
parties with active applications under consideration. (See Mineral Resources Act, Sections
22(6) which provides, “No application for a special licence shall be accepted for areas upon
which another application for a special licence is under consideration” and Section 30 which
provides, “No application for an exploration licence shall be accepted for areas that are
subject to an exploration licence, special licence, non-mineral registration, lease, special
lease or application for any of them, unless the applicant holds the mineral right or non-
mineral registration.”)
As of the date of this report, the Special Licence 50462 has been renewed by the Government
of Nova Scotia to 2 February 2019. Note that the pending application by Avalon for a
Mineral Lease in the same area is recorded on the official Nova Scotia claim maps online
system with the note of application SLE50804.
4.2 SURFACE RIGHTS AND ACCESS
The surface rights overlying Special Licence 50462 are a mix of private and Crown
ownership. A portion of the Crown lands have been leased to RAL. In order for Avalon to
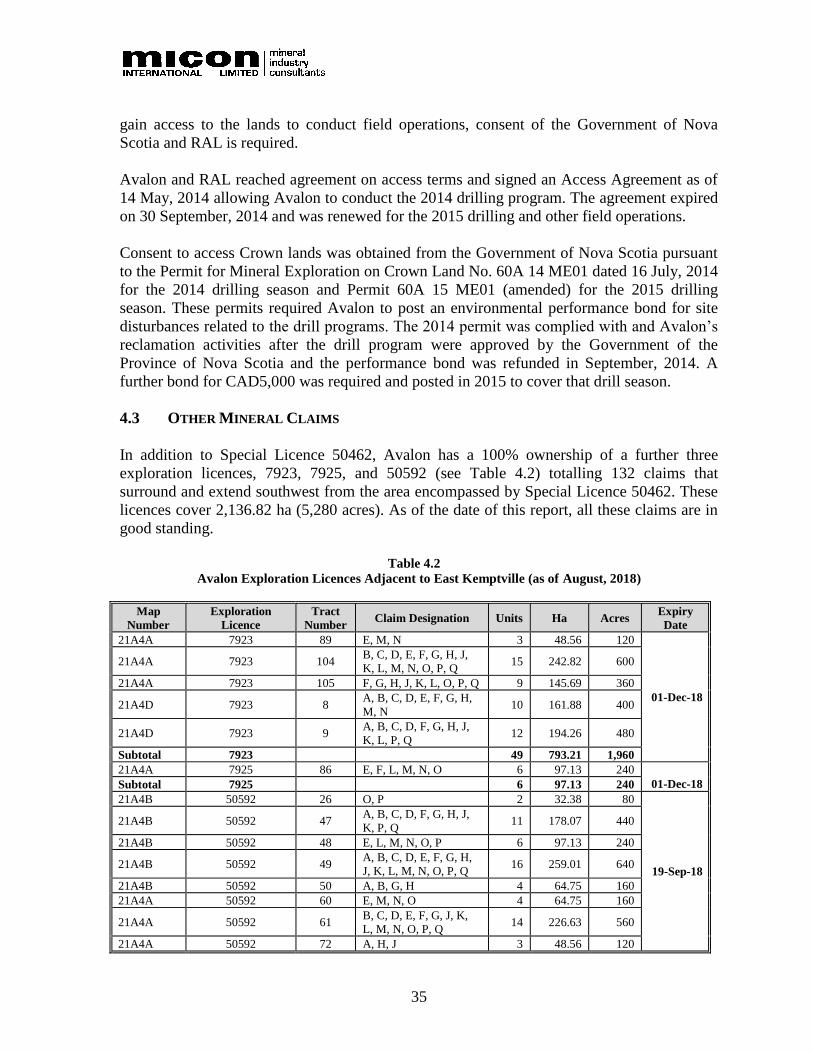
35
gain access to the lands to conduct field operations, consent of the Government of Nova
Scotia and RAL is required.
Avalon and RAL reached agreement on access terms and signed an Access Agreement as of
14 May, 2014 allowing Avalon to conduct the 2014 drilling program. The agreement expired
on 30 September, 2014 and was renewed for the 2015 drilling and other field operations.
Consent to access Crown lands was obtained from the Government of Nova Scotia pursuant
to the Permit for Mineral Exploration on Crown Land No. 60A 14 ME01 dated 16 July, 2014
for the 2014 drilling season and Permit 60A 15 ME01 (amended) for the 2015 drilling
season. These permits required Avalon to post an environmental performance bond for site
disturbances related to the drill programs. The 2014 permit was complied with and Avalon’s
reclamation activities after the drill program were approved by the Government of the
Province of Nova Scotia and the performance bond was refunded in September, 2014. A
further bond for CAD5,000 was required and posted in 2015 to cover that drill season.
4.3 OTHER MINERAL CLAIMS
In addition to Special Licence 50462, Avalon has a 100% ownership of a further three
exploration licences, 7923, 7925, and 50592 (see Table 4.2) totalling 132 claims that
surround and extend southwest from the area encompassed by Special Licence 50462. These
licences cover 2,136.82 ha (5,280 acres). As of the date of this report, all these claims are in
good standing.
Table 4.2
Avalon Exploration Licences Adjacent to East Kemptville (as of August, 2018)
Map
Number
Exploration
Licence
Tract
Number Claim Designation Units Ha Acres
Expiry
Date
21A4A 7923 89 E, M, N 3 48.56 120
01-Dec-18
21A4A 7923 104 B, C, D, E, F, G, H, J,
K, L, M, N, O, P, Q 15 242.82 600
21A4A 7923 105 F, G, H, J, K, L, O, P, Q 9 145.69 360
21A4D 7923 8 A, B, C, D, E, F, G, H,
M, N 10 161.88 400
21A4D 7923 9 A, B, C, D, F, G, H, J,
K, L, P, Q 12 194.26 480
Subtotal 7923 49 793.21 1,960
21A4A 7925 86 E, F, L, M, N, O 6 97.13 240
01-Dec-18 Subtotal 7925 6 97.13 240
21A4B 50592 26 O, P 2 32.38 80
19-Sep-18
21A4B 50592 47 A, B, C, D, F, G, H, J,
K, P, Q 11 178.07 440
21A4B 50592 48 E, L, M, N, O, P 6 97.13 240
21A4B 50592 49 A, B, C, D, E, F, G, H,
J, K, L, M, N, O, P, Q 16 259.01 640
21A4B 50592 50 A, B, G, H 4 64.75 160
21A4A 50592 60 E, M, N, O 4 64.75 160
21A4A 50592 61 B, C, D, E, F, G, J, K,
L, M, N, O, P, Q 14 226.63 560
21A4A 50592 72 A, H, J 3 48.56 120
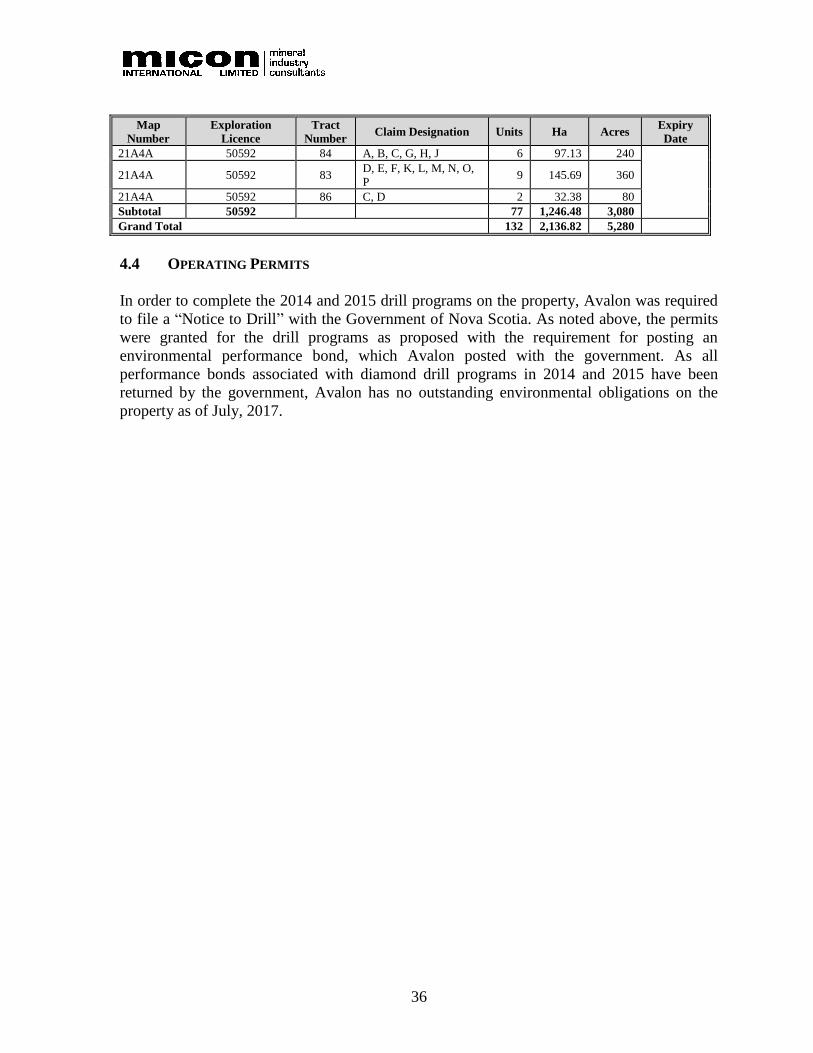
36
Map
Number
Exploration
Licence
Tract
Number Claim Designation Units Ha Acres
Expiry
Date
21A4A 50592 84 A, B, C, G, H, J 6 97.13 240
21A4A 50592 83 D, E, F, K, L, M, N, O,
P 9 145.69 360
21A4A 50592 86 C, D 2 32.38 80
Subtotal 50592 77 1,246.48 3,080
Grand Total 132 2,136.82 5,280
4.4 OPERATING PERMITS
In order to complete the 2014 and 2015 drill programs on the property, Avalon was required
to file a “Notice to Drill” with the Government of Nova Scotia. As noted above, the permits
were granted for the drill programs as proposed with the requirement for posting an
environmental performance bond, which Avalon posted with the government. As all
performance bonds associated with diamond drill programs in 2014 and 2015 have been
returned by the government, Avalon has no outstanding environmental obligations on the
property as of July, 2017.
37
5.0 ACCESSIBILITY, CLIMATE, LOCAL RESOURCES, INFRASTRUCTURE
AND PHYSIOGRAPHY
5.1 ACCESSIBILITY
The East Kemptville site is located 55 km by road east of the town of Yarmouth, Nova
Scotia, and accessed from Yarmouth via Nova Scotia paved Highways 340 to Carleton and
then 203 to the site. Yarmouth lies on Highways 103 and 101, approximately 300 km by road
from Halifax.
Highway 203 extends southeast to the town of Shelburne, where it connects to Highway 103
leading to Halifax and Yarmouth. When the East Kemptville mine was in operation, some
concentrates were taken by road to Shelburne, a distance of approximately 55 km, where the
concentrate was transferred to ships in Shelburne harbour. Shelburne harbour is among the
largest natural harbours in the world, being 10 nautical miles long, with depths ranging from
8 m at low tide to 14.6 m at high tide. The harbour is open year-round.
An existing air strip near Yarmouth can be used for access from outside the area and
discussions are underway regarding the possibility of re-introducing commercial flights to
Yarmouth to support the Project. It is classed as an international airport with customs and
immigration facilities. The airport has two asphalt-surface runways, one 5,000 ft (1,525 m)
long, the other 6,000 ft (1,830 m) long, and is capable of handling B737/A320 equivalent
aircraft.
5.2 CLIMATE
The nearest weather station to the East Kemptville site is Yarmouth. The climate may differ
somewhat as East Kemptville is about 55 km inland.
The Closure Plan for the mine site provides some details on climate. The text below is
derived from this and from the websites www.weatherspark.com and www.allmetstat.com
which publish a number of graphs of climatic variables. Records are available for the
Yarmouth Airport weather station over the course of an average year, based on historical
records from 1982 to 2012. The Closure Plan states:
“The regional climate is modified continental, resulting from marine interactions
with predominantly west to east continental air masses. Influxes of moist Atlantic
air may produce mild spells in winter and cool weather in summer. Measurable
precipitation days vary from about 160 near Yarmouth to about 100 to 120 days
inland. Snowfall accounts for about 13% of precipitation” (RAL, 1993).
Precipitation is seasonal with a winter maximum and late spring/early summer minimum
(See Figure 5.1). Annual total precipitation is in the 1,200 to 1,400 mm range. Median snow
cover duration varies from 100 days along the coast to 130 days inland. Based upon a small
period of record, the 24-hour rainfall amount for a 50-year storm is about 104 mm and for a
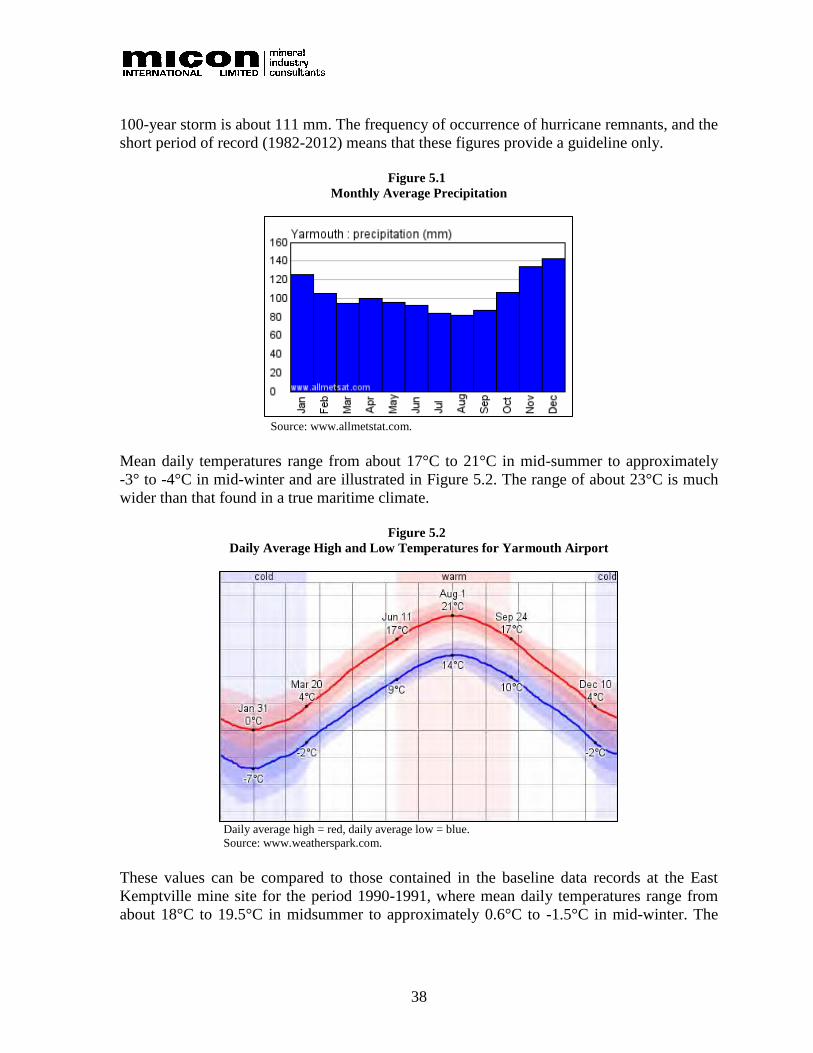
38
100-year storm is about 111 mm. The frequency of occurrence of hurricane remnants, and the
short period of record (1982-2012) means that these figures provide a guideline only.
Figure 5.1
Monthly Average Precipitation
Source: www.allmetstat.com.
Mean daily temperatures range from about 17°C to 21°C in mid-summer to approximately
-3° to -4°C in mid-winter and are illustrated in Figure 5.2. The range of about 23°C is much
wider than that found in a true maritime climate.
Figure 5.2
Daily Average High and Low Temperatures for Yarmouth Airport
Daily average high = red, daily average low = blue.
Source: www.weatherspark.com.
These values can be compared to those contained in the baseline data records at the East
Kemptville mine site for the period 1990-1991, where mean daily temperatures range from
about 18°C to 19.5°C in midsummer to approximately 0.6°C to -1.5°C in mid-winter. The

39
mean (50%) frost free period varies between 106 and 171 days and extends from about mid-
May through September (RAL, 1993).
Over the course of the year, typical wind speeds vary from 1 m/s to 9 m/s (light air to fresh
breeze), rarely exceeding 13 m/s (strong breeze) (See Figure 5.3). The highest average wind
speed of 6 m/s (moderate breeze) occurs around 18 January, at which time the average daily
maximum wind speed is 9 m/s (fresh breeze). The lowest average wind speed of 4 m/s
(gentle breeze) occurs around 9 August, at which time the average daily maximum wind
speed is 6 m/s (moderate breeze).
Figure 5.3
Average Daily Wind Speed with Percentile Bands for Yarmouth Airport
Minimum = red, Maximum = green, Average = black.
Inner Band from 25th to 75th percentile; outer band from 10th to 90th percentile.
Source: www.weatherspark.com.
Average wind directions indicate that winds from the north dominate in winter (55%) and
from the south in summer (60%). The wind is roughly 50% of the time from the east or west.
Exploration and mining operations may be carried out year-round.
5.3 LOCAL RESOURCES
The town of Yarmouth has basic requirements for operations and would be, along with
Shelburne, the likely location for employees to reside, as well as the rural areas and small
communities in between. Yarmouth had its highest population in 1961 at 8,636 and at present
is believed to be of the order of 6,700. The population has been dropping steadily in recent
years due to lack of economic opportunity.
40
The main economic activity of the community is lobster fishing though the Nova Scotia
government is attempting to promote tourism.
5.4 INFRASTRUCTURE
The Project site is well provided with infrastructure:
1. Power is available on site with a 69 kV power line served by Nova Scotia Power,
a subsidiary of Emera, which is a Nova Scotia-based electrical power utility listed
on the Toronto Stock Exchange. The substation remains intact but is not currently
online.
2. Gate house and administrative building in good condition.
3. A well-developed internal road network at the mine site.
4. Ample water supply is available, given the presence of rivers, lakes and rainfall.
Water will also be extracted from the 2 existing pits and recycled from the TMF.
5. The highway to the site is paved, but in poor condition, and would require
rebuilding for operations. Redevelopment of the mine operation is expected by
Avalon to be viewed favourably by the provincial government with respect to
rebuilding Highway 203.
6. There is no shortage of local housing, or land for housing, for employees.
7. Tailings facilities and ponds and related water pipelines and pumping
infrastructure remain in place and are in excellent condition.
8. Two lime silos and associated mixing and dosing equipment are on site. These
facilities are currently maintained for treatment of mine water runoff. One silo is
actively operated, while the second is on stand-by duty and operated on an as-
required basis.
9. The existing Tailings Management Facility (TMF) currently on-site was
originally designed for 60 million tonnes (Mt), but this includes most of the
tailings deposited above the water table where it is exposed to oxidation and the
generation of Acid Mine Drainage (AMD). The subaqueous capacity of the TMF,
allowing for a 1 m water cover to prevent oxidation, is 1.75 million m3 (2.7 Mt of
tailings). This is sufficient capacity for the first 3 years of the proposed operating
scenario.
5.5 PHYSIOGRAPHY
The topography of the immediate project area is subdued, with small hills with elevations
varying from 60 masl to 130 masl in the highest areas. The only water bodies within the
project area are man-made relating to the previous mining activities, being the pit lakes and
the tailings pond. The area is either covered in outcrop or glacial till, which locally averages
about 10 m thick.

41
The area was extensively glaciated, and the main Wisconsin ice advance over Nova Scotia
moved southerly and terminated at the edge of the continental shelf about 300 km south of
the present shoreline. During the retreat of the Wisconsin ice sheet, a secondary ice cap
developed over the area underlain by the South Mountain Batholith and produced a radial
flow outward in all directions away from this centre. In southwestern Nova Scotia, the
direction of ice movement varied from 120° to 170° (Kohlsmith, 1984).
Virtually the whole of the leased area is mantled with a layer of coarse sandy, stony till of
uneven thickness. Large surface boulders (erratics) are common in many areas with
concentrations occurring in eastern and southern portions of the study area. Detailed data on
till compositions are available from the geotechnical exploration drilling programs. In nearly
all instances, tills are composed of varying proportions of silty sand, sand, gravel, cobbles
and boulders. Concentrations of boulders and cobbles are generally greatest in surface layers
on upland sites where the differential erosion has removed finer materials. In extreme cases,
boulders comprised more than 50% of surface and near surface materials. Concentrations of
silty sands and sands are common in depressions and lowland sites where they are frequently
overlain by organic deposits (RAL, 1993).
5.6 VEGETATION
The Project site is within the Western Ecoregion of Nova Scotia (Ecological Land
Classification for Nova Scotia, Report DNR 2005). Within that classification, the dominant
landform is “hummocky terrain” as noted in Figure 5.4.
Forest stands of red spruce, hemlock and white pine are most prominent in the Western
Ecoregion and perhaps more so than anywhere else in the province. Stands of this distinctive
Maritime forest occur on the sandy and generally shallow soils of the ecoregion. Other
dominant trees include red oak and red pine. Pure stands of white pine can be found on the
drumlins, eskers and flutes of the barren lands. Although balsam fir occurs in most of the
forest types, its dominance within stands has been reduced by the damaging effects of the
balsam woolly adelgid (adelges piceae) a gout-causing forest pest introduced from Europe
circa 1910. Significant portions of the ecoregion are occupied by stunted forests of black
spruce on the bogs. Large tracts of red maple occur on other wetlands associated with the
western rivers.

42
Figure 5.4
Land Classification in the Project Area
Note: The tailings ponds appear on this government map, but not the pit lakes.
Source: Government of Nova Scotia, Department of Natural Resources. Ecological Land Classification Map of Nova Scotia,
online at www.gis4.natr.gov.ns.ca.
http://gis4.natr.gov.ns/ca/website/nselcmap/viewer.htm.
The explanation for the map is given at: http://novascotia.ca/natr/forestry/ecological/pdf/ELCrevised2.pdf.
43
6.0 HISTORY
Significant, greisen-style tin mineralization was discovered in granitic outcrop in the East
Kemptville area, in 1978, by Shell Canada Resources Limited (Shell) as a direct result of a
large follow-up regional geochemical till sampling program carried out in southwestern Nova
Scotia. This program was in part driven by the 1976 discovery of highly mineralized, meta-
sedimentary rocks in the Plymouth quarry some 20 km to the southeast by a group of local
prospectors led by Avard Hudgins and Merton Stewart, as well as from a subsequent airborne
radiometric survey released by the Geological Survey of Canada in 1977.
Shell initially drilled a total of 136 BQ diamond drill holes for a total of 12,450 m during the
period March, 1979 through August, 1980. Holes were mainly drilled on 50 m by 100 m
centres at -450 grid east (1,200) normal to the strike of the intrusive contact. A further 23
diamond drill holes totalling 1,840 m were drilled on 25 m centres in a 100 m by 100 m cell
in the centre of the deposit to test for grade continuity between existing holes. Subsequently,
an additional four diamond drill holes totalling 490 m were drilled as part of an underground
exploration and bulk sampling program conducted between September, 1980 and February,
1981.
Two shallow, surface trenches are also reported to have been sampled and mapped sometime
during the period 1979 to 1981. Shell reported non-compliant “drill indicated reserves” of
25.9 Mt and 30.0 Mt grading 0.21% tin in 1980, based on two different estimation methods
using the results from 87 diamond drill holes completed in 1979 (Wilson, 1980).
The south-central part of the deposit was also tested by 975 m of underground drifting during
the period from September, 1980 to February, 1981. The ramp access tested an area of
approximately 500 m by 350 m to a vertical depth of 50 m. A total of 31,600 t of material
was extracted as a bulk sample and four underground diamond drill holes totalling 490 m
were drilled for comparative purposes. (RAL, 1983).
Detailed, deposit-scale and regional exploration for similar deposit styles was also carried out
during the period 1979 to 1982 by Shell and several other major mining companies in the
area. Exploration work and limited drilling by Shell also led to the discovery of several
similar but smaller occurrences of greisen-style mineralization along the main
sediment/granite contact for a distance of approximately 20 km, as well as a significant,
sediment-hosted tin deposit at Duck Pond, which is located approximately 2 km to the
northwest of the East Kemptville deposit.
Historic resources for Duck Pond have been reported at 9 Mt grading 0.11% Sn (Kooiman,
1989). This resource estimate is historic and does not satisfy the requirements set out in
NI 43-101 and a Qualified Person has not completed sufficient work to classify the historic
estimate. Therefore, the estimate may not be relied upon and should be regarded as
conceptual in nature.

44
In 1982, the East Kemptville Deposit and surrounding claims were purchased from Shell by
Riocanex, the Canadian exploration arm of RAL. During the years 1982 to 1983, RAL
conducted a detailed due diligence of Shell’s work, which included the resurveying of all
possible surface diamond drill holes and re-assaying of several of Shell’s drill holes. RAL
also drilled a total of 15 HQ diameter holes totalling 1,305 m during 1983 in preparation for a
feasibility study and production decision also completed in 1983.
Table 6.1 gives the historic preproduction geological and “mineable ore reserves” reported
by RAL at the time of the feasibility study of 1983. These resources are shown solely for
historic context and are not current and should not be relied upon.
Table 6.1
Historic Preproduction Geological and Mineable Ore Reserves (1983)
Category
Geological Mineable
Tonnes Sn
(%)
Cut-off Grade
Sn (%) Tonnes
Sn
(%)
Cu
(%)
Zn
(%)
Strip
Ratio
Higher Grade Ore 40,193,951 0.194 0.12 40,800,000 0.185 0.11 0.18 1:1
Low Grade Ore 25,907,594 0.095 0.08 15,300,000 0.105
Total 66,101,545 0.155 56,100,000 0.163
Source: RAL, 1983.
Notes:
1. Resources are historic estimates. While viewed as reliable and relevant based on the information and methods used at
the time, they do not satisfy the requirements set out by NI 43-101. Sampling and assay methods used may have resulted
in understatement or overstatement of the grade and thus contained tin, copper and zinc. The extent of understatement or
overstatement is unknown.
2. No Qualified Person has undertaken sufficient work to classify the historical estimates as current resources or reserves.
3. Resource classification not in accordance with CIM standards.
4. Avalon is not treating the historical estimate as current resources.
5. Historic resource estimate based on cut-off grade of 0.08% Sn for “low-grade ore” and 0.12% Sn for “higher-grade ore”.
6. Estimate is a historic summary only. The Historical Resource should not be relied upon.
Open-pit operations at East Kemptville commenced in the fall of 1985 with a reported 17
years of production at a planned rate of 9,000 t/d of ore and 5,000 t/d of waste. Average
annual concentrate production was expected to be 3,700 t of a high-grade tin concentrate
grading 50% Sn; 8,600 t of low grade tin concentrate (21.4% Sn); 5,100 t of copper
concentrate (25% Cu) and 4,000 t of zinc concentrate (50% Zn).
Shortly after commencing production, the operation ran into serious problems related to the
recovery of tin by gravity methods. A dramatic price decline of approximately 50% for tin on
world markets in the fall of 1985 put added fiscal pressure on the operation. Late in 1986,
RAL announced the decision to end its financial obligations to the Project, and it was handed
over to the lenders that had financed it (NSDNR Annual Report Summaries). The operation
was re-purchased from the receiver by RAL and Rio Kemptville Tin Corporation took over
control of the Project shortly thereafter.
A compilation of various sources of information in the public domain suggests that the
operation was making headway in the last few years of operation with regard to
improvements in tin recoveries and head grades. However, due to the continued depressed
price of tin and the resultant low profit levels, operations were ceased in early 1992.
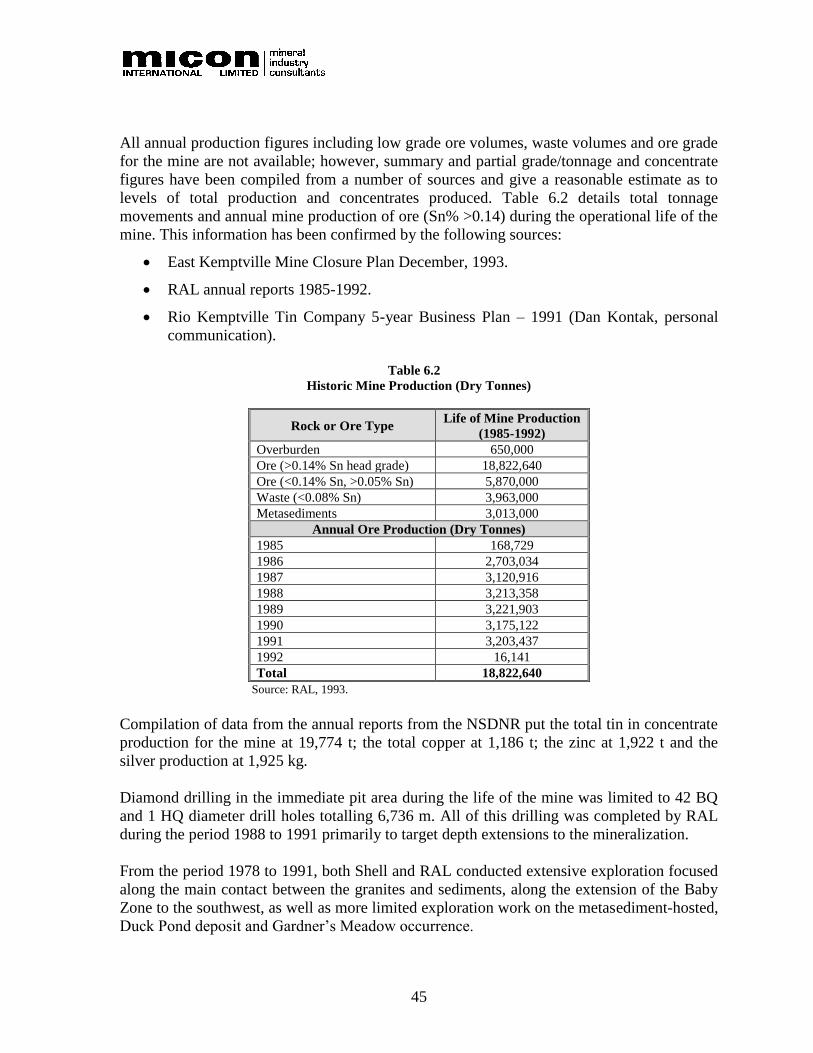
45
All annual production figures including low grade ore volumes, waste volumes and ore grade
for the mine are not available; however, summary and partial grade/tonnage and concentrate
figures have been compiled from a number of sources and give a reasonable estimate as to
levels of total production and concentrates produced. Table 6.2 details total tonnage
movements and annual mine production of ore (Sn% >0.14) during the operational life of the
mine. This information has been confirmed by the following sources:
• East Kemptville Mine Closure Plan December, 1993.
• RAL annual reports 1985-1992.
• Rio Kemptville Tin Company 5-year Business Plan – 1991 (Dan Kontak, personal
communication).
Table 6.2
Historic Mine Production (Dry Tonnes)
Rock or Ore Type Life of Mine Production
(1985-1992)
Overburden 650,000
Ore (>0.14% Sn head grade) 18,822,640
Ore (<0.14% Sn, >0.05% Sn) 5,870,000
Waste (<0.08% Sn) 3,963,000
Metasediments 3,013,000
Annual Ore Production (Dry Tonnes)
1985 168,729
1986 2,703,034
1987 3,120,916
1988 3,213,358
1989 3,221,903
1990 3,175,122
1991 3,203,437
1992 16,141
Total 18,822,640
Source: RAL, 1993.
Compilation of data from the annual reports from the NSDNR put the total tin in concentrate
production for the mine at 19,774 t; the total copper at 1,186 t; the zinc at 1,922 t and the
silver production at 1,925 kg.
Diamond drilling in the immediate pit area during the life of the mine was limited to 42 BQ
and 1 HQ diameter drill holes totalling 6,736 m. All of this drilling was completed by RAL
during the period 1988 to 1991 primarily to target depth extensions to the mineralization.
From the period 1978 to 1991, both Shell and RAL conducted extensive exploration focused
along the main contact between the granites and sediments, along the extension of the Baby
Zone to the southwest, as well as more limited exploration work on the metasediment-hosted,
Duck Pond deposit and Gardner’s Meadow occurrence.

46
In 2006, Avalon acquired the mineral tenure to the mine site under a Special Licence 50462
which is currently in the process of renewal by the Government of Nova Scotia (Avalon has
no reason to believe this will not be successfully completed). Subsequent compilation of
historical exploration data, and limited field work where access was possible, by Avalon
consultants over the last several years has indicated these areas are worthy of additional
follow-up work. Well-mineralized, thick intercepts from relatively isolated drill holes located
southwest of the Baby Zone at depth and in the Duck Pond area suggest further exploration
work might be warranted in these areas.
In May 2014, Avalon entered into an agreement with the surface rights holder to secure
access for an initial drilling program, and the agreement was extended to 2018 to allow for a
second drilling program to be completed in the summer of 2015. A further extension to this
agreement is currently being finalized
Avalon is currently assessing the economic viability of re-starting production on a relatively
small scale, through the processing of a low-grade stockpile and high-grade zones of the
Main and Baby Zone ore bodies (the subject of this report).
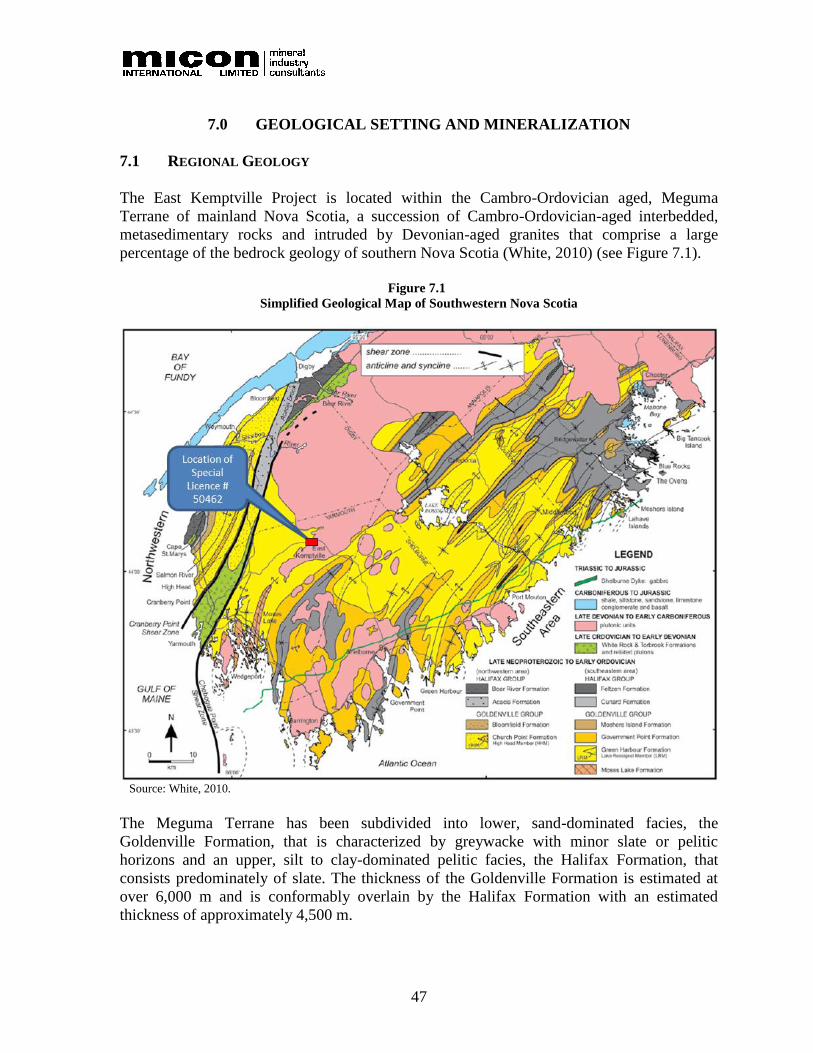
47
7.0 GEOLOGICAL SETTING AND MINERALIZATION
7.1 REGIONAL GEOLOGY
The East Kemptville Project is located within the Cambro-Ordovician aged, Meguma
Terrane of mainland Nova Scotia, a succession of Cambro-Ordovician-aged interbedded,
metasedimentary rocks and intruded by Devonian-aged granites that comprise a large
percentage of the bedrock geology of southern Nova Scotia (White, 2010) (see Figure 7.1).
Figure 7.1
Simplified Geological Map of Southwestern Nova Scotia
Source: White, 2010.
The Meguma Terrane has been subdivided into lower, sand-dominated facies, the
Goldenville Formation, that is characterized by greywacke with minor slate or pelitic
horizons and an upper, silt to clay-dominated pelitic facies, the Halifax Formation, that
consists predominately of slate. The thickness of the Goldenville Formation is estimated at
over 6,000 m and is conformably overlain by the Halifax Formation with an estimated
thickness of approximately 4,500 m.

48
These strata were subjected to a regional deformation event, the Early to Middle Devonian
Acadian Orogeny (ca. 410-380 Ma), associated with the docking or collision of the Meguma
Terrane with the Avalon Terrane of northern Nova Scotia and Newfoundland. The rocks of
the Meguma were subsequently folded into a series of long, northeast-trending, doubly
plunging folds with anticlinal wavelengths in the order of 1 to 5 km, regionally
metamorphosed from greenschist to amphibolite facies, and intruded by Middle to Late
Devonian peraluminous granitoids (ca. 370-380 Ma) and minor mafic intrusions.
The South Mountain Batholith (SMB) represents the largest of these granitoid intrusions in
western Nova Scotia and has been defined as a composite intrusion of older biotite
granodiorite and smaller, younger leucocratic intrusions of Devonian-Carboniferous age. It is
indicated on the geological map, Figure 7.1 as Late Devonian to Early Carboniferous
Intrusives. Many of the granite-related tin occurrences and deposits in the province, including
the East Kemptville tin deposit, appear to be related to the more evolved or specialized
phases of the SMB.
Five deformation events (D1 to D5) have been identified that have affected the Meguma
Group in Eastern Nova Scotia. These events are summarized by Ryan and Smith (1998) as
follows:
D1 – represented by early development of asymmetric step folds with
subhorizontal grain alignment cleavage. These are variably developed and often
difficult to determine due to later deformation.
D2 – related to the pervasive regional folding event with upright slatey cleavage
and pressure solution cleavage. This event is pre- to syn-regional metamorphism
and is responsible for the geometry of the regional map patterns.
D3 – coeval with 370 Ma granitoid plutonism and represented by rare folds and
development of a flat lying crenulation cleavage or biotite foliation that are
preferentially developed in the siltier lithologies.
D4 – associated with ductile shear zones, small folds, upright cleavage and
deformation of metamorphic porphyroblasts. Difficult to distinguish from fabrics
developed during the D2 event.
D5 – characterized by subhorizontal crenulation cleavage, thrust, normal, reverse
and strike-slip faults, kink bands and boudinage structures. These fabrics
generally appear to post-date gold mineralization, although exceptions to this have
been noted at several gold districts where late stage kink structures are
mineralized and where gold enrichment occurs along faults.
The structural fabric in southwestern Nova Scotia is characterized by a series of kilometre-
scale, northeast-trending shear zones that appear to post-date the regional metamorphism.
These shear zones are thought to have been partially to wholly re-set by thermal event such
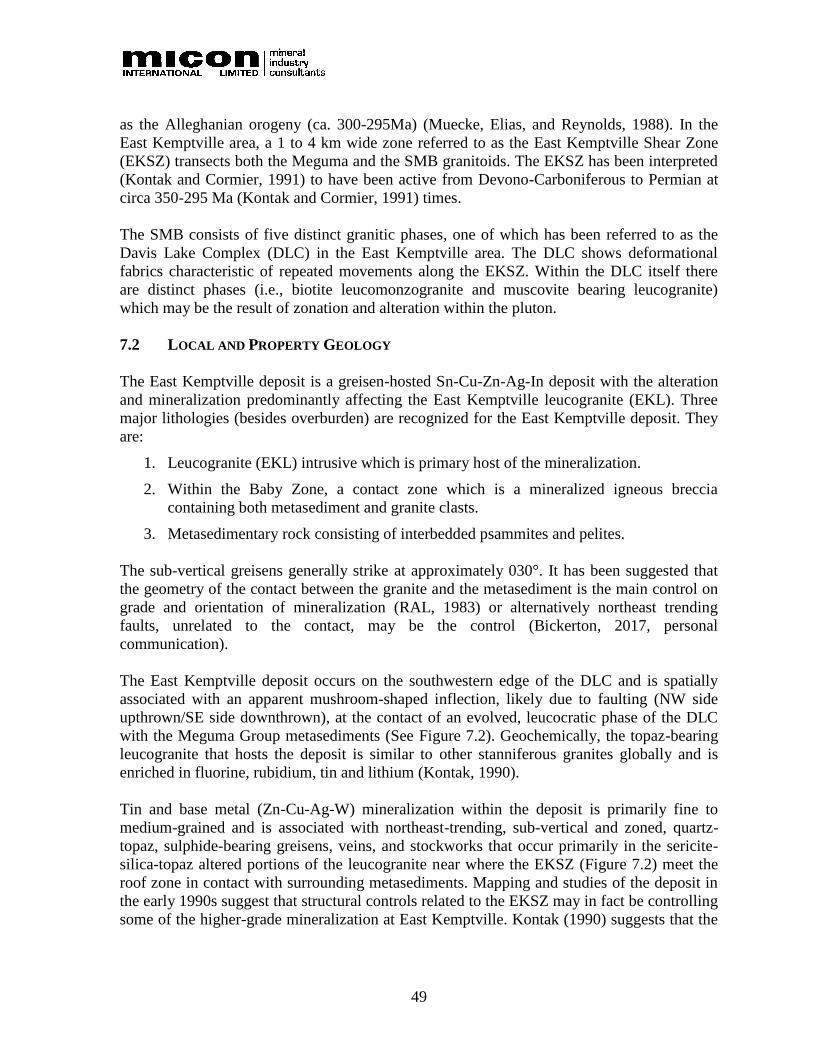
49
as the Alleghanian orogeny (ca. 300-295Ma) (Muecke, Elias, and Reynolds, 1988). In the
East Kemptville area, a 1 to 4 km wide zone referred to as the East Kemptville Shear Zone
(EKSZ) transects both the Meguma and the SMB granitoids. The EKSZ has been interpreted
(Kontak and Cormier, 1991) to have been active from Devono-Carboniferous to Permian at
circa 350-295 Ma (Kontak and Cormier, 1991) times.
The SMB consists of five distinct granitic phases, one of which has been referred to as the
Davis Lake Complex (DLC) in the East Kemptville area. The DLC shows deformational
fabrics characteristic of repeated movements along the EKSZ. Within the DLC itself there
are distinct phases (i.e., biotite leucomonzogranite and muscovite bearing leucogranite)
which may be the result of zonation and alteration within the pluton.
7.2 LOCAL AND PROPERTY GEOLOGY
The East Kemptville deposit is a greisen-hosted Sn-Cu-Zn-Ag-In deposit with the alteration
and mineralization predominantly affecting the East Kemptville leucogranite (EKL). Three
major lithologies (besides overburden) are recognized for the East Kemptville deposit. They
are:
1. Leucogranite (EKL) intrusive which is primary host of the mineralization.
2. Within the Baby Zone, a contact zone which is a mineralized igneous breccia
containing both metasediment and granite clasts.
3. Metasedimentary rock consisting of interbedded psammites and pelites.
The sub-vertical greisens generally strike at approximately 030°. It has been suggested that
the geometry of the contact between the granite and the metasediment is the main control on
grade and orientation of mineralization (RAL, 1983) or alternatively northeast trending
faults, unrelated to the contact, may be the control (Bickerton, 2017, personal
communication).
The East Kemptville deposit occurs on the southwestern edge of the DLC and is spatially
associated with an apparent mushroom-shaped inflection, likely due to faulting (NW side
upthrown/SE side downthrown), at the contact of an evolved, leucocratic phase of the DLC
with the Meguma Group metasediments (See Figure 7.2). Geochemically, the topaz-bearing
leucogranite that hosts the deposit is similar to other stanniferous granites globally and is
enriched in fluorine, rubidium, tin and lithium (Kontak, 1990).
Tin and base metal (Zn-Cu-Ag-W) mineralization within the deposit is primarily fine to
medium-grained and is associated with northeast-trending, sub-vertical and zoned, quartz-
topaz, sulphide-bearing greisens, veins, and stockworks that occur primarily in the sericite-
silica-topaz altered portions of the leucogranite near where the EKSZ (Figure 7.2) meet the
roof zone in contact with surrounding metasediments. Mapping and studies of the deposit in
the early 1990s suggest that structural controls related to the EKSZ may in fact be controlling
some of the higher-grade mineralization at East Kemptville. Kontak (1990) suggests that the
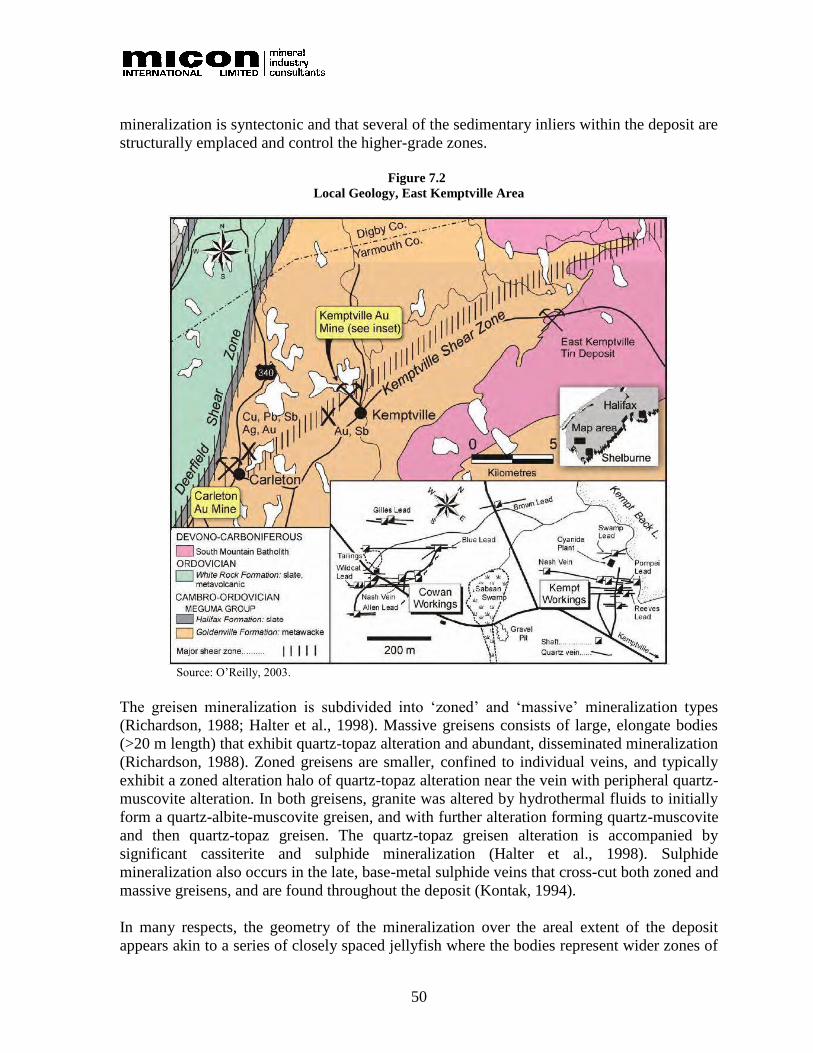
50
mineralization is syntectonic and that several of the sedimentary inliers within the deposit are
structurally emplaced and control the higher-grade zones.
Figure 7.2
Local Geology, East Kemptville Area
Source: O’Reilly, 2003.
The greisen mineralization is subdivided into ‘zoned’ and ‘massive’ mineralization types
(Richardson, 1988; Halter et al., 1998). Massive greisens consists of large, elongate bodies
(>20 m length) that exhibit quartz-topaz alteration and abundant, disseminated mineralization
(Richardson, 1988). Zoned greisens are smaller, confined to individual veins, and typically
exhibit a zoned alteration halo of quartz-topaz alteration near the vein with peripheral quartz-
muscovite alteration. In both greisens, granite was altered by hydrothermal fluids to initially
form a quartz-albite-muscovite greisen, and with further alteration forming quartz-muscovite
and then quartz-topaz greisen. The quartz-topaz greisen alteration is accompanied by
significant cassiterite and sulphide mineralization (Halter et al., 1998). Sulphide
mineralization also occurs in the late, base-metal sulphide veins that cross-cut both zoned and
massive greisens, and are found throughout the deposit (Kontak, 1994).
In many respects, the geometry of the mineralization over the areal extent of the deposit
appears akin to a series of closely spaced jellyfish where the bodies represent wider zones of

51
intense fracturing and coalescing greisens near the top of the intrusion and where the
tentacles represent narrower, higher-grade feeders or root zones as described by Kooiman
(1969) and other RAL geologists in the latter years of the previous mining operation. A
structural control on the emplacement of the mineralization may help explain why some
thicker (20-40 m) portions of the deposit occur at greater depths and why some thinner zones
(2-5 m) occur at higher levels (i.e., northern portion of Main Pit). In general, the zones below
the current pit appear to be thinning and are of higher grade, as noted from limited, deeper
drilling completed on the deposit in 1989.
The overall gross dimensions of the original potential economic mineralization at the Main
and Baby Zones based on a cut-off grade of approximately 0.05% Sn are in the order of
1,500 m long, 350 m wide and 75 m to 150 m deep. Most of this volume is represented by
the larger, Main Zone, which has been further subdivided into three subzones termed the
Western Flank and South and North Extension Zones (see Figure 7.3). The smaller and
discrete Baby Zone occurs a few hundred metres southwest of the Main Zone within what is
believed to be a structurally controlled, satellite intrusion (see Figure 7.4). The intrusion
hosting the Baby Zone is in the order of 250 m long and 50 m to 75 m wide, but may be
continuous with that of the Main Zone at depth through the South Extension Zone. There are
on-going academic arguments regarding the presence of one or of more than one distinct
phase of intrusive which may or may not be important for mineral exploration purposes.
Figure 7.3
Geological Plan of East Kemptville Deposit at 94-m Elevation
Note: This figure is historical and refers to “ore” zones. The terminology is not compliant with NI 43-101.
Source: Kontak and Dostal, 1992.
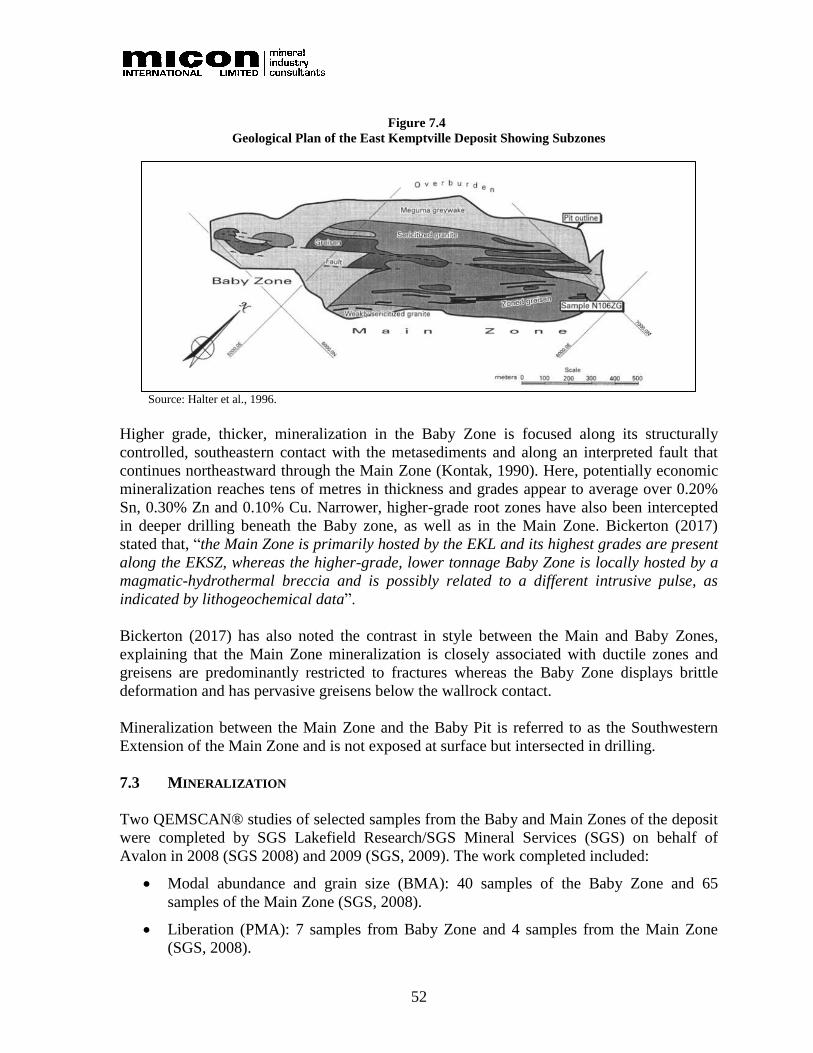
52
Figure 7.4
Geological Plan of the East Kemptville Deposit Showing Subzones
Source: Halter et al., 1996.
Higher grade, thicker, mineralization in the Baby Zone is focused along its structurally
controlled, southeastern contact with the metasediments and along an interpreted fault that
continues northeastward through the Main Zone (Kontak, 1990). Here, potentially economic
mineralization reaches tens of metres in thickness and grades appear to average over 0.20%
Sn, 0.30% Zn and 0.10% Cu. Narrower, higher-grade root zones have also been intercepted
in deeper drilling beneath the Baby zone, as well as in the Main Zone. Bickerton (2017)
stated that, “the Main Zone is primarily hosted by the EKL and its highest grades are present
along the EKSZ, whereas the higher-grade, lower tonnage Baby Zone is locally hosted by a
magmatic-hydrothermal breccia and is possibly related to a different intrusive pulse, as
indicated by lithogeochemical data”.
Bickerton (2017) has also noted the contrast in style between the Main and Baby Zones,
explaining that the Main Zone mineralization is closely associated with ductile zones and
greisens are predominantly restricted to fractures whereas the Baby Zone displays brittle
deformation and has pervasive greisens below the wallrock contact.
Mineralization between the Main Zone and the Baby Pit is referred to as the Southwestern
Extension of the Main Zone and is not exposed at surface but intersected in drilling.
7.3 MINERALIZATION
Two QEMSCAN® studies of selected samples from the Baby and Main Zones of the deposit
were completed by SGS Lakefield Research/SGS Mineral Services (SGS) on behalf of
Avalon in 2008 (SGS 2008) and 2009 (SGS, 2009). The work completed included:
• Modal abundance and grain size (BMA): 40 samples of the Baby Zone and 65
samples of the Main Zone (SGS, 2008).
• Liberation (PMA): 7 samples from Baby Zone and 4 samples from the Main Zone
(SGS, 2008).
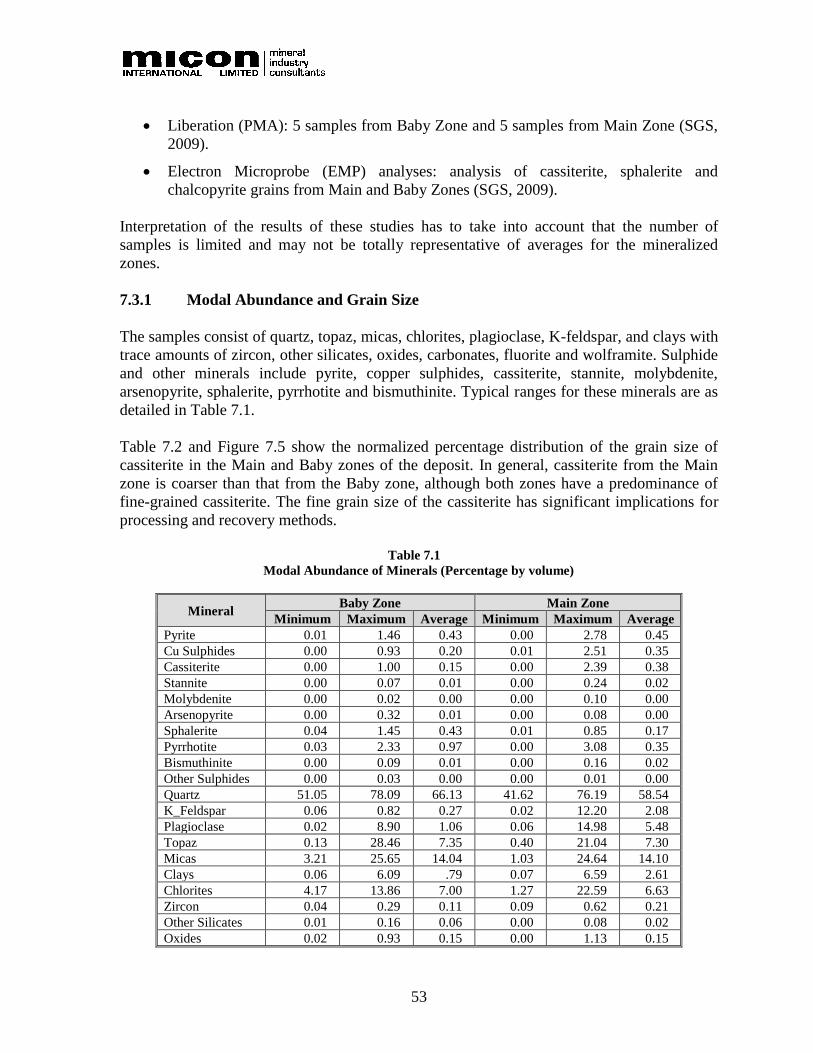
53
• Liberation (PMA): 5 samples from Baby Zone and 5 samples from Main Zone (SGS,
2009).
• Electron Microprobe (EMP) analyses: analysis of cassiterite, sphalerite and
chalcopyrite grains from Main and Baby Zones (SGS, 2009).
Interpretation of the results of these studies has to take into account that the number of
samples is limited and may not be totally representative of averages for the mineralized
zones.
7.3.1 Modal Abundance and Grain Size
The samples consist of quartz, topaz, micas, chlorites, plagioclase, K-feldspar, and clays with
trace amounts of zircon, other silicates, oxides, carbonates, fluorite and wolframite. Sulphide
and other minerals include pyrite, copper sulphides, cassiterite, stannite, molybdenite,
arsenopyrite, sphalerite, pyrrhotite and bismuthinite. Typical ranges for these minerals are as
detailed in Table 7.1.
Table 7.2 and Figure 7.5 show the normalized percentage distribution of the grain size of
cassiterite in the Main and Baby zones of the deposit. In general, cassiterite from the Main
zone is coarser than that from the Baby zone, although both zones have a predominance of
fine-grained cassiterite. The fine grain size of the cassiterite has significant implications for
processing and recovery methods.
Table 7.1
Modal Abundance of Minerals (Percentage by volume)
Mineral Baby Zone Main Zone
Minimum Maximum Average Minimum Maximum Average
Pyrite 0.01 1.46 0.43 0.00 2.78 0.45
Cu Sulphides 0.00 0.93 0.20 0.01 2.51 0.35
Cassiterite 0.00 1.00 0.15 0.00 2.39 0.38
Stannite 0.00 0.07 0.01 0.00 0.24 0.02
Molybdenite 0.00 0.02 0.00 0.00 0.10 0.00
Arsenopyrite 0.00 0.32 0.01 0.00 0.08 0.00
Sphalerite 0.04 1.45 0.43 0.01 0.85 0.17
Pyrrhotite 0.03 2.33 0.97 0.00 3.08 0.35
Bismuthinite 0.00 0.09 0.01 0.00 0.16 0.02
Other Sulphides 0.00 0.03 0.00 0.00 0.01 0.00
Quartz 51.05 78.09 66.13 41.62 76.19 58.54
K_Feldspar 0.06 0.82 0.27 0.02 12.20 2.08
Plagioclase 0.02 8.90 1.06 0.06 14.98 5.48
Topaz 0.13 28.46 7.35 0.40 21.04 7.30
Micas 3.21 25.65 14.04 1.03 24.64 14.10
Clays 0.06 6.09 .79 0.07 6.59 2.61
Chlorites 4.17 13.86 7.00 1.27 22.59 6.63
Zircon 0.04 0.29 0.11 0.09 0.62 0.21
Other Silicates 0.01 0.16 0.06 0.00 0.08 0.02
Oxides 0.02 0.93 0.15 0.00 1.13 0.15
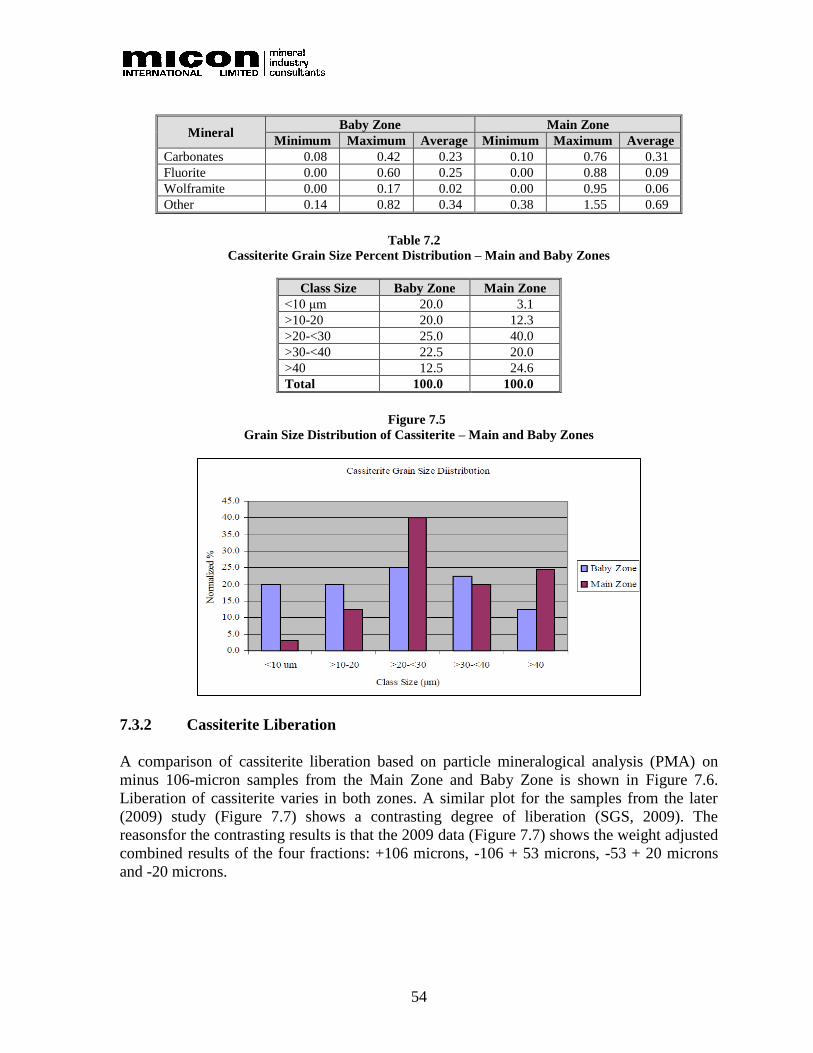
54
Mineral Baby Zone Main Zone
Minimum Maximum Average Minimum Maximum Average
Carbonates 0.08 0.42 0.23 0.10 0.76 0.31
Fluorite 0.00 0.60 0.25 0.00 0.88 0.09
Wolframite 0.00 0.17 0.02 0.00 0.95 0.06
Other 0.14 0.82 0.34 0.38 1.55 0.69
Table 7.2
Cassiterite Grain Size Percent Distribution – Main and Baby Zones
Class Size Baby Zone Main Zone
<10 μm 20.0 3.1
>10-20 20.0 12.3
>20-<30 25.0 40.0
>30-<40 22.5 20.0
>40 12.5 24.6
Total 100.0 100.0
Figure 7.5
Grain Size Distribution of Cassiterite – Main and Baby Zones
7.3.2 Cassiterite Liberation
A comparison of cassiterite liberation based on particle mineralogical analysis (PMA) on
minus 106-micron samples from the Main Zone and Baby Zone is shown in Figure 7.6.
Liberation of cassiterite varies in both zones. A similar plot for the samples from the later
(2009) study (Figure 7.7) shows a contrasting degree of liberation (SGS, 2009). The
reasonsfor the contrasting results is that the 2009 data (Figure 7.7) shows the weight adjusted
combined results of the four fractions: +106 microns, -106 + 53 microns, -53 + 20 microns
and -20 microns.

55
Figure 7.6
2008 Cassiterite Liberation (PMA Analysis) Main and Baby Zones
Note: Samples 335, 304, 265, 267, 336 and 296 from Baby Zone; 305, 482, 500, 540 from Main Zone. Source: SGS, 2008.
Figure 7.7
2009 Cassiterite Liberation (PMA Analysis) Main and Baby Zones
Note: Samples 217, 327, 004, 268 and 295 from Baby Zone; 518, 489, 563, 622, 578 from Main Zone. Source: SGS, 2009.
56
Tin Deportment: Based on the modal abundance of the minerals and their tin content, it is
shown that cassiterite accounts for most of the tin in the samples (average 92.73%), whereas
stannite accounts for the remainder.
Zinc Deportment: Zinc is primarily found as sphalerite, with some enrichment in the Baby
Zone compared to the Main Zone. The average modal abundance in the Baby Zone is 0.43%
and that in the Main Zone 0.17%. It is noted that indium is associated with the sphalerite.
Microprobe analyses by SGS (SGS, 2009) indicate an average indium content of 0.25% in
sphalerite, but only 0.08% in chalcopyrite and below detection limit in cassiterite. More
recent work by Jason Wilson (MSc Thesis, in progress) has reinforced these conclusions.
Copper Deportment: Copper is primarily present as chalcopyrite and a small portion in
stannite. Other copper sulphide minerals such as bornite are present as trace quantities. The
average modal abundance in the Baby Zone is reported as 0.20% while that for the Main
Zone is reported as 0.35%.
7.3.3 Mineralogical Summary
Overall, the mineralogy of the deposit, as represented by the limited number of samples
examined to date, can be summarized as follows (bearing in mind that these conclusions are
reflecting information from a limited number of samples):
1. The mineralogy of the deposit consists mainly of similar contents of quartz, micas,
feldspars, topaz and chlorites, although minor variations are noted in each group and
between the Baby and Main Zones.
2. For the samples subjected to QEMSCAN® analysis, the average cassiterite content is
higher in the Main Zone than in the Baby Zone (0.38% and 0.15% respectively), that
of sphalerite is higher in the Baby Zone (0.43%) than that in the Main Zone (0.17%).
The difference between these quantities and the actual metal grades in the deposit
indicates that the QEMSCAN® samples are not totally representative of the contents
in the Main and Baby Zones.
3. Cassiterite from the Main Zone is coarser than that from the Baby Zone. In the Baby
Zone, approximately 40% of cassiterite is less than 20 µm, 47.5% is between 20 and
40 µm and only 12.5% is greater than 40 µm. In the Main Zone, the size distributions
are 15.4%, 50% and 24.6%, respectively. Again, the small sample number should
temper overall conclusions from this information.
4. The modal abundance and grain size of the minerals, as calculated using both the bulk
mineral analysis (BMA) and PMA methods, are indicative of the limited variability of
the minerals. However, analyses should be done on at least three or four size fractions
for better determination of the modal abundance especially for the minor constituents
in the samples, e.g., sphalerite, cassiterite.
5. Liberation and association of the minerals must be calculated based on size fractions
and not on single samples/fractions.

57
6. Quartz seems to correlate well with plagioclase, potassium-feldspars and clays in the
Main Zone, but poorly in the Baby Zone. Quartz and topaz show a generally poor
correlation and partial overlapping. Copper sulphides versus sphalerite, cassiterite and
topaz, as well as sphalerite versus cassiterite; also show a scatter, a partial overlap and
a poor correlation. There is higher cassiterite content in the Main Zone and higher
sphalerite in the Baby Zone. An overall positive correlation between quartz and the
total amount of all sulphides is noted for both zones.
58
8.0 DEPOSIT TYPES
Tin deposit classification has been discussed by Taylor (1979) with reference to the
classifications of Smirnov in Russia and Hosking in the United Kingdom. Taylor suggests a
group of deposits termed “Deposits associated with passive and/or batholithic magmatic
environments”, and states that “this is the greisen association” or Erzgebirge style. This type
of deposit is dominated in economic terms by massive greisen zones and quartz vein systems.
It is suggested that this is the deposit type to which the East Kemptville deposit belongs.

59
9.0 EXPLORATION
Historical exploration on the Project is described in Section 6.0.
Prior to the 2014 and 2015 drill programs, exploration by Avalon has been limited to regional
reconnaissance, geochemical sampling and limited diamond drilling on the exploration
licences outside of the Special Licence area. The 2014 and 2015 drill programs are described
in more detail in Section 10.0 of this report.
In 2009-2010, Avalon conducted a program of geochemical Mobile Metal Ion (MMI),
induced polarization (IP) and gravity surveys on exploration Licences 07179, 08186 and
08720 in the Gardener’s Meadows area approximately 6 to 7 km to the southwest of the East
Kemptville mine area. The results of the work suggested the potential for a concealed granite
cupola that may be responsible for the narrow, high-grade tin zones intersected from limited
historical drilling and trenching. The geochemical and geophysical work identified an
anomalous zone which was followed up by a six-hole NQ diamond drill program. Results of
the drill program indicated the presence of several, narrow 0.10 m to 3.00 m zones of
subeconomic polymetallic Sn-Zn-Cu-Ag-In grades associated with weakly developed zones
of quartz-sulphide veining and alteration of the metasediments. No definitive evidence of a
buried granite cupola was seen in the drill core.
Nevertheless, follow-up work consisting of in-fill drilling and additional multi-element
geochemistry and IP geophysical work to identify possible vectors to wider, better
mineralized zones of economic mineralization was recommended (Hudgtech, 2010).
The East Kemptville tin deposit is regarded as a brownfields exploration project. In certain
respects, it can also be considered as an advanced exploration project. However, considerable
work remains to be done to more fully define the economic potential of the remaining
resources in the original deposit, the potential for delineating additional resources, and the
costs associated with advancing the Project to a production decision.
9.1 EXPLORATION POTENTIAL
Exploration potential on the property is focused on following areas:
1. South and west of the Baby Pit, including the area referred to historically as the South
Grid.
2. East of the Main Pit.
3. The Duck Pond area, north of the existing tailings ponds.
There are intercepts of tin mineralization reported in drill holes southwest of the Baby Zone
in an area referred to in historic reports as the “South Grid Zone”. This “zone” consists of
two holes separated by 200 m with significant tin intercepts at a depth of about 90 m below
the surface. Drill hole 90-010 has 34.3 m at 0.17% Sn and 90-008 has 33.0 m at 0.31% Sn,
both in the granite. These intercepts are 1 km south along strike from the Main Pit

60
mineralization and 700 m south of the Baby Pit mineralization. The mineralization is
reportedly within granite.
The Main Zone appears to be open to the southeast and east. As a result, some of the 2015
drilling was in this area (see Section 10.0).
The Duck Pond deposit, located approximately 2 km west of the East Kemptville mine site,
was drilled by Shell in 1980 (nine holes) and RAL in 1983/84 (seven holes). Avalon
completed 5 drill holes for 1,153 m as part of the 2015 drill program on the property and
described in more detail in Section 10.0.
The rocks in the Duck Pond deposit are interbedded argillites and greywackes in a transition
unit from the Goldenville Formation to the Halifax Formation. The argillites are reported as
fine-grained, chloritized and slatey. The coarser grained sandy argillites and silicified
sediments or greywackes are sericite-muscovite rich. Tin mineralization associated with
chloritic alteration, occurs in veinlets and as disseminated material in the silicified zones.
Sphalerite, chalcopyrite and bornite are also present. Mineralization is reportedly present in
two zones over a strike length of 750 m, open to the northeast, southwest and at depth. The
Duck Pond Zone is underlain by a strong airborne magnetic anomaly, partially coincident
with and extending beyond the known mineralization. It is possible that this magnetic
anomaly is caused by an intrusive at depth which was the source of the mineralizing fluids.
This suggests potential for tin-zinc mineralization at depth.
61
10.0 DRILLING
Historic drilling on the property by Shell and RAL is described in Section 6.0.
10.1 2014 AVALON DRILLING PROGRAM
The purpose of Avalon’s 2014 drill program was to investigate mineralization between the
Main Zone Pit and Baby Pit, referred to as the Southwestern Extension of the Main Zone,
and at depth and to twin some selected historic holes as part of a due diligence program to
validate the historical drill results. The drill program confirmed mineralization outlined by
historical drilling.
Avalon completed an in-fill/twin hole program consisting of seven HQ diamond drill holes
totalling 986 m in 2014, as summarized in Table 10.1. Four of the holes twinned historical
drill holes while two targeted higher-grade mineralization underneath the Baby Pit. One drill
hole targeted higher-grade mineralization between the Main and Baby Pits.
The seven HQ diamond drill holes were completed on Special Licence 1/12 by Logan
Drilling Group International from July to September, 2014 in order to confirm tin and
polymetallic zinc-copper mineralization. Core recovery for the seven holes was close to
100%.
Holes were spotted using a handheld Garmin GPSmap 60Cx and, upon completion, were
cemented into bedrock from top to bottom where possible. Downhole surveys were
performed on all holes using the Reflex system. Coordinates in NAD27 and NAD83/Zone 20
for each hole were established upon completion by Scotia Surveys Limited of Shelburne,
Nova Scotia, using a Topcon HiperLitr +GPS RTK system. All drill sites were cleaned upon
completion. The core is presently stored on the property at 3762 Highway 203, East
Kemptville which is owned by Avalon.
Table 10.1
Details of Drill Holes – 2014 Drill Program
Drill Hole Field Data Dates
Easting Northing Dip Azimuth Length Start date End date Days
EKAV-14-001 284,911.0 4,886,454.0 -45 120 147 22-Jul-14 01-Aug-14 10
EKAV-14-002 284,831.0 4,886,264.0 -65 300 159 02-Aug-14 12-Aug-14 10
EKAV-14-003 284,830.5 4,886,264.5 -45 300 148.1 13-Aug-14 20-Aug-14 7
EKAV-14-004 284,638.0 4,886,337.0 -45 120 166 21-Aug-14 30-Aug-14 9
EKAV-14-005 284,684.0 4,886,338.0 -45 120 145 31-Aug-14 03-Sep-14 3
EKAV-14-006 284,982.0 4,886,472.0 -83 120 113 05-Sep-14 09-Sep-14 4
EKAV-14-007 284,982.0 4,886,472.0 -45 120 106 09-Sep-14 12-Sep-14 3
Locations of drill holes in this program are shown in Figure 10.1.
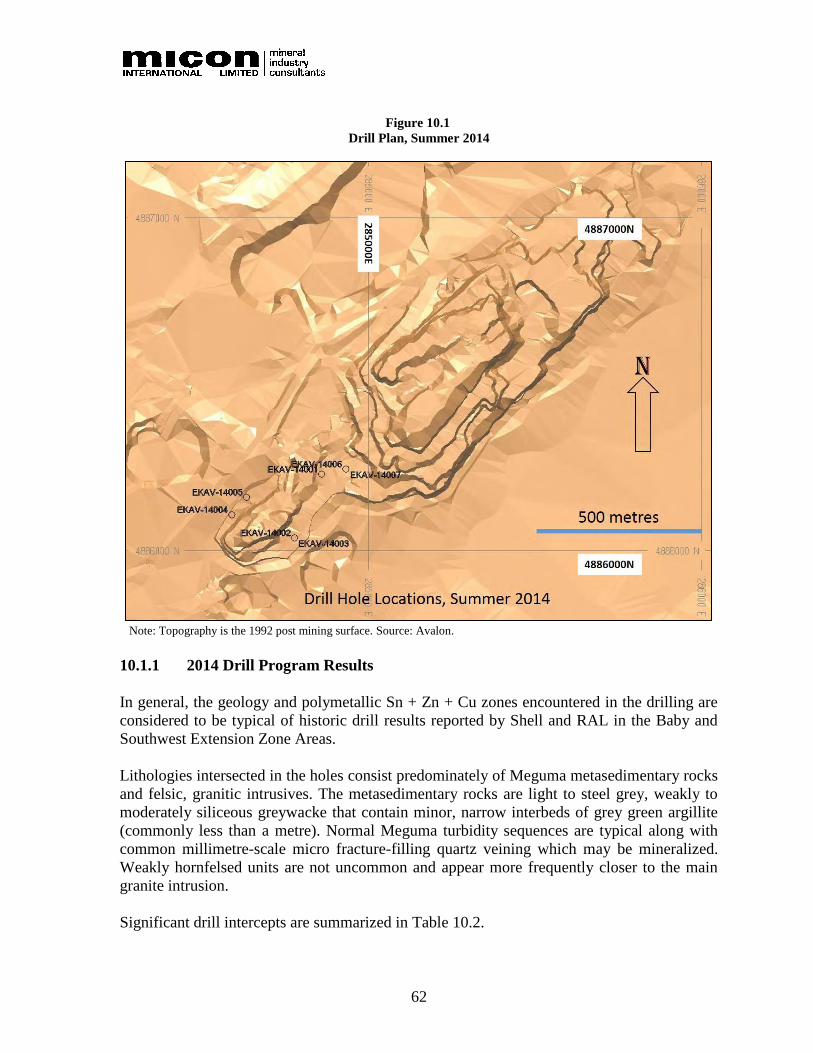
62
Figure 10.1
Drill Plan, Summer 2014
Note: Topography is the 1992 post mining surface. Source: Avalon.
10.1.1 2014 Drill Program Results
In general, the geology and polymetallic Sn + Zn + Cu zones encountered in the drilling are
considered to be typical of historic drill results reported by Shell and RAL in the Baby and
Southwest Extension Zone Areas.
Lithologies intersected in the holes consist predominately of Meguma metasedimentary rocks
and felsic, granitic intrusives. The metasedimentary rocks are light to steel grey, weakly to
moderately siliceous greywacke that contain minor, narrow interbeds of grey green argillite
(commonly less than a metre). Normal Meguma turbidity sequences are typical along with
common millimetre-scale micro fracture-filling quartz veining which may be mineralized.
Weakly hornfelsed units are not uncommon and appear more frequently closer to the main
granite intrusion.
Significant drill intercepts are summarized in Table 10.2.

63
Table 10.2
Summary Drill Hole Intercepts, 2014 Drill Program
Zone Drill Hole From
(m)
To
(m)
Width
(m)
Zn
(ppm)
Sn
(ppm)
Cu
(ppm)
Ag
(ppm)
In
(ppm)
Southwest
Extension
EKAV-14-001 77.90 109.00 31.10 1,179 1,357 507 1.18 7.19
including 77.90 98.50 20.60 1,104 1,791 659 1.52 7.18
Southwest
Extension
EKAV-14-006 29.70 110.00 80.30 2,270 2,623 1,142 3.41 14.92
including 29.70 83.00 53.30 2,350 3,270 1,412 4.31 15.59
and 95.00 110.00 15.00 3,204 2,229 820 2.17 20.49
Southwest
Extension
EKAV-14-007 44.50 82.00 37.50 1,828 1,567 617 1.70 11.67
including 44.50 73.00 28.50 2,078 1,883 607 1.77 12.45
and 44.50 48.80 4.30 3,177 1,555 1,154 3.26 26.03
and 55.00 64.00 9.00 2,999 4,156 773 2.32 15.03
Baby Zone EKAV-14-002 92.25 159.00 66.75 5,039 3,599 949 2.65 20.76
including 92.25 133.50 41.25 3,924 4,691 1,225 3.36 21.00
Baby Zone EKAV-14-003 49.00 65.75 16.75 2,890 3,897 801 1.80 20.91
and 80.25 148.10 67.85 5,349 4,101 482 1.01 16.77
Baby Zone EKAV-14-004 63.65 166.00 102.35 4,365 942 288 0.53 13.78
including 63.65 161.20 97.55 4,521 975 293 0.54 14.20
including 63.65 101.50 37.85 4,805 1,141 376 0.48 14.72
and 80.50 94.00 13.50 5,218 1,702 489 0.68 16.26
and 128.50 134.50 6.00 1,960 1,355 69 0.25 7.11
and 147.00 161.20 14.20 11,524 1,685 583 1.08 30.19
Baby Zone EKAV-14-005 No significant intercepts
The main granite intrusion is weakly to strongly altered with alteration affecting both the
colour and texture of the granite. Generally, light to darker, highly siliceous, fine grained
granite is associated with the higher grade, mineralized sections. Yellow to yellowish grey,
medium to coarse grained granite with abundant sericite is most commonly associated with
lower grade mineralization adjacent to the higher-grade mineralization.
The unit associated with the lower grade mineralization has a gradational contact with
unaltered and unmineralized granite.
The following types of veining occur:
1. Quartz veining as bedding-parallel veins, angular veins and irregular fracture filling
millimetre-scale veins. These veins are commonly barren but sometimes have minor
to trace mineralization consisting of chalcopyrite, + sphalerite, cassiterite, pyrrhotite,
arsenopyrite and possibly molybdenite.
2. Quartz flooding or replacement style veining/silification (greisenization) which
commonly has associated mineralization (+ sphalerite, + cassiterite + pyrrhotite, +
pyrite, + fluorite, + molybdenite, + wolframite).
3. Semi-massive to massive sulphide veins, consisting predominately of pyrrhotite, +
chalcopyrite and sphalerite. Cassiterite is locally abundant in these veins.
4. Cream coloured, fine-grained, granitic veins or dykes commonly associated with
high-grade tin mineralization.
64
All drill holes were logged in detail, noting lithology, alteration and mineralogy. Density,
rock quality designation (RQD) and magnetic susceptibility readings were also recorded for
all drill holes.
10.1.2 Drill Hole Summaries
EKAV-14-001: Diamond drill hole EKAV-14-001 was drilled to twin historical drill holes
79-047 and 89-208 (extension of 79-047). The geology intersected is summarized as follows:
0 to 4 m overburden, 4 m to 77.9 m metasediments and 77.9 m to end of hole at 147 m is
granite. The geology is consistent with the historical drilling and from examinations of the
analytical data, a similar trend in grade is recognized.
EKAV-14-002: Diamond drill hole EKAV-14-002 was drilled to test-higher grade, thicker,
mineralization in the Baby Zone that is focused along the southeast, structurally controlled
contact with the metasediments. The geology intersected is summarized as follows: 0 to 3 m
overburden, 46.6 m to 97.95 m contact zone (Igneous Breccia) and granite from 97.95 m to
the end of the hole at 159 m. The drilling cut a thicker zone of contact zone geology than
anticipated. This appears largely due to drilling sub-parallel to the zone, however, the zone is
noted to be thicker in this local area as compared to other parts of the deposit. Drilling
confirmed the higher grade, thicker zone of mineralization focused along the southeast
contact.
EKAV-14-003: Hole EKAV-14-003 was drilled from the same set up as EKAV-14-002 to
test the higher grade, thicker, mineralization in the Baby Zone that is focused along the
southeast, structurally controlled contact with the metasediments at a shallower depth. The
geology intersected is summarized as follows: 0 m to 3.5 m overburden, 3.5 m to 32.35 m
metasediments, 32.35 m to 49 m contact zone, 49 m to 65.75 m granite, 65.75 m to 81.25 m
contact zone and from 81.25 m to the end of hole at 148.1 m is granite. Within the main
granite, hole EKAV-14-003 intersected an inlier of contact zone that was not recognized
from the historical drilling. The significance of this inlier is not well understood at this time
and it is recommended that the zone should be completely sampled and analysed.
EKAV-14-004: Hole EKAV-14-004 was drilled to twin historical drill hole 88-200 and to
test the higher grade, thicker, mineralization in the Baby Zone that is focused along the
southeast structurally-controlled contact with the metasediments. The geology intersected is
summarized as follows: 0 to 3 m overburden, 3 m to 63.65 m metasediments, 63.65 m to 65.7
m contact zone, 65.7 m to- 161.2 m granite and from 161.2 m to the end of the hole at 166 m
is contact zone. The geology is consistent with the historical drilling and from examinations
of the analytical data, a similar trend in grade is recognized.
EKAV-14-005: Hole EKAV-14-005 was drilled to twin historical drill hole 90-003. The
geology is 0 to 10.7 m overburden, 10.7 m to 63.1 m metasediments and from 63.1 m to the
end of the hole at 145 m is granite. The geology is consistent with the historical drilling.
However, no significant mineralization was encountered in this hole.

65
EKAV-14-006: Hole EKAV-14-006 was drilled to test the higher-grade mineralization noted
at the end of historical drill hole 80-160. The geology intersected is as follows: 0 to 2.7 m
overburden, 2.7 m to 28.35 m is metasediments and from 28.35 m to the end of the hole at
113 m is granite. The thickness of the metasediments is greater than anticipated from the
historical drilling. In addition, this hole confirmed significant mineralization that occurs past
the end of historical drill hole 80-160.
EKAV-14-007: Hole EKAV-14-007 was drilled to twin historical drill hole 80-159. The
geology comprises: 0 to 5 m overburden, 5 m to 40.65 m metasediments and from 40.65 m to
end of the hole at 106 m is granite. Preliminary observations indicate the geology and grade
are consistent with historical drilling results.
10.2 CONCLUSIONS
The main conclusions from the 2014 drill program were:
• Drilling was successful in confirming the known geology.
• Drilling confirmed higher-grade, thicker mineralization focused along the southeast,
structurally controlled contact of the Baby Zone with the metasediments.
• Diamond drill hole EKAV-14-003 identified a ‘contact zone-like’ inlier of sediments
with the main granite that was not previously recognized.
• No significant difference in grade of mineralization or geological interpretations were
noted or recognized from this preliminary evaluation.
• Drilling confirmed the mineralization associated with the southwest extension of the
Main Zone.
10.3 2015 AVALON DRILLING PROGRAM
Twenty-two HQ diamond drill holes totalling 4,514 m were completed on Special Licence
No. 50462 by Foraco Drilling from 13 July to 15 November, 2015. All drilling was
performed on RAL and Crown Lands.
Holes were spotted using a handheld Garmin GPSmap 60Cx and, upon completion, were
cemented into bedrock from top to bottom where possible. In cases where drill holes were
not totally cemented, a plug was inserted at about 30 m depth in the hole and the hole was
cemented from there to surface.
Surveyed coordinates for each hole were established upon completion by Scotia Surveys
Limited of Shelburne, N.S. using a Topcon HiperLitr +GPS RTK system. All drill sites were
cleaned upon completion. The core is presently stored at 3193 Main Shore Road, Port
Maitland, N.S.
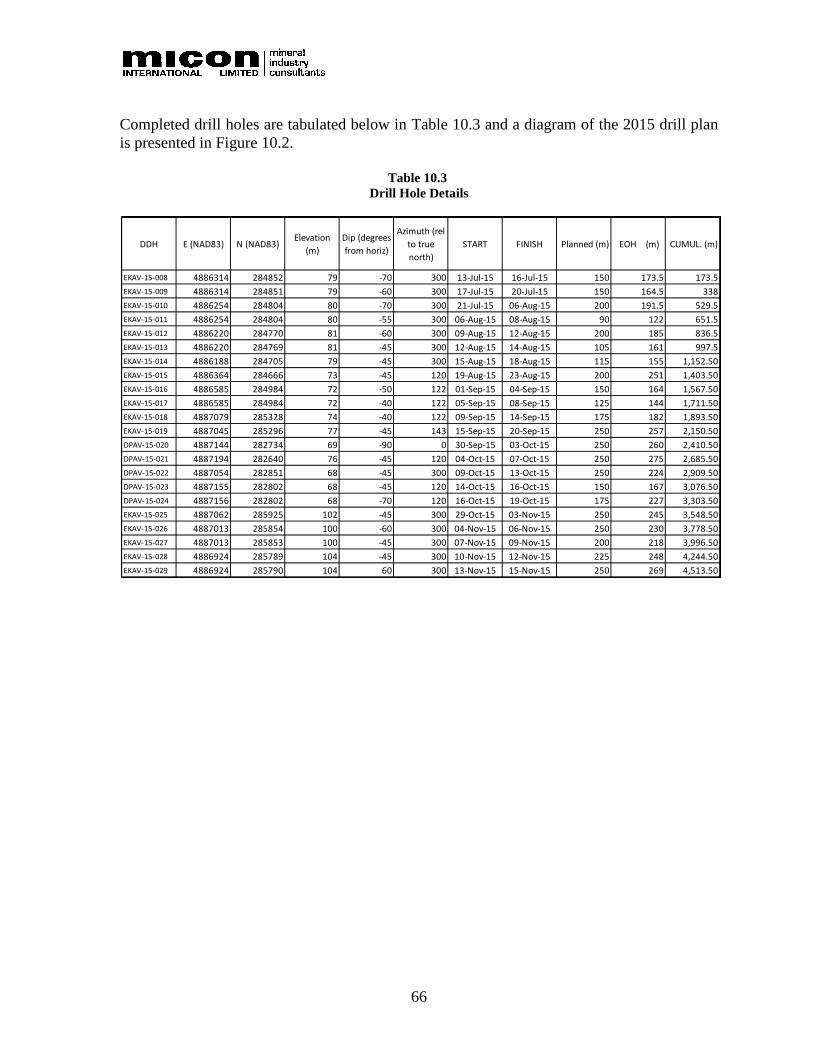
66
Completed drill holes are tabulated below in Table 10.3 and a diagram of the 2015 drill plan
is presented in Figure 10.2.
Table 10.3
Drill Hole Details
DDH E (NAD83) N (NAD83)Elevation
(m)
Dip (degrees
from horiz)
Azimuth (rel
to true
north)
START FINISH Planned (m) EOH (m) CUMUL. (m)
EKAV-15-008 4886314 284852 79 -70 300 13-Jul-15 16-Jul-15 150 173.5 173.5
EKAV-15-009 4886314 284851 79 -60 300 17-Jul-15 20-Jul-15 150 164.5 338
EKAV-15-010 4886254 284804 80 -70 300 21-Jul-15 06-Aug-15 200 191.5 529.5
EKAV-15-011 4886254 284804 80 -55 300 06-Aug-15 08-Aug-15 90 122 651.5
EKAV-15-012 4886220 284770 81 -60 300 09-Aug-15 12-Aug-15 200 185 836.5
EKAV-15-013 4886220 284769 81 -45 300 12-Aug-15 14-Aug-15 105 161 997.5
EKAV-15-014 4886188 284705 79 -45 300 15-Aug-15 18-Aug-15 115 155 1,152.50
EKAV-15-015 4886364 284666 73 -45 120 19-Aug-15 23-Aug-15 200 251 1,403.50
EKAV-15-016 4886585 284984 72 -50 122 01-Sep-15 04-Sep-15 150 164 1,567.50
EKAV-15-017 4886585 284984 72 -40 122 05-Sep-15 08-Sep-15 125 144 1,711.50
EKAV-15-018 4887079 285328 74 -40 122 09-Sep-15 14-Sep-15 175 182 1,893.50
EKAV-15-019 4887045 285296 77 -45 143 15-Sep-15 20-Sep-15 250 257 2,150.50
DPAV-15-020 4887144 282734 69 -90 0 30-Sep-15 03-Oct-15 250 260 2,410.50
DPAV-15-021 4887194 282640 76 -45 120 04-Oct-15 07-Oct-15 250 275 2,685.50
DPAV-15-022 4887054 282851 68 -45 300 09-Oct-15 13-Oct-15 250 224 2,909.50
DPAV-15-023 4887155 282802 68 -45 120 14-Oct-15 16-Oct-15 150 167 3,076.50
DPAV-15-024 4887156 282802 68 -70 120 16-Oct-15 19-Oct-15 175 227 3,303.50
EKAV-15-025 4887062 285925 102 -45 300 29-Oct-15 03-Nov-15 250 245 3,548.50
EKAV-15-026 4887013 285854 100 -60 300 04-Nov-15 06-Nov-15 250 230 3,778.50
EKAV-15-027 4887013 285853 100 -45 300 07-Nov-15 09-Nov-15 200 218 3,996.50
EKAV-15-028 4886924 285789 104 -45 300 10-Nov-15 12-Nov-15 225 248 4,244.50
EKAV-15-029 4886924 285790 104 60 300 13-Nov-15 15-Nov-15 250 269 4,513.50

67
Figure 10.2
2015 Drill Plan
10.3.1 2015 Drill Program Results
Lithologies intersected in the holes consist predominately of Meguma metasedimentary rocks
and felsic, granitic intrusives. The metasedimentary rocks are light to steel grey, weakly to
moderately siliceous greywacke that contain minor, narrow interbeds of grey green argillite
(commonly less than a metre). Normal Meguma turbidity sequences are typical along with
common millimetre-scale micro fracture-filling quartz veining which may be mineralized.
Weak hornfels units are not uncommon and appear more frequently closer to the main granite
intrusion.
The main granite intrusion is weakly to strongly altered with alteration affecting both the
colour and texture of the granite. Generally, light to darker, highly siliceous, fine grained
granite is associated with the higher grade, mineralized sections. Yellow to yellowish grey,

68
medium to coarse grained granite with abundant sericite is most commonly associated with
lower grade mineralization adjacent to the higher-grade mineralization.
The following types of veining were noted in the drilling:
1. Quartz veining as bedding-parallel veins, angular veins and irregular fracture filling
millimetre-scale veins. These veins are commonly barren but sometimes have minor
to trace mineralization consisting of chalcopyrite, + sphalerite, cassiterite, pyrrhotite,
arsenopyrite and possibly molybdenite.
2. Quartz flooding or replacement style veining/silification (greisenization) which
commonly has associated mineralization (+ sphalerite, + cassiterite + pyrrhotite, +
pyrite, + fluorite, + molybdenite, + wolframite).
3. Semi-massive to massive sulphide veins, consisting predominately of pyrrhotite, +
chalcopyrite and sphalerite. Cassiterite is locally abundant in these veins. Additional
readings were also taken for density, rock quality designation (RQD) and magnetic
susceptibility.
The 22 drill holes totaling 4,514 m achieved the following objectives, namely:
• Further definition of mineral resources.
• Geotechnical information for future mine planning.
• Geochemical information for waste rock handling planning.
• Potential bulk sample for pilot scale metallurgical testing.
The drill program was successful in providing assay results that are the basis of the update of
the mineral resources for the East Kemptville Project, which includes three zones:
• Baby Zone.
• Duck Pond Zone.
• Main Zone.
The drill hole sample preparation and assays, conducted under best practice QA/QC
procedures with insertion of blanks and standards, as well as duplicate coarse sample
analyses at a secondary laboratory and core duplicates, indicate similar values of economic
elements such as tin and zinc as historic data, allowing verification of the data by an
independent Qualified Person.
Basic geotechnical information was collected by logging of all holes with a limited number
representative holes logged in greater detail. In addition, wall rock samples (rock material
outside, but adjacent to the mineralization zones) were analysed for carbon and sulphur in
order to provide information on potential for acid rock drainage in the waste stripping
process.
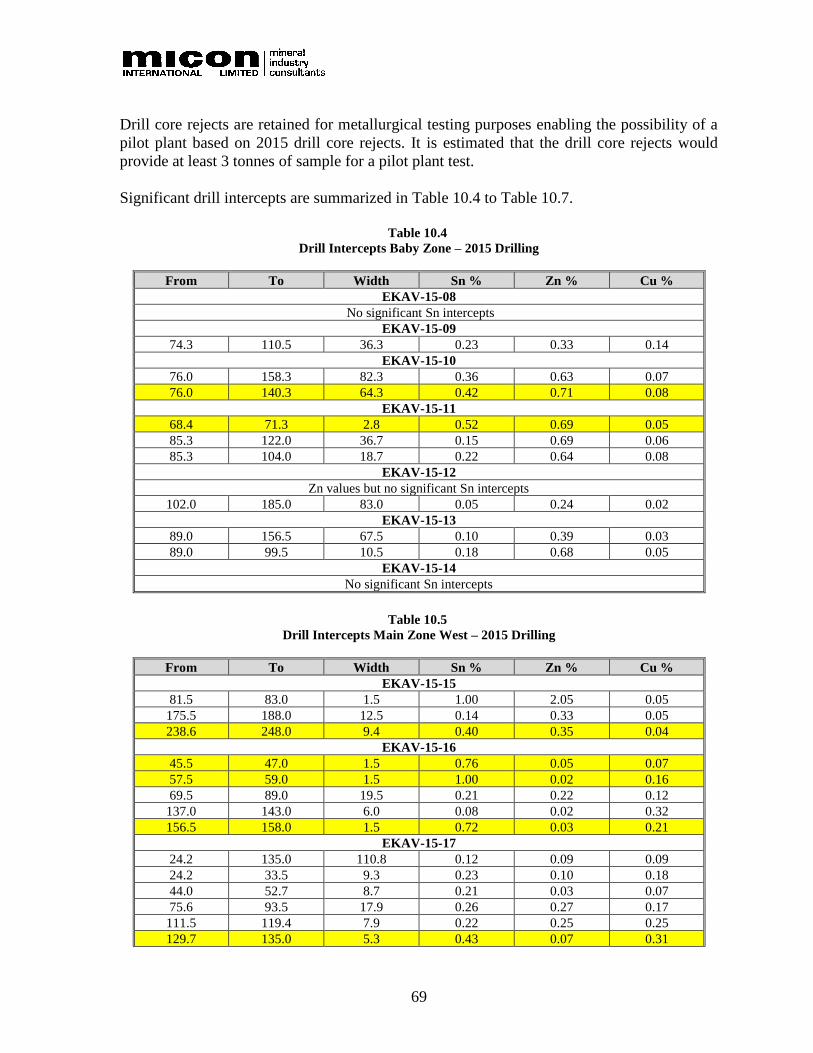
69
Drill core rejects are retained for metallurgical testing purposes enabling the possibility of a
pilot plant based on 2015 drill core rejects. It is estimated that the drill core rejects would
provide at least 3 tonnes of sample for a pilot plant test.
Significant drill intercepts are summarized in Table 10.4 to Table 10.7.
Table 10.4
Drill Intercepts Baby Zone – 2015 Drilling
From To Width Sn % Zn % Cu %
EKAV-15-08
No significant Sn intercepts
EKAV-15-09
74.3 110.5 36.3 0.23 0.33 0.14
EKAV-15-10
76.0 158.3 82.3 0.36 0.63 0.07
76.0 140.3 64.3 0.42 0.71 0.08
EKAV-15-11
68.4 71.3 2.8 0.52 0.69 0.05
85.3 122.0 36.7 0.15 0.69 0.06
85.3 104.0 18.7 0.22 0.64 0.08
EKAV-15-12
Zn values but no significant Sn intercepts
102.0 185.0 83.0 0.05 0.24 0.02
EKAV-15-13
89.0 156.5 67.5 0.10 0.39 0.03
89.0 99.5 10.5 0.18 0.68 0.05
EKAV-15-14
No significant Sn intercepts
Table 10.5
Drill Intercepts Main Zone West – 2015 Drilling
From To Width Sn % Zn % Cu %
EKAV-15-15
81.5 83.0 1.5 1.00 2.05 0.05
175.5 188.0 12.5 0.14 0.33 0.05
238.6 248.0 9.4 0.40 0.35 0.04
EKAV-15-16
45.5 47.0 1.5 0.76 0.05 0.07
57.5 59.0 1.5 1.00 0.02 0.16
69.5 89.0 19.5 0.21 0.22 0.12
137.0 143.0 6.0 0.08 0.02 0.32
156.5 158.0 1.5 0.72 0.03 0.21
EKAV-15-17
24.2 135.0 110.8 0.12 0.09 0.09
24.2 33.5 9.3 0.23 0.10 0.18
44.0 52.7 8.7 0.21 0.03 0.07
75.6 93.5 17.9 0.26 0.27 0.17
111.5 119.4 7.9 0.22 0.25 0.25
129.7 135.0 5.3 0.43 0.07 0.31

70
From To Width Sn % Zn % Cu %
EKAV-15-18
99.5 111.5 12.0 0.18 0.38 0.15
122.0 127.5 5.5 0.21 0.30 0.03
155.0 158.5 3.5 0.54 0.13 0.13
EKAV-15-19
106.8 203.0 96.2 0.13 0.10 0.08
106.8 116.0 9.2 0.33 0.30 0.15
128.2 135.8 7.6 0.14 0.26 0.08
145.0 146.3 1.3 1.00 0.12 0.09
159.5 168.3 8.8 0.26 0.12 0.33
179.4 188.1 8.7 0.25 0.05 0.14
191.1 203.0 11.9 0.12 0.04 0.05
Table 10.6
Drill Intercepts Main Zone East – 2015 Drilling
From (m) To (m) Width (m) Sn % Zn % Cu % In ppm
EKAV-15-025
4.5 59.6 55.1 0.10 0.18 0.02 5.5
INCLUDING
47.5 51.5 4.0 0.71 0.13 0.01 5.3
81.3 92.0 10.7 0.22 0.37 0.05 21.7
102.0 104.1 2.1 0.15 0.32 0.06 20.5
108.7 129.5 20.8 0.38 0.56 0.14 32.8
134.0 144.5 10.5 0.21 0.18 0.04 10.4
162.5 167.0 4.5 0.34 0.10 0.02 3.9
176.0 179.0 3.0 0.15 0.05 0.02 3.2
189.5 212.0 22.5 0.07 0.26 0.05 8.3
215.2 225.5 10.4 0.27 0.42 0.10 17.7
243.5 245.0 1.5 0.36 0.07 0.02 1.9
EKAV-15-026
5.0 6.5 1.5 0.45 0.59 0.10 12.2
38.0 47.9 9.9 0.38 0.49 0.11 21.9
66.4 84.5 18.1 0.19 0.27 0.06 12.1
89.0 95.0 6.0 0.13 0.12 0.02 5.3
114.4 116.0 1.7 2.76 0.30 0.19 28.2
119.0 137.2 18.2 0.13 0.19 0.07 13.4
158.0 163.1 5.1 0.31 0.14 0.08 9.7
192.5 198.1 5.6 1.30 0.20 0.64 40.0
201.6 206.0 4.4 0.16 0.35 0.12 12.4
EKAV-15-027
20.0 26.0 6.0 0.20 0.19 0.03 4.8
53.0 62.0 9.0 0.08 0.31 0.02 9.2
66.0 70.7 4.7 0.59 0.48 0.04 14.4
78.5 85.0 6.5 0.31 0.28 0.09 14.8
94.8 101.2 6.4 0.37 0.38 0.21 24.7
105.5 117.5 12.0 0.14 0.12 0.04 6.9
168.7 178.0 9.3 0.33 0.77 0.26 39.9
207.0 213.5 6.5 0.14 0.07 0.02 4.3
EKAV-15-028
48.5 50.0 1.5 0.46 0.20 0.02 7.6

71
From (m) To (m) Width (m) Sn % Zn % Cu % In ppm
72.5 87.5 15.0 0.19 0.25 0.09 12.0
110.0 111.5 1.5 0.43 0.07 0.01 4.1
137.0 138.5 1.5 0.48 0.08 0.03 4.2
144.5 154.1 9.6 0.34 0.34 0.25 27.9
159.5 162.2 2.7 0.13 0.20 0.03 7.4
180.5 182.0 1.5 0.48 0.29 0.13 14.1
204.0 209.0 5.0 0.29 0.13 0.07 6.1
EKAV-15-029
27.5 30.5 3.0 0.30 0.20 0.05 10.6
44.1 45.8 1.7 1.27 0.44 0.02 20.3
56.0 58.0 2.0 0.05 0.23 0.03 7.9
126.5 132.1 5.6 0.31 0.11 0.09 0.0
165.3 168.3 3.0 0.16 0.23 0.35 26.6
191.0 194.0 3.0 0.13 0.15 0.08 11.0
221.0 222.5 1.5 0.40 0.25 0.04 12.9
Table 10.7
Drill Intercepts Duck Pond Zone – 2015 Drilling
From (m) To (m) Width (m) Sn % Zn % In ppm
DPAV-15-20
96.5 98.0 1.5 0.79 0.20 7.2
129.4 156.4 27.0 0.23 0.39 8.4
216.5 236.0 19.5 0.43 0.25 12.1
257.0 260.0 3.0 0.41 1.24 36.0
DPAV-15-021
Significant intercepts are zinc with low tin
DPAV-15-022
14.0 21.5 7.5 0.86 0.20 37.6
30.3 35.2 4.9 0.15 0.21 11.6
43.2 56.0 12.8 0.16 0.13 21.2
DPAV-15-023
40.5 43.0 2.5 0.39 0.18 14.0
89.5 120.5 31.0 0.15 0.25 9.6
DPAV-15-024
6.5 9.0 2.5 0.16 0.05
50.5 61.0 10.5 0.60 0.27 18.0
135.5 143.1 7.6 0.28 0.38 6.0
10.3.2 Drill Hole Summaries
Abbreviations used in the drill hole summaries are listed in Table 10.8.

72
Table 10.8
Abbreviations Used in Drill Hole Summaries
Abbreviation Mineral
Name
aspy Arsenopyrite
cas Cassiterite
cpy Chalcopyrite
flu Fluorite
ga Galena
moly Molybdenite
po Pyrrhotite
py Pyrite
qtz Quartz
sph Sphalerite
wolf Wolframite
Baby Zone: The initial ten drill holes were all targeted on the Baby Zone and Table 10.9
below summarizes the results.
Table 10.9
Summary of Initial 10 Holes Drilled in the Baby Zone
DDH Objective Comments Mineralization Comments:
Water, Etc.
Comments:
Cementing
EKAV-15-
008
Baby Zone:
Upgrading
resources
Meguma better mineralized than
granite. Trace mineralization upper
granite.
Casing leaking
cuttings. No water
loss in hole
although return
occasionally
diminished.
24 eighty-pound
bags used.
EKAV-15-
009
Baby Zone:
Upgrading
resources
Transition Zone moderately
mineralized and upper part of granite
to 110.5 m. Minor mineralization to
145 m trace to nil to end of hole.
Casing sealed, good
water return.
24 eighty-pound
bags used.
EKAV-15-
010
Baby Zone:
Upgrading
resources
2-3% mineralization from 78.2-158.5
m, in grey granite then nil to trace in
sericitic granite to end of hole.
Cassiterite evident in mineralized
zone.
Lost water
temporarily 23 m,
returned, but not
100%. Total loss
72m-146 m, then
partial return. Put in
plug at 21 m and
cemented to top.
4 eighty-pound
bags used. Put in
plug at 21 m and
cemented to top.
EKAV-15-
011
Baby Zone:
Upgrading
resources
Altered Meguma to 85 m, minor
mineralization. 85-113.5 m granite
with local Transition Zone, 2-4%
po/cpy/py/sph. Rare moly/flu. 113.5-
122 m trace min – py/sph/possible cas.
Hole 10, lost water
return at 23 m with
partial return
below, intermittent.
4 eighty-pound
bags used. Put in
plug at 21 m and
cemented to top.
EKAV-15-
012
Baby Zone:
Upgrading
resources
Scarce mineralization to 62 m, then 1-
2% sulphides to 99.5 m. 99.5-108 m
mixture of Meguma/granite/Contact
Zone with 1% sulphides. 108-112.5 m
granite with 2% po/cpy. 112.5-131.5
Lost water 12 m,
partial return,
intermittent.
Plugged at 10 m
and cemented. 2
eighty-pound bags
used.
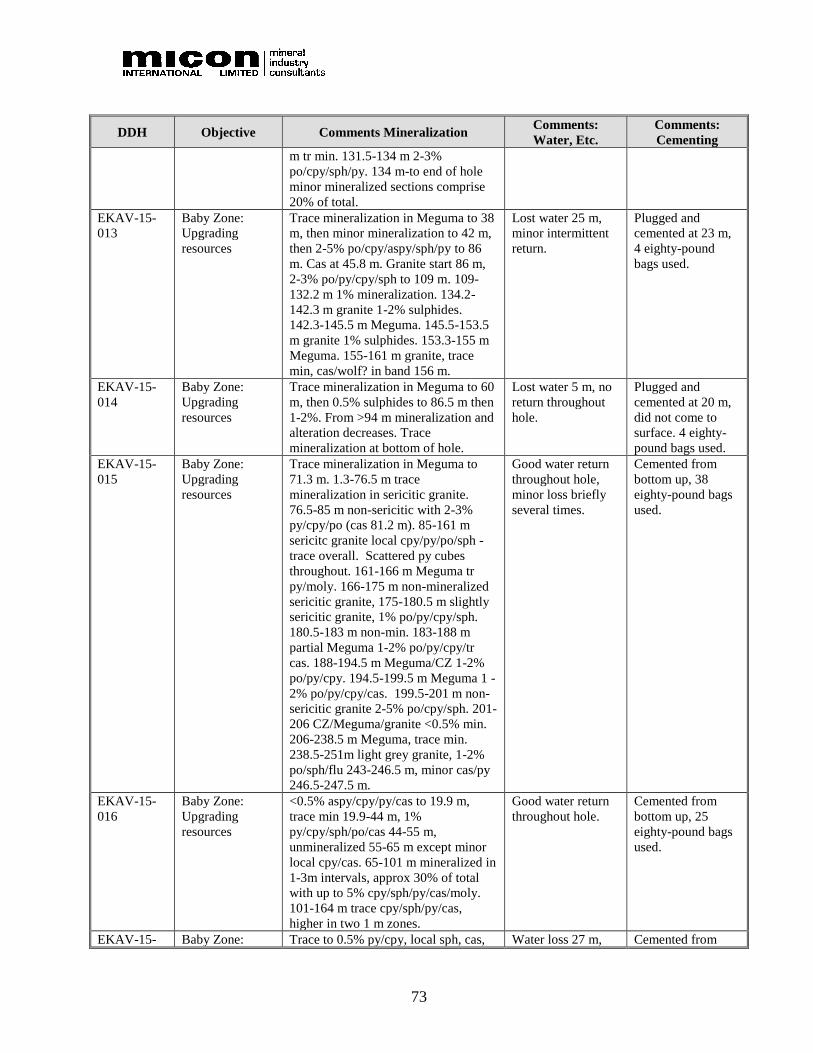
73
DDH Objective Comments Mineralization Comments:
Water, Etc.
Comments:
Cementing
m tr min. 131.5-134 m 2-3%
po/cpy/sph/py. 134 m-to end of hole
minor mineralized sections comprise
20% of total.
EKAV-15-
013
Baby Zone:
Upgrading
resources
Trace mineralization in Meguma to 38
m, then minor mineralization to 42 m,
then 2-5% po/cpy/aspy/sph/py to 86
m. Cas at 45.8 m. Granite start 86 m,
2-3% po/py/cpy/sph to 109 m. 109-
132.2 m 1% mineralization. 134.2-
142.3 m granite 1-2% sulphides.
142.3-145.5 m Meguma. 145.5-153.5
m granite 1% sulphides. 153.3-155 m
Meguma. 155-161 m granite, trace
min, cas/wolf? in band 156 m.
Lost water 25 m,
minor intermittent
return.
Plugged and
cemented at 23 m,
4 eighty-pound
bags used.
EKAV-15-
014
Baby Zone:
Upgrading
resources
Trace mineralization in Meguma to 60
m, then 0.5% sulphides to 86.5 m then
1-2%. From >94 m mineralization and
alteration decreases. Trace
mineralization at bottom of hole.
Lost water 5 m, no
return throughout
hole.
Plugged and
cemented at 20 m,
did not come to
surface. 4 eighty-
pound bags used.
EKAV-15-
015
Baby Zone:
Upgrading
resources
Trace mineralization in Meguma to
71.3 m. 1.3-76.5 m trace
mineralization in sericitic granite.
76.5-85 m non-sericitic with 2-3%
py/cpy/po (cas 81.2 m). 85-161 m
sericitc granite local cpy/py/po/sph -
trace overall. Scattered py cubes
throughout. 161-166 m Meguma tr
py/moly. 166-175 m non-mineralized
sericitic granite, 175-180.5 m slightly
sericitic granite, 1% po/py/cpy/sph.
180.5-183 m non-min. 183-188 m
partial Meguma 1-2% po/py/cpy/tr
cas. 188-194.5 m Meguma/CZ 1-2%
po/py/cpy. 194.5-199.5 m Meguma 1 -
2% po/py/cpy/cas. 199.5-201 m non-
sericitic granite 2-5% po/cpy/sph. 201-
206 CZ/Meguma/granite <0.5% min.
206-238.5 m Meguma, trace min.
238.5-251m light grey granite, 1-2%
po/sph/flu 243-246.5 m, minor cas/py
246.5-247.5 m.
Good water return
throughout hole,
minor loss briefly
several times.
Cemented from
bottom up, 38
eighty-pound bags
used.
EKAV-15-
016
Baby Zone:
Upgrading
resources
<0.5% aspy/cpy/py/cas to 19.9 m,
trace min 19.9-44 m, 1%
py/cpy/sph/po/cas 44-55 m,
unmineralized 55-65 m except minor
local cpy/cas. 65-101 m mineralized in
1-3m intervals, approx 30% of total
with up to 5% cpy/sph/py/cas/moly.
101-164 m trace cpy/sph/py/cas,
higher in two 1 m zones.
Good water return
throughout hole.
Cemented from
bottom up, 25
eighty-pound bags
used.
EKAV-15- Baby Zone: Trace to 0.5% py/cpy, local sph, cas, Water loss 27 m, Cemented from
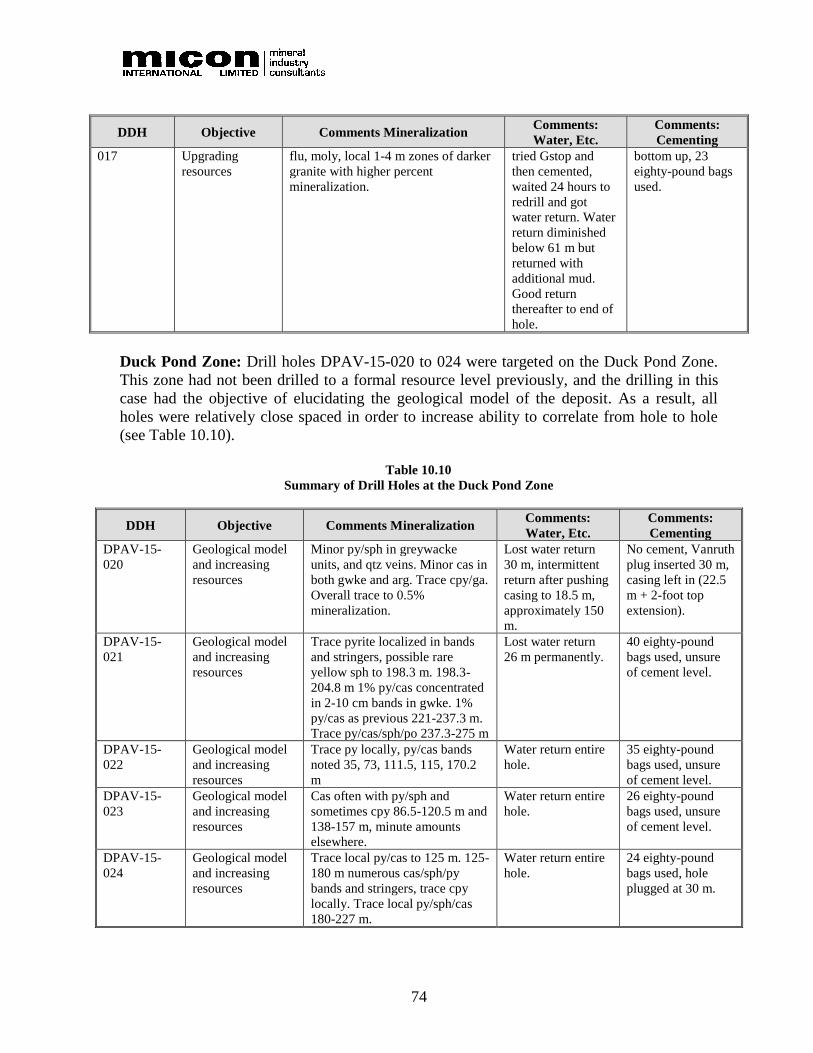
74
DDH Objective Comments Mineralization Comments:
Water, Etc.
Comments:
Cementing
017 Upgrading
resources
flu, moly, local 1-4 m zones of darker
granite with higher percent
mineralization.
tried Gstop and
then cemented,
waited 24 hours to
redrill and got
water return. Water
return diminished
below 61 m but
returned with
additional mud.
Good return
thereafter to end of
hole.
bottom up, 23
eighty-pound bags
used.
Duck Pond Zone: Drill holes DPAV-15-020 to 024 were targeted on the Duck Pond Zone.
This zone had not been drilled to a formal resource level previously, and the drilling in this
case had the objective of elucidating the geological model of the deposit. As a result, all
holes were relatively close spaced in order to increase ability to correlate from hole to hole
(see Table 10.10).
Table 10.10
Summary of Drill Holes at the Duck Pond Zone
DDH Objective Comments Mineralization Comments:
Water, Etc.
Comments:
Cementing
DPAV-15-
020
Geological model
and increasing
resources
Minor py/sph in greywacke
units, and qtz veins. Minor cas in
both gwke and arg. Trace cpy/ga.
Overall trace to 0.5%
mineralization.
Lost water return
30 m, intermittent
return after pushing
casing to 18.5 m,
approximately 150
m.
No cement, Vanruth
plug inserted 30 m,
casing left in (22.5
m + 2-foot top
extension).
DPAV-15-
021
Geological model
and increasing
resources
Trace pyrite localized in bands
and stringers, possible rare
yellow sph to 198.3 m. 198.3-
204.8 m 1% py/cas concentrated
in 2-10 cm bands in gwke. 1%
py/cas as previous 221-237.3 m.
Trace py/cas/sph/po 237.3-275 m
Lost water return
26 m permanently.
40 eighty-pound
bags used, unsure
of cement level.
DPAV-15-
022
Geological model
and increasing
resources
Trace py locally, py/cas bands
noted 35, 73, 111.5, 115, 170.2
m
Water return entire
hole.
35 eighty-pound
bags used, unsure
of cement level.
DPAV-15-
023
Geological model
and increasing
resources
Cas often with py/sph and
sometimes cpy 86.5-120.5 m and
138-157 m, minute amounts
elsewhere.
Water return entire
hole.
26 eighty-pound
bags used, unsure
of cement level.
DPAV-15-
024
Geological model
and increasing
resources
Trace local py/cas to 125 m. 125-
180 m numerous cas/sph/py
bands and stringers, trace cpy
locally. Trace local py/sph/cas
180-227 m.
Water return entire
hole.
24 eighty-pound
bags used, hole
plugged at 30 m.
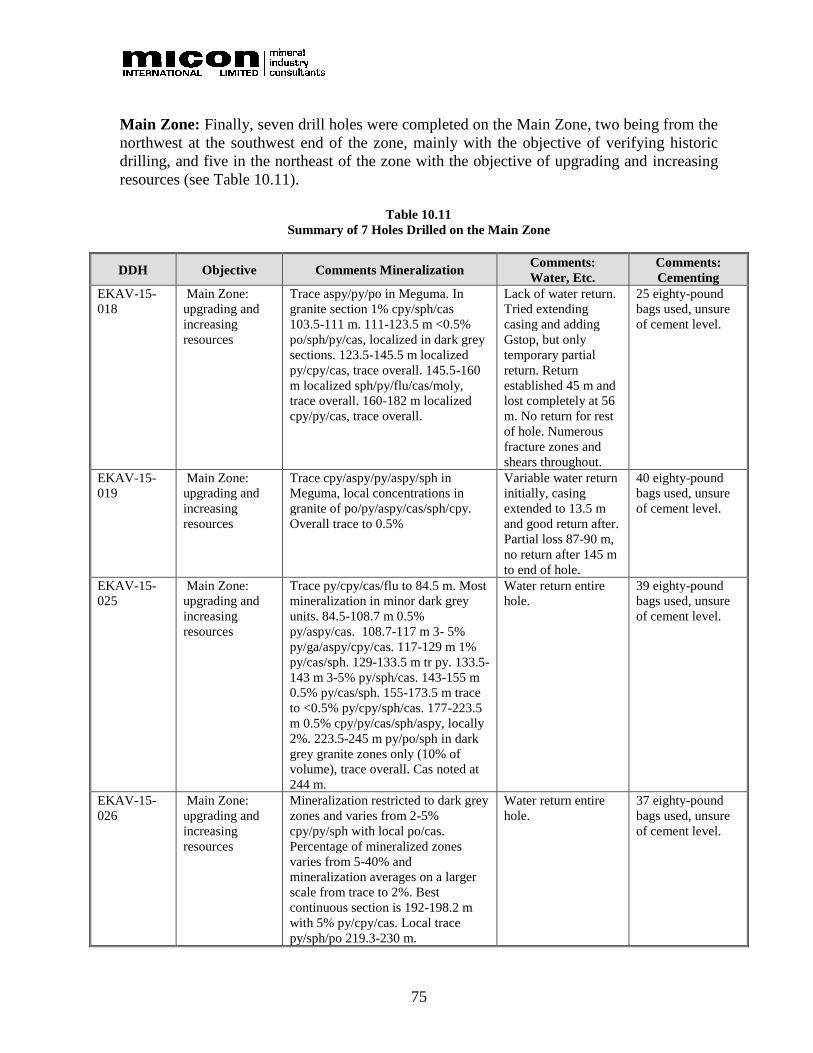
75
Main Zone: Finally, seven drill holes were completed on the Main Zone, two being from the
northwest at the southwest end of the zone, mainly with the objective of verifying historic
drilling, and five in the northeast of the zone with the objective of upgrading and increasing
resources (see Table 10.11).
Table 10.11
Summary of 7 Holes Drilled on the Main Zone
DDH Objective Comments Mineralization Comments:
Water, Etc.
Comments:
Cementing
EKAV-15-
018
Main Zone:
upgrading and
increasing
resources
Trace aspy/py/po in Meguma. In
granite section 1% cpy/sph/cas
103.5-111 m. 111-123.5 m <0.5%
po/sph/py/cas, localized in dark grey
sections. 123.5-145.5 m localized
py/cpy/cas, trace overall. 145.5-160
m localized sph/py/flu/cas/moly,
trace overall. 160-182 m localized
cpy/py/cas, trace overall.
Lack of water return.
Tried extending
casing and adding
Gstop, but only
temporary partial
return. Return
established 45 m and
lost completely at 56
m. No return for rest
of hole. Numerous
fracture zones and
shears throughout.
25 eighty-pound
bags used, unsure
of cement level.
EKAV-15-
019
Main Zone:
upgrading and
increasing
resources
Trace cpy/aspy/py/aspy/sph in
Meguma, local concentrations in
granite of po/py/aspy/cas/sph/cpy.
Overall trace to 0.5%
Variable water return
initially, casing
extended to 13.5 m
and good return after.
Partial loss 87-90 m,
no return after 145 m
to end of hole.
40 eighty-pound
bags used, unsure
of cement level.
EKAV-15-
025
Main Zone:
upgrading and
increasing
resources
Trace py/cpy/cas/flu to 84.5 m. Most
mineralization in minor dark grey
units. 84.5-108.7 m 0.5%
py/aspy/cas. 108.7-117 m 3- 5%
py/ga/aspy/cpy/cas. 117-129 m 1%
py/cas/sph. 129-133.5 m tr py. 133.5-
143 m 3-5% py/sph/cas. 143-155 m
0.5% py/cas/sph. 155-173.5 m trace
to <0.5% py/cpy/sph/cas. 177-223.5
m 0.5% cpy/py/cas/sph/aspy, locally
2%. 223.5-245 m py/po/sph in dark
grey granite zones only (10% of
volume), trace overall. Cas noted at
244 m.
Water return entire
hole.
39 eighty-pound
bags used, unsure
of cement level.
EKAV-15-
026
Main Zone:
upgrading and
increasing
resources
Mineralization restricted to dark grey
zones and varies from 2-5%
cpy/py/sph with local po/cas.
Percentage of mineralized zones
varies from 5-40% and
mineralization averages on a larger
scale from trace to 2%. Best
continuous section is 192-198.2 m
with 5% py/cpy/cas. Local trace
py/sph/po 219.3-230 m.
Water return entire
hole.
37 eighty-pound
bags used, unsure
of cement level.

76
DDH Objective Comments Mineralization Comments:
Water, Etc.
Comments:
Cementing
EKAV-15-
027
Main Zone:
upgrading and
increasing
resources
As above, but best continuous
section 170-173.5 m with similar
mineralization. Likely the same unit.
Water return entire
hole.
34 eighty-pound
bags used, unsure
of cement level.
EKAV-15-
028
Main Zone:
upgrading and
increasing
resources
Similar to hole 26. Best continuous
mineralized section 159.6-162.5 m,
lower grade equivalent 190-200 m.
Lost water 12.5 m,
greased rods and got
return back, but only
partial return shortly
after. Little return to
bottom of hole.
36 eighty-pound
bags used, unsure
of cement level.
EKAV-15-
029
Main Zone:
upgrading and
increasing
resources
Few continuous mineralized zones.
101-104.1 m, 108.8-116.3 m (40%
zones of min.), 130.5-132 m, 165.3-
168. 5 m. Mostly 5-10% zones of
mineralization.
Return throughout
hole, partial leakage
out of hole 28 casing.
42 eighty-pound
bags used, unsure
of cement level.
77
11.0 SAMPLE PREPARATION, ANALYSES AND SECURITY
11.1 SAMPLE PREPARATION
11.1.1 2014 Drill Program
Core was placed in numbered and marked core boxes at the drill site and a quick log
prepared. After the quick logging was completed the core boxes were covered and taped
closed with duct tape, removed from the drill site each evening by Avalon personnel and
transferred to the core logging area. At the core logging area, boxes were opened, drill core
was logged in detail and marked for sampling and all core photographed prior to sampling.
Sampling was typically undertaken on 1.5 m intervals within mineralized sections. Only a
limited amount of sampling was undertaken in non-mineralized sections (limestone and
greywacke). Core was split using a manual core splitter, with the remaining ½-core
reassembled in order in the core box. Sample material was placed in plastic sample bags with
sample number marked on the outside of the bag and a sample tag stapled to the inside fold
of the bag. A duplicate tag was placed in the core box to mark the sample interval and the
sample interval was also noted on the core box divider. Duplicate samples were obtained
from drill core by splitting core in half, with one half noted as the main sample and the other
half noted as the duplicate in the sample log. Standards and blanks were inserted in the
sample list on a pre-determined basis.
Bagged samples were placed in 20-L plastic pails. The pails were sealed with secure lids and
taped closed and the sample numbers noted on the outside of the pail.
Once a sufficient number of samples had been prepared, samples were shipped by courier to
ALS Canada Ltd. (ALS) in Sudbury for initial sample preparation. After initial sample
preparation, ALS shipped the samples to its Vancouver facility for assaying. Sample
preparation at ALS involved the following:
1. Weighing of samples as received.
2. Sample log-in with bar code.
3. Coarse crushing to 70% <3.36 mm.
4. Sample split using rotary splitter.
5. Duplicate split using rotary splitter (for duplicates at ALS).
6. Triplicate split using rotary splitter (for check samples to other laboratories).
7. Pulverize 100 gm split to 95% passing 75 µm.
8. Crushing and pulverizing quality control (QC) tests (internal ALS QC check).
Coarse check sample splits were shipped by ALS to SGS Canada in Lakefield, Ontario, and
to Activation Laboratories Ltd. (Actlabs) in Ancaster, Ontario, under the same sample
number as the main sample with an identifier letter code. Sample preparation of the coarse

78
check samples included sample log-in and pulverization to 95% passing 75 µm. Splits were
prepared using a rotary splitter. Two standards were inserted in the check sample batches.
A total of 404 samples (excluding the 57 duplicates, standards and blank samples) were
submitted to ALS for multi-element work using the ME-MS81, MEOG62, ME-ICP06 and
Fusion XRF for Sn methods. Sixteen blanks, 15 standards and 13 field duplicates were
inserted into the three sample shipments to monitor contamination, accuracy and precision.
In-house Avalon standards STD-292 and SDT-300 were cuts prepared for Avalon by ALS
from blended and homogenized utilized East Kemptville mineralized core material from
original test work to try and cover a range of potential indium and tin grades. Certified
reference material was obtained from both CANMET Mining and Mineral Sciences
Laboratories (CANMET) and Ore Research and Exploration Pty Ltd (ORE). The details of
these standards, including certification, are accessible on the respective websites.
The CANMET standard utilized was MP-1B, “certified reference material for zinc-tin-copper
lead ore” and contains 1.61% Sn. The reference material is ore from Mount Pleasant, New
Brunswick.
The standards supplied by ORE were OREAS-140, 141, and 142 tin standards. These
standards are derived from a tin oxide deposit in New South Wales, Australia, but despite the
differing mineralogy to East Kemptville, were utilized as the only readily commercially
available tin rock standards at suitable grades. They, along with MP-18, were used to in turn
to certify Avalon’s new standards through a Round Robin process.
Blanks were derived from barren greywacke drill core taken from hole GM-10-08,
previously drilled by Avalon in the Gardener’s Meadow exploration area of the East
Kemptville claims.
Sample preparation work on the samples at ALS involved coarse crushing of drill core
samples to a minimum of 70% <3.36 mm (6 mesh) then pulverizing a 1,000 g split to better
than 95% passing minus 75 µm. Table 11.1 summarizes the sample program for the 2014
drill program.
SGS Canada, ALS and Actlabs are independent of Avalon.
Table 11.1
Summary of Samples for 2014 Drill Program
Sample Type Number % of Main Samples
Main Samples 404 100
Duplicates 26 6.44
Standards 15 3.71
Blanks 16 3.96
Total 461

79
11.1.2 2015 Drill Program
For the 2015 drill program, the sample treatment at the core logging facility was similar to
2014, with the exception that the samples were shipped to Actlabs’ sample preparation
facility in either New Brunswick or Ontario, with the New Brunswick facility utilized except
in some cases where a backlog had built up in New Brunswick. In the latter case, the samples
were shipped direct to the Actlabs laboratory in Ancaster, Ontario.
At the drill site, core was placed in numbered and marked core boxes and a quick geological
log prepared. Also completed at the drill site was a simple geotechnical log including
recovery and RQD. A limited number of holes were also logged geotechnically in detail,
some before splitting and some after splitting, depending on the availability of the
geotechnical logging geologist.
After geotechnical logging at the drill site, core boxes were covered and taped closed with
duct tape, removed from the drill site each evening by Avalon personnel and transferred to a
secure storage area. At the core storage area, boxes were opened, drill core was logged in
detail and marked for sampling and all core photographed prior to sampling.
Over three thousand (3,000) assay samples were obtained by sawing half core utilizing an
electric core saw. Sampling was typically undertaken on 1.5 m intervals within mineralized
sections though, depending on geological boundaries, there may be some variation in sample
length.
For the 2014 program, only a limited amount of sampling was undertaken in non-mineralized
sections (limestone and greywacke). However, in 2015, in light of the occurrence of
mineralization to the boundary of sampling, prior to the start of the 2015 drill program,
additional sections of unsampled 2014 core were split and assayed and, in some cases,
contained significant mineralization that was contiguous with existing known mineralization.
As mentioned above, core was split using an electric core saw, with the remaining ½ core re-
assembled in order in the core box. Sample material was placed in plastic sample bags with
sample number marked on the outside of the bag and a sample tag stapled to the inside fold
of the bag. A duplicate tag was placed in the core box to mark the sample interval and the
sample interval also noted on the core box divider.
Duplicate samples were split from drill core by ½ splitting core, with one half noted as the
main sample and the other half noted as the duplicate in the sample log. Standards and blanks
were inserted in the sample list on a pre-determined basis. The statistics for samples,
duplicates, blanks and standards for Actlabs are given in Table 11.2 and Table 11.3 below.
As can be seen, Avalon inserted a total number of control samples (standards and blanks) of
one to every nine samples.

80
Table 11.2
Total Sample Count
Laboratories ACT_ANC
No. of Batches 20
No. of DH Samples 2438
No. of Field duplicates of drill core 76
No. of Standard Samples 347
Table 11.3
Standard Insertion Statistics
Standard
Type
DH Sample
Count
Standard
Type Count
Standard
Sample Count
Ratio of QC Standard to
DH Samples
Avalon 2438 4 262 1:9
Laboratory 2438 6 85 1:29
Bagged samples were placed in 20 litre plastic pails. The pails were sealed with secure lids
and taped closed and the sample number intervals noted on the outside of the pail. Once a
sufficient number of samples had been prepared, samples were shipped by courier to Actlabs
in Ancaster, Ontario, or the Actlabs sample preparation facility in Fredericton, New
Brunswick.
The core logging geologist was responsible for making a determination as to whether a
sample was potentially mineralized or likely to be waste rock in any open pit. The
instructions sent to the laboratory were different according to whether the sample was
designated in the first, mineralized, or second, unmineralized, category.
Coarse check sample splits were prepared and then shipped by Actlabs (the “primary” lab) to
Avalon’s office in Toronto. Avalon inserted standards and then shipped the check samples to
ALS laboratory (the ‘secondary” lab) in Vancouver, B.C., for analysis under the same sample
number as the main sample with an identifier letter code. Sample preparation of the coarse
check samples included sample log-in and pulverization to 95% passing 75 microns. Splits
were prepared using a rotary splitter.
11.1.3 Low Grade Stockpile Surface Sampling Program
In order to verify the metal grade of the low-grade stockpile, a surface sampling program was
completed in 2015. It is recognized that surface sampling has significant potential for error as
the samples might not be representative of the internal material of the pile. However, the tin
grade of the pile estimated by RAL from more than a thousand blasthole points was within
17% of the average grade from five RAL surface samples. Therefore, it was considered that a
surface sample program would be sufficient for initial verification of grades for the purpose
of classifying the resource as an Inferred Mineral Resource.
A program was completed with two samplers to reduce sample bias, each independently
taking a sample at points at 50 m intervals across the length and width of the low-grade

81
stockpile, plus samples around one side of the bottom of the pile. The two samples from the
two individuals from each site were kept separate for analysis in order to investigate any
sampling bias on the part of one or other sampler. A total of approximately 270 kg was
collected with each sample being about 5 kg.
These results are compared with the RAL Closure Plan (RAL, 1993) data in Table 11.4 and
show that the Avalon estimates for Sn (0.117% Sn) and Zn are within 11% of the surface
samples quoted by RAL (0.106% Sn) and, for Sn, higher than the blasthole assays estimate or
0.09% Sn given by RAL (1993). Copper is close to the block model estimate and below the
RAL surface sample estimates. These analytical results are considered to be in reasonable
agreement with the average resource grade quoted by RAL (1993) and support the estimated
grades of the low-grade stockpile.
Table 11.4
Comparison of Avalon (2015) and RAL (1993) Estimated Grades for the Low-Grade Stockpile
Dump Tonnes
(Mt)
Surface
Area (ha)
Sample
Description
Grade (%)
Sn Zn Cu
Low Grade Stockpile (RAL, 1993) 5.87 22.7 Ave LG1-5 0.108 0.106 0.064
Sampled on Surface (RAL)1 Mean 0.106 0.106 0.068
Block Model Estimate (RAL)2 Mean 0.091 0.153 0.058
Mean 2015 Sample Assays (Avalon) 5.87 0.117 0.094 0.054
Differences
Sampled on Surface (RAL) 100% 100% 100%
Block Model Estimate (RAL) 86% 144% 85%
This study (Avalon) 110% 89% 79% 1 Measured by RAL in samples collected from surface piles in 1991. 2 Estimated by RAL from more than 1,000 sample analyses from blasthole cuttings.
In 2016, Avalon completed an additional sampling program of the low-grade stockpile in
order to obtain a sample for metallurgical testwork. The total material collected was 122
samples totalling 320 kg. The analyses of the samples were completed by Bureau Veritas
utilizing method LF100 (Lithium metaborate fusion followed by ICP-MS).
The results of this 2016 sampling give an average grade of 0.1273% Sn in the 320 kg of
sample. These results are considered by Avalon to be in close agreement with previous
sampling by Avalon and RAL with the overall average slightly higher than previous. Thus, it
is considered that this sampling is additional confirmation of the grade of the surface of the
Low-Grade Stockpile.
11.2 SAMPLE ANALYSIS
Samples in 2014 were shipped to ALS (Vancouver, BC) for analysis and check samples
returned to Avalon. Avalon then inserted standards in the sequence of check samples and
shipped them to SGS (Peterborough, Ontario) or Actlabs (Ancaster, Ontario) for check
analysis. In 2015, the initial processing and analysis of the drill core samples was completed
by Actlabs (Ancaster, Ontario) and the check samples sent to ALS (Vancouver, BC) for
analysis.

82
The low-grade stockpile samples collected from each site were shipped to Actlabs for rush
analysis including multi-element Ultratrace-7 (56 elements) and XRF for Sn (plus 19
elements including whole rock analysis).
11.2.1 ALS
Sample analysis at ALS included the following procedures:
1. Loss on ignition determination at 1,000°C (method OA-GRAO5).
2. Multi-element assay by lithium borate fusion/ICP-MS (method MEMS81) (31
elements).
3. Base metal assay by four-acid digestion and ICP-AES (Method ME-4ACD81 as part
of ME-MS81).
4. Major oxides by ICP-AES (method ME-ICP06).
5. Four-acid digestion/ICP-AES (method ME-OG62) for Cu, Pb and Zn.
6. Sn by XRF fusion, ore grade (method Sn-XRF10).
7. XRF fusion, other elements, ore grade by method ME-XRF10.
8. Loss on Ignition for ME-XRF06 (method OA-GRA06).
Method ME-MS81 involves fusion of the sample in a lithium borate/lithium tetraborate flux,
dissolution of the melt in a three-acid mixture (nitric, hydrochloric and hydrofluoric) and
analysis of the solution by ICP-MS. Method ME-4ACD81 uses a four-acid digestion to place
the elements into solution. Four-acid digestion followed by ICP-AES is used for high grade
base metal analysis. Fusion XRF is used for samples over limits using method ME-MS81.
The limits of detection for method ME-MS81 and ME-4ACD81 are noted in Table 11.5 and
Table 11.6.
Table 11.5
Limits of Detection for Method ME-MS81
Element Symbol Unit Lower
Limit
Upper
Limit
Barium Ba ppm 0.5 10,000
Cerium Ce ppm 0.5 10,000
Chromium Cr ppm 10 10,000
Cesium Cs ppm 0.01 10,000
Dysprosium Dy ppm 0.05 1,000
Erbium Er ppm 0.03 1,000
Europium Eu ppm 0.03 1,000
Gallium Ga ppm 0.1 1,000
Gadolinium Gd ppm 0.05 1,000
Hafnium Hf ppm 0.2 10,000
Holmium Ho ppm 0.01 1,000

83
Element Symbol Unit Lower
Limit
Upper
Limit
Lanthanum La ppm 0.5 10,000
Lutetium Lu ppm 0.01 1,000
Niobium Nb ppm 0.2 2,500
Neodymium Nd ppm 0.1 10,000
Praseodymium Pr ppm 0.03 1,000
Rubidium Rb ppm 0.2 10,000
Samarium Sm ppm 0.03 1,000
Tin Sn ppm 1 10,000
Strontium Sr ppm 0.1 10,000
Tantalum Ta ppm 0.1 2,500
Terbium Tb ppm 0.01 1,000
Thorium Th ppm 0.05 1,000
Thallium Ti ppm 0.5 1,000
Thullium Tm ppm 0.01 1,000
Uranium U ppm 0.05 1,000
Vanadium V ppm 5 10,000
Tungsten W ppm 1 10,000
Yttrium Y ppm 0.5 10,000
Ytterbium Yb ppm 0.03 1,000
Zirconium Zr ppm 2 10,000
Table 11.6
Limits of Detection for Method ME-4ACD81
Element Symbol Unit Lower
Limit
Upper
Limit
Silver Ag ppm 0.5 100
Arsenic As ppm 5 10,000
Cadmium Cd ppm 0.5 1,000
Cobalt Co ppm 1 10,000
Copper Cu ppm 1 10,000
Lithium Li ppm 10 10,000
Molybdenum Mo ppm 1 10,000
Nickel Ni ppm 1 10,000
Lead Pb ppm 2 10,000
Scandium Sc ppm 1 10,000
Zinc Zn ppm 2 10,000
11.2.2 SGS Canada Assays
Sample analysis at SGS Canada was by method GE-ICM90A. This method is a sodium
peroxide fusion followed by acid dissolution and assay using combined ICP-AES and ICP-
MS for 55 elements. The limits of detection for the method are as noted in Table 11.7.

84
Table 11.7
Limits of Detection SGS Method GE-ICM90A
Element Detection
Limits Element
Detection
Limits Element
Detection
Limits
Ag 1-1,000 Ge 1-1,000 ppm Sb 0.1-10,000 ppm
Al 0.01-25% Hf 1-10,000 ppm Sm 0.1-1,000 ppm
As 0.0005-10% Ho 0.05-1,000 ppm Sn 1-10,000 ppm
Ba 0.5-10,000ppm In 0.2-1,000 ppm Sr 0.1-10,000 ppm
Be 5-2,500 ppm K 0.1-25% Ta 0.5-0,000 ppm
Bi 0.1-1,000 ppm La 0.1-10,000 ppm Tb 0.05-1,000 ppm
Ca 0.1-35% Li 0.001-5% Th 0.1-1,000 ppm
Cd 0.2-10,000 ppm Lu 0.05-1,000 ppm Ti 0.01-25%
Ce 0.1-10,000 ppm Mg 0.01-30% Tl 0.5-1,000 ppm
Co 0.5-10,000 ppm Mn 0.001-10% Tm 0.05-1,000 ppm
Cr 0.001-10% Mo 2-10,000 ppm U 0.05-1,000 ppm
Cs 0.1-10,000 ppm Nb 1-10,000 ppm V 5-10,000 ppm
Cu 5-10,000 ppm Nd 0.1-10,000 ppm W 1-10,000 ppm
Dy 0.05-1,000 ppm Ni 5-10,000 ppm Y 0.5-1,000 ppm
Er 0.05-1,000 ppm P 0.01-25% Yb 0.1-1,000 ppm
Eu 0.05-1,000 ppm Pb 5-10,000 ppm Zn 5-10,000 ppm
Fe 0.01-30% Pr 0.05-1,000 ppm Zr 0.5-10,000 ppm
Ga 1-1,000 ppm Rb 0.2-10,000 ppm
Gd 0.05-1,000 ppm Sc 0.0005-5%
11.2.3 Actlabs Assays
Assaying of coarse duplicate samples in 2014 or initial analysis in 2015 at Actlabs was by
method FUS-MS-Na2O2, a sodium peroxide fusion, followed by acid dissolution and ICP-
MS finish. Tin and tungsten, if high grade and over limits for ICP, were rerun using the XRF
method.
In detail, samples classified as mineralized were routinely analysed by Actlabs methods as
follows:
1. Weighing of samples as received.
2. Sample log-in with bar code.
3. Coarse crush ½ core (about 4 kgs) to 90%, -6 mesh, or <3.36 mm.
4. Sample split out 1 kg using rotary splitter.
5. Crush the 1 kg sample to -10 mesh, or ~2mm.
6. Riffle-split and pulverize 250 g to 95% passing 200 mesh.
7. Pulverize a 125 g duplicate split every ten samples to prepare a duplicate to be
shipped to the secondary laboratory.
8. Analysis of the pulp by methods Ultratrace 7 plus 1E-Ag, Whole Rock Package 4C
plus XRF Sn and W. Any Cu or Zn over limits, run 8-peroxide analyses. Also,
complete 4C-C, S.

85
The purpose of the initial coarse crush at -6 mesh was in order to preserve sample suitable for
a future metallurgical pilot plant. Normal -10 mesh preparation for assaying purposes would
provide sample too fine grained for metallurgical testing.
For samples considered unmineralized, the approach was slightly different:
1. Weighing of samples as received.
2. Sample log-in with bar code.
3. Coarse crush ½ core (about 4 kgs) to 90%, -10 mesh, or 2 mm.
4. Riffle split and pulverize weighed 100 g to 95% passing 200 mesh.
5. Combine three pulverized contiguous drill core samples to make one 300 g sample (in
cases where three contiguous samples were not present, then either one or two
samples were utilized).
6. These samples were then prefixed with “COMP” and the number of the last sample in
the sequence.
7. Analysis of the pulp by methods Ultratrace 7, Whole Rock Package 7 and 4F-C, S.
For unmineralized samples, combining typically three samples at a time reduced analytical
costs, but still provided continuous geochemistry aimed at modelling acid generation
potential of any waste rock to be mined from future open pits.
Method Ultratrace 7: This method utilizes sodium peroxide fusion, followed by ICP-MS or
ICP. This method provides analyses for 56 elements, including Sn, In, Zn, Cu and Li.
However, its maximum level for base metals is 10,000 ppm or 1%.
Method Whole Rock 4C: This method utilizes lithium metaborate/tetraborate fusion
followed by XRF to provide the standard suite of major rock forming elements plus Loss on
Ignition (LOI). Analysis of Sn and W by XRF was added to this package. Note that early in
the program Actlabs reported tin as SnO2 in %, not Sn in ppm. At Avalon’s request, this was
changed partway through the program.
Method Code 8-Peroxide: This analysis utilizes sodium peroxide fusion and ICP-MS
similar to Ultratrace 7 but adjusted to provide high upper limits for Cu and Zn.
Method 4F-C, S: An add on to method 4C using solid state infrared absorption.
11.3 LABORATORY CERTIFICATIONS
ALS laboratories in Sudbury and Vancouver are ISO 9001 certified. The Vancouver
laboratory holds ISO 17025 certification for most procedures, including EMS81 and XRF10.
The laboratories follow a well-documented internal quality assurance/quality control
(QA/QC) protocol for control of sample preparation and for assay quality control and quality
86
assurance. Internal assay QA/QC procedures include the insertion of certified blanks and
standards in each assay batch and the analysis of internal laboratory duplicates and replicates
at a rate of 5% of the assay samples.
SGS Canada at Lakefield holds ISO 17025 certification for laboratory quality assurance and
quality control. The laboratory follows a standardized protocol for insertion of certified
standards and blanks, internal duplicates and replicates.
Activation Laboratories Ltd. (Actlabs) is ISO 17025 accredited and/or certified to 9001:
2008. It is also a Standards Council of Canada accredited laboratory (Accreditation Number
0266) and follows a standardized protocol for insertion of certified standards and blanks.
Natural Resources Canada (NRCan) helps improve the reliability of measurements at mineral
analysis labs in Canada and around the world by certifying reference materials. Certified
reference materials—Canadian ores, rocks, concentrates, tailings, soils, alloys, anodes and
radioactive materials—are used as standards to validate analytical measurement methods or
to calibrate analytical instruments used in analytical chemistry. These standards support
decision-making around mineral resource production, commodity valuation and compliance
with environmental regulations. NRCan’s analysis and certification is conducted through its
Canadian Certified Reference Materials Project (CCRMP) run by CANMET, the NRCAN
laboratory.
Ore Research & Exploration Pty Ltd (ORE) is an Australian-based company specialising in
the development of low cost certified reference materials (CRMs) for the mining and
exploration industry since 1988. ORE combines a blend of innovative technology with
world’s best practices to maintain its position as a leading producer of reference materials.
In the opinion of the author, the standard QA/QC procedures employed by each of the sample
preparation and assay laboratories are acceptable.
11.4 SAMPLE SECURITY
The sample security measures employed included a documented chain of custody and
shipment of samples in secure packaging by reputable courier companies. Sample receipt
notifications were provided by each laboratory to Avalon and no discrepancies between the
sample lists and the receipt notices were noted. Sample security at the drill rig and at the core
logging facility was deemed to be adequate for the type of samples and no deficiencies in the
drill core handling and sample storage procedures were noted.
Overall, the author is satisfied that the sample preparation, sample assaying and sample
security procedures employed were adequate for the purposes and no deficiencies were
noted.
87
12.0 DATA VERIFICATION
The following section outlines the procedures adopted for the processing of drill core from
the 2014 and 2015 drill programs used as the basis for estimating the mineral resources.
Methodology and practices applied for sampling of the low-grade ore stockpile are
summarized in Section 11.1.3.
12.1 DATA VERIFICATION – HISTORICAL DATA AND 2014 DRILL PROGRAM
Data verification for the 2014 drill program and the historical data in the resource database
included the following:
1. Comparison of 2014 drill core sample numbers against assay sample shipment lists
and sample receipt list. One discrepancy in the original sample numbering sequence
for the 10 mesh check samples was noted. This appears to be a sequence numbering
error in the shipment list which was corrected by the receiving laboratories.
2. Drill collar coordinates were surveyed in by a qualified Nova Scotia land surveyor
(Scotia Surveys) using a Magellan Ashtech ProMark2 static GPS equipment. The
base station occupied Nova Scotia High Precision Network monument #229333.
Survey data was recorded in Nova Scotia 3° M.T.M. projection, Zone 5, NAD 83,
ATS 77 Coordinates and converted to NAD 27 UTM coordinates by Scotia Surveys
to match the coordinate system used in the database.
3. Site visit and inspection of 2014 drilling procedures, core logging, and sampling for
the 2014 drill program by Hains Engineering.
4. Collection of due diligence ¼-core samples and independent assaying of samples
from holes EKAV 14-001 through EKAV 14-004 of the 2014 drill program by Hains
Engineering.
5. Comparison of 2014 drill core assays against assay certificates. PDF assay certificates
were manually checked against Excel copies of assay certificates and against the
sample data base.
6. Comparison of historic drill logs and assay certificates against the historic Excel
database used in the resource estimate.
7. Verification of historic Rio Algom Limited (RAL) QA/QC data detailed in the 1983
feasibility study against the historic drill logs and the resource database.
8. Inspection of selected historic drill core stored at the NSDNR Core Library in
Stellarton, Nova Scotia and verification of descriptions in historic drill logs by Hains
Engineering.
9. Collection of due diligence ¼-core samples and independent assaying of samples
from selected drill core intervals of historic drill core stored at Stellarton by Hains
Engineering.

88
The due diligence’ check samples collected from the Stellarton historic drill core were
assayed at SGS Lakefield. The assay results are shown in Table 12.1.
Table 12.1
Due Diligence Check Samples, Stellarton Historic Drill Core Storage Library
Hole No. Interval Sample
Number
Assay
From (m) To (m) Sn (%) Cu (%) Zn (%)
89-229
7.0 10.0 20734 1.024 0.19 1.94
10.0 13.0 20735 1.118 0.30 0.68
7.0 13.0 1.07 0.25 1.31
Due Diligence Samples ¼ core
7.0 8.5 B00010551 0.63 0.16 1.77
8.5 10.0 B00010552 0.29 0.17 1.02
Length Weighted 7.0 10.0 0.46 0.17 1.40
10.0 11.5 B00010553 1.64 0.08 0.34
11.5 13.0 B00010554 0.49 0.34 0.95
Length Weighted 10.0 13.0 1.07 0.21 0.65
7.0 13.0 0.77 0.19 1.03
Given the high heterogeneity of short sample intervals, especially relatively high-grade
samples, the comparison of assay results is reasonable.
Due diligence samples collected by Hains Engineering from holes EKAV 14-001 through
EKAV 14-004 were ¼-core samples. These samples were assayed at SGS Lakefield using
peroxide fusion with an ICP-OES finish for Sn, Cu and Zn and an atomic absorption (AA)
finish for In. Detection limits for this method are not directly comparable to other assay
methods such as the methods used to assay the main samples at ALS Canada Ltd. (ALS) in
Vancouver. The results of the due diligence assays and comparison with the original assays
from ALS are detailed in Table 12.2.
The results are in broad agreement, although it is noted that the sampling differences, short
sample intervals and the nuggety nature of the tin mineralization give rise to potential for
wide variations in assay results, especially for tin.
The results of the data verification indicated no issues with drill core sampling, sample
preparation and security and the 2014 drill program assay data base. Review by Hains
Engineering of the historic drill core stored in Stellarton indicated that the historic drill logs
adequately represented the historic drill core and that there is no reason to believe the historic
drill logs misrepresent the reported mineralization. The data verification process has
confirmed the historic assay database.
Due diligence sampling has confirmed the general tenor of mineralization in the samples
analysed and the results give no reason to doubt the integrity of the main samples.
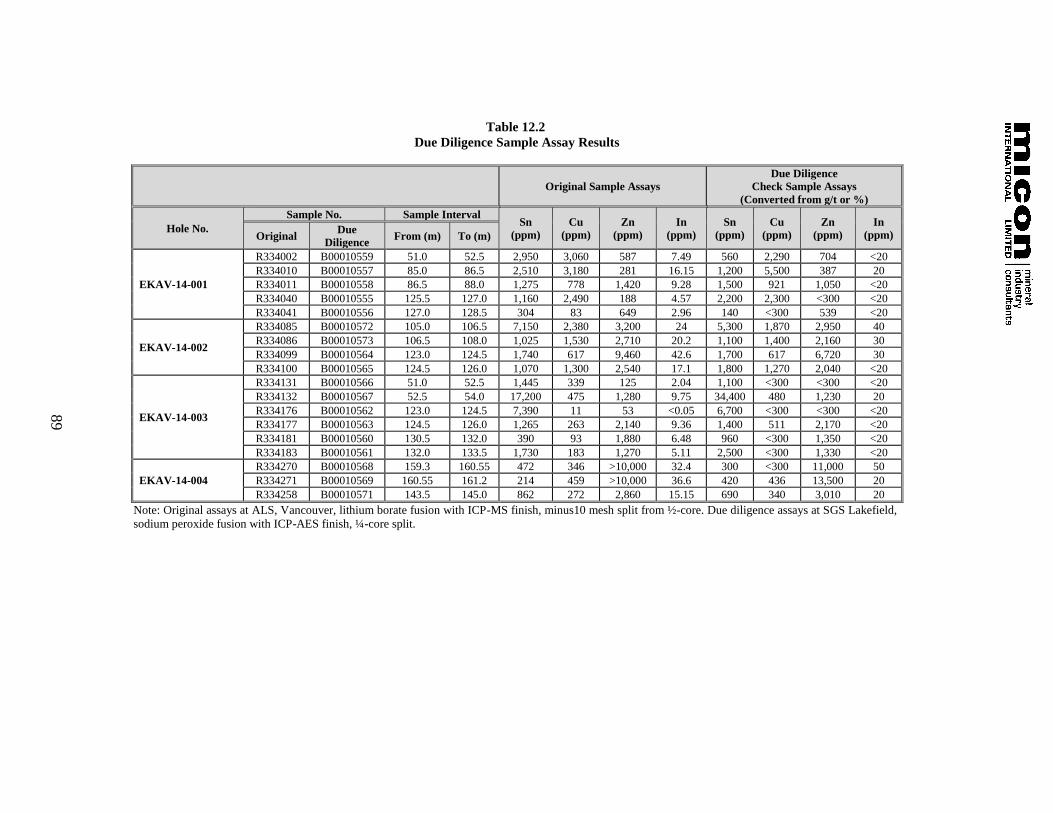
89
Table 12.2
Due Diligence Sample Assay Results
Original Sample Assays
Due Diligence
Check Sample Assays
(Converted from g/t or %)
Hole No.
Sample No. Sample Interval Sn
(ppm)
Cu
(ppm)
Zn
(ppm)
In
(ppm)
Sn
(ppm)
Cu
(ppm)
Zn
(ppm)
In
(ppm) Original Due
Diligence From (m) To (m)
EKAV-14-001
R334002 B00010559 51.0 52.5 2,950 3,060 587 7.49 560 2,290 704 <20
R334010 B00010557 85.0 86.5 2,510 3,180 281 16.15 1,200 5,500 387 20
R334011 B00010558 86.5 88.0 1,275 778 1,420 9.28 1,500 921 1,050 <20
R334040 B00010555 125.5 127.0 1,160 2,490 188 4.57 2,200 2,300 <300 <20
R334041 B00010556 127.0 128.5 304 83 649 2.96 140 <300 539 <20
EKAV-14-002
R334085 B00010572 105.0 106.5 7,150 2,380 3,200 24 5,300 1,870 2,950 40
R334086 B00010573 106.5 108.0 1,025 1,530 2,710 20.2 1,100 1,400 2,160 30
R334099 B00010564 123.0 124.5 1,740 617 9,460 42.6 1,700 617 6,720 30
R334100 B00010565 124.5 126.0 1,070 1,300 2,540 17.1 1,800 1,270 2,040 <20
EKAV-14-003
R334131 B00010566 51.0 52.5 1,445 339 125 2.04 1,100 <300 <300 <20
R334132 B00010567 52.5 54.0 17,200 475 1,280 9.75 34,400 480 1,230 20
R334176 B00010562 123.0 124.5 7,390 11 53 <0.05 6,700 <300 <300 <20
R334177 B00010563 124.5 126.0 1,265 263 2,140 9.36 1,400 511 2,170 <20
R334181 B00010560 130.5 132.0 390 93 1,880 6.48 960 <300 1,350 <20
R334183 B00010561 132.0 133.5 1,730 183 1,270 5.11 2,500 <300 1,330 <20
EKAV-14-004
R334270 B00010568 159.3 160.55 472 346 >10,000 32.4 300 <300 11,000 50
R334271 B00010569 160.55 161.2 214 459 >10,000 36.6 420 436 13,500 20
R334258 B00010571 143.5 145.0 862 272 2,860 15.15 690 340 3,010 20
Note: Original assays at ALS, Vancouver, lithium borate fusion with ICP-MS finish, minus10 mesh split from ½-core. Due diligence assays at SGS Lakefield,
sodium peroxide fusion with ICP-AES finish, ¼-core split.
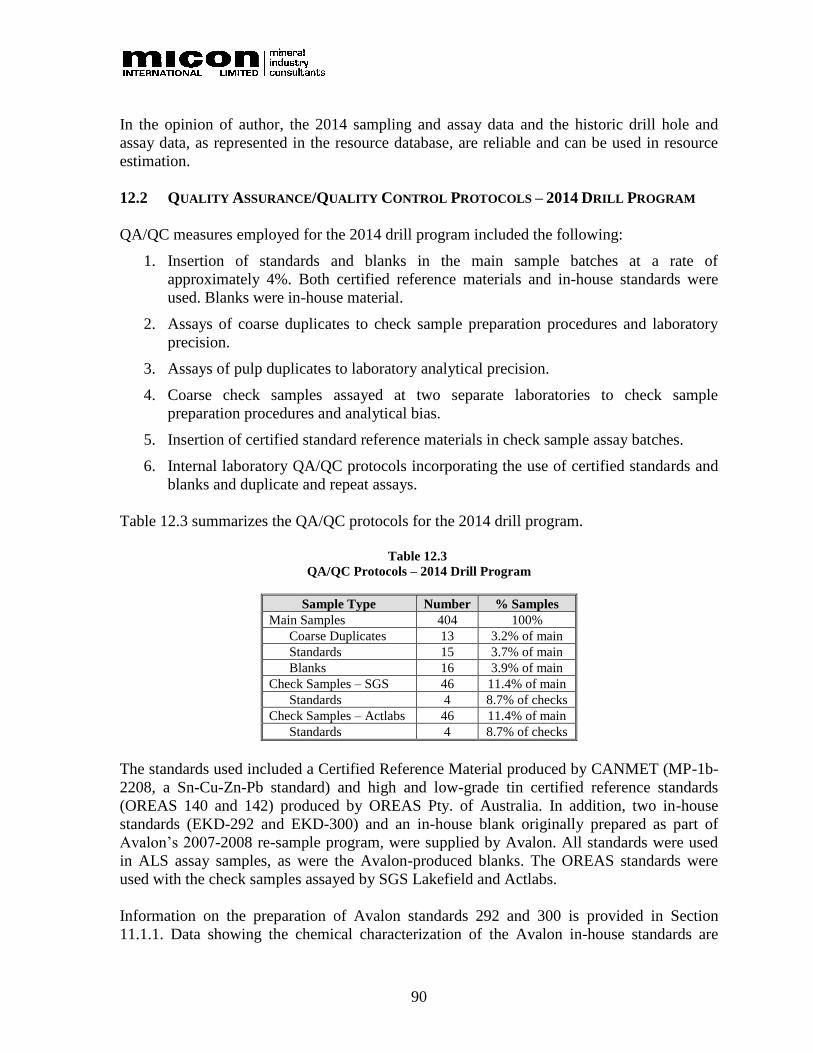
90
In the opinion of author, the 2014 sampling and assay data and the historic drill hole and
assay data, as represented in the resource database, are reliable and can be used in resource
estimation.
12.2 QUALITY ASSURANCE/QUALITY CONTROL PROTOCOLS – 2014 DRILL PROGRAM
QA/QC measures employed for the 2014 drill program included the following:
1. Insertion of standards and blanks in the main sample batches at a rate of
approximately 4%. Both certified reference materials and in-house standards were
used. Blanks were in-house material.
2. Assays of coarse duplicates to check sample preparation procedures and laboratory
precision.
3. Assays of pulp duplicates to laboratory analytical precision.
4. Coarse check samples assayed at two separate laboratories to check sample
preparation procedures and analytical bias.
5. Insertion of certified standard reference materials in check sample assay batches.
6. Internal laboratory QA/QC protocols incorporating the use of certified standards and
blanks and duplicate and repeat assays.
Table 12.3 summarizes the QA/QC protocols for the 2014 drill program.
Table 12.3
QA/QC Protocols – 2014 Drill Program
Sample Type Number % Samples
Main Samples 404 100%
Coarse Duplicates 13 3.2% of main
Standards 15 3.7% of main
Blanks 16 3.9% of main
Check Samples – SGS 46 11.4% of main
Standards 4 8.7% of checks
Check Samples – Actlabs 46 11.4% of main
Standards 4 8.7% of checks
The standards used included a Certified Reference Material produced by CANMET (MP-1b-
2208, a Sn-Cu-Zn-Pb standard) and high and low-grade tin certified reference standards
(OREAS 140 and 142) produced by OREAS Pty. of Australia. In addition, two in-house
standards (EKD-292 and EKD-300) and an in-house blank originally prepared as part of
Avalon’s 2007-2008 re-sample program, were supplied by Avalon. All standards were used
in ALS assay samples, as were the Avalon-produced blanks. The OREAS standards were
used with the check samples assayed by SGS Lakefield and Actlabs.
Information on the preparation of Avalon standards 292 and 300 is provided in Section
11.1.1. Data showing the chemical characterization of the Avalon in-house standards are
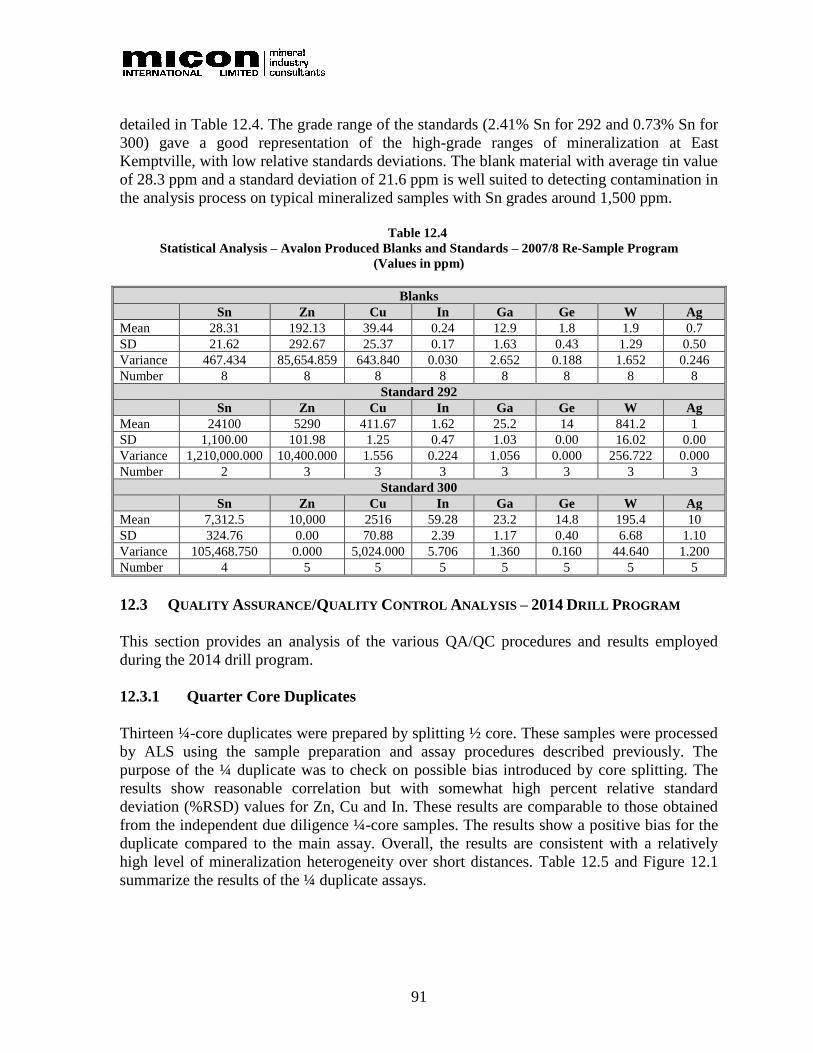
91
detailed in Table 12.4. The grade range of the standards (2.41% Sn for 292 and 0.73% Sn for
300) gave a good representation of the high-grade ranges of mineralization at East
Kemptville, with low relative standards deviations. The blank material with average tin value
of 28.3 ppm and a standard deviation of 21.6 ppm is well suited to detecting contamination in
the analysis process on typical mineralized samples with Sn grades around 1,500 ppm.
Table 12.4
Statistical Analysis – Avalon Produced Blanks and Standards – 2007/8 Re-Sample Program
(Values in ppm)
Blanks
Sn Zn Cu In Ga Ge W Ag
Mean 28.31 192.13 39.44 0.24 12.9 1.8 1.9 0.7
SD 21.62 292.67 25.37 0.17 1.63 0.43 1.29 0.50
Variance 467.434 85,654.859 643.840 0.030 2.652 0.188 1.652 0.246
Number 8 8 8 8 8 8 8 8
Standard 292
Sn Zn Cu In Ga Ge W Ag
Mean 24100 5290 411.67 1.62 25.2 14 841.2 1
SD 1,100.00 101.98 1.25 0.47 1.03 0.00 16.02 0.00
Variance 1,210,000.000 10,400.000 1.556 0.224 1.056 0.000 256.722 0.000
Number 2 3 3 3 3 3 3 3
Standard 300
Sn Zn Cu In Ga Ge W Ag
Mean 7,312.5 10,000 2516 59.28 23.2 14.8 195.4 10
SD 324.76 0.00 70.88 2.39 1.17 0.40 6.68 1.10
Variance 105,468.750 0.000 5,024.000 5.706 1.360 0.160 44.640 1.200
Number 4 5 5 5 5 5 5 5
12.3 QUALITY ASSURANCE/QUALITY CONTROL ANALYSIS – 2014 DRILL PROGRAM
This section provides an analysis of the various QA/QC procedures and results employed
during the 2014 drill program.
12.3.1 Quarter Core Duplicates
Thirteen ¼-core duplicates were prepared by splitting ½ core. These samples were processed
by ALS using the sample preparation and assay procedures described previously. The
purpose of the ¼ duplicate was to check on possible bias introduced by core splitting. The
results show reasonable correlation but with somewhat high percent relative standard
deviation (%RSD) values for Zn, Cu and In. These results are comparable to those obtained
from the independent due diligence ¼-core samples. The results show a positive bias for the
duplicate compared to the main assay. Overall, the results are consistent with a relatively
high level of mineralization heterogeneity over short distances. Table 12.5 and Figure 12.1
summarize the results of the ¼ duplicate assays.

92
Table 12.5
Quarter Core Duplicate Assay Results – 2014 Drill Program
Hole_ID Main
Sample ID
Duplicate
Sample ID
Assay Results
Main (ppm) Duplicate (ppm)
Sn Cu Zn In Sn Cu Zn In
EKAV-14-001 R334027 R334028 91 62 273 1.34 78 37 202 0.84
EKAV-14-002 R334067 R334068 1,050 133 459 1.01 220 107 355 0.88
EKAV-14-002 R334088 R334089 2,070 1,190 2,170 14.3 3,170 1,040 2,170 13.35
EKAV-14-003 R334133 R334134 4,620 906 3,420 26.9 4,260 718 4,160 30.9
EKAV-14-003 R334171 R334172 965 192 3,180 8.74 1,010 178 3,300 8.61
EKAV-14-004 R334223 R334224 435 181 1,480 5.76 377 177 1,400 5.29
EKAV-14-004 R334253 R334254 360 21 1,050 5.83 379 41 1,870 9.44
EKAV-14-005 R334282 R334283 224 59 97 1.84 225 63 100 1.89
EKAV-14-005 R334315 R334316 38 66 397 0.95 43 70 556 1.2
EKAV-14-006 R334345 R334346 3,870 995 1,210 7.63 2,880 741 1,130 6.64
EKAV-14-006 R334381 R334382 1,705 1,295 759 8.26 1,780 1,300 761 8.88
EKAV-14-007 R334416 R334417 3,640 2,930 5,030 57.2 5,840 3,560 8,690 85
EKAV-14-007 R334445 R334446 201 294 437 4.36 165 292 580 5.5
Mean 1,482.23 640.31 1,535.54 11.09 1,571.31 640.31 1,944.15 13.72
SD 1,535.59 801.19 1,444.95 14.93 1,820.99 934.45 2,277.30 21.94
% RSD Difference Main vs Duplicate -12.29% -20.81% -23.00% -25.28%
Figure 12.1
Quarter Core Duplicate Assays – 2014 Drill Program
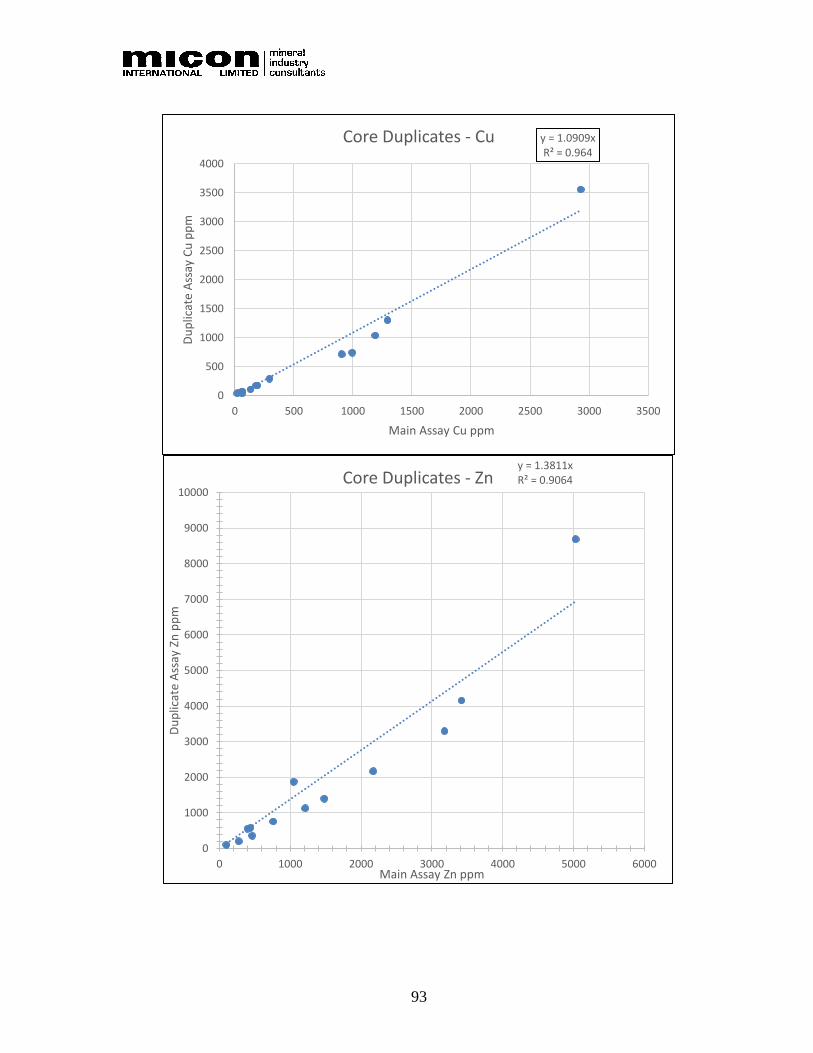
93
y = 1.0909xR² = 0.964
0
500
1000
1500
2000
2500
3000
3500
4000
0 500 1000 1500 2000 2500 3000 3500
Du
plic
ate
Ass
ay C
u p
pm
Main Assay Cu ppm
Core Duplicates - Cu
y = 1.3811xR² = 0.9064
0
1000
2000
3000
4000
5000
6000
7000
8000
9000
10000
0 1000 2000 3000 4000 5000 6000
Du
plic
ate
Ass
ay Z
n p
pm
Main Assay Zn ppm
Core Duplicates - Zn

94
12.3.2 Check Assays
Coarse splits (-10 mesh) for the ½-core samples were prepared and assayed at SGS Lakefield
and Actlabs. Comparisons of the assay results provide information on sample preparation and
assay method variation. Overall, the results show excellent correlation between the ALS
results and those obtained by either SGS Lakefield or Actlabs. Some differences can be noted
between the laboratories indicating either a slight positive or negative bias in assays for Sn,
Cu, Zn and In, with SGS Lakefield generally being slightly upwardly biased compared to
either ALS or Actlabs. Figure 12.2 and Figure 12.3 illustrate the results of the check assays
between ALS and either SGS Lakefield or Actlabs. Figure 12.4 provides a comparison
between the SGS Lakefield results and the Actlabs results. In all cases, values reporting over
limits have been set to 10,000 ppm.
y = 1.3789xR² = 0.9743
0
10
20
30
40
50
60
70
80
90
0 10 20 30 40 50 60 70
Du
plic
ate
Ass
ay In
pp
m
Main Assay - In ppm
Core Duplicates - In

95
Figure 12.2
Check Assay Results, ALS vs SGS Lakefield
y = 1.0219xR² = 0.9918
0
1000
2000
3000
4000
5000
6000
7000
8000
9000
10000
0 1000 2000 3000 4000 5000 6000 7000 8000 9000 10000
SGS
Ch
eck
Ass
ay S
n (
pp
m)
ALS Main Assay - Sn (ppm)
Main ALS Assay vs SGS Check Assay - Sn
y = 1.057xR² = 0.9972
0
500
1000
1500
2000
2500
3000
3500
4000
0 500 1000 1500 2000 2500 3000 3500
SGS
Ch
eck
Ass
ay -
Cu
(p
pm
)
ALS Main Assay - Cu (ppm)
Main ALS Assay vs SGS Check Assay - Cu
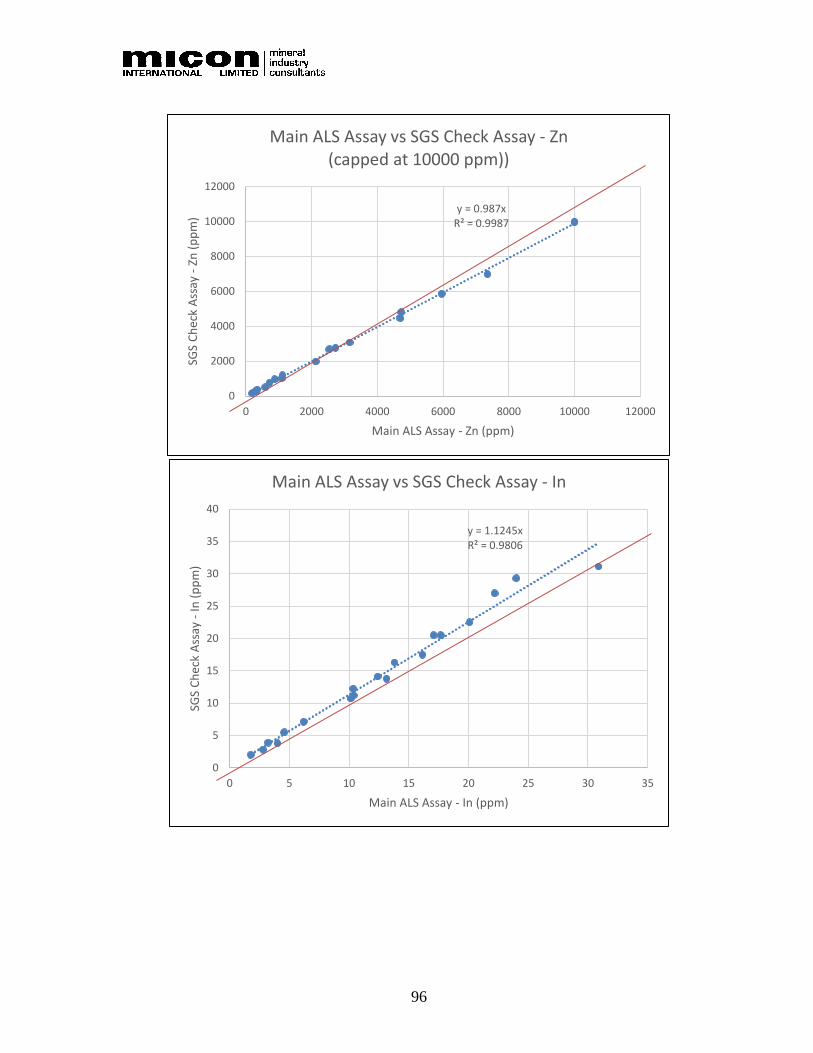
96
y = 0.987xR² = 0.9987
0
2000
4000
6000
8000
10000
12000
0 2000 4000 6000 8000 10000 12000
SGS
Ch
eck
Ass
ay -
Zn (
pp
m)
Main ALS Assay - Zn (ppm)
Main ALS Assay vs SGS Check Assay - Zn (capped at 10000 ppm))
y = 1.1245xR² = 0.9806
0
5
10
15
20
25
30
35
40
0 5 10 15 20 25 30 35
SGS
Ch
eck
Ass
ay -
In (
pp
m)
Main ALS Assay - In (ppm)
Main ALS Assay vs SGS Check Assay - In
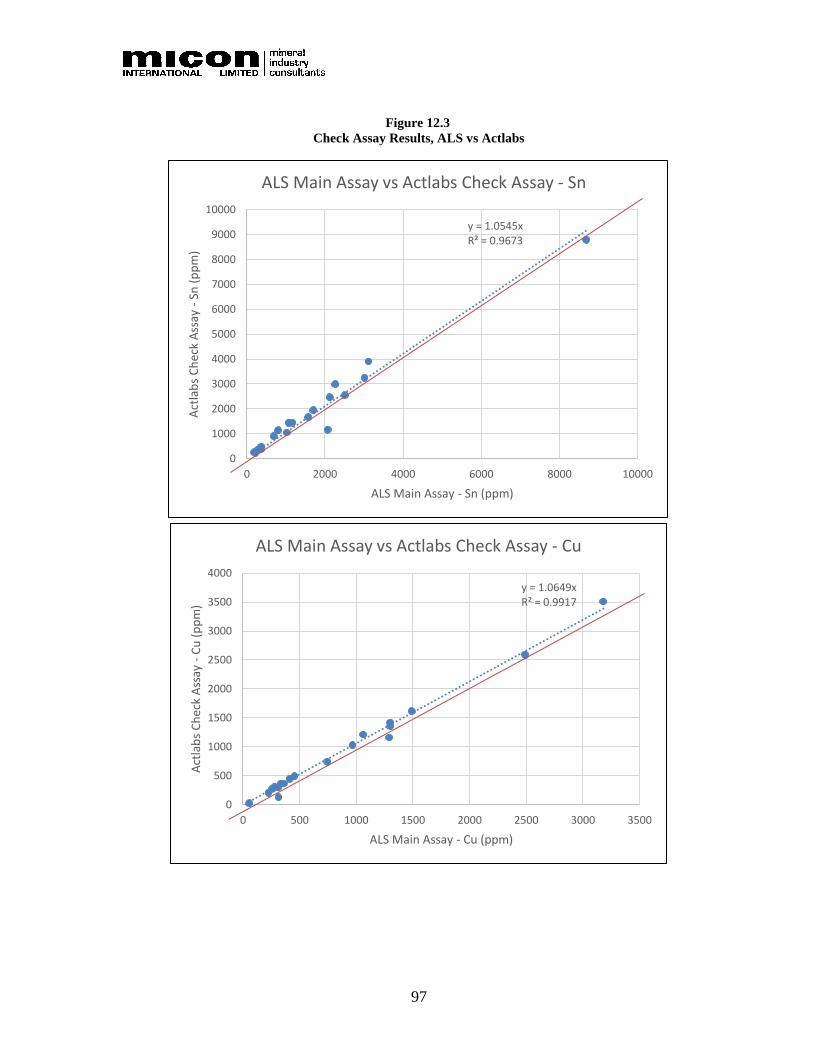
97
Figure 12.3
Check Assay Results, ALS vs Actlabs
y = 1.0545xR² = 0.9673
0
1000
2000
3000
4000
5000
6000
7000
8000
9000
10000
0 2000 4000 6000 8000 10000
Act
lab
s C
hec
k A
ssay
-Sn
(p
pm
)
ALS Main Assay - Sn (ppm)
ALS Main Assay vs Actlabs Check Assay - Sn
y = 1.0649xR² = 0.9917
0
500
1000
1500
2000
2500
3000
3500
4000
0 500 1000 1500 2000 2500 3000 3500
Act
lab
s C
hec
k A
ssay
-C
u (
pp
m)
ALS Main Assay - Cu (ppm)
ALS Main Assay vs Actlabs Check Assay - Cu
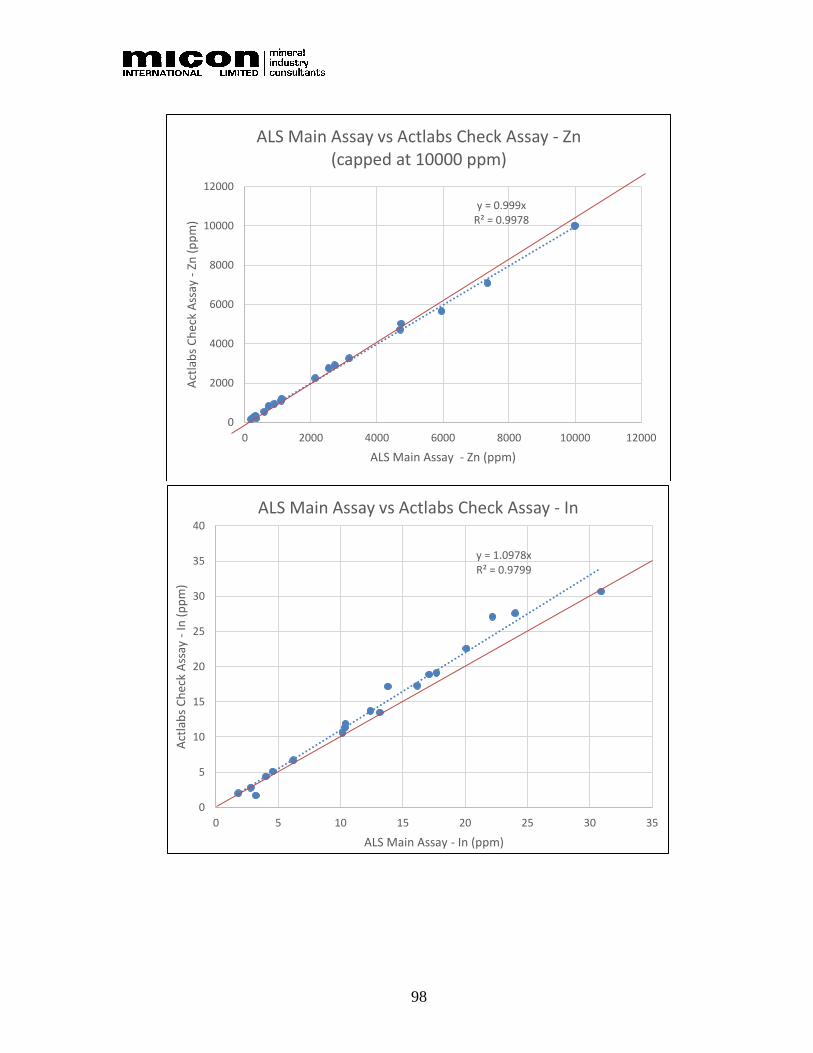
98
y = 0.999xR² = 0.9978
0
2000
4000
6000
8000
10000
12000
0 2000 4000 6000 8000 10000 12000
Act
lab
s C
hec
k A
ssay
-Zn
(p
pm
)
ALS Main Assay - Zn (ppm)
ALS Main Assay vs Actlabs Check Assay - Zn (capped at 10000 ppm)
y = 1.0978xR² = 0.9799
0
5
10
15
20
25
30
35
40
0 5 10 15 20 25 30 35
Act
lab
s C
hec
k A
ssay
-In
(p
pm
)
ALS Main Assay - In (ppm)
ALS Main Assay vs Actlabs Check Assay - In

99
Figure 12.4
Check Assay Results, SGS Lakefield vs Actlabs
y = 0.9889x + 156.17R² = 0.9697
0
1000
2000
3000
4000
5000
6000
7000
8000
9000
10000
0 2000 4000 6000 8000 10000
Act
Lab
s A
ssay
Sn
pp
m
SGS Assay Sn ppm
SGS vs Act Labs Check Assays - Sn
R² = 0.9914
0
500
1000
1500
2000
2500
3000
3500
4000
0 500 1000 1500 2000 2500 3000 3500 4000
Act
Lab
s A
ssay
Cu
pp
m
SGS Assay Cu ppm
SGS vs Act Labs Check Assays - Cu
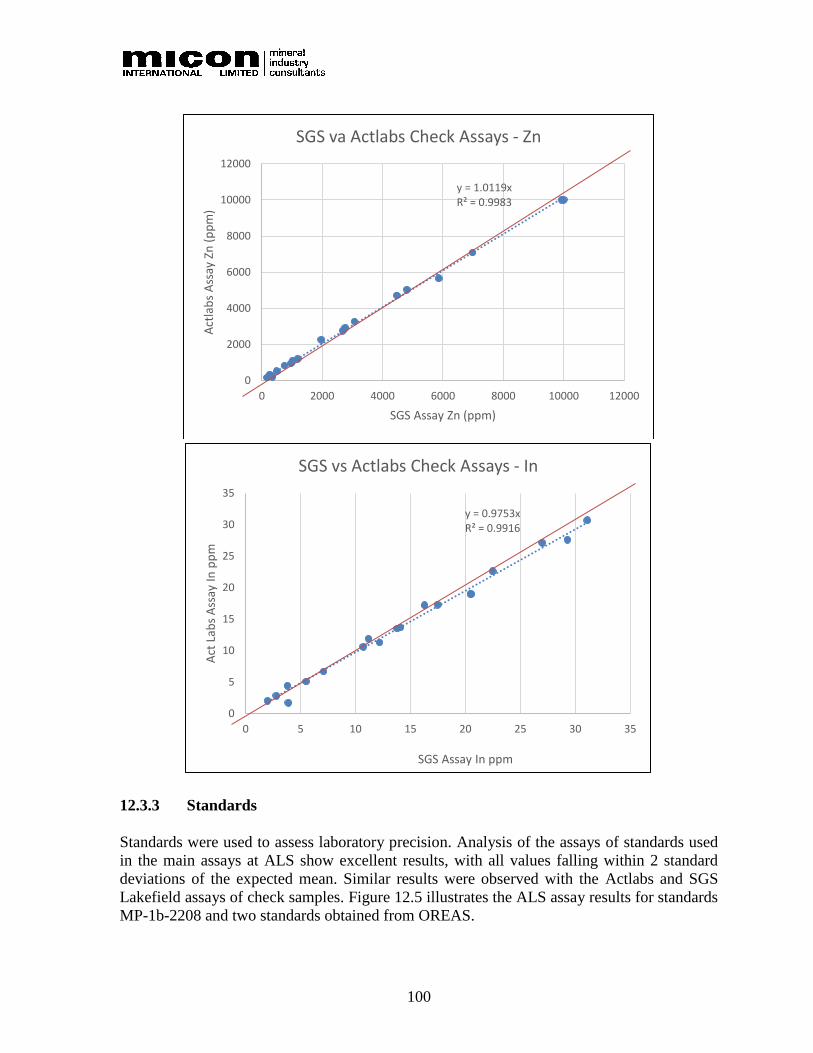
100
12.3.3 Standards
Standards were used to assess laboratory precision. Analysis of the assays of standards used
in the main assays at ALS show excellent results, with all values falling within 2 standard
deviations of the expected mean. Similar results were observed with the Actlabs and SGS
Lakefield assays of check samples. Figure 12.5 illustrates the ALS assay results for standards
MP-1b-2208 and two standards obtained from OREAS.
y = 1.0119xR² = 0.9983
0
2000
4000
6000
8000
10000
12000
0 2000 4000 6000 8000 10000 12000
Act
lab
s A
ssay
Zn
(p
pm
)
SGS Assay Zn (ppm)
SGS va Actlabs Check Assays - Zn
y = 0.9753xR² = 0.9916
0
5
10
15
20
25
30
35
0 5 10 15 20 25 30 35
Act
Lab
s A
ssay
In p
pm
SGS Assay In ppm
SGS vs Actlabs Check Assays - In
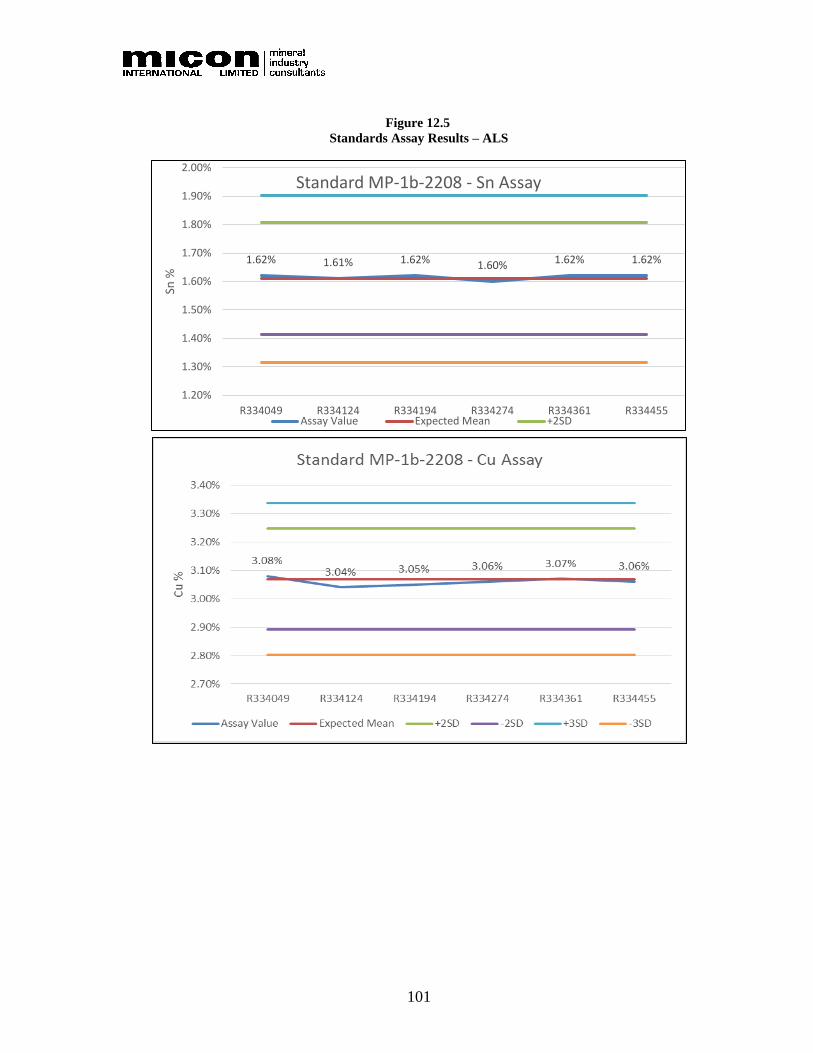
101
Figure 12.5
Standards Assay Results – ALS
1.62% 1.61% 1.62% 1.60% 1.62% 1.62%
1.20%
1.30%
1.40%
1.50%
1.60%
1.70%
1.80%
1.90%
2.00%
R334049 R334124 R334194 R334274 R334361 R334455
Sn %
Standard MP-1b-2208 - Sn Assay
Assay Value Expected Mean +2SD
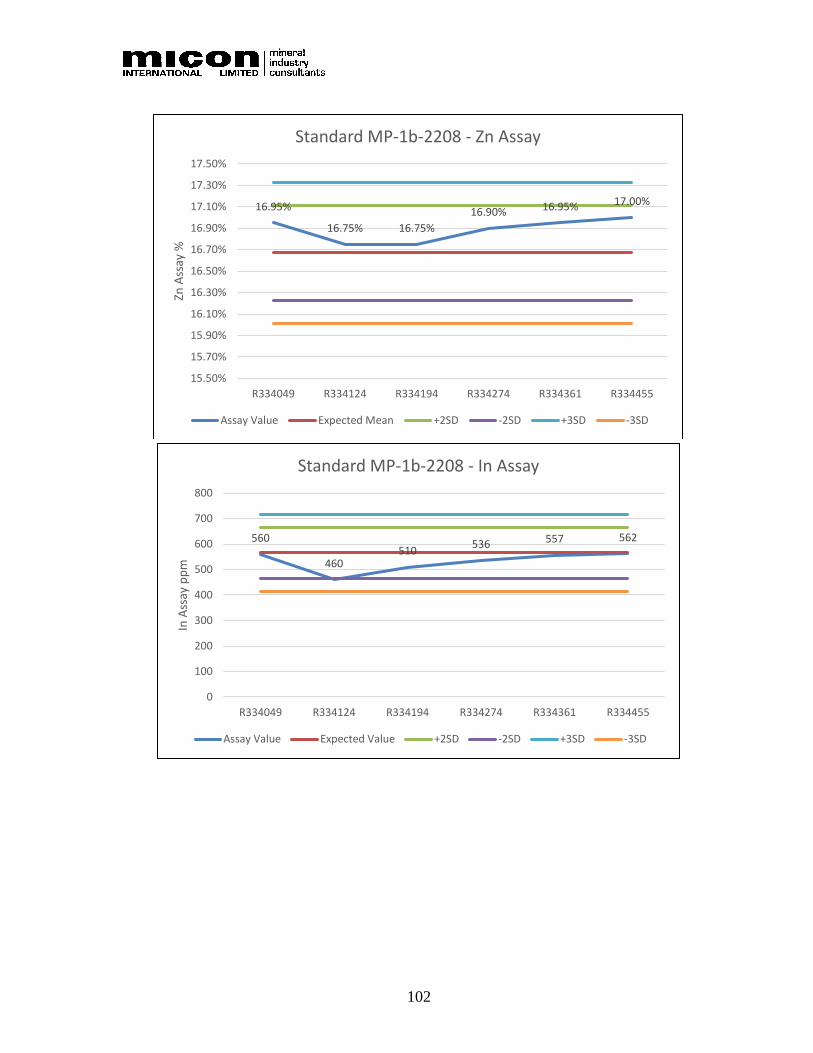
102
16.95%
16.75% 16.75%
16.90% 16.95% 17.00%
15.50%
15.70%
15.90%
16.10%
16.30%
16.50%
16.70%
16.90%
17.10%
17.30%
17.50%
R334049 R334124 R334194 R334274 R334361 R334455
Zn A
ssay
%
Standard MP-1b-2208 - Zn Assay
Assay Value Expected Mean +2SD -2SD +3SD -3SD
560
460510
536 557 562
0
100
200
300
400
500
600
700
800
R334049 R334124 R334194 R334274 R334361 R334455
In A
ssay
pp
m
Standard MP-1b-2208 - In Assay
Assay Value Expected Value +2SD -2SD +3SD -3SD
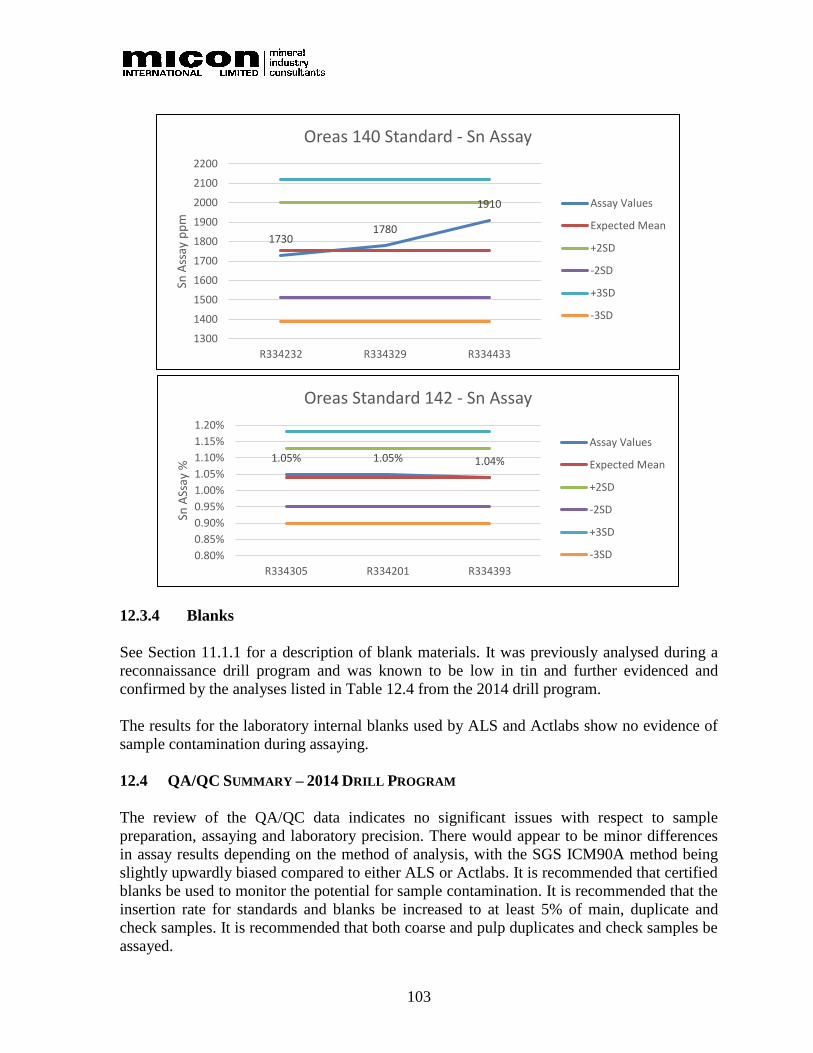
103
12.3.4 Blanks
See Section 11.1.1 for a description of blank materials. It was previously analysed during a
reconnaissance drill program and was known to be low in tin and further evidenced and
confirmed by the analyses listed in Table 12.4 from the 2014 drill program.
The results for the laboratory internal blanks used by ALS and Actlabs show no evidence of
sample contamination during assaying.
12.4 QA/QC SUMMARY – 2014 DRILL PROGRAM
The review of the QA/QC data indicates no significant issues with respect to sample
preparation, assaying and laboratory precision. There would appear to be minor differences
in assay results depending on the method of analysis, with the SGS ICM90A method being
slightly upwardly biased compared to either ALS or Actlabs. It is recommended that certified
blanks be used to monitor the potential for sample contamination. It is recommended that the
insertion rate for standards and blanks be increased to at least 5% of main, duplicate and
check samples. It is recommended that both coarse and pulp duplicates and check samples be
assayed.
17301780
1910
1300
1400
1500
1600
1700
1800
1900
2000
2100
2200
R334232 R334329 R334433
Sn A
ssay
pp
m
Oreas 140 Standard - Sn Assay
Assay Values
Expected Mean
+2SD
-2SD
+3SD
-3SD
1.05% 1.05% 1.04%
0.80%
0.85%
0.90%
0.95%
1.00%
1.05%
1.10%
1.15%
1.20%
R334305 R334201 R334393
Sn A
Ssay
%
Oreas Standard 142 - Sn Assay
Assay Values
Expected Mean
+2SD
-2SD
+3SD
-3SD
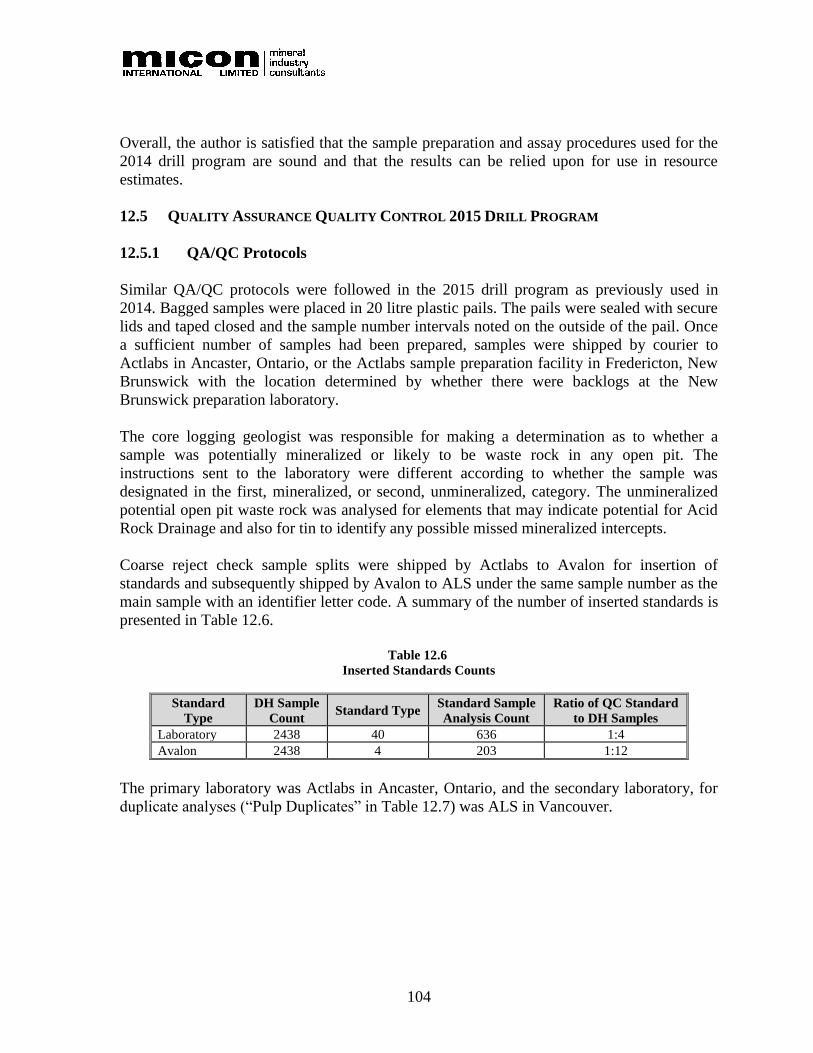
104
Overall, the author is satisfied that the sample preparation and assay procedures used for the
2014 drill program are sound and that the results can be relied upon for use in resource
estimates.
12.5 QUALITY ASSURANCE QUALITY CONTROL 2015 DRILL PROGRAM
12.5.1 QA/QC Protocols
Similar QA/QC protocols were followed in the 2015 drill program as previously used in
2014. Bagged samples were placed in 20 litre plastic pails. The pails were sealed with secure
lids and taped closed and the sample number intervals noted on the outside of the pail. Once
a sufficient number of samples had been prepared, samples were shipped by courier to
Actlabs in Ancaster, Ontario, or the Actlabs sample preparation facility in Fredericton, New
Brunswick with the location determined by whether there were backlogs at the New
Brunswick preparation laboratory.
The core logging geologist was responsible for making a determination as to whether a
sample was potentially mineralized or likely to be waste rock in any open pit. The
instructions sent to the laboratory were different according to whether the sample was
designated in the first, mineralized, or second, unmineralized, category. The unmineralized
potential open pit waste rock was analysed for elements that may indicate potential for Acid
Rock Drainage and also for tin to identify any possible missed mineralized intercepts.
Coarse reject check sample splits were shipped by Actlabs to Avalon for insertion of
standards and subsequently shipped by Avalon to ALS under the same sample number as the
main sample with an identifier letter code. A summary of the number of inserted standards is
presented in Table 12.6.
Table 12.6
Inserted Standards Counts
Standard
Type
DH Sample
Count Standard Type
Standard Sample
Analysis Count
Ratio of QC Standard
to DH Samples
Laboratory 2438 40 636 1:4
Avalon 2438 4 203 1:12
The primary laboratory was Actlabs in Ancaster, Ontario, and the secondary laboratory, for
duplicate analyses (“Pulp Duplicates” in Table 12.7) was ALS in Vancouver.
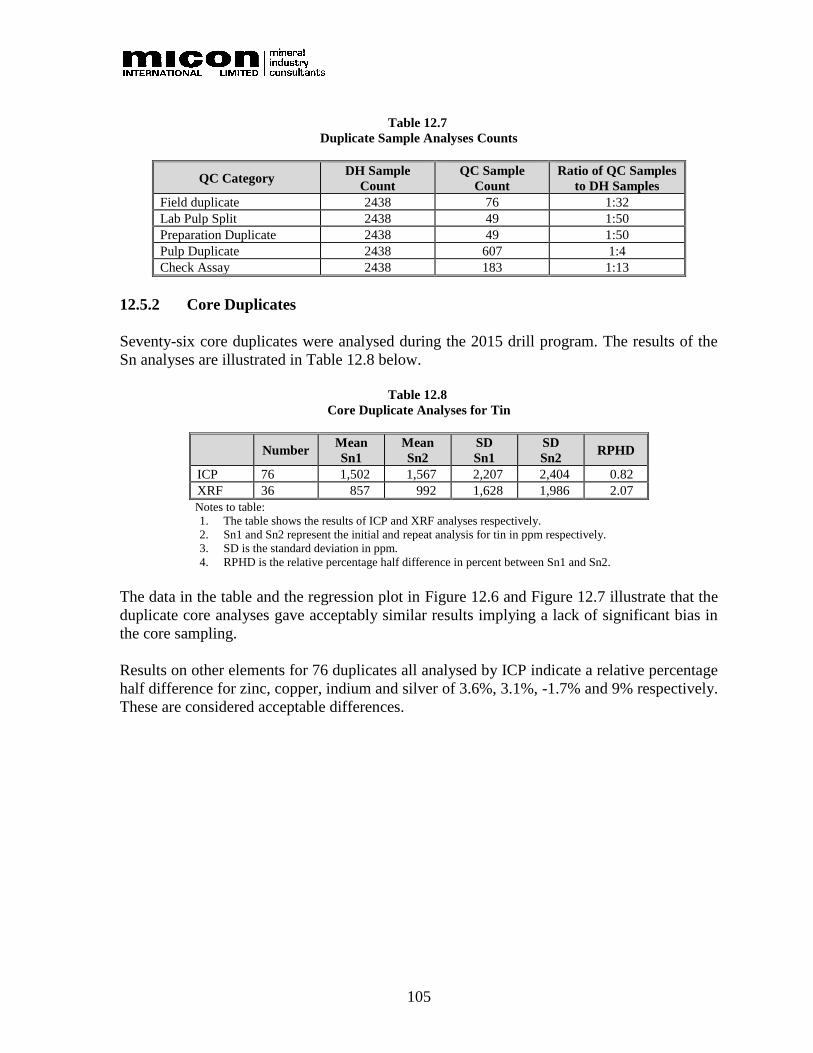
105
Table 12.7
Duplicate Sample Analyses Counts
QC Category DH Sample
Count
QC Sample
Count
Ratio of QC Samples
to DH Samples
Field duplicate 2438 76 1:32
Lab Pulp Split 2438 49 1:50
Preparation Duplicate 2438 49 1:50
Pulp Duplicate 2438 607 1:4
Check Assay 2438 183 1:13
12.5.2 Core Duplicates
Seventy-six core duplicates were analysed during the 2015 drill program. The results of the
Sn analyses are illustrated in Table 12.8 below.
Table 12.8
Core Duplicate Analyses for Tin
Number
Mean
Sn1
Mean
Sn2
SD
Sn1
SD
Sn2 RPHD
ICP 76 1,502 1,567 2,207 2,404 0.82
XRF 36 857 992 1,628 1,986 2.07
Notes to table:
1. The table shows the results of ICP and XRF analyses respectively.
2. Sn1 and Sn2 represent the initial and repeat analysis for tin in ppm respectively.
3. SD is the standard deviation in ppm.
4. RPHD is the relative percentage half difference in percent between Sn1 and Sn2.
The data in the table and the regression plot in Figure 12.6 and Figure 12.7 illustrate that the
duplicate core analyses gave acceptably similar results implying a lack of significant bias in
the core sampling.
Results on other elements for 76 duplicates all analysed by ICP indicate a relative percentage
half difference for zinc, copper, indium and silver of 3.6%, 3.1%, -1.7% and 9% respectively.
These are considered acceptable differences.
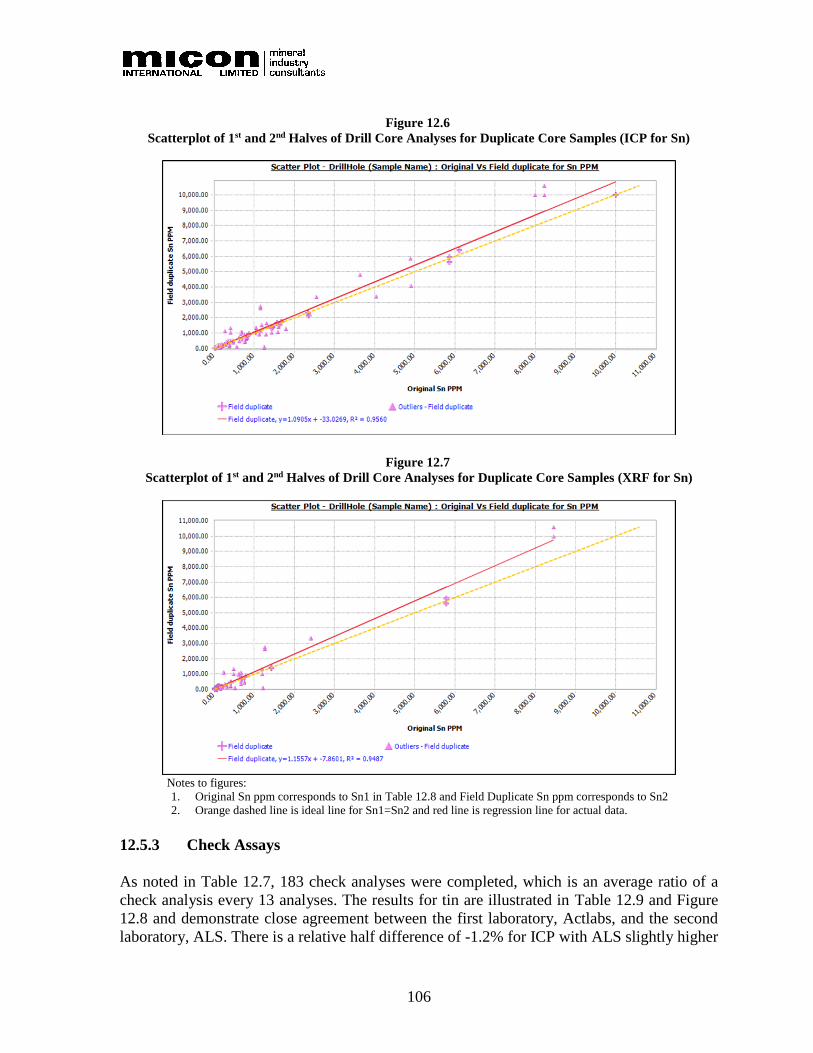
106
Figure 12.6
Scatterplot of 1st and 2nd Halves of Drill Core Analyses for Duplicate Core Samples (ICP for Sn)
Figure 12.7
Scatterplot of 1st and 2nd Halves of Drill Core Analyses for Duplicate Core Samples (XRF for Sn)
Notes to figures:
1. Original Sn ppm corresponds to Sn1 in Table 12.8 and Field Duplicate Sn ppm corresponds to Sn2
2. Orange dashed line is ideal line for Sn1=Sn2 and red line is regression line for actual data.
12.5.3 Check Assays
As noted in Table 12.7, 183 check analyses were completed, which is an average ratio of a
check analysis every 13 analyses. The results for tin are illustrated in Table 12.9 and Figure
12.8 and demonstrate close agreement between the first laboratory, Actlabs, and the second
laboratory, ALS. There is a relative half difference of -1.2% for ICP with ALS slightly higher

107
and a difference of -7.9% for XRF again with ALS higher than Actlabs. This implies that use
of the data from Actlabs will be slightly conservative in terms of tin levels which is a similar
conclusion as for standard analyses.
Table 12.9
Comparison of Actlabs (Sn1) and ALS (Sn2) on Pulp Duplicates
Method No. of
Samples
Mean
Sn1 ppm
Mean
Sn2 ppm
SD
Sn1
SD
Sn2
CV
Sn1
CV
Sn2 sRPHD
ICP 183 1036 1097 1841 2013 1.78 1.84 -1.18
XRF 151 1224 1261 2997 3011 2.45 2.39 -7.87
Figure 12.8
Regression Plot of Pulp Duplicates from Actlabs (Original Sn ppm) and ALS (Check Assay Sn ppm)
12.5.4 Standards
Four standards were routinely used for checks on the laboratory batches being standard LG,
AG, HG and VG. The Sn values are given in Table 12.10 and run charts for the standard
analyses in Figure 12.9 to Figure 12.12.
The results show a consistent negative bias in both Table 12.10 and the figures for both ICP
and XRF analyses between the certified value from the analytical Round Robin and the 2015
drill program results.
It is also clear that the negative bias for ICP analyses is higher at high grades as standard EK-
HG1 has a negative bias of 7.6%. The analyses in the 2015 drill program on the high-grade
standard are 7.6% below the Round Robin average of acceptable laboratories. For XRF, this
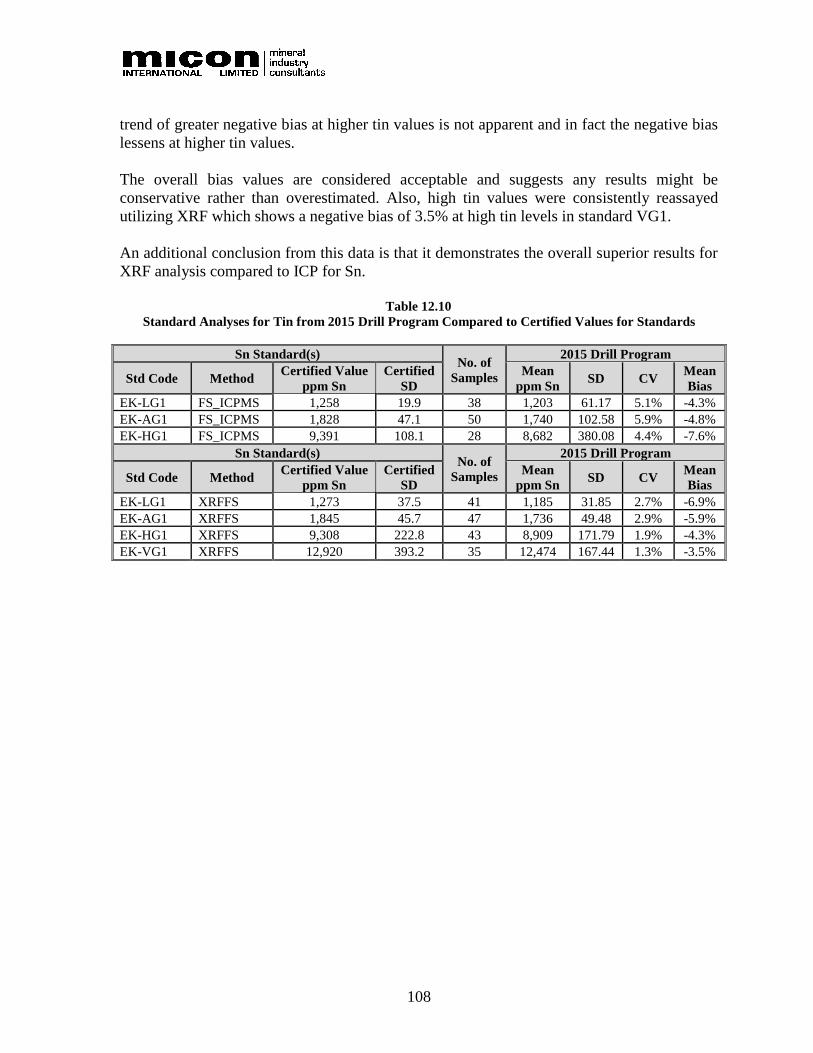
108
trend of greater negative bias at higher tin values is not apparent and in fact the negative bias
lessens at higher tin values.
The overall bias values are considered acceptable and suggests any results might be
conservative rather than overestimated. Also, high tin values were consistently reassayed
utilizing XRF which shows a negative bias of 3.5% at high tin levels in standard VG1.
An additional conclusion from this data is that it demonstrates the overall superior results for
XRF analysis compared to ICP for Sn.
Table 12.10
Standard Analyses for Tin from 2015 Drill Program Compared to Certified Values for Standards
Sn Standard(s) No. of
Samples
2015 Drill Program
Std Code Method Certified Value
ppm Sn
Certified
SD
Mean
ppm Sn SD CV
Mean
Bias
EK-LG1 FS_ICPMS 1,258 19.9 38 1,203 61.17 5.1% -4.3%
EK-AG1 FS_ICPMS 1,828 47.1 50 1,740 102.58 5.9% -4.8%
EK-HG1 FS_ICPMS 9,391 108.1 28 8,682 380.08 4.4% -7.6%
Sn Standard(s) No. of
Samples
2015 Drill Program
Std Code Method Certified Value
ppm Sn
Certified
SD
Mean
ppm Sn SD CV
Mean
Bias
EK-LG1 XRFFS 1,273 37.5 41 1,185 31.85 2.7% -6.9%
EK-AG1 XRFFS 1,845 45.7 47 1,736 49.48 2.9% -5.9%
EK-HG1 XRFFS 9,308 222.8 43 8,909 171.79 1.9% -4.3%
EK-VG1 XRFFS 12,920 393.2 35 12,474 167.44 1.3% -3.5%

109
Figure 12.9
Run Chart for Tin Analysis of Standard EK-LG1 (ICP and XRF)

110
Figure 12.10
Run Chart for Tin Analysis of Standard EK-AG1 (ICP and XRF)
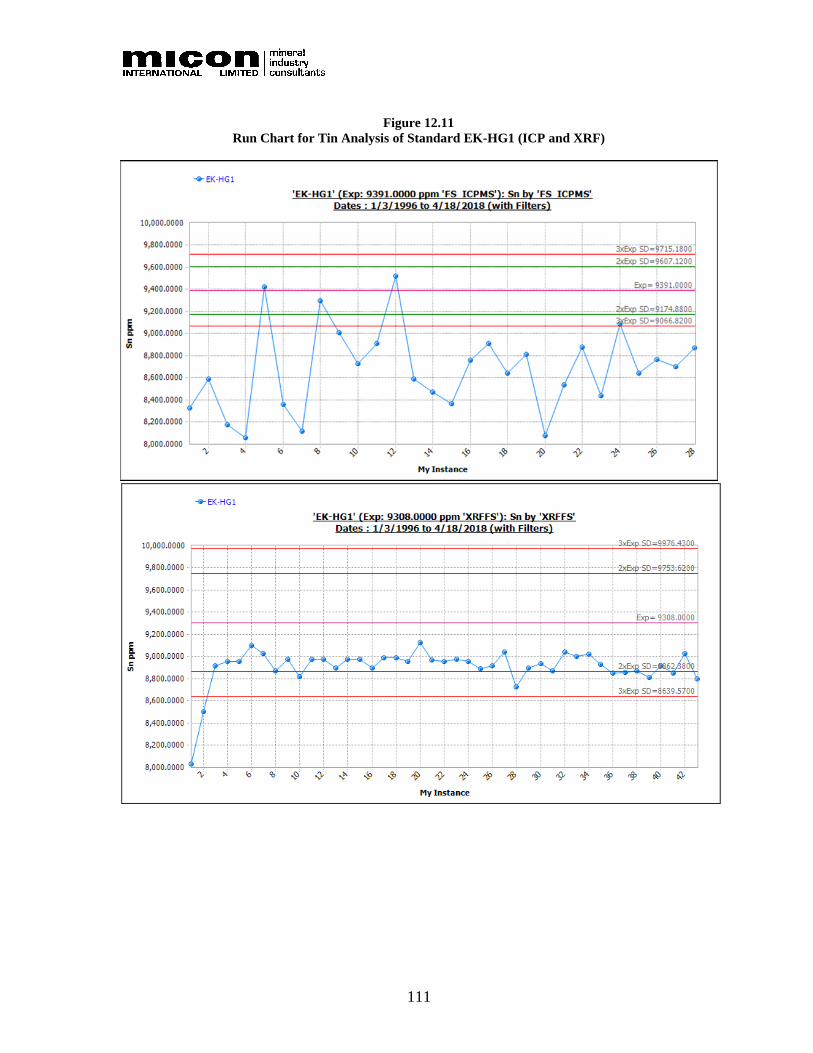
111
Figure 12.11
Run Chart for Tin Analysis of Standard EK-HG1 (ICP and XRF)
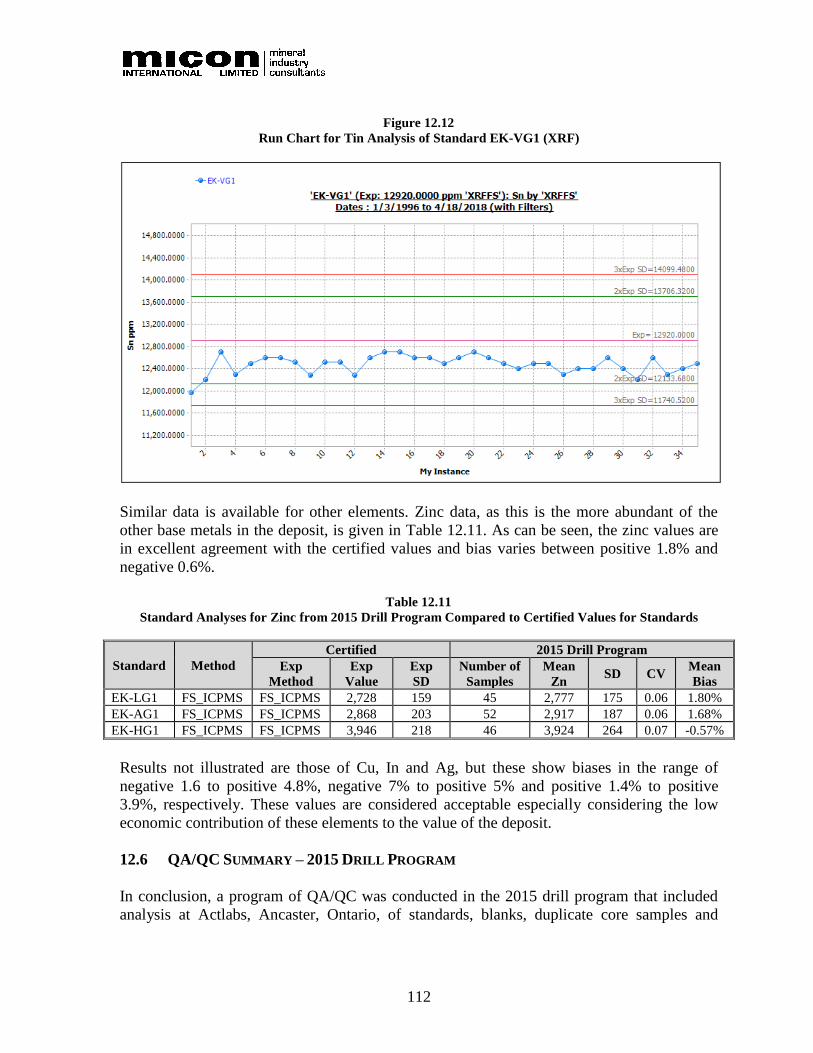
112
Figure 12.12
Run Chart for Tin Analysis of Standard EK-VG1 (XRF)
Similar data is available for other elements. Zinc data, as this is the more abundant of the
other base metals in the deposit, is given in Table 12.11. As can be seen, the zinc values are
in excellent agreement with the certified values and bias varies between positive 1.8% and
negative 0.6%.
Table 12.11
Standard Analyses for Zinc from 2015 Drill Program Compared to Certified Values for Standards
Standard Method
Certified 2015 Drill Program
Exp
Method
Exp
Value
Exp
SD
Number of
Samples
Mean
Zn SD CV
Mean
Bias
EK-LG1 FS_ICPMS FS_ICPMS 2,728 159 45 2,777 175 0.06 1.80%
EK-AG1 FS_ICPMS FS_ICPMS 2,868 203 52 2,917 187 0.06 1.68%
EK-HG1 FS_ICPMS FS_ICPMS 3,946 218 46 3,924 264 0.07 -0.57%
Results not illustrated are those of Cu, In and Ag, but these show biases in the range of
negative 1.6 to positive 4.8%, negative 7% to positive 5% and positive 1.4% to positive
3.9%, respectively. These values are considered acceptable especially considering the low
economic contribution of these elements to the value of the deposit.
12.6 QA/QC SUMMARY – 2015 DRILL PROGRAM
In conclusion, a program of QA/QC was conducted in the 2015 drill program that included
analysis at Actlabs, Ancaster, Ontario, of standards, blanks, duplicate core samples and
113
duplicate pulp analyses with these latter analyses conducted at ALS in Vancouver, British
Columbia.
The results on the standards and duplicates suggest that Actlabs may have a slight negative
bias in analyses of the order of 4% to 8% in tin. Bias for other elements including Zn, Cu, In
and Ag are variable, being both negative and positive, and of lower magnitude. As all biases
present are indicated at levels below 10% and in most cases less than 5%, the analytical data
is considered acceptable for resource estimation.
12.7 HISTORIC SHELL AND RAL SAMPLING PROGRAMS
This section details the historic sampling methodologies employed during the exploration
and development of the East Kemptville deposit, and the due diligence sampling programs
undertaken by Avalon to validate the historic sampling data.
The independent laboratories used by Shell and RAL included Atlantic Analytical
Laboratory, X-Ray Assay Laboratory (XRAL) and Bondar Clegg.
No records were found regarding Atlantic Analytical Laboratory in a search of the NRCan
Laboratories list.
The laboratory referred to as XRAL (X-Ray Assay Laboratory) in the Shell and RAL
literature such as the Feasibility Study of East Kemptville was acquired by the SGS Group in
1988 and in effect became SGS’s Canadian Laboratory (reference online document at
https://www.sgs.ca/-/media/local/canada/documents/flyers-and-leaflets/sgs-min-lab-
geochemical-services-north-america-flyer-en-11.pdf).
Bondar Clegg laboratory operated from 1962 and was taken over by ALS Laboratories in
2001.
There is no evidence that the three laboratories, XRAL, Bondar Clegg and Atlantic
Analytical Laboratory, had any relationship with Shell or Rio Algom, except as independent
assay laboratories. The authors used XRAL and Bondar Clegg at the time of the East
Kemptville exploration and knew them as independent laboratories with no formal
relationship (ownership or management) to any operating mining company.
The exploration undertaken by Shell and RAL is described in Section 6.0.
Table 12.12 summarizes the diamond drill core sampling procedures, sample preparation
methods and analytical techniques employed by Shell and RAL from 1978 through to
February, 1983.
Drill core recovery for both Shell and RAL was reported as very high (>95%).
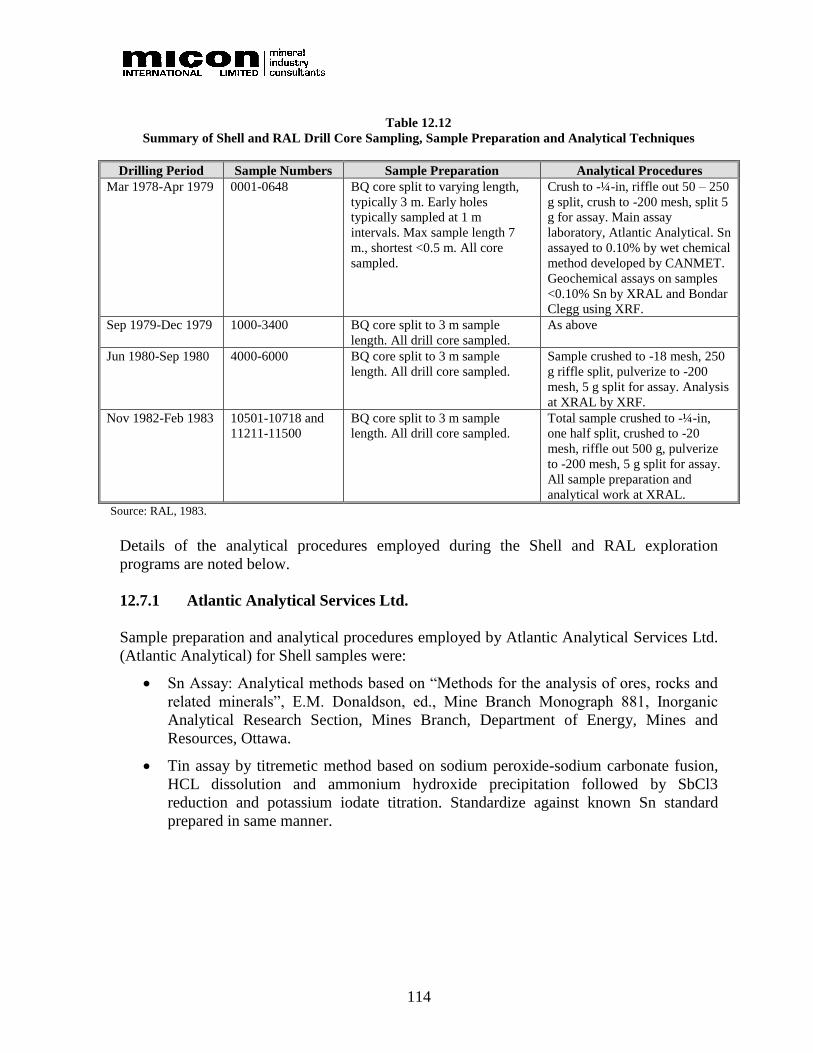
114
Table 12.12
Summary of Shell and RAL Drill Core Sampling, Sample Preparation and Analytical Techniques
Drilling Period Sample Numbers Sample Preparation Analytical Procedures
Mar 1978-Apr 1979 0001-0648 BQ core split to varying length,
typically 3 m. Early holes
typically sampled at 1 m
intervals. Max sample length 7
m., shortest <0.5 m. All core
sampled.
Crush to -¼-in, riffle out 50 – 250
g split, crush to -200 mesh, split 5
g for assay. Main assay
laboratory, Atlantic Analytical. Sn
assayed to 0.10% by wet chemical
method developed by CANMET.
Geochemical assays on samples
<0.10% Sn by XRAL and Bondar
Clegg using XRF.
Sep 1979-Dec 1979 1000-3400 BQ core split to 3 m sample
length. All drill core sampled.
As above
Jun 1980-Sep 1980 4000-6000 BQ core split to 3 m sample
length. All drill core sampled.
Sample crushed to -18 mesh, 250
g riffle split, pulverize to -200
mesh, 5 g split for assay. Analysis
at XRAL by XRF.
Nov 1982-Feb 1983 10501-10718 and
11211-11500
BQ core split to 3 m sample
length. All drill core sampled.
Total sample crushed to -¼-in,
one half split, crushed to -20
mesh, riffle out 500 g, pulverize
to -200 mesh, 5 g split for assay.
All sample preparation and
analytical work at XRAL.
Source: RAL, 1983.
Details of the analytical procedures employed during the Shell and RAL exploration
programs are noted below.
12.7.1 Atlantic Analytical Services Ltd.
Sample preparation and analytical procedures employed by Atlantic Analytical Services Ltd.
(Atlantic Analytical) for Shell samples were:
• Sn Assay: Analytical methods based on “Methods for the analysis of ores, rocks and
related minerals”, E.M. Donaldson, ed., Mine Branch Monograph 881, Inorganic
Analytical Research Section, Mines Branch, Department of Energy, Mines and
Resources, Ottawa.
• Tin assay by titremetic method based on sodium peroxide-sodium carbonate fusion,
HCL dissolution and ammonium hydroxide precipitation followed by SbCl3
reduction and potassium iodate titration. Standardize against known Sn standard
prepared in same manner.
115
% Sn = (Vs –Vb) x Sn(eq) x 100
Sample wt (mg)
Where Sn(eq) = wt Sn in aliquot taken (mg)
Vs-Vb
and Vs = Vol (ml) % of potassium iodate solution required by Sn
Vb = Vol (ml) of potassium iodate solution required by blank
12.7.2 X-Ray Assay Laboratories
Sample preparation and analytical procedures employed by X-Ray Assay Laboratories
(XRAL) for Shell samples were:
Sample Preparation:
Jaw crush and cone crush total sample to -¼-in. Pulverize total sample to -100 mesh.
Riffle out 250 gm aliquot and mill in ring mill to -200 mesh
Analysis:
Sn – initial XRF assay on loose powder. Calibrate using 1,000 ppm synthetic
standard. Accept values <500 ppm as final. For >500 ppm samples, pressed pellet
XRF method (8 gm, 32 mm dia.) using Sb as an internal standard. Calibrate
instrument using synthetic standard for >0.1% Sn <5%. CANMET standard KC-1
used as control standard, plus some previously analysed Shell samples. 10% of
samples run as check samples (repeats).
Cu and Zn– mixed acid dissolution followed by AA. Not all samples analysed for Cu
and Zn
Sample preparation and analytical methods employed by XRAL for RAL samples were:
Sample Preparation:
For BQ core: 2-4 kg sample, crush to -20 mesh, riffle out 500 gm, pulverize to -200
mesh.
For HQ core: ~25 kg core, crush to -¼-in, split (save rejects), crush to -20 mesh, riffle
out 500 g (save rejects), pulverize to -200 mesh.
Analysis:
Sn– XRF using PW1410 instrument. Initial geochemical assay based on loose powder
XRF analysis of -200 mesh material. Reported detection limit of 20 to 1,000 ppm.
Values above 1,000 ppm assayed using pressed pellet method incorporating internal
Sb standard. Pellet produced using 4 g silica and fixed amount of internal Sb
standard. Method reported valid up to 5% Sn. CANMET Sn standard inserted in each
batch. 10% of samples re-assayed.
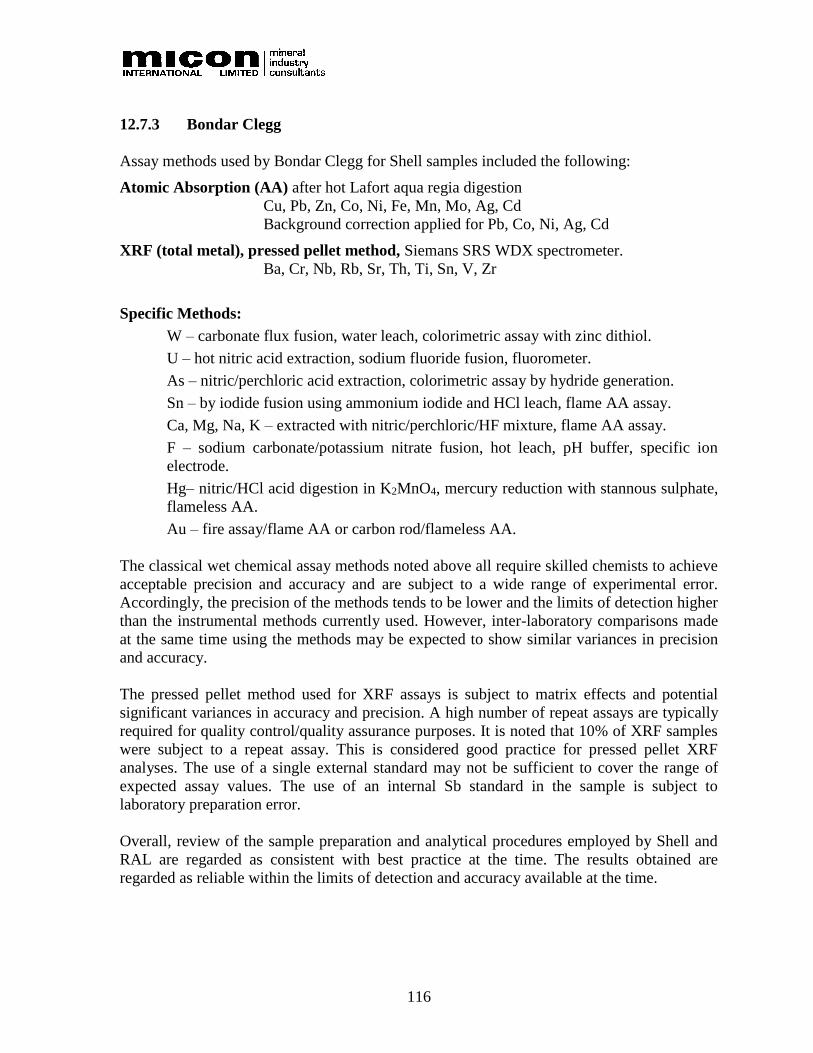
116
12.7.3 Bondar Clegg
Assay methods used by Bondar Clegg for Shell samples included the following:
Atomic Absorption (AA) after hot Lafort aqua regia digestion
Cu, Pb, Zn, Co, Ni, Fe, Mn, Mo, Ag, Cd
Background correction applied for Pb, Co, Ni, Ag, Cd
XRF (total metal), pressed pellet method, Siemans SRS WDX spectrometer.
Ba, Cr, Nb, Rb, Sr, Th, Ti, Sn, V, Zr
Specific Methods:
W – carbonate flux fusion, water leach, colorimetric assay with zinc dithiol.
U – hot nitric acid extraction, sodium fluoride fusion, fluorometer.
As – nitric/perchloric acid extraction, colorimetric assay by hydride generation.
Sn – by iodide fusion using ammonium iodide and HCl leach, flame AA assay.
Ca, Mg, Na, K – extracted with nitric/perchloric/HF mixture, flame AA assay.
F – sodium carbonate/potassium nitrate fusion, hot leach, pH buffer, specific ion
electrode.
Hg– nitric/HCl acid digestion in K2MnO4, mercury reduction with stannous sulphate,
flameless AA.
Au – fire assay/flame AA or carbon rod/flameless AA.
The classical wet chemical assay methods noted above all require skilled chemists to achieve
acceptable precision and accuracy and are subject to a wide range of experimental error.
Accordingly, the precision of the methods tends to be lower and the limits of detection higher
than the instrumental methods currently used. However, inter-laboratory comparisons made
at the same time using the methods may be expected to show similar variances in precision
and accuracy.
The pressed pellet method used for XRF assays is subject to matrix effects and potential
significant variances in accuracy and precision. A high number of repeat assays are typically
required for quality control/quality assurance purposes. It is noted that 10% of XRF samples
were subject to a repeat assay. This is considered good practice for pressed pellet XRF
analyses. The use of a single external standard may not be sufficient to cover the range of
expected assay values. The use of an internal Sb standard in the sample is subject to
laboratory preparation error.
Overall, review of the sample preparation and analytical procedures employed by Shell and
RAL are regarded as consistent with best practice at the time. The results obtained are
regarded as reliable within the limits of detection and accuracy available at the time.

117
12.8 UNDERGROUND BULK SAMPLING
The Shell underground bulk sample program was designed to provide a bulk sample for
metallurgical testing and to confirm the grades indicated by diamond drilling. The bulk
sample recovered about 31,600 t of material from 298 rounds. An on-site sampler was used
to process the bulk sample to provide a metallurgical sample and a sample for assay. The
sampling process was reportedly designed such that the total standard deviation in tin content
of a round was less than 5%. The bulk sample processing scheme is illustrated in Figure
12.13. The sample processing procedures employed are considered to be good practice at the
time and consistent with current practice.
Figure 12.13
Bulk Sample Processing Scheme – Shell

118
A split of the final processed sample from each round was sent to XRAL (XRF analysis) and
Lakefield Research Limited (AA analysis). (Lakefield Research is the predecessor company
to SGS Lakefield Canada). The analytical data showed excellent correlation, as illustrated in
Table 12.13. The original data has not been verified, but there is no reason to believe the data
are not accurate.
Table 12.13
Statistical Summary of Round Robin Data – Shell Bulk Sampling Program
Statistic % Sn
XRAL Lakefield Average
Mean 0.199 0.203 0.201
SD 0.126 0.124 0.125
Variance 0.016 0.015 0.0155
Standard Error 0.007 0.007 0.007
Number of Rounds 289 289 289
Source: RAL, 1983.
12.9 SHELL AND RAL CHECK ASSAY PROGRAMS
Both Shell and RAL undertook extensive programs of check assays and inter-laboratory
comparisons as part of their exploration and due diligence programs.
12.9.1 Pulp Check Assays (Shell)
Shell sent 114 sample pulps to XRAL and Bondar Clegg to compare with the original
Atlantic Analytical result. The analytical methods used by XRAL and Bondar Clegg were as
discussed above.
12.9.2 BQ Check Assays (RAL)
RAL sent 160 samples of Shell’s remaining split BQ core to XRAL as a check of possible
bias introduced by core splitting and/or sample preparation. There was one significant outlier
in the assays results.
RAL checked the repeatability of the XRAL results by resubmitting 16 BQ sample pulps
under new sample numbers.
RAL submitted 10 HQ sample pulps (-200 mesh) to XRAL, the Wheal Jane tin mine
laboratory in Cornwall, United Kingdom, and Lakefield Research.
RAL evaluated the effectiveness of its HQ drill core sample preparation procedures by
assaying the coarse (¼-in) rejects. Seven assays by XRAL and five assays by Lakefield
Research were completed.

119
12.10 VERIFICATION OF HISTORIC SAMPLING AND ASSAY DATA
Data verification of the historic sampling and assay data consisted of checking the reported
assay values contained in the QA/QC appendix of the RAL feasibility study against the
current assay data base and the available drill logs. The current assay database is a
compilation undertaken by Avalon of all available assay certificates, drill logs and survey
data.
The results of the data verification of historic QA/QC procedures are summarized below.
12.10.1 Pulp Check Assays
One hundred and four of the 114 original pulp check assays could be verified against the
current assay database, original drill logs and assay certificates. Five samples reported assay
values from the database different from the values in the data provided in the RAL feasibility
study. These results were adjusted to the values for the samples in the database. A number of
other samples reported values differing from the database values due to rounding. All other
values matched the database values.
Regression analysis (Figure 12.14) shows a high degree of correlation between the assay
results, with excellent agreement between the Atlantic Analytical results versus Bondar
Clegg results, and XRAL versus Bondar Clegg results. The agreement between the Atlantic
Analytical results and the XRAL results is somewhat less but still within acceptable limits.
There would appear to be a slight negative bias for the Atlantic Analytical results versus
either XRAL or Bondar Clegg based on the Reduced to Major Axis (RMA) analysis.
Figure 12.14
Pulp Check Assays, Shell Minerals Analyses
y = 0.7501x + 0.0268R² = 0.9713
y = 0.7832xR² = 0.9617
0
0.5
1
1.5
2
2.5
0 0.5 1 1.5 2 2.5 3
Bo
nd
ar C
legg
Ass
ay (
%Sn
)
Atlantic Analytical Assay (% Sn)
Check Assays Atlantic Analytical vs Bondar Clegg
RMA
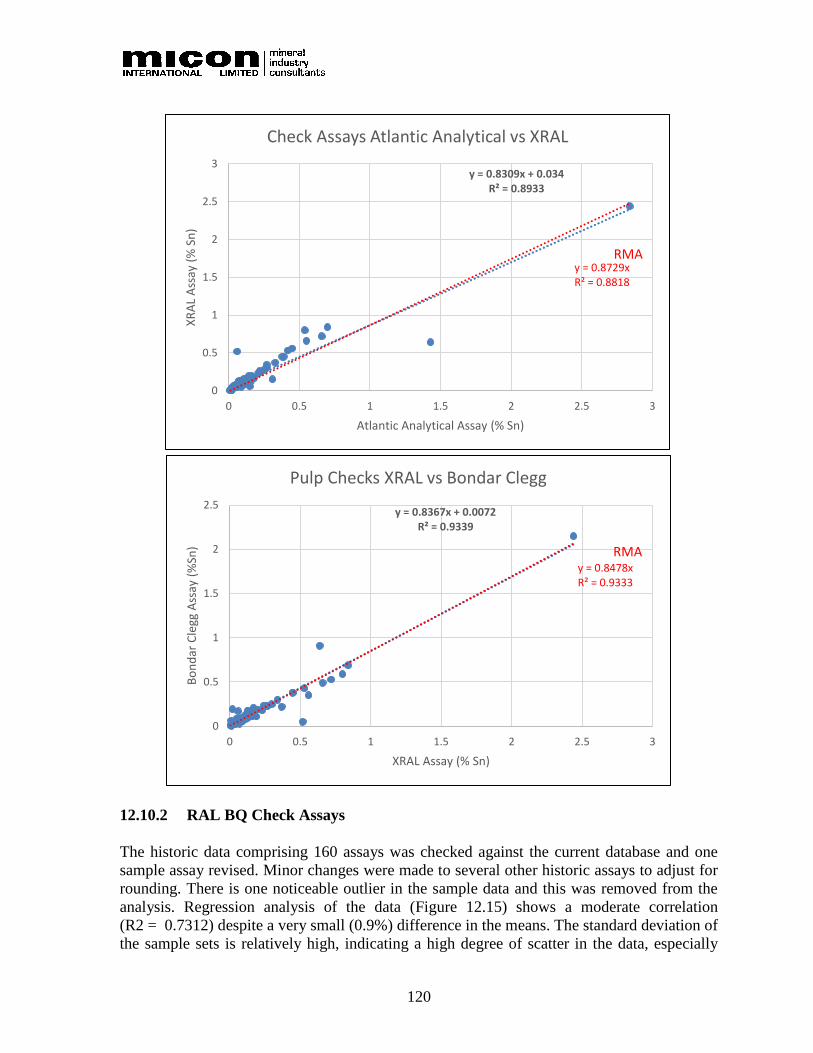
120
12.10.2 RAL BQ Check Assays
The historic data comprising 160 assays was checked against the current database and one
sample assay revised. Minor changes were made to several other historic assays to adjust for
rounding. There is one noticeable outlier in the sample data and this was removed from the
analysis. Regression analysis of the data (Figure 12.15) shows a moderate correlation
(R2 = 0.7312) despite a very small (0.9%) difference in the means. The standard deviation of
the sample sets is relatively high, indicating a high degree of scatter in the data, especially
y = 0.8309x + 0.034R² = 0.8933
y = 0.8729xR² = 0.8818
0
0.5
1
1.5
2
2.5
3
0 0.5 1 1.5 2 2.5 3
XR
AL
Ass
ay (
% S
n)
Atlantic Analytical Assay (% Sn)
Check Assays Atlantic Analytical vs XRAL
RMA
y = 0.8367x + 0.0072R² = 0.9339
y = 0.8478xR² = 0.9333
0
0.5
1
1.5
2
2.5
0 0.5 1 1.5 2 2.5 3
Bo
nd
ar C
legg
Ass
ay (
%Sn
)
XRAL Assay (% Sn)
Pulp Checks XRAL vs Bondar Clegg
RMA

121
with higher assay values. Such a result might be expected given the high nugget texture of
the higher-grade samples, especially over short (3-m) sample intervals.
Figure 12.15
RAL BQ Core Check Analyses
12.10.3 RAL BQ Core Pulp Re-Sample
RAL submitted 16 -200 mesh pulps to XRAL for re-assay under new sample numbers. The
results of the re-assay indicated excellent agreement (Figure 12.16) and good repeatability.
Figure 12.16
BQ Core Pulp Re-sampling, Rio Algom
y = 1.0495x - 0.0053R² = 0.7312
0
0.5
1
1.5
2
0 0.2 0.4 0.6 0.8 1 1.2
Rio
Ch
eck
Ass
ay (
%Sn
)
Original Shell Assay (%Sn)
Rio BQ Core Re-Sample Data - 1 Outlier Removed
y = 0.9682x + 0.0006R² = 0.9961
0
0.05
0.1
0.15
0.2
0.25
0.3
0.35
0 0.05 0.1 0.15 0.2 0.25 0.3 0.35
Rep
eat
Sn A
ssay
(%
)
Original Sn Assay (%)
-200 Mesh Pulp Repeats - Rio Assays

122
12.10.4 RAL HQ Core Check Samples
RAL checked HQ sample preparation by sending 10 HQ sample pulps (-200 mesh) to each of
XRAL, the Wheal Jane mine laboratory and Lakefield Research. The results of the assays
(Figure 12.17) show excellent agreement, indicating no bias in final sample preparation.
Figure 12.17
RAL HQ Core Check Samples
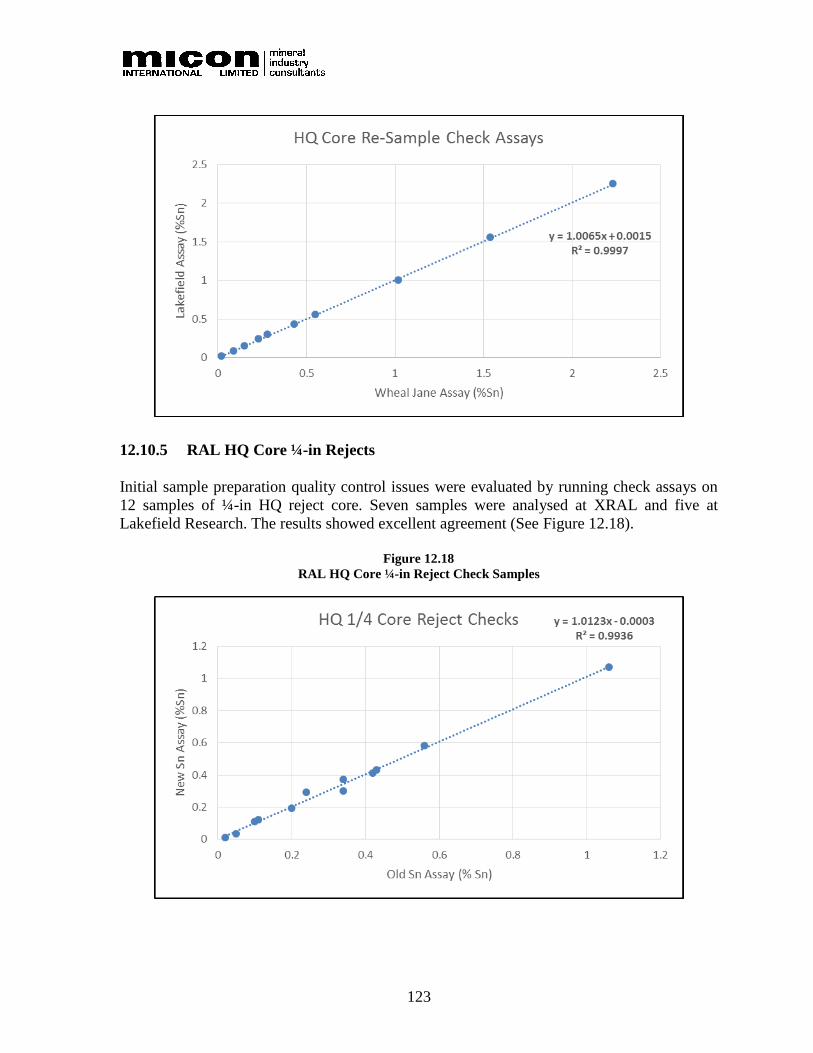
123
12.10.5 RAL HQ Core ¼-in Rejects
Initial sample preparation quality control issues were evaluated by running check assays on
12 samples of ¼-in HQ reject core. Seven samples were analysed at XRAL and five at
Lakefield Research. The results showed excellent agreement (See Figure 12.18).
Figure 12.18
RAL HQ Core ¼-in Reject Check Samples
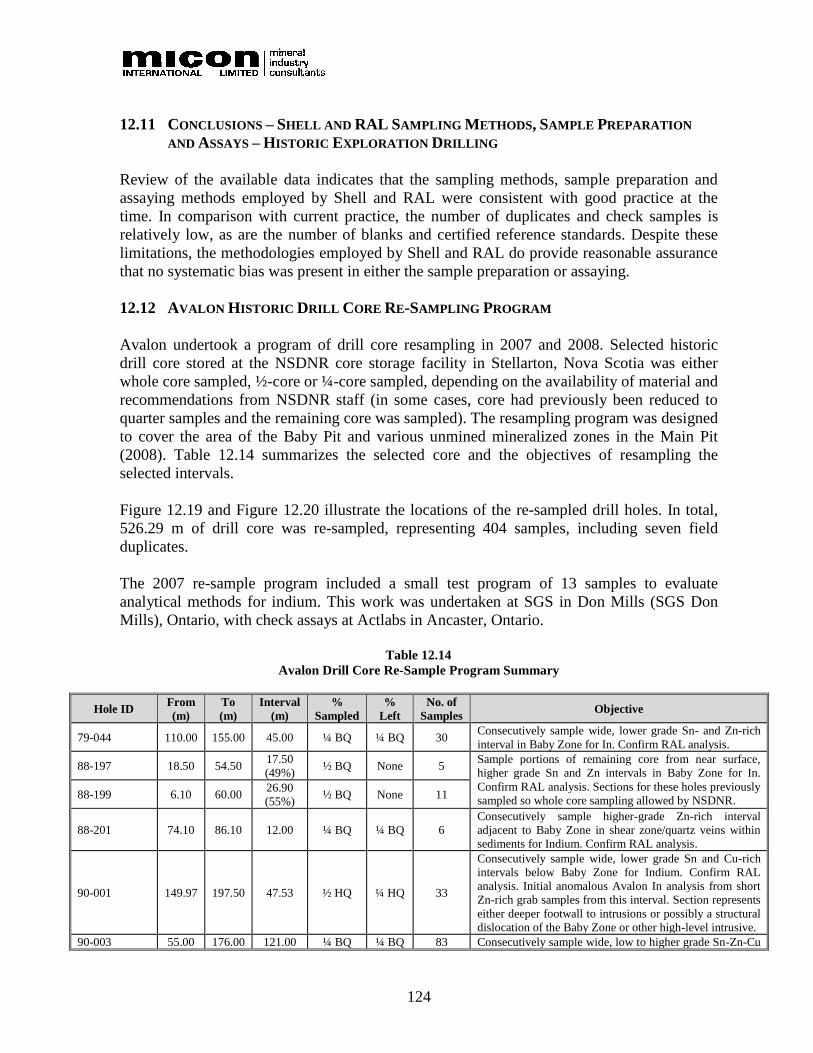
124
12.11 CONCLUSIONS – SHELL AND RAL SAMPLING METHODS, SAMPLE PREPARATION
AND ASSAYS – HISTORIC EXPLORATION DRILLING
Review of the available data indicates that the sampling methods, sample preparation and
assaying methods employed by Shell and RAL were consistent with good practice at the
time. In comparison with current practice, the number of duplicates and check samples is
relatively low, as are the number of blanks and certified reference standards. Despite these
limitations, the methodologies employed by Shell and RAL do provide reasonable assurance
that no systematic bias was present in either the sample preparation or assaying.
12.12 AVALON HISTORIC DRILL CORE RE-SAMPLING PROGRAM
Avalon undertook a program of drill core resampling in 2007 and 2008. Selected historic
drill core stored at the NSDNR core storage facility in Stellarton, Nova Scotia was either
whole core sampled, ½-core or ¼-core sampled, depending on the availability of material and
recommendations from NSDNR staff (in some cases, core had previously been reduced to
quarter samples and the remaining core was sampled). The resampling program was designed
to cover the area of the Baby Pit and various unmined mineralized zones in the Main Pit
(2008). Table 12.14 summarizes the selected core and the objectives of resampling the
selected intervals.
Figure 12.19 and Figure 12.20 illustrate the locations of the re-sampled drill holes. In total,
526.29 m of drill core was re-sampled, representing 404 samples, including seven field
duplicates.
The 2007 re-sample program included a small test program of 13 samples to evaluate
analytical methods for indium. This work was undertaken at SGS in Don Mills (SGS Don
Mills), Ontario, with check assays at Actlabs in Ancaster, Ontario.
Table 12.14
Avalon Drill Core Re-Sample Program Summary
Hole ID From
(m)
To
(m)
Interval
(m)
%
Sampled
%
Left
No. of
Samples Objective
79-044 110.00 155.00 45.00 ¼ BQ ¼ BQ 30 Consecutively sample wide, lower grade Sn- and Zn-rich
interval in Baby Zone for In. Confirm RAL analysis.
88-197 18.50 54.50 17.50
(49%) ½ BQ None 5
Sample portions of remaining core from near surface,
higher grade Sn and Zn intervals in Baby Zone for In.
Confirm RAL analysis. Sections for these holes previously
sampled so whole core sampling allowed by NSDNR. 88-199 6.10 60.00
26.90
(55%) ½ BQ None 11
88-201 74.10 86.10 12.00 ¼ BQ ¼ BQ 6
Consecutively sample higher-grade Zn-rich interval
adjacent to Baby Zone in shear zone/quartz veins within
sediments for Indium. Confirm RAL analysis.
90-001 149.97 197.50 47.53 ½ HQ ¼ HQ 33
Consecutively sample wide, lower grade Sn and Cu-rich
intervals below Baby Zone for Indium. Confirm RAL
analysis. Initial anomalous Avalon In analysis from short
Zn-rich grab samples from this interval. Section represents
either deeper footwall to intrusions or possibly a structural
dislocation of the Baby Zone or other high-level intrusive.
90-003 55.00 176.00 121.00 ¼ BQ ¼ BQ 83 Consecutively sample wide, low to higher grade Sn-Zn-Cu

125
Hole ID From
(m)
To
(m)
Interval
(m)
%
Sampled
%
Left
No. of
Samples Objective
rich sections in thickest portion of Baby Zone for In.
Confirm RAL analysis.
89-218 (Main) 82.00 88.00 6.00 ¼ BQ ¼ BQ 2 Sample Zn-rich small sections of core from Main Pit for
In.
89-222 (Main) 69.00 72.00 3.00 ¼ BQ ¼ BQ 1 Sample Zn-rich small section of core from Main Pit for In.
80-093 55.50 99.10 40.60
(100%) ¼ BQ ¼ BQ 27
Consecutively sample unmined, wide, medium to higher
grade Sn intervals in Southwest Extension Zone and below
Main Pit likely to be mined. Intercepts selected based on
remaining drill core at NSDNR Core Library and modelled
pit surface based on best survey maps available at the
time.
89-204 4.20 105.00 100.80
(100%) ½ BQ ¼ BQ 67
89-216 1.00 65.00 64.00
(100%) ½ BQ ¼ BQ 43
89-225 84.00 175.26 90.26
(98.9%) ¼ BQ ¼ BQ 61
89.229 34.00 85.00 51.00
(100%) ¼ BQ ¼ BQ 35
Total sampling Baby Zone &
Main Pit – 2007 278.93 171 Incl. 5 field duplicates plus standards and blanks.
Total sampling Southwest
Extension and Main Pit – 2008 247.36 233 Incl. 2 field duplicates plus standards and blanks.
Total Sampling 2007 and 2008 526.29 404 Incl. 7 field duplicates plus standards and blanks
Source: Avalon Assessment Reports, 2007 and 2008.
Figure 12.19
Drill Core Re-Sample Program 2007
Source: Avalon, 2007.
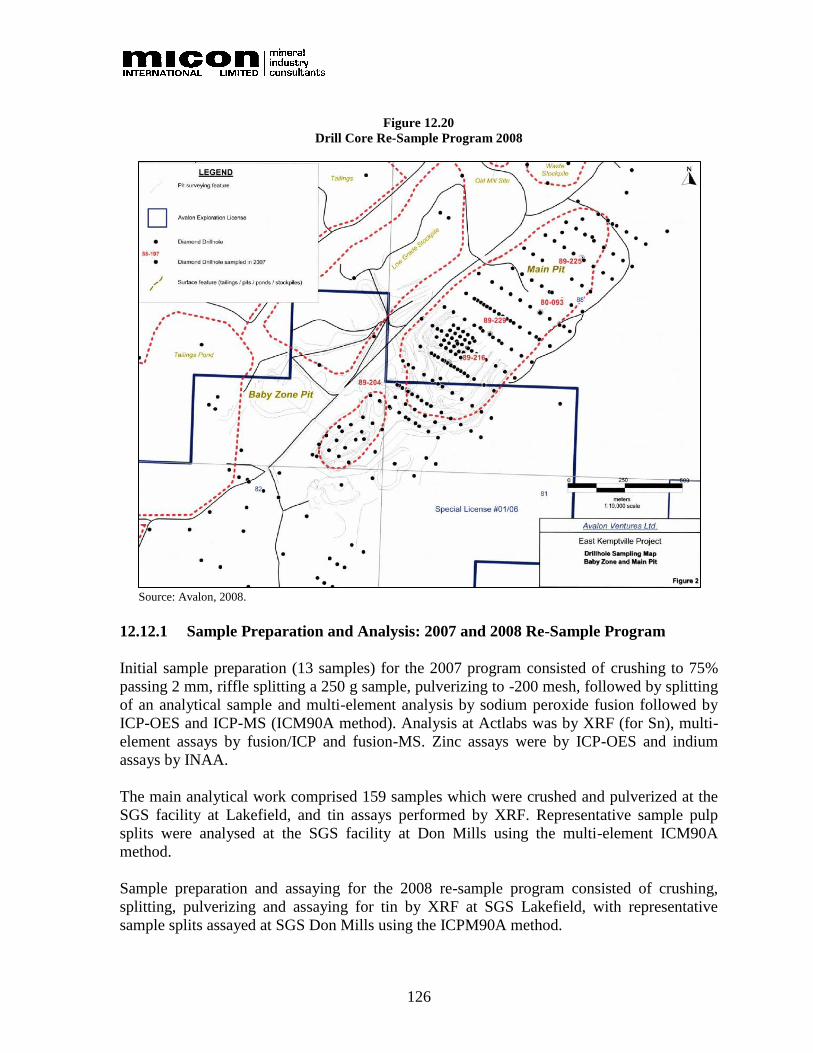
126
Figure 12.20
Drill Core Re-Sample Program 2008
Source: Avalon, 2008.
12.12.1 Sample Preparation and Analysis: 2007 and 2008 Re-Sample Program
Initial sample preparation (13 samples) for the 2007 program consisted of crushing to 75%
passing 2 mm, riffle splitting a 250 g sample, pulverizing to -200 mesh, followed by splitting
of an analytical sample and multi-element analysis by sodium peroxide fusion followed by
ICP-OES and ICP-MS (ICM90A method). Analysis at Actlabs was by XRF (for Sn), multi-
element assays by fusion/ICP and fusion-MS. Zinc assays were by ICP-OES and indium
assays by INAA.
The main analytical work comprised 159 samples which were crushed and pulverized at the
SGS facility at Lakefield, and tin assays performed by XRF. Representative sample pulp
splits were analysed at the SGS facility at Don Mills using the multi-element ICM90A
method.
Sample preparation and assaying for the 2008 re-sample program consisted of crushing,
splitting, pulverizing and assaying for tin by XRF at SGS Lakefield, with representative
sample splits assayed at SGS Don Mills using the ICPM90A method.
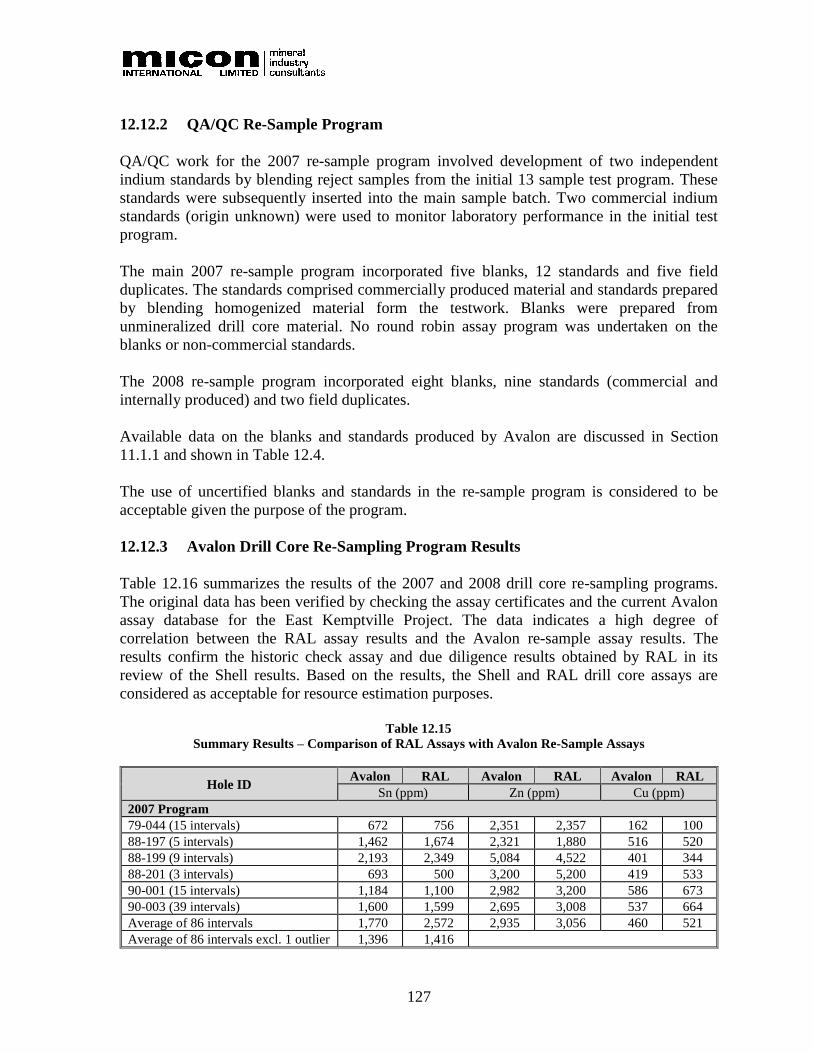
127
12.12.2 QA/QC Re-Sample Program
QA/QC work for the 2007 re-sample program involved development of two independent
indium standards by blending reject samples from the initial 13 sample test program. These
standards were subsequently inserted into the main sample batch. Two commercial indium
standards (origin unknown) were used to monitor laboratory performance in the initial test
program.
The main 2007 re-sample program incorporated five blanks, 12 standards and five field
duplicates. The standards comprised commercially produced material and standards prepared
by blending homogenized material form the testwork. Blanks were prepared from
unmineralized drill core material. No round robin assay program was undertaken on the
blanks or non-commercial standards.
The 2008 re-sample program incorporated eight blanks, nine standards (commercial and
internally produced) and two field duplicates.
Available data on the blanks and standards produced by Avalon are discussed in Section
11.1.1 and shown in Table 12.4.
The use of uncertified blanks and standards in the re-sample program is considered to be
acceptable given the purpose of the program.
12.12.3 Avalon Drill Core Re-Sampling Program Results
Table 12.16 summarizes the results of the 2007 and 2008 drill core re-sampling programs.
The original data has been verified by checking the assay certificates and the current Avalon
assay database for the East Kemptville Project. The data indicates a high degree of
correlation between the RAL assay results and the Avalon re-sample assay results. The
results confirm the historic check assay and due diligence results obtained by RAL in its
review of the Shell results. Based on the results, the Shell and RAL drill core assays are
considered as acceptable for resource estimation purposes.
Table 12.15
Summary Results – Comparison of RAL Assays with Avalon Re-Sample Assays
Hole ID Avalon RAL Avalon RAL Avalon RAL
Sn (ppm) Zn (ppm) Cu (ppm)
2007 Program
79-044 (15 intervals) 672 756 2,351 2,357 162 100
88-197 (5 intervals) 1,462 1,674 2,321 1,880 516 520
88-199 (9 intervals) 2,193 2,349 5,084 4,522 401 344
88-201 (3 intervals) 693 500 3,200 5,200 419 533
90-001 (15 intervals) 1,184 1,100 2,982 3,200 586 673
90-003 (39 intervals) 1,600 1,599 2,695 3,008 537 664
Average of 86 intervals 1,770 2,572 2,935 3,056 460 521
Average of 86 intervals excl. 1 outlier 1,396 1,416

128
Hole ID Avalon RAL Avalon RAL Avalon RAL
Sn (ppm) Zn (ppm) Cu (ppm)
2008 Program
80-093 (14 intervals) 2,176 2,370 2,428 2,416 995 797
89-204 (34 intervals) 2,831 3,112 1,491 1,783 1,349 1,402
89-216 (22 intervals) 1,712 1,996 612 670 1,083 1,180
89-225 928 intervals) 1,812 1,425 1,122 1,089 474 546
89-229 (17 intervals) 3,155 4,029 3,129 3,141 881 988
Average of 115 intervals 2,356 2,533 1,587 1,679 977 1,020
129
13.0 MINERAL PROCESSING AND METALLURGICAL TESTING
13.1 INTRODUCTION
Avalon has conducted a number of testwork programs on the East Kemptville deposit in
recent years. Work began with SGS UK in Cornwall, UK to develop a more comprehensive
flowsheet to produce tin, copper, and zinc/indium concentrates using mineralized samples
from the Baby Zone deposit. This set the baseline for a subsequent test program campaign in
2016 at Met-Solve who investigated recovering tin (only) from the existing low-grade ore
stockpile. Table 13.1 below lists all the flotation/concentrator testwork reports issued as part
of these two programs.
Table 13.1
List of Testwork Relevant to Stockpile Flowsheet Development
Date Author Title Remarks
January, 2016 SGS UK East Kemptville Phased Process
Development Test Work Phase 1
and Phase II Interim Report
Testwork by SGS UK to
investigate recovering tin, copper,
and zinc from the Baby Zone
October, 2016 Met-Solve Avalon East Kemptville Gravity
Testwork Report
Testwork by Met-Solve on low
grade tin stockpile material from
East Kemptville
February, 2017 Met-Solve Avalon East Kemptville Gravity
Testwork Supplementary Report
Supplementary report on Oct 2016
testwork with additional results
from Locked Cycle Tests (LCT)
13.2 SGS UK 2015 TESTWORK
Avalon engaged SGS UK in Cornwall to undertake testwork on a sample of mineralization
collected from the Baby Zone. The testwork program was divided into two phases. The first
phase looked at using heavy liquid separation and gravity pre-concentration to remove barren
waste prior to down-stream processing. The second phase developed a process using sulphide
flotation for copper/zinc recovery followed by gravity concentration and flotation for tin
recovery. The findings in this work provided the basis of investigation for later low-grade
stockpile testwork programs by Met-Solve.
The narrative below summarizes those results relevant to tin recovery and have been used in
the development of the proposed flowsheet.
13.2.1 Metallurgical Samples
A total of 1,140 kg of material comprising 394 split drill core from the Baby Zone were sent
to SGS UK. A composite was prepared using 94 samples originating from the 2014 drilling
campaign. These samples were selected by Avalon from two drill holes, EKAV-14-002 and
003. The testwork composite weighed approximately 290 kg and, although relatively high
grade, is considered representative of the typical mineralization contained within the Baby
Zone mineral resource. A head sample analysis of the composite is presented in Table 13.2.
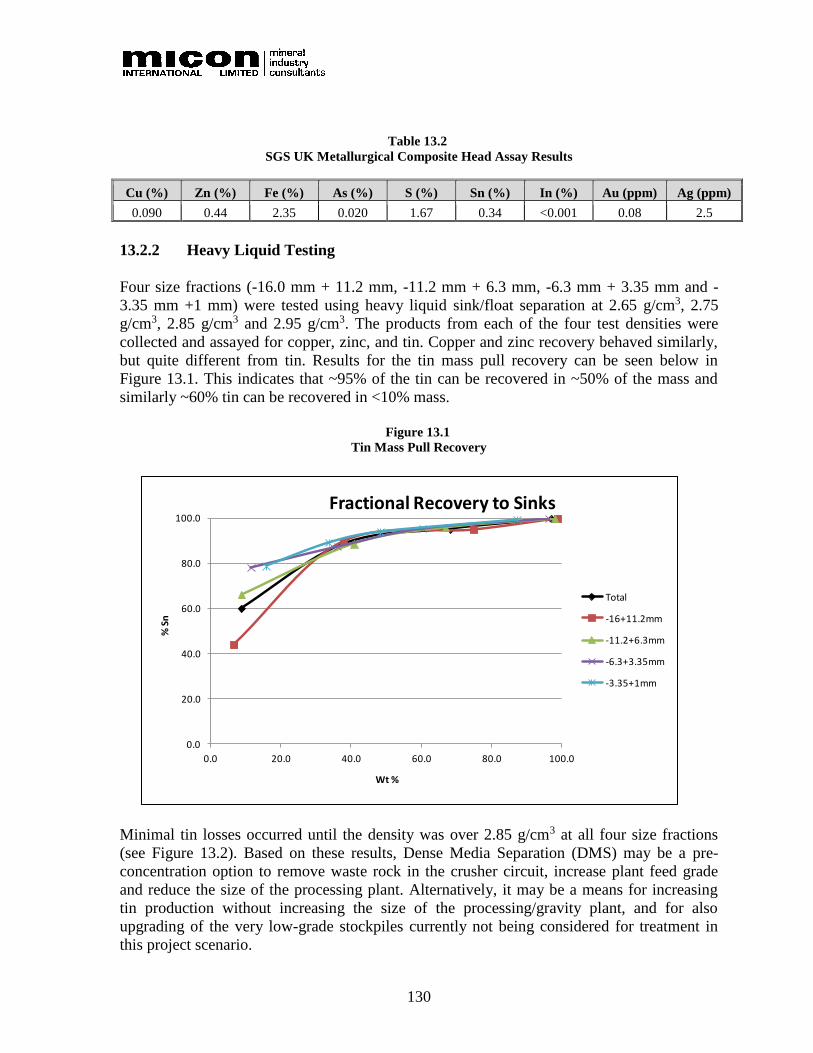
130
Table 13.2
SGS UK Metallurgical Composite Head Assay Results
Cu (%) Zn (%) Fe (%) As (%) S (%) Sn (%) In (%) Au (ppm) Ag (ppm)
0.090 0.44 2.35 0.020 1.67 0.34 <0.001 0.08 2.5
13.2.2 Heavy Liquid Testing
Four size fractions (-16.0 mm + 11.2 mm, -11.2 mm + 6.3 mm, -6.3 mm + 3.35 mm and -
3.35 mm +1 mm) were tested using heavy liquid sink/float separation at 2.65 g/cm3, 2.75
g/cm3, 2.85 g/cm3 and 2.95 g/cm3. The products from each of the four test densities were
collected and assayed for copper, zinc, and tin. Copper and zinc recovery behaved similarly,
but quite different from tin. Results for the tin mass pull recovery can be seen below in
Figure 13.1. This indicates that ~95% of the tin can be recovered in ~50% of the mass and
similarly ~60% tin can be recovered in <10% mass.
Figure 13.1
Tin Mass Pull Recovery
Minimal tin losses occurred until the density was over 2.85 g/cm3 at all four size fractions
(see Figure 13.2). Based on these results, Dense Media Separation (DMS) may be a pre-
concentration option to remove waste rock in the crusher circuit, increase plant feed grade
and reduce the size of the processing plant. Alternatively, it may be a means for increasing
tin production without increasing the size of the processing/gravity plant, and for also
upgrading of the very low-grade stockpiles currently not being considered for treatment in
this project scenario.
0.0
20.0
40.0
60.0
80.0
100.0
0.0 20.0 40.0 60.0 80.0 100.0
% S
n
Wt %
Fractional Recovery to Sinks
Total
-16+11.2mm
-11.2+6.3mm
-6.3+3.35mm
-3.35+1mm

131
Figure 13.2
Heavy Liquids – Tin Loss to Floats
13.2.3 Bond Rod and Ball Mill Grindability Testwork
Both the Bond rod and ball mill index and an abrasion index tests were completed. Results of
these comminution tests are summarized in Table 13.3 below.
Table 13.3
Grinding Test Results
Test Parameter Product Size
(P80 - µm) Results
Bond rod mill index 806 16.2
kWh/t
Bond ball mill index 85 14.5
kWh/t
Abrasion Index 0.584 g
Comparing the grinding index test results with the extensive SGS UK Database it can be
concluded that the mineralization from the Baby Zone is slightly harder than average. The
abrasion index suggests that the material is relatively abrasive, probably due to the siliceous
nature of the mineralization.
0.0
10.0
20.0
30.0
40.0
50.0
60.0
70.0
80.0
90.0
100.0
2.60 2.65 2.70 2.75 2.80 2.85 2.90 2.95 3.00
Cu
mu
lati
ve S
n L
oss
to
Flo
ats
(%)
Float Density (g/cm3)
Overall
-16.0+11.2mm
-11.2+6.3mm
-6.3mm+3.35mm
-3.35+1.0mm
(g/cm3)

132
13.2.4 Test Results – Gravity Separation Using Mozley Concentrators
A number of gravity separation tests were conducted on bulk flotation tailings solids by SGS
UK to investigate the possibility of using Mozley Concentrators to recover the tin.
The initial set of tests were done on 200-micron tailings solids after bulk flotation, and it was
found that laboratory gravity separation was able to achieve a tin concentration upgrade ratio
of at least 5:1 compared to the head grade. Results are seen in Table 13.4 below.
Table 13.4
200-Micron Grind Flotation Tailings Gravity Separation Results
Test F5 Assay (%) Recovery (%)
Product Mass (%) Cu Zn S Sn Cu Zn S Sn
Bulk float con 4.53 1.900 10.52 34.99 0.25 92.9 87.1 88.5 4.1
Float tailings 95.47 0.007 0.074 0.19 0.28 7.1 12.9 11.5 95.9
Grav. Ro. Con. 5.47 0.009 0.130 0.43 1.40 0.5 1.3 1.5 27.2
Grav. Ro. Mids. 39.98 0.009 0.084 0.24 0.36 3.9 6.1 6.0 51.0
Grav. Ro Tails 50.01 0.005 0.060 0.13 0.10 2.7 5.5 4.1 17.7
Float feed 100.00 0.090 0.550 1.60 0.28 100.0 100.0 100.0 100.0
The material, with a Sn head grade of 0.28% Sn was concentrated to 1.4% Sn in the
concentrate with 27.2% Sn recovery. Most of the remaining tin was locked in the middlings
where the tin recoveries were 51%, which suggested that more milling may be necessary to
further liberate the tin minerals for concentration. Overall recovery to a combined
concentrate plus middlings product was 87.2%.
With these results, in the next set of testwork, SGS UK milled the bulk flotation tailings to
80% passing 50 microns to see if a finer grind would improve tin recovery in the
concentrates. Results for the 50-micron gravity separation testwork can be seen in Table 13.5
below.
Table 13.5
50-micron Grind – Gravity Separation Results
Test F6 Assay (%) Recovery (%)
Product Mass (%) Cu Zn S Sn Cu Zn S Sn
Bulk Float Con.1 7.9 1.22 15.40 17.77 0.16 89.9 87.0 82.7 5.0
Float Tailings1 92.10 0.012 0.199 0.32 0.38 10.1 13.0 17.3 95.0
Grav. Ro. Con. 3.00 0.012 0.016 3.32 6.57 0.3 0.0 5.8 53.6
Grav. Ro. Mids. 6.50 0.009 0.015 1.75 0.53 0.5 0.1 6.7 9.5
Grav. Ro Tails 82.60 0.012 0.220 0.10 0.14 9.3 12.9 4.8 31.9
Float Feed 100.00 0.107 1.400 1.70 0.36 100.0 100.0 100.0 100.0 1Back calculated from gravity results and float feed calculated head assays.
With the finer grind, tin recovery increased from 25% to 54% in the gravity concentrates and
grade improved to 6.57% Sn. Recovery of tin to the middlings also decreased as expected to

133
9.5%. However, loss of tin to the tailings increased to 32% from 18%, signaling that 50
microns may be too fine of a grind and more tin was being lost to the tailings stream as fines.
13.2.5 Test Results – Gravity Separation Using Shaking Tables
Following the encouraging results with the finer grind gravity test, SGS UK repeated the
testwork using more conventional shaking tables (see Figure 13.3). Tests were undertaken at
200, 100 and 50 microns to assess the viability of using shaking tables to concentrate tin
from bulk flotation tailings.
Figure 13.3
Picture of a 200 Micron Gravity Separation Test
Initial results with the 200-micron material showed improved results to those using Mozley
Concentrators. Approximately 72% of the tin was recovered in the rougher concentrate with
a grade of 6.6% Sn. Results are summarized in Table 13.6.

134
Table 13.6
200 Micron Primary Gravity Separation Shaking Table Test Results
-200 Micron Assay (%) Recovery (%)
Product Mass (%) Cu Zn S Sn Cu Zn S Sn
Grav. Ro. Con. 4.40 0.014 0.280 2.49 6.61 5.3 10.9 30.2 71.6
Grav. Ro Tails 95.60 0.012 0.105 0.266 0.121 94.7 89.1 69.8 28.4
Test Feed 100.00 0.012 0.113 0.364 0.408 100.0 100.0 100.0 100.0
It should be noted that a middlings stream was not produced as the objective of the testwork
was to produce a higher recovery rougher concentrate suitable for further cleaning into a
saleable product, leaving tailings for further regrinding and increased tin release. Physically,
it is also easy to see the darker tin stream, enabling better control for operators during
operations.
Table 13.7 presents the results of gravity separation of reground -200-micron test tailings. A
scavenger concentrate containing 1.6% Sn was produced with a 34% recovery.
Table 13.7
100 Micron Scavenger Gravity Test Results After Regrinding 200 Micron Rougher Test Tailings
-100 Micron Assay (%) Recovery (%)
Product Mass (%) Cu Zn S Sn Cu Zn S Sn
Grav. Sc. Con. 2.60 0.019 0.068 1.74 1.59 4.3 1.7 17.0 34.1
Grav. Sc Tails 97.40 0.011 0.106 0.227 0.082 95.7 98.3 83.0 65.9
Test Feed1 100.00 0.012 0.105 0.266 0.121 100.0 100.0 100.0 100.0 1Test feed is the reground tailings from the 200-micron rougher test.
This additional gravity test increases overall tin recovery to 81.3%.
SGS then took the rougher tailings from the 100-micron gravity testwork and further milled
them to 50 microns and conducted additional gravity separation on the material. Results can
be seen in Table 13.8 below.
Table 13.8
50 Micron Secondary Scavenger Gravity Testwork Results After Regrinding 100 Micron Scavenger Test
Tailings
-50 Micron Assay (%) Recovery (%)
Product Mass (%) Cu Zn S Sn Cu Zn S Sn
Grav. Sc. Con. 4.90 0.018 0.330 0.68 0.34 7.7 15.1 14.6 20.2
Grav. Sc Tails 95.10 0.011 0.095 0.203 0.069 92.3 84.9 85.4 79.8
Test Feed1 100.00 0.011 0.106 0.227 0.082 100.0 100.0 100.0 100.0 1Test feed is the reground tailings from the 100-micron scavenger test.
Given that tin head grades were low after two cycles of gravity separation, only 20.2% of the
tin was recovered into a 0.34% Sn concentrate. This translates to an additional 3.8% increase
in overall tin recovery, which may not merit the additional milling and gravity separation
stage on the 100-micron scavenger tailings.

135
13.2.6 Test Results – Tin Flotation
Tin flotation tests were carried out on the various gravity tailings using the conditions
outlined in Table 13.9 below.
Table 13.9
Tin Flotation Conditions
Sulphide Scavenger FT12 FT13 Tin Rougher FT12 FT13
pH 5.5 5.5 pH 5.2 5.2
H2SO4 g/t 31 31 H2SO4 g/t 156 156
CuSO4 g/t 250 250 Sodium Silicate g/t 1000 1000
SIPX g/t 100 100 Aluminum Sulphate g/t - -
MIBC g/t 20 20 Aero 845 g/t 330 330
Condition Time 5/2 min 5/2 min Condition Time 5/5 min 5/5 min
Flotation Time 2 2 Flotation Time 15 15
The feed to test FT12 was scavenged 50-micron tailings, and FT13 used 100-micron gravity
tailings milled to 50 microns to compare gravity/flotation and flotation only.
The flotation feed was subjected to desliming at approximately 8 microns and a sulphide
scavenger flotation prior to tin flotation.
The tin flotation rougher produced a tin stage recovery of 63%, with a maximum grade of
0.38% Sn from a 0.069% Sn head grade. Flotation was essentially complete after 10 min, but
since the feed only represented 14.9% of the tin in the original feed, the overall tin recovery
was 9.4%. Some tin was able to be extracted from the 50-micron tailings, but the grades and
recovery were low. See Table 13.10.
Flotation was also conducted on the 50-micron material produced without a gravity
scavenger circuit in test FT13. Results are shown in Table 13.11.
Flotation without a prior gravity scavenger stage did not produce significantly better results
than FT12, which included gravity scavenging. Tin recovery was high at 67% after 5 rougher
stages, but overall rougher concentrate tin grades were low at 0.14%. The feed only
represented 18.5% of the tin in plant feed, so the overall tin recovery was 12.4%.
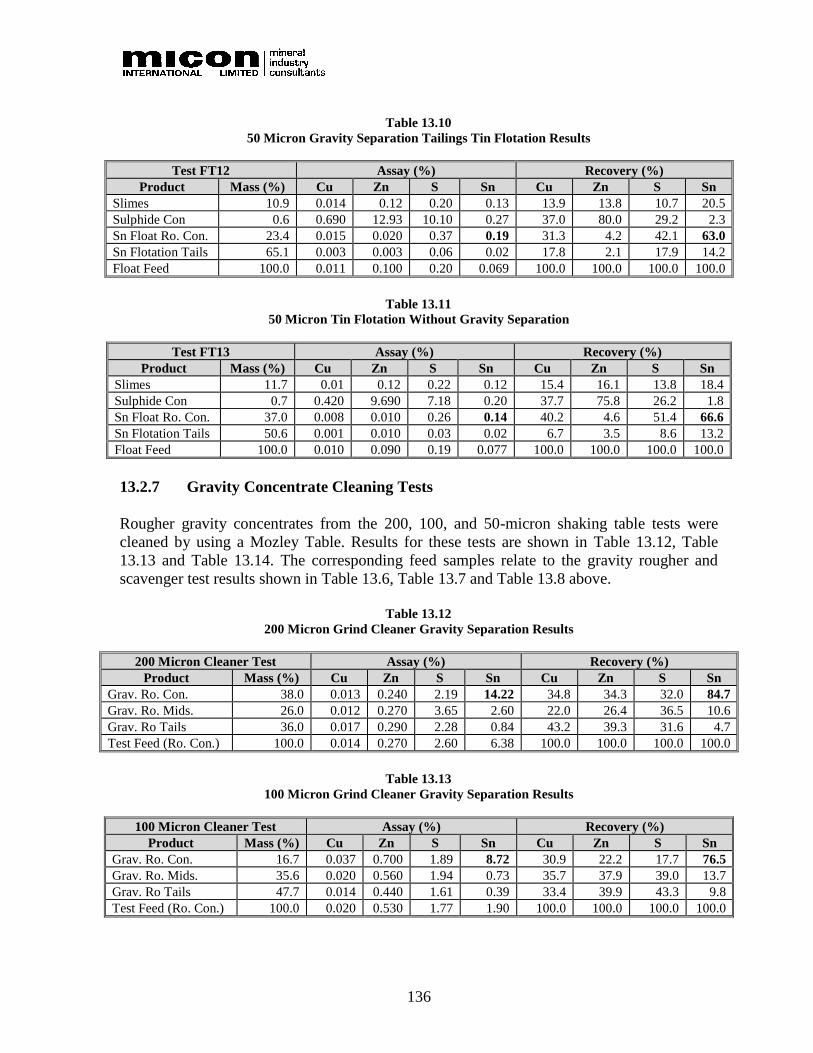
136
Table 13.10
50 Micron Gravity Separation Tailings Tin Flotation Results
Test FT12 Assay (%) Recovery (%)
Product Mass (%) Cu Zn S Sn Cu Zn S Sn
Slimes 10.9 0.014 0.12 0.20 0.13 13.9 13.8 10.7 20.5
Sulphide Con 0.6 0.690 12.93 10.10 0.27 37.0 80.0 29.2 2.3
Sn Float Ro. Con. 23.4 0.015 0.020 0.37 0.19 31.3 4.2 42.1 63.0
Sn Flotation Tails 65.1 0.003 0.003 0.06 0.02 17.8 2.1 17.9 14.2
Float Feed 100.0 0.011 0.100 0.20 0.069 100.0 100.0 100.0 100.0
Table 13.11
50 Micron Tin Flotation Without Gravity Separation
Test FT13 Assay (%) Recovery (%)
Product Mass (%) Cu Zn S Sn Cu Zn S Sn
Slimes 11.7 0.01 0.12 0.22 0.12 15.4 16.1 13.8 18.4
Sulphide Con 0.7 0.420 9.690 7.18 0.20 37.7 75.8 26.2 1.8
Sn Float Ro. Con. 37.0 0.008 0.010 0.26 0.14 40.2 4.6 51.4 66.6
Sn Flotation Tails 50.6 0.001 0.010 0.03 0.02 6.7 3.5 8.6 13.2
Float Feed 100.0 0.010 0.090 0.19 0.077 100.0 100.0 100.0 100.0
13.2.7 Gravity Concentrate Cleaning Tests
Rougher gravity concentrates from the 200, 100, and 50-micron shaking table tests were
cleaned by using a Mozley Table. Results for these tests are shown in Table 13.12, Table
13.13 and Table 13.14. The corresponding feed samples relate to the gravity rougher and
scavenger test results shown in Table 13.6, Table 13.7 and Table 13.8 above.
Table 13.12
200 Micron Grind Cleaner Gravity Separation Results
200 Micron Cleaner Test Assay (%) Recovery (%)
Product Mass (%) Cu Zn S Sn Cu Zn S Sn
Grav. Ro. Con. 38.0 0.013 0.240 2.19 14.22 34.8 34.3 32.0 84.7
Grav. Ro. Mids. 26.0 0.012 0.270 3.65 2.60 22.0 26.4 36.5 10.6
Grav. Ro Tails 36.0 0.017 0.290 2.28 0.84 43.2 39.3 31.6 4.7
Test Feed (Ro. Con.) 100.0 0.014 0.270 2.60 6.38 100.0 100.0 100.0 100.0
Table 13.13
100 Micron Grind Cleaner Gravity Separation Results
100 Micron Cleaner Test Assay (%) Recovery (%)
Product Mass (%) Cu Zn S Sn Cu Zn S Sn
Grav. Ro. Con. 16.7 0.037 0.700 1.89 8.72 30.9 22.2 17.7 76.5
Grav. Ro. Mids. 35.6 0.020 0.560 1.94 0.73 35.7 37.9 39.0 13.7
Grav. Ro Tails 47.7 0.014 0.440 1.61 0.39 33.4 39.9 43.3 9.8
Test Feed (Ro. Con.) 100.0 0.020 0.530 1.77 1.90 100.0 100.0 100.0 100.0
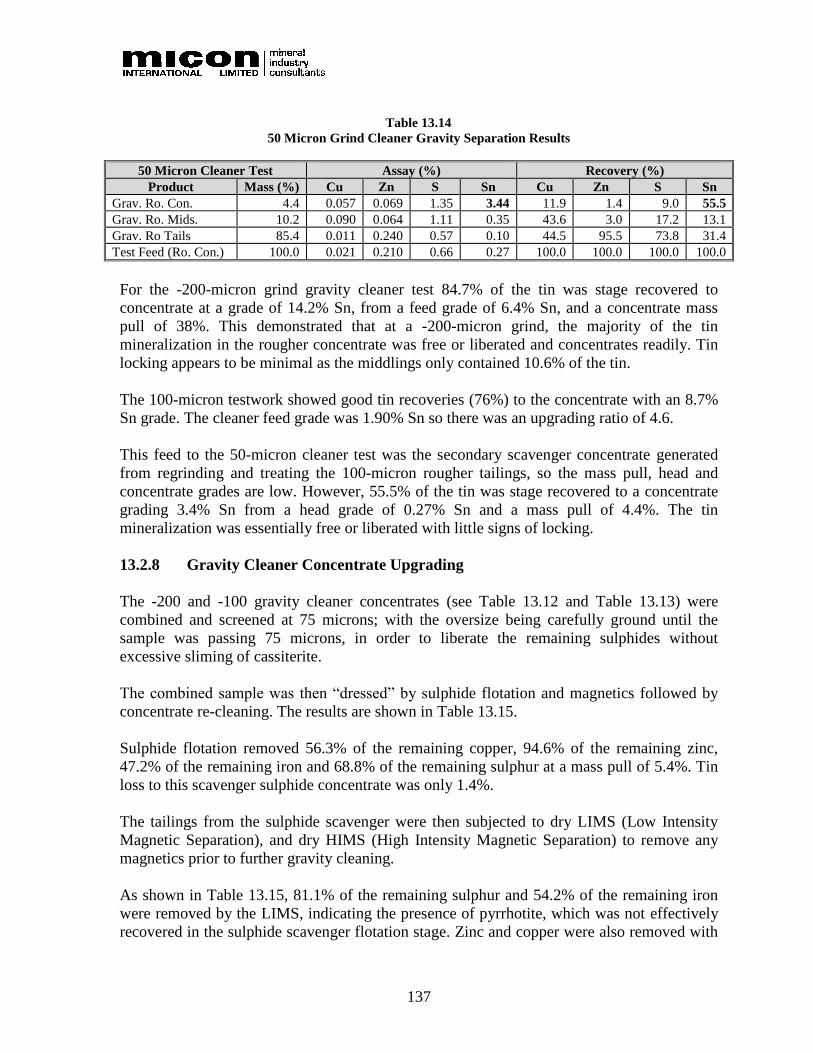
137
Table 13.14
50 Micron Grind Cleaner Gravity Separation Results
50 Micron Cleaner Test Assay (%) Recovery (%)
Product Mass (%) Cu Zn S Sn Cu Zn S Sn
Grav. Ro. Con. 4.4 0.057 0.069 1.35 3.44 11.9 1.4 9.0 55.5
Grav. Ro. Mids. 10.2 0.090 0.064 1.11 0.35 43.6 3.0 17.2 13.1
Grav. Ro Tails 85.4 0.011 0.240 0.57 0.10 44.5 95.5 73.8 31.4
Test Feed (Ro. Con.) 100.0 0.021 0.210 0.66 0.27 100.0 100.0 100.0 100.0
For the -200-micron grind gravity cleaner test 84.7% of the tin was stage recovered to
concentrate at a grade of 14.2% Sn, from a feed grade of 6.4% Sn, and a concentrate mass
pull of 38%. This demonstrated that at a -200-micron grind, the majority of the tin
mineralization in the rougher concentrate was free or liberated and concentrates readily. Tin
locking appears to be minimal as the middlings only contained 10.6% of the tin.
The 100-micron testwork showed good tin recoveries (76%) to the concentrate with an 8.7%
Sn grade. The cleaner feed grade was 1.90% Sn so there was an upgrading ratio of 4.6.
This feed to the 50-micron cleaner test was the secondary scavenger concentrate generated
from regrinding and treating the 100-micron rougher tailings, so the mass pull, head and
concentrate grades are low. However, 55.5% of the tin was stage recovered to a concentrate
grading 3.4% Sn from a head grade of 0.27% Sn and a mass pull of 4.4%. The tin
mineralization was essentially free or liberated with little signs of locking.
13.2.8 Gravity Cleaner Concentrate Upgrading
The -200 and -100 gravity cleaner concentrates (see Table 13.12 and Table 13.13) were
combined and screened at 75 microns; with the oversize being carefully ground until the
sample was passing 75 microns, in order to liberate the remaining sulphides without
excessive sliming of cassiterite.
The combined sample was then “dressed” by sulphide flotation and magnetics followed by
concentrate re-cleaning. The results are shown in Table 13.15.
Sulphide flotation removed 56.3% of the remaining copper, 94.6% of the remaining zinc,
47.2% of the remaining iron and 68.8% of the remaining sulphur at a mass pull of 5.4%. Tin
loss to this scavenger sulphide concentrate was only 1.4%.
The tailings from the sulphide scavenger were then subjected to dry LIMS (Low Intensity
Magnetic Separation), and dry HIMS (High Intensity Magnetic Separation) to remove any
magnetics prior to further gravity cleaning.
As shown in Table 13.15, 81.1% of the remaining sulphur and 54.2% of the remaining iron
were removed by the LIMS, indicating the presence of pyrrhotite, which was not effectively
recovered in the sulphide scavenger flotation stage. Zinc and copper were also removed with
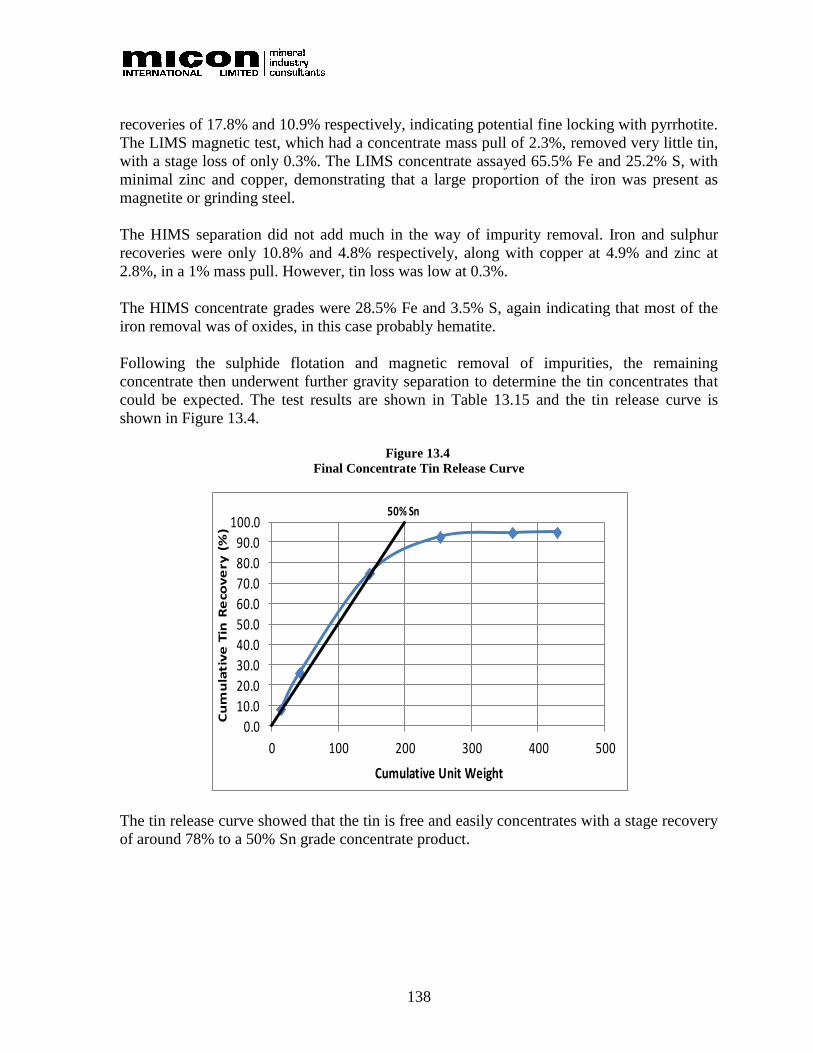
138
recoveries of 17.8% and 10.9% respectively, indicating potential fine locking with pyrrhotite.
The LIMS magnetic test, which had a concentrate mass pull of 2.3%, removed very little tin,
with a stage loss of only 0.3%. The LIMS concentrate assayed 65.5% Fe and 25.2% S, with
minimal zinc and copper, demonstrating that a large proportion of the iron was present as
magnetite or grinding steel.
The HIMS separation did not add much in the way of impurity removal. Iron and sulphur
recoveries were only 10.8% and 4.8% respectively, along with copper at 4.9% and zinc at
2.8%, in a 1% mass pull. However, tin loss was low at 0.3%.
The HIMS concentrate grades were 28.5% Fe and 3.5% S, again indicating that most of the
iron removal was of oxides, in this case probably hematite.
Following the sulphide flotation and magnetic removal of impurities, the remaining
concentrate then underwent further gravity separation to determine the tin concentrates that
could be expected. The test results are shown in Table 13.15 and the tin release curve is
shown in Figure 13.4.
Figure 13.4
Final Concentrate Tin Release Curve
The tin release curve showed that the tin is free and easily concentrates with a stage recovery
of around 78% to a 50% Sn grade concentrate product.
0.0
10.0
20.0
30.0
40.0
50.0
60.0
70.0
80.0
90.0
100.0
0 100 200 300 400 500
Cu
mu
lati
ve
Tin
Re
cov
ery
(%
)
Cumulative Unit Weight
50% Sn
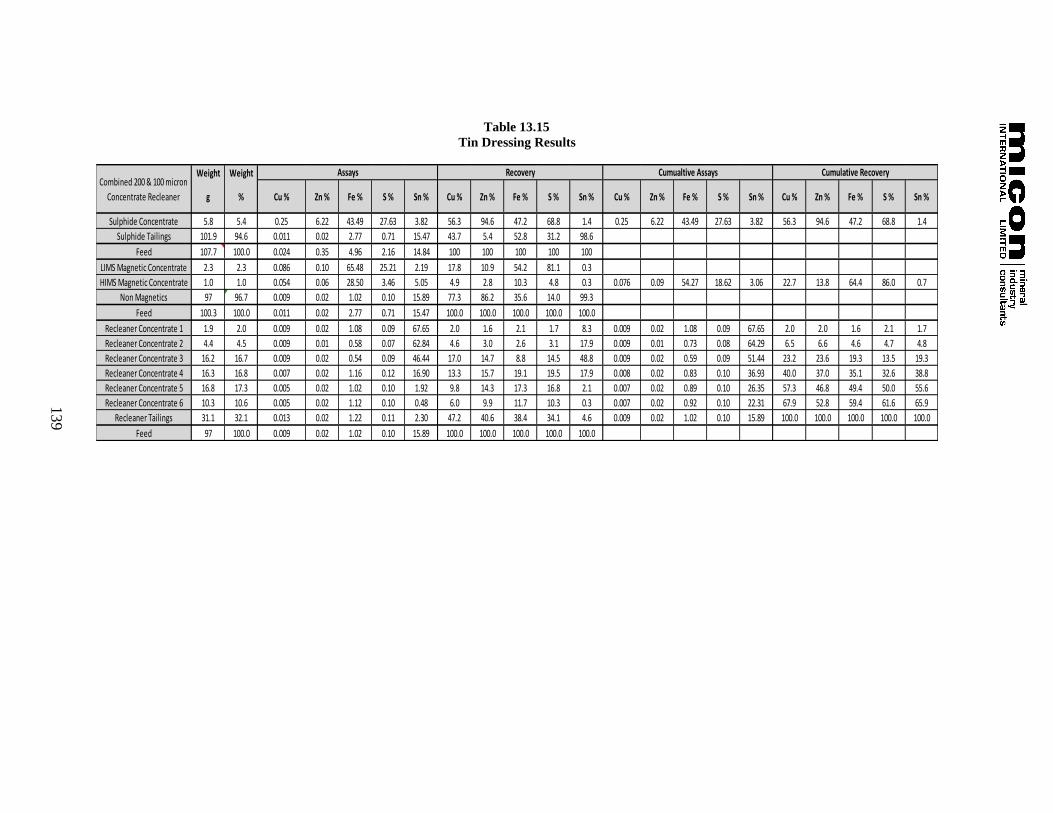
139
Table 13.15
Tin Dressing Results
Weight Weight
g % Cu % Zn % Fe % S % Sn % Cu % Zn % Fe % S % Sn % Cu % Zn % Fe % S % Sn % Cu % Zn % Fe % S % Sn %
Sulphide Concentrate 5.8 5.4 0.25 6.22 43.49 27.63 3.82 56.3 94.6 47.2 68.8 1.4 0.25 6.22 43.49 27.63 3.82 56.3 94.6 47.2 68.8 1.4
Sulphide Tailings 101.9 94.6 0.011 0.02 2.77 0.71 15.47 43.7 5.4 52.8 31.2 98.6
Feed 107.7 100.0 0.024 0.35 4.96 2.16 14.84 100 100 100 100 100
LIMS Magnetic Concentrate 2.3 2.3 0.086 0.10 65.48 25.21 2.19 17.8 10.9 54.2 81.1 0.3
HIMS Magnetic Concentrate 1.0 1.0 0.054 0.06 28.50 3.46 5.05 4.9 2.8 10.3 4.8 0.3 0.076 0.09 54.27 18.62 3.06 22.7 13.8 64.4 86.0 0.7
Non Magnetics 97 96.7 0.009 0.02 1.02 0.10 15.89 77.3 86.2 35.6 14.0 99.3
Feed 100.3 100.0 0.011 0.02 2.77 0.71 15.47 100.0 100.0 100.0 100.0 100.0
Recleaner Concentrate 1 1.9 2.0 0.009 0.02 1.08 0.09 67.65 2.0 1.6 2.1 1.7 8.3 0.009 0.02 1.08 0.09 67.65 2.0 2.0 1.6 2.1 1.7
Recleaner Concentrate 2 4.4 4.5 0.009 0.01 0.58 0.07 62.84 4.6 3.0 2.6 3.1 17.9 0.009 0.01 0.73 0.08 64.29 6.5 6.6 4.6 4.7 4.8
Recleaner Concentrate 3 16.2 16.7 0.009 0.02 0.54 0.09 46.44 17.0 14.7 8.8 14.5 48.8 0.009 0.02 0.59 0.09 51.44 23.2 23.6 19.3 13.5 19.3
Recleaner Concentrate 4 16.3 16.8 0.007 0.02 1.16 0.12 16.90 13.3 15.7 19.1 19.5 17.9 0.008 0.02 0.83 0.10 36.93 40.0 37.0 35.1 32.6 38.8
Recleaner Concentrate 5 16.8 17.3 0.005 0.02 1.02 0.10 1.92 9.8 14.3 17.3 16.8 2.1 0.007 0.02 0.89 0.10 26.35 57.3 46.8 49.4 50.0 55.6
Recleaner Concentrate 6 10.3 10.6 0.005 0.02 1.12 0.10 0.48 6.0 9.9 11.7 10.3 0.3 0.007 0.02 0.92 0.10 22.31 67.9 52.8 59.4 61.6 65.9
Recleaner Tailings 31.1 32.1 0.013 0.02 1.22 0.11 2.30 47.2 40.6 38.4 34.1 4.6 0.009 0.02 1.02 0.10 15.89 100.0 100.0 100.0 100.0 100.0
Feed 97 100.0 0.009 0.02 1.02 0.10 15.89 100.0 100.0 100.0 100.0 100.0
Cumualtive Assays Cumulative RecoveryCombined 200 & 100 micron
Concentrate Recleaner
Assays Recovery
140
13.2.9 Conclusions and Recommendations from the SGS UK Test Program
• Pre-concentration using dense media separation or conventional gravity separation at
coarse sizes to reject a coarse waste product could be considered for tin recovery
although the overall copper and zinc losses would be high. Heavy liquid test results
demonstrated that with mass rejection from 25% to 51%, (mass rejection increasing
with decreasing size from 11.2 mm to 1 mm) tin losses would be around 5-7%.
• The tin release curves give clear cut separations below 250 microns, with 40% mass
pull to concentrate generating 97% tin recoveries. There is no clear separation for the
tin until size is reduced to below 250 microns, which is an optimum size for further
processing.
• Tin grades of over 5% were being achieved in all of the size fractions, albeit at low
recoveries indicating the presence of free tin from the coarsest sizes downwards,
which should be removed at the earliest opportunity to prevent over grinding of
cassiterite as the grind size decreases.
• The magnetic separation testwork suggested that iron and sulphur could be removed
magnetically, at low magnetic field strengths.
• Previous mineralogy investigations highlighted that pyrite/pyrrhotite and cassiterite
particle size was typically coarse at circa 100 microns, with chalcopyrite and
sphalerite particle size being finer at 50 microns. All of the minerals of interest were
60-80% liberated at +106 microns, which showed that a coarse bulk sulphide removal
approach could be feasible.
• Gravity separation on bulk rougher flotation tailings at -200 microns produced a tin
concentrate assaying 6.6% Sn at a stage recovery of 71.6%. Following further
grinding of the 200-micron gravity tailings to 100 microns, a further gravity tin
recovery of 9.7% was generated at a tin grade of 1.6% Sn giving a total recovery of
81.3%. Allowing for the 2% tin loss to sulphide concentrates, this generated an
overall tin rougher recovery of 79.7%. Overall mass pull was circa 6-7%.
• Gravity separation following further milling of the 100-micron gravity tailings to
80% passing 50 microns generated a further tin stage recovery at a grade of 0.34% Sn
from a head grade of 0.082% Sn. This represented a further overall tin recovery of
4%, bringing total gravity stage recovery to 85.5%.
• Tin rougher flotation on the 80% passing 50-micron gravity tailings gave higher tin
recoveries than the gravity separation at between 63-67% at concentrate grades of
circa 0.19-0.14% Sn. Mass pull to concentrate was high at approximately 25%.
However, cleaning of the flotation tin concentrate using flotation proved to be
difficult.
• Cleaning of the 200 and 100-micron rougher gravity concentrates produced tin stage
recoveries of 85% and 77% respectively with tin concentrate grades of 14.2% Sn and
8.7% Sn, demonstrating that even at these coarser sizes, there is considerable tin
liberation. The majority of the remaining tin was locked in the middlings, with only
5-9% of the tin lost to tailings.
141
• Gravity re-cleaning of the high intensity non-magnetic tailings generated tin grades of
up to 63% Sn, albeit at a low stage recovery of 26%. A 75% tin stage recovery could
be achieved at an acceptable tin grade of 50.5%.
After completing a variety of bench scale tests, SGS UK was able to develop a flowsheet for
the East Kemptville deposit to produce copper, zinc and tin concentrates. Copper recovery
was estimated at 86.4% into a 20.7% grade copper concentrate, zinc recovery was estimated
at 84.5% into a 51.4% grade zinc concentrate and tin recovery into a 50.5% Sn concentrate
was estimated at 76.8%. A detailed analysis of the final tin concentrate as produced by SGS
UK is presented in Table 13.16.
Table 13.16
Final Tin Concentrate Analysis
Element Sn Cu Zn Fe S Pb As Cd
Value (%) 55.22 0.009 0.014 0.57 0.08 0.005 0.002 <0.0001
Element Ni Co Bi Hg Se SiO2 Mn CaF2
Value (%) 0.006 <0.001 <0.0001 <0.0001 0.0001 9.04 0.35 0.55
13.3 MET-SOLVE LOW GRADE STOCKPILE TESTWORK
Using the SGS UK test results as a basis, Avalon contracted Met-Solve in Langley, BC (Met-
Solve) in 2016 to undertake further flowsheet development testwork to recover tin from East
Kemptville mineralization. The testwork program was divided into three phases:
• Phase I: Use of falcon gravity concentrators at 3 different grind sizes (200, 150 and
100 µm) to determine the sample’s response to gravity concentration for the recovery
of tin.
• Phase II: Grind material to 200 µm for the gravity rougher stage, followed by a
regrind to 100 µm for gravity scavenging. Gravity tailings were then floated to
attempt to recover additional tin.
• Phase III: Locked Cycle tests of the best flowsheet configuration previously identified
in Phases I and II.
13.3.1 Metallurgical Sample
Avalon selected and shipped approximately 178 kg of crushed samples from the East
Kemptville low-grade stockpile to Met-Solve. A composite was created from the combined
samples which was analysed. In addition, head sample analyses were generated for a number
of the tests the results of which are listed in Table 13.17. The average head grade for this
sample (based on the various analyses) was 0.12% Sn which is higher than the direct assay of
the composite sample at 0.10% Sn and also more in-line with previous stockpile sampling
analyses. The inferred mineral resource grade of the stockpile is 0.11% Sn which compares
well with the sample analyses.

142
Table 13.17
Tin Head Assay of Various Met-Solve Testwork Samples
Test Description Test Number Sn (%)
SFA (Size Fraction Analysis) WA101 0.13
Open Rougher Cleaner Test WA102 0.12
Open Rougher Cleaner Test WA103 0.12
Open Rougher Cleaner Test WA104 0.12
Open Gravity-Float Test WA105 0.12
Locked Cycle Test WA201 0.11
Locked Cycle Test WA301 0.11
Average Calculated Grade - 0.12
Direct Assay - 0.10
13.3.2 Phase I – Gravity Concentration
Results from Phase I found that gravity concentration was an effective method at recovering
tin from the mineralized samples and grinding to 98 microns gave better results compared to
the other coarser grind sizes. Figure 13.5 below shows the results of the three grinds used for
the testwork.
The results indicate that the East Kemptville material responds well to gravity concentration,
achieving up to 81.6% tin recovery with a 26% mass yield with the P80 grind of 98 microns.
Figure 13.5
Falcon Rougher Gravity Recoveries at Various Grind Sizes
Source: Met-Solve, MS1666 Avalon East Kemptville Gravity Testwork Report, October 2016

143
Additional testwork comprising rougher, cleaner, scavenger and cleaner scavenger gravity
concentration using Falcons was completed. Cleaner gravity concentrate was further
processed with a shaking table to improve tin grade. A final concentrate grading 45.8% Sn
was produced albeit with poor tin recoveries due to the test being operated in open-circuit
with no recycling of intermediate products (the scavenger tailings stream contained only
17.7% of the tin).
13.3.3 Phase II – Gravity and Flotation Testwork
Phase II of the testwork included a two-stage grinding circuit and a flotation circuit to
recover tin from the scavenger gravity tailings stream. Overgrinding and slimes production
can be a problem, so the first stage of gravity concentration was used to capture coarser tin
minerals and a grind of 182 microns while the tailings from the first stage were re-ground to
109 micron and subjected to a second stage of gravity recovery. Figure 13.6 below illustrates
the flowsheet used for the testwork.
Results from the Phase II testwork showed improved tin recoveries when combining flotation
and shaking table concentrates, but the overall grade was low due to the poorer liberation
from the coarser concentrate material. It was also shown that the intermediate grind at 100
microns had limited effect in improving recoveries as the bulk of the tin was recovered in the
first/coarse stage. Although about 63.5% of the tin in the gravity tailings were recovered in
the flotation concentrate, the potential to upgrade this material to a grade >40% was
considered limited, and the cost of the additional flotation circuit would most likely outweigh
any additional revenue.
Figure 13.6
Open Circuit Gravity-Flotation Flowsheet
Source: Met-Solve, MS1666 Avalon East Kemptville Gravity Testwork Report, October 2016.
13.3.4 Phase III – Locked Cycle Tests
It was decided that doing a Locked Cycle Tests (LCT) was required to better determine the
overall recovery potential, and that in order to keep the flowsheet to a single stage of
grinding, a mill product size P80 of ~100 microns should be targeted.
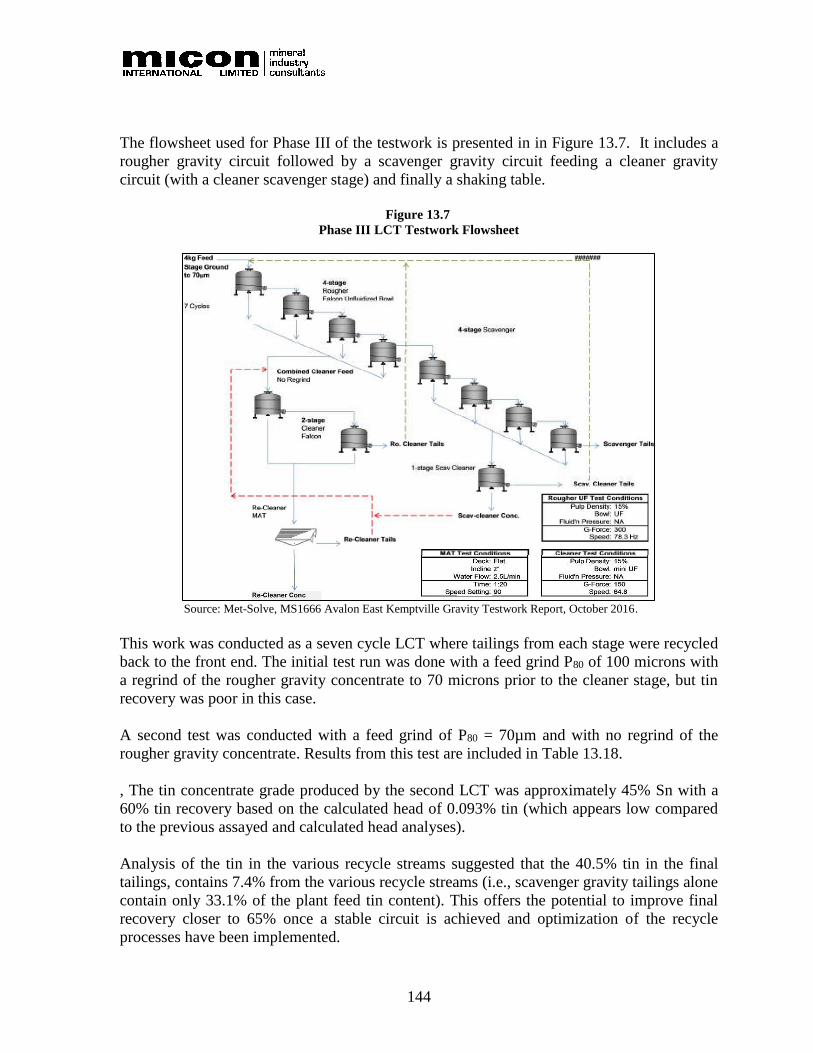
144
The flowsheet used for Phase III of the testwork is presented in in Figure 13.7. It includes a
rougher gravity circuit followed by a scavenger gravity circuit feeding a cleaner gravity
circuit (with a cleaner scavenger stage) and finally a shaking table.
Figure 13.7
Phase III LCT Testwork Flowsheet
Source: Met-Solve, MS1666 Avalon East Kemptville Gravity Testwork Report, October 2016.
This work was conducted as a seven cycle LCT where tailings from each stage were recycled
back to the front end. The initial test run was done with a feed grind P80 of 100 microns with
a regrind of the rougher gravity concentrate to 70 microns prior to the cleaner stage, but tin
recovery was poor in this case.
A second test was conducted with a feed grind of P80 = 70µm and with no regrind of the
rougher gravity concentrate. Results from this test are included in Table 13.18.
, The tin concentrate grade produced by the second LCT was approximately 45% Sn with a
60% tin recovery based on the calculated head of 0.093% tin (which appears low compared
to the previous assayed and calculated head analyses).
Analysis of the tin in the various recycle streams suggested that the 40.5% tin in the final
tailings, contains 7.4% from the various recycle streams (i.e., scavenger gravity tailings alone
contain only 33.1% of the plant feed tin content). This offers the potential to improve final
recovery closer to 65% once a stable circuit is achieved and optimization of the recycle
processes have been implemented.

145
Table 13.18
Locked Cycle Test 2 Results
Product wt. % Grade
Sn (%)
F
(%)
Sn Distribution
(%)
Gravity Concentrate
Re-Cleaner Con. Cycle 1 0.01 41.61 1.44 4.8
Re-Cleaner Con. Cycle 2 0.02 47.49 0.67 10.3
Re-Cleaner Con. Cycle 3 0.02 43.93 0.90 7.5
Re-Cleaner Con. Cycle 4 0.02 44.68 0.66 8.3
Re-Cleaner Con. Cycle 5 0.02 44.06 0.68 9.2
Re-Cleaner Con. Cycle 6 0.02 46.91 0.59 9.4
Re-Cleaner Con. Cycle 7 0.02 42.74 0.55 10.2
Total Re-Cleaner Concentrates 0.12 44.67 59.5
Average Con Grade from Last 3 Cycles 44.57 0.61
Scavenger Tailings, Cycle 1 10.6 0.031 3.5
Scavenger Tailings, Cycle 2 14.0 0.036 5.4
Scavenger Tailings, Cycle 3 15.7 0.040 6.7
Scavenger Tailings, Cycle 4 14.7 0.038 5.9
Scavenger Tailings, Cycle 5 15.3 0.041 6.6
Scavenger Tailings, Cycle 6 14.1 0.038 5.8
Scavenger Tailings, Cycle 7 15.5 0.040 6.6
Total Bulk Gravity Tailings 99.9 0.038 40.5
Calculated Head from LCT 100.0 0.093 100.0
Assayed Head 0.100
SFA Calculated Head 0.104
13.3.5 Concentrate Upgrading by Flotation to Remove Base Metal Sulphides
The tin concentrate produced by the LCT discussed above contained over 20% sulphides,
predominantly iron sulphides. An investigation was conducted to remove these to produce a
higher-grade tin concentrate without significant tin losses.
To further upgrade the final tin concentrate, Met-Solve conducted further testwork
investigating the use of froth flotation together with low intensity magnetic separation
(LIMS) to remove sulphide material from the Locked Cycle concentrate. The flowsheet used
was the same as Figure 13.7 with the addition of sulphide flotation and magnetic separation
between the Falcon cleaners and the final shaking table cleaner. The feed to this test circuit
was ground to a P80 of 79 µm.
The LIMS and sulphide float removed ~60% of the iron and 93% of the sulphur present. The
final tin concentrate after removal of these increased to 68.3% tin with only very minor
losses of tin (approximately 0.2% losses to magnetics and 1.4% losses to the flotation
concentrate). It is believed that much of these losses could be recovered by subjecting both
the magnetics and float concentrate to cleaner operations as any tin present is most likely the
result of physical entrainment in the material being removed.

146
The final tin concentrate grade of >68% is far greater than the targeted 55% concentrate. This
suggests that it is reasonable to assume that the eventual tin recovery will be higher than the
58-59.5% achieved in these tests when producing the lower grade. product.
13.3.6 Sulphide Removal from Gravity Tailings
Following the development work covered in Section 13.3.3 and 13.3.4, Met-Solve performed
further investigations to look at using sulphide flotation to reduce sulphide levels in the
gravity tailings to below 0.1% wt. % sulphur such that they could be used as capping material
for sealing the tailings dam. The scope of the work included producing a bulk composite for
gravity tailings (after tin removal) following which, the sample was subjected to sulphide
flotation to reduce the suphide grade. Met-Solve conducted a number of scoping flotation
tests with SIPX and PAX reagents at different dosages to achieve the low sulphide
requirement for the tailings.
Avalon sent approximately 167 kg of Main Zone drill core sample to Met-Solve in April,
2018. Met-Solve then crushed the material to 2 mm before stage-grinding the sample to a
grind size of 68 µm. The calculated head sample contained 0.15% Sn and 0.62% S. The
milled material was subjected to a two-stage gravity process with the rougher gravity tailings
from the first stage feeding the second gravity process. Concentrates from the two stages
were collected while the rougher scavenger gravity tailings were used for sulphide flotation
testing. Figure 13.8 below shows the flowsheet and Falcon concentrator test conditions.
Figure 13.8
Met-Solve Gravity Tailings Sulphide Removal Flowsheet
The results from this test are summarized in Table 13.19.
147
Table 13.19
Summary of Results from Met-Solve Gravity Tailings Sulphide Removal Test
Products Weight
(%)
Assay (%) Distribution (%)
Sn S Sn S
Falcon Concentrate 22.37 0.54 1.13 75.6 40.4
Rougher + Scav Float Conc 4.27 0.09 8.30 2.4 56.6
Scavenger Float Tails 73.36 0.05 0.025 22.0 2.9
Calculated Head 100.0
0
0.16 0.63 100.0 100.0
Assay Head 0.16 0.64
The sulphide flotation stage was able to reduce the levels of the sulphur in the scavenger
tailings to 0.025% S, which is well below the target of 0.1% S. In reviewing the results, it
was noted that the sulphur content of the rougher tailings (scavenger feed) was 0.05% which
suggests that the scavenger flotation stages would not be required. By eliminating the second
sulphide rougher and the rougher scavenger, PAX addition would be reduced to 95 g/t and
neither copper sulphate or Lime (for pH control) would not be required.
13.4 CONCLUSIONS
The testwork on samples representing the East Kemptville mineral resources has resulted in
the development of a flowsheet capable of producing a tin concentrate. The material will be
milled to P80 ±80 microns before being put through a series of Falcon gravity concentrators.
Falcon concentrates will feed a magnetic separation circuit followed by a simple sulphide
flotation circuit to remove sulphides. The non-sulphide flotation tailings will be cleaned
using final shaking table gravity circuit the concentrates from which will be collected and
dewatered before being shipped to potential customers.
In order to minimize over-grinding of the cassiterite a gravity recovery stage will be installed
within the milling/classification process which will reduce the recirculation of liberated tin to
the ball mill.
The recoveries and product grades used in the plant design, based on the testwork described
above, are presented in Table 13.20.
Table 13.20
Basic Process Design Criteria from Metallurgical Testwork
Parameter Units Value
Grind Size P80 Microns 80
Tin losses to sulphide/magnetics concentrate % In Mill Feed 1.6
Tin recovery to final concentrate % 60
Grade of the tin gravity concentrate % Tin 55
The tailings from the gravity circuit can be treated through a bulk sulphide flotation process
to reduce contained Sulphur content to approximately 0.05% S, making it a suitable material
for capping of the tailings dam.
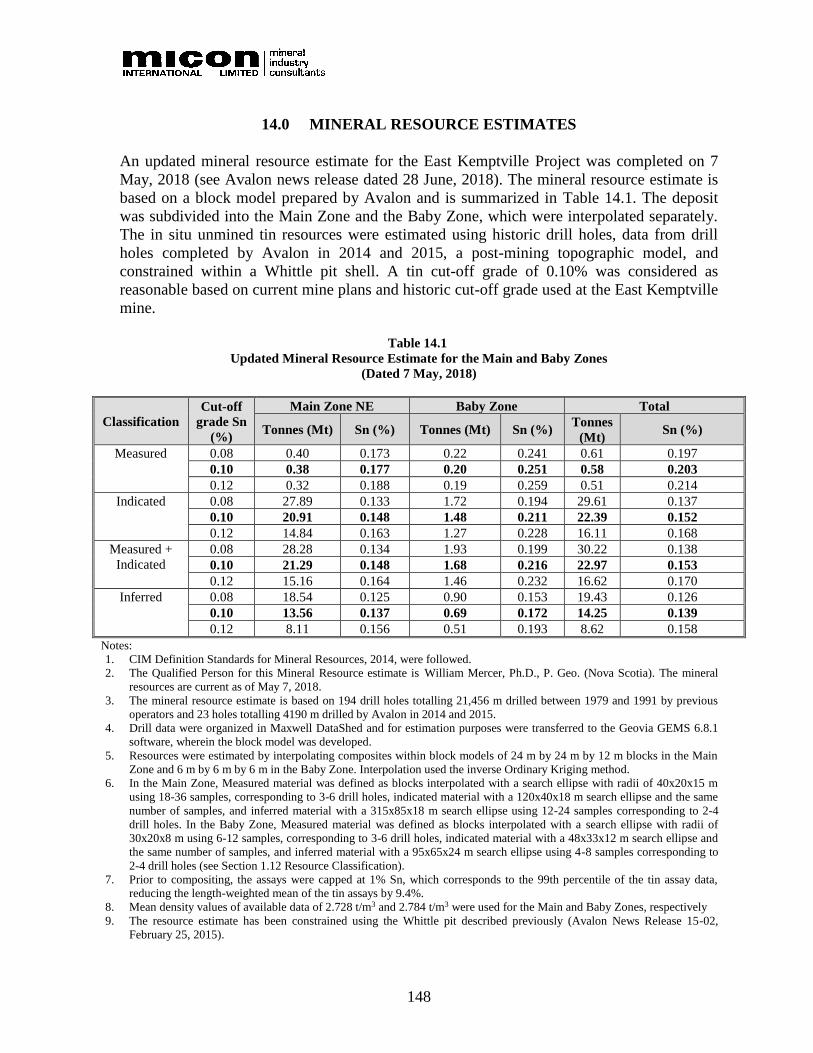
148
14.0 MINERAL RESOURCE ESTIMATES
An updated mineral resource estimate for the East Kemptville Project was completed on 7
May, 2018 (see Avalon news release dated 28 June, 2018). The mineral resource estimate is
based on a block model prepared by Avalon and is summarized in Table 14.1. The deposit
was subdivided into the Main Zone and the Baby Zone, which were interpolated separately.
The in situ unmined tin resources were estimated using historic drill holes, data from drill
holes completed by Avalon in 2014 and 2015, a post-mining topographic model, and
constrained within a Whittle pit shell. A tin cut-off grade of 0.10% was considered as
reasonable based on current mine plans and historic cut-off grade used at the East Kemptville
mine.
Table 14.1
Updated Mineral Resource Estimate for the Main and Baby Zones
(Dated 7 May, 2018)
Classification
Cut-off
grade Sn
(%)
Main Zone NE Baby Zone Total
Tonnes (Mt) Sn (%) Tonnes (Mt) Sn (%) Tonnes
(Mt) Sn (%)
Measured 0.08 0.40 0.173 0.22 0.241 0.61 0.197
0.10 0.38 0.177 0.20 0.251 0.58 0.203
0.12 0.32 0.188 0.19 0.259 0.51 0.214
Indicated 0.08 27.89 0.133 1.72 0.194 29.61 0.137
0.10 20.91 0.148 1.48 0.211 22.39 0.152
0.12 14.84 0.163 1.27 0.228 16.11 0.168
Measured +
Indicated
0.08 28.28 0.134 1.93 0.199 30.22 0.138
0.10 21.29 0.148 1.68 0.216 22.97 0.153
0.12 15.16 0.164 1.46 0.232 16.62 0.170
Inferred 0.08 18.54 0.125 0.90 0.153 19.43 0.126
0.10 13.56 0.137 0.69 0.172 14.25 0.139
0.12 8.11 0.156 0.51 0.193 8.62 0.158
Notes:
1. CIM Definition Standards for Mineral Resources, 2014, were followed.
2. The Qualified Person for this Mineral Resource estimate is William Mercer, Ph.D., P. Geo. (Nova Scotia). The mineral
resources are current as of May 7, 2018.
3. The mineral resource estimate is based on 194 drill holes totalling 21,456 m drilled between 1979 and 1991 by previous
operators and 23 holes totalling 4190 m drilled by Avalon in 2014 and 2015.
4. Drill data were organized in Maxwell DataShed and for estimation purposes were transferred to the Geovia GEMS 6.8.1
software, wherein the block model was developed.
5. Resources were estimated by interpolating composites within block models of 24 m by 24 m by 12 m blocks in the Main
Zone and 6 m by 6 m by 6 m in the Baby Zone. Interpolation used the inverse Ordinary Kriging method.
6. In the Main Zone, Measured material was defined as blocks interpolated with a search ellipse with radii of 40x20x15 m
using 18-36 samples, corresponding to 3-6 drill holes, indicated material with a 120x40x18 m search ellipse and the same
number of samples, and inferred material with a 315x85x18 m search ellipse using 12-24 samples corresponding to 2-4
drill holes. In the Baby Zone, Measured material was defined as blocks interpolated with a search ellipse with radii of
30x20x8 m using 6-12 samples, corresponding to 3-6 drill holes, indicated material with a 48x33x12 m search ellipse and
the same number of samples, and inferred material with a 95x65x24 m search ellipse using 4-8 samples corresponding to
2-4 drill holes (see Section 1.12 Resource Classification).
7. Prior to compositing, the assays were capped at 1% Sn, which corresponds to the 99th percentile of the tin assay data,
reducing the length-weighted mean of the tin assays by 9.4%.
8. Mean density values of available data of 2.728 t/m3 and 2.784 t/m3 were used for the Main and Baby Zones, respectively
9. The resource estimate has been constrained using the Whittle pit described previously (Avalon News Release 15-02,
February 25, 2015).

149
10. Several possible cut-off grades are reported in this resource estimate. Based on past mining practice at East Kemptville, a
cut-off grade of 0.1% Sn is reasonable and preliminary cost and revenue values at the time of estimation also suggest this
is reasonable.
11. Mineral resources do not have demonstrated economic viability and their value may be materially affected by
environmental, permitting, legal, title, socio-political, marketing, or other issues.
The Qualified Person (QP) for the Baby and Main Zone mineral resources reported in the
PEA is William Mercer, P. Geo. who is not independent from Avalon. However, these
current resource estimates have not changed significantly since the previous versions that
were prepared independently by Hains Engineering with its principal, Donald Hains (P.
Geo), serving as the independent QP for the purpose of NI 43-101 (News Release 14-13,
October 31, 2014).
There has been no material change of the mineral resource estimate for the Low Grade
Stockpile since the previous estimate by Hains with an effective date of 16 November, 2015
(see Annual Information Form 20F, Avalon Advanced Materials, August 31, 2016, Table
EK2, Page 82, accessible on SEDAR (www.sedar.com) and Avalon’s website under
Financial Statements 2016 at the following link:
http://avalonadvancedmaterials.com/investors/regulatory_filings/).
Table 14.2
Low Grade Stockpile Estimated Inferred Mineral Resource
Category Tonnes (Mt) Grade (%)
Sn Zn Cu
Inferred 5.87 0.112 0.100 0.61
Notes:
1. This estimate is as of 16 November 2015.
2. CIM Definition Standards 2014 were followed for mineral resources.
3. The independent Qualified Person for this Mineral Resource estimate is Donald
Hains, P.Geo., of Hains Engineering Company Limited.
4. Resources were estimated by examination of historical RAL data and Avalon’s
2015 sampling of the Low-Grade Stockpile.
5. Mineral resources do not have demonstrated economic viability and their value
may be materially affected by environmental, permitting, legal, title, socio-
political, marketing or other issues.
14.1 MINERAL RESOURCE DATABASE
Avalon's Maxwell Datashed database for the May 7, 2018 mineral resource estimate for the
East Kemptville Project contained 472 drill holes with a total length of 62,893 m. The
Avalon database is based on the database of historical East Kemptville data built by a Nova
Scotia geological consultant using original drill hole logs and assay reports. The historical
database was imported to Avalon’s Maxwell Datashed database and verified. The database
contains 443 historical holes (57,395 m) drilled from 1979 to 1991 first by Shell and then by
Rio Algom and 29 drill holes (5,498 m) drilled by Avalon between 2014 to 2015 (Figure
14.1) to verify and expand on the historical drilling. The database includes collar, downhole
survey, lithology and assay tables.

150
Figure 14.1
Plan Showing Post-Mining (1992) Topography with the Traces of the Holes Drilled by Avalon Between
2014 and 2015 Projected to the Surface.
The assay data set in the Maxwell Datashed database includes 15,309 drill hole intervals, of
which 3,093 are from the 2014 and 2015 drill holes. Of these intervals, 14,277 contain Sn
assay values, 12,363 have Zn and 12,232 have Cu assay values.
An inspection of the data and the available original assay sheets indicated that for the missing
assay values, the data are not available because the original paper copies of the assay sheets
were lost. The missing intervals were thus removed prior to processing to avoid the
generation of artificial zero-grade assay intervals.
Not all drill holes in the project database are located within the resource model or have valid
collar data (Figure 14.2). The data was imported into GEMS 6.8.1 for geological modeling
and resource estimation. During the import into GEMS, 222 samples were discarded because
they are duplicates. Following removal of the empty Sn assay intervals and import into
GEMS, the sample intervals have a median length of 3.00 m and an average of 2.49 ± 0.92 m
(1σ) both in the overall data set (14,055 samples) and in the subset for the modeled granite
geology 3D-solid (9,178 samples). Table 14.2 summarizes the assay statistics for the project
database including all available data.

151
Figure 14.2
Plan Showing the 1992 Topographic Model and the Traces of All Drill Holes in the Database
Table 14.3
Assay Statistics – East Kemptville Project Database
All Assays Sn Zn Cu
Count (N)* 14,277 12,363 12,232
Minimum (%) 0.000 0.000 0.000
Maximum (%) 27.20 7.14 3.00
Mean (%) 0.110 0.129 0.050
Median (%) 0.032 0.056 0.021
Standard Deviation 0.493 0.227 0.097
The density database table includes data for historic holes (Wardrop, 2010) and for the holes
drilled by Avalon in 2014 and 2015. It contains 2,954 density entries, ranging from 1.680 to
7.970 g/cm3 with a mean of 2.751 g/cm3 and a median of 2.72 g/cm3. The density data is
further analysed in Section 14.6 including identification of erroneous data.
For this study, all available 3D coordinate data was transformed into the UTM NAD83 Zone
20 N and CGVD2013 elevation systems using Datashed transformations and transformations
in GEMS. It should be noted that the original database used NAD27 UTM coordinates as the
data was already prepared in this format by a Nova Scotia consultant. Present general
practice in Nova Scotia is to utilize NAD83 UTM coordinates.
In addition, the original mine elevations are 21.635 m higher than NAD83 CGVD2013
elevations. The calculation of this difference is based on survey of an iron bar on the East

152
Kemptville site with an original mine site elevation of 87.837 m. The NAD 83, CGVD2013
elevation of this same point is 66.202 m. Thus, the historic mine-based elevations are 21.635
m higher than NAD83.
14.2 DATABASE VALIDATION
The data exported from the Avalon database were validated by Avalon staff directed by
William Mercer P.Geo, and the procedures are described in Sections 11.0 and 12.0 detailing
the data verification and quality assurance/quality control procedures. The data imported into
GEMS was randomly validated against the original drill hole logs and assay reports. The
location of holes is reliant on historic data from qualified land surveyors as reported by Rio
Algom for the historical holes and reliant on Nova Scotia registered land surveyors for the
2014 and 2015 drill holes.
14.3 GEOLOGICAL INTERPRETATION
The East Kemptville deposit is a greisen deposit in which the four major lithologies are
recognized:
1. Granite intrusive, which hosts most of the mineralization.
2. Contact zone, which is a mineralized breccia containing both metasediment and
granite clasts.
3. Metasediments.
4. Overburden.
The greisen veins generally strike 030° and dip steeply and the geometry of the contact
between the granite and the metasediment is the main control on mineralization (Rio Algom,
1983).
Three geological units were modeled using the GEMS 6.8.1 3D software based on the
geology lithology table of the database: granite, metasediment and overburden. Although the
granite in the Baby Zone possibly represents a separate intrusion, it was found to be
geologically continuous with the granite of the Main Zone and the granite further to the
southwest. The contact zone, described as a mixture of granite and metasediment in drill
logs, was found to be discontinuous in 3D-space and was thus merged with either granite or
metasediment on a majority basis according to the drill logs. The 3D outline of the granite
was used as the limit of mineralized material in the resource estimate. In the block model,
blocks below the topography which were not within either of the geology 3D solids, were
assigned the rock code 'unknown'.
Although the lithological contacts were interpreted accurately, faults have not yet been
interpreted in the 3D model, mainly due to a lack of data providing their geo-referenced
locations. Future resource estimates may be improved through interpretation of the faults
crossing the deposit.

153
Figure 14.3
Three-Dimensional View Showing the 3D Wireframes for the Granite (Pink) and the Metasediment
(Brown) – Both Pre-Mining and the Drill Hole Traces
14.4 TOPOGRAPHY
The model of the original pre-mining topography in 1983 (Figure 14.4) is based on a 1:5,000
scale site plan from the 1983 Nova Scotia Department of Natural Resources Property Report
PR_ME_1983-010. The map was scanned and registered using the grid lines on the map.
Contour lines were digitized, and the surface was modeled from this data in Surpac software.
The model correlates well with the available surveyed drill hole collars with an average
difference of less than 0.1 m.
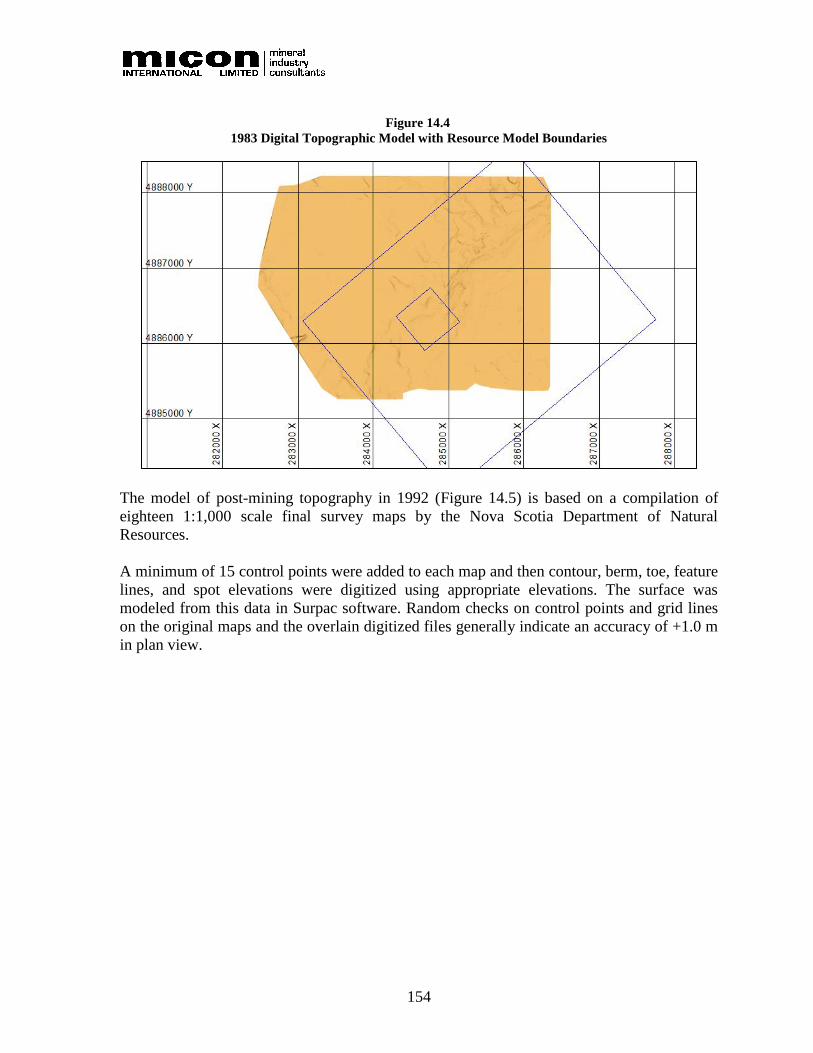
154
Figure 14.4
1983 Digital Topographic Model with Resource Model Boundaries
The model of post-mining topography in 1992 (Figure 14.5) is based on a compilation of
eighteen 1:1,000 scale final survey maps by the Nova Scotia Department of Natural
Resources.
A minimum of 15 control points were added to each map and then contour, berm, toe, feature
lines, and spot elevations were digitized using appropriate elevations. The surface was
modeled from this data in Surpac software. Random checks on control points and grid lines
on the original maps and the overlain digitized files generally indicate an accuracy of +1.0 m
in plan view.

155
Figure 14.5
1992 Digital Topographic Model with Resource Model Boundaries
14.5 SUBDIVISION OF ZONES IN THE DEPOSIT
Whereas the tin-mineralized granite body is continuous along strike, the historic mine
operated in two pits, namely the Main and the Baby pits (Figure 14.6). They are located in
the northeastern part of the known occurrence of the granite body (Figure 14.7). For these
two areas, hereafter referred to as the Main Zone and the Baby Zone, the drilling coverage is
considerably more systematic and closely spaced than outside them and the drill spacing is
significantly closer in the Baby Zone than in the Main Zone (Figure 14.7). These two zones
were thus used as a subdivision for all data for the purpose of this resource estimate. A third
zone, which has been explored historically and by Avalon, the Duck Pond Zone, is not part
of the current resource estimate.
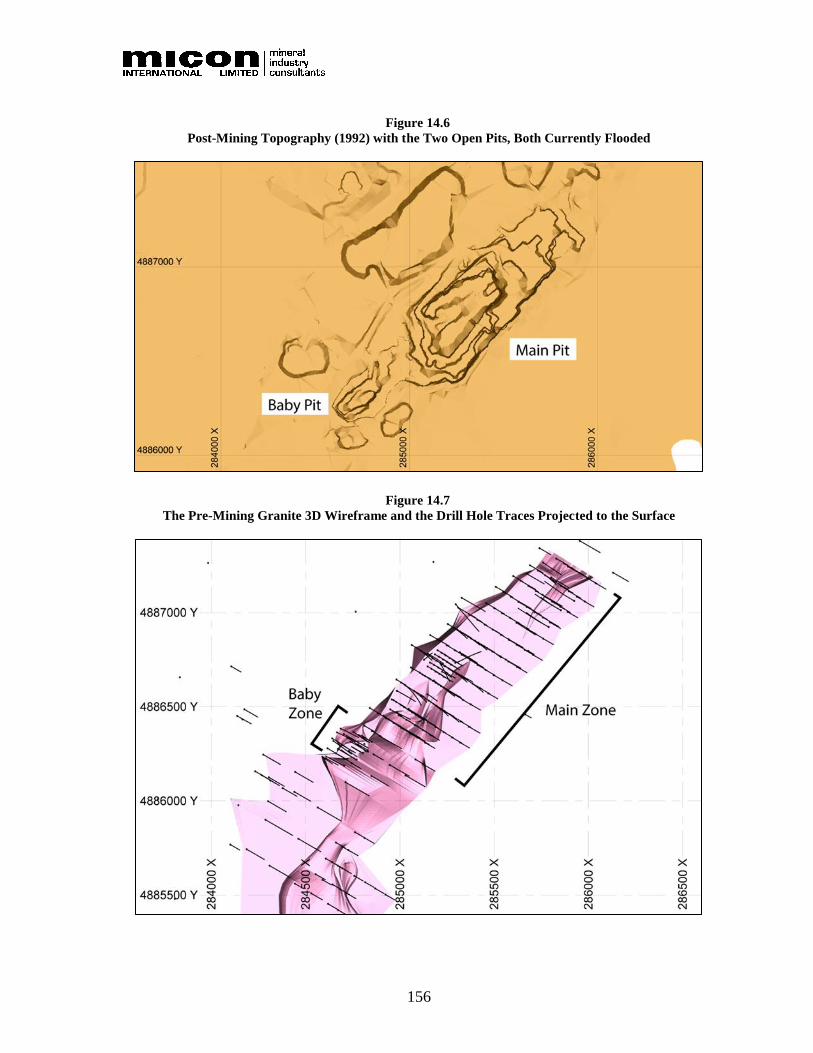
156
Figure 14.6
Post-Mining Topography (1992) with the Two Open Pits, Both Currently Flooded
Figure 14.7
The Pre-Mining Granite 3D Wireframe and the Drill Hole Traces Projected to the Surface

157
14.6 ROCK DENSITY
Wardrop (2010) reported a density of 2.737 ± 0.101 t/m3 (1σ, N = 1,107) for the granite in
the Main Zone, a density of granite in the Baby Zone of 2.747 ± 0.096 t/m3 (N = 83) and a
density of the metasediment of 2.699 ± 0.034 t/m3 (N = 7). Rio Algom's 1983, feasibility
study reported a density of the run-of-mine mill feed of 2.75 t/m3. The feasibility study also
reports additional density data with an average of 2.79 ± 0.08 t/m3 (N = 70, mineralized BQ
core). The 2014 resource estimate prepared by B. Webb used a median granite density of
2.78 t/m3 for all mineralized material (N=184, using only Avalon's 2014 data). (ref. Avalon
News Release 14-13, October 31, 2014).
The density estimates for the present resource calculation uses a filtered subset (1,996 values)
of all available data (N = 2,954) from Avalon's Datashed database, including the
measurements of Wardop (2009) on historic core and those on Avalon's 2014 and 2015
diamond drill holes. Following a detailed inspection of the full database, the density data for
holes EKAV-15-008, EKAV-15-009, EKAV-15-016, EKAV-15-017, EKAV-15-018,
DPAV-021 to DPAV -024, and EKAV-15-025 to EKAV-15-029 were removed from the
data set, because they contain unreasonably high densities which are not explained by any
geological observations noted in the drill logs. This suggests a series of methodically flawed
measurements; it is recommended that the density measurements for these holes are verified
and/or re-acquired. This filtering removes most of the data for the Duck Pond area, which is
not part of the present resource estimate. A further five outliers with densities of 1.68, 1.97,
3.31, 3.37 and 3.45 t/m3 were removed from the data set for the Main Zone granite because
they fell outside of the main data population.
As the 3D-coverage is insufficient for an interpolation of the density, the current resource
estimate uses mean values. Separate density values for the granite in the Main and Baby
Zones were calculated in accordance with reported petrological differences between the two
granites (Figure 14.8, Table 14.4). Although their density ranges overlap within the standard
deviations, the granite in the Main Zone (2.728 t/m3) is slightly lighter than that in the Baby
Zone (2.784 t/m3, Table 14.16). These values are comparable to those reported historically
for the mineralized granite (2.75-2.79 t/m3; Rio Algom, 1983). In the Main Zone, only a
small group of very high-grade samples displays a correlation with Sn grade. In the Baby
Zone, a weak correlation between density and Sn grade and stronger correlations with Zn and
Cu were observed. The Contact Zone lithology of the Baby Zone (not assigned for the
resource estimate) has an average density of 2.815 t/m3, possibly owing to the presence of
tourmaline.
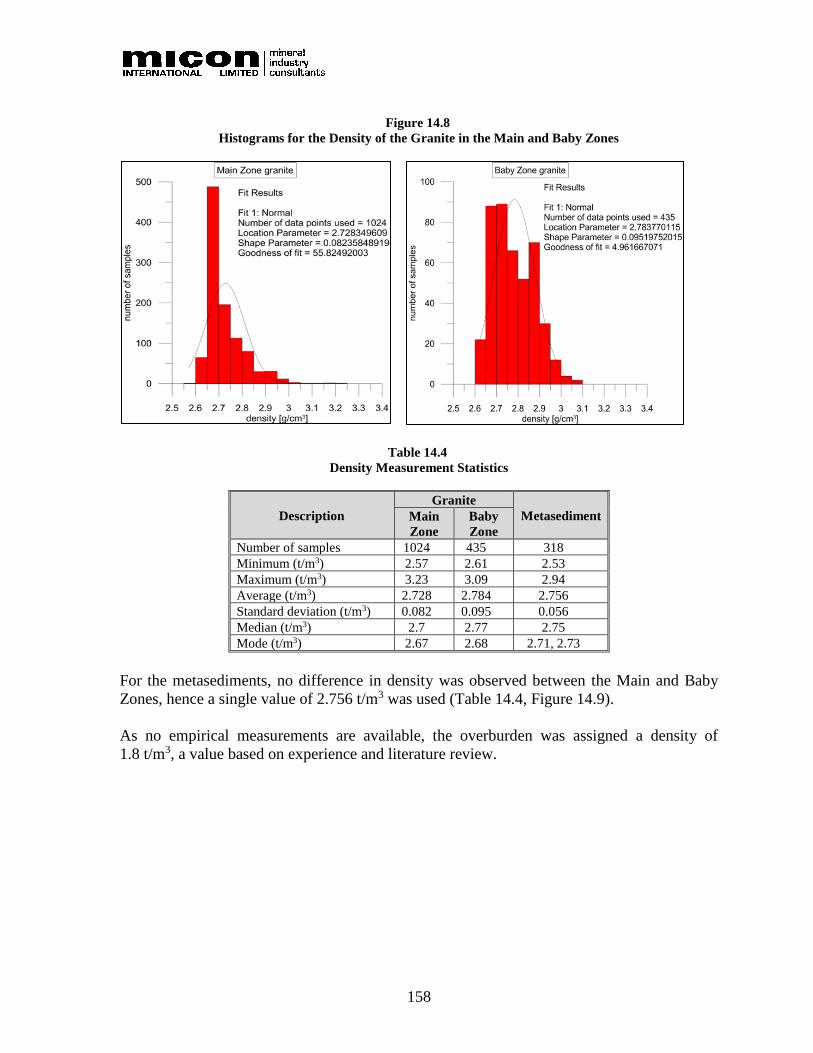
158
Figure 14.8
Histograms for the Density of the Granite in the Main and Baby Zones
Table 14.4
Density Measurement Statistics
Description
Granite
Metasediment Main
Zone
Baby
Zone
Number of samples 1024 435 318
Minimum (t/m3) 2.57 2.61 2.53
Maximum (t/m3) 3.23 3.09 2.94
Average (t/m3) 2.728 2.784 2.756
Standard deviation (t/m3) 0.082 0.095 0.056
Median (t/m3) 2.7 2.77 2.75
Mode (t/m3) 2.67 2.68 2.71, 2.73
For the metasediments, no difference in density was observed between the Main and Baby
Zones, hence a single value of 2.756 t/m3 was used (Table 14.4, Figure 14.9).
As no empirical measurements are available, the overburden was assigned a density of
1.8 t/m3, a value based on experience and literature review.
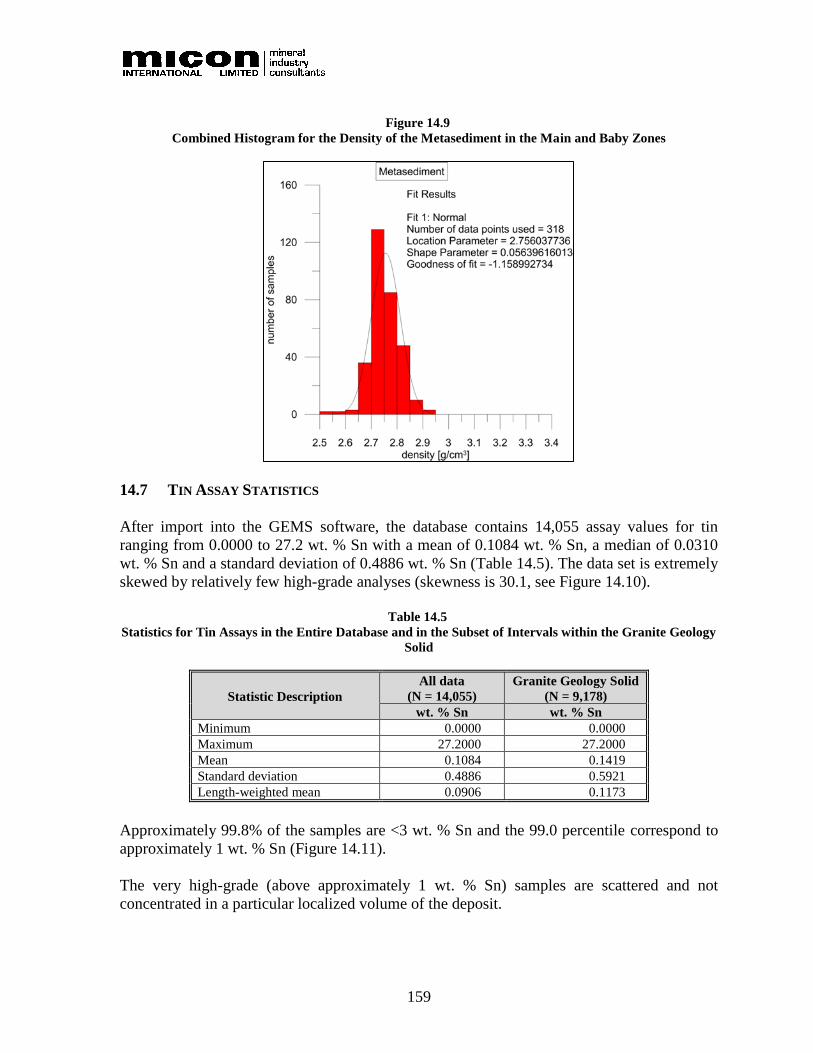
159
Figure 14.9
Combined Histogram for the Density of the Metasediment in the Main and Baby Zones
14.7 TIN ASSAY STATISTICS
After import into the GEMS software, the database contains 14,055 assay values for tin
ranging from 0.0000 to 27.2 wt. % Sn with a mean of 0.1084 wt. % Sn, a median of 0.0310
wt. % Sn and a standard deviation of 0.4886 wt. % Sn (Table 14.5). The data set is extremely
skewed by relatively few high-grade analyses (skewness is 30.1, see Figure 14.10).
Table 14.5
Statistics for Tin Assays in the Entire Database and in the Subset of Intervals within the Granite Geology
Solid
Statistic Description
All data
(N = 14,055)
Granite Geology Solid
(N = 9,178)
wt. % Sn wt. % Sn
Minimum 0.0000 0.0000
Maximum 27.2000 27.2000
Mean 0.1084 0.1419
Standard deviation 0.4886 0.5921
Length-weighted mean 0.0906 0.1173
Approximately 99.8% of the samples are <3 wt. % Sn and the 99.0 percentile correspond to
approximately 1 wt. % Sn (Figure 14.11).
The very high-grade (above approximately 1 wt. % Sn) samples are scattered and not
concentrated in a particular localized volume of the deposit.
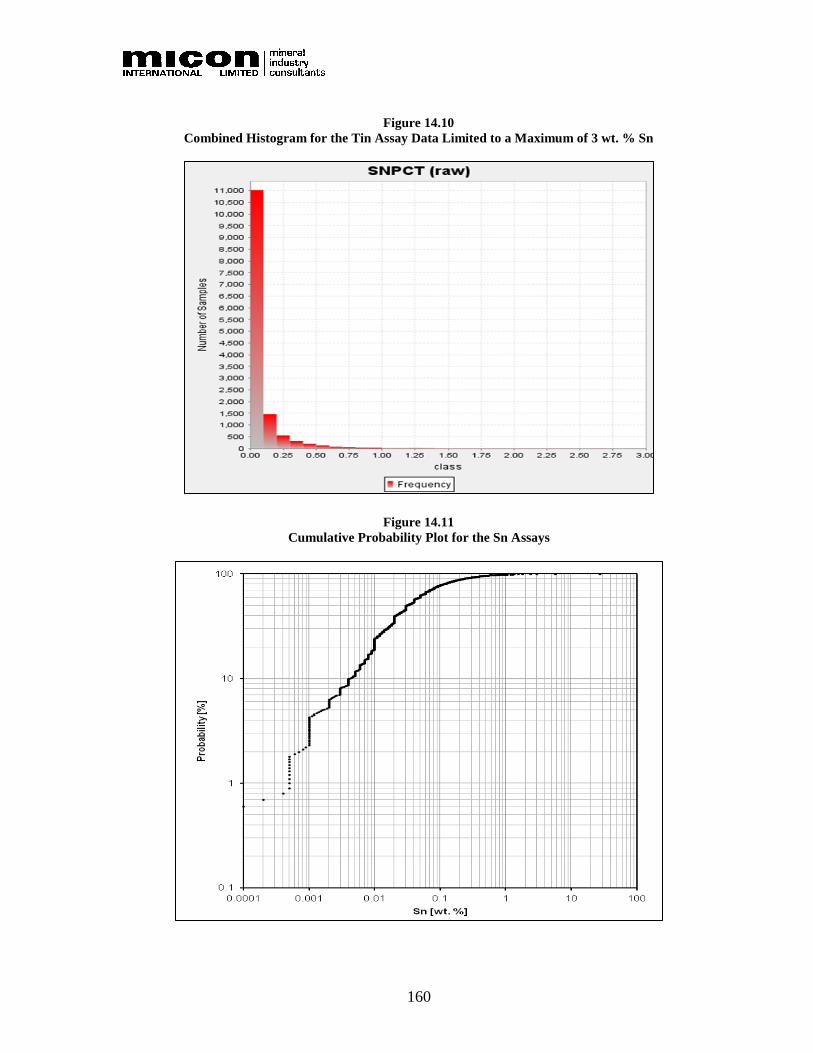
160
Figure 14.10
Combined Histogram for the Tin Assay Data Limited to a Maximum of 3 wt. % Sn
Figure 14.11
Cumulative Probability Plot for the Sn Assays
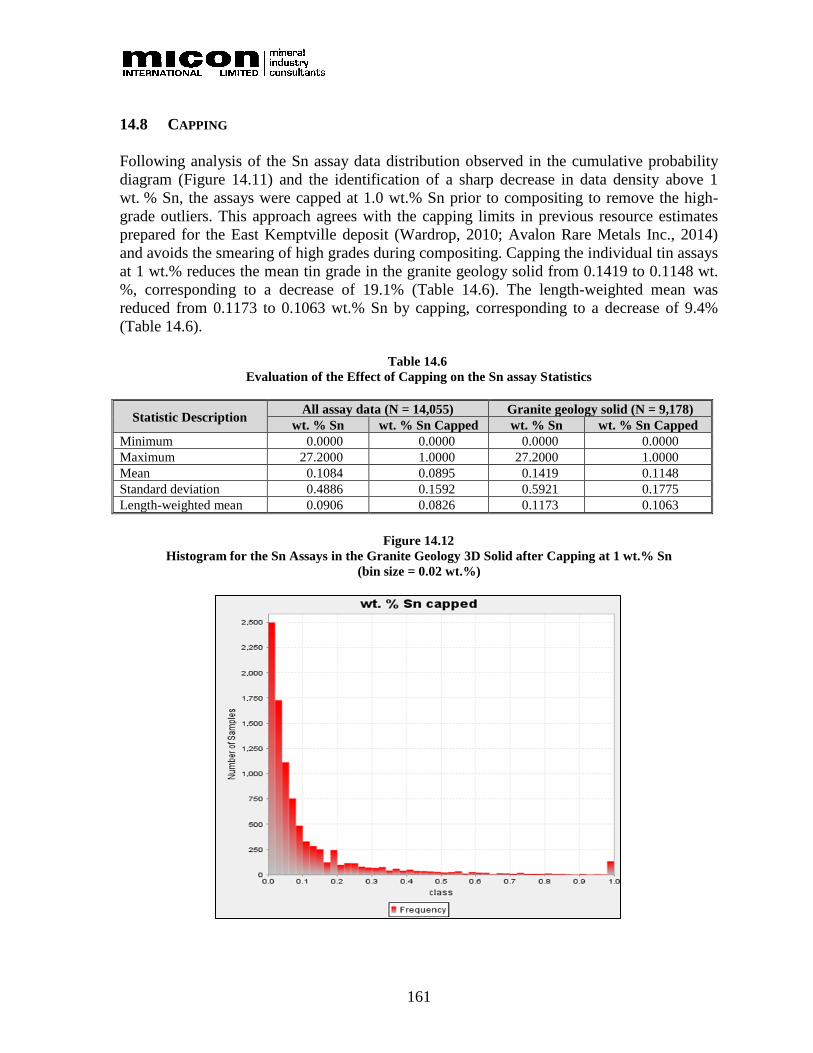
161
14.8 CAPPING
Following analysis of the Sn assay data distribution observed in the cumulative probability
diagram (Figure 14.11) and the identification of a sharp decrease in data density above 1
wt. % Sn, the assays were capped at 1.0 wt.% Sn prior to compositing to remove the high-
grade outliers. This approach agrees with the capping limits in previous resource estimates
prepared for the East Kemptville deposit (Wardrop, 2010; Avalon Rare Metals Inc., 2014)
and avoids the smearing of high grades during compositing. Capping the individual tin assays
at 1 wt.% reduces the mean tin grade in the granite geology solid from 0.1419 to 0.1148 wt.
%, corresponding to a decrease of 19.1% (Table 14.6). The length-weighted mean was
reduced from 0.1173 to 0.1063 wt.% Sn by capping, corresponding to a decrease of 9.4%
(Table 14.6).
Table 14.6
Evaluation of the Effect of Capping on the Sn assay Statistics
Statistic Description All assay data (N = 14,055) Granite geology solid (N = 9,178)
wt. % Sn wt. % Sn Capped wt. % Sn wt. % Sn Capped
Minimum 0.0000 0.0000 0.0000 0.0000
Maximum 27.2000 1.0000 27.2000 1.0000
Mean 0.1084 0.0895 0.1419 0.1148
Standard deviation 0.4886 0.1592 0.5921 0.1775
Length-weighted mean 0.0906 0.0826 0.1173 0.1063
Figure 14.12
Histogram for the Sn Assays in the Granite Geology 3D Solid after Capping at 1 wt.% Sn
(bin size = 0.02 wt.%)
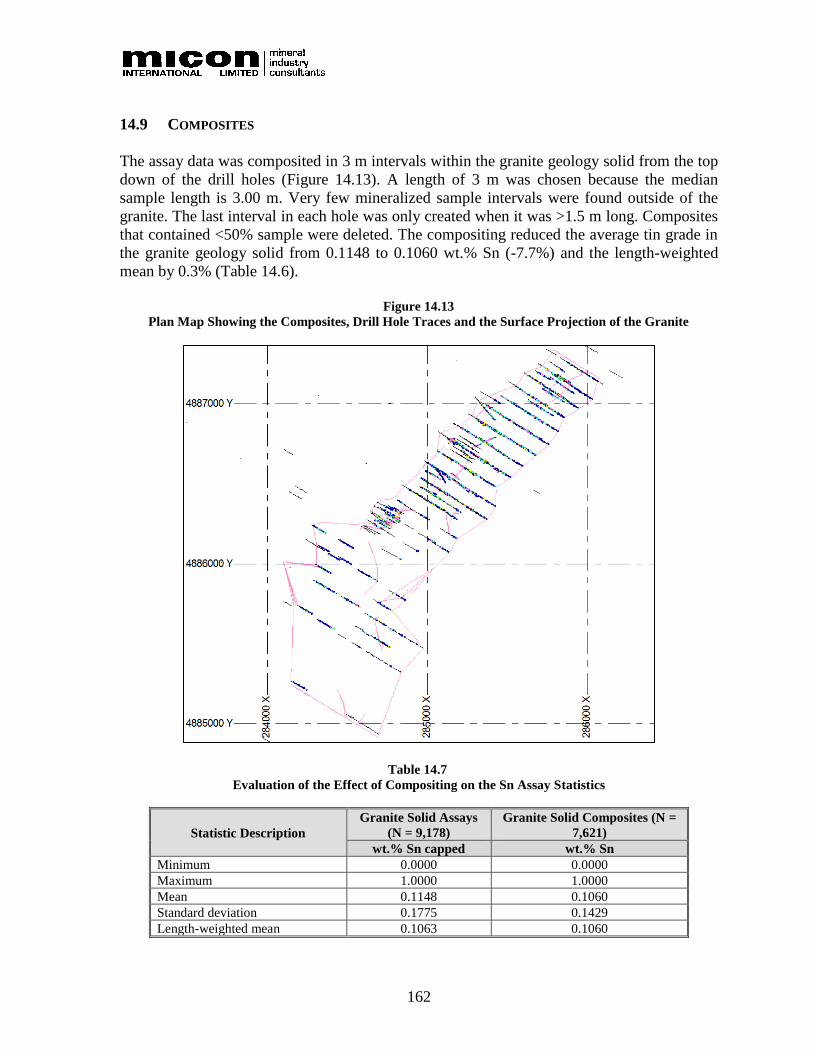
162
14.9 COMPOSITES
The assay data was composited in 3 m intervals within the granite geology solid from the top
down of the drill holes (Figure 14.13). A length of 3 m was chosen because the median
sample length is 3.00 m. Very few mineralized sample intervals were found outside of the
granite. The last interval in each hole was only created when it was >1.5 m long. Composites
that contained <50% sample were deleted. The compositing reduced the average tin grade in
the granite geology solid from 0.1148 to 0.1060 wt.% Sn (-7.7%) and the length-weighted
mean by 0.3% (Table 14.6).
Figure 14.13
Plan Map Showing the Composites, Drill Hole Traces and the Surface Projection of the Granite
Table 14.7
Evaluation of the Effect of Compositing on the Sn Assay Statistics
Statistic Description
Granite Solid Assays
(N = 9,178)
Granite Solid Composites (N =
7,621)
wt.% Sn capped wt.% Sn
Minimum 0.0000 0.0000
Maximum 1.0000 1.0000
Mean 0.1148 0.1060
Standard deviation 0.1775 0.1429
Length-weighted mean 0.1063 0.1060

163
For the resource estimation, the composites were subdivided spatially into subsets, resulting
in a count of 4,277 composites from 193 drill holes for the Main Zone and 762 composites
from 24 drill holes for the Baby Zone, allowing some composites to be used for the
estimation of both zones. These composites were extracted from a total of 194 drill holes
totalling 21,456 m drilled between 1979 and 1991 by previous operators and 23 holes
totalling 4,190 m drilled by Avalon in 2014.
14.10 TIN GRADE VARIOGRAPHY
The variography for the tin grades was performed on separate subsets of the tin composites
for the Main Zone and the Baby Zone. Separate variograms were modeled because the
average sample spacing in the Baby Zone (approximately 22 m) is much closer than that in
the Main Zone (approximately 65 m). The downhole semi-variogram for the tin composites
in the Main Zone, constructed with a lag distance of 3 m, indicates a range of 18 m and a
nugget of 0.35 (Figure 14.14).
Figure 14.14
Linear Downhole Semi-Variogram for the Tin Composites (Main Zone)
The 3D semi-variograms for the Main Zone were constructed using a lag distance of 100 m
and the downhole nugget value was used to model the variograms. The directions of lowest
variance, maximum range and highest number of pairs were found to be 55° azimuth / 0° dip
with a range of ~315 m (major axis), -90° dip with a range of ~86 m (semi-major axis) and
325° azimuth / 0° dip for which the range of 18 m from the linear downhole semi-variogram
was used (minor axis, Figure 14.15). The major (55° azimuth) and semi-major (-90° dip)
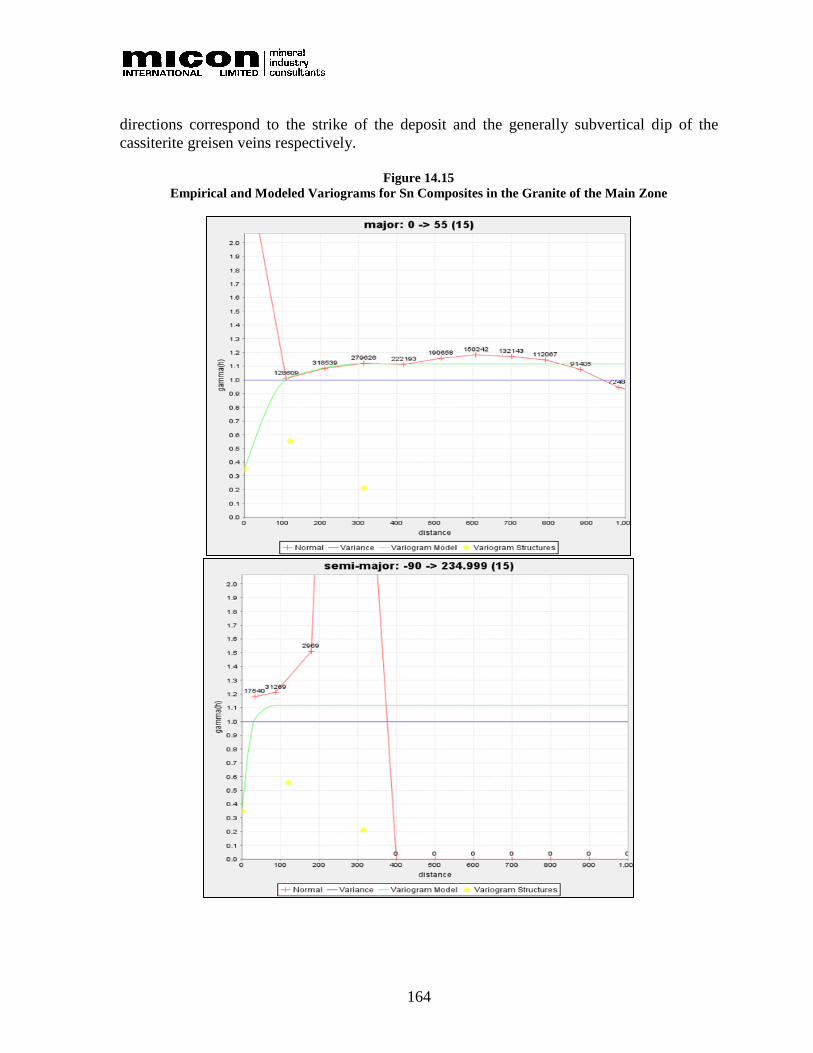
164
directions correspond to the strike of the deposit and the generally subvertical dip of the
cassiterite greisen veins respectively.
Figure 14.15
Empirical and Modeled Variograms for Sn Composites in the Granite of the Main Zone

165
For the Baby Zone, the downhole semi-variogram for the composites, constructed using a lag
of 3 m, indicates a range of 24 m and a nugget of 0.38 (Figure 14.16).
Figure 14.16
Linear Downhole Semi-Variogram for the Tin Composites in the Baby Zone

166
The 3D variography for the tin composites in the Baby Zone indicates that an ellipsoid with
the semi-variograms along 60° azimuth / 0° dip with a range of 95 m (major axis), 150°
azimuth / 75° dip with a range of 65 m (semi-major axis) and 150° azimuth / -15° dip with a
range of 25 m (minor axis) represent the tin grade continuity of the zone (Figure 14.17). The
variograms were calculated with a lag of 35 m and the downhole nugget of 0.38 was used to
model the variograms.
Figure 14.17
Empirical and Modeled Variograms for Sn Composites in the Granite of the Baby Zone

167
14.11 BLOCK MODEL AND GRADE ESTIMATION
Two separate block models were developed which accommodate the wide drill spacing of the
Main Zone and the greater detail of the drilling data for the Baby Zone (Figure 14.18).
Following the interpolations, the block models were re-blocked and merged into one 6 x 6 x
6 m model and provided to Micon for the purpose of developing of a combined mine design
and schedule. The resources are reported for the two separate block models for the Main and
Baby Zones.
14.11.1 Block Model Dimensions
For the Main Zone, a block size of 24 m x 24 m width and 12 m height was chosen to
accommodate the drill section spacing of ~100 m and the bench height of the historic mining
(12 m; Table 14.8). For the Baby Zone, a small block size of 6 m in all dimensions was
chosen which allows a high level of detail for the grade interpolation and rock code
assignment and is amenable to subsequent merging with the Main Zone block model. Both
block models were rotated 40° from east-west in GEMS (corresponding to a row alignment
along a 50° azimuth) approximately parallel to the strike direction of the granite. The origins
were chosen so that they coincide approximately with the existing bench levels and so that
the block models can be merged.

168
Figure 14.18
Plan of the two Main and Baby Zones Block Models
Note: Only blocks with the granite rock code are shown, the outline of the granite wireframe projected to
surface is shown for reference. The thin red lines are projections of the contacts.
Table 14.8
Main Zone and Baby Zone Block Model Dimensions
Description Main Zone Baby Zone
Block size (m)
Column 24 6
Row 24 6
Level 12 6
Origin (m)
X 285,000 284,689.33
Y 4,884,000 4,885,901.07
Z 154 124
Rotation angle 40° 40°
Number of blocks
Column 150 100
Row 125 100
Level 50 50

169
14.11.2 Block Model Parameters
The parameters, range of values and the methods for their assignment for both block models
are summarized in Table 14.9.
Table 14.9
Block Model Parameters
Parameter Type1 Description Values
Rock Type Integer Assigned from 3D geology solids and
topography based on a 50% threshold using
needling level 10 (100 needles per block)
vertically down levels.
0 = air
1 = Unknown (outside of geology
models)
2 = Metasediment
3 = Granite
5 = Overburden
Density Single Main Zone granite = 2.728
Baby Zone granite = 2.784
Metasediment = 2.756
Unknown = 2.756
Overburden = 1.8
SNPCT Single tin grade in percent, assigned by Kriging
Zone String based on geology and drilling coverage Main-NE = northeast granite
Baby = Baby Zone
Mined Integer mined out, = blocks with rock code 2 & 3
50% above the 1992 topography, using 10
needles vertically down
0 = not mined out
1 = mined out
% air Double percentage of block within air solid
% Granite Double percentage of block within granite geology
solid
% Metased Double percentage of block in metasediment geology
wireframes
% Overburden Double percentage of block within overburden solid
Pass Integer interpolation pass 1 = first interpolation pass
2 = second pass
3 = third pass
Blockvar Double block variance
Gr-cl-pt Double grade of closest point to block
Nearest Double actual distance to closest point to block
No-of-holes Integer number of holes used to interpolate block
No-of-points Integer number of points used to interpolate block
MII Integer resource category 1 = measured
2 = indicated
3 = inferred
Krig-Var Double Kriging variance 1Integer = whole number without decimals, Single, Double = high-precision numbers with decimals.
14.12 TIN GRADE ESTIMATION METHODOLOGY
The tin grade of all blocks containing >0% granite was interpolated using Ordinary Kriging
in the Geovia GEMS 6.8.1 software (Dassault Systems). Separate search ellipses and
variograms based on the variography were used for the Main Zone and Baby Zone. The tin
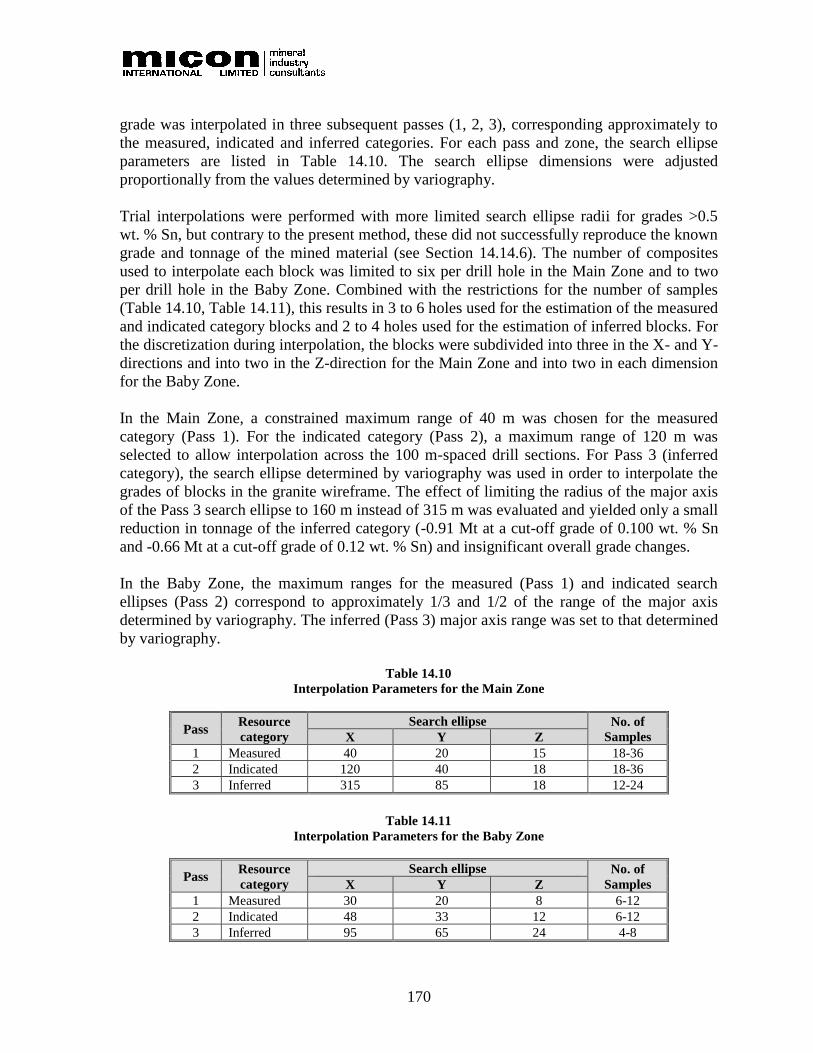
170
grade was interpolated in three subsequent passes (1, 2, 3), corresponding approximately to
the measured, indicated and inferred categories. For each pass and zone, the search ellipse
parameters are listed in Table 14.10. The search ellipse dimensions were adjusted
proportionally from the values determined by variography.
Trial interpolations were performed with more limited search ellipse radii for grades >0.5
wt. % Sn, but contrary to the present method, these did not successfully reproduce the known
grade and tonnage of the mined material (see Section 14.14.6). The number of composites
used to interpolate each block was limited to six per drill hole in the Main Zone and to two
per drill hole in the Baby Zone. Combined with the restrictions for the number of samples
(Table 14.10, Table 14.11), this results in 3 to 6 holes used for the estimation of the measured
and indicated category blocks and 2 to 4 holes used for the estimation of inferred blocks. For
the discretization during interpolation, the blocks were subdivided into three in the X- and Y-
directions and into two in the Z-direction for the Main Zone and into two in each dimension
for the Baby Zone.
In the Main Zone, a constrained maximum range of 40 m was chosen for the measured
category (Pass 1). For the indicated category (Pass 2), a maximum range of 120 m was
selected to allow interpolation across the 100 m-spaced drill sections. For Pass 3 (inferred
category), the search ellipse determined by variography was used in order to interpolate the
grades of blocks in the granite wireframe. The effect of limiting the radius of the major axis
of the Pass 3 search ellipse to 160 m instead of 315 m was evaluated and yielded only a small
reduction in tonnage of the inferred category (-0.91 Mt at a cut-off grade of 0.100 wt. % Sn
and -0.66 Mt at a cut-off grade of 0.12 wt. % Sn) and insignificant overall grade changes.
In the Baby Zone, the maximum ranges for the measured (Pass 1) and indicated search
ellipses (Pass 2) correspond to approximately 1/3 and 1/2 of the range of the major axis
determined by variography. The inferred (Pass 3) major axis range was set to that determined
by variography.
Table 14.10
Interpolation Parameters for the Main Zone
Pass Resource
category
Search ellipse No. of
Samples X Y Z
1 Measured 40 20 15 18-36
2 Indicated 120 40 18 18-36
3 Inferred 315 85 18 12-24
Table 14.11
Interpolation Parameters for the Baby Zone
Pass Resource
category
Search ellipse No. of
Samples X Y Z
1 Measured 30 20 8 6-12
2 Indicated 48 33 12 6-12
3 Inferred 95 65 24 4-8
171
14.13 RESOURCE CLASSIFICATION
The East Kemptville mineral resource was classified based on the Passes from the Kriging
interpolation (Table 14.10, Table 14.11 above) which correspond to search ellipses, in
combination with the requirement that measured and indicated resources are characterized by
geological continuity that is well-constrained by drilling in three dimensions. At least three
drill holes were used to estimate measured and indicated blocks. In some cases, Pass 2 or 3
blocks were included in zones classified as measured or indicated where they were
surrounded by Pass 1 or 2 blocks, geological continuity was indicated and sufficiently spaced
drill holes were present. In addition to geological observations and the variography, the
rationale for classifying blocks as indicated resources in the Main Zone using a search ellipse
measuring 120 x 40 x 18 m is that the previous mining has demonstrated that the deposit is
continuous along strike at a ~50° azimuth across the ~100 m drill sections.
14.14 BLOCK MODEL VALIDATION
The block model was validated in cross-sections and plan maps, by comparing the block
model volumes to the wireframes, and by comparing the block model grades to the assays,
composites and other methods of grade interpolation.
14.14.1 Validation of the Volume Assignment
A comparison of the pre-mining volume of the granite 3D wireframe (134,364,183 m3) to the
blocks assigned >50% granite percentage (19,326 blocks ≙ 133,581,312 m3) in the 24 x 24 x
12 m block model that covers the Main Zone shows that the blocking resulted in a -0.6%
volume loss. The rock percentage, forming the basis of the tonnage calculation, was thus
correctly assigned from the 3D wireframe.
14.14.2 Validation in Cross-Sections and Level Plans
For the Main Zone, representative level plans (Figure 14.19 to Figure 14.21) and cross-
sections (Figure 14.22 to Figure 14.27) were prepared which show the results of the Kriging
grade interpolation and the grade of the drill hole composites. The effect of the shape of the
search ellipse is clearly visible in the plan views (Figure 14.19 to Figure 14.21). The cross-
sections indicate that the interpolated grades are consistent with those of the composites
(Figure 14.22 to Figure 14.27).
Figure 14.19 details the Main Zone, Level 6 plan view showing tin grade in wt. % of in situ
blocks and drill hole composites. The outline of the historic pit is visible a white area of
mined out blocks.
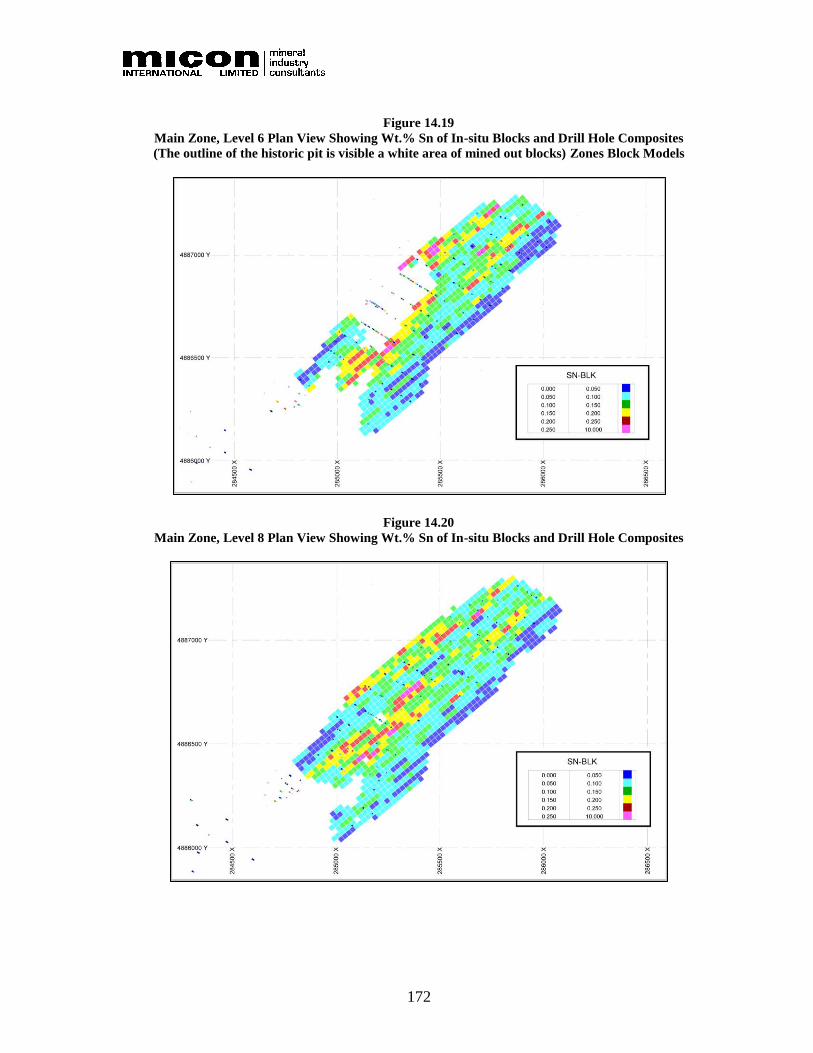
172
Figure 14.19
Main Zone, Level 6 Plan View Showing Wt.% Sn of In-situ Blocks and Drill Hole Composites
(The outline of the historic pit is visible a white area of mined out blocks) Zones Block Models
Figure 14.20
Main Zone, Level 8 Plan View Showing Wt.% Sn of In-situ Blocks and Drill Hole Composites
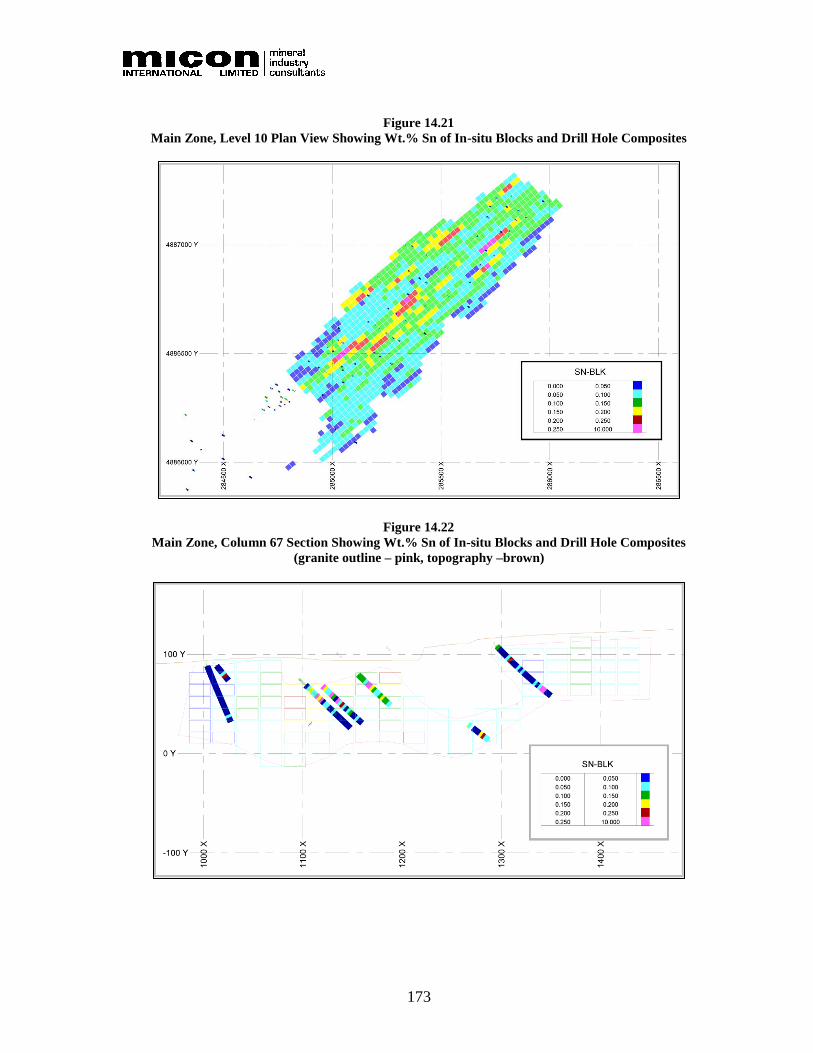
173
Figure 14.21
Main Zone, Level 10 Plan View Showing Wt.% Sn of In-situ Blocks and Drill Hole Composites
Figure 14.22
Main Zone, Column 67 Section Showing Wt.% Sn of In-situ Blocks and Drill Hole Composites
(granite outline – pink, topography –brown)

174
Figure 14.23
Main Zone, Column 74 Section Showing Wt.% Sn of In-situ Blocks and Drill Hole Composites
(granite outline – pink, topography –brown)
Figure 14.24
Main Zone, Column 92 Section Showing Wt.% Sn of In-situ Blocks and Drill Hole Composites
(granite outline – pink, topography –brown)
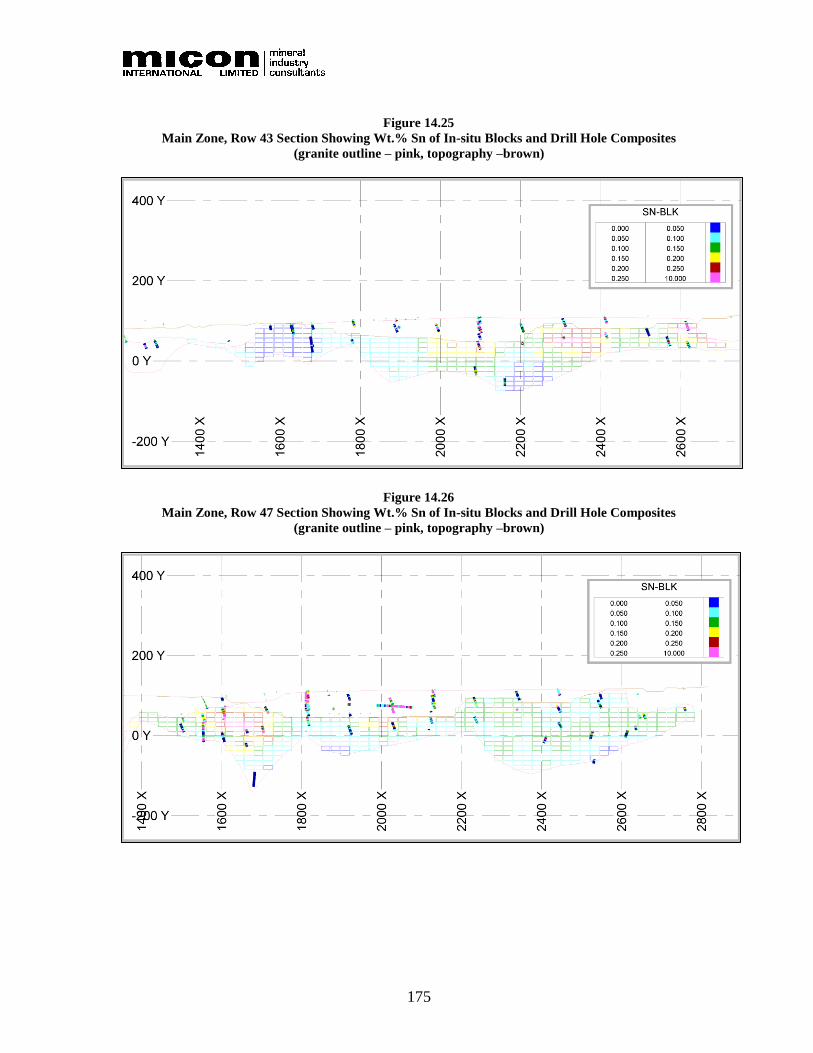
175
Figure 14.25
Main Zone, Row 43 Section Showing Wt.% Sn of In-situ Blocks and Drill Hole Composites
(granite outline – pink, topography –brown)
Figure 14.26
Main Zone, Row 47 Section Showing Wt.% Sn of In-situ Blocks and Drill Hole Composites
(granite outline – pink, topography –brown)
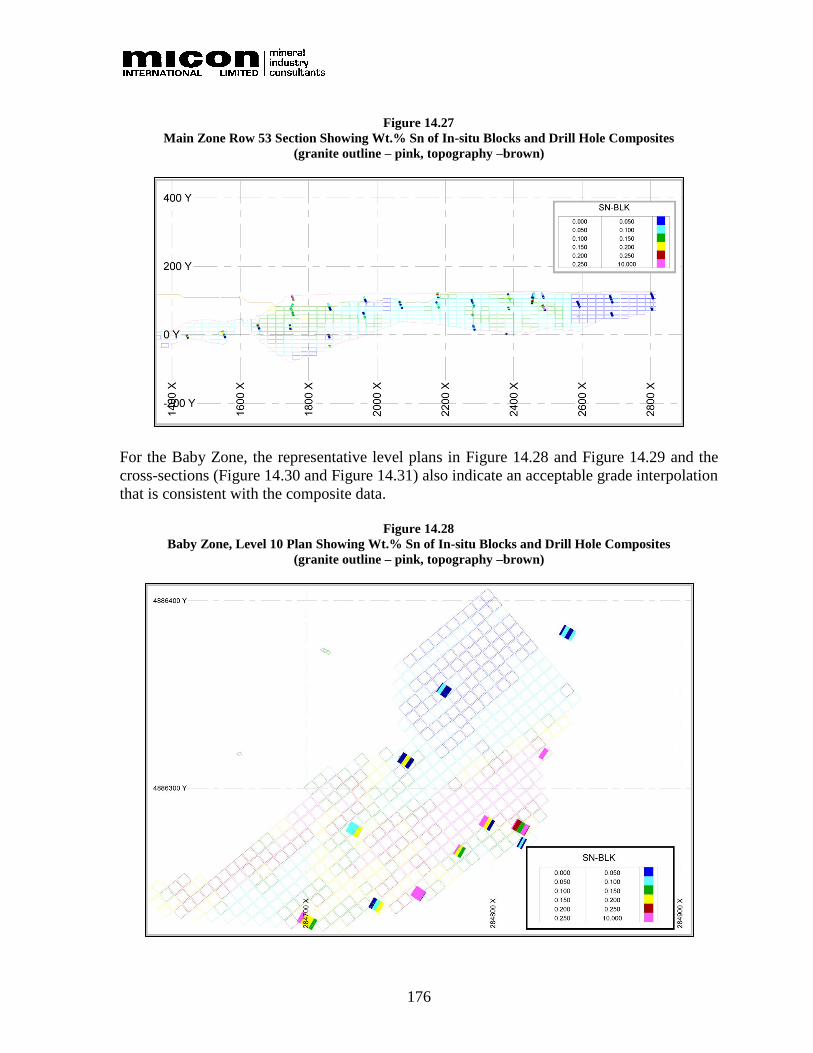
176
Figure 14.27
Main Zone Row 53 Section Showing Wt.% Sn of In-situ Blocks and Drill Hole Composites
(granite outline – pink, topography –brown)
For the Baby Zone, the representative level plans in Figure 14.28 and Figure 14.29 and the
cross-sections (Figure 14.30 and Figure 14.31) also indicate an acceptable grade interpolation
that is consistent with the composite data.
Figure 14.28
Baby Zone, Level 10 Plan Showing Wt.% Sn of In-situ Blocks and Drill Hole Composites
(granite outline – pink, topography –brown)
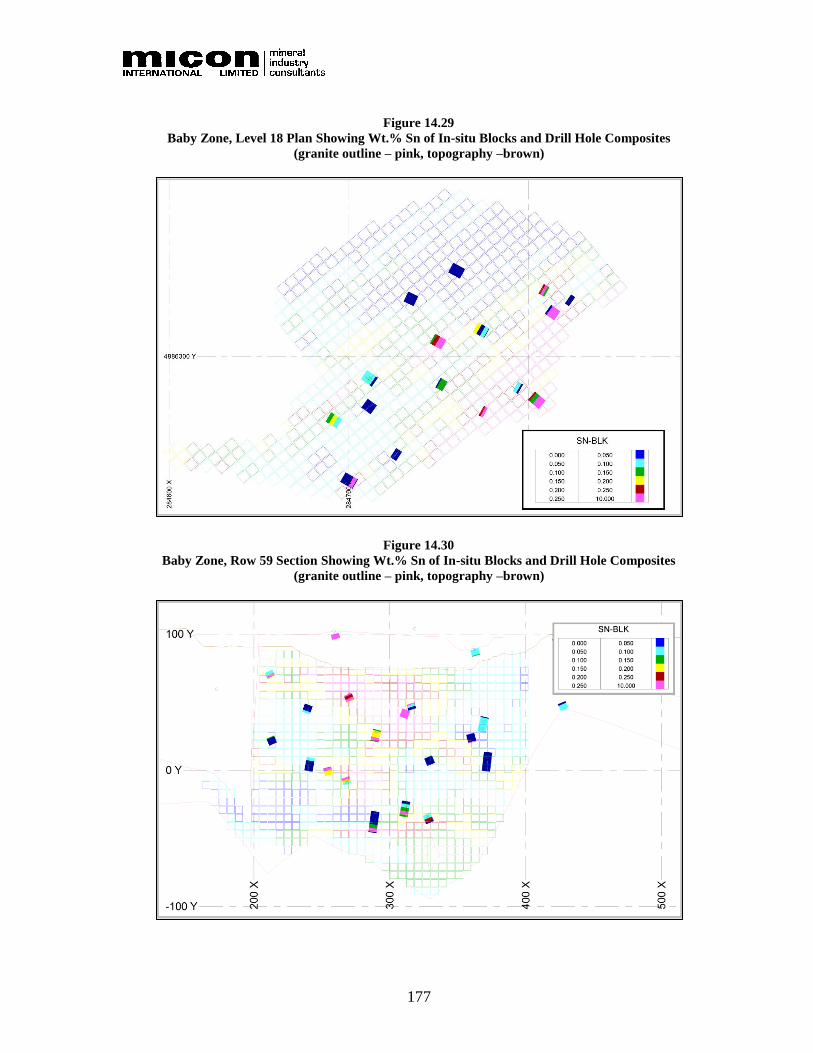
177
Figure 14.29
Baby Zone, Level 18 Plan Showing Wt.% Sn of In-situ Blocks and Drill Hole Composites
(granite outline – pink, topography –brown)
Figure 14.30
Baby Zone, Row 59 Section Showing Wt.% Sn of In-situ Blocks and Drill Hole Composites
(granite outline – pink, topography –brown)
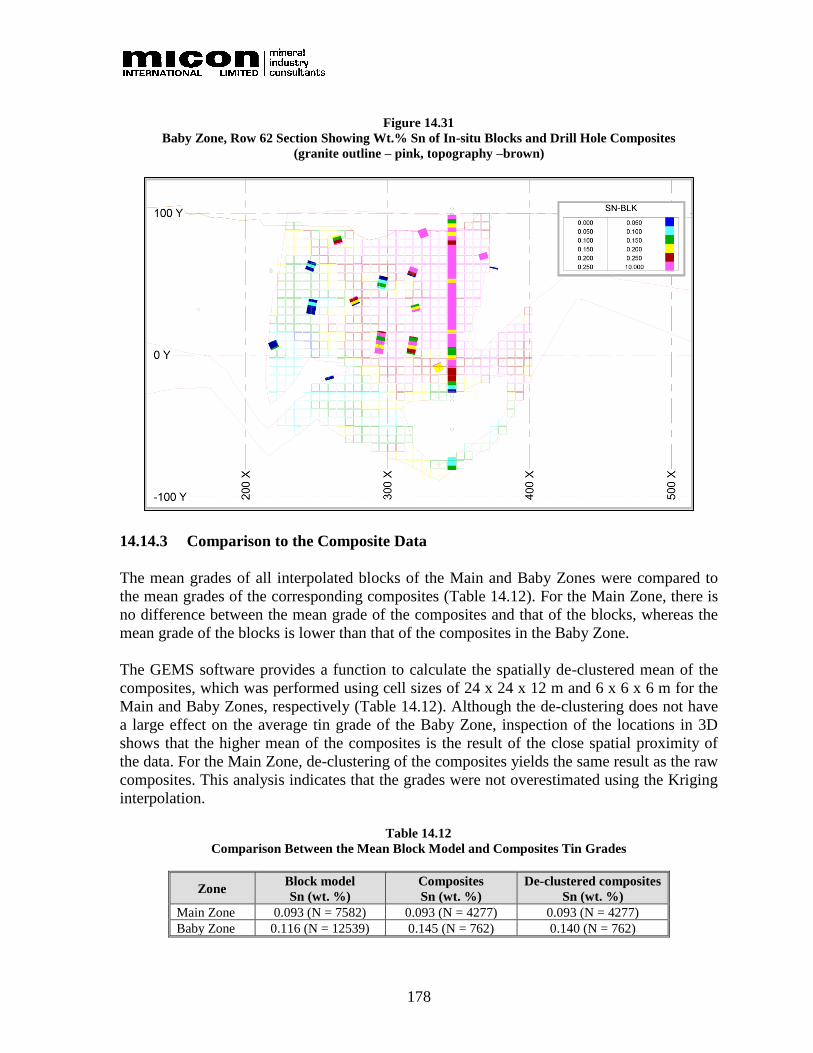
178
Figure 14.31
Baby Zone, Row 62 Section Showing Wt.% Sn of In-situ Blocks and Drill Hole Composites
(granite outline – pink, topography –brown)
14.14.3 Comparison to the Composite Data
The mean grades of all interpolated blocks of the Main and Baby Zones were compared to
the mean grades of the corresponding composites (Table 14.12). For the Main Zone, there is
no difference between the mean grade of the composites and that of the blocks, whereas the
mean grade of the blocks is lower than that of the composites in the Baby Zone.
The GEMS software provides a function to calculate the spatially de-clustered mean of the
composites, which was performed using cell sizes of 24 x 24 x 12 m and 6 x 6 x 6 m for the
Main and Baby Zones, respectively (Table 14.12). Although the de-clustering does not have
a large effect on the average tin grade of the Baby Zone, inspection of the locations in 3D
shows that the higher mean of the composites is the result of the close spatial proximity of
the data. For the Main Zone, de-clustering of the composites yields the same result as the raw
composites. This analysis indicates that the grades were not overestimated using the Kriging
interpolation.
Table 14.12
Comparison Between the Mean Block Model and Composites Tin Grades
Zone Block model
Sn (wt. %)
Composites
Sn (wt. %)
De-clustered composites
Sn (wt. %)
Main Zone 0.093 (N = 7582) 0.093 (N = 4277) 0.093 (N = 4277)
Baby Zone 0.116 (N = 12539) 0.145 (N = 762) 0.140 (N = 762)
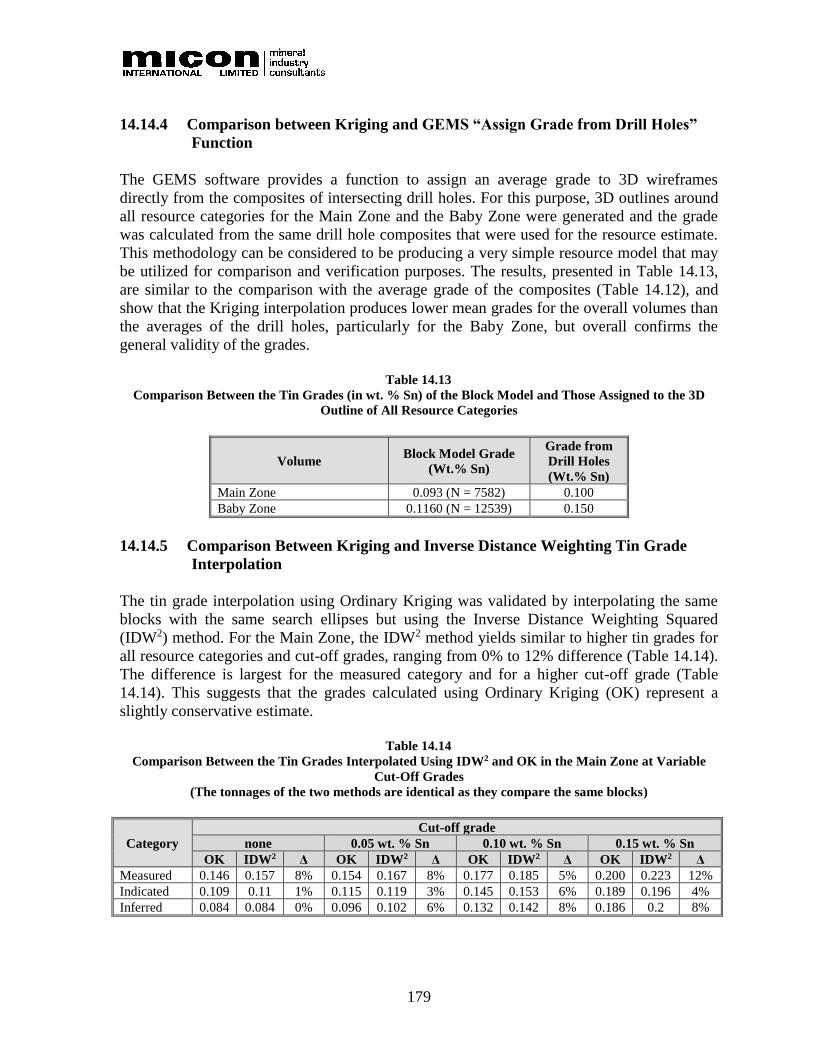
179
14.14.4 Comparison between Kriging and GEMS “Assign Grade from Drill Holes”
Function
The GEMS software provides a function to assign an average grade to 3D wireframes
directly from the composites of intersecting drill holes. For this purpose, 3D outlines around
all resource categories for the Main Zone and the Baby Zone were generated and the grade
was calculated from the same drill hole composites that were used for the resource estimate.
This methodology can be considered to be producing a very simple resource model that may
be utilized for comparison and verification purposes. The results, presented in Table 14.13,
are similar to the comparison with the average grade of the composites (Table 14.12), and
show that the Kriging interpolation produces lower mean grades for the overall volumes than
the averages of the drill holes, particularly for the Baby Zone, but overall confirms the
general validity of the grades.
Table 14.13
Comparison Between the Tin Grades (in wt. % Sn) of the Block Model and Those Assigned to the 3D
Outline of All Resource Categories
Volume Block Model Grade
(Wt.% Sn)
Grade from
Drill Holes
(Wt.% Sn)
Main Zone 0.093 (N = 7582) 0.100
Baby Zone 0.1160 (N = 12539) 0.150
14.14.5 Comparison Between Kriging and Inverse Distance Weighting Tin Grade
Interpolation
The tin grade interpolation using Ordinary Kriging was validated by interpolating the same
blocks with the same search ellipses but using the Inverse Distance Weighting Squared
(IDW2) method. For the Main Zone, the IDW2 method yields similar to higher tin grades for
all resource categories and cut-off grades, ranging from 0% to 12% difference (Table 14.14).
The difference is largest for the measured category and for a higher cut-off grade (Table
14.14). This suggests that the grades calculated using Ordinary Kriging (OK) represent a
slightly conservative estimate.
Table 14.14
Comparison Between the Tin Grades Interpolated Using IDW2 and OK in the Main Zone at Variable
Cut-Off Grades
(The tonnages of the two methods are identical as they compare the same blocks)
Category
Cut-off grade
none 0.05 wt. % Sn 0.10 wt. % Sn 0.15 wt. % Sn
OK IDW2 Δ OK IDW2 Δ OK IDW2 Δ OK IDW2 Δ
Measured 0.146 0.157 8% 0.154 0.167 8% 0.177 0.185 5% 0.200 0.223 12%
Indicated 0.109 0.11 1% 0.115 0.119 3% 0.145 0.153 6% 0.189 0.196 4%
Inferred 0.084 0.084 0% 0.096 0.102 6% 0.132 0.142 8% 0.186 0.2 8%
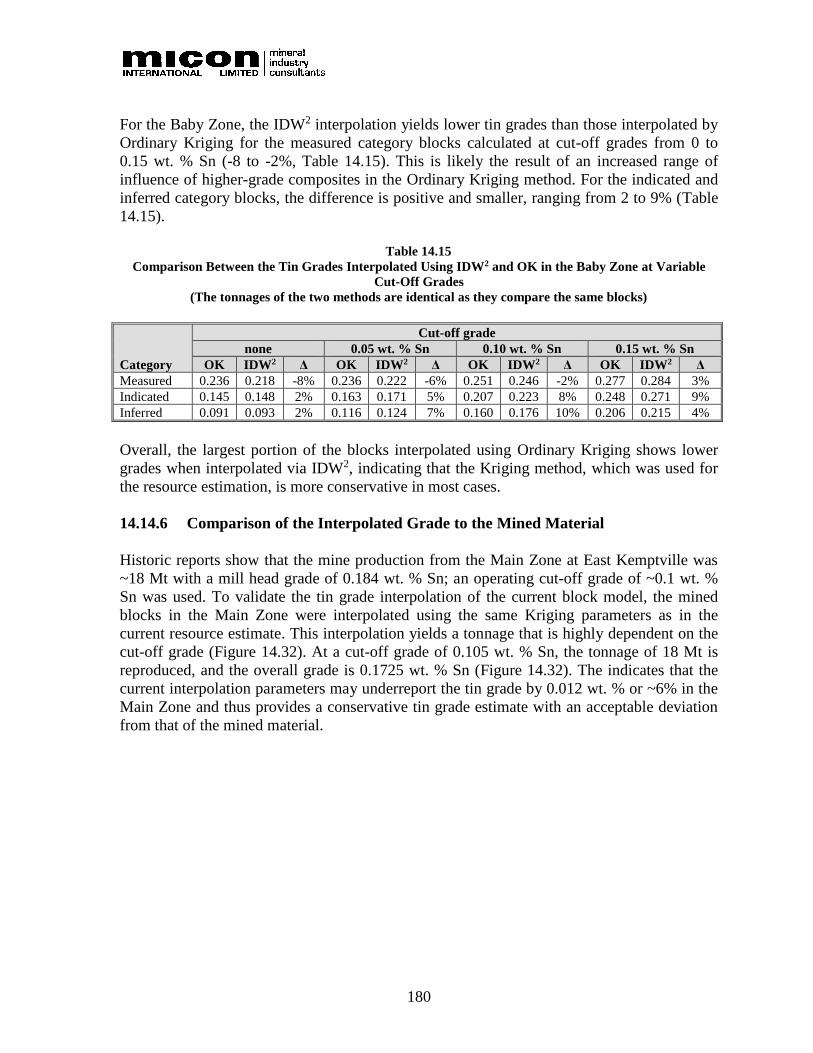
180
For the Baby Zone, the IDW2 interpolation yields lower tin grades than those interpolated by
Ordinary Kriging for the measured category blocks calculated at cut-off grades from 0 to
0.15 wt. % Sn (-8 to -2%, Table 14.15). This is likely the result of an increased range of
influence of higher-grade composites in the Ordinary Kriging method. For the indicated and
inferred category blocks, the difference is positive and smaller, ranging from 2 to 9% (Table
14.15).
Table 14.15
Comparison Between the Tin Grades Interpolated Using IDW2 and OK in the Baby Zone at Variable
Cut-Off Grades
(The tonnages of the two methods are identical as they compare the same blocks)
Category
Cut-off grade
none 0.05 wt. % Sn 0.10 wt. % Sn 0.15 wt. % Sn
OK IDW2 Δ OK IDW2 Δ OK IDW2 Δ OK IDW2 Δ
Measured 0.236 0.218 -8% 0.236 0.222 -6% 0.251 0.246 -2% 0.277 0.284 3%
Indicated 0.145 0.148 2% 0.163 0.171 5% 0.207 0.223 8% 0.248 0.271 9%
Inferred 0.091 0.093 2% 0.116 0.124 7% 0.160 0.176 10% 0.206 0.215 4%
Overall, the largest portion of the blocks interpolated using Ordinary Kriging shows lower
grades when interpolated via IDW2, indicating that the Kriging method, which was used for
the resource estimation, is more conservative in most cases.
14.14.6 Comparison of the Interpolated Grade to the Mined Material
Historic reports show that the mine production from the Main Zone at East Kemptville was
~18 Mt with a mill head grade of 0.184 wt. % Sn; an operating cut-off grade of ~0.1 wt. %
Sn was used. To validate the tin grade interpolation of the current block model, the mined
blocks in the Main Zone were interpolated using the same Kriging parameters as in the
current resource estimate. This interpolation yields a tonnage that is highly dependent on the
cut-off grade (Figure 14.32). At a cut-off grade of 0.105 wt. % Sn, the tonnage of 18 Mt is
reproduced, and the overall grade is 0.1725 wt. % Sn (Figure 14.32). The indicates that the
current interpolation parameters may underreport the tin grade by 0.012 wt. % or ~6% in the
Main Zone and thus provides a conservative tin grade estimate with an acceptable deviation
from that of the mined material.
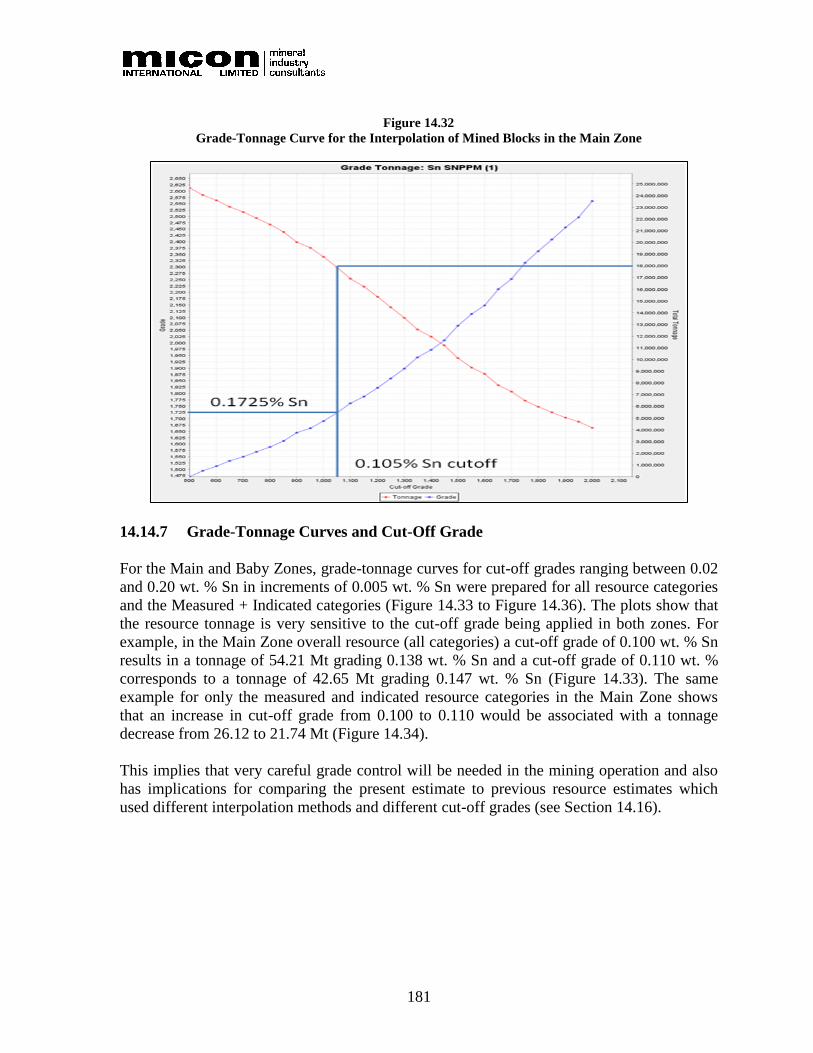
181
Figure 14.32
Grade-Tonnage Curve for the Interpolation of Mined Blocks in the Main Zone
14.14.7 Grade-Tonnage Curves and Cut-Off Grade
For the Main and Baby Zones, grade-tonnage curves for cut-off grades ranging between 0.02
and 0.20 wt. % Sn in increments of 0.005 wt. % Sn were prepared for all resource categories
and the Measured + Indicated categories (Figure 14.33 to Figure 14.36). The plots show that
the resource tonnage is very sensitive to the cut-off grade being applied in both zones. For
example, in the Main Zone overall resource (all categories) a cut-off grade of 0.100 wt. % Sn
results in a tonnage of 54.21 Mt grading 0.138 wt. % Sn and a cut-off grade of 0.110 wt. %
corresponds to a tonnage of 42.65 Mt grading 0.147 wt. % Sn (Figure 14.33). The same
example for only the measured and indicated resource categories in the Main Zone shows
that an increase in cut-off grade from 0.100 to 0.110 would be associated with a tonnage
decrease from 26.12 to 21.74 Mt (Figure 14.34).
This implies that very careful grade control will be needed in the mining operation and also
has implications for comparing the present estimate to previous resource estimates which
used different interpolation methods and different cut-off grades (see Section 14.16).
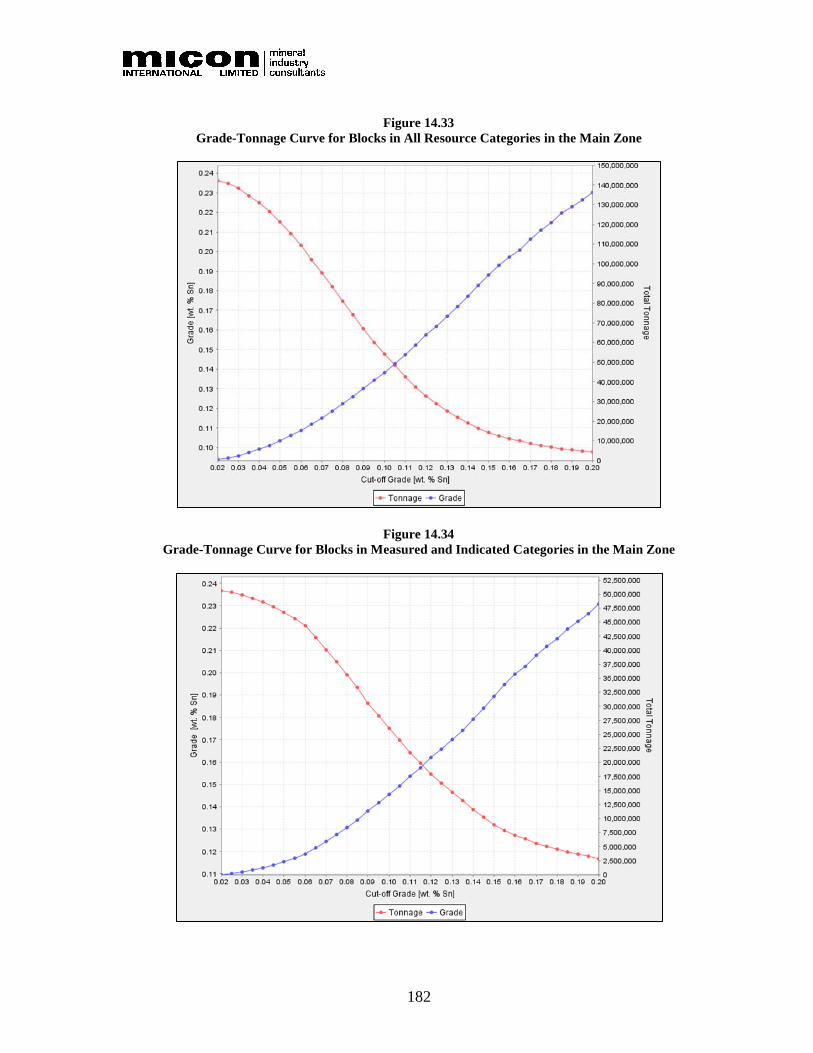
182
Figure 14.33
Grade-Tonnage Curve for Blocks in All Resource Categories in the Main Zone
Figure 14.34
Grade-Tonnage Curve for Blocks in Measured and Indicated Categories in the Main Zone

183
Figure 14.35
Grade-Tonnage Curve for Blocks in All Resource Categories in the Baby Zone
.
Figure 14.36
Grade-Tonnage Curve for Blocks in Measured and Indicated Categories in the Baby Zone
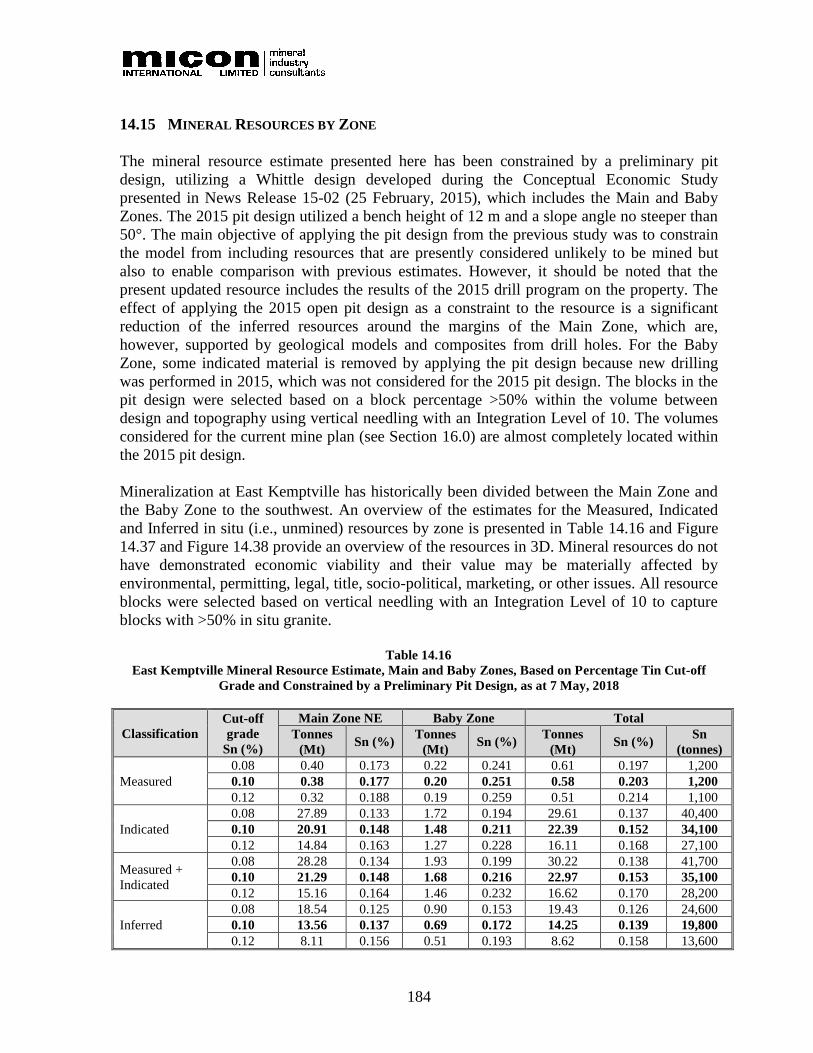
184
14.15 MINERAL RESOURCES BY ZONE
The mineral resource estimate presented here has been constrained by a preliminary pit
design, utilizing a Whittle design developed during the Conceptual Economic Study
presented in News Release 15-02 (25 February, 2015), which includes the Main and Baby
Zones. The 2015 pit design utilized a bench height of 12 m and a slope angle no steeper than
50°. The main objective of applying the pit design from the previous study was to constrain
the model from including resources that are presently considered unlikely to be mined but
also to enable comparison with previous estimates. However, it should be noted that the
present updated resource includes the results of the 2015 drill program on the property. The
effect of applying the 2015 open pit design as a constraint to the resource is a significant
reduction of the inferred resources around the margins of the Main Zone, which are,
however, supported by geological models and composites from drill holes. For the Baby
Zone, some indicated material is removed by applying the pit design because new drilling
was performed in 2015, which was not considered for the 2015 pit design. The blocks in the
pit design were selected based on a block percentage >50% within the volume between
design and topography using vertical needling with an Integration Level of 10. The volumes
considered for the current mine plan (see Section 16.0) are almost completely located within
the 2015 pit design.
Mineralization at East Kemptville has historically been divided between the Main Zone and
the Baby Zone to the southwest. An overview of the estimates for the Measured, Indicated
and Inferred in situ (i.e., unmined) resources by zone is presented in Table 14.16 and Figure
14.37 and Figure 14.38 provide an overview of the resources in 3D. Mineral resources do not
have demonstrated economic viability and their value may be materially affected by
environmental, permitting, legal, title, socio-political, marketing, or other issues. All resource
blocks were selected based on vertical needling with an Integration Level of 10 to capture
blocks with >50% in situ granite.
Table 14.16
East Kemptville Mineral Resource Estimate, Main and Baby Zones, Based on Percentage Tin Cut-off
Grade and Constrained by a Preliminary Pit Design, as at 7 May, 2018
Classification
Cut-off
grade
Sn (%)
Main Zone NE Baby Zone Total
Tonnes
(Mt) Sn (%)
Tonnes
(Mt) Sn (%)
Tonnes
(Mt) Sn (%)
Sn
(tonnes)
Measured
0.08 0.40 0.173 0.22 0.241 0.61 0.197 1,200
0.10 0.38 0.177 0.20 0.251 0.58 0.203 1,200
0.12 0.32 0.188 0.19 0.259 0.51 0.214 1,100
Indicated
0.08 27.89 0.133 1.72 0.194 29.61 0.137 40,400
0.10 20.91 0.148 1.48 0.211 22.39 0.152 34,100
0.12 14.84 0.163 1.27 0.228 16.11 0.168 27,100
Measured +
Indicated
0.08 28.28 0.134 1.93 0.199 30.22 0.138 41,700
0.10 21.29 0.148 1.68 0.216 22.97 0.153 35,100
0.12 15.16 0.164 1.46 0.232 16.62 0.170 28,200
Inferred
0.08 18.54 0.125 0.90 0.153 19.43 0.126 24,600
0.10 13.56 0.137 0.69 0.172 14.25 0.139 19,800
0.12 8.11 0.156 0.51 0.193 8.62 0.158 13,600

185
Notes:
1. CIM Definition Standards for Mineral Resources, 2014, were followed.
2. The independent Qualified Person for this Mineral Resource estimate is William Mercer, Ph.D., P. Geo. (Nova
Scotia). The mineral resources are current as of May 7, 2018.
3. The mineral resource estimate is based on 194 drill holes totalling 21,456 m drilled between 1979 and 1991 by
previous operators and 23 holes totalling 4190 m drilled by Avalon in 2014 and 2015.
4. Drill data were organized in Maxwell DataShed and for estimation purposes were transferred to the Geovia GEMS
6.8.1 software, wherein the block model was developed.
5. Resources were estimated by interpolating composites within block models of 24 m by 24 m by 12 m blocks in the
Main Zone and 6 m by 6 m by 6 m in the Baby Zone. Interpolation used the Ordinary Kriging method.
6. In the Main Zone, Measured material was defined as blocks interpolated with a search ellipse with radii of
40x20x15 m using 18-36 samples, corresponding to 3-6 drill holes, indicated material with a 120x40x18 m search
ellipse and the same number of samples, and inferred material with a 315x85x18 m search ellipse using 12-24
samples corresponding to 2-4 drill holes. In the Baby Zone, Measured material was defined as blocks interpolated
with a search ellipse with radii of 30x20x8 m using 6-12 samples, corresponding to 3-6 drill holes, indicated
material with a 48x33x12 m search ellipse and the same number of samples, and inferred material with a
95x65x24 m search ellipse using 4-8 samples corresponding to 2-4 drill holes (see Section 1.12 Resource
Classification).
7. Prior to compositing, the assays were capped at 1% Sn, which corresponds to the 99th percentile of the tin assay
data, reducing the length-weighted mean of the tin assays by 9.4%.
8. Mean density values of available data of 2.728 t/m3 and 2.784 t/m3 were used for the Main and Baby Zones,
respectively.
9. The resource estimate has been constrained using the Whittle pit described previously (Avalon News Release 15-
02, February 25, 2015).
10. Several possible cut-off grades are reported in this resource estimate. Based on past mining practice at East
Kemptville, a cut-off grade of 0.1% Sn is reasonable and preliminary cost and revenue values at the time of
estimation also suggest this is reasonable.
11. Mineral resources do not have demonstrated economic viability and their value may be materially affected by
environmental, permitting, legal, title, socio-political, marketing, or other issues.
Figure 14.37
Overview of the Main Zone Block Model at a Cut-off Grade of 0.10 wt. % Sn in 3D
(The blocks are colour-coded by confidence category: measured – red, indicated – yellow, inferred –
green)
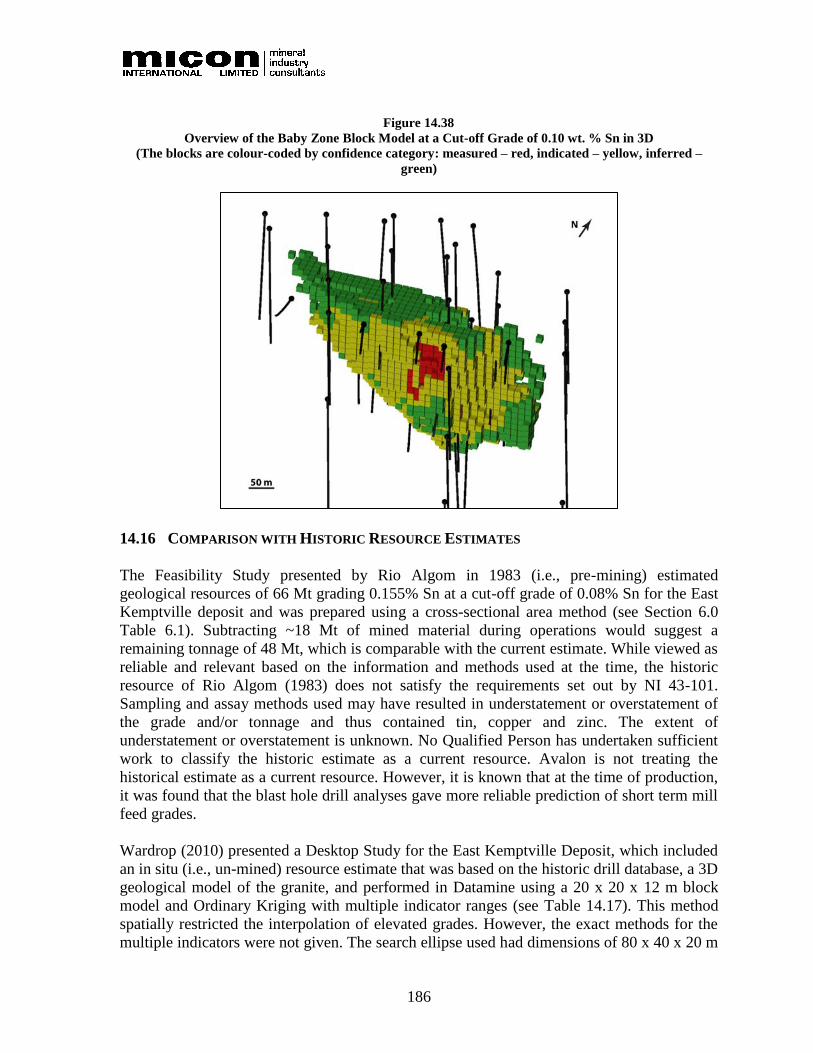
186
Figure 14.38
Overview of the Baby Zone Block Model at a Cut-off Grade of 0.10 wt. % Sn in 3D
(The blocks are colour-coded by confidence category: measured – red, indicated – yellow, inferred –
green)
14.16 COMPARISON WITH HISTORIC RESOURCE ESTIMATES
The Feasibility Study presented by Rio Algom in 1983 (i.e., pre-mining) estimated
geological resources of 66 Mt grading 0.155% Sn at a cut-off grade of 0.08% Sn for the East
Kemptville deposit and was prepared using a cross-sectional area method (see Section 6.0
Table 6.1). Subtracting ~18 Mt of mined material during operations would suggest a
remaining tonnage of 48 Mt, which is comparable with the current estimate. While viewed as
reliable and relevant based on the information and methods used at the time, the historic
resource of Rio Algom (1983) does not satisfy the requirements set out by NI 43-101.
Sampling and assay methods used may have resulted in understatement or overstatement of
the grade and/or tonnage and thus contained tin, copper and zinc. The extent of
understatement or overstatement is unknown. No Qualified Person has undertaken sufficient
work to classify the historic estimate as a current resource. Avalon is not treating the
historical estimate as a current resource. However, it is known that at the time of production,
it was found that the blast hole drill analyses gave more reliable prediction of short term mill
feed grades.
Wardrop (2010) presented a Desktop Study for the East Kemptville Deposit, which included
an in situ (i.e., un-mined) resource estimate that was based on the historic drill database, a 3D
geological model of the granite, and performed in Datamine using a 20 x 20 x 12 m block
model and Ordinary Kriging with multiple indicator ranges (see Table 14.17). This method
spatially restricted the interpolation of elevated grades. However, the exact methods for the
multiple indicators were not given. The search ellipse used had dimensions of 80 x 40 x 20 m
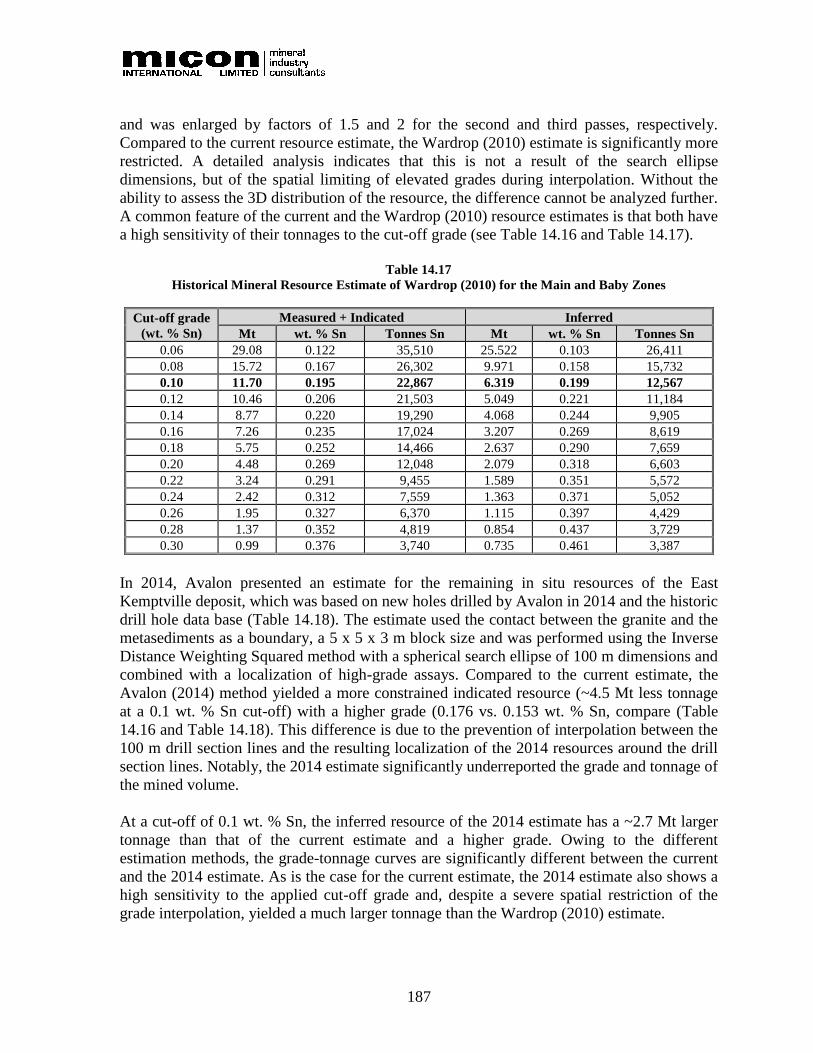
187
and was enlarged by factors of 1.5 and 2 for the second and third passes, respectively.
Compared to the current resource estimate, the Wardrop (2010) estimate is significantly more
restricted. A detailed analysis indicates that this is not a result of the search ellipse
dimensions, but of the spatial limiting of elevated grades during interpolation. Without the
ability to assess the 3D distribution of the resource, the difference cannot be analyzed further.
A common feature of the current and the Wardrop (2010) resource estimates is that both have
a high sensitivity of their tonnages to the cut-off grade (see Table 14.16 and Table 14.17).
Table 14.17
Historical Mineral Resource Estimate of Wardrop (2010) for the Main and Baby Zones
Cut-off grade
(wt. % Sn)
Measured + Indicated Inferred
Mt wt. % Sn Tonnes Sn Mt wt. % Sn Tonnes Sn
0.06 29.08 0.122 35,510 25.522 0.103 26,411
0.08 15.72 0.167 26,302 9.971 0.158 15,732
0.10 11.70 0.195 22,867 6.319 0.199 12,567
0.12 10.46 0.206 21,503 5.049 0.221 11,184
0.14 8.77 0.220 19,290 4.068 0.244 9,905
0.16 7.26 0.235 17,024 3.207 0.269 8,619
0.18 5.75 0.252 14,466 2.637 0.290 7,659
0.20 4.48 0.269 12,048 2.079 0.318 6,603
0.22 3.24 0.291 9,455 1.589 0.351 5,572
0.24 2.42 0.312 7,559 1.363 0.371 5,052
0.26 1.95 0.327 6,370 1.115 0.397 4,429
0.28 1.37 0.352 4,819 0.854 0.437 3,729
0.30 0.99 0.376 3,740 0.735 0.461 3,387
In 2014, Avalon presented an estimate for the remaining in situ resources of the East
Kemptville deposit, which was based on new holes drilled by Avalon in 2014 and the historic
drill hole data base (Table 14.18). The estimate used the contact between the granite and the
metasediments as a boundary, a 5 x 5 x 3 m block size and was performed using the Inverse
Distance Weighting Squared method with a spherical search ellipse of 100 m dimensions and
combined with a localization of high-grade assays. Compared to the current estimate, the
Avalon (2014) method yielded a more constrained indicated resource (~4.5 Mt less tonnage
at a 0.1 wt. % Sn cut-off) with a higher grade (0.176 vs. 0.153 wt. % Sn, compare (Table
14.16 and Table 14.18). This difference is due to the prevention of interpolation between the
100 m drill section lines and the resulting localization of the 2014 resources around the drill
section lines. Notably, the 2014 estimate significantly underreported the grade and tonnage of
the mined volume.
At a cut-off of 0.1 wt. % Sn, the inferred resource of the 2014 estimate has a ~2.7 Mt larger
tonnage than that of the current estimate and a higher grade. Owing to the different
estimation methods, the grade-tonnage curves are significantly different between the current
and the 2014 estimate. As is the case for the current estimate, the 2014 estimate also shows a
high sensitivity to the applied cut-off grade and, despite a severe spatial restriction of the
grade interpolation, yielded a much larger tonnage than the Wardrop (2010) estimate.
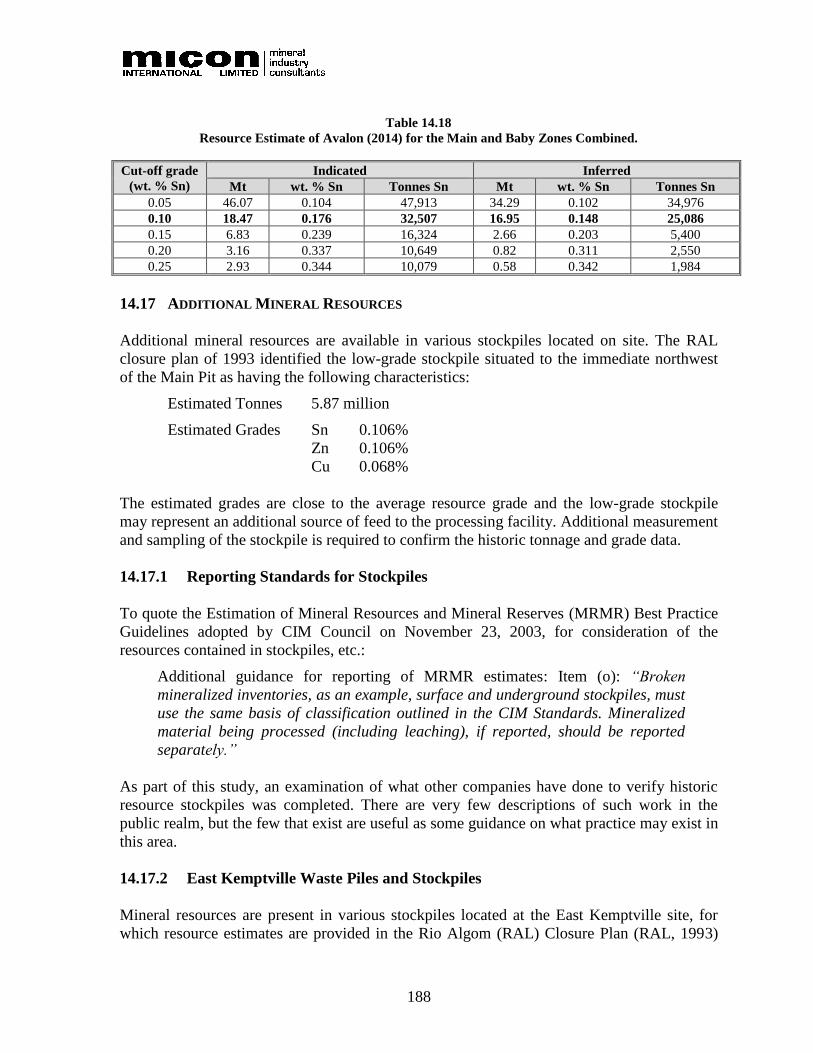
188
Table 14.18
Resource Estimate of Avalon (2014) for the Main and Baby Zones Combined.
Cut-off grade
(wt. % Sn)
Indicated Inferred
Mt wt. % Sn Tonnes Sn Mt wt. % Sn Tonnes Sn
0.05 46.07 0.104 47,913 34.29 0.102 34,976
0.10 18.47 0.176 32,507 16.95 0.148 25,086
0.15 6.83 0.239 16,324 2.66 0.203 5,400
0.20 3.16 0.337 10,649 0.82 0.311 2,550
0.25 2.93 0.344 10,079 0.58 0.342 1,984
14.17 ADDITIONAL MINERAL RESOURCES
Additional mineral resources are available in various stockpiles located on site. The RAL
closure plan of 1993 identified the low-grade stockpile situated to the immediate northwest
of the Main Pit as having the following characteristics:
Estimated Tonnes 5.87 million
Estimated Grades Sn 0.106%
Zn 0.106%
Cu 0.068%
The estimated grades are close to the average resource grade and the low-grade stockpile
may represent an additional source of feed to the processing facility. Additional measurement
and sampling of the stockpile is required to confirm the historic tonnage and grade data.
14.17.1 Reporting Standards for Stockpiles
To quote the Estimation of Mineral Resources and Mineral Reserves (MRMR) Best Practice
Guidelines adopted by CIM Council on November 23, 2003, for consideration of the
resources contained in stockpiles, etc.:
Additional guidance for reporting of MRMR estimates: Item (o): “Broken
mineralized inventories, as an example, surface and underground stockpiles, must
use the same basis of classification outlined in the CIM Standards. Mineralized
material being processed (including leaching), if reported, should be reported
separately.”
As part of this study, an examination of what other companies have done to verify historic
resource stockpiles was completed. There are very few descriptions of such work in the
public realm, but the few that exist are useful as some guidance on what practice may exist in
this area.
14.17.2 East Kemptville Waste Piles and Stockpiles
Mineral resources are present in various stockpiles located at the East Kemptville site, for
which resource estimates are provided in the Rio Algom (RAL) Closure Plan (RAL, 1993)

189
and which is quoted in Table 14.19: The footnotes to the table comprise information
provided in the RAL Closure Report.
Table 14.19
Low Grade Stockpiles and Waste Piles Characteristics, Rio Algom (1993)
Dump Tonnes
(Mt)
Surface
Area (ha)
Sample
Number
Grade (%)
Sn Zn Cu
North Waste Dump 1.29 6.8 NWD-1 0.116 0.180 0.070
NWD-2 0.096 0.120 0.050
NWD-3 0.055 0.090 0.030
Measured1 Mean 0.089 0.130 0.050
South Waste Dump and Pad 2.82 19.4 SD-1 0.026 0.080 0.030
SD-2 0.065 0.180 0.030
Measured1 Mean 0.046 0.120 0.030
Estimated2 North and South Mean 0.049 0.102 0.035
Low Grade Stockpile 5.87 22.7 LG-1 0.188 0.090 0.080
LG-2 0.057 0.090 0.040
LG-3 0.140 0.160 0.060
LG-4 0.076 0.060 0.090
LG-5 0.078 0.130 0.050
Measured1 Mean 0.106 0.106 0.068
Estimated2 Mean 0.091 0.153 0.058 1 Measured by RAL in samples collected from surface piles in 1991. 2 Estimated by RAL from more than 1,000 sample analyses from blasthole cuttings.
In the original Feasibility Study, RAL classified the rock into “High Grade”, which was
above a cutoff grade of 0.12% Sn and “Low Grade” which was the remaining materials
above a cutoff of 0.08% Sn (see Section 6.0 Table 6.1).
Cut off grade during operations (1985 to 1990) were reported to be:
• Material at better than 0.12% Sn, delivered to the mill.
• Low grade mineralization at 0.08 to 0.119% Sn, delivered to Low Grade Stockpiles.
• Waste rock below 0.08% Sn, delivered to waste piles.
Grades were determined by blasthole sampling.
14.17.3 Grade and Tonnage Verification
The Low-Grade Stockpile reaches an elevation of about 113 m above sea level, and the
surrounding land is at about 93 m above sea level, so the thickness of the main part of the
pile is about 20 m. Measured on Google Earth, the Low-Grade Stockpile has a perimeter of
about 1,500 m and an area of about 135,000 m2. At a density of 1.6 t/m3, this would give a
very approximate tonnage of about 4.5 Mt.
In order to verify more accurately the tonnage present in the stockpiles and waste dumps, a
volume estimate was completed using Minesight software and the following:

190
• The original 1983 topography prior to mining.
• The topography from the 1992 topographic survey at the close of mining.
A density (SG) of 1.6 t/m3 was then applied as this was considered reasonable from past
experience with estimating resources in stockpiles and dumps. The results are summarized in
Table 14.20. The Avalon estimate of tonnage is within 5.5% overall of that quoted by RAL
for all stockpiles and dumps.
Table 14.20
Volume and Tonnage Estimates, Low Grade Stockpile
Area Avalon RAL
Difference Volume (m3) SG Tonnes Tonnes
North Waste Dump 810,078 1.60 1,296,125 1,290,000 -0.5%
Low Grade Stockpile + South Waste Pad 4,653,489 1.60 7,445,582 5,870,000
South Waste Dump and Pad 2,820,000
South Waste Dump 432,505 1.60 692,008
Total 9,433,715 9,980,000 5.5%
The sampling and grade verification process is described in Section 11.1.3.
14.17.4 Low Grade Stockpile Mineral Resources
On the basis of its investigation, Avalon considers that the Low-Grade Stockpile may be
reported as an Inferred Mineral Resource as summarized in Table 14.21 (Reference: Annual
Information Form 20F, Avalon Advanced Materials Inc., August 31, 2016. Table EK2.
Accessible on Avalon Website or www.Sedar.com). The accepted metal grades are the
average of the RAL and Avalon surface sampling.
Table 14.21
Low Grade Stockpile Estimated Inferred Mineral Resource
Category Tonnes
(Mt)
Grade (%)
Sn Zn Cu
Inferred 5.87 0.112 0.100 0.61
Notes:
1. This estimate is as of 16 November 2015.
2. CIM Definition Standards 2014 were followed for mineral
resources.
3. The independent Qualified Person for this Mineral Resource
estimate is Donald H. Hains, P.Geo., of Hains Engineering
Company Limited.
4. Resources were estimated by examination of historical RAL data
and Avalon’s 2015 sampling of the Low-Grade Stockpile.
5. Mineral resources do not have demonstrated economic viability
and their value may be materially affected by environmental,
permitting, legal, title, socio-political, marketing or other issues.

191
Additional measurement and sampling of the stockpile, especially with depth, is required to
confirm the historic tonnage and grade data to a higher category of resource such as Indicated
or Measured.

192
15.0 MINERAL RESERVES ESTIMATES
No mineral reserves have been estimated for the East Kemptville tin Project.

193
16.0 MINING METHODS
16.1 INTRODUCTION
Avalon plans to engage a locally (Eastern Canada) based mining contractor to mine material
from the Rio Algom Ltd. (RAL) legacy stockpile, the Baby Zone pit and the Main Zone pit.
This contractor will be responsible for supplying, operating and maintaining all mining
equipment, trucks and mining related infrastructure. Avalon’s cost estimate has only
budgeted for emptying the pits of both water and any sludge that may have settled on the
bottom.
The mining will re-start as a continuation of the historic open pit operation using a
conventional drill and blast process and conventional truck and shovel methods for material
movement. Mill feed will be hauled to a small (24 h) stockpile and then reclaimed into the
crusher rock box by a front-end loader. The mill treatment rate is set at 2,208 t/d
(806,000 t/y) starting initially using only stockpiled material, which will then be
supplemented by new feed mined from the Baby Zone Pit during production Years 2 and 3.
Thereafter, mining will take place from the southern portion of the Main Zone Pit in Years 3
through 7, followed by production from two pits located in the northern portion of the Main
Pit Zone in Years 7 through 14, after which the operation will be fed with the remainder of
the legacy stockpile through Years 15 to 19. During Years 2 through 14 when the majority
of mill feed is sourced from the pits, approximately 6 weeks’ worth of material will be
scheduled from the legacy pile in order to (a) incrementally reduce the environmental
liability and (b) maintain mill productivity in the event significant operational delays are
encountered in the mine.
For this PEA, the life-of-mine (LOM) open pit mineable plant feed material within the
conceptual pit designs is 9.22 Mt, inclusive of Measured, Indicated and Inferred resources,
with a total waste movement of 3.24 Mt for an average stripping ratio of 0.35:1. With the
inclusion of an additional 5.87 Mt of Inferred resources from the RAL legacy stockpile, the
mine life is extended to 19 years.
16.2 PIT OPTIMIZATION
Two rotated resource block models were prepared by Avalon at different block resolutions (6
m x 6 m x 6 m for the Baby Zone, and 24 m x 24 m x 12 m for the Main Zone). The two
models were merged to create a single functional model suitable for mine planning and pit
optimization at a resolution of 6 m x 6 m x 6 m. The economic parameters used as inputs into
Datamine NPV Scheduler® are summarized in Table 16.1.
Table 16.1
Pit Optimization Criteria East Kemptville Tin Project
Parameter Unit Value
Mining Cost (Mill Feed) CAD/t. mined 4.70
Mining Cost (Waste) CAD/t. mined 4.70
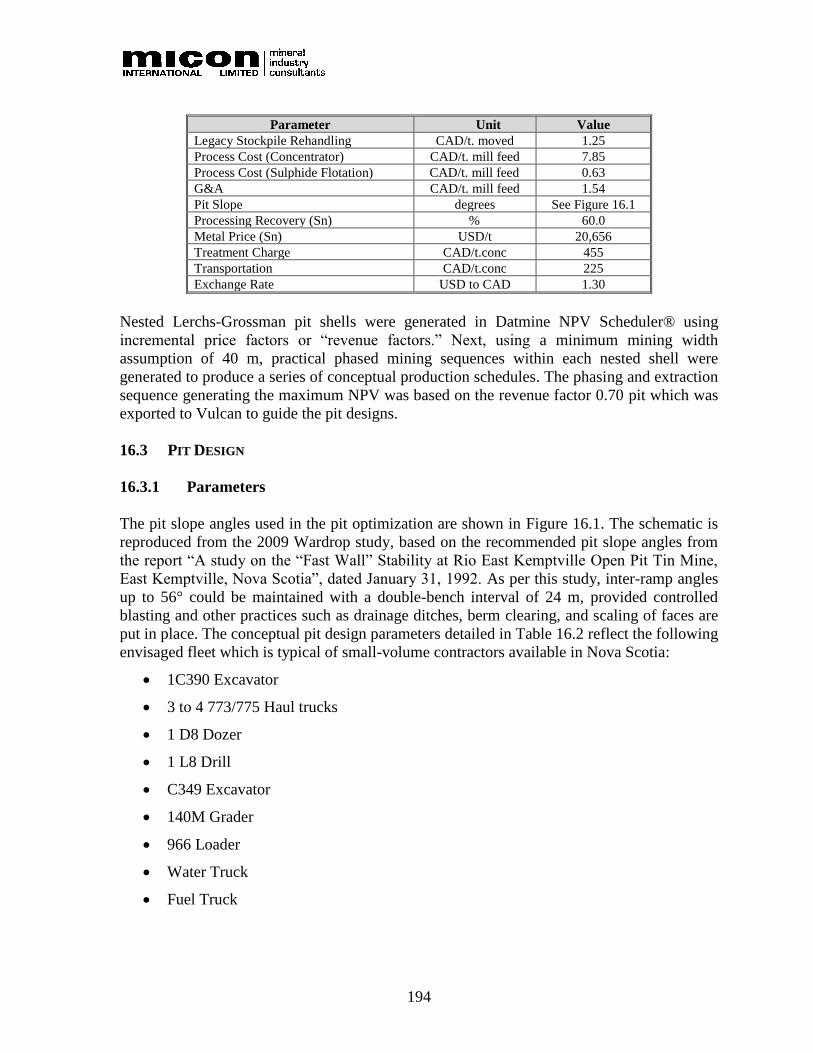
194
Parameter Unit Value
Legacy Stockpile Rehandling CAD/t. moved 1.25
Process Cost (Concentrator) CAD/t. mill feed 7.85
Process Cost (Sulphide Flotation) CAD/t. mill feed 0.63
G&A CAD/t. mill feed 1.54
Pit Slope degrees See Figure 16.1
Processing Recovery (Sn) % 60.0
Metal Price (Sn) USD/t 20,656
Treatment Charge CAD/t.conc 455
Transportation CAD/t.conc 225
Exchange Rate USD to CAD 1.30
Nested Lerchs-Grossman pit shells were generated in Datmine NPV Scheduler® using
incremental price factors or “revenue factors.” Next, using a minimum mining width
assumption of 40 m, practical phased mining sequences within each nested shell were
generated to produce a series of conceptual production schedules. The phasing and extraction
sequence generating the maximum NPV was based on the revenue factor 0.70 pit which was
exported to Vulcan to guide the pit designs.
16.3 PIT DESIGN
16.3.1 Parameters
The pit slope angles used in the pit optimization are shown in Figure 16.1. The schematic is
reproduced from the 2009 Wardrop study, based on the recommended pit slope angles from
the report “A study on the “Fast Wall” Stability at Rio East Kemptville Open Pit Tin Mine,
East Kemptville, Nova Scotia”, dated January 31, 1992. As per this study, inter-ramp angles
up to 56° could be maintained with a double-bench interval of 24 m, provided controlled
blasting and other practices such as drainage ditches, berm clearing, and scaling of faces are
put in place. The conceptual pit design parameters detailed in Table 16.2 reflect the following
envisaged fleet which is typical of small-volume contractors available in Nova Scotia:
• 1C390 Excavator
• 3 to 4 773/775 Haul trucks
• 1 D8 Dozer
• 1 L8 Drill
• C349 Excavator
• 140M Grader
• 966 Loader
• Water Truck
• Fuel Truck
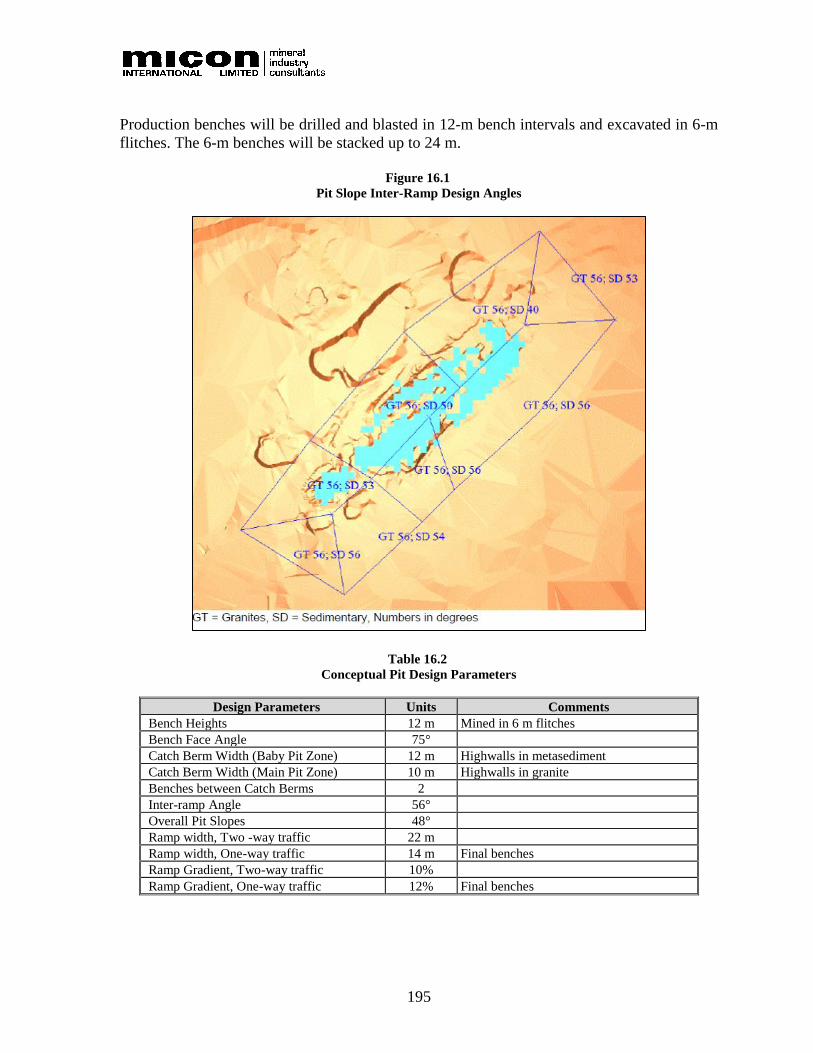
195
Production benches will be drilled and blasted in 12-m bench intervals and excavated in 6-m
flitches. The 6-m benches will be stacked up to 24 m.
Figure 16.1
Pit Slope Inter-Ramp Design Angles
Table 16.2
Conceptual Pit Design Parameters
Design Parameters Units Comments
Bench Heights 12 m Mined in 6 m flitches
Bench Face Angle 75°
Catch Berm Width (Baby Pit Zone) 12 m Highwalls in metasediment
Catch Berm Width (Main Pit Zone) 10 m Highwalls in granite
Benches between Catch Berms 2
Inter-ramp Angle 56°
Overall Pit Slopes 48°
Ramp width, Two -way traffic 22 m
Ramp width, One-way traffic 14 m Final benches
Ramp Gradient, Two-way traffic 10%
Ramp Gradient, One-way traffic 12% Final benches
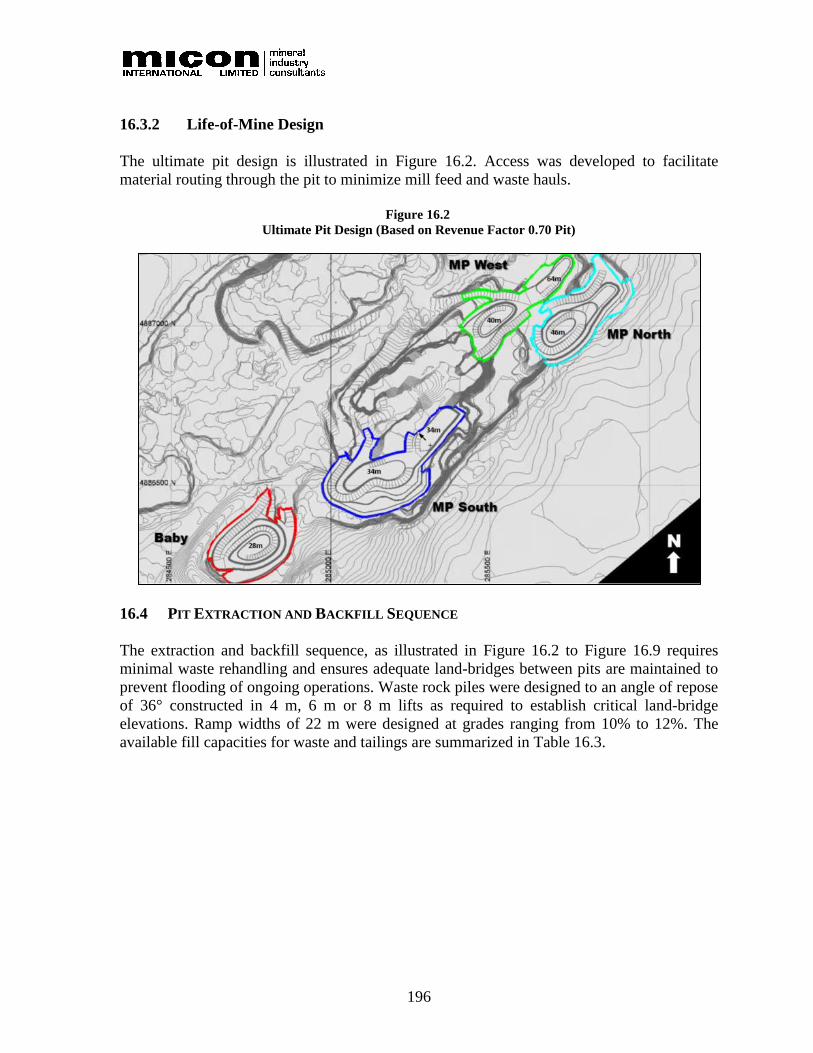
196
16.3.2 Life-of-Mine Design
The ultimate pit design is illustrated in Figure 16.2. Access was developed to facilitate
material routing through the pit to minimize mill feed and waste hauls.
Figure 16.2
Ultimate Pit Design (Based on Revenue Factor 0.70 Pit)
16.4 PIT EXTRACTION AND BACKFILL SEQUENCE
The extraction and backfill sequence, as illustrated in Figure 16.2 to Figure 16.9 requires
minimal waste rehandling and ensures adequate land-bridges between pits are maintained to
prevent flooding of ongoing operations. Waste rock piles were designed to an angle of repose
of 36° constructed in 4 m, 6 m or 8 m lifts as required to establish critical land-bridge
elevations. Ramp widths of 22 m were designed at grades ranging from 10% to 12%. The
available fill capacities for waste and tailings are summarized in Table 16.3.
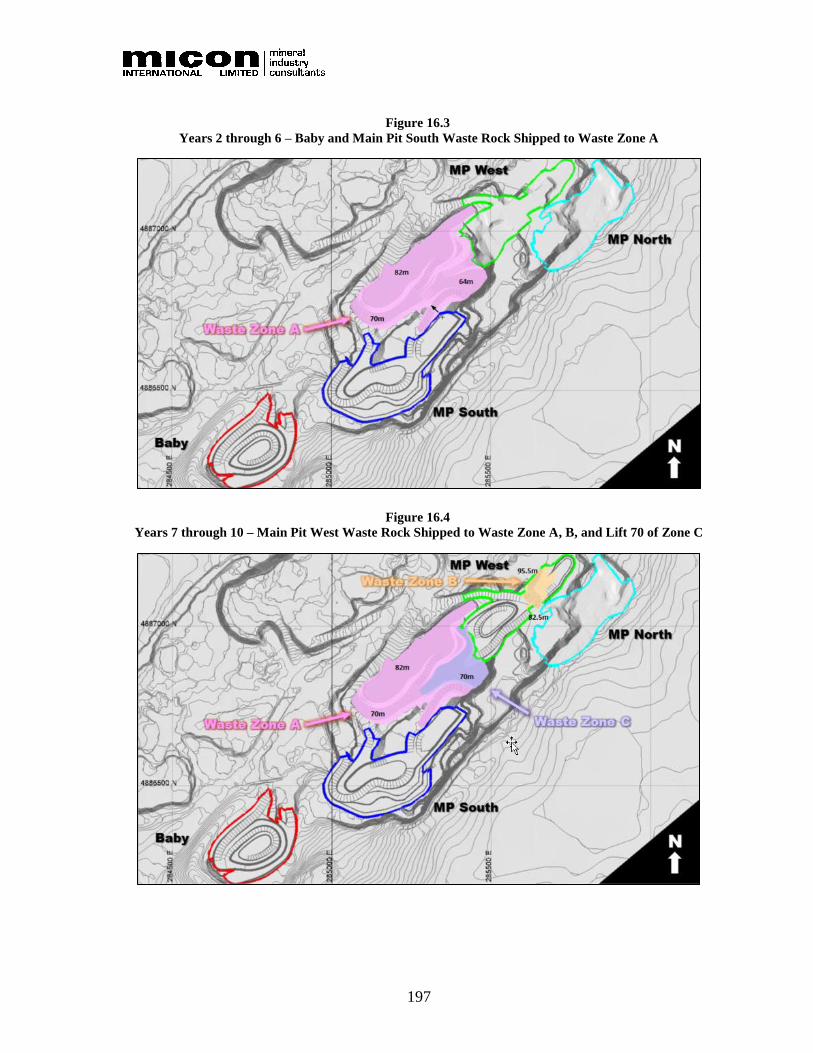
197
Figure 16.3
Years 2 through 6 – Baby and Main Pit South Waste Rock Shipped to Waste Zone A
Figure 16.4
Years 7 through 10 – Main Pit West Waste Rock Shipped to Waste Zone A, B, and Lift 70 of Zone C

198
Figure 16.5
Years 11 through 14 – Main Pit North Waste Production to Waste Zone C and D
Figure 16.6
Tailings Backfill Elevations – Years 4(Q4) through 12(Q3)
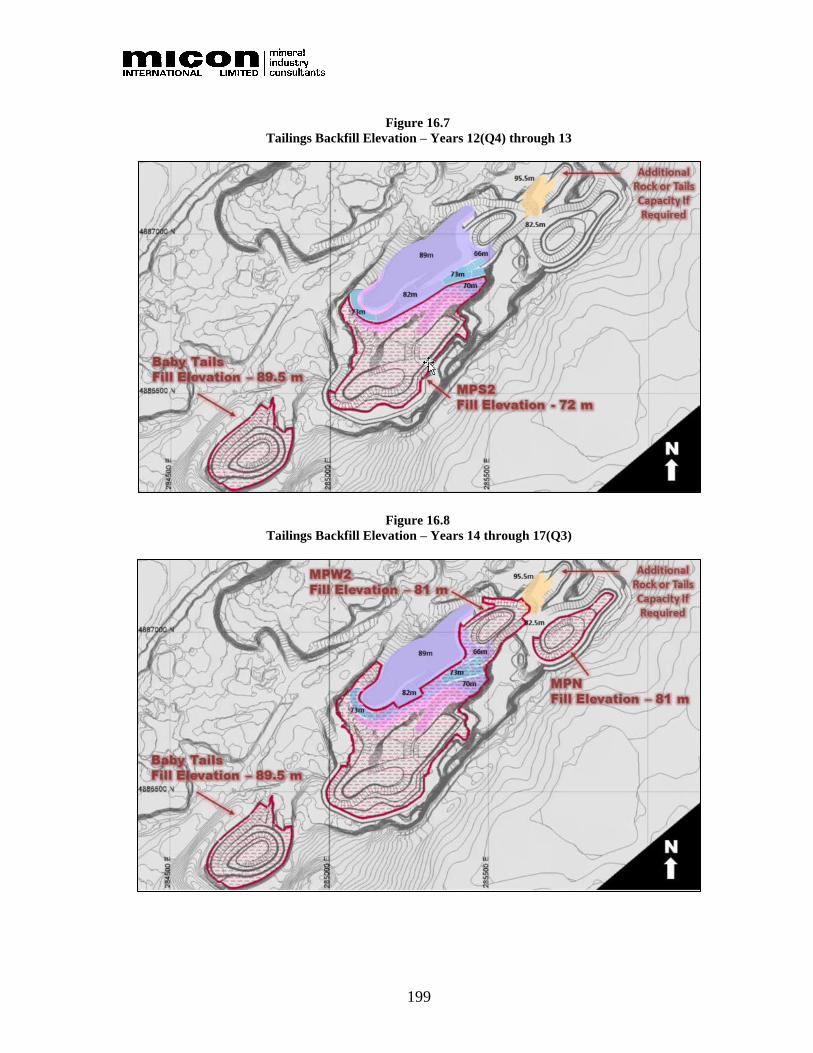
199
Figure 16.7
Tailings Backfill Elevation – Years 12(Q4) through 13
Figure 16.8
Tailings Backfill Elevation – Years 14 through 17(Q3)

200
Figure 16.9
Final Backfill Elevation for Tailings and Other Legacy Waste Piles
Table 16.3
Available Storage Capacity for Waste Rock and Tailings
Storage Location Fill Elevation
(m)
Available Capacity
(m3)
Waste Zone A 82 1,415,989
Waste Zone B 93 77,620
Waste Zone C 89 512,449
Waste Zone D 73 22,546
Main Pit South 1 (MPS1) 65 1,268,380
Main Pit South 2 (MPS2) 72 612,949
Main Pit West (MPW) 81 1,644,299
Main Pit North (MPN) 81 401,327
Remaining MP Capacity When Pit Production Ceases 22 2,500,461
16.5 PRE-PRODUCTION SCHEDULE
The Pre-production schedule is a function of the time required to dewater and remediate the
Baby Zone Pit to a condition suitable to resume mining and the anticipated construction
period required for the plant. Other pre-production activities will include upgrades to the
tailings facility and the water treatment facility to handle the additional water originating
from the Baby Pit. Dewatering of the Main Pit Zone will continue through the first month of
Year 2.

201
16.6 MINE PRODUCTION SCHEDULE
The proposed production plan is presented in Table 16.4. Phasing and production planning
was developed to meet the following operational and environmental objectives:
• To support Avalon’s strategy for a “walk away” closure plan that will isolate all
potentially acid generating waste rock and tailings from oxygen and/or water, allow
for the storage of all waste and tailings in the excavated pits that will be flooded
when operations cease.
• To the extent practicable, avoid the need for temporary ex-pit storage of waste and
minimize re-handling costs.
• Allow for an 18-month start up period to build the process plant, begin dewatering of
both pits and prepare the roads and tailings facility for operation.
• Create sufficient capacity in Main Pit South as soon as possible to accommodate
tailings after the TMF and Baby Pit tailings storage areas have reached design limits.
• Maintain internal access between the three Main Zone pits to minimize waste
rehandling and provide shortened hauls for plant feed, thereby reducing the
greenhouse gas emissions footprint of the site remediation plan.
• Facilitate safe and productive simultaneous mine and backfill operations in the Main
Zone by maintaining a minimum freeboard of one metre in the tailings repositories to
manage water after storm events.
• Provide for a freeboard allowance of one metre in the final backfilled pit
configuration.
• Maximize NPV within all constraints defined above.
Key milestones for the conceptual Project development are described below:
Year -1: Dewatering of the Baby Pit and Main Pit begins, along with site preparation for
construction of plant.
Year 1: Final dewatering and removal of sludge in the Baby Pit takes place during Q1 and
Q2. Shipment from the legacy stockpile begins in Q3, with process tailings directed to the
TMF. Dewatering of the Main Pit continues and will carry over into the first month of
Year 2.
Year 2: Mine operations in the Baby Pit begin supplemented by feed from the legacy
stockpile. Waste rock is shipped to its final destination to the west of Main Pit South (Waste
Zone A, Figure 16.3) and tailings are directed to the TMF. Any overburden material suitable
for use in future revegetation work will be set aside.
Year 3: Baby Pit production ceases and Main Pit South mining begins, supplemented with
legacy stockpile feed. Waste rock from both pits is shipped to Waste Zone A and process
tailings are sent to the TMF.

202
Year 4-6: Production feed is sourced from Main Pit South, supplemented with the RAL
legacy stockpile. Waste rock is shipped to Waste Zone A. Once the TMF capacity is reached
in the last quarter of Year 4, tailings will be directed to the Baby Pit. Beginning in Year 6,
mill feed from the Main Pit will be processed through a sulphide flotation circuit to produce
clean tailings to cap the TMF.
Year 7: Main Pit South production ceases and Main Pit West mining begins, supplemented
with legacy stockpile feed. A portion of the waste rock from Main Pit West will be
temporarily staged as required to create a fill ramp in Year 9 (Waste Zone B, Figure 16.4) to
haul mill feed excavated from the lower benches. Sulphide tailings are directed to the Baby
Pit, with low-sulphide tailings directed to capping operations.
Year 8-10: Production feed sourced from Main Pit West is supplemented with the RAL
legacy stockpile. Stockpiled waste rock from the upper benches of Main Pit West is used to
construct a fill ramp needed to haul mill feed from the lower benches in year 9 and 10.
Remaining waste in is shipped to the final lift of Waste Zone A and the first lift (70 m
elevation) of Waste Zone C (Figure 16.4). Low-sulphide tailings are directed to capping
operations and sulphide tailings are deposited in the Main Pit South repository (MPS1,
Figure 16.6).
Year 11-14: Production feed is sourced from Main Pit North, supplemented with the RAL
legacy stockpile. Waste rock is shipped to Waste Zone C and D (Figure 16.5). Sulphide
tailings continue to be directed to Main Pit South, with Year 11 being the final year of low-
sulphide tailings production used for surface capping of the TMF. In Year 12, additional
capacity in Main Pit South becomes available that will be sufficient for tailings deposition
through Year 13 (Figure 16.7). In Year 14, tailings deposition will be directed to the Main Pit
West area.
Year 15-19: Mill production comes from the RAL stockpile for the remainder of the Project
life. Tailings deposition continues in Main Pit West and Main Pit South areas through Year
16 (Figure 16.8). Beginning in Year 17, tailings are directed to the Main Pit North pit area,
after which tailings will continue to be deposited in the Main Pit for the remainder of the
schedule (Figure 16.9). If evenly distributed, the estimated tailings volume in the Main Pit
will approach an elevation of 87.5 m, leaving approximately 0.9 Mm3 of additional capacity
that may be used to reach the final allowable fill elevation of 90.5 m (one metre below the
final water table). Potential uses for this capacity are discussed in Section 20.3.
16.7 MINE INFRASTRUCTURE
Mine infrastructure requirements are discussed in Section 18.0, Project Infrastructure.
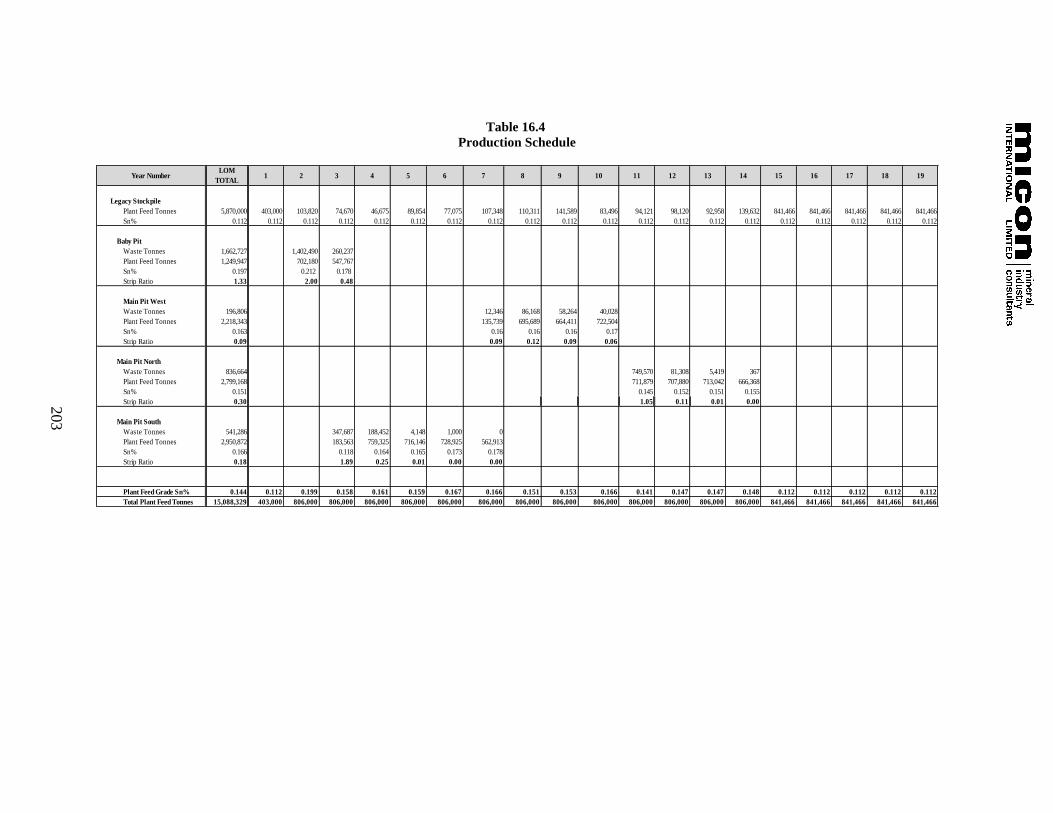
203
Table 16.4
Production Schedule
Year NumberLOM
TOTAL1 2 3 4 5 6 7 8 9 10 11 12 13 14 15 16 17 18 19
Legacy Stockpile
Plant Feed Tonnes 5,870,000 403,000 103,820 74,670 46,675 89,854 77,075 107,348 110,311 141,589 83,496 94,121 98,120 92,958 139,632 841,466 841,466 841,466 841,466 841,466
Sn% 0.112 0.112 0.112 0.112 0.112 0.112 0.112 0.112 0.112 0.112 0.112 0.112 0.112 0.112 0.112 0.112 0.112 0.112 0.112 0.112
Baby Pit
Waste Tonnes 1,662,727 1,402,490 260,237
Plant Feed Tonnes 1,249,947 702,180 547,767
Sn% 0.197 0.212 0.178
Strip Ratio 1.33 2.00 0.48
Main Pit West
Waste Tonnes 196,806 12,346 86,168 58,264 40,028
Plant Feed Tonnes 2,218,343 135,739 695,689 664,411 722,504
Sn% 0.163 0.16 0.16 0.16 0.17
Strip Ratio 0.09 0.09 0.12 0.09 0.06
Main Pit North
Waste Tonnes 836,664 749,570 81,308 5,419 367
Plant Feed Tonnes 2,799,168 711,879 707,880 713,042 666,368
Sn% 0.151 0.145 0.152 0.151 0.155
Strip Ratio 0.30 1.05 0.11 0.01 0.00
Main Pit South
Waste Tonnes 541,286 347,687 188,452 4,148 1,000 0
Plant Feed Tonnes 2,950,872 183,563 759,325 716,146 728,925 562,913
Sn% 0.166 0.118 0.164 0.165 0.173 0.178
Strip Ratio 0.18 1.89 0.25 0.01 0.00 0.00
Plant Feed Grade Sn% 0.144 0.112 0.199 0.158 0.161 0.159 0.167 0.166 0.151 0.153 0.166 0.141 0.147 0.147 0.148 0.112 0.112 0.112 0.112 0.112
Total Plant Feed Tonnes 15,088,329 403,000 806,000 806,000 806,000 806,000 806,000 806,000 806,000 806,000 806,000 806,000 806,000 806,000 806,000 841,466 841,466 841,466 841,466 841,466

204
17.0 RECOVERY METHODS
17.1 INTRODUCTION
The metallurgical process for the East Kemptville Project is based on the testwork that is
described in Section 13.0 and comprises the mineral separation and recovery of a tin
concentrate with a target grade of 55 % Sn. A small portion of the copper, zinc, iron and
indium will be collected into a sulphide concentrate which will be appropriately disposed of
in the tailings facility unless a buyer for the material is found.
Production is based initially on the processing of 806,000 t/y of stockpiled material, but after
Year 1, there will be an introduction of higher grade mineralization mined from the Baby
Zone Pit. In Year 3, there will be the introduction of plant feed material from the Main Zone
Pits. Construction of a bulk sulphide flotation circuit to remove sulphides from the plant
tailings will begin in year 5, with sulphide-free tailings production beginning in Year 6
through Year 11. These low-sulphide “clean” tailings will be filtered and used as “capping
material” for sealing the old tailings facility.
17.2 PROCESS FLOWSHEET DEVELOPMENT
The original East Kemptville metallurgical flowsheet comprised conventional process
operations such as crushing, two-stage grinding, bulk sulphide flotation followed by
differential Cu/Zn flotation and gravity recovery for tin. Such a flowsheet was determined to
be uneconomic at current metal prices. Consequently, Avalon developed a simpler process
focused on the production of a single tin concentrate. Data gathered from both the SGS UK
and Met-Solve metallurgical test programs (see Section 13.0) along with historical
information from previous operations and operating personnel was reviewed and used as the
basis for developing the flowsheet.
Avalon’s objective is to construct a simple plant with as few unit operations as possible that
is focused purely on the recovery of a saleable tin concentrate. It is acknowledged that this
approach will result in a lower than possible metal recovery, but it is believed that the low
costs associated with such an approach will out-weigh any potential tin losses.
The primary consideration has been to produce a suitably sized milled product from a single
stage grinding system and simultaneously prevent over-grinding of the plant feed and
resultant production of very fine cassiterite grains which would be difficult to recover. This is
achieved by incorporating a gravity recovery circuit within the grinding/classification circuit
and also with the use of classifying screens rather than cyclones in the circuit.
17.3 PROCESS DESIGN BASIS
The PEA is based on the following assumptions derived from the testwork results:
• 806,000 t/y of stockpiled mineralized material will be fed to the concentrator at a rate
of 100 t/h.
205
• Target primary grind P80= 80 Microns.
• The tin gravity concentrate grade of 55% Sn and tin recovery to concentrate of ~60%.
• Plant availability of 91.3% for the concentrator (8,000 h/y operating time).
• Preliminary tin recovery will be by centrifugal concentrators with shaking tables used
to produce the final product.
• Concentrate cleaning will include magnetic separation and flotation to remove iron,
copper and zinc sulphides.
17.4 PROCESS DESCRIPTION
Process flow diagrams (PFDs) showing the selected process are included at the end of this
section.
17.4.1 Overview
The 100 tonne per hour operation to treat the mineral resources at East Kemptville consists of
several conventional processes to produce a tin concentrate. The plant feed undergoes
crushing in a three staged crushing circuit, milling and classification, and is then put through
a series of gravity circuits using high-speed centrifugal concentrators (HSCCs), magnetic
separation and flotation to remove the metal sulphide before going through a series of
shaking tables. A bulk sulphide flotation circuit is also included in Year 6 of the operation to
remove sulphides from the gravity tailings (See Figure 17.1).
Benign flotation tailings will be filtered and used for capping the tailings facility. The bulk
sulphides concentrate removed from the gravity tailings will be combined with the sulphide
concentrate from the tin gravity circuit and stored under a cover of water to prevent
oxidation.
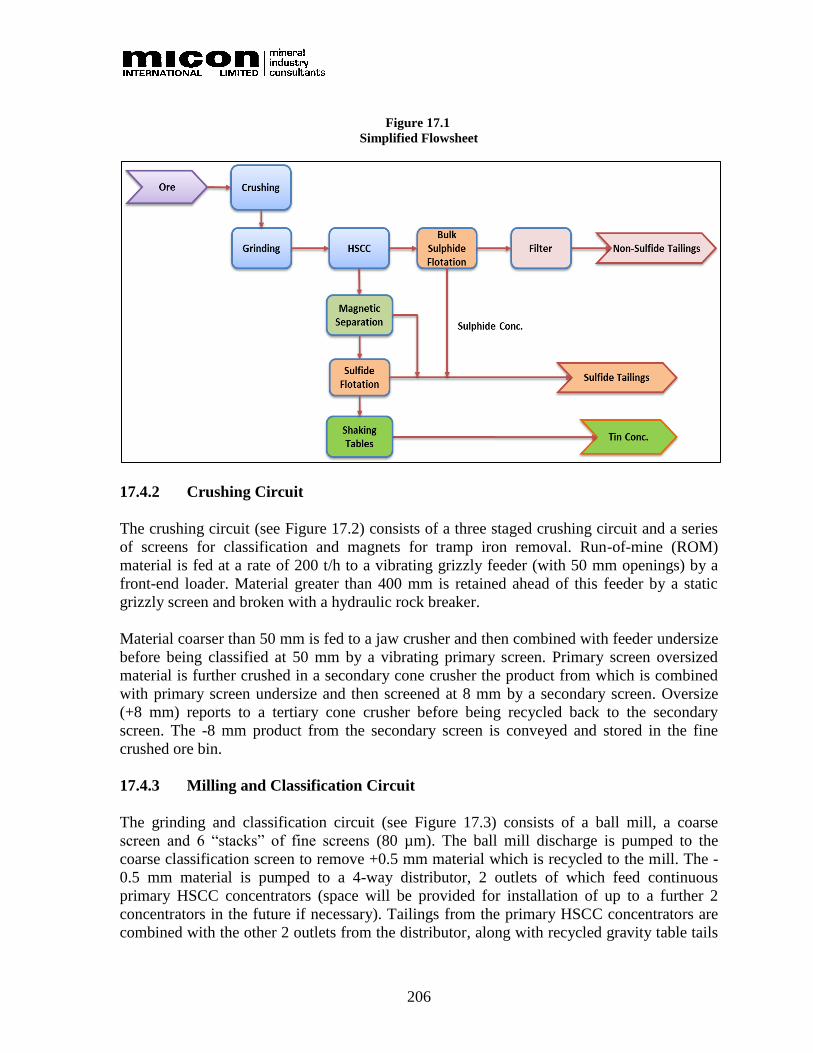
206
Figure 17.1
Simplified Flowsheet
17.4.2 Crushing Circuit
The crushing circuit (see Figure 17.2) consists of a three staged crushing circuit and a series
of screens for classification and magnets for tramp iron removal. Run-of-mine (ROM)
material is fed at a rate of 200 t/h to a vibrating grizzly feeder (with 50 mm openings) by a
front-end loader. Material greater than 400 mm is retained ahead of this feeder by a static
grizzly screen and broken with a hydraulic rock breaker.
Material coarser than 50 mm is fed to a jaw crusher and then combined with feeder undersize
before being classified at 50 mm by a vibrating primary screen. Primary screen oversized
material is further crushed in a secondary cone crusher the product from which is combined
with primary screen undersize and then screened at 8 mm by a secondary screen. Oversize
(+8 mm) reports to a tertiary cone crusher before being recycled back to the secondary
screen. The -8 mm product from the secondary screen is conveyed and stored in the fine
crushed ore bin.
17.4.3 Milling and Classification Circuit
The grinding and classification circuit (see Figure 17.3) consists of a ball mill, a coarse
screen and 6 “stacks” of fine screens (80 µm). The ball mill discharge is pumped to the
coarse classification screen to remove +0.5 mm material which is recycled to the mill. The -
0.5 mm material is pumped to a 4-way distributor, 2 outlets of which feed continuous
primary HSCC concentrators (space will be provided for installation of up to a further 2
concentrators in the future if necessary). Tailings from the primary HSCC concentrators are
combined with the other 2 outlets from the distributor, along with recycled gravity table tails
207
and cleaner 1 and 2 HSCC concentrate tails and pumped to the stack of -80 µm fine screens.
Screen oversize is recycled to the ball mill while screen undersize is feeds the main HSCC
gravity circuit.
17.4.4 Gravity Circuit
Screen underflow from the milling circuit feeds a 2-way distributor with each outlet feeding
continuous rougher HSCC concentrators in the gravity circuit (see Figure 17.3). Tailings
from the rougher concentrators are pumped to tailings. Concentrates from the rougher
concentrators are combined with primary HSCC concentrates and fed to a primary cleaner
HSCC concentrator. Primary cleaner concentrate feeds a secondary cleaner concentrator, the
concentrate from which is pumped to a sulphide removal circuit. Tailings from cleaner
concentrators are combined and recycled to the fine screens in the milling circuit.
17.4.5 Sulphide Removal Circuit
The gravity concentrate sulphide removal circuit (see Figure 17.3) comprises a low intensity
magnetic separation (LIMS) unit and a small flotation circuit to remove the entrained
sulphides in the centrifugal concentrate. Gravity concentrate feeds a rougher LIMS, to
scavenge entrained tin.
Non-magnetics from both magnetic separators are combined and sent to a small, sulphide
flotation circuit where sulphide flotation reagents, such as Copper Sulphate, Xanthate and
MIBC, will be added during a two-stage conditioning process. Flotation rougher concentrate
is pumped to a small cleaner circuit to remove entrained tin with the final sulphide
concentrate then being combined with the magnetics stream and pumped to the final tailings
facility where they will be contained under water to prevent oxidation.
17.4.6 Tin Shaking Tables Circuit
The non-sulphide material is pumped to the tin shaking table circuit (see Figure 17.4) which
consists of a dewatering cyclone and a series of 4 shaking tables used to produce a final tin
concentrate containing ±55% tin. The dewatering cyclone thickens the slurry to ±40% solids
which feeds a four-way distributor ahead of 4 shaking tables operating in parallel. Final
concentrates from the four shaking tables are combined and fed into a holding tank before
being pumped to filters for final dewatering. Table middlings are recycled back to the table
feed whilst table tailings are recycled back to the milling/classification circuit. The dewatered
tin concentrate filter cake will contain approximately 10% moisture and will be collected in
large one tonne super-sacs before being containerized and shipped to potential customers.
17.4.7 Bulk Sulphide Flotation
Gravity circuit tailings will be pumped to the bulk sulphide flotation circuit (see Figure 17.5)
comprising a single bank of rougher flotation cells where a sulphide concentrate will be
recovered. Potassium amyl xanthate (PAX) will be used as a collector with MIBC/TF250
208
added as frother. Provision is also included in the design and costing for the addition of lime
(for pH control) and copper sulphate although the Met-Solve testwork indicated these will
probably not be required.
The circuit is designed to maximize sulphide removal in order to achieve the targeted
<0.05% S in the final tailings. The tailings after sulphide removal will be filtered and the
cake transported by truck to the tailings facility where it will be used for capping as part of
the tailings facility remediation process.
17.4.8 Tailings and Sulphide Concentrates Storage
The tailings treatment circuit (see Figure 17.6) consists of a holding tank and a series of
pumps. There are two sections to tailings and sulphide concentrate treatment, the first
processes the tin tailings and the second handles the sulphide concentrate from the sulphide
removal circuits.
Tailings from the gravity circuit will initially be pumped to the existing tailings facility and
distributed appropriately across the facility (and below the current water line). Once the
existing facility is filled, the material will be deposited inside one of the existing, mined out
pits.
Sulphide/magnetics concentrate from the tin concentrate cleaning circuits will have a
separate holding tank and also be pumped to the existing tailings facility (initially) but to a
single, sub-aqueous location.
At the end of Year 5 of operations, the bulk sulphide flotation circuit will be installed to
reduce sulphur content of the gravity tailings to <0.05%. The sulphide concentrate will be
deposited under water inside one of the abandoned/mined out pits. Once the tailings facility
is fully capped, this large flotation circuit will no longer be used (See Environmental Section
20.0 for more details).
17.4.9 Flotation Reagents
Flotation reagents will be stored, mixed and pumped to specific addition points within the
process using dedicated variable speed dosing pumps (see Figure 17.7). Some of the reagents
will arrive on site in bulk and some will be in drums. The reagents include the following:
• Potassium Amyl Xanthate (PAX) – Collector.
• Methyl Isobutyl Carbinol (MIBC) – Frother.
• Lime- pH modifier (only used if required).
• Copper Sulphate- Activator (only used if required).

209
17.5 METALLURGICAL ACCOUNTING
Mechanical weightometers will be installed on the conveyors to the jaw crusher feed as well
as the feed to the ball mill to both measure and control feed rates onto the conveyors.
Mass flow systems and/or sampler facilities will be installed on the following process
streams:
• Jaw crusher product conveyor (weightometer).
• Crushed material to the ball mill (weightometer).
• Manual sampling of feed.
• Mill circuit product (automatic sampler).
• Final plant tailings (flowmeter, densitometer and automatic sampler).
• Feed to sulphide removal circuit (access for manual sample).
• Sulphide concentrate (access for manual sample).
• Tin shaking table concentrate (automatic sampler).
• Tin shaking table tailings (automatic sampler).
Samples will be taken several times per hour (frequency will vary depending on sample) and
eight-hour composites will be sent to the laboratory for analysis.
17.6 PLANT SERVICES
17.6.1 Compressed Air
The processing plant will have a small compressor to generate both plant air and
clean/instrument air (air which has been filtered and dried).
17.6.2 Raw Water
Raw water will be obtained from the existing supply and piped to a new storage tank. Fresh
water from this tank will be used to provide gland service water, reagent make-up water and
final concentrate filter wash water. Potable water also sourced from existing facilities will be
used only for ablution and human consumption.
17.6.3 Process Water
Process water will be used for the following duties:
• Comminution (mill dilution and screen sprays).
• Gravity concentrator circuits (flush water).

210
• Shaking Tables (wash water).
• Sulphide flotation circuits (launder sprays).
Process water will be recycled from the tailings treatment facility to both these circuits to
minimize fresh water consumption.
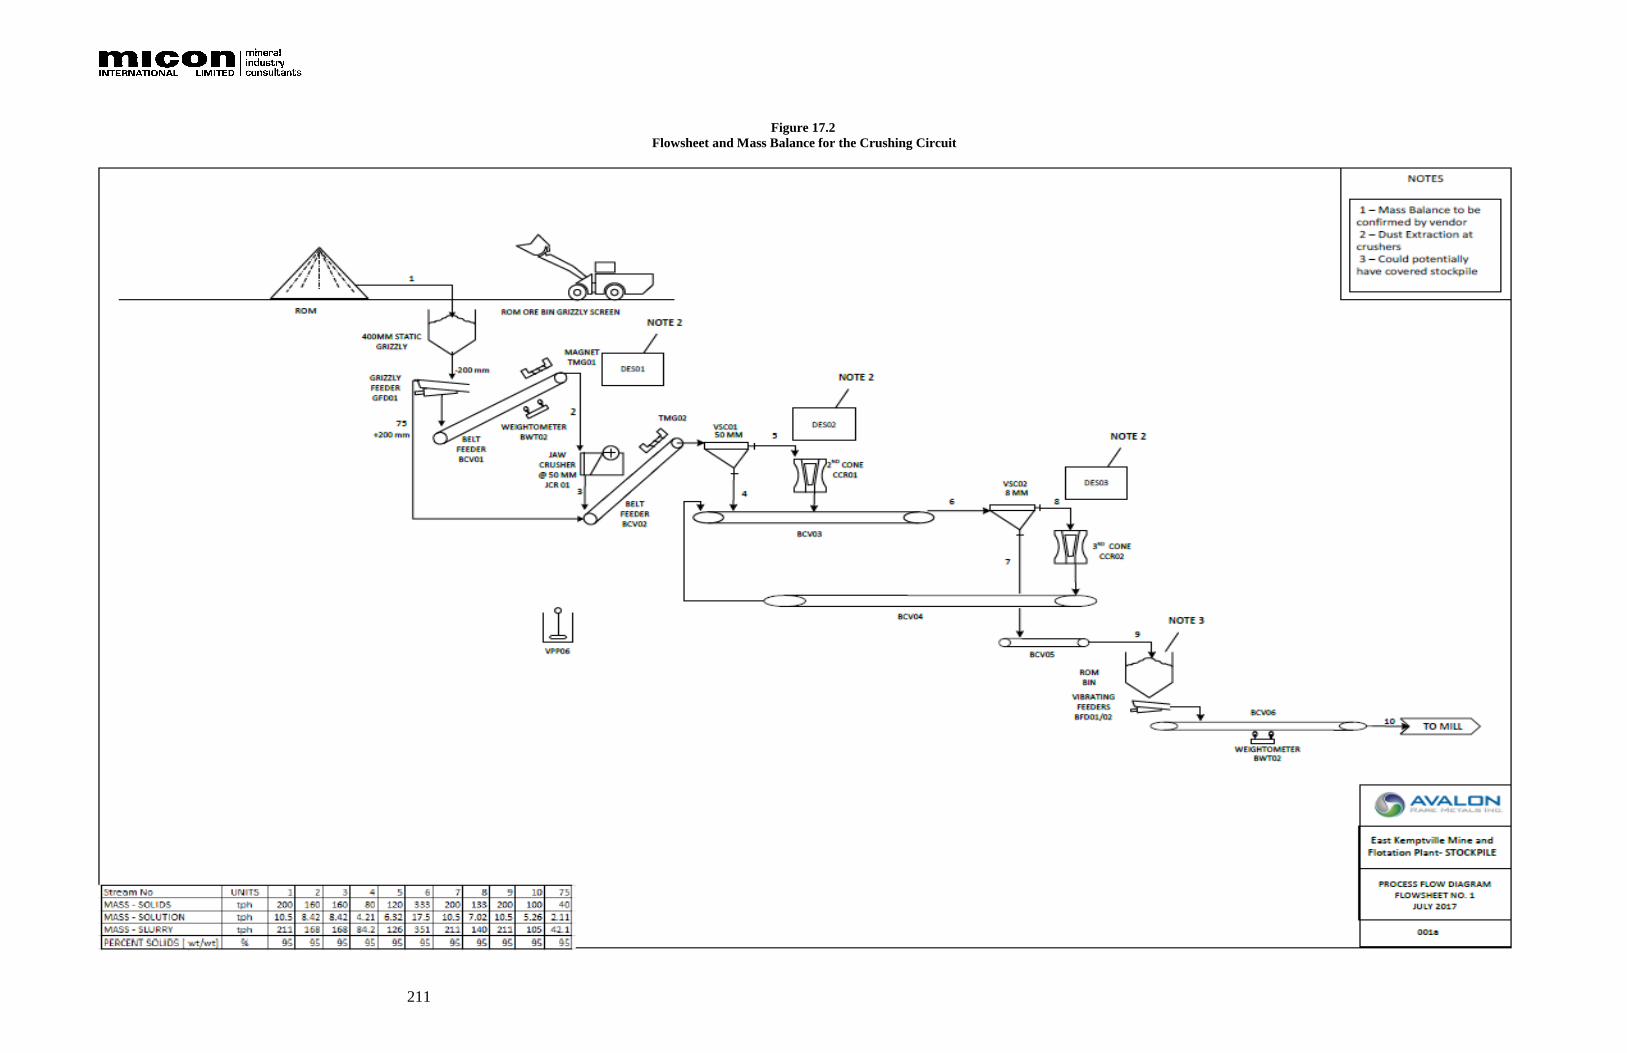
211
Figure 17.2
Flowsheet and Mass Balance for the Crushing Circuit
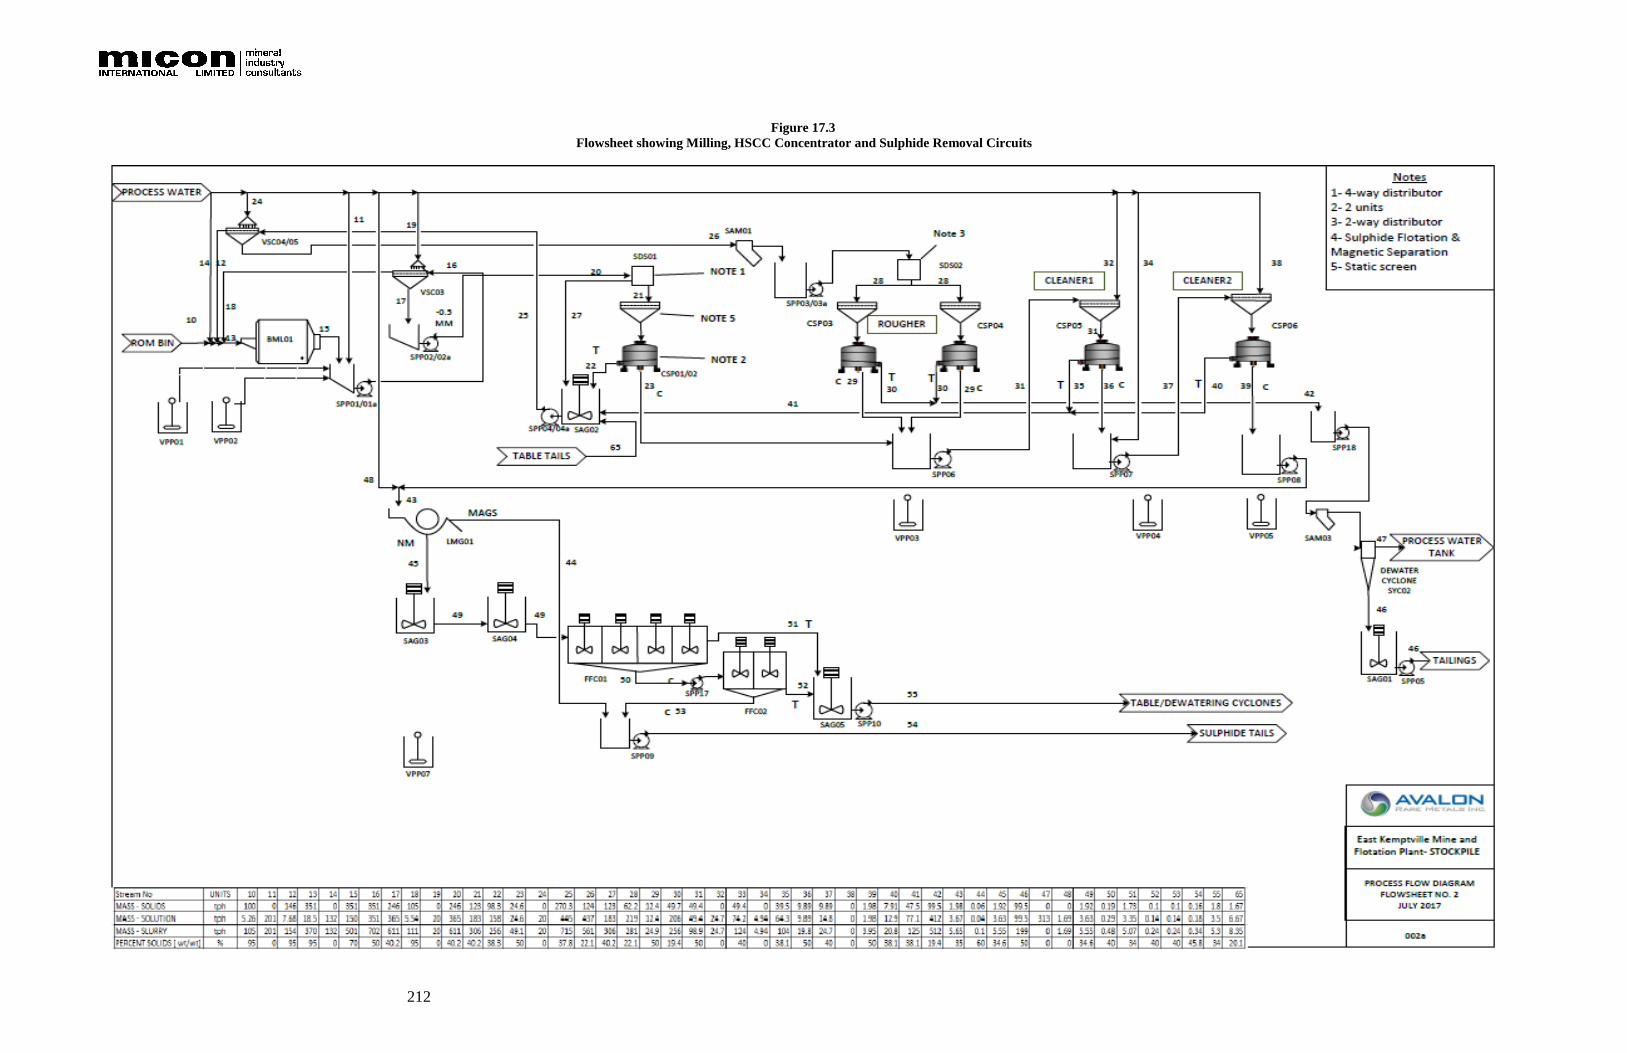
212
Figure 17.3
Flowsheet showing Milling, HSCC Concentrator and Sulphide Removal Circuits
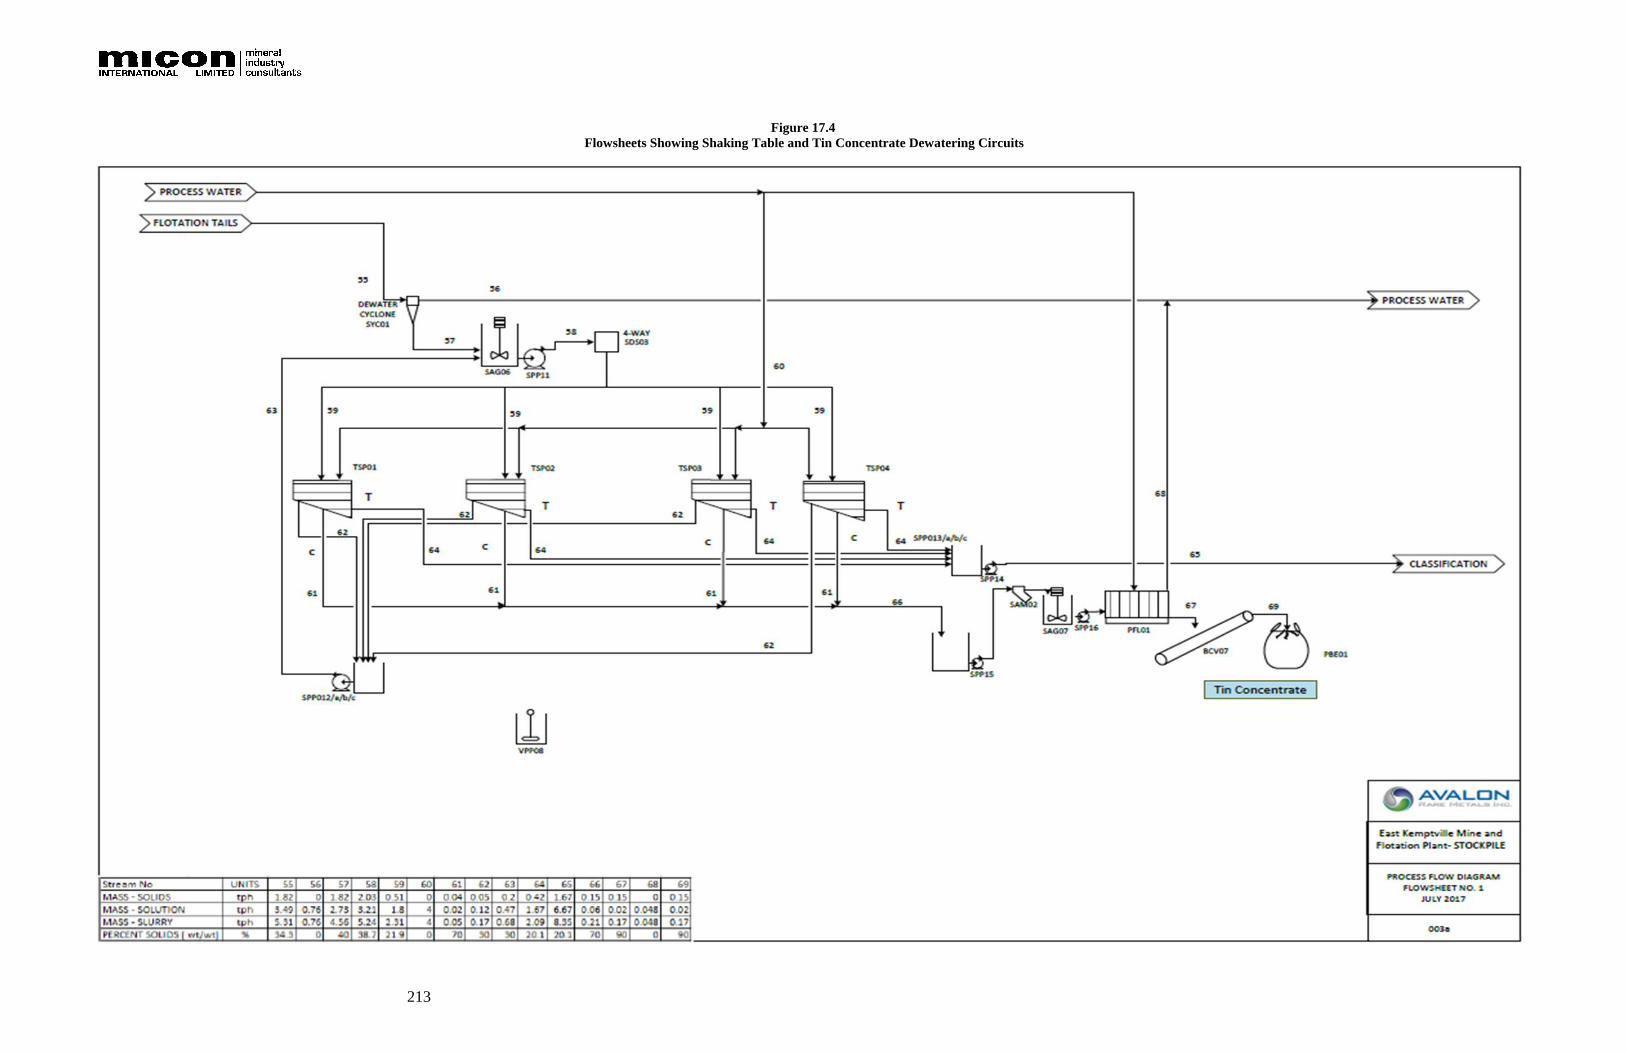
213
Figure 17.4
Flowsheets Showing Shaking Table and Tin Concentrate Dewatering Circuits

214
Figure 17.5
Flowsheets Showing Bulk Sulphide Flotation Circuits
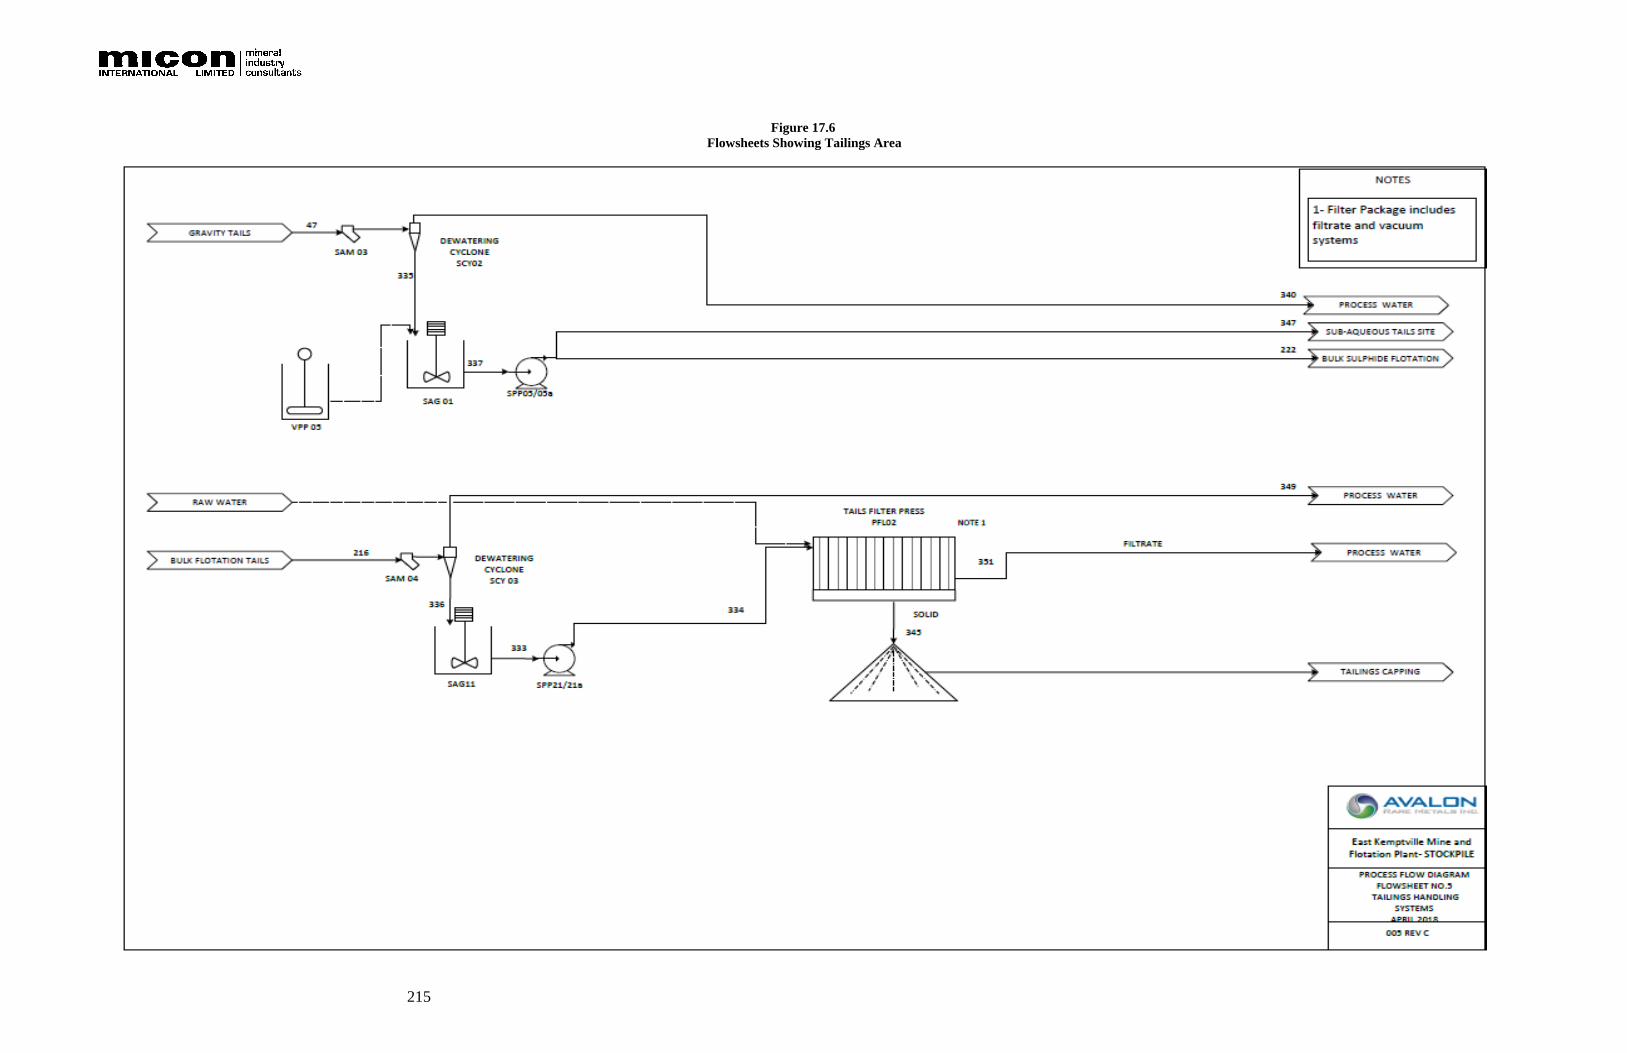
215
Figure 17.6
Flowsheets Showing Tailings Area
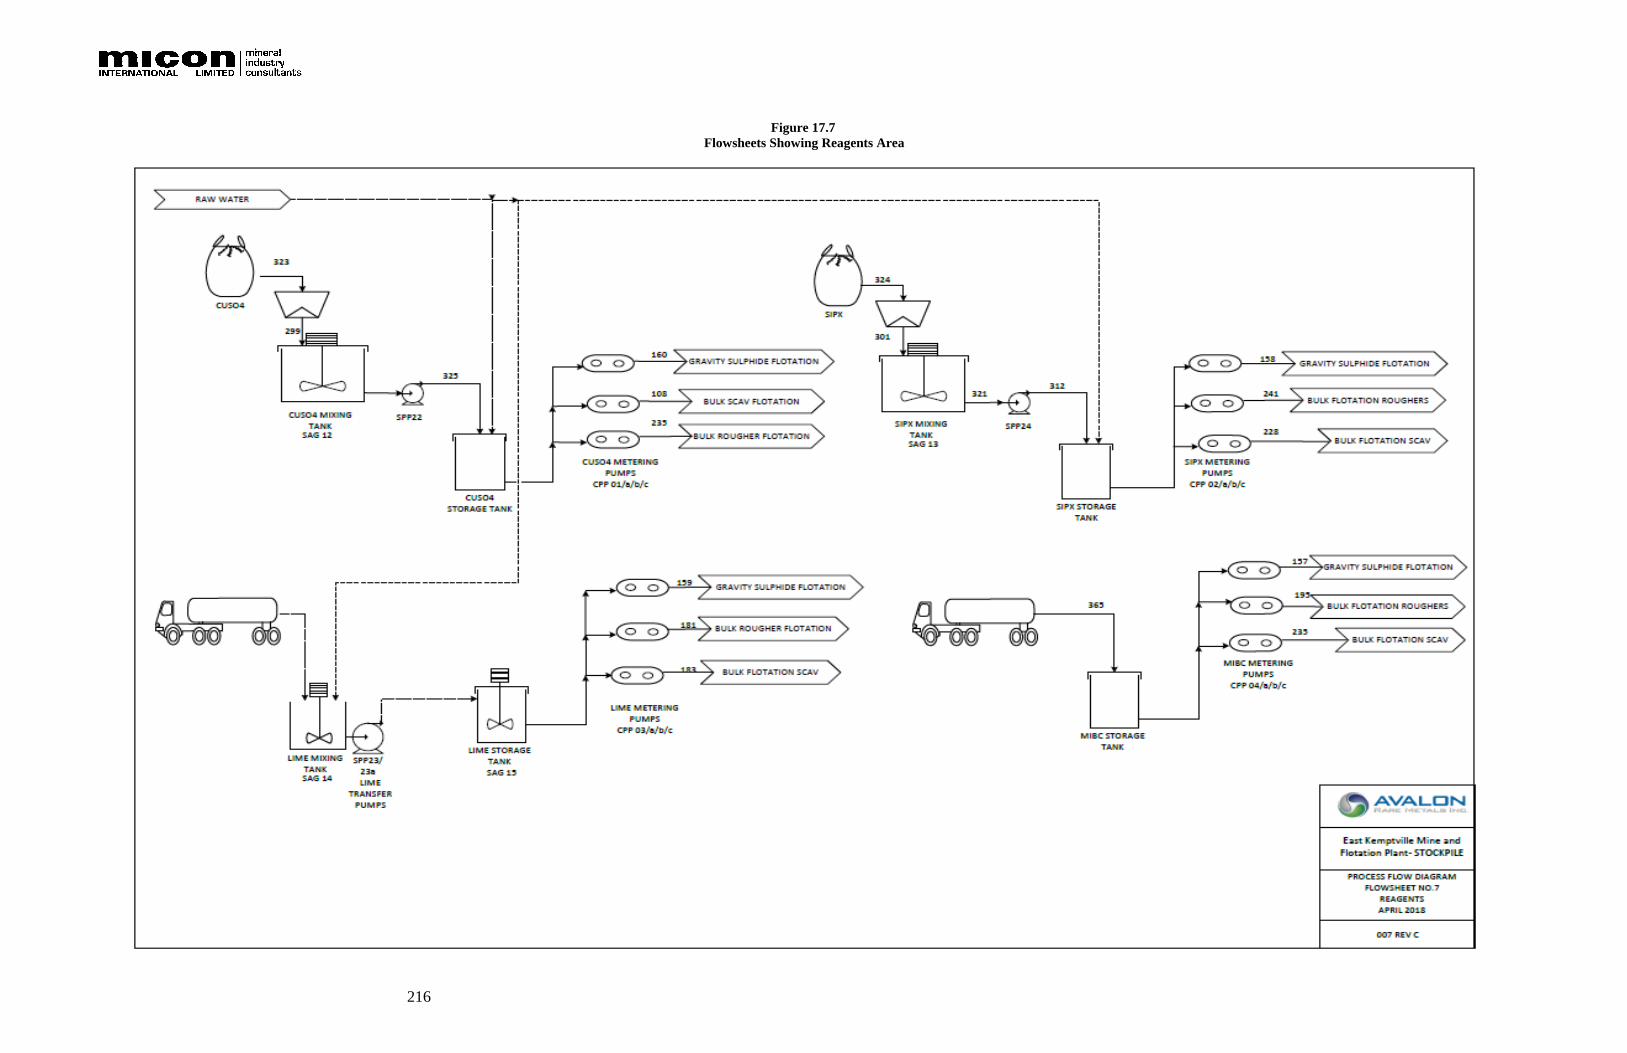
216
Figure 17.7
Flowsheets Showing Reagents Area
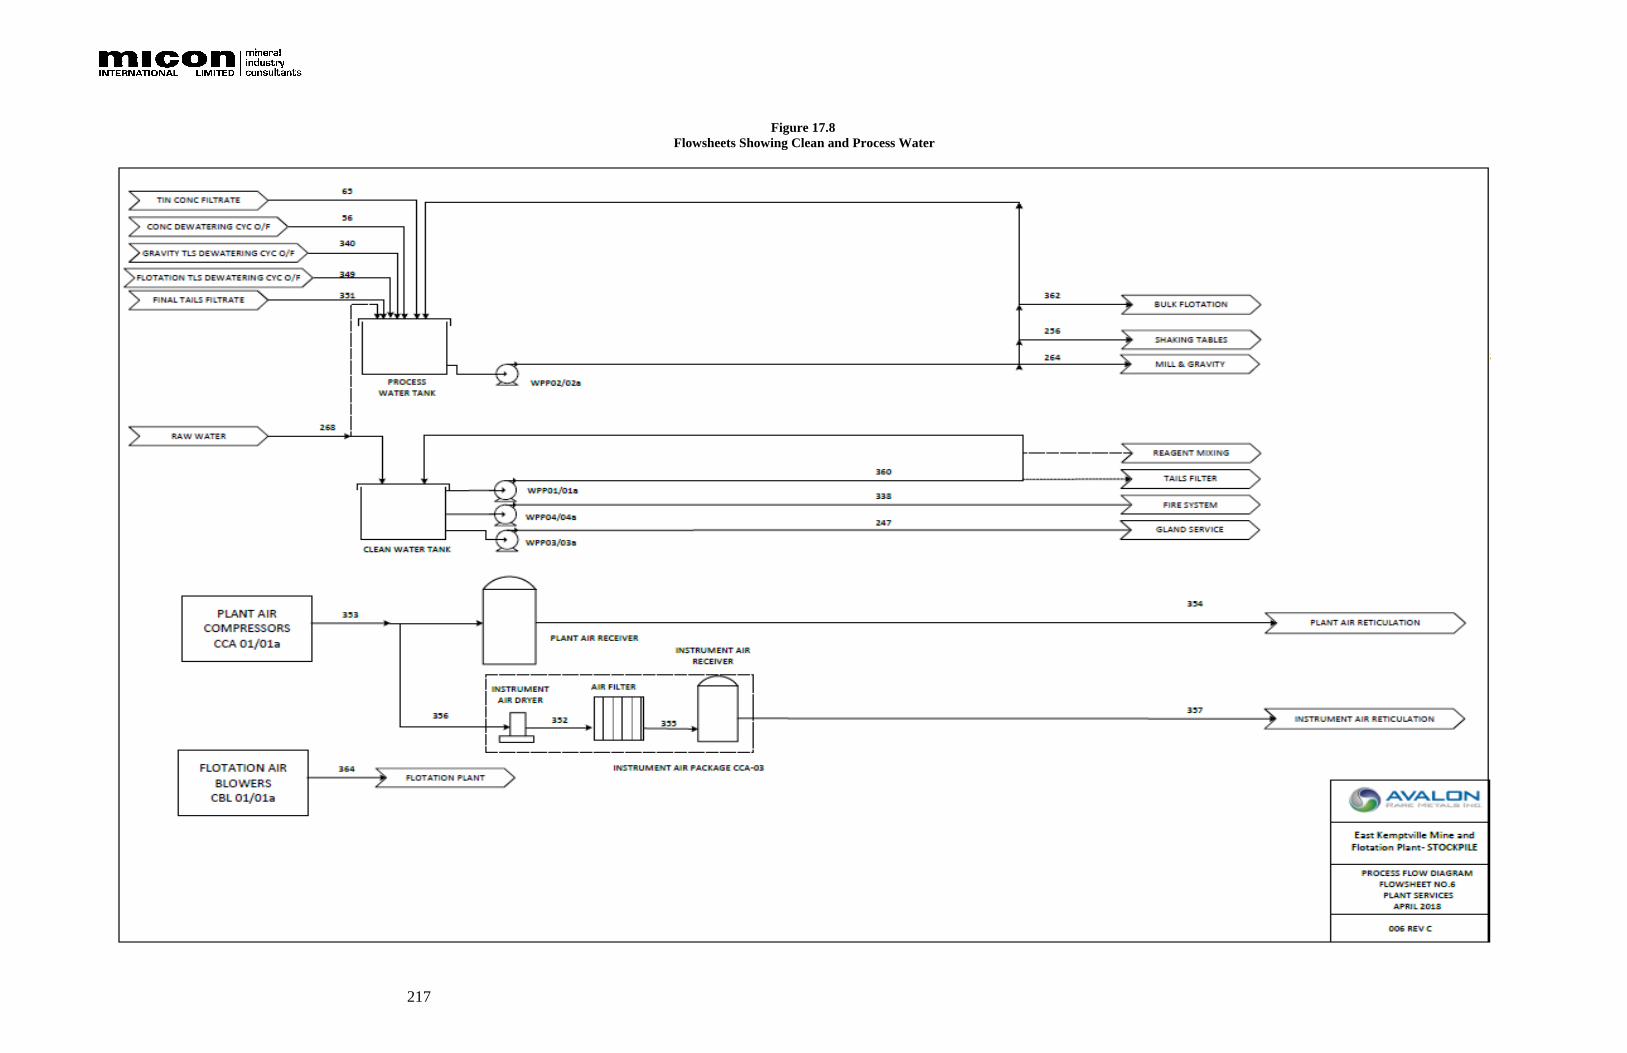
217
Figure 17.8
Flowsheets Showing Clean and Process Water

218
18.0 PROJECT INFRASTRUCTURE
The East Kemptville Project is located in Yarmouth County, in southwestern Nova Scotia.
The property is situated approximately 180 km southwest of Halifax, the provincial capital,
and 55 km northeast of the town of Yarmouth, a port town of 7,500 people.
Figure 18.1 shows the mine site in relation to major towns, roads and power lines.
Figure 18.1
Mine Location Map
18.1 ACCESS
Highway 203 was constructed in the early 1980s to help facilitate the transportation of
concentrates from the East Kemptville mine to the port of Shelburne. Connecting with
Highway 340, this highway links the Project site with the port towns of Yarmouth and
Shelburne. Shelburne is located on the Atlantic Ocean some 45 km to the southeast of the
Project site. The highway is currently in reasonable condition for about 30 km from the
junction with Highway 101 but does require some minor upgrading from there to the mine
entrance. It is anticipated that this upgrade will be carried out by the province of Nova Scotia.
An existing air strip near Yarmouth can be used for access from outside the area. The airport
has two asphalt-surface runways, one 5,000 ft (1,525 m) long, the other 6,000 ft (1,830 m)
long, and is capable of handling B737/A320 equivalent aircraft. Both Avgas and Jet A-1
fuels are available. There are four RNAV GNSS instrument approaches, VOR (VHF
omnidirectional range/distance measuring equipment) and NDB (non-directional beacon) and
a high-intensity approach lighting system.

219
Existing roads on site allow easy access to the entire site for operations and maintenance. A
new haul road will be required from the mine pits to the processing plant, but this distance
will be short.
18.2 SITE FACILITIES
18.2.1 Power, Fuel and Water
Primary power to the site will be provided by Nova Scotia Power. A 69-kV line is already in
place to the mine site to feed a new substation providing sufficient power for the mine
operations. A power distribution system will be established to feed power to the site as
required. Emergency/back-up power will be provided by a diesel generator.
Diesel storage and fueling stations will be provided on site for mobile equipment.
Raw water will be taken from the Tuskett River and stored in a tank at site to supply potable
water, fire water and process water top-up (process water will be recycled to keep make-up
water requirements to a minimum). Excess water will be treated prior to release to the
environment.
Process water will also be extracted from the two existing pits or recycled from the TMF in
order to minimize raw water consumption and to also make the pits accessible for mining.
A water treatment facility to treat run-off from the tailings is already in operation at the site,
consisting primarily of settlement ponds and lime treatment. This facility will be maintained
for ongoing operations and modified as required to meet the new project demands, though
minimal changes are anticipated to be required.
18.2.2 Buildings, Communication and Waste Handling
The intention is to erect a single pre-engineered and pre-fabricated building that can house
the main processing plant (excluding crushing circuit), stores and workshop areas all under a
single roof. Containerized/pre-fabricated administration offices, first aid/medical room, a site
laboratory and dry facilities will be provided, including lockers and change facilities for both
male and female workers.
Mine vehicle/mobile equipment maintenance facilities will be supplied by the mining
contractor.
Proven, reliable and state-of-the-art telecommunications systems will be provided at the site
for permanent operations and maintenance.

220
Waste materials (organic waste, hazardous and recyclable wastes, etc.) will be sorted on site
and disposed of off-site using local contracting companies or existing municipal handling
facilities.
There is sufficient infrastructure in the area to support the labour force required for the
Project operations, there will be no requirement for camp accommodations at site.
18.3 CONCENTRATE STORAGE AND SHIPPING
Concentrate will be bagged, containerized and stored at site before shipment on a regular
basis to the laydown area at the port in Shelburne or Halifax. On average, approximately 120
t of concentrate will be produced per month requiring the transportation of 4-5 truckloads per
month from the site to the port.
The dock at the port in Shelburne has a proven history of accommodating ships and ocean-
going barges. The dock is 20 m by 169 m with the ability to accommodate ships up to 190 m
in length. Water depths range from 9 m to 10 m at low tide. The dock is designed for axle
loads of approximately 10 t which will adequately accommodate the anticipated truckloads.
The port is regularly used to handle containers. Typical container ships docking at the port
are around 7,000 t and 130 m in length.
Near the dock is a 75 m by 150 m laydown area that could also be used to store concentrate
containers awaiting shipment. While the port is currently only handling approximately 200
containers per year, in prior years, the port has been able to process up to 150 containers per
month, more than what is anticipated for the Project. Facilities at Shelburne are illustrated in
Figure 18.2.
Figure 18.2
Aerial View of Ship-loading Facilities at Shelburne

221
19.0 MARKET STUDIES AND CONTRACT
For the purposes of this report, Avalon has undertaken an in-house analysis of the markets
for tin concentrates during the course of which it has consulted with industry participants and
specialist consultants. Avalon is a member of the International Tin Association (ITA)
(formerly the International Tin Research Institute (ITRI)) and has access to all the market
information that ITA provides to its members. While the current development model does not
contemplate recovery of copper and zinc/indium concentrates, these are potentially
recoverable in the future, and are included in some alternative development models. Recent
work has demonstrated that the zinc concentrate from East Kemptville would be enriched in
indium, a potentially valuable rare metal by-product.
In April 2018 ITA released its Central Forecast for tin in 2022 of USD25,000/t (Source: “Tin
Market Outlook” ITA presentation in Budapest April 2018).
The World Bank tin price forecast for 2020 is USD21,038/t and for 2025 is USD20,169/t
(Source: Commodity Markets Outlook, World Bank Group, April 2018).
For the purposes of this report, the price of USD21,038 /tonne has been used which is the
World Bank forecast for 2020 but also is consistent with the LME price for tin during the
first quarter of 2018 (USD21,187).
19.1 TIN HISTORIC PRICES
Tin prices on the LME were below USD10,000/t from 2000 to 2006 and then increased
dramatically in 2007 and 2008 to USD20,000/t before falling back to USD10,000/t in mid-
2009. Since 2009 the price has fluctuated in an upward direction and maintained an average
above USD21,000/t (See Figure 19.1). The low prices prior to 2008 did not encourage much
tin exploration or mine development, and price volatility has not encouraged significant tin
exploration since. As a result, there are relatively few new tin mines or projects that have
reached advanced stages of development in the developed world. The exception is in
Myanmar where ITA has reported on a surge of artisanal tin production in recent years with
concentrates being shipped to China for processing. It is unclear if this production is
sustainable over the longer term.
Prices in 2017 traded between USD19,000 and USD21,000 with an average of USD20,061.
In 2018 through March the price has averaged USD21,187/t on the LME.
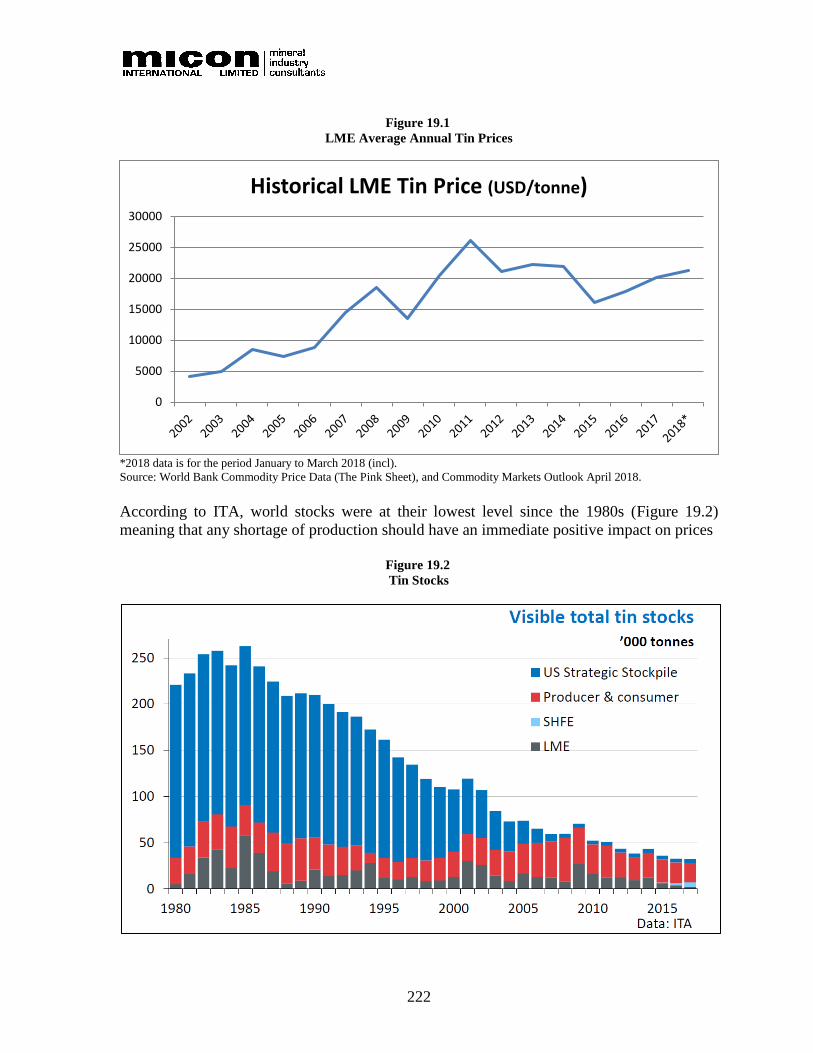
222
Figure 19.1
LME Average Annual Tin Prices
*2018 data is for the period January to March 2018 (incl).
Source: World Bank Commodity Price Data (The Pink Sheet), and Commodity Markets Outlook April 2018.
According to ITA, world stocks were at their lowest level since the 1980s (Figure 19.2)
meaning that any shortage of production should have an immediate positive impact on prices
Figure 19.2
Tin Stocks
0
5000
10000
15000
20000
25000
30000
Historical LME Tin Price (USD/tonne)
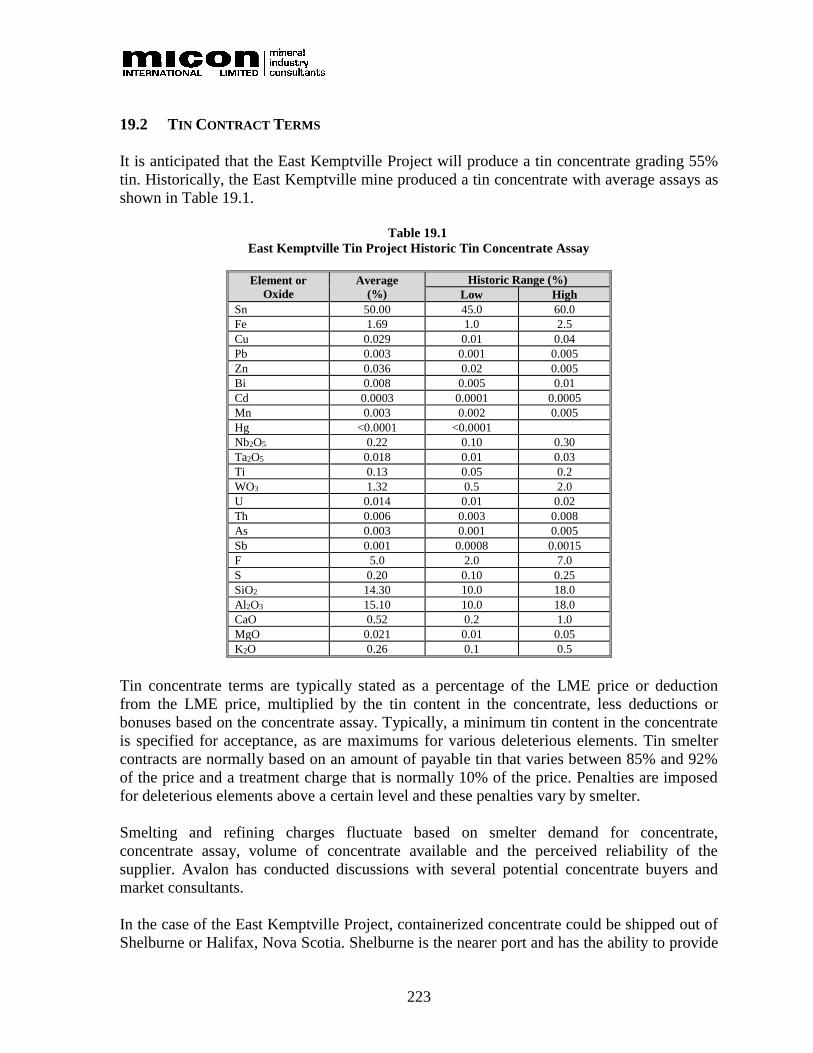
223
19.2 TIN CONTRACT TERMS
It is anticipated that the East Kemptville Project will produce a tin concentrate grading 55%
tin. Historically, the East Kemptville mine produced a tin concentrate with average assays as
shown in Table 19.1.
Table 19.1
East Kemptville Tin Project Historic Tin Concentrate Assay
Element or
Oxide
Average
(%)
Historic Range (%)
Low High
Sn 50.00 45.0 60.0
Fe 1.69 1.0 2.5
Cu 0.029 0.01 0.04
Pb 0.003 0.001 0.005
Zn 0.036 0.02 0.005
Bi 0.008 0.005 0.01
Cd 0.0003 0.0001 0.0005
Mn 0.003 0.002 0.005
Hg <0.0001 <0.0001
Nb2O5 0.22 0.10 0.30
Ta2O5 0.018 0.01 0.03
Ti 0.13 0.05 0.2
WO3 1.32 0.5 2.0
U 0.014 0.01 0.02
Th 0.006 0.003 0.008
As 0.003 0.001 0.005
Sb 0.001 0.0008 0.0015
F 5.0 2.0 7.0
S 0.20 0.10 0.25
SiO2 14.30 10.0 18.0
Al2O3 15.10 10.0 18.0
CaO 0.52 0.2 1.0
MgO 0.021 0.01 0.05
K2O 0.26 0.1 0.5
Tin concentrate terms are typically stated as a percentage of the LME price or deduction
from the LME price, multiplied by the tin content in the concentrate, less deductions or
bonuses based on the concentrate assay. Typically, a minimum tin content in the concentrate
is specified for acceptance, as are maximums for various deleterious elements. Tin smelter
contracts are normally based on an amount of payable tin that varies between 85% and 92%
of the price and a treatment charge that is normally 10% of the price. Penalties are imposed
for deleterious elements above a certain level and these penalties vary by smelter.
Smelting and refining charges fluctuate based on smelter demand for concentrate,
concentrate assay, volume of concentrate available and the perceived reliability of the
supplier. Avalon has conducted discussions with several potential concentrate buyers and
market consultants.
In the case of the East Kemptville Project, containerized concentrate could be shipped out of
Shelburne or Halifax, Nova Scotia. Shelburne is the nearer port and has the ability to provide
224
container service on a call basis but does not offer regular container service. For the purposes
of the economic analysis presented in this report, established rates from Halifax have been
used since it offers regular liner container services. The prime destinations for the
concentrate would be smelters in Europe (Belgium, Germany) and in Malaysia or Thailand.
Based on current shipping rates for 20-ft containers and assuming 20 t of concentrate per
container, shipping charges are estimated at CAD175/t concentrate to major European ports
(Antwerp or Bremen) and CAD225/t concentrate to ports in Thailand or Malaysia. These
charges include inland trucking costs from East Kemptville to Halifax.
Avalon has signed an indicative off-take agreement in the form of a non-binding
Memorandum of Understanding (MOU) with a well-known, large tin smelting company
(who wishes to remain anonymous for the time being) for all of the East Kemptville tin
production. Based on this MOU, the calculated price Avalon will receive for its tin
concentrate will be USD10,621/dmt (before freight charges of CAD225/t).
19.3 ZINC/INDIUM AND COPPER CONCENTRATES
The current, proposed Project does not make provision for the production of either a zinc or
copper concentrate, nor is any recovery of indium contemplated at this time. However,
Avalon will continue to monitor prices for these potential metal by-products and should the
production of concentrates of any or all become economically viable, the option will be there
to enlarge the operation to facilitate their recovery.
Historically the zinc concentrate produced at East Kemptville had high indium content which
would be a valuable by-product. Zinc smelters who recover indium are located in Canada
(Trail, BC), France, and Korea. Indium is relatively rare in the earth’s crust and total world
demand was just above 800 tons in 2016. Indium is used as an alloy material such as indium
tin oxide (ITO) which is used in flat panel displays, smart windows, electronics and thin film
photovoltaics for solar panels. Indium prices have been very volatile in recent years due in
part to the failed Chinese Fanya Exchange that helped fuel a price increase, and then a
collapse in late 2015 to USD270 per kg, its lowest price in 11 years. Prices in mid-2016 had
not yet recovered and were just above USD200/kg, however discussions with market
participants in April 2018 revealed that prices had firmed up to a range of USD330-
USD350/kg level.
19.4 CONTRACTS
In early 2018, Avalon entered into a non-binding MOU for the sale of all its production of tin
concentrate with a well-known company that owns a large tin smelter. The formula used by
this customer for determining concentrate pricing has been used by Avalon in the financial
model.
Avalon has not entered into any material contracts that are required for property
development.
225
20.0 ENVIRONMENTAL STUDIES, PERMITTING AND SOCIAL OR
COMMUNITY IMPACT
Following the completion of an environmental baseline study, impact assessment and
permitting, the East Kemptville mine operated between 1983 and 1992 at a production rate
approximately four times higher than that envisioned for the currently proposed Project.
After 1992, the mine entered a care and maintenance phase under provincial approval which
remains in place. The overall site is currently considered a brownfields site with ongoing
management and treatment of surface water.
The East Kemptville site has long-term surface and groundwater environmental liabilities
(RAL, East Kemptville 2017 Annual Report, 2018) that are the result of sulphide minerals
that remain in the pit walls, low grade and waste rock stockpiles, and tailings, all of which
generate acid mine drainage to a greater or lesser extent. At this time, these liabilities are
being effectively managed by the surface rights holder through the collection, treatment and
release of treated water. Compliance monitoring and performance of effluent treatment is
summarized in annual reports by the surface rights holder and submitted to the relevant
provincial regulators (RAL, East Kemptville 2017 Annual Report, 2018).
A three-party agreement between Avalon, Rio Algom (RAL, the surface rights holder) and
the Government of Nova Scotia will be required, prior to development of this Project, which
details how and when Avalon will assume care and custody of the closed site as a precursor
to new mining activities. A letter describing this requirement was signed by the Ministry of
Natural Resources (now Nova Scotia Energy and Mines) and Ministry of Environment. Other
than the long-term liability associated with the mine waste and water treatment requirements
noted herein, Avalon is not aware of any instances of fuel oil spills or other sources of
significant contamination, or any regulatory orders that have been issued against the site.
This information will be confirmed once the agreement, referenced above, has been finalized.
Construction and operation of the proposed Project is not anticipated to be subject to
approvals under the current Canadian Environmental Assessment Act 2012 (CEAA) as the
mine does not exceed any of the existing CEAA triggers, including mine and mill tonnages
and footprint expansion. The pending changes to federal environmental impact assessment
legislation are also not anticipated to require approvals from the Project; this will be
confirmed when the details of the finalized legislation are available. The Project is not
anticipated to have any substantive new impacts to terrestrial, fish or fish habitat, and will not
impact any federally designated wildlife conservations areas. The Project will be subject to
the Nova Scotia Environment Act and associated regulations (including the Environmental
Assessment Regulations), via the provincial “One Window” approach to mineral resource
development chaired by Nova Scotia Energy and Mines.
The proposed mine operations are an integral component of the overall mine rehabilitation
strategy and to mitigate the present and ongoing sources of environmental liability. The
brownfields site has known sources of acid mine drainage (AMD) to both surface and
groundwater. These are well understood by Avalon and appropriate mitigations and
226
monitoring for these historical impacts have been developed. An updated closure plan is
currently under development and will be a requirement of the Project permitting process.
20.1 ENVIRONMENT AND SOCIOECONOMIC CONDITIONS
20.1.1 Environmental Setting
Following the completion of an environmental baseline study, impact assessment and
permitting (East Kemptville Project Environmental Assessment, 1983), the East Kemptville
mine operated between 1983 and 1992 at a production rate approximately four times higher
than that envisioned for the currently proposed Project. In the early years of operation, a
discharge of elevated turbidity from the TMF occurred. Modifications to the management of
the TMF were immediately put in place and based on Avalon’s current understanding the
system has been operated successfully since that time. Upon cessation of mining, in 1992, a
closure plan was filed and accepted by the NSDNR, in 1993. All mill facilities were
decommissioned and demolished and portions of the Project site have been regraded and
revegetated. The tailings surface has been revegetated with on-going maintenance
periodically required. Much of the rest of the site has also been revegetated, but full
restoration to a natural state has not yet been undertaken. Waste rock stockpiles are sparsely
revegetating naturally.
The East Kemptville site has long term surface and ground water environmental liabilities
that are the result of sulphide minerals that remain in the pit walls, low grade and waste rock
stockpiles, and tailings, all of which generate AMD to a greater or lesser extent. These
drainages impact both surface run-off and groundwater. At this time, these liabilities are
being effectively managed by the surface rights holder through the collection, treatment and
release of treated water (East Kemptville 2017 Annual Report, 2018). Two water treatment
plants, seepage collection and pumping systems are currently in operation on the site to
manage the impacted waters. Based on informal discussions with the local regulators, no
known directives have been issued to the surface rights holder in response to any non-
compliance with conditions of the existing Industrial Approval (2009-06752). Extrapolating
current water quality trends (East Kemptville 2017 annual report, 2018) suggest that
treatment could be required for 40 years or more, especially in consideration of provincial
discharge and closure requirements and the application of the new MDMER requirements. It
is also anticipated, based on site water treatment experience, that as the water quality prior to
treatment slowly improves, it becomes increasingly difficult and expensive to treat the water
to acceptable metals concentrations. This now includes requiring the periodic addition of
flocculants to facilitate precipitation of metals, primarily zinc, and this use is predicted to
increase.
The Tusket River and, more recently, Big Meadow Brook adjacent to the Project and the
receiving waters for the treated mine effluent, support recognized sport fisheries. The Tusket
River watershed is also known to contain rare species of coastal plain flora, at distance,
downstream. Plant species of conservation concern are found in the wetlands, barrens and
along lake shores within the watershed.

227
As part of a comprehensive due diligence exercise, the surface rights owner has provided
Avalon with extensive background information of the site. This included the original
development Environmental Impact Assessment, details of the treatment systems (their
upgrades, procedures, maintenance, monitoring and performance), Dam Safety Reviews and
annual Dam Safety Inspection reports, as-built diagrams, historic and recent biological
studies, site water and ground water monitoring data and ground water model, annual reports
and meeting minutes with local NGOs. This information, where relevant, will contribute to
the Registration required for the proposed project under the Nova Scotia Environmental
Assessment Regulations.
Water quality is monitored according to the existing Industrial Approval (2009-06752) at
identified locations and frequencies. Some additional biological monitoring has voluntarily
taken place in the receiving water body by the surface rights owner; this is anticipated to
become a requirement, should Avalon re-start operations, due to new mining effluent
regulations that have come into effect since the original mine closure. This monitoring
includes water and sediment quality, along with an assessment of benthic invertebrate and
fish populations (Minnow Environmental Ltd., 2016).
Additional aquatic analysis was also completed to assess potential long-term risk for
parameters presently under review for changes to the Federal Metal and Diamond Mining
Effluent (MDMER) Regulations, which will apply if operation re-starts. An assessment of
potential optional and cost-effective treatment technologies is ongoing to address the
anticipated application of more stringent effluent standards. The existing TMF was originally
designed, optimized (once being used) and successfully operated for plant and water volumes
and associated reagent use much larger than the production rate proposed by this Project
(East Kemptville Project Environmental Assessment, 1983).
20.1.2 Socio-economic Setting
The East Kemptville site is located 55 km by road east of the town of Yarmouth, Nova
Scotia, and accessed from Yarmouth via Nova Scotia paved highways 340 to Carleton and
then 203 to the site. Yarmouth is on Highway 103 and Highway 101, 300 km by road from
Halifax. The town of Yarmouth has basic requirements for operations and would be, along
with Shelburne, the likely location for employees to reside, as well as the rural areas and
small communities in between. Yarmouth had its highest population, in 1961, at 8,636 and at
present is believed to be of the order of 6,700. The population has been dropping steadily in
recent years due to lack of economic opportunity.
The main economic activity of the community is lobster fishing although the Nova Scotia
government is attempting to promote tourism. There are no communities in the immediate
vicinity of the mine. In a direct line, one tourist operator is located approximately four km
from the site, as is the community of East Kemptville.
Avalon has initiated engagement with the local community. It has hired a local geologist and
drilling company to assist in supervising the initial drilling program. It has held positive
228
meetings with the Tusket River Environmental Protection Association, the Yarmouth Mayor
and key members of her team, and the Chambers of Commerce of Yarmouth and Shelburne,
with plans to expand this engagement in the future to the Municipality of Argyle and others.
Members of both provincial and federal government have also been regularly updated on the
Project and are also supportive. A recent meeting and site visit, on July 19, 2018, included
representatives from the Nova Scotia Department of Natural Resources, Department of
Environment, the Acadia First Nation Band along with Avalon and RAL. Given the
depressed level of industrial activity and following these preliminary discussions, community
support for the Project is anticipated. Ongoing engagement with other stakeholder groups is
also planned.
The Nova Scotia mining industry in this region has undergone a loss of employment in recent
years. In addition, employment in many other areas of the Nova Scotia economy has also
seen reductions. As such, it is anticipated that there will be an available educated workforce
for both construction and operations at the site, composed of both Indigenous and other local
employees.
20.1.3 Indigenous Communities
Avalon is recognized for its leadership in Indigenous Engagement and the province of Nova
Scotia is committed to the clear and transparent process for engaging Indigenous
government/communities. Avalon has already reached out to representatives of the Mi'kmaq
First Nation, specifically the Acadia First Nation Band, to inform them of recent small drill
programs and to initiate dialog. Recent discussions have included a Project overview, a site
visit and discussion on both operating and closure. Avalon also helped a local Mi’kmaq
business development organization to develop a core box construction business and supply
core boxes to the Avalon drill program.
20.2 ENVIRONMENTAL REGULATORY REQUIREMENTS
20.2.1 Provincial
The Nova Scotia government supports mineral development through its “One Window”
regulatory process to aid proponents with reviewing, permitting and monitoring mine
development projects in Nova Scotia. This includes the Nova Scotia Energy and Mines,
Nova Scotia Environment, Nova Scotia Department of Labour and other provincial, federal
and municipal agencies as determined on a project-by-project basis. Avalon has initiated
development of relationships with the regulators through participation in a multi-ministry
meeting, though this was based on a previous business model. Since then, the various
applicable regulatory agencies have been periodically updated in association with the
development of the current business model. A multi ministry meeting and site visit with key
provincial regulators and representatives of the Mi'kmaq First Nation was held most recently
in July 2018.
229
A three-party agreement between Avalon, RAL and the Government of Nova Scotia will be
required to determine Avalon’s responsibilities for the on-going care of the closed site, prior
to development of the currently proposed Project. A Mining Lease and Crown Land Transfer
under the authority of the Nova Scotia Energy and Mines is also required. These have been
initiated, and the final application is planned for September, 2018.
Avalon has been notified that a Registration under the Nova Scotia Environmental
Assessment Regulations is required for the proposed Project. It is anticipated, that a new
Industrial Approval (under Activities Designation Regulation) will also be required. Based
on preliminary discussions with regulators, it is expected that the Registration will be able to
rely on information available from previous and ongoing studies and monitoring reports
where applicable and will be supplemented with new information from limited field
programs. Other provincial environmental regulations that govern water quality, waste
management, fuel storage, air quality, wetlands and watercourses, among others, would also
apply. Discussions have been held with relevant provincial regulators toward streamlining
the regulatory approval process.
In addition to, ongoing surface and groundwater water quality monitoring and biological
aquatic effects assessment, long term leachate studies and detailed acute and sub-lethal
aquatic toxicity studies are ongoing to further assess and validate that the effluent treatment
system will continue to meet regulatory chemical and biological requirements (East
Kemptville 2017, Annual Report, 2018). A Species at Risk (SAR) study has been initiated
for breeding birds (complete), vegetation (September, 2018) as well as a wetland survey
(September, 2018). Risks to affect SAR species are considered low due to the disturbed
nature of the site and small footprint of new Project activities. This information will also be
used as components of Project Registration and provincial permit applications, for example
wetland alteration permits, if required.
20.2.2 Federal
The new Project is not anticipated to be subject to approvals under the current Canadian
Environmental Assessment Act 2012 (CEAA) as the mine does not exceed any of the CEAA
triggers, including mine and mill tonnages and increase in mine footprint. The pending
changes to federal environmental impact assessment legislation are also not anticipated to
require approvals from the Project; this will be confirmed when the details of the finalized
legislation are available.
The Project is not anticipated to have any substantive new impacts to fish habitat, regulated
by Fisheries and Oceans Canada or other areas of federal environmental regulation (e.g.,
migratory birds). While there has been an ongoing treated mine water discharge at site since
it began operations, effluent treatment studies with pilot plant and site water have been
initiated to assess if there would be any anticipated substantive changes to effluent quality
and quantity and thus the receiving waters of Big Meadow Brook and the Tusket River. It is
anticipated that the new Project will be subject to requirements under the Metal and Diamond
Mining Effluent Regulations (Fisheries Act).
230
20.3 WATER MANAGEMENT
A water management plan exists for the site, and a new plan will be required for new Project
activities for the Mining Lease and prior to construction. The quantity and quality details
below are based on the mine schedule and associated information used in the
production/financial model developed by Avalon and Micon.
The Tusket River and, more recently, Big Meadow Brook, both adjacent to the Project, are
recognized sport fisheries. The Tusket River is also known to contain rare species of coastal
plain flora at a distance downstream. Nationally endangered and threatened plants are found
in wetlands, barrens and along the lake shores in the watershed. There is some merit in the
present and potential future discharge providing a benefit to Big Meadow Brook and the
Tusket River in terms of fisheries habitat, by the neutralization of naturally occurring organic
acids that are generated upstream of the site by alkaline effluent from the Project.
Due to the small scale of the Project and plan to recycle water from the TMF, water volumes
from the TMF during operations are not anticipated to significantly change from present
discharges. During construction and the first year of operation, there will be an average flow
increase of approximately 35% during the period of pit dewatering, but these will remain
below historical peak discharge rates. Pit water will be pre-treated, in-pit, to ensure adequate
water quality prior to pumping for direct discharge to the receiver, thus not changing the
retention time and proven treatment capability of the existing TMF system. A preliminary
proven design for the removal and storage of sludges at the bottom of the two pits has been
costed, though it is believed there is opportunity to improve on this.
Water quality requiring treatment is also not anticipated to vary significantly from historical
operating concentrations, and operating volumes will be much smaller than the original
Project. Unlike the historical operations, virtually no reagent is planned in the early stages.
Gravity separation of tin only and potentially a small sulphide float to clean up the
concentrate (using a degradable flotation reagent and 100% recycle of this water) is planned,
such that no impacts to the operation of the existing proven effective water treatment facility
or the downstream receivers are envisioned. In conclusion, there will be no changes to the
water treatment systems, effluent quality and quantity or air emissions, and also no change in
the Project footprint (i.e., no new disturbed areas).
Planned operations are an integral component of the rehabilitation strategy and to mitigate
the present and ongoing sources of environmental liability. Tailings will be discharged and
deposited sub-aqueously, starting in the existing TMF in Years 1-4, to prevent oxidation and
acid mine drainage in perpetuity. In late Year 4, tailings will start being deposited in the
mined-out Baby Pit. Beginning in Year 6, an additional flotation step will become
operational in the concentrator to produce clean, low sulphur, low permeable tailings to be
placed on and become a clean cover for isolating the existing TMF. Thus, in Years 6-8, due
to the production of an estimated 500,000 tonnes/year of clean, low sulphur, low
permeability tailings from the tailing stream, significantly smaller quantities of sulphide
bearing tailings will be sent to the Baby Pit. The Baby Pit will be full to within

231
approximately one metre of the water surface early in Year 8. In Years 8-11, similar
quantities of tailing will be placed into the Main Zone Pit South. At closure, they too will be
permanently stored under water. The clean tailings will be placed as a cover on the existing,
coarse tailings pile in the TMF from Years 6-11. The minimum one-metre thick cover is
designed to isolate the TMF from water inflow (and to a lesser extent oxygen), thus
eliminating the TMF as a source of Acid Mine Drainage.
Process water discharged to the Baby Pit or Main Zone Pit will subsequently flow into the
TMF, thereby increasing water retention times and treatment efficiency during the periods of
additional flotation. The cover will be completed in Year 11. The cover will be progressively
remediated as it is deposited to prevent erosion. Monitoring and maintenance as required will
ensure a self-sustaining vegetated cover by the time the Project is closed in Year 19, as well
as validate the effectiveness of the strategy to prevent the release of acid mine drainage.
During Year 8, tailing will begin to be deposited in the Main Zone Pit and for the remainder
of the life of the Project. Once dewatered, water will initially be pumped from the Main Zone
Pit to the TMF until the end of mining in Year 16, after which time the pit will be allowed to
flood and gravity flow to the TMF once it is full. Revegetation in the TMF ponds can begin
in Year 5 and in the Baby Pit in Year 10. Thus, most of the site will be progressively
rehabilitated and there is significant time available to monitor the success of the overall
rehabilitation program and to fine tune it during operations if necessary, significantly
reducing the rehabilitation risk.
All waste rock for the purposes of this study is assumed to be acid generating. The rock from
the Baby Pit and the Main Zone Pit will be placed in the Main Zone Pit, either in areas not
planned for mining or in mined out areas as the Project progresses. The tailing produced in
Years 8-16 will also remain in the Main Zone Pit. All waste rock will remain underwater
upon cessation of mining and flooding of the Main Zone Pit. Tailings not utilized for the
tailing cover will be placed in the Main Zone Pit in Years 10 and 11. Given that all tailings in
Years 12-19 will be placed in the Main Zone Pit, flooding is expected to be completed well
in advance of mine closure in Year 19.
The Main Zone Pit has sufficient space for the remaining tailings and all the new waste rock
produced, which as currently designed will approach an elevation of 87.5 masl. Therefore,
approximately 0.9 Mm3 of additional capacity is still available at the end of the Project
should additional resources be developed elsewhere. Alternately, if necessary due to ongoing
generation of AMD from historical waste rock dumps, some of this excess capacity could be
utilized for placing these dumps underwater or being processed and placed underwater in the
Main Zone Pit. As such, all the potentially acid generating waste rock and tailings will
remain below the water surface and are eliminated as a source of AMD. In Years 15-19, the
remainder of the low-grade legacy stockpile will be processed until closure during Year 19.
No waste rock will be generated during this period, and all tailings will be placed sub-
aqueously in the Main Zone Pit. Thus, the low-grade stockpile is eliminated as a source of
AMD.

232
Studies have indicated that pit water from surface to bottom in both pits is already of a
quality close to or meeting effluent discharge criteria. A small amount of in-pit treatment will
be completed as necessary utilizing excess lime capacity in the existing treatment plants.
Most of the water is planned to be discharged directly to the receiving streams at or near the
final effluent once acceptable water quality is reached. Pumping will be initiated from the
Baby Pit during construction at a rate of approximately 230 m3/hour. This represents a 30%
increase relative to the last 7-year annual average discharge rate from the TMF, and
marginally higher than the maximum annual average rate in that time period and can be
managed to remain below peak discharge rates. However, the maximum pump rate will be
controlled to below historical maximum water discharge rates. This relatively small and
short-term increase in discharge rate is not anticipated to further impact the downstream fish
and fish habitat and is believed to be well below the discharge rates of the former operations
that operated at a tonnage rate of approximately 4 times the planned Project rate.
Once the Baby Pit is pumped out, pumping will begin in the Main Zone Pit. The total
pumping time is estimated to take approximately 2.5 years and is timed to meet the mining
needs and minimize additional flows to the receivers. This strategy will also maximize
retention time for the treatment of operational water in the existing TMF. An assessment of
this discharge on Big Meadow Brook and the Tusket River, as well as engaging with
communities of interest and regulators, is planned to select the preferred point of discharge to
ensure that no impacts result from pit dewatering. Both pits could be utilized to supply
process water to the concentrator to reduce both fresh water inputs and reduce the overall
discharge volumes to the receivers, but recycling from the TMF is the preferred option to
maximize retention time for process water treatment in the TMF. It is also planned to assess
the quantity of sludge presently in the TMF Sludge Pond, and pending the results, may also
have to be dredged and disposed of in a similar manner to the sludges in the two pits.
No new areas with fisheries or fish habitat will be utilized and further impacts to the
freshwater aquatic environment are not anticipated. Most process water will be recycled from
the TMF to minimize fresh water use and discharge volumes, and only a small volume of
fresh water from the large Tusket River will be required for the small operation. This water
will be treated and largely used for potable water purposes. There is an existing road and
power line to the site, such that approvals for these will not be required, except perhaps for
some upgrading. No camp is planned for construction or operations. Limited sewage
treatment is proposed using septic tanks and field bed. There will be no landfills established
on site during operations. All waste other than waste rock and tailings will be sorted and
temporarily stored on site prior to being sent to appropriately licenced waste management
facilities.
The brownfields site has known sources of acid mine drainage (AMD) to both surface and
groundwater. These are now well understood by Avalon and appropriate mitigations and
closure plans identified for these historical impacts have been developed, as well as any
impacts anticipated from future operations.
233
The surface rights holder has completed a number of studies in recent years, including a
Tailing and Water Management Optimization Study, a Hydrological Study, and a
Geotechnical Investigation of Tailings Dam and Coarse Tailings Pile, completed by
independent consultants who are expert in these areas. Annual Dam Safety Inspections and
periodic Dam Safety Reviews have been completed. These reports indicate that the existing
tailings facility stability is acceptable with ongoing management, and no remediation is
required. The tailings and water optimization study identified a number of upgrades to
improve water treatment efficiency and reliability which have subsequently been
implemented.
Avalon has evaluated the existing Tailings Management Facility (TMF) for use in future
operations from both a long-term facility safety/stability and tailings pond capacity
perspectives. Additional drilling has been completed in the area of the north facility to assess
long term stability as well as to measure tailings metal values for potential re-processing.
(Tailings reprocessing is not envisioned in this project model.) The additional study indicated
that the TMF is stable and identified additional mitigation measures will not be required.
Avalon proposes to utilize the pond sections only of the existing facility for sulphide bearing
tailings, and only in the first 4 years of operation. As the new tailings are anticipated to be
acid generating, all the sulphide bearing tailings will be placed a minimum of one metre
below the existing water surface to prevent oxidation and the formation of AMD. The one
metre cover to be placed on the existing tailing pile will have the additional benefit of
lowering the water table in the tailing pile, further improving TMF stability.
An assessment of the quantity and quality of the treated metal bearing sludge presently
located in the bottom of the two pits has been completed. A complex treatment strategy to
manage this material has been developed and costed. Opportunities to optimize this strategy
will be more fully assessed during the Feasibility Study. For example, the material in the
Main Zone Pit could be pumped into the Baby Pit.
20.4 MINE CLOSURE, WASTE MANAGEMENT AND PROGRESSIVE REHABILITATION
A mine closure plan exists for the site, but a new plan will be required for new Project
activities for the Mining Lease and prior to construction. The quantity of tailings and waste
rock produced as detailed below is based on the mine schedule used in the
production/financial model developed by Avalon and Micon. This Project’s primary
objective is to economically reduce or eliminate the long-term environmental liability of the
site. This includes the elimination of the existing perpetual treatment strategy by permanently
stabilizing the site such that ongoing treatment of AMD will no longer be required. The
strategy’s objective is to eliminate the water treatment risk and also to reduce the already low
physical risk associated with the facilities. By implementing a low permeability cover on the
existing Coarse Tailings Pile (CTP), water levels in the CTP would remain at permanently
low elevations and thus lower the risk of CTP failure. The extensive progressive remediation
built into the development model and identified below is anticipated to enable some of the
financial assurance to be returned during the life of the Project.
234
The strategy for a “walk away” closure involves progressively isolating all potentially acid
generating waste rock and tailings from oxygen and/or water. This either stops oxidation and
the formation of AMD or prevents the flushing of oxidized materials into the environment.
The strategy proposed includes:
1. Processing of the low-grade stockpile and placing the resulting tailings a minimum of
one metre below water in the TMF and the pits. This reduces oxygen exposure to very
low concentrations and reduces the production of AMD to acceptable levels. This
eliminates the coarse stockpile as a major source of AMD. If required, waste organic
materials may be added once deposition is completed to aid natural regeneration of
wetland vegetation to further stabilize the sulphides by aiding in the generation of
anaerobic reducing conditions. In the unlikely event of a small quantity of sulphide
remaining, the goal would be to naturally treat this by creating wetland conditions.
2. Isolation of the existing tailings management facility CTP with a low permeability
clean tailings cover. This would reduce water and oxygen penetration and eliminate
the flushing of historically oxidized products into the environment. The cover would
then be progressively revegetated for stability, aesthetics and beneficial reuse by biota
during operations. Beneficial reuse by stakeholders for agricultural production is also
being discussed.
3. Placement of all waste rock produced during mining of both pits into the Baby and
Main Zone Pits where it will be flooded on closure. Again, the objective would be to
prevent the oxidation of sulphides and the generation of AMD.
4. Assess the North and South Waste Dumps to determine their contribution to the site
AMD. Given that they both contain relatively low-grade materials and they have been
oxidizing for many years, they are less likely to be significant sources of AMD at
closure. Should this assumption be determined to be incorrect, remaining acid
generating materials could also be relocated at minimal cost into the Main Zone Pit,
either through direct trucking or through processing, whichever is more economic.
The Baby Pit will be dewatered during construction. The Main Zone Pit will be dewatered by
the end of Year 1 or very early in Year 2. The first year of operation will only utilize material
from the Low-Grade Stockpile and tailing will go underwater in the TMF ponds. The mining
of the Baby Pit is planned in Years 2 and 3 which has the additional benefit of generating
space for the tailings deposition beginning in late Year 4. During the mining of the Baby Pit,
the tailings will also be placed in the TMF ponds. Mining of the Main Zone Pit begins mid-
Year 3 until Year 14. During Years 6-11, a clean tailings cover will be used to cover and
isolate the existing CTP. During Years 7-12, the cover will be progressively revegetated, and
the impact of the clean cover can be monitored to demonstrate the effectiveness of the cover
and vegetation to isolate the pile and prevent release of acid mine drainage. Tailing will
begin being placed in the Main Zone Pit when the Baby Pit tailing reaches one metre from
the water surface in late Year 8. The low-grade stockpile will be processed during the full life
of the Project and the tailings placed underwater in the mined-out pits and TMF.
In order to develop the waste rock and tailings management strategy for the Project, an
assessment of the new waste rock and tailings volumes and the existing volumes presently

235
available in the TMF, Baby Pit and Main Zone Pit was completed. The key objectives were
to:
1. Confirm that there was sufficient space to place all future potentially acid generating
waste rock and all acid generating tailings under water with a minimum 1 metre water
cover to prevent oxidations, with an objective to allow a “walk away” closure plan for
these materials.
2. Minimize waste rock and tailings management costs.
3. Continue to utilize the existing proven TMF for all mine tailings and surface runoff
water treatment during operations.
Hydrometallurgical testing was completed and demonstrated that sufficiently low sulphide
“clean” tailings can be produced with the necessary physical characteristics to act as a low
permeability cover for the CTP.
In an effort to be conservative, all waste rock and the non-desulphurized tailings were
assumed to be acid generating. Conservative estimates of the density of waste rock and
settled tailings were utilized. It was assumed that all tailings would be placed underwater
except when the clean tailings cover material is produced from mill feed sourced from the
Main Zone Pit mineralization. Approximately 1.7 Mm3 (2.7 Mt) of desulphurized low
permeability tailings (at less than 0.1% S and <1x10⁻⁴ cm/s permeability) will be placed on
the TMF. This is generated from approximately 65%, or 500,000 t/y of the mill feed shipped
in Years 6-11 that will be processed through the additional flotation circuit to produce a low-
sulphur, low permeability cover that will isolate the existing tailings management facility as
part of the closure plan. Since the existing low-grade stockpile sulphides are significantly
oxidized, efficient sulphide removal from the stockpile material is anticipated to be
problematic, such that fresh mineralization is required to produce this cover. For this reason,
un-oxidized mineralization from the Main Zone Pit is proposed for this.
To accomplish this and maintain a sufficiently positive cash flow to achieve a “walk away”
scenario, in Year 5 and to confirm that adequate space is available for subaqueous tailing
disposal, a flotation circuit will be installed in the concentrator to float the sulphides from the
tailings of the un-oxidized Main Zone mineralization. This circuit will produce fine, low
permeability clean tailings that can be utilized to cover and isolate the existing TMF coarse
tailings pile. The sulphide bearing float will be disposed of under water in the Baby Pit and
Main Zone Pit or potentially sold if an interested buyer can be identified. By isolating the
existing CTP tailings in this manner, oxidation products that presently contribute to acid
mine drainage are permanently contained in the coarse tailings pile. This will eliminate the
need for long term acid mine drainage treatment from this source. A 65% recovery of clean
tails from the un-oxidized mill feed from the Main Zone Pit will provide the required
quantity of “clean” tailings cover during Years 6-11.
The assessment included an analysis of when the various storage locations would become
available in comparison to when the materials would be produced. Based on this conservative
analysis and schedule proposed, it was determined that there will always be ample
236
underwater storage capacity for all the tailings and waste rock produced. The mine plan
sequence was specifically designed to provide safe, adequate access for simultaneous mining
and tailings backfill operations by ensuring that tailings fill would remain 1 metre below
active haulage areas at all times (See Figures 16.6, 16.7, 16.8). The process for mining and
placement of waste materials is as follows:
Year 1: All new tailings from processing of the low-grade stockpile will be placed one metre
below the water surface of the existing TMF. There is no waste rock produced in Year 1 as
the plant feed comes from the low-grade stockpile.
Years 2 to 9: The waste rock from the Baby Pit and Main Zone Pit will be direct-shipped to
four different waste areas located within the Main Zone Pit as discussed in Section 16. All
tailings are directed to the TMF in Years 2 to 4.
Late Year 4: When the TMF is filled to one metre below the water surface in late Year 4, all
tailings from the Main Zone Pit and Low-Grade Stockpile will then begin to be placed in the
Baby Pit (which will be mined out in the current mine plan). This will be sufficient until
early in Year 8 when mining of the deep Main Zone South Pit will be complete.
Year 6 to 11: The production of the clean tailings cover will begin and be placed on the
coarse tailing pile of the TMF. Progressive revegetation of the clean tailings cover will be
completed in Years 7 to 12. The remaining tailing will go either into the Baby Pit (until Year
8) or Main Zone Pit.
Year 15 to 19: After the end of open pit mining in Year 14, the tailings from the final 5 years
of stockpile processing can be placed in the Main Zone Pit. No waste rock would be
produced after Year 14. At the end of operations as per this scenario, assuming
approximately 1.7 Mm3 of clean tailings are placed on the TMF, there will still be
approximately 0.9 Mm3 of storage space available in the Main Zone Pit should additional
capacity be required for processing of material from other mining areas or utilized to relocate
any other waste dumps that continue to generate AMD at that time.
A more detailed mine and waste storage area plan, reflective of the envisaged post-closure
uses currently under discussion with stakeholders and regulators, will be prepared during the
detailed engineering phase of the Project.
20.4.1 Progressive Rehabilitation
Once the TMF ponds are full after Year 4, field studies to initiate the development of wetland
habitat on them will be initiated. Depending on water quality and runoff from the coarse
tailing pile, this wetland may begin to be progressively established immediately. However, it
may be required to wait until some or all of the CTP cover is in place in Year 11 that will
stop AMD entering this area from the CTP. Note that the generation of the wetland habitat is
not required for long term tailing stabilization, but is done for environmental benefit.
237
At the point where processing is complete, the Baby Pit will have been flooded for
approximately 10 years. Over this time period and starting in about Year 9, utilizing the high
quality, high pH treatment plant discharge water, any latent AMD is anticipated to have been
treated in situ, and stable good water quality is anticipated to have been achieved. As with the
TMF, adequate time will be available to progressively establish, monitor and fine tune a self-
sustaining wetland ecosystem utilizing locally available waste organic materials. The
objective of this additional level of protection and habitat generation would be to maintain
anoxic sediments, prevent tailings oxidation and remove metals from solution, but is not
required for long term tailing stabilization. In consultation with the government and local
communities of interest, cooperative efforts to establish the endangered Blandings Turtle,
known to be present in the nearby Tobeatic Wilderness Area, will be considered for the Baby
Pit. Similarly, moose may also be able to utilize this habitat.
At Year 12, the historic tailings will also have been covered and progressively revegetated.
Monitoring of groundwater and runoff over the life of the mine and especially following the
reclamation of the TMF will measure the effectiveness of the strategy and allow for any
required fine tuning well in advance of final closure in Year 20. Runoff and associated AMD
from the CTP is anticipated to have been eliminated by this time.
During Years 15-19, in addition to the water associated with the final tailing deposition into
the Main Zone Pit, treated water can be diverted from the TMF to aid in flooding the Main
Zone Pit with alkaline water to stabilize any remaining oxidized material in the Pit. A thin
layer of organic material can be placed on areas that will be sufficiently shallow to support
and maintain wetland vegetation to accelerate and aid in maintaining water quality
stabilization. Monitoring of the TMF runoff and Main Zone Pit water quality will continue
until clean water quality has have been permanently established, with lessons learned from
the stabilization of the Baby Pit and TMF over the previous decade or more. The flooding
and establishment of stable acceptable pit water quality from the Main Zone Pit is estimated
to take 1-3 years following the end of production. Seepage water collection, treatment and
monitoring will continue during this period if required and until such time as the cover has
demonstrated that seepage and run-off have improved to acceptable water quality. If there are
discharges to the environment from the TMF, monitoring of this will also continue although
at least some of this treated water in the early years is anticipated to be utilized for the
flooding of the Main Zone Pit.
It is noted that discussions with local stakeholders has indicated an interest in utilizing the
TMF for beneficial agricultural uses, as has been done in other TMF’s in Canada, or
potentially for green energy production with solar panels. These discussions will continue.
Avalon is also in discussions with local universities to discuss potential crops. Other mines
have successfully produced corn, hemp and canola utilizing waste organic covers on TMF’s.
These will be considered as well as others that may be recommended by Nova Scotia
agricultural or traditional knowledge experts.
While engagement on the closure plan will have been ongoing, at this point, if there is a
beneficial reuse for any of the buildings or infrastructure on site, in agreement with the new

238
owner and the government, a plan will be developed to transfer the responsibility for that
infrastructure to the new owner. This could include maintenance, office or warehouse
facilities or agricultural production for example. To the extent practical, remaining
equipment and infrastructure will be dismantled and sold for reuse or recycling as scrap.
Concrete walls will be knocked down and placed in the Main Zone Pit to add additional
alkalinity and clean cover material. This is not anticipated to be required but is a cost
effective and environmentally friendly option for the small quantity of alkaline concrete. All
remaining unused infrastructure will be removed. All concrete pads will either be placed in
the pit or be broken up and covered with organic material and revegetated. At this point and
once the pit water qualities are stable, the bulk of the site may be returned to the Crown.
If financial assurances have not been previously returned due to the progressive remediation
identified above, as no ongoing water collection and treatment will be required, and the site
will be revegetated, most of the financial assurance can then be returned. During operations,
opportunities to permanently stabilize the tailings facility dam slopes to eliminate the need
for their long-term care and maintenance will be evaluated and implemented, such as the use
of available barren pit waste rock for slope protection and stabilization. Once implemented,
and the tailings cover performance is proven and effluent quality is acceptable, the site will
be in a permanently stable configuration and the full financial assurance can be returned.
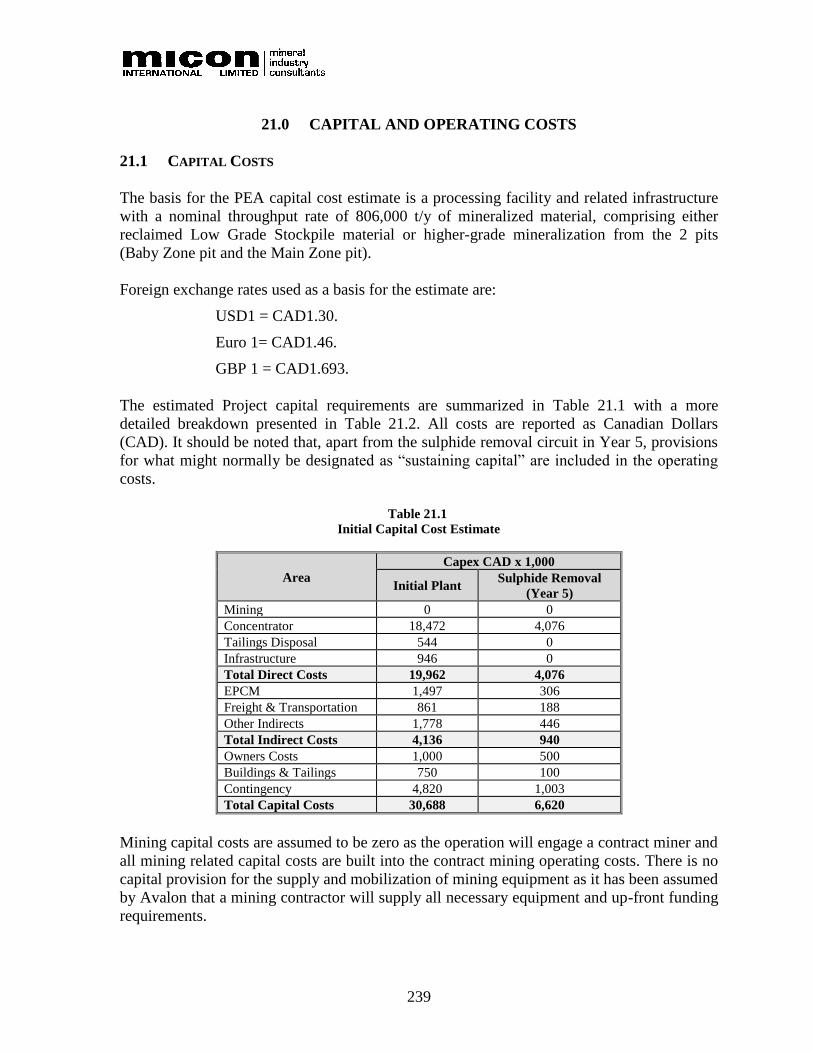
239
21.0 CAPITAL AND OPERATING COSTS
21.1 CAPITAL COSTS
The basis for the PEA capital cost estimate is a processing facility and related infrastructure
with a nominal throughput rate of 806,000 t/y of mineralized material, comprising either
reclaimed Low Grade Stockpile material or higher-grade mineralization from the 2 pits
(Baby Zone pit and the Main Zone pit).
Foreign exchange rates used as a basis for the estimate are:
USD1 = CAD1.30.
Euro 1= CAD1.46.
GBP 1 = CAD1.693.
The estimated Project capital requirements are summarized in Table 21.1 with a more
detailed breakdown presented in Table 21.2. All costs are reported as Canadian Dollars
(CAD). It should be noted that, apart from the sulphide removal circuit in Year 5, provisions
for what might normally be designated as “sustaining capital” are included in the operating
costs.
Table 21.1
Initial Capital Cost Estimate
Area
Capex CAD x 1,000
Initial Plant Sulphide Removal
(Year 5)
Mining 0 0
Concentrator 18,472 4,076
Tailings Disposal 544 0
Infrastructure 946 0
Total Direct Costs 19,962 4,076
EPCM 1,497 306
Freight & Transportation 861 188
Other Indirects 1,778 446
Total Indirect Costs 4,136 940
Owners Costs 1,000 500
Buildings & Tailings 750 100
Contingency 4,820 1,003
Total Capital Costs 30,688 6,620
Mining capital costs are assumed to be zero as the operation will engage a contract miner and
all mining related capital costs are built into the contract mining operating costs. There is no
capital provision for the supply and mobilization of mining equipment as it has been assumed
by Avalon that a mining contractor will supply all necessary equipment and up-front funding
requirements.

240
The crusher plant has been sized at double the capacity of the concentrator to facilitate a
single 12-hour shift for crushing.
The Project intends making use of the existing tailings facility for tailings disposal in the
early years of operation, followed by back-filling of the pits once mining operations have
ceased.
Excluded from the pre-production capital cost estimate is the allowance for dewatering the
two pits. This amount is estimated at CAD850,000, which increases the estimate to CAD31.5
million.
The concept of having most of the plant pre-assembled off-site and delivered in modules
(fully or partly assembled) has been assumed for much of the equipment and facilities in
order to reduce on-site construction activities.
21.1.1 Concentrator Direct Capital Costs
Based on the results of the various testwork programs, process flowsheets and mass balances
were generated together with a detailed equipment list, and process design criteria. From this
information, preliminary equipment duties have been determined and budget prices received
from qualified vendors. For some of the smaller items, Avalon has used costs from other
studies with a similar size or type of equipment.
The pricing of the crushing plant is based on a modular type facility as used in many quarry-
type operations.
Site and plant maintenance costs and a provision for site closure are included in operating
expenses so no sustaining capital is indicated.
Factors for each area of the processing facility were applied to estimate the associated direct
and indirect costs for civil and earthworks, concrete, structural steel, plate-work, piping and
electrical/instrumentation. These factors are based on in-house expertise and other similar
sized Projects.

241
Table 21.2
Detailed Breakdown of Initial Capital Cost Requirements
Sub Civil & Structural Platework Piping Electrical & Total
Equipment Installation Total Concrete Steel Instrumentation CAD
DIRECTS
Crushing Circuit % 5% 7.5% 2.5% 2% 1% 7.5%
CAD $ 3,210,116 160,506 3,370,622 252,797 84,266 67,412 33,706 252,797 4,061,599
Grinding Circuit % 10% 15% 10% 5% 15% 10%
CAD $ 5,188,661 518,866 5,707,527 856,129 570,753 285,376 856,129 570,753 8,846,667
Gravity Circuits % 10% 10% 7.5% 5% 7.5% 10%
CAD $ 3,125,938 312,594 3,438,532 343,853 257,890 171,927 257,890 343,853 4,813,944
Concentrate Handling % 10% 15% 10% 12.5% 12.5% 30%
CAD $ 378,439 37,844 416,283 62,442 41,628 52,035 52,035 124,885 749,310
Tailings Disposal % 10% 15% 10% 20% 50% 25%
CAD $ 224,908 22,491 247,398 37,110 24,740 49,480 123,699 61,850 544,276
Infrastructure % 15% 15% 10% 25% 33% 25%
CAD $ 395,646 59,347 454,993 68,249 45,499 113,748 150,148 113,748 946,385
TOTAL PROJECT DIRECTS CAD $ 12,523,707 1,111,647 13,635,355 1,620,580 1,024,776 739,979 1,473,607 1,467,885 19,962,181
INDIRECTS
EPCM 7.5% 1,497,164
Off-site Infrastructure & Mobile Equipment 100,000
Commissioning & Start-up 2.5% 313,093
Vendor Rep's 250,000
First Fill, 3 Months Consumables 50,000
Spare Parts 2.5% 313,093
Freight & Transportation 5.0% 5.0% 5.0% 5.0% 5.0% 861,498
Contractor Indirects 2.0% 250,474
Insurance 1.0% 125,237
Construction Indirects 3.0% 375,711
TOTAL PROJECT INDIRECTS CAD$ 4,136,269
Contingency 20% 4,819,690
Buildings 750,000
Owners Costs 1,000,000
TOTAL PLANT CAPITAL COSTS 30,668,141
Mechanical Equipment
242
21.1.2 Concentrator Indirect Capital Costs
The EPCM cost is estimated at only 7.5% of direct costs as a result of the crusher plant being
a modular/mobile facility, and the use of the vendors to pre-assemble the bulk of the
mechanical equipment on skids or modular structure; hence much of the engineering and
installation costs will be borne by the vendors. In addition, Avalon will have a small team on
site to manage construction so minimal input from the EPCM engineer will be required
during the construction period. Electrical design will also be completed by a vendor.
The process modules will be installed in a building that will be a pre-engineered and
fabricated steel structure with cladding.
The price of the ball mill is inclusive of liners and the initial ball charge (80 t) has been
included in “first fill”.
21.1.3 Bulk Sulphide Flotation Circuit
In Year 5 a bulk sulphide flotation plant will be installed at an estimated cost of CAD6.62M
(Table 21.1 above). These capital costs have been estimated using the same philosophy and
methodology as applied to the main plant.
This facility will include rougher and scavenger flotation circuits, reagent mixing and dosing
equipment, blowers, and a sulphide free tailings filter press. The sulphide concentrate will be
pumped to an underwater storage facility while the flotation tailings will be transported by
truck to the tailings area for capping purposes.
21.1.4 Tailings
The capital estimate includes provision for pumping final tailings slurry from the plant to the
existing tailings facility via a new delivery pipe with spigots to facilitate an even distribution.
21.1.5 Infrastructure
The site already has an electrical power supply and access roads, so no provision is made for
any off-site infrastructure. However, additional transformer capacity is required (as previous
units were mostly removed). The new electrical equipment will all be pre-assembled off-site
in a container(s) and then positioned on site. Also, a small amount of capital has been
allocated for minor upgrades to on-site roads.
Plant infrastructure provisions in the capex estimate include compressed air, clean, process,
gland service and tailings return water circuits.
There are some existing offices on site which can be utilized, but some additional space will
be available within a new plant building which will also house stores and workshop areas.

243
21.1.6 Owners Costs
A provision of CAD1 Million is included for Owner’s costs (see Table 21.3).
Table 21.3
Breakdown of Owners Costs Provision
Expense Cost
(CAD)
Training – Operation/Maintenance Labour 280,000
Site Construction Management 195,000
H/Office Support – Expenses 120,000
Permitting 80,000
Drilling of Stockpile 250,000
Recruitment 35,000
Miscellaneous Disbursements 40,000
Total 1,000,000
• The training provision allows for 2 months for all personnel prior to commissioning
(the potential for some government funding for this activity is being investigated).
• Site construction management provides for one site manager, one assistant manager
and a clerk for a total of 9 months.
• Home office support expenses provides for travel and food during site visits by head
office personnel - accommodation for Avalon personnel will be at Avalon’s house,
but a provision for a part-time housekeeper is included.
• Permitting – permits for final construction and operations.
• It is planned to complete a drilling exercise on the low-grade stockpile to assist with
production scheduling and plant feed grade control.
• There will be a number of expenses associated with the recruitment of operating
personnel and miscellaneous activities both at site (e.g., construction power) and at
head office.
The Owner’s costs estimate does not include labour costs for head office personnel as these
will be covered by Avalon’s normal corporate operating costs.
21.1.7 Contingency
A contingency of 20% has been added to the capital cost estimate. This is considered
acceptable on the basis that significant detail has already gone into the process design and
equipment sizing. In addition, there is tremendous potential for equipment savings through
the procurement of second-hand equipment particularly for the mill, screens and gravity
concentrators.
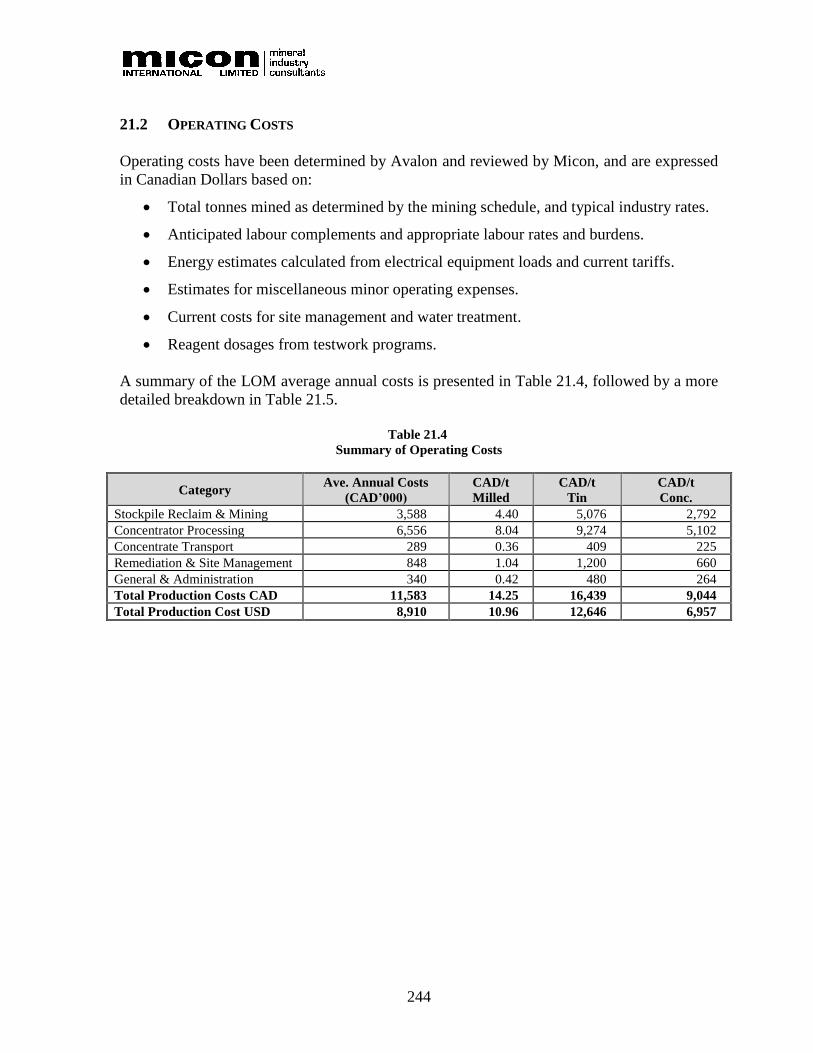
244
21.2 OPERATING COSTS
Operating costs have been determined by Avalon and reviewed by Micon, and are expressed
in Canadian Dollars based on:
• Total tonnes mined as determined by the mining schedule, and typical industry rates.
• Anticipated labour complements and appropriate labour rates and burdens.
• Energy estimates calculated from electrical equipment loads and current tariffs.
• Estimates for miscellaneous minor operating expenses.
• Current costs for site management and water treatment.
• Reagent dosages from testwork programs.
A summary of the LOM average annual costs is presented in Table 21.4, followed by a more
detailed breakdown in Table 21.5.
Table 21.4
Summary of Operating Costs
Category Ave. Annual Costs
(CAD’000)
CAD/t
Milled
CAD/t
Tin
CAD/t
Conc.
Stockpile Reclaim & Mining 3,588 4.40 5,076 2,792
Concentrator Processing 6,556 8.04 9,274 5,102
Concentrate Transport 289 0.36 409 225
Remediation & Site Management 848 1.04 1,200 660
General & Administration 340 0.42 480 264
Total Production Costs CAD 11,583 14.25 16,439 9,044
Total Production Cost USD 8,910 10.96 12,646 6,957

245
Table 21.5
Detailed Breakdown of Estimated Annual Operating Costs
(CAD ‘000’s)
EXPENSE LOM Y1 Y2 Y3 Y4 Y5 Y6 Y7 Y8 Y9 Y10 Y11 Y12 Y13 Y14 Y15 Y16 Y17 Y18 Y19
Mining
Stockpile/Ore Reclaim Contractor 7,337 504 130 93 58 112 96 134 138 177 104 118 123 116 175 1,052 1,052 1,052 1,052 1,052
Exploration 500 250 250
Mining- ore 43,326 – 3,300 3,437 3,569 3,366 3,426 3,284 3,270 3,123 3,396 3,346 3,327 3,351 3,132 – – – – –
Mining- Waste 15,216 – 6,592 2,857 886 19 5 58 405 274 188 3,523 382 25 2 – – – – –
Crushing Contractor – – – – – – – – – – – – – – – – – – – –
Mining Total 66,380 504 10,272 6,638 4,513 3,498 3,527 3,476 3,813 3,574 3,688 6,986 3,832 3,493 3,308 1,052 1,052 1,052 1,052 1,052
Concentrator
Labour 32,719 1,309 1,745 1,745 1,745 1,745 1,745 1,745 1,745 1,745 1,745 1,745 1,745 1,745 1,745 1,745 1,745 1,745 1,745 1,745
Energy- Crushing Plant 5,950 161 322 322 322 322 322 322 322 322 322 322 322 322 322 322 322 322 322 322
Energy- Process Plant (exc. Crushing) 43,051 1,102 2,205 2,205 2,205 2,205 2,582 2,582 2,582 2,582 2,582 2,582 2,205 2,205 2,205 2,205 2,205 2,205 2,205 2,205
Miscellaneous Consumables 1,850 50 100 100 100 100 100 100 100 100 100 100 100 100 100 100 100 100 100 100
Grinding Media + Liners 26,677 842 1,421 1,421 1,421 1,421 1,421 1,421 1,421 1,421 1,421 1,421 1,421 1,421 1,421 1,472 1,472 1,472 1,472 1,472
Flotation Reagents 1,893 5 9 9 9 9 296 296 296 296 296 296 9 9 9 9 9 9 9 9
Environmental Monitoring 1,900 100 100 100 100 100 100 100 100 100 100 100 100 100 100 100 100 100 100 100
Maintenance 7,248 188 376 376 376 376 457 457 457 457 457 457 376 376 376 376 376 376 376 188
Plant Expansion –
Concentrator Total 120,588 3,656 6,177 6,177 6,177 6,177 6,923 6,923 7,023 7,023 7,023 7,023 6,277 6,277 6,277 6,328 6,328 6,328 6,328 6,140
Concentrate & Site Management
Site Management Costs (current) 9,690 510 510 510 510 510 510 510 510 510 510 510 510 510 510 510 510 510 510 510
Transportation of Conc 5,350 111 395 312 318 315 331 328 298 303 328 280 291 290 293 231 231 231 231 231
Rehabilitation-Tailings Placement 6,000 500 500 500 500 500 500 1,000 2,000
Total Site & Concentrate 21,040 621 905 822 828 825 1,341 1,338 1,308 1,313 1,338 1,290 801 800 803 741 741 741 1,741 2,741
Genaral & Administration
Labour 3,469 139 185 185 185 185 185 185 185 185 185 185 185 185 185 185 185 185 185 185
Miscellaneous 2,813 113 150 150 150 150 150 150 150 150 150 150 150 150 150 150 150 150 150 150
Site visits – – – – – – – – – – – – – – – – – – – –
Consultation fees – – – – – – – – – – – – – – – – – – – –
Genaral & Administration Total 6,281 251 335 335 335 335 335 335 335 335 335 335 335 335 335 335 335 335 335 335
Total operating costs 214,289 5,032 17,689 13,972 11,854 10,835 12,126 12,072 12,479 12,245 12,384 15,634 11,245 10,906 10,723 8,456 8,456 8,456 9,456 10,269

246
21.2.1 Stockpile Reclaim and Mining
A cost of CAD1.25/t moved has been used for the reclamation of material by front-end
loader from the stockpile and delivered to a crusher feed bin. It is intended that the crushing
plant operates initially on a single 12-hour shift per day.
Costs for mining of plant feed and waste rock from the pits have been determined using a
rate of CAD4.70/t mined for the Baby Zone and the Main Pit North based on a budget
proposal received from a local mining contractor. This price includes drilling, blasting and
transport of mill feed to the crusher and waste rock to the waste rock storage facility.
The cost for mining in the Main Zone North and West is assumed to be CAD0.5/t lower due
to the waste rock being deposited in the mined-out Main Zone North area, hence incurring a
lower transport cost.
21.2.2 Concentrator
21.2.2.1 Power
Power costs have been determined based on the installed mechanical equipment load. It is
assumed all operating drives draw 80% of their installed power except for certain intermittent
operating equipment items such as filter circuits, samplers, spillage pumps and stand-by
equipment. An average power cost of CAD0.099/kWh has been used based on current rates
from the local power supplier.
21.2.2.2 Labour
Labour requirements for the processing plant are estimated at only 26 personnel as indicated
in Table 21.6 below for a total annual operating cost of CAD1.93M. Operations will also be
supported by Head Office personnel on a part-time basis for activities such as procurement,
accounting, human resources and technical support in areas such as metallurgy,
environmental, geology and marketing.
The “day-shift” operator will oversee on-site environmental monitoring, basic training, on-
site safety, product packing and dispatch, etc. under the supervision of the operations
manager.
The operations manager will have a strong process/operations background, and the
millwright will also be responsible for maintenance planning and general engineering
supervision.
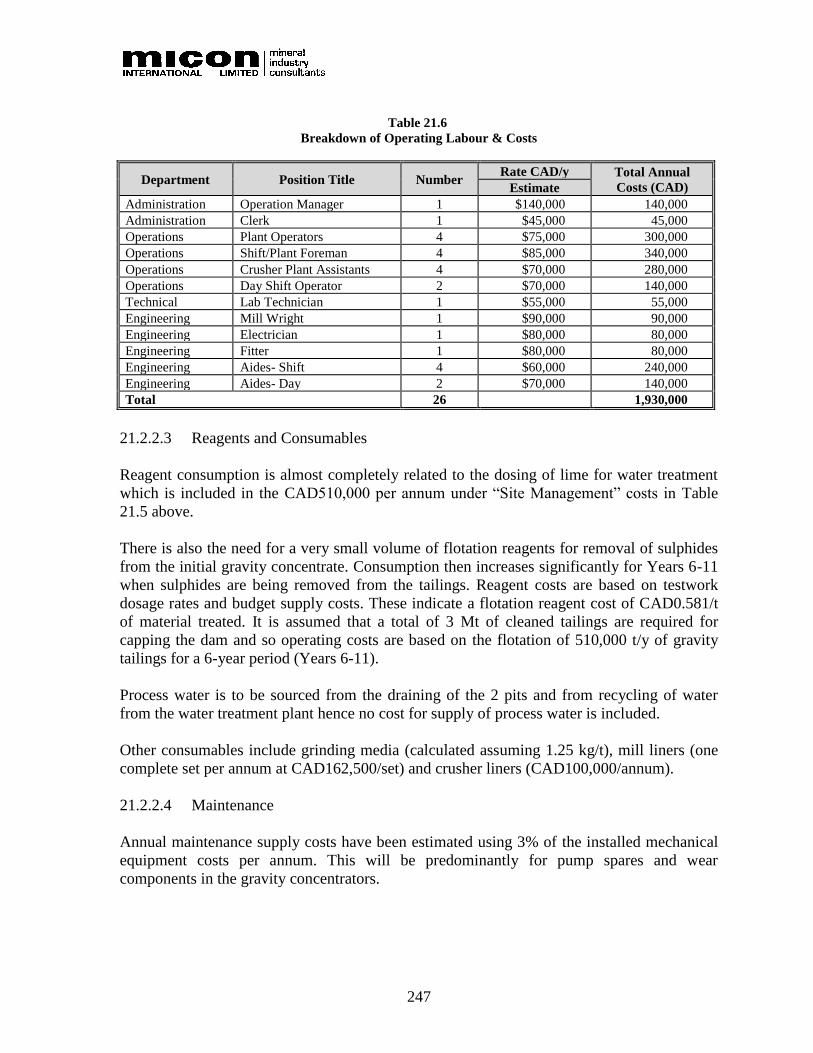
247
Table 21.6
Breakdown of Operating Labour & Costs
Department Position Title Number Rate CAD/y Total Annual
Costs (CAD) Estimate
Administration Operation Manager 1 $140,000 140,000
Administration Clerk 1 $45,000 45,000
Operations Plant Operators 4 $75,000 300,000
Operations Shift/Plant Foreman 4 $85,000 340,000
Operations Crusher Plant Assistants 4 $70,000 280,000
Operations Day Shift Operator 2 $70,000 140,000
Technical Lab Technician 1 $55,000 55,000
Engineering Mill Wright 1 $90,000 90,000
Engineering Electrician 1 $80,000 80,000
Engineering Fitter 1 $80,000 80,000
Engineering Aides- Shift 4 $60,000 240,000
Engineering Aides- Day 2 $70,000 140,000
Total 26 1,930,000
21.2.2.3 Reagents and Consumables
Reagent consumption is almost completely related to the dosing of lime for water treatment
which is included in the CAD510,000 per annum under “Site Management” costs in Table
21.5 above.
There is also the need for a very small volume of flotation reagents for removal of sulphides
from the initial gravity concentrate. Consumption then increases significantly for Years 6-11
when sulphides are being removed from the tailings. Reagent costs are based on testwork
dosage rates and budget supply costs. These indicate a flotation reagent cost of CAD0.581/t
of material treated. It is assumed that a total of 3 Mt of cleaned tailings are required for
capping the dam and so operating costs are based on the flotation of 510,000 t/y of gravity
tailings for a 6-year period (Years 6-11).
Process water is to be sourced from the draining of the 2 pits and from recycling of water
from the water treatment plant hence no cost for supply of process water is included.
Other consumables include grinding media (calculated assuming 1.25 kg/t), mill liners (one
complete set per annum at CAD162,500/set) and crusher liners (CAD100,000/annum).
21.2.2.4 Maintenance
Annual maintenance supply costs have been estimated using 3% of the installed mechanical
equipment costs per annum. This will be predominantly for pump spares and wear
components in the gravity concentrators.

248
21.2.2.5 Environmental and Tailings
There is a CAD100,000 per annum allowance for environmental monitoring which provides
for general water trench maintenance/repairs as well as on-going analyses of various
environmental samples. In addition, there is a CAD500,000/annum provision during Years 6-
11 for capping of the tailings facility (based on the placement of 500,000 t/y at CAD1.00/t).
Final closure costs are expected to be relatively small as remediation of the tailings facility
will have been completed during Years 6-11 and the balance of the tailings and waste rock
will have been deposited in the 2 mined out pits. The plant building will also be specifically
designed for easy removal and potential sale or relocation. Hence a provision of CAD3
Million spread across Years 18 and 19 is considered sufficient for this activity.
21.2.2.6 Transportation of Concentrate
A cost of CAD225/t of dry concentrate produced is assumed (based on budget quotations) for
concentrate transport to customers in Malaysia or Indonesia.

249
22.0 ECONOMIC ANALYSIS
Micon has prepared this PEA of the Project on the basis of a discounted cash flow model,
from which Net Present Value (NPV), Internal Rate of Return (IRR), payback and other
measures of project viability can be determined. Assessments of NPV are generally accepted
within the mining industry as representing the economic value of a project after allowing for
the cost of capital invested.
The objective of the study was to determine the potential viability of the proposed
development of the East Kemptville Tin Production and Site Remediation Project. In order to
do this, the cash flow arising from the base case has been forecast, enabling a computation of
the NPV to be made. The sensitivity of this NPV to changes in the base case assumptions is
then examined.
22.1 MACRO-ECONOMIC ASSUMPTIONS
22.1.1 Exchange Rate, Inflation and Discount Rate
The tin price assumed is based on a USD rate, but unless otherwise stated, financial results
are expressed in CAD. Cost estimates and other inputs to the cash flow model for the Project
have been prepared using constant, second quarter 2018 money terms, i.e., without provision
for escalation or inflation.
An exchange rate of CAD1.30/USD is applied in the base case, approximately equal to
current rates and to the trailing average over the past two years.
Micon has applied a real discount rate of 8% in its base case evaluation, approximating the
weighted average cost of capital (WACC) for the Project.
22.1.2 Expected Metal Prices
The base case cash flow projection assumes a constant price of USD21,038/t tin metal as
forecast by the World Bank for 2020 (see Section 19.0 for further forecast information).
22.1.3 Taxation Regime
Nova Scotia mining taxes, and Canadian federal and provincial income taxes payable on the
Project have been provided for in the cash flow forecast. Mining tax is charged at the greater
of 2% of gross revenue and 15% of net income from the mine.
Provincial and federal income tax rates are 16% and 15%, respectively. Depreciation
allowances for income tax are generally limited to 25% on a declining balance basis, with
only a small proportion of initial capital assumed to be eligible for accelerated allowance that
may be claimed during the transition period ending in 2020.

250
22.1.4 Royalty
No royalty has been provided for in the cash flow model.
22.1.5 Selling Expenses
A provision for concentrate transport from East Kemptville to customer of CAD225/t is
included within forecast cash operating costs.
22.2 TECHNICAL ASSUMPTIONS
The technical parameters, production forecasts and estimates described elsewhere in this
report are reflected in the base case cash flow model. These inputs to the model are
summarized below. The measures used in the study are metric throughout.
22.2.1 Plant Feed and Tin Concentrate/Metal Production Schedule
Figure 22.1 shows the annual tonnage of plant feed material reclaimed from the stockpile and
mined from the two open pits.
Figure 22.1
Annual Plant Feed Production Schedule
(tonnes)
Annual production of tin metal (as a 55% tin concentrate) is shown in Figure 22.2.
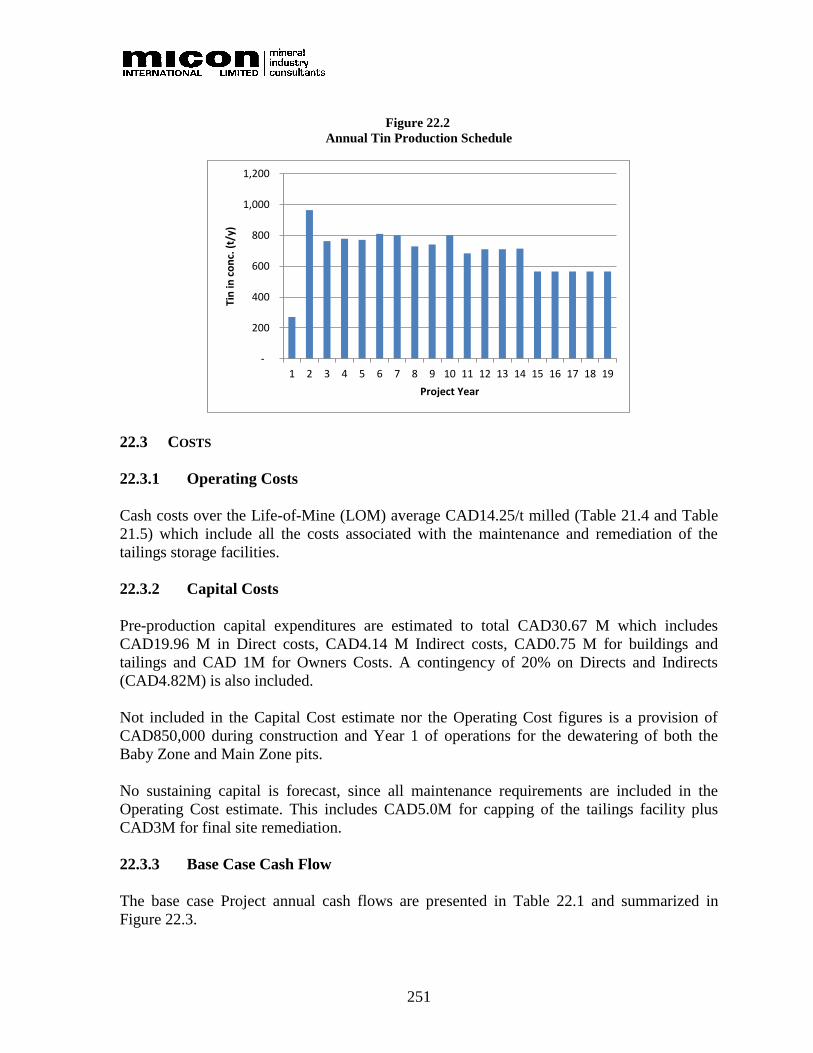
251
Figure 22.2
Annual Tin Production Schedule
22.3 COSTS
22.3.1 Operating Costs
Cash costs over the Life-of-Mine (LOM) average CAD14.25/t milled (Table 21.4 and Table
21.5) which include all the costs associated with the maintenance and remediation of the
tailings storage facilities.
22.3.2 Capital Costs
Pre-production capital expenditures are estimated to total CAD30.67 M which includes
CAD19.96 M in Direct costs, CAD4.14 M Indirect costs, CAD0.75 M for buildings and
tailings and CAD 1M for Owners Costs. A contingency of 20% on Directs and Indirects
(CAD4.82M) is also included.
Not included in the Capital Cost estimate nor the Operating Cost figures is a provision of
CAD850,000 during construction and Year 1 of operations for the dewatering of both the
Baby Zone and Main Zone pits.
No sustaining capital is forecast, since all maintenance requirements are included in the
Operating Cost estimate. This includes CAD5.0M for capping of the tailings facility plus
CAD3M for final site remediation.
22.3.3 Base Case Cash Flow
The base case Project annual cash flows are presented in Table 22.1 and summarized in
Figure 22.3.
-
200
400
600
800
1,000
1,200
1 2 3 4 5 6 7 8 9 10 11 12 13 14 15 16 17 18 19
Tin
in c
on
c. (
t/y)
Project Year
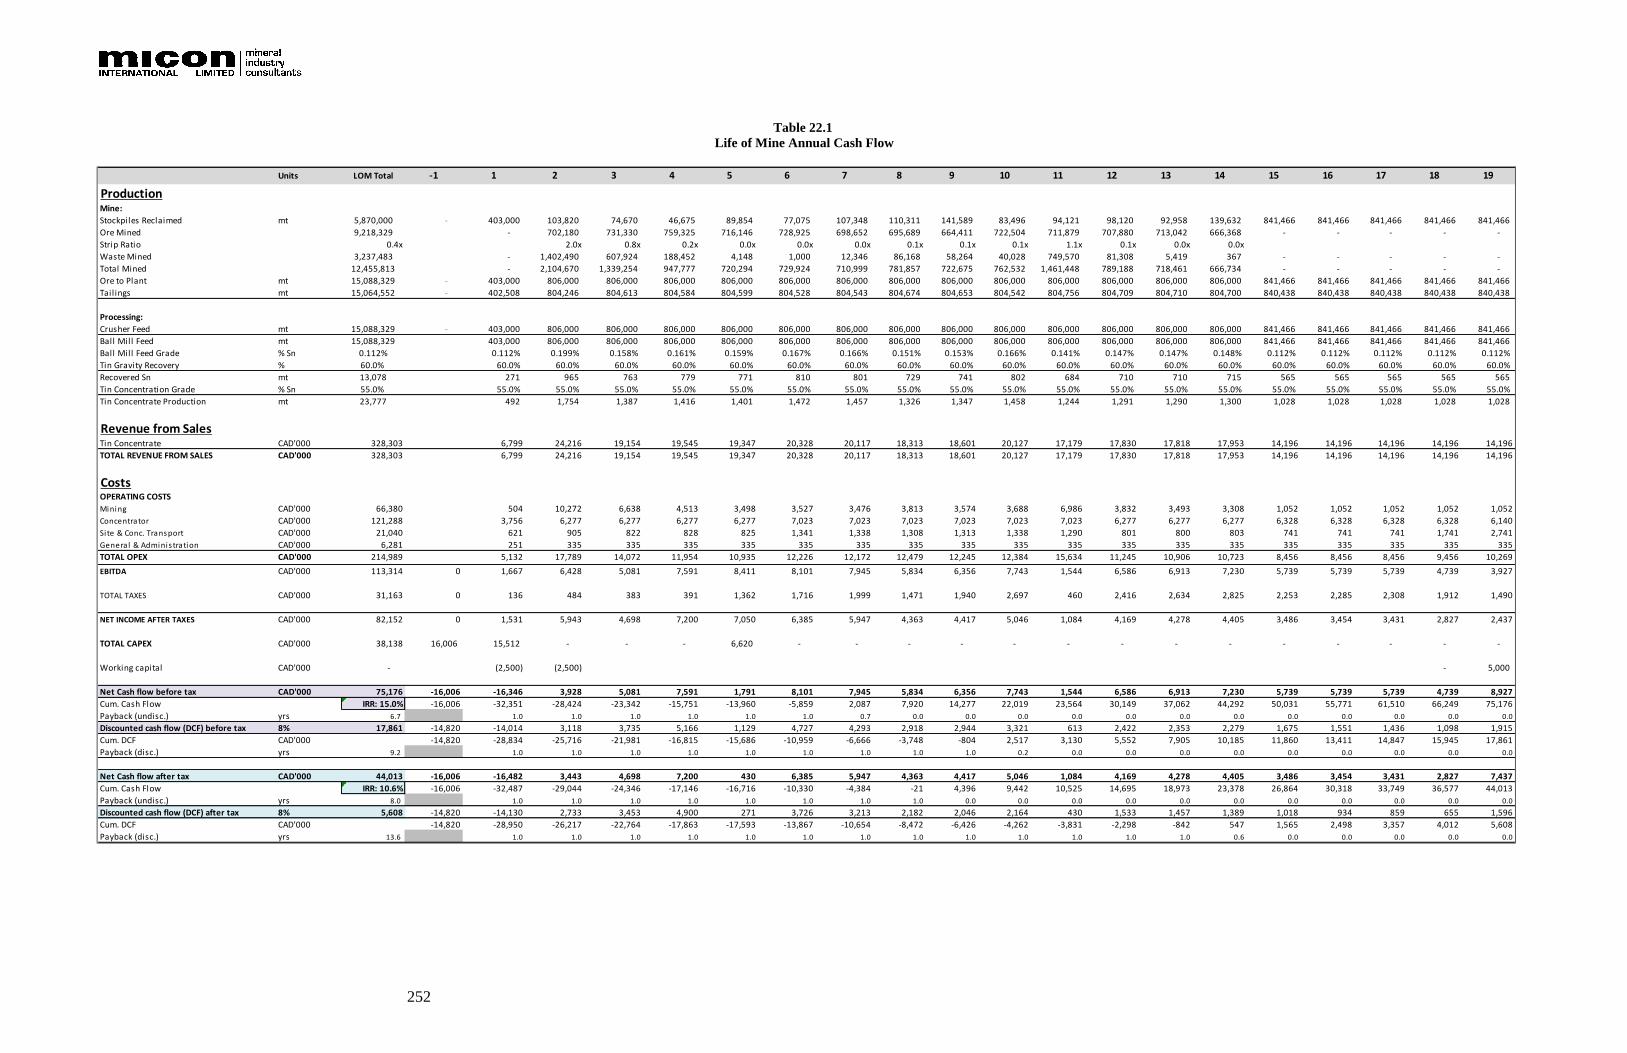
252
Table 22.1
Life of Mine Annual Cash Flow
Units LOM Total -1 1 2 3 4 5 6 7 8 9 10 11 12 13 14 15 16 17 18 19
ProductionMine:
Stockpiles Reclaimed mt 5,870,000 - 403,000 103,820 74,670 46,675 89,854 77,075 107,348 110,311 141,589 83,496 94,121 98,120 92,958 139,632 841,466 841,466 841,466 841,466 841,466
Ore Mined 9,218,329 - 702,180 731,330 759,325 716,146 728,925 698,652 695,689 664,411 722,504 711,879 707,880 713,042 666,368 - - - - -
Strip Ratio 0.4x 2.0x 0.8x 0.2x 0.0x 0.0x 0.0x 0.1x 0.1x 0.1x 1.1x 0.1x 0.0x 0.0x
Waste Mined 3,237,483 - 1,402,490 607,924 188,452 4,148 1,000 12,346 86,168 58,264 40,028 749,570 81,308 5,419 367 - - - - -
Total Mined 12,455,813 - 2,104,670 1,339,254 947,777 720,294 729,924 710,999 781,857 722,675 762,532 1,461,448 789,188 718,461 666,734 - - - - -
Ore to Plant mt 15,088,329 - 403,000 806,000 806,000 806,000 806,000 806,000 806,000 806,000 806,000 806,000 806,000 806,000 806,000 806,000 841,466 841,466 841,466 841,466 841,466
Tail ings mt 15,064,552 - 402,508 804,246 804,613 804,584 804,599 804,528 804,543 804,674 804,653 804,542 804,756 804,709 804,710 804,700 840,438 840,438 840,438 840,438 840,438
Processing:
Crusher Feed mt 15,088,329 - 403,000 806,000 806,000 806,000 806,000 806,000 806,000 806,000 806,000 806,000 806,000 806,000 806,000 806,000 841,466 841,466 841,466 841,466 841,466
Ball Mill Feed mt 15,088,329 403,000 806,000 806,000 806,000 806,000 806,000 806,000 806,000 806,000 806,000 806,000 806,000 806,000 806,000 841,466 841,466 841,466 841,466 841,466
Ball Mill Feed Grade % Sn 0.112% 0.112% 0.199% 0.158% 0.161% 0.159% 0.167% 0.166% 0.151% 0.153% 0.166% 0.141% 0.147% 0.147% 0.148% 0.112% 0.112% 0.112% 0.112% 0.112%
Tin Gravity Recovery % 60.0% 60.0% 60.0% 60.0% 60.0% 60.0% 60.0% 60.0% 60.0% 60.0% 60.0% 60.0% 60.0% 60.0% 60.0% 60.0% 60.0% 60.0% 60.0% 60.0%
Recovered Sn mt 13,078 271 965 763 779 771 810 801 729 741 802 684 710 710 715 565 565 565 565 565
Tin Concentration Grade % Sn 55.0% 55.0% 55.0% 55.0% 55.0% 55.0% 55.0% 55.0% 55.0% 55.0% 55.0% 55.0% 55.0% 55.0% 55.0% 55.0% 55.0% 55.0% 55.0% 55.0%
Tin Concentrate Production mt 23,777 492 1,754 1,387 1,416 1,401 1,472 1,457 1,326 1,347 1,458 1,244 1,291 1,290 1,300 1,028 1,028 1,028 1,028 1,028
Revenue from SalesTin Concentrate CAD'000 328,303 6,799 24,216 19,154 19,545 19,347 20,328 20,117 18,313 18,601 20,127 17,179 17,830 17,818 17,953 14,196 14,196 14,196 14,196 14,196
TOTAL REVENUE FROM SALES CAD'000 328,303 6,799 24,216 19,154 19,545 19,347 20,328 20,117 18,313 18,601 20,127 17,179 17,830 17,818 17,953 14,196 14,196 14,196 14,196 14,196
CostsOPERATING COSTS
Mining CAD'000 66,380 504 10,272 6,638 4,513 3,498 3,527 3,476 3,813 3,574 3,688 6,986 3,832 3,493 3,308 1,052 1,052 1,052 1,052 1,052
Concentrator CAD'000 121,288 3,756 6,277 6,277 6,277 6,277 7,023 7,023 7,023 7,023 7,023 7,023 6,277 6,277 6,277 6,328 6,328 6,328 6,328 6,140
Si te & Conc. Transport CAD'000 21,040 621 905 822 828 825 1,341 1,338 1,308 1,313 1,338 1,290 801 800 803 741 741 741 1,741 2,741
General & Adminis tration CAD'000 6,281 251 335 335 335 335 335 335 335 335 335 335 335 335 335 335 335 335 335 335
TOTAL OPEX CAD'000 214,989 5,132 17,789 14,072 11,954 10,935 12,226 12,172 12,479 12,245 12,384 15,634 11,245 10,906 10,723 8,456 8,456 8,456 9,456 10,269
EBITDA CAD'000 113,314 0 1,667 6,428 5,081 7,591 8,411 8,101 7,945 5,834 6,356 7,743 1,544 6,586 6,913 7,230 5,739 5,739 5,739 4,739 3,927
TOTAL TAXES CAD'000 31,163 0 136 484 383 391 1,362 1,716 1,999 1,471 1,940 2,697 460 2,416 2,634 2,825 2,253 2,285 2,308 1,912 1,490
NET INCOME AFTER TAXES CAD'000 82,152 0 1,531 5,943 4,698 7,200 7,050 6,385 5,947 4,363 4,417 5,046 1,084 4,169 4,278 4,405 3,486 3,454 3,431 2,827 2,437
TOTAL CAPEX CAD'000 38,138 16,006 15,512 - - - 6,620 - - - - - - - - - - - - - -
Working capital CAD'000 - (2,500) (2,500) - 5,000
Net Cash flow before tax CAD'000 75,176 -16,006 -16,346 3,928 5,081 7,591 1,791 8,101 7,945 5,834 6,356 7,743 1,544 6,586 6,913 7,230 5,739 5,739 5,739 4,739 8,927
Cum. Cash Flow IRR: 15.0% -16,006 -32,351 -28,424 -23,342 -15,751 -13,960 -5,859 2,087 7,920 14,277 22,019 23,564 30,149 37,062 44,292 50,031 55,771 61,510 66,249 75,176
Payback (undisc.) yrs 6.7 1.0 1.0 1.0 1.0 1.0 1.0 0.7 0.0 0.0 0.0 0.0 0.0 0.0 0.0 0.0 0.0 0.0 0.0 0.0
Discounted cash flow (DCF) before tax 8% 17,861 -14,820 -14,014 3,118 3,735 5,166 1,129 4,727 4,293 2,918 2,944 3,321 613 2,422 2,353 2,279 1,675 1,551 1,436 1,098 1,915
Cum. DCF CAD'000 -14,820 -28,834 -25,716 -21,981 -16,815 -15,686 -10,959 -6,666 -3,748 -804 2,517 3,130 5,552 7,905 10,185 11,860 13,411 14,847 15,945 17,861
Payback (disc.) yrs 9.2 1.0 1.0 1.0 1.0 1.0 1.0 1.0 1.0 1.0 0.2 0.0 0.0 0.0 0.0 0.0 0.0 0.0 0.0 0.0
Net Cash flow after tax CAD'000 44,013 -16,006 -16,482 3,443 4,698 7,200 430 6,385 5,947 4,363 4,417 5,046 1,084 4,169 4,278 4,405 3,486 3,454 3,431 2,827 7,437
Cum. Cash Flow IRR: 10.6% -16,006 -32,487 -29,044 -24,346 -17,146 -16,716 -10,330 -4,384 -21 4,396 9,442 10,525 14,695 18,973 23,378 26,864 30,318 33,749 36,577 44,013
Payback (undisc.) yrs 8.0 1.0 1.0 1.0 1.0 1.0 1.0 1.0 1.0 0.0 0.0 0.0 0.0 0.0 0.0 0.0 0.0 0.0 0.0 0.0
Discounted cash flow (DCF) after tax 8% 5,608 -14,820 -14,130 2,733 3,453 4,900 271 3,726 3,213 2,182 2,046 2,164 430 1,533 1,457 1,389 1,018 934 859 655 1,596
Cum. DCF CAD'000 -14,820 -28,950 -26,217 -22,764 -17,863 -17,593 -13,867 -10,654 -8,472 -6,426 -4,262 -3,831 -2,298 -842 547 1,565 2,498 3,357 4,012 5,608
Payback (disc.) yrs 13.6 1.0 1.0 1.0 1.0 1.0 1.0 1.0 1.0 1.0 1.0 1.0 1.0 1.0 0.6 0.0 0.0 0.0 0.0 0.0

253
Figure 22.3
Annual Cash Flow
This PEA is preliminary in nature; it includes inferred mineral resources that are considered
too speculative geologically to have the economic considerations applied to them that would
enable them to be categorized as mineral reserves, and there is no certainty that the
preliminary economic assessment will be realized.
Before tax, the base case demonstrates an undiscounted payback period of 6.7 years, and an
IRR of 15.0%. At an annual discount rate of 8%, the Project has a net present value (NPV8)
before tax of CAD17.8 million, and the payback period extends to 9.2 years.
After tax, the base case undiscounted payback period is 8.0 years, leaving a tail of 11 years
planned production, and the Project has an IRR of 10.6%. At an annual discount rate of 8%,
the Project NPV8 after tax is CAD5.6 million, and the payback period extends to 13.6 years.
22.4 SENSITIVITY STUDY
22.4.1 Capital, Operating Costs, Tin Price and Recovery Sensitivity
The sensitivity of Project returns to changes in capital, operating costs and all revenue factors
(including recovery and tin price) was tested over a range of 20% above and below base case
values (Figure 22.4 and Figure 22.5).
-35,000
-30,000
-25,000
-20,000
-15,000
-10,000
-5,000
0
5,000
10,000
15,000
20,000
25,000
-1 1 2 3 4 5 6 7 8 9 10 11 12 13 14 15 16 17 18 19
CA
D'0
00
Project Years
Mining Concentrator Site & Conc. Transport
General & Administration Taxation Capital Exp.
Net Cash Flow Sales Revenue Cum. Cash Flow
Cum. DCF
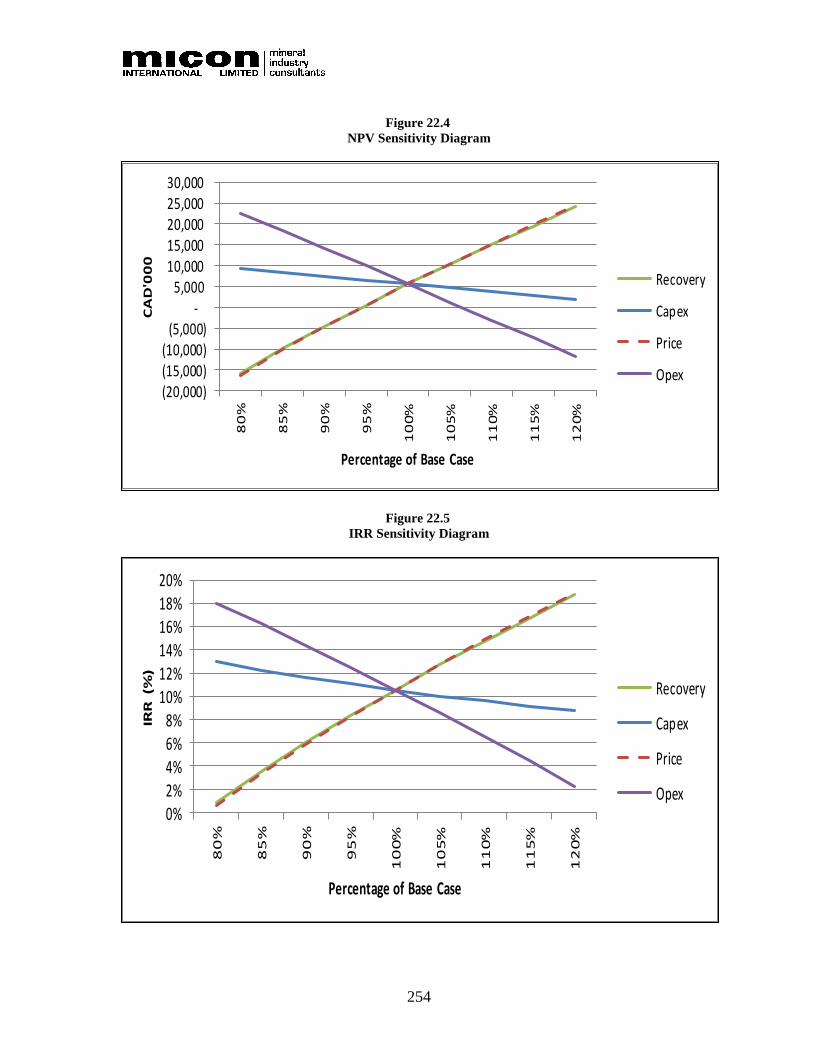
254
Figure 22.4
NPV Sensitivity Diagram
Figure 22.5
IRR Sensitivity Diagram
(20,000) (15,000) (10,000)
(5,000) -
5,000 10,000 15,000 20,000 25,000 30,000
80
%
85
%
90
%
95
%
10
0%
10
5%
11
0%
11
5%
12
0%
CA
D'0
00
Percentage of Base Case
Recovery
Capex
Price
Opex
0%2%4%6%8%
10%12%14%16%18%20%
80
%
85
%
90
%
95
%
10
0%
10
5%
11
0%
11
5%
12
0%
IRR
(%
)
Percentage of Base Case
Recovery
Capex
Price
Opex
255
The charts suggest that the Project is most sensitive to revenue drivers, namely tin price and
recovery which are essentially identical, with an adverse change of 5% in tin price resulting
in a reduction of almost CAD5 million in NPV8. The Project is somewhat less sensitive to
changes in operating cost, with a 7.5% increase in costs resulting in a near-zero NPV8. The
Project is least sensitive to capital cost, with NPV8 remaining positive even with a 20%
increase in capital costs.
22.5 CONCLUSION
Avalon has the opportunity to re-commence commercial tin production from the East
Kemptville mine by establishing a small-scale operation processing an on-surface, Low
Grade Stockpile and higher grade, near surface occurrences within the existing pits.
Assuming a tin price of USD21,038/t (as forecast by the World Bank Commodity Price for
2020), and an exchange rate of CAD1.30/USD, the Project has an indicated pre-tax IRR of
15.0% and an NPV8 of CAD17.9 million. After tax IRR is 10.6% and NPV8 after tax is
CAD5.6 million. Initial capital cost is estimated at CAD31.5 million which the after-tax cash
flow pays back in approximately 8 years, leaving a tail of 11 years planned production.
In so -doing, Avalon also has the opportunity to remediate the site by removing the existing
environmental liabilities created by previous operations.
While the results of the PEA indicate economic potential, there are a number of opportunities
to further improve Project economics. One of the most promising of these is the potential to
upgrade the feed material to the processing plant through ore-sorting. Results from an initial
evaluation of ore-sorting technology carried out in 2017 were very encouraging. Additional
results from a second evaluation using an alternative ore-sorting technology are expected by
the end of this month, after which further testwork or a piloting program at site is likely.
Successful application of ore-sorting process technology offers a number of potential benefits
to the Project financial model. By rejecting non-mineralized waste rock before feeding it into
the concentrator, ore-sorting allows for a reduction in the size of the concentrator with
attendant reductions in both capital and operating costs. It may also allow for economic
recovery of tin from other mineralized materials stored on site that are presently not included
in the re-development model.

256
23.0 ADJACENT PROPERTIES
Avalon holds exploration claims adjacent to the East Kemptville mine site as disclosed in
Section 4.0 of this report. Relevant information on these claims is to be found in Sections 4.0
and 6.0 of this report.
There are no third-party exploration licences adjacent to Avalon’s Special Licence.

257
24.0 OTHER RELEVANT DATA AND INFORMATION
Micon and Avalon believe that no additional information or explanation is necessary to make
this Technical Report understandable and not misleading. Any requests for clarification
should be addressed to Avalon at [email protected].
258
25.0 INTERPRETATION AND CONCLUSIONS
25.1 INTERPRETATION
The study has determined that processing of the stockpiled material and higher-grade zones
from the pits can be economically viable across an operating life of 18.5 years producing a
total of approximately 24,000 tonnes of 55% tin concentrate (13,078 t of contained tin).
The initial capital cost estimate for the Project is CAD31.5 M with a further CAD6.6 M in
year 5 of operations for a flotation plant to remove sulphides and produce clean tailings for
capping of the TMF. There is no sustaining capital indicated as all such costs (additional
plant, tailings maintenance, etc.) are included in the operating cost estimates.
The simple processing circuit proposed has minimal reagent requirements, a low power
demand (~29-32,000 MWh/y) and small operating labour force (26 full time personnel in
total) resulting in a low cost of production. It also has the potential to commence production
relatively quickly (approximately 18-20 months) as the lead time on the processing plant is
short due to its’ scale and simplicity, plus permitting requirements are not overly onerous.
The Project economics are sufficiently robust to accommodate some fluctuation in pricing
and the tin metal price and there remains the potential to also recover concentrates of copper
and zinc/indium should the prices of these metals warrant doing so.
The capital cost estimate is based on 100% new equipment so there are a number of
opportunities to reduce this cost by purchasing good quality used equipment.
A well-thought-out remediation program has been developed which has been scrutinized by a
number of independent parties as well as local government authorities. This program will
enable Avalon to fully demonstrate its commitment to sustainable “mining” through
responsible actions as it restores the site to one with no on-going environmental liabilities.
25.2 RISKS AND OPPORTUNITIES
The Project in its current format has the following risks and opportunities.
25.2.1.1 Head Grade to Mill
Most of the area of the Main Zone deposit is drilled at 25 m intervals along lines 100 m apart.
The mineralization at East Kemptville has a wide range of grades that can change in short
distances. Due to the “nugget effect” that this implies, there is risk of difficulty of accurately
predicting mill feed grade during mining. As the objective is mining and processing modest
tonnages of higher grade sections of the deposit, which suggests selective mining, it is
prudent to consider infill diamond drilling specific areas of the proposed pits to increase the
resource confidence, especially of Inferred Resources but also Indicated resource category
sections. The opportunity presented by the drill hole spacing is that there may be areas of

259
potential high-grade mining that are poorly defined and unrecognised at present due to the
wide drill hole spacing thus increasing the mine life and financial return. The operating cost
schedule provides CAD250,000 in each of Years 2 and 3 for conducting suitable drill
programs within both pits once they are dewatered.
25.2.1.2 Resources
Opportunities exist to increase resources for the Project. For example, it is believed that a
more detailed mine plan is likely to increase the tonnage of high grade, near surface material
in these pits which could extend the life of the operation.
There has been no examination of the possibility of underground mining. Deep drilling on
the Baby Zone has suggested that tin mineralization continues close to 100 m below the
bottom of the presently planned pits. A detailed examination of this data may reveal
underground mining potential in this and other areas of the property.
In Section 9.1, opportunities for additional resources are discussed, including the Duck Pond
Zone and area west of the Baby Pit.
Further, there are additional very low-grade stockpiles on surface which could potentially be
processed if methods such as ore-sorting are demonstrated to have the ability to pre-
concentrate the tin prior to the milling circuit
25.2.1.3 Tin Price
The Project is somewhat sensitive to the tin price but can accommodate a ~33% drop in price
(i.e. from USD21,038/t to ~USD14,100/t) before cost/revenue breakeven (Revenue from
Sales equals Operating Costs). An analysis of recent historical tin prices indicates that the
LME listed price for tin has been above that value virtually continuously for more than the
past 10 years. The LME listed price as of 1st May 2018 is USD21,395 and the World Bank
Commodity Price forecast indicates tin a long-term price forecast of USD20,169 for 2025.
25.2.1.4 Tin Recovery
Economic sensitivity to tin recovery is identical to that for tin price. The recovery of 60% is
based on the testwork program by Met-Solve, and Avalon believes that once the plant is up
and running, this figure can actually be improved upon. The reason for this is that with the
bench scale testwork, it is very difficult to simulate the impact of recirculating streams and
optimize recovery over time so material that would be captured from such streams often
reports to tailings during bench testing. With an operating plant, these streams are fully
recycled, and operators have the opportunity to optimize recovery. The Project can
accommodate a drop-in recovery to around 40% before cost/revenue breakeven.
260
25.2.1.5 Mining
The forecast mining costs represent almost 30% of total production costs and are estimated
using typical industry contractor rates for open pit operations of this size. Upon completion
of the proposed drilling to update the resource model, further mine design work and haulage
analyses are required before costing of the final tonnages of material (plant feed plus waste)
to be mined can be more accurately defined.
25.2.1.6 Stockpile Grade
The grade of the material in the stockpile has been estimated by two surface sampling
programs and by reviewing historical information, all of which produced similar results, and
as a consequence an “inferred” resource has been determined by an external consultant. It is,
however, planned to complete a drill program of the stockpile as soon as financing is
available, partly to confirm the overall grade, but more importantly to map the internal grade
distributions and produce a more representative schedule of feed grades shipped to the
processing plant from this source.
25.2.1.7 Operating Life
The current operating life is 18.5 years; however, Avalon is confident that additional feed
sources will be identified, and that the operating life will be extended by:
• Processing other, lower grade deposits on site (installation of a dense media
separation or ore-sorting circuit as a pre-concentration step could make these viable).
• The “Duck Pond” area is known to contain tin mineralization that could be exploited
although further drilling is required to determine plant feed potential here. Historic
resources for Duck Pond have been reported at 9 Mt grading 0.11% Sn (Kooiman,
1989). In addition, drilling by Avalon at Duck Pond includes intercepts such as 0.86%
Sn over 7.5 m (DPAV-15-22) and 0.60% Sn over 10.5 m (DPAV-15-24), implying
potential for higher grade resources.
• “South Grid Area” has intercepts of tin mineralization reported in historic drill hole
90-010 with 0.17% Sn over 34.3 m and 90-008 with 0.31% Sn over 33.0 m in the
granite. These intercepts are 700 m southwest of the Baby Pit. These intercepts have
not been investigated further.
• Identifying additional higher-grade zones in the pits just below those areas planned to
be mined in the PEA.
• Toll-treatment of other material from external operations.
• Moving to an underground mining operating if economics can be supported by a
strong tin price.
261
25.2.1.8 Purchasing Used/Refurbished Equipment
The capital cost estimate has assumed all equipment is purchased new, but there are
significant opportunities to reduce equipment costs, particularly for the crushers and mill, by
purchasing used/refurbished items. Avalon is also aware of a number of used screens and
gravity concentrators that could potentially be acquired.
25.2.1.9 Revenue from By-products
No provision has been made for up-grading the sulphide concentrate into marketable copper
and zinc/indium concentrates for sale. However, should recent increases in the price of all 3
of these metals continue then this situation could change. It is possible that this mixed
product may have some economic value if sold to one of the eastern Canadian base metal
mining operators.
25.2.1.10 Foreign Exchange Rate
A lot of the mechanical equipment is being sourced from outside Canada and is priced in
American dollars. Similarly, all revenue is in USD. An exchange rate of CAD1.30:USD1 has
been used. Should the Canadian dollar strengthen this would be positive in terms of initial
capex, but then negative with respect to subsequent revenue once in production.
25.2.1.11 Environmental Liability
By re-activating the Project, Avalon will be inheriting a number of (currently) long term
environmental liabilities. However, by removing the low-grade stockpile, capping the tailings
facility and depositing the balance of the tailings along with waste rock into the two pits,
Avalon believes a “walk-away” closure strategy has been developed, eliminating these long-
term liabilities.
Under a Memorandum of Understanding, Avalon and RAL/BHP have agreed in principle to
work toward a mutually beneficial transition arrangement to minimize Avalon’s up-front
exposure to the existing environmental liability, while providing RAL/BHP with a pathway
toward eliminating its exposure to the long-term liability. Such an agreement could include
allowing Avalon access to already filed financial assurance in the short term and phasing this
out as the Project progresses and once Avalon income is being generated. There will also be
a reduction in the required financial assurance associated with the progressive remediation
once the clean tailings cover on the existing CTP is established and the low-grade stockpile is
no longer a source of AMD.
25.3 CONCLUSIONS
Avalon has the opportunity to re-commence commercial tin production from the East
Kemptville mine by establishing a small-scale operation processing an on-surface, low-grade
stockpile and higher grade, near surface occurrences within the existing pits. Assuming a tin

262
price of USD21,038/t (as forecast by the World Bank Commodity Price indicates for 2020),
and an exchange rate of CAD1.30/USD, the Project has an indicated pre-tax IRR of 15.0%
and an NPV8 of CAD17.8 million. After-tax IRR is 10.6% and NPV8 after tax is
CAD5.6 million. Initial capital cost is estimated at CAD31.5 million which the after-tax cash
flow pays back in approximately 8 years, leaving a tail of 11 years planned production.
Avalon considers the tin concentrate produced (Table 25.1) to be highly marketable. In early
2018, Avalon entered into a non-binding MOU for the sale of all its production with a well-
known company that owns a large tin smelter. The formula used by this customer for
determining concentrate pricing has been used by Avalon in the financial model.
Table 25.1
Final Tin Concentrate Analysis
Element Sn Cu Zn Fe S Pb As Cd
Value (%) 55.22 0.009 0.014 0.57 0.08 0.005 0.002 <0.0001
Element Ni Co Bi Hg Se SiO2 Mn CaF2
Value (%) 0.006 <0.001 <0.0001 <0.0001 0.0001 9.04 0.35 0.55
The re-development model, as presently conceived, is an environmental remediation Project
that will be financed through the sale of tin concentrates recovered in large part from
previously-mined mineralized material on the site.
From Day 1 of operations, Avalon’s model provides for a reduction in the long-term
environmental liability and eventual full rehabilitation of this brownfield site. By processing
the stockpiles, Avalon will be also removing a significant on-going source of acid rock
drainage and contribute to the environmental remediation of the site. The intention will be to
create a clean, re-habilitated “walk-away” site once operations are ceased.
The Project enjoys strong support from the community as well as from local politicians, First
Nations and environmental NGOs. Avalon is also in discussions with a number of local
businesses towards collaboration on future opportunities including, among others, a long-
term vision for re-development of the rehabilitated site.
The start of operations is not anticipated to be subject to approvals under the Canadian
Environmental Assessment Act 2012 (CEAA) as the mine does not exceed any of the CEAA
triggers including mine and mill tonnages. The Project will not have any new impacts to fish
or fish habitat, nor will it impact on any Federal Wildlife Areas or Migratory Bird
Sanctuaries. Final Permitting and Approval for the Project is therefore expected to be
relatively short and simple.
263
26.0 RECOMMENDATIONS
26.1 OVERVIEW
The preliminary economic assessment presents an attractive Project and the opportunity to
generate significant revenue for Avalon as well as remediating an environmental problem. It
is recommended therefore that the Project continues to the next stage of development.
26.2 RECOMMENDATIONS FOR THE NEXT PHASE OF PROJECT DEVELOPMENT
26.2.1 Resources
• The low-grade stockpile should be drilled, sampled and assayed to increase the
confidence of the mineral resource estimate from an inferred category. This work will
also confirm the overall grade and metal distribution so that a detailed plant feed
schedule can be determined. Not only will this assist with metallurgical performance,
it may also identify areas of abnormally high or low-grade zones which could require
differing processing requirements (e.g., extremely low-grade zones could be left
untreated).
• Once de-watered, a program of infill drilling is recommended for the Main and Baby
zones in order to improve the geological data base and to improve understanding of
the controls on mineralization and variability of grade. Also, it is likely there are other
areas of shallow, high grade material which could be added to the feed stock
particularly if the tin price continues to trend upwards. There are currently no plans to
recover copper or zinc/indium concentrates, but if the recent increases in the prices of
these metals continue then at some point it may become viable to extract them,
especially when processing the high-grade material from the pits and even the coarse
rocks already mined. Regular economic viability calculations should be
performed/up-dated particularly in the early years prior to commencement of mining
from the pits. Some additional drilling of the in-situ deposits might also be considered
if metal prices improve and remain stable.
• During the course of operations, additional exploration should be conducted on other
areas within and adjacent to the current property boundary in order to identify
additional resources (e.g., Duck Pond area where prospective economic
mineralization has already been identified).
26.2.2 Mining
• The mine designs and project schedules should be completed to a more detailed level
using the revised mineral resources resulting from the work recommended above.
• Mining contractors should be requested to provide a more detailed mining contract
proposal using these detailed mine plans and schedules.
• The economic potential of mining deeper (either through open pit or underground
methods) should be investigated for the Main and Baby Zone mineralization

264
26.2.3 Processing Plant
• During the next phase of engineering, the proposed modular off-site fabrication and
assembly philosophy should be adhered to as it will not only keep the up-front capital
cost lower than normal but will also facilitate either future expansion or plant
relocation to elsewhere once the East Kemptville resources have been exhausted.
• There is an opportunity to run a short pilot campaign to assess and optimize the initial
“rougher” tin recovery performance. The purpose of this work will be to further
optimize the grinding and classification circuit in order to minimize over-grinding of
cassiterite. . The pilot rougher flotation circuit operation will also provide an
opportunity to optimize performance and confirm tin recovery.
• The potential for using ore-sorting to upgrade the plant feed should be further
investigated. This could have significant impacts on capital and/or operating costs
either through the use of a smaller, cheaper processing plant or by significantly
increasing the tin output through the same plant but over a shorter time frame. The
pre-treatment by ore-sorting, of the “very low” grade stockpiles may also generate a
suitably graded material to allow plant operations over a longer period.
26.2.4 Project Implementation
• The current 16-18-month implementation schedule is tight, and where possible,
development activities should continue whilst project funding is being secured. Such
activities could include finalizing fixed equipment prices, confirming fabricators to be
used and negotiating various service and supply contracts.
• There are various minor permitting studies which still need to be completed in order
to gain site access for initiating construction activities. These studies are a priority in
order to prevent any possible impact on the implementation schedule.
• Securing a final agreement with BHP still needs to be completed but this must be
subject to finalizing a mutually beneficial transition arrangement to minimize
Avalon’s up-front exposure to the existing environmental liability.
• The start of operations is not anticipated to be subject to approvals under the
Canadian Environmental Assessment Act 2012 (CEAA) as the mine does not exceed
any of the CEAA triggers including mine and mill tonnages. The Project will not
have any new impacts to fish or fish habitat, nor will it impact on any Federal
Wildlife Areas or Migratory Bird Sanctuaries. Final Permitting and Approval for the
Project is therefore expected to be relatively short and simple.
26.3 BUDGET
The budget prepared by Avalon for the next phase of work to develop the East Kemptville
Project towards production is presented below.

265
Table 26.1
Budget for the Next Phase of Project Development
Proposed Work Cost (CAD)
Drilling and Resources Update
Drilling Stockpile and Updated Resource Estimate 250,000
Economic Study Update
Mini Pilot Plant Trial 100,000
Preliminary Engineering and detailed cost estimates 300,000
Updated economic study and NI 43-101 report 100,000
Environmental
General studies and permitting applications 100,000
Total Proposed Budget (all items) 850,000
Micon has reviewed Avalon’s budget for the next phase of work on the East Kemptville
Project and considers it to be reasonable.
266
27.0 DATE AND SIGNATURE PAGE
“Richard Gowans” {signed and sealed as of report date}
Richard Gowans, P.Eng. Report Date: August 30, 2018
President & Principal Metallurgist Effective Date: July 24, 2018
“Christopher Jacobs” {signed and sealed as of report date}
Christopher Jacobs, CEng., MIMMM Report Date: August 30, 2018
Vice President & Mining Economist Effective Date: July 24, 2018
“Dayan Anderson” {signed and sealed as of report date}
Dayan Anderson, MMSA Report Date: August 30, 2018
Senior Mining Engineer Effective Date: July 24, 2018
“Jane Spooner” {signed and sealed as of report date}
Jane Spooner, P.Geo. Report Date: August 30, 2018
Vice President Effective Date: July 24, 2018
“William Mercer” {signed and sealed as of report date}
William Mercer, P. Geo. Report Date: August 30, 2018
Effective Date: July 24, 2018
“Donald Hains” {signed and sealed as of report date}
Donald Hains, P.Geo. Report Date: August 30, 2018
Effective Date: July 24, 2018
“Reid Smith” {signed and sealed as of report date}
Reid Smith, P.Geo. Report Date: August 30, 2018
Effective Date: July 24, 2018
267
28.0 REFERENCES
AMEC Earth & Environmental (2008): East Kemptville Mine Geotechnical Inestigation of
Tailings Dams and Coarse Tailings Pile; report prepared for Rio Algom Limited, July, 2008
Avalon News Release: “Avalon reports Resource Estimate for East Kemptville Tin-Zinc-
Copper-Indium Deposit, Nova Scotia, Canada”: October 31, 2014 No. 14-13.
Avalon News Release: “Avalon announces Conceptual Economic Study confirming potential
for redevelopment of the East Kemptville Tin Deposit, Yarmouth Co., Nova Scotia”:
February 25, 2015 No. 15-02.
Avalon News Release: “Avalon provides up-date on re-development plans for the East
Kemptville Tin-Indium Project, Nova Scotia”: June 28, 2018 No. 18-10.
Geological Survey of Canada (1977): Open File Report 429, doi:10.4095/129232 Airborne
Radioactivity Maps and Profiles, Nova Scotia.
Halter, W.E., Williams-Jones, A.E., Kontak, D.J., (1996) The Role of Greisenization in
Cassiterite Precipitation at the East Kemptville Tin Deposit, Nova Scotia, Economic
Geology, Vol. 91, pp. 368-385.
Horne, R.J., King, M.S., Kontak, D.J., O’Reilly, G.A. (2005): The East Kemptville Shear
Zone: Regional Shear Related to Granite Emplacement and Mineralization, Nova Scotia
Department of Natural Resources, Report of Activities, 2005.
Hudgtec Consulting Limited (2007): 2007 Assessment Report on Phase 1 Work Program,
Special Licence 1/06, Avalon Ventures Ltd., East Kemptville, Yarmouth Co., NS;
Assessment Report AR 2007-160, Oct. 29, 2007
Hudgtec Consulting Limited (2008): 2008 Assessment Work Report on Phase 2 Work
Program, Special Licence 1/06, Avalon Ventures Ltd., East Kemptville, Yarmouth Co., NS;
Assessment Report AR 2008-217, December 12, 2008
Hudgtec Consulting Limited (2010): Assessment Report on Exploration Licences 07179,
08186 and 08720; Avalon Rare Metals Inc, East Kemptville, Yarmouth Co., N.S.; April 30,
2010; Assessment Report AR 2010-058.
International Tin Association (2018a): Tin Market Outlook, ITA presentation in Budapest,
April, 2018.
International Tin Association (2018b): Tin for Tomorrow, Contributing to Global Sustainable
Development, www.internationaltin.org/wp-content/uploads/2018/01/Tin-for-Tomorrow.pdf.
268
Kontak, D. (1990): The East Kemptville Tpoaz-Muscovite Leucogranite, Nova Scotia –
Geological Setting and Whole Rock Geochemistry; Geochemistry, Vol. 28, pp 787-825.
Kontak, D (2004): 25th Anniversary of the Discovery of North America’s Only Primary
Producer of Tin; PowerPoint presentation, Nova Scotia Departmnet of Natural Resources.
Kontack, D. and Dostal, J. (1992): The East Kemptville tin deposit, Yarmouth County,
Southwestern Nova Scotia: a lithogeochemical study of the wallrock metasedimentary rocks,
Atlantic Geology, V 28, 63-83.
Kooiman, G. (1989): Exploration Potential for Tin in the Vicinity of the East Kemptville
Mine, Nova Scotia; unpublished report prepared for Rio Algom Ltd., March, 1989.
Met-Solv Laboratories Inc. (2009): East Kemptville Project – Main Zone and Baby Zone;
Report MS1181, prepared for Avalon Rare Metals Inc., Oct. 15, 2009
Neily, P.D., Quigley, E., Benjamin, L., Stewart, B.J., and Duke, T. (2003) Ecological land
classification for Nova Scotia: volume 1 - mapping Nova Scotia’s terrestrial ecosystems.
NSDNR Report DNR 2003-2.
Nova Scotia Department of Natural Resources, Ecological Land Classification for Nova
Scotia, Report DNR 2003-2.
Patterson, J. M., (1993): Chapter 8, Granite and Associated Deposits, pp. 52-58 in
“Metalliferous Environments in Nova Scotia: Base Metals”, Technical Paper ISBN 1-
895140-06-4 (hppt://novascotia.ca/natr/meb/data/is/is22/IS22_00Chapter.pdf).
O’Reilly, G. (2003): The East Kemptville Gold Mine: Meguma-hosted Gold with a
Difference, in; From the Mineral Inventory Files, Nova Scotia Department of Natural
Resources, Summer, 2003, Volume 20, No. 3, p. 5.
(http://novascotia.ca/NATR/MEB/DATA/pubs/ftmif/mif20n3.pdf)
Rio Algom Ltd. (1993): Closure Plan, East Kemptville Tin Mine, December, 1993; report
E115 93/12 filed with Nova Scotia Department of Environment
Rio Algom Ltd. (1983): East Kemptville Tin Project Feasibility Study, report prepared by
Rio Algom Ltd and Bechtel Canada Limited, September, 1983
Rio Algom Ltd. (1983): East Kemptville Project Environmental Assessment, Vol 1 The
Environmental Report prepared by Applications Group Limited, October 1983.
Rio Algom Ltd, (2018): 2017 Annual Report East Kemptville Mine Property, May 23, 2018

269
Rio Algom Ltd, various dates:
1987-09 Monthly Report
1991-1992 Concentrate Reports
Five Year Mine Plan, 1987-1992
1988-10 Monthly Status Report
Annual Reports, 1982 – 1995
Ryan, R.J. and Smith, P.K. (1998): Review of the Mesothermal Gold Deposits in the
Meguma Group, Nova Scotia, Canada; Ore Geology Reviews, Vol. 13, April, pp 153-183.
SGS Lakefield Research Ltd. (2008): An QEMSCAN Investigation of Drill Core Samples
from the East Kemptville, Deposit, NS, Canada; SGS Project 11953-001, Dec. 11, 2008,
report prepared for Avalon Ventures Ltd.
SGS Mineral Services Ltd. (2009): An Investigation into Mineralogical and Chemical
Characterization of Ten Composite Samples from the East Kemptville Deposit, NS, Canada;
SGS Report CALR 12153-001, Oct. 6, 2009; report prepared for Avalon Rare Metals Inc.
SNC Lavalin Ltd (2009): Tailings and Water Management Optimization, East Kemptville
Mine, Nova Scotia, February, 2009.
Sykes, John, P., (2012): New Sources of Tin Mine Supply, Greenfields Research Ltd. on
behalf of ITRI Ltd.
Taylor, R. (1979); Geology of Tin Deposits, Elsevier, 543 pp.
White, C. (2010): Stratigraphy of the Lower Paleozoic Goldenville and Halifax Groups in
Southwestern Nova Scotia, Atlantic Geology, v. 46, 19 pp.
(https://journals.lib.unb.ca/index.php/ag/article/view/12465/16513).
Whiteway, Patrick (1989): East Kemptville Tin, The Northern Miner, 1-7 November 1989,
Volume 75, No. 34
Wilson, B. H., (1980): Tin, East Kemptville Report on Drilling, Assessment Rrport ME
21A/04A 51-r-25(01), 15 pp, 3 maps.
World Bank Group Commodity Markets Outlook (April 2018
World Bank Commodity Price Data (The Pink Sheet), and Commodity Markets Outlook
April 2018.

270
29.0 CERTIFICATES

271
CERTIFICATE OF QUALIFIED PERSON
Richard Gowans, P.Eng.
As the co-author of this report for Avalon Advanced Materials Inc. (Avalon) entitled “The East Kemptville Tin
Production and Site Remediation Project Preliminary Economic Assessment, Nova Scotia, Canada”, effective
date July 24, 2018, I, Richard Gowans, do hereby certify that:
1. I am employed as the President and Principal Metallurgist by, and carried out this assignment for
Micon International Limited, Suite 900, 390 Bay Street Toronto, Ontario, M5H 2Y2. tel. (416) 362-
5135 fax (416) 362-5763 e-mail: [email protected]
2. I hold the following academic qualifications:
B.Sc. (Hons) Minerals Engineering, The University of Birmingham, U.K., 1980
3. I am a registered Professional Engineer of Ontario (membership number 90529389); as well, I am a
member in good standing of the Canadian Institute of Mining, Metallurgy and Petroleum.
4. I have worked as an extractive metallurgist in the minerals industry for over 35 years. Throughout my
career I have worked on and managed a wide assortment of feasibility studies and technical audits on
international industrial mineral, precious and base metal projects.
5. I do, by reason of education, experience and professional registration, fulfill the requirements of a
Qualified Person as defined in NI 43-101. My work experience includes the management of technical
studies and design of numerous metallurgical testwork programs and metallurgical processing plants.
6. I have not visited the Property that is the subject of this report.
7. I am responsible for Sections 1, 2, 3, 4, 5, 13, 17, 18, 21, 25 and 26 of this Technical Report.
8. I am independent of Avalon and related entities, as defined in Section 1.5 of NI 43-101.
9. I have not worked on or been associated with the Property prior to this Technical Report.
10. I have read NI 43-101 and the Sections of this report for which I am responsible have been prepared in
compliance with the instrument.
11. As of the date of this certificate to the best of my knowledge, information and belief, the sections of
this Technical Report for which I am responsible contain all scientific and technical information that is
required to be disclosed to make this report not misleading.
Report Date: August 30, 2018
Effective Date: July 24, 2018
“Richard Gowans” {signed and sealed as of report date}
Richard Gowans, B.Sc., P.Eng.
President & Principal Metallurgist
272
CERTIFICATE OF QUALIFIED PERSON
Christopher Jacobs, CEng, MIMMM
As the co-author of this report for Avalon Advanced Materials Inc. (Avalon) entitled “The East Kemptville Tin
Production and Site Remediation Project Preliminary Economic Assessment, Nova Scotia, Canada”, effective
date July 24, 2018, I, Christopher Jacobs, do hereby certify that:
1. I am employed as a Vice President and Mining Economist by, and carried out this assignment for,
Micon International Limited, 900 – 390 Bay Street, Toronto, Ontario M5H 2Y2. tel. (416) 362-5135,
email: [email protected].
2. I hold the following academic qualifications:
B.Sc. (Hons) Geochemistry, University of Reading, 1980;
M.B.A., Gordon Institute of Business Science, University of Pretoria, 2004.
3. I am a Chartered Engineer registered with the Engineering Council of the U.K.
(registration number 369178).
4. Also, I am a professional member in good standing of: The Institute of Materials, Minerals and
Mining; and The Canadian Institute of Mining, Metallurgy and Petroleum (Member).
5. I have worked in the minerals industry for more than 35 years; my work experience includes 10 years
as an exploration and mining geologist on gold, platinum, copper/nickel and chromite deposits; 10
years as a technical/operations manager in both open-pit and underground mines; 3 years as strategic
(mine) planning manager and the remainder as an independent consultant when I have worked on a
variety of deposits including cobalt, copper and gold.
6. I have not visited the Property that is the subject of this report.
7. I am responsible for Section 22 of this Technical Report.
8. I am independent of Avalon and related entities, as defined in Section 1.5 of NI 43-101.
9. I have not worked on or been associated with the Property prior to this Technical Report.
10. I have read NI 43-101 and the Sections of this report for which I am responsible have been prepared in
compliance with the instrument.
11. As of the date of this certificate to the best of my knowledge, information and belief, the sections of
this Technical Report for which I am responsible contain all scientific and technical information that is
required to be disclosed to make this report not misleading.
Report Date: August 30, 2018
Effective Date: July 24, 2018
“Christopher Jacobs” {signed and sealed as of report date}
Christopher Jacobs, CEng, MIMMM
Vice President & Mining Economist
273
CERTIFICATE OF QUALIFIED PERSON
Dayan Anderson, M.S., MMSA(QP)
As the co-author of this report for Avalon Advanced Materials Inc. (Avalon) entitled “The East Kemptville Tin
Production and Site Remediation Project Preliminary Economic Assessment, Nova Scotia, Canada”, effective
date July 24, 2018, I, Dayan Anderson, do hereby certify that:
1. I am the Principal of Onyx Mining Services, California, and I carried out this assignment as an
associate for Micon International Limited, Suite 900, 390 Bay Street, Toronto, Ontario, M5H 2Y2
e-mail: [email protected].
2. I hold the following academic qualifications:
B.S. Mining Engineering, Colorado School of Mines (1997)
M.S. Environmental Studies, Green Mountain Collage (2018)
3. I am a Qualified Professional (QP) Member of the Mining & Metallurgical Society of America
(MMSA). I am also a member in good standing of the Society for Mining, Metallurgy, and
Exploration.
4. I have worked in the minerals industry for over 20 years across the coal, iron ore, industrial minerals,
and base and precious metals sectors.
5. I do, by reason of education, experience and professional registration, fulfill the requirements of a
Qualified Person as defined in NI 43-101. My work experience includes 2 years in ore control and
operations, 6 years in strategic and tactical mine planning, 3 years of permitting and environmental
management, 1 year as mine manager, and the remainder as an independent consultant working on
technical studies, operational audits and due diligence assessments.
6. I have not visited the Property that is the subject of this report.
7. I am responsible for Sections 15,16, and portions of Sections 20.3 and 20.4 pertaining to the integrated
mine, waste backfill and tailings deposition strategy of this Technical Report.
8. I am independent of Avalon and related entities, as defined in Section 1.5 of NI 43-101.
9. I have not worked on or been associated with the Property prior to this Technical Report.
10. I have read NI 43-101 and the Sections of this report for which I am responsible have been prepared in
compliance with the instrument.
11. As of the date of this certificate to the best of my knowledge, information and belief, the sections of
this Technical Report for which I am responsible contain all scientific and technical information that is
required to be disclosed to make this report not misleading.
Report Date: August 30, 2018
Effective Date: July 24, 2018
“Dayan Anderson” {signed and sealed as of report date}
Dayan Anderson, M.S., MMSA(QP)
Senior Mining Engineer

274
CERTIFICATE OF QUALIFIED PERSON
Jane Spooner, M.Sc., P.Geo.
As the co-author of this report for Avalon Advanced Materials Inc. (Avalon) entitled “The East Kemptville Tin
Production and Site Remediation Project Preliminary Economic Assessment, Nova Scotia, Canada”, effective
date July 24, 2018, I, Jane Spooner, do hereby certify that:
1. I am employed as an Associate Specialist in Mineral Market Analysis and carried out this assignment
for
Micon International Limited
Suite 900, 390 Bay Street
Toronto, Ontario M5H 2Y2
tel. (416) 362-5135 fax (416) 362-5763
e-mail: [email protected]
2. I hold the following academic qualifications:
B.Sc. (Hons) Geology, University of Manchester, U.K. 1972
M.Sc. Environmental Resources, University of Salford, U.K. 1973
3. I am a member of the Association of Professional Geoscientists of Ontario (membership number
0990); as well, I am a member in good standing of the Canadian Institute of Mining, Metallurgy and
Petroleum.
4. I have worked as a specialist in mineral market analysis for over 30 years.
5. I do, by reason of education, experience and professional registration, fulfill the requirements of a
Qualified Person as defined in NI 43-101. My work experience includes the analysis of markets for
base and precious metals, industrial and specialty minerals, coal and uranium; project due diligence
assessments and project management.
6. I have not visited the Property that is the subject of this report.
7. I am responsible for Section 19 of this Technical Report.
8. I am independent of Avalon and related entities, as defined in Section 1.5 of NI 43-101.
9. I have not worked on or been associated with the Property prior to this Technical Report.
10. I have read NI 43-101 and the Sections of this report for which I am responsible have been prepared in
compliance with the instrument.
11. As of the date of this certificate to the best of my knowledge, information and belief, the sections of
this Technical Report for which I am responsible contain all scientific and technical information that is
required to be disclosed to make this report not misleading.
Report Date: XXX XX, 2018
Effective Date: July 24, 2018
“Jane Spooner” {signed and sealed as of report date}
Jane Spooner, M.Sc., P.Geo.
Vice President

275
CERTIFICATE OF QUALIFIED PERSON
William Mercer, P. Geo.
As the co-author of this report for Avalon Advanced Materials Inc. (Avalon) entitled “The East Kemptville Tin
Production and Site Remediation Project Preliminary Economic Assessment, Nova Scotia, Canada”, effective
date July 24, 2018, I, William Mercer, do hereby certify that:
1. I am employed as the Vice President, Exploration by Avalon Advanced Materials Inc. (Avalon) at
Suite 1901, 130 Adelaide Street West, Toronto, Ontario, M5H 3P5, telephone 416 364 4938, email
2. I hold the following academic qualifications:
BSc (Geology), Edinburgh University, 1968
PhD (Geology), McMaster University, 1975
3. I am a member of the Association of Professional Geoscientists of Nova Scotia (membership number
166) and the Association of Professional Geoscientists of Ontario (membership number 0186).
4. I have worked in mineral exploration for over 40 years.
5. I do, by reason of education, experience and professional registration, fulfill the requirements of a
Qualified Person as defined in NI 43-101. My work experience includes field exploration and senior
level supervision as manager and chief geologist of exploration in Canada, Latin America and
elsewhere for commodities including base and precious metals, industrial and specialty minerals,
bauxite and uranium; operating mine due diligence assessments and project management.
6. I visited the Property that is the subject of this report on numerous occasions between 2014 and 2016.
7. I am responsible for Sections 6 to 12, 14, 23 and 24 of this Technical Report.
8. I am not independent of Avalon and related entities, as defined in Section 1.5 of NI 43-101.
9. I have worked on or been associated with the Property since 2007.
10. I have read NI 43-101 and the Sections of this report for which I am responsible have been prepared in
compliance with the instrument.
11. As of the date of this certificate to the best of my knowledge, information and belief, the sections of
this Technical Report for which I am responsible contain all scientific and technical information that is
required to be disclosed to make this report not misleading.
Report Date: August 30, 2018
Effective Date of PEA: July 24, 2018
Effective Date of Updated Mineral Resource Estimates: May 7, 2018
“William Mercer” {signed and sealed as of report date}
William Mercer, P.Geo.
276
CERTIFICATE OF QUALIFIED PERSON
Donald H. Hains, P.Geo.
As the co-author of this report for Avalon Advanced Materials Inc. (Avalon) entitled “The East Kemptville Tin
Production and Site Remediation Project Preliminary Economic Assessment, Nova Scotia, Canada”, effective
date July 24, 2018, I, Donald H. Hains, do hereby certify that:
1. I am President of Hains Engineering Company Limited, a company duly authorized by Professional
Engineers of Ontario, with offices at 2275 Lakeshore Blvd. West, Suite 515, Toronto, ON M8V 3Y3.
2. I am a graduate of Queen’s University, Kingston, ON with a degree in Chemistry (1974) and a
graduate of Dalhousie University, Halifax, NS with an MBA (1976):
3. I am registered as a Professional Geoscientist in the Province of Ontario (Reg. # 0494). I have worked
as a geologist and minerals economist for a since my graduation. My relevant experience for the
purpose of the Technical Report includes:
• NI 43-101 Technical report on MSFA Ltda tin deposit, Sao Francisco de Assis, Pará, Brazil (2014)
• Due diligence review of Abu Dabbab tin-tantalum project, Egypt, 2011 and 2013
• Due diligence review of alluvial tin/tantalite/columbite project in Sierra Leone (2013)
• Due diligence reviews and technical report on tin/tantalite/lithium pegmatite deposits in Canada
(1998, 2001, 2004, 2005, 2011, 2012), China (2004, 2005), Mozambique (2010, 2011), Zimbabwe
(2000, 2001)
4. I visited the East Kemptville property on July 23-25 and September 3, 2014.
5. I am responsible for the Resource Estimate of the Low-Grade Stockpile and the text relevant to this
resource estimate within the Technical Report.
6. I am independent of Avalon and related entities, as defined in Section 1.5 of NI 43-101.
7. I have had no prior involvement with the property that is the subject of this Report.
8. I have read the definition of "qualified person" set out in National Instrument 43-101 (NI 43-101) and
certify that by reason of my education, affiliation with a professional association (as defined in NI 43-
101) and past relevant work experience, I fulfill the requirements to be a "qualified person" for the
purposes of NI 43-101.
9. To the best of my knowledge, information, and belief, this Report contains all scientific and technical
information that is required to be disclosed to make the relevant section not misleading.
Report Date: XXX XX, 2018
Effective Date: July 24, 2018
“Donald H. Hains” {signed and sealed as of report date}
Donald H. Hains, P.Geo.

277
CERTIFICATE OF QUALIFIED PERSON
Reid Smith, M.A.Sc., P. Geo.
As the co-author of this report for Avalon Advanced Materials Inc. (Avalon) entitled “The East Kemptville Tin
Production and Site Remediation Project Preliminary Economic Assessment, Nova Scotia, Canada”, effective
date July 24, 2018, I, Reid Smith, do hereby certify that:
1. I am the Team Leader, Environmental Services (Atlantic), Stantec Consulting Ltd., 102-40 Highfield
Park Drive, Dartmouth, NS B3A OA3 e-mail: [email protected]
2. I hold the following academic qualifications:
B.Sc. Acadia University (2004)
Masters of Applied Science, Civil Engineering, Queen’s University (2010)
3. I am a Qualified Professional (QP), and hold a Professional Geoscientist certification (NS, ON,
NWT/NU)
4. I have worked in the minerals industry for over 7 years; my work experience has included consulting
on environmental, hydrogeological and/or mine closure planning for proponents and/or regulators on
projects such as: the Snap Lake, Gahcho Kue, Ekati and Diavik Diamond Projects (NWT), Mary River
Iron Project (NU), Meadowbank Gold Project (NU), Touquoy Gold Project (NS) and GGM Hardrock
Project (ON).
5. I do, by reason of education, experience and professional registration, fulfill the requirements of a
Qualified Person as defined in NI 43-101. My work experience includes environmental consulting and
mine closure planning for several proposed and/or operating mining projects.
6. I have not visited the Property that is the subject of this report.
7. I am responsible for the section entitled “Environment and Socioeconomic Conditions”, that provides a
background of provincial and federal regulatory permitting approval processes, a baseline biophysical
description and public and indigenous engagement, of Chapter 20 of this Technical Report.
8. I am independent of Avalon and related entities, as defined in Section 1.5 of NI 43-101.
9. I have worked on and been associated with the Property prior to this Technical Report.
10. I have read NI 43-101 and the Sections of this report for which I am responsible have been prepared in
compliance with the instrument.
11. As of the date of this certificate to the best of my knowledge, information and belief, the sections of
this Technical Report for which I am responsible contain all scientific and technical information that is
required to be disclosed to make this report not misleading.
Report Date: August 30, 2018
Effective Date: July 24, 2018
“Reid Smith” {signed and sealed as of report date}
Reid Smith, M.A.Sc., P. Geo.