avaya™ call management system (cms)...
TRANSCRIPT

Avaya™ Call Management System (CMS) SupervisorVersion 11Report Designer User Guide
585-210-707Comcode 700206642
Issue 1May 2002
Compas ID 90604
© 2002, Avaya Inc.All Rights Reserved
NoticeEvery effort was made to ensure that the information in this book was complete and accurate at the time of printing. However, information is subject to change.
Preventing Toll Fraud“Toll fraud” is the unauthorized use of your telecommunications system by an unauthorized party (for example, a person who is not a corporate employee, agent, subcontractor, or working on your company's behalf). Be aware that there may be a risk of toll fraud associated with your system and that, if toll fraud occurs, it can result in substantial additional charges for your telecommunications services.
Avaya Fraud InterventionIf you suspect that you are being victimized by toll fraud and you need technical support or assistance, call Technical Service Center Toll Fraud Intervention Hotline at +1 800 643 2353.
Providing Telecommunications SecurityTelecommunications security (of voice, data, and/or video communications) is the prevention of any type of intrusion to (that is, either unauthorized or malicious access to or use of your company's telecommunications equipment) by some party.Your company's “telecommunications equipment” includes both this Avaya product and any other voice/data/video equipment that could be accessed via this Avaya product (that is, “networked equipment”).
An “outside party” is anyone who is not a corporate employee, agent, subcontractor, or working on your company's behalf. Whereas, a “malicious party” is anyone (including someone who may be otherwise authorized) who accesses your telecommunications equipment with either malicious or mischievous intent.
Such intrusions may be either to/through synchronous (time-multiplexed and/or circuit-based) or asynchronous (character-, message-, or packet-based) equipment or interfaces for reasons of:
• Utilization (of capabilities special to the accessed equipment)• Theft (such as, of intellectual property, financial assets, or
toll-facility access)• Eavesdropping (privacy invasions to humans)• Mischief (troubling, but apparently innocuous, tampering)• Harm (such as harmful tampering, data loss or alteration,
regardless of motive or intent)
Be aware that there may be a risk of unauthorized intrusions associated with your system and/or its networked equipment. Also realize that, if such an intrusion should occur, it could result in a variety of losses to your company (including but not limited to, human/data privacy, intellectual property, material assets, financial resources, labor costs, and/or legal costs).
Your Responsibility for Your Company’s Telecommunications SecurityThe final responsibility for securing both this system and its networked equipment rests with you - an Avaya customer's system administrator, your telecommunications peers, and your managers. Base the fulfillment of your responsibility on acquired knowledge and resources from a variety of sources including but not limited to:
• Installation documents• System administration documents• Security documents• Hardware-/software-based security tools• Shared information between you and your peers• Telecommunications security experts
To prevent intrusions to your telecommunications equipment, you and your peers should carefully program and configure your:
• Avaya-provided telecommunications systems and their inter-faces
• Avaya-provided software applications, as well as their under-lying hardware/software platforms and interfaces
• Any other equipment networked to your Avaya products.
Federal Communications Commission StatementPart 15: Class A Statement. This equipment has been tested and found to comply with the limits for a Class A digital device, pursuant to Part 15 of the FCC Rules. These limits are designed to provide reasonable protection against harmful interference when the equipment is operated in a commercial environment. This equipment generates, uses, and can radiate radio frequency energy and, if not installed and used in accordance with the instruction manual, may cause harmful interference to radio communications. Operation of this equipment in a residential area is likely to cause harmful interference, in which case the user will be required to correct the interference at his own expense.
European Union Declaration of ConformityAvaya Business Communications Systems declares that equipment specified in this document conforms to the referenced European Union (EU) Directives and Harmonized Standards listed below:
EMC Directive 89/336/EECLow Voltage Directive 73/23/EEC
The “CE” mark affixed to the equipment means that it conforms to the above Directives.
TrademarksINFORMIX is a registered trademark of Informix Software, Inc.Microsoft Windows is a trademark of Microsoft Corp.Pentium is a registered trademark of Intel Corporation.
Solaris is a registered trademark of Sun Microsystems, Inc.Sun is a registered trademark of Sun Microsystems, Inc.UNIX is a registered trademark of Novell, Inc.
Windows 95 is a trademark of Microsoft Corp.Windows 98 is a trademark of Microsoft Corp.Windows NT is a registered trademark of Microsoft Corp.
Windows ME is a trademark of Microsoft Corp.Windows XP is a trademark of Microsoft Corp.
Ordering InformationCall: Avaya Publications Center
Voice +1 800 457 1235Fax +1 800 457 1764International Voice +1 410 568 3680International Fax+1 410 891 0207
Write: Globalware Solutions200 Ward Hill AvenueHverhill, MA 01835 USAAttention: Avaya Account Manager
Email: [email protected]: Document No. 585-210-707, Issue 1
May 2002You can be placed on a Standing Order list for this and other documents you may need. Standing Order will enable you to automatically receive updated versions of individual documents or document sets, billed to account information that you provide. For more information on Standing Orders, or to be put on a list to receive future issues of this document, please contact the Avaya Publications Center.
Avaya National Customer Care CenterAvaya provides a telephone number for you to use to report problems or to ask questions about your contact center. The support telephone number is 1-800-242-2121.
Avaya Web PageFor information about Avaya products and service, go to www.avaya.com. For Avaya product documentation, go to www.avayadocs.com.
CommentsTo comment on this document, return the comment card at the end of the document.
AcknowledgmentThis document was written by the CRM Development group of Avaya.

Issue 1 May 2002 3
Contents 3
Introduction
What you need to know . . . . . . . . . . . . . . . . . . . . . . . . . . . . . . . 13Organization . . . . . . . . . . . . . . . . . . . . . . . . . . . . . . . . . . . . 13
About Report Designer . . . . . . . . . . . . . . . . . . . . . . . . . . . . . . . . . 14What is Report Designer?. . . . . . . . . . . . . . . . . . . . . . . . . . . . . . 14How do you use Report Designer? . . . . . . . . . . . . . . . . . . . . . . . . . 14What kinds of reports can I create? . . . . . . . . . . . . . . . . . . . . . . . . . 14
Contents of this document . . . . . . . . . . . . . . . . . . . . . . . . . . . . . . . 15Conventions used in this document . . . . . . . . . . . . . . . . . . . . . . . . . . . 17
About Windows . . . . . . . . . . . . . . . . . . . . . . . . . . . . . . . . . . 17Window graphics . . . . . . . . . . . . . . . . . . . . . . . . . . . . . . . . . . 17Typographical conventions . . . . . . . . . . . . . . . . . . . . . . . . . . . . . 17
Related documents . . . . . . . . . . . . . . . . . . . . . . . . . . . . . . . . . . . 19
Report Wizard
Organization of general information . . . . . . . . . . . . . . . . . . . . . . . . . 21Organization of procedures . . . . . . . . . . . . . . . . . . . . . . . . . . . . . 21
About the Report Wizard . . . . . . . . . . . . . . . . . . . . . . . . . . . . . . . . 22What is Report Wizard?. . . . . . . . . . . . . . . . . . . . . . . . . . . . . . . 22Report Wizard and Report Designer . . . . . . . . . . . . . . . . . . . . . . . . . 22Facts about Report Wizard . . . . . . . . . . . . . . . . . . . . . . . . . . . . . 22Report Wizard command buttons . . . . . . . . . . . . . . . . . . . . . . . . . . 23
Wizard steps . . . . . . . . . . . . . . . . . . . . . . . . . . . . . . . . . . . . . . 25Start the Report Wizard . . . . . . . . . . . . . . . . . . . . . . . . . . . . . . . . . 26
Before you begin . . . . . . . . . . . . . . . . . . . . . . . . . . . . . . . . . . 26Start with the toolbar icon . . . . . . . . . . . . . . . . . . . . . . . . . . . . . . 26
The Select a Report Type page . . . . . . . . . . . . . . . . . . . . . . . . . . . . . 28Example . . . . . . . . . . . . . . . . . . . . . . . . . . . . . . . . . . . . . . 28Types of reports . . . . . . . . . . . . . . . . . . . . . . . . . . . . . . . . . . 29
The Select a Report Layout page . . . . . . . . . . . . . . . . . . . . . . . . . . . . 30The Selection Layout page . . . . . . . . . . . . . . . . . . . . . . . . . . . . . . . 31
Example . . . . . . . . . . . . . . . . . . . . . . . . . . . . . . . . . . . . . . 31Define sections . . . . . . . . . . . . . . . . . . . . . . . . . . . . . . . . . . . 32
Avaya Call Management System SupervisorVersion 11
Report Designer
Contents

Contents
4 Avaya CMS Supervisor Report Designer
The Select a Data Group page . . . . . . . . . . . . . . . . . . . . . . . . . . . . . 33Example . . . . . . . . . . . . . . . . . . . . . . . . . . . . . . . . . . . . . . 33Levels of data groups . . . . . . . . . . . . . . . . . . . . . . . . . . . . . . . . 33First level . . . . . . . . . . . . . . . . . . . . . . . . . . . . . . . . . . . . . 34Second level . . . . . . . . . . . . . . . . . . . . . . . . . . . . . . . . . . . . 34Third level . . . . . . . . . . . . . . . . . . . . . . . . . . . . . . . . . . . . . 34Expand and collapse categories. . . . . . . . . . . . . . . . . . . . . . . . . . . 35
The Select Data Items page . . . . . . . . . . . . . . . . . . . . . . . . . . . . . . 36Example . . . . . . . . . . . . . . . . . . . . . . . . . . . . . . . . . . . . . . 36Box and button descriptions. . . . . . . . . . . . . . . . . . . . . . . . . . . . . 37Data item column descriptions . . . . . . . . . . . . . . . . . . . . . . . . . . . 37About No Pre-selection . . . . . . . . . . . . . . . . . . . . . . . . . . . . . . . 38
Procedures for the Select Data Items page . . . . . . . . . . . . . . . . . . . . . . . 39Filter data group items . . . . . . . . . . . . . . . . . . . . . . . . . . . . . . . 39Sort data group items. . . . . . . . . . . . . . . . . . . . . . . . . . . . . . . . 40Move data group items from one box to another . . . . . . . . . . . . . . . . . . . 40Reposition data group items . . . . . . . . . . . . . . . . . . . . . . . . . . . . 41Create custom report headings . . . . . . . . . . . . . . . . . . . . . . . . . . . 41
The Select Chart Format page . . . . . . . . . . . . . . . . . . . . . . . . . . . . . 42Example . . . . . . . . . . . . . . . . . . . . . . . . . . . . . . . . . . . . . . 42Field descriptions. . . . . . . . . . . . . . . . . . . . . . . . . . . . . . . . . . 43Available chart formats . . . . . . . . . . . . . . . . . . . . . . . . . . . . . . . 43
The Select Table Format page . . . . . . . . . . . . . . . . . . . . . . . . . . . . . 45Example . . . . . . . . . . . . . . . . . . . . . . . . . . . . . . . . . . . . . . 45Field descriptions. . . . . . . . . . . . . . . . . . . . . . . . . . . . . . . . . . 46Example of a row-oriented report . . . . . . . . . . . . . . . . . . . . . . . . . . 46Example of a column-oriented report . . . . . . . . . . . . . . . . . . . . . . . . 46
The Change Input Captions page . . . . . . . . . . . . . . . . . . . . . . . . . . . . 47Example . . . . . . . . . . . . . . . . . . . . . . . . . . . . . . . . . . . . . . 47Input Prompts . . . . . . . . . . . . . . . . . . . . . . . . . . . . . . . . . . . 47
The Preview Option page . . . . . . . . . . . . . . . . . . . . . . . . . . . . . . . . 48Example . . . . . . . . . . . . . . . . . . . . . . . . . . . . . . . . . . . . . . 48Two-section report . . . . . . . . . . . . . . . . . . . . . . . . . . . . . . . . . 48
The Save Report page . . . . . . . . . . . . . . . . . . . . . . . . . . . . . . . . . 49Example . . . . . . . . . . . . . . . . . . . . . . . . . . . . . . . . . . . . . . 49Field descriptions. . . . . . . . . . . . . . . . . . . . . . . . . . . . . . . . . . 50
The Finish page . . . . . . . . . . . . . . . . . . . . . . . . . . . . . . . . . . . . 51Example . . . . . . . . . . . . . . . . . . . . . . . . . . . . . . . . . . . . . . 51Run Report for ACD . . . . . . . . . . . . . . . . . . . . . . . . . . . . . . . . 51Run Report . . . . . . . . . . . . . . . . . . . . . . . . . . . . . . . . . . . . 51Edit Report in Report Designer . . . . . . . . . . . . . . . . . . . . . . . . . . . 52Run or Edit report at a later time . . . . . . . . . . . . . . . . . . . . . . . . . . 52

Contents
Issue 1 May 2002 5
Use Report Manager
Organization of general information . . . . . . . . . . . . . . . . . . . . . . . . . 53Organization of procedures . . . . . . . . . . . . . . . . . . . . . . . . . . . . . 53
About Report Manager . . . . . . . . . . . . . . . . . . . . . . . . . . . . . . . . . 54What is Report Manager? . . . . . . . . . . . . . . . . . . . . . . . . . . . . . . 54The Reports Selector window . . . . . . . . . . . . . . . . . . . . . . . . . . . . 54Buttons on the Report Selector window . . . . . . . . . . . . . . . . . . . . . . . 54
View or change a report’s properties. . . . . . . . . . . . . . . . . . . . . . . . . . . 56Copy a report to the designer category . . . . . . . . . . . . . . . . . . . . . . . . . 57
Where to access your reports . . . . . . . . . . . . . . . . . . . . . . . . . . . . 57Who can modify your reports . . . . . . . . . . . . . . . . . . . . . . . . . . . . 57Procedure . . . . . . . . . . . . . . . . . . . . . . . . . . . . . . . . . . . . . 57
Copy a designer report to a file . . . . . . . . . . . . . . . . . . . . . . . . . . . . . 60Copy a designer report from a file . . . . . . . . . . . . . . . . . . . . . . . . . . . . 61Delete a report from the designer category. . . . . . . . . . . . . . . . . . . . . . . . 62Open Report Designer with Edit or New . . . . . . . . . . . . . . . . . . . . . . . . . 63
Report Designer basics
Organization of general information . . . . . . . . . . . . . . . . . . . . . . . . . 65Organization of procedures . . . . . . . . . . . . . . . . . . . . . . . . . . . . . 65
Report Designer menus. . . . . . . . . . . . . . . . . . . . . . . . . . . . . . . . . 66Report . . . . . . . . . . . . . . . . . . . . . . . . . . . . . . . . . . . . . . . 66Edit . . . . . . . . . . . . . . . . . . . . . . . . . . . . . . . . . . . . . . . . 67Format . . . . . . . . . . . . . . . . . . . . . . . . . . . . . . . . . . . . . . . 68Options . . . . . . . . . . . . . . . . . . . . . . . . . . . . . . . . . . . . . . 69Insert . . . . . . . . . . . . . . . . . . . . . . . . . . . . . . . . . . . . . . . 70Help . . . . . . . . . . . . . . . . . . . . . . . . . . . . . . . . . . . . . . . . 71
Access online database definitions . . . . . . . . . . . . . . . . . . . . . . . . . . . 72Example . . . . . . . . . . . . . . . . . . . . . . . . . . . . . . . . . . . . . . 72Procedure . . . . . . . . . . . . . . . . . . . . . . . . . . . . . . . . . . . . . 72
Start Report Designer. . . . . . . . . . . . . . . . . . . . . . . . . . . . . . . . . . 73About user permissions . . . . . . . . . . . . . . . . . . . . . . . . . . . . . . . 73Different ways to start Report Designer . . . . . . . . . . . . . . . . . . . . . . . 73Design Mode window . . . . . . . . . . . . . . . . . . . . . . . . . . . . . . . . 73
Exit Report Designer . . . . . . . . . . . . . . . . . . . . . . . . . . . . . . . . . . 74Create a new report . . . . . . . . . . . . . . . . . . . . . . . . . . . . . . . . . . 75
Before you begin . . . . . . . . . . . . . . . . . . . . . . . . . . . . . . . . . . 75Procedure . . . . . . . . . . . . . . . . . . . . . . . . . . . . . . . . . . . . . 75
Edit an existing report . . . . . . . . . . . . . . . . . . . . . . . . . . . . . . . . . 77

Contents
6 Avaya CMS Supervisor Report Designer
Design mode basics
Organization of procedures . . . . . . . . . . . . . . . . . . . . . . . . . . . . . 79Copy an item and paste the item into the same report . . . . . . . . . . . . . . . . . . 80Copy and paste items . . . . . . . . . . . . . . . . . . . . . . . . . . . . . . . . . 81
Copy from a Designer report . . . . . . . . . . . . . . . . . . . . . . . . . . . . 81Copy from a report that is not a Designer report . . . . . . . . . . . . . . . . . . . 81
Cut an item . . . . . . . . . . . . . . . . . . . . . . . . . . . . . . . . . . . . . . 82Delete an item . . . . . . . . . . . . . . . . . . . . . . . . . . . . . . . . . . . . . 83
Procedure . . . . . . . . . . . . . . . . . . . . . . . . . . . . . . . . . . . . . 83Restore an accidently-deleted item . . . . . . . . . . . . . . . . . . . . . . . . . 83
Drag and drop to arrange items . . . . . . . . . . . . . . . . . . . . . . . . . . . . . 84Resize an item . . . . . . . . . . . . . . . . . . . . . . . . . . . . . . . . . . . . . 85Select and move multiple items . . . . . . . . . . . . . . . . . . . . . . . . . . . . . 86
Select multiple items . . . . . . . . . . . . . . . . . . . . . . . . . . . . . . . . 86Move multiple items . . . . . . . . . . . . . . . . . . . . . . . . . . . . . . . . 86
Change the width of a column in a table . . . . . . . . . . . . . . . . . . . . . . . . . 87Change the column headings . . . . . . . . . . . . . . . . . . . . . . . . . . . . . . 88Align fields . . . . . . . . . . . . . . . . . . . . . . . . . . . . . . . . . . . . . . . 89
Align menu items . . . . . . . . . . . . . . . . . . . . . . . . . . . . . . . . . . 89How to use align . . . . . . . . . . . . . . . . . . . . . . . . . . . . . . . . . . 89
Scale to page . . . . . . . . . . . . . . . . . . . . . . . . . . . . . . . . . . . . . 90
Edit | Inputs
Organization of general information . . . . . . . . . . . . . . . . . . . . . . . . . 91Organization of procedures . . . . . . . . . . . . . . . . . . . . . . . . . . . . . 91
The Report Input fields . . . . . . . . . . . . . . . . . . . . . . . . . . . . . . . . . 92The Report Input window . . . . . . . . . . . . . . . . . . . . . . . . . . . . . . 92The Define Input window . . . . . . . . . . . . . . . . . . . . . . . . . . . . . . 92Example of input window . . . . . . . . . . . . . . . . . . . . . . . . . . . . . . 92How CMS stores and retrieves data . . . . . . . . . . . . . . . . . . . . . . . . . 93
Information about how to add input fields . . . . . . . . . . . . . . . . . . . . . . . . 94Why define an input field? . . . . . . . . . . . . . . . . . . . . . . . . . . . . . 94Add only relevant information . . . . . . . . . . . . . . . . . . . . . . . . . . . . 94Fields you do not define . . . . . . . . . . . . . . . . . . . . . . . . . . . . . . 94Related topic . . . . . . . . . . . . . . . . . . . . . . . . . . . . . . . . . . . . 94
Input fields for pattern matching . . . . . . . . . . . . . . . . . . . . . . . . . . . . . 95What is pattern matching? . . . . . . . . . . . . . . . . . . . . . . . . . . . . . 95Database items that allow search . . . . . . . . . . . . . . . . . . . . . . . . . . 95Example using an asterisk . . . . . . . . . . . . . . . . . . . . . . . . . . . . . 95Example using a question mark . . . . . . . . . . . . . . . . . . . . . . . . . . . 96Example using String as an input field . . . . . . . . . . . . . . . . . . . . . . . . 96
Input types . . . . . . . . . . . . . . . . . . . . . . . . . . . . . . . . . . . . . . . 97Add input fields to the input window . . . . . . . . . . . . . . . . . . . . . . . . . . . 100
Before you begin . . . . . . . . . . . . . . . . . . . . . . . . . . . . . . . . . . 100Procedure . . . . . . . . . . . . . . . . . . . . . . . . . . . . . . . . . . . . . 100

Contents
Issue 1 May 2002 7
Delete input fields from the input window . . . . . . . . . . . . . . . . . . . . . . . . 101Before you begin . . . . . . . . . . . . . . . . . . . . . . . . . . . . . . . . . . 101Procedure . . . . . . . . . . . . . . . . . . . . . . . . . . . . . . . . . . . . . 101
Edit the order of input fields . . . . . . . . . . . . . . . . . . . . . . . . . . . . . . . 102Edit the appearance of input fields. . . . . . . . . . . . . . . . . . . . . . . . . . . . 103
Example . . . . . . . . . . . . . . . . . . . . . . . . . . . . . . . . . . . . . . 103Edit columns . . . . . . . . . . . . . . . . . . . . . . . . . . . . . . . . . . . . 103
Set up inputs for a multi-ACD report . . . . . . . . . . . . . . . . . . . . . . . . . . . 105Types of multi-ACD reports . . . . . . . . . . . . . . . . . . . . . . . . . . . . . 105Procedure . . . . . . . . . . . . . . . . . . . . . . . . . . . . . . . . . . . . . 105
View the input window . . . . . . . . . . . . . . . . . . . . . . . . . . . . . . . . . 108When to view. . . . . . . . . . . . . . . . . . . . . . . . . . . . . . . . . . . . 108Return to design mode . . . . . . . . . . . . . . . . . . . . . . . . . . . . . . . 108
Edit | Queries
Organization of general information . . . . . . . . . . . . . . . . . . . . . . . . . 109Organization of procedures . . . . . . . . . . . . . . . . . . . . . . . . . . . . . 109
About queries . . . . . . . . . . . . . . . . . . . . . . . . . . . . . . . . . . . . . 110What are queries? . . . . . . . . . . . . . . . . . . . . . . . . . . . . . . . . . 110About columns and rows . . . . . . . . . . . . . . . . . . . . . . . . . . . . . . 110
The Query Assistant window . . . . . . . . . . . . . . . . . . . . . . . . . . . . . . 111Example . . . . . . . . . . . . . . . . . . . . . . . . . . . . . . . . . . . . . . 111Query Assistant input fields . . . . . . . . . . . . . . . . . . . . . . . . . . . . . 112Data Item definition . . . . . . . . . . . . . . . . . . . . . . . . . . . . . . . . . 112
The Query Assistant: Select a database and one or more tables for the query window. . . . 113The Query Assistant: Add the database items and
calculations for the SELECT portion of the query window . . . . . . . . . . . . . . . . 114Tasks . . . . . . . . . . . . . . . . . . . . . . . . . . . . . . . . . . . . . . . 114Database Items or Calculations . . . . . . . . . . . . . . . . . . . . . . . . . . . 114
The Query Assistant: Choose functions for the SELECT items window . . . . . . . . . . 115Definition of function . . . . . . . . . . . . . . . . . . . . . . . . . . . . . . . . 115Types of functions . . . . . . . . . . . . . . . . . . . . . . . . . . . . . . . . . 115
The Query Assistant: Enter the SQL WHERE criteria window . . . . . . . . . . . . . . . 116Tips using this window . . . . . . . . . . . . . . . . . . . . . . . . . . . . . . . 116Field descriptions. . . . . . . . . . . . . . . . . . . . . . . . . . . . . . . . . . 117
The Query Assistant: Specify all field joins for the tables window . . . . . . . . . . . . . 118Create a new query for a real-time report . . . . . . . . . . . . . . . . . . . . . . . . 119Create a new query for a historical report . . . . . . . . . . . . . . . . . . . . . . . . 121Create a new query for an integrated report . . . . . . . . . . . . . . . . . . . . . . . 123Edit an existing real-time or historical query . . . . . . . . . . . . . . . . . . . . . . . 125Edit an existing integrated query . . . . . . . . . . . . . . . . . . . . . . . . . . . . 127Copy a query. . . . . . . . . . . . . . . . . . . . . . . . . . . . . . . . . . . . . . 128Delete a query . . . . . . . . . . . . . . . . . . . . . . . . . . . . . . . . . . . . . 129

Contents
8 Avaya CMS Supervisor Report Designer
Insert | Chart
Organization . . . . . . . . . . . . . . . . . . . . . . . . . . . . . . . . . . . . 131Information about how to insert charts . . . . . . . . . . . . . . . . . . . . . . . . . . 132
About inserting charts . . . . . . . . . . . . . . . . . . . . . . . . . . . . . . . 132About charts and tables. . . . . . . . . . . . . . . . . . . . . . . . . . . . . . . 132About fields and text . . . . . . . . . . . . . . . . . . . . . . . . . . . . . . . . 132
Insert a chart. . . . . . . . . . . . . . . . . . . . . . . . . . . . . . . . . . . . . . 133Before you begin . . . . . . . . . . . . . . . . . . . . . . . . . . . . . . . . . . 133Procedure . . . . . . . . . . . . . . . . . . . . . . . . . . . . . . . . . . . . . 133
Insert | Field
Organization of general information . . . . . . . . . . . . . . . . . . . . . . . . . 137Organization of procedures . . . . . . . . . . . . . . . . . . . . . . . . . . . . . 137
Information about how to insert fields . . . . . . . . . . . . . . . . . . . . . . . . . . 138About Field Assistant . . . . . . . . . . . . . . . . . . . . . . . . . . . . . . . . 138How to position a field . . . . . . . . . . . . . . . . . . . . . . . . . . . . . . . 138How to edit a field . . . . . . . . . . . . . . . . . . . . . . . . . . . . . . . . . 138
Use the Field Assistant window . . . . . . . . . . . . . . . . . . . . . . . . . . . . . 139Insert an ACD Name field . . . . . . . . . . . . . . . . . . . . . . . . . . . . . . . . 140Insert Data Item fields . . . . . . . . . . . . . . . . . . . . . . . . . . . . . . . . . 141
Before you begin . . . . . . . . . . . . . . . . . . . . . . . . . . . . . . . . . . 141Procedure . . . . . . . . . . . . . . . . . . . . . . . . . . . . . . . . . . . . . 141
Insert Input Value fields . . . . . . . . . . . . . . . . . . . . . . . . . . . . . . . . . 142Insert Report Data Start Time field. . . . . . . . . . . . . . . . . . . . . . . . . . . . 143Insert Time Report Run field . . . . . . . . . . . . . . . . . . . . . . . . . . . . . . 144
Insert | Table
Organization of procedures . . . . . . . . . . . . . . . . . . . . . . . . . . . . . 145How to position and edit tables . . . . . . . . . . . . . . . . . . . . . . . . . . . . . 146
Position a field on a table . . . . . . . . . . . . . . . . . . . . . . . . . . . . . . 146Edit a table. . . . . . . . . . . . . . . . . . . . . . . . . . . . . . . . . . . . . 146
Insert a table . . . . . . . . . . . . . . . . . . . . . . . . . . . . . . . . . . . . . . 147Before you begin . . . . . . . . . . . . . . . . . . . . . . . . . . . . . . . . . . 147Procedure . . . . . . . . . . . . . . . . . . . . . . . . . . . . . . . . . . . . . 147
Insert | Text
Organization of procedures . . . . . . . . . . . . . . . . . . . . . . . . . . . . . 151How to position and edit text . . . . . . . . . . . . . . . . . . . . . . . . . . . . . . 152
Position text . . . . . . . . . . . . . . . . . . . . . . . . . . . . . . . . . . . . 152Edit text . . . . . . . . . . . . . . . . . . . . . . . . . . . . . . . . . . . . . . 152
Insert text . . . . . . . . . . . . . . . . . . . . . . . . . . . . . . . . . . . . . . . 153

Contents
Issue 1 May 2002 9
Format | Chart
Organization of general information . . . . . . . . . . . . . . . . . . . . . . . . . 155Organization of procedures . . . . . . . . . . . . . . . . . . . . . . . . . . . . . 155
Information about how to format charts . . . . . . . . . . . . . . . . . . . . . . . . . 157What are charts? . . . . . . . . . . . . . . . . . . . . . . . . . . . . . . . . . . 157About the window . . . . . . . . . . . . . . . . . . . . . . . . . . . . . . . . . 157How to access the window . . . . . . . . . . . . . . . . . . . . . . . . . . . . . 158How your changes affect others . . . . . . . . . . . . . . . . . . . . . . . . . . . 158
General tab . . . . . . . . . . . . . . . . . . . . . . . . . . . . . . . . . . . . . . 159Example . . . . . . . . . . . . . . . . . . . . . . . . . . . . . . . . . . . . . . 159General tab options. . . . . . . . . . . . . . . . . . . . . . . . . . . . . . . . . 159
Change general chart parameters . . . . . . . . . . . . . . . . . . . . . . . . . . . . 160Axis tab . . . . . . . . . . . . . . . . . . . . . . . . . . . . . . . . . . . . . . . . 161
Example . . . . . . . . . . . . . . . . . . . . . . . . . . . . . . . . . . . . . . 161Axis tab options . . . . . . . . . . . . . . . . . . . . . . . . . . . . . . . . . . 161
Change axis titles . . . . . . . . . . . . . . . . . . . . . . . . . . . . . . . . . . . 164Data tab . . . . . . . . . . . . . . . . . . . . . . . . . . . . . . . . . . . . . . . . 165
Example . . . . . . . . . . . . . . . . . . . . . . . . . . . . . . . . . . . . . . 165Data tab options . . . . . . . . . . . . . . . . . . . . . . . . . . . . . . . . . . 165
Add, remove, or rearrange data items . . . . . . . . . . . . . . . . . . . . . . . . . . 166Data Labels tab . . . . . . . . . . . . . . . . . . . . . . . . . . . . . . . . . . . . 167
Example . . . . . . . . . . . . . . . . . . . . . . . . . . . . . . . . . . . . . . 167Data Labels tab options . . . . . . . . . . . . . . . . . . . . . . . . . . . . . . . 167
Define data labels on data points . . . . . . . . . . . . . . . . . . . . . . . . . . . . 169Fonts tab. . . . . . . . . . . . . . . . . . . . . . . . . . . . . . . . . . . . . . . . 170
Example . . . . . . . . . . . . . . . . . . . . . . . . . . . . . . . . . . . . . . 170Fonts tab options . . . . . . . . . . . . . . . . . . . . . . . . . . . . . . . . . . 170
Change fonts. . . . . . . . . . . . . . . . . . . . . . . . . . . . . . . . . . . . . . 171Legend tab . . . . . . . . . . . . . . . . . . . . . . . . . . . . . . . . . . . . . . . 172
Example . . . . . . . . . . . . . . . . . . . . . . . . . . . . . . . . . . . . . . 172Legend tab options . . . . . . . . . . . . . . . . . . . . . . . . . . . . . . . . . 172
Format the chart legend . . . . . . . . . . . . . . . . . . . . . . . . . . . . . . . . 173Series Labels tab . . . . . . . . . . . . . . . . . . . . . . . . . . . . . . . . . . . . 174
Example . . . . . . . . . . . . . . . . . . . . . . . . . . . . . . . . . . . . . . 174Series Labels tab option . . . . . . . . . . . . . . . . . . . . . . . . . . . . . . 174
Edit data item headings . . . . . . . . . . . . . . . . . . . . . . . . . . . . . . . . . 175Title tab . . . . . . . . . . . . . . . . . . . . . . . . . . . . . . . . . . . . . . . . 176
Example . . . . . . . . . . . . . . . . . . . . . . . . . . . . . . . . . . . . . . 176Title tab options . . . . . . . . . . . . . . . . . . . . . . . . . . . . . . . . . . 176
Format the title . . . . . . . . . . . . . . . . . . . . . . . . . . . . . . . . . . . . . 177Type tab . . . . . . . . . . . . . . . . . . . . . . . . . . . . . . . . . . . . . . . . 178
Example . . . . . . . . . . . . . . . . . . . . . . . . . . . . . . . . . . . . . . 178Type tab options . . . . . . . . . . . . . . . . . . . . . . . . . . . . . . . . . . 179
Select a chart type . . . . . . . . . . . . . . . . . . . . . . . . . . . . . . . . . . . 180
Contents
10 Avaya CMS Supervisor Report Designer
3D Effects tab . . . . . . . . . . . . . . . . . . . . . . . . . . . . . . . . . . . . . 181Example . . . . . . . . . . . . . . . . . . . . . . . . . . . . . . . . . . . . . . 1813D Effects tab options . . . . . . . . . . . . . . . . . . . . . . . . . . . . . . . 181
Control the 3D appearance . . . . . . . . . . . . . . . . . . . . . . . . . . . . . . . 183
Format | Table
Organization of general information . . . . . . . . . . . . . . . . . . . . . . . . . 185Organization of procedures . . . . . . . . . . . . . . . . . . . . . . . . . . . . . 185
Information about how to format tables . . . . . . . . . . . . . . . . . . . . . . . . . 186About the window . . . . . . . . . . . . . . . . . . . . . . . . . . . . . . . . . 186How to access the window . . . . . . . . . . . . . . . . . . . . . . . . . . . . . 186How your changes affect others . . . . . . . . . . . . . . . . . . . . . . . . . . . 186
General tab . . . . . . . . . . . . . . . . . . . . . . . . . . . . . . . . . . . . . . 187Example . . . . . . . . . . . . . . . . . . . . . . . . . . . . . . . . . . . . . . 187General tab options . . . . . . . . . . . . . . . . . . . . . . . . . . . . . . . . 187
Use the General tab . . . . . . . . . . . . . . . . . . . . . . . . . . . . . . . . . . 188Data tab . . . . . . . . . . . . . . . . . . . . . . . . . . . . . . . . . . . . . . . . 189
Example . . . . . . . . . . . . . . . . . . . . . . . . . . . . . . . . . . . . . . 189Data tab options . . . . . . . . . . . . . . . . . . . . . . . . . . . . . . . . . . 189
Use the Data tab . . . . . . . . . . . . . . . . . . . . . . . . . . . . . . . . . . . . 190Fonts tab . . . . . . . . . . . . . . . . . . . . . . . . . . . . . . . . . . . . . . . 191
Example . . . . . . . . . . . . . . . . . . . . . . . . . . . . . . . . . . . . . . 191Fonts tab options . . . . . . . . . . . . . . . . . . . . . . . . . . . . . . . . . . 191
Use the Fonts tab . . . . . . . . . . . . . . . . . . . . . . . . . . . . . . . . . . . 192Format tab . . . . . . . . . . . . . . . . . . . . . . . . . . . . . . . . . . . . . . . 193
Example . . . . . . . . . . . . . . . . . . . . . . . . . . . . . . . . . . . . . . 193Format tab options . . . . . . . . . . . . . . . . . . . . . . . . . . . . . . . . . 193
Use the Format tab . . . . . . . . . . . . . . . . . . . . . . . . . . . . . . . . . . . 195Headers tab . . . . . . . . . . . . . . . . . . . . . . . . . . . . . . . . . . . . . . 196
Example . . . . . . . . . . . . . . . . . . . . . . . . . . . . . . . . . . . . . . 196Headers tab options . . . . . . . . . . . . . . . . . . . . . . . . . . . . . . . . 196
Use the Headers tab . . . . . . . . . . . . . . . . . . . . . . . . . . . . . . . . . . 197Sort tab . . . . . . . . . . . . . . . . . . . . . . . . . . . . . . . . . . . . . . . . 198
Example . . . . . . . . . . . . . . . . . . . . . . . . . . . . . . . . . . . . . . 198Sort tab options . . . . . . . . . . . . . . . . . . . . . . . . . . . . . . . . . . 198
Use the Sort tab . . . . . . . . . . . . . . . . . . . . . . . . . . . . . . . . . . . . 199Summary tab . . . . . . . . . . . . . . . . . . . . . . . . . . . . . . . . . . . . . 200
Example . . . . . . . . . . . . . . . . . . . . . . . . . . . . . . . . . . . . . . 200Summary tab options . . . . . . . . . . . . . . . . . . . . . . . . . . . . . . . . 200
Use the Summary tab . . . . . . . . . . . . . . . . . . . . . . . . . . . . . . . . . 201

Contents
Issue 1 May 2002 11
Format | Field
Organization of general information . . . . . . . . . . . . . . . . . . . . . . . . . 203Organization of procedures . . . . . . . . . . . . . . . . . . . . . . . . . . . . . 203
The Field Format Options window . . . . . . . . . . . . . . . . . . . . . . . . . . . . 204Example . . . . . . . . . . . . . . . . . . . . . . . . . . . . . . . . . . . . . . 204Field Format Options field descriptions . . . . . . . . . . . . . . . . . . . . . . . 205
Create or change a label for the field . . . . . . . . . . . . . . . . . . . . . . . . . . 206Edit the format of a field. . . . . . . . . . . . . . . . . . . . . . . . . . . . . . . . . 207
Format | Text
Organization . . . . . . . . . . . . . . . . . . . . . . . . . . . . . . . . . . . . 209The Text Format Options window . . . . . . . . . . . . . . . . . . . . . . . . . . . . 210
Example . . . . . . . . . . . . . . . . . . . . . . . . . . . . . . . . . . . . . . 210Text Format Options parameters . . . . . . . . . . . . . . . . . . . . . . . . . . 210
Format text. . . . . . . . . . . . . . . . . . . . . . . . . . . . . . . . . . . . . . . 211
Error messages
Organization of general information . . . . . . . . . . . . . . . . . . . . . . . . . 213Phase 1 error messages . . . . . . . . . . . . . . . . . . . . . . . . . . . . . . . . 214Phase 2 historical report error codes . . . . . . . . . . . . . . . . . . . . . . . . . . 216
Format . . . . . . . . . . . . . . . . . . . . . . . . . . . . . . . . . . . . . . . 216List of phase 2 error codes . . . . . . . . . . . . . . . . . . . . . . . . . . . . . 216
Phase 3 real-time report error codes. . . . . . . . . . . . . . . . . . . . . . . . . . . 220Format . . . . . . . . . . . . . . . . . . . . . . . . . . . . . . . . . . . . . . . 220List of phase 3 error codes . . . . . . . . . . . . . . . . . . . . . . . . . . . . . 220
How CMS stores and retrieves data
Organization of general information . . . . . . . . . . . . . . . . . . . . . . . . . 223How CMS stores data . . . . . . . . . . . . . . . . . . . . . . . . . . . . . . . . . 224
Table . . . . . . . . . . . . . . . . . . . . . . . . . . . . . . . . . . . . . . . 224Database items. . . . . . . . . . . . . . . . . . . . . . . . . . . . . . . . . . . 224Row . . . . . . . . . . . . . . . . . . . . . . . . . . . . . . . . . . . . . . . . 224Index . . . . . . . . . . . . . . . . . . . . . . . . . . . . . . . . . . . . . . . 224
How CMS retrieves data . . . . . . . . . . . . . . . . . . . . . . . . . . . . . . . . 225Three types of information . . . . . . . . . . . . . . . . . . . . . . . . . . . . . 225How to tell CMS to retrieve data . . . . . . . . . . . . . . . . . . . . . . . . . . . 225Identify rows . . . . . . . . . . . . . . . . . . . . . . . . . . . . . . . . . . . . 225Indexes for search . . . . . . . . . . . . . . . . . . . . . . . . . . . . . . . . . 226About creating new database tables . . . . . . . . . . . . . . . . . . . . . . . . . 226Example . . . . . . . . . . . . . . . . . . . . . . . . . . . . . . . . . . . . . . 226

Contents
12 Avaya CMS Supervisor Report Designer
Report Designer examples
Organization of procedures . . . . . . . . . . . . . . . . . . . . . . . . . . . . . 229Create an integrated report . . . . . . . . . . . . . . . . . . . . . . . . . . . . . . . 230Modify an integrated report . . . . . . . . . . . . . . . . . . . . . . . . . . . . . . . 232
Glossary . . . . . . . . . . . . . . . . . . . . . . . . . . . . . . . . . . . . . . . 235
Index . . . . . . . . . . . . . . . . . . . . . . . . . . . . . . . . . . . . . . . 241

Issue 1 May 2002 13
Introduction
Avaya Call Management System Supervisor Report Designer describes what you need to know to create new reports and to edit existing reports through Report Designer and Report Wizard.
What you need to know
You must have the following skills to use this book successfully:
● You must be familiar with your computer and the Windows® operating system.
● You must be familiar with the Avaya Call Management System (CMS) Supervisor application and have some knowledge of how Avaya CMS reports work.
Organization
Introduction is organized as follows:
● About Report Designer on page 14
● Contents of this document on page 15
● Conventions used in this document on page 17
● Related documents on page 19

Introduction
14 Avaya CMS Supervisor Report Designer
About Report Designer
What is Report Designer?
Report Designer allows you to create reports that are tailored to your call center needs. You then run the reports you have created from the Supervisor application.
Report Designer allows you to create new reports, edit standard CMS and Supervisor reports, and copy items from one report to another report. You can purchase Report Designer with the Supervisor software.
How do you use Report Designer?
When you use report Designer to edit an existing report or to create a new one, you usually begin by creating or modifying a Structured Query Language (SQL) query. Using the database items contained in the tables referenced in the query, you can populate fields, grids, and charts for the report. You can then size, move, and change the fields, tables, and charts on the report.
When you have finished creating or editing a report, you save the report on the CMS server. If you assigned Global user permissions to the report, other Supervisor users with the appropriate permissions can run the report.
What kinds of reports can I create?
You can create real-time, historical, and integrated reports. Report Designer lets you do the following:
● Copy existing report designs, including standard report designs.
● Edit reports by adding, moving, copying, and deleting fields, tables, or charts.
● Define Automatic Call Distribution (ACD) data for report fields, tables, and charts.
● Enter text for field labels, column headers, row headers, or special instructions.

Contents of this document
Issue 1 May 2002 15
Contents of this documentThis document is organized as follows:
Chapter 1 Introduction
Background information on Report Designer application and general information about this book
Chapter 2 Use the Report Wizard
Background information on the Report Wizard features, functionality, and steps to help you create a new report
Chapter 3 Use Report Manager
Basic procedures for using Report Manager
Chapter 4 Report Designer basics
Basic information for using Report Designer
Chapter 5 Design mode basics
Basic procedures for using Report Designer design mode
Chapter 6 Edit | Inputs
Procedures for editing the existing input fields that are used on the input window for the report you are editing
Chapter 7 Edit | Queries
Procedures to edit existing queries and create new queries
Chapter 8 Insert | Chart
Procedures to insert a chart into a report
Chapter 9 Insert | Field
Procedures to insert a field into a report
Chapter 10 Insert | Table
Procedures to insert a table into a report
Chapter 11 Insert | Text
Procedures to insert text into a report

Introduction
16 Avaya CMS Supervisor Report Designer
Chapter 12 Format | Chart
General information about the tabs that you access from the Chart option of the Format menu
Chapter 13 Format | Table
General information about the tabs that you access from the Table option of the Format menu
Chapter 14 Format | Field
This chapter provides general information about the window that you access from the Format option of the Format menu
Chapter 15 Format | Text
General information about the window that you access from the Text option of the Format menu
Chapter 16 Error messages
The most common errors related to queries that you create for reports
Chapter 17 How CMS stores and retrieves data
General information about how the CMS server stores and retrieves the data that is used in the reports
Chapter 18 Report Designer examples
Examples about how to create and edit a commonly-used report with Report Designer

Conventions used in this document
Issue 1 May 2002 17
Conventions used in this document
About Windows
Windows refers to the following operating systems:
● Windows 98
● Windows NT 4.0
● Windows ME
● Windows 2000
● Windows XP
Window graphics
A graphic is provided for only some Supervisor windows. Graphics are provided to give you general information about a type of window or to help clarify a procedure that is being described.
Typographical conventions
The following typographical conventions are used in this document:
This type of information: Is presented as follows:
GUI text strings embedded in procedures
Click Save the report being copied as.
Names of windows and keyboard keys
This field is in the Manual Login window.
Text you are asked to enter and system commands
Enter
save.exe
Variable text Could not create <filename>.
Key combinations for which you must press and hold down one key and then press another.
ALT+4

Introduction
18 Avaya CMS Supervisor Report Designer
References to other documents
See the Avaya CMS Supervisor Reports manual
Referenced sections and chapters
For an outline of the information in this document, see Contents of this document on page 15.
This type of information: Is presented as follows:

Related documents
Issue 1 May 2002 19
Related documentsThe following documents provide additional information about CMS or Supervisor:
● Avaya Call Management Supervisor Version 11 Installation and Getting Started, 585-210-706
● Avaya Call Management System Release 3 Version 11 Administration, 585-215-515
● Avaya Call Management Supervisor Version 11 Reports, 585-210-708
● Avaya Call Management System Release 3 Version 11 Database Items and Calculations, 585-780-702

Introduction
20 Avaya CMS Supervisor Report Designer

Issue 1 May 2002 21
Report Wizard
Report Wizard describes the Report Wizard windows and provides an overview of the steps.
Organization of general information
Report Wizard contains the following general information:
● About the Report Wizard on page 22
● The Select a Report Type page on page 28
● The Select a Report Layout page on page 30
● The Selection Layout page on page 31
● The Select a Data Group page on page 33
● The Select Data Items page on page 36
● The Select Chart Format page on page 42
● The Select Table Format page on page 45
● The Change Input Captions page on page 47
● The Preview Option page on page 48
● The Save Report page on page 49
● The Finish page on page 51
Organization of procedures
Report Wizard contains the following procedures:
● Start the Report Wizard on page 26
● Wizard steps on page 25
● Procedures for the Select Data Items page on page 39

Report Wizard
22 Avaya CMS Supervisor Report Designer
About the Report Wizard
What is Report Wizard?
Report Wizard is a supplement to Report Designer and is available only if you have purchased Report Designer. The Report Wizard feature delivers user assistance, by way of a wizard, to quickly and easily generate new customized reports. The wizard provides instructional help that guides you through a series of tasks that create a new customized report.
Report Wizard and Report Designer
All reports created with Report Wizard have the same designation and accessibility as those created in Report Designer.Thus, reports created by Report Wizard are referred to as Report Designer reports. This means that reports created by Report Wizard will be accessible only by Avaya Call Management System (CMS) Supervisor users.
Facts about Report Wizard
The following list provides general facts about Report Wizard:
● Report Wizard can access all database items and standard calculations.
Although you can access all database items and standard calculations, you cannot create new calculations or link fields together with math functions by way of the Report Wizard. However, Report Designer allows you to create new calculations and link fields together with math functions for reports that you create in the Report Wizard.
● Report Wizard can create a report with charts and tables.
With the Report Wizard you will be able to create a report that contains the following:
— One or two charts
— One or two tables
— One chart and one table
To enter text or fields containing one data item, use Report Designer.
● Report Wizard does not display queries and database table names used to generate a report.
If you need to see this type of information, use Report Designer.

About the Report Wizard
Issue 1 May 2002 23
● Report Wizard provides access to database item definitions.
While in the Select Data Items page of the Report Wizard, you can view the definition of a database item or calculation.
● Report Wizard does not allow you to edit a completed report.
Report Wizard is designed to create only new reports. To edit a completed report, use Report Designer.
● Report Wizard does not allow reentry.
Report Wizard does not allow you to leave and then reenter to finish a partially-completed report. Use Report Designer to make changes to a report created and saved in Report Wizard.
Report Wizard command buttons
Each page of the Report Wizard contains command buttons to help you navigate through wizard and define your report. The following table provides an explanation of these command buttons.
Command button Action
Back Returns to the previous page. When you back up to previous pages, Report Wizard retains the values you entered unless you back up to a previous page and make changes that impact ensuing pages.
Next Moves to the next page in the sequence, maintaining whatever settings you provided on the previous pages.
Finished Applies your settings, or the default settings, from all pages and completes the task.
Cancel Discards any selections you have made if you have not saved the report, terminates the process, and closes the Report Wizard.
If you saved the report before you clicked Cancel, the Report Wizard closes; however, you will be able to run or edit the report in Report Designer.
Help Provides information about the page.
Data Item Definition
Provides a definition for the selected database item or calculation.

Report Wizard
24 Avaya CMS Supervisor Report Designer
Moves up one database item or calculation in the list of Selected Data Items.
Moves down one database item or calculation in the list of Selected Data Items.
Removes a database item or calculation from the Selected Data Items list.
Adds a database item or calculation to the Selected Data Items list.
Edit Item Heading
Use to edit a database item heading.
Preview Captures a screen shot of your report as it is currently defined.
Command button Action

Wizard steps
Issue 1 May 2002 25
Wizard stepsThe following chart describes the steps Wizard takes you through.

Report Wizard
26 Avaya CMS Supervisor Report Designer
Start the Report Wizard
Before you begin
You can access Report Wizard only when Report Designer is activated on the Avaya Call Management System (CMS) server, and when you have the appropriate permissions to access Report Designer.
Start with the toolbar icon
If you have purchased Report Designer, a toolbar icon will be displayed on the Controller window’s toolbar.
To start with the toolbar icon, do the following steps:
1. Click the Report Wizard toolbar icon.
The Report Wizard opens.
2. Click Next after you complete each page.
Related topics
For more information about each page, see any of the following topics:
● The Select a Report Type page on page 28
● The Select a Report Layout page on page 30
● The Selection Layout page on page 31
● The Select a Data Group page on page 33
● The Select Data Items page on page 36
● Procedures for the Select Data Items page on page 39
● The Select Chart Format page on page 42
● The Select Table Format page on page 45
● The Change Input Captions page on page 47

Start the Report Wizard
Issue 1 May 2002 27
● The Preview Option page on page 48
● The Save Report page on page 49
● The Finish page on page 51

Report Wizard
28 Avaya CMS Supervisor Report Designer
The Select a Report Type pageYour first task is to select a report type. The report type determines whether the data in the report is real-time, integrated or historical. For example, if you select a real-time report, you will not be able to specify historical data in the report.
Example

The Select a Report Type page
Issue 1 May 2002 29
Types of reports
The following table provides information about each type of report.
Report Description
Real-Time Reports that refresh in real time. Real-time reports are reports that display current ACD call activity on agents, splits/skills, trunks, trunk groups, vectors, and vector directory numbers (VDNs) for the current interval (15, 30, or 60 minutes). Current intrahour interval real-time reports are periodically updated as data changes during the interval.
Integrated Reports that refresh in real-time and show information that is accumulated from any point in time in the past 24 hours of ACD, agent, split/skill, trunk, trunk group, vector, and VDN activities.
Historical Reports that give information tabulated over a period of time. Historical reports display past ACD data for various agent, split/skill, trunk, trunk group, vector, or VDN activities. You must select a historical report if you want to include the following data:
● Exceptions
● Call Work Code
● Agent Trace
● Call Record
Report Wizard
30 Avaya CMS Supervisor Report Designer
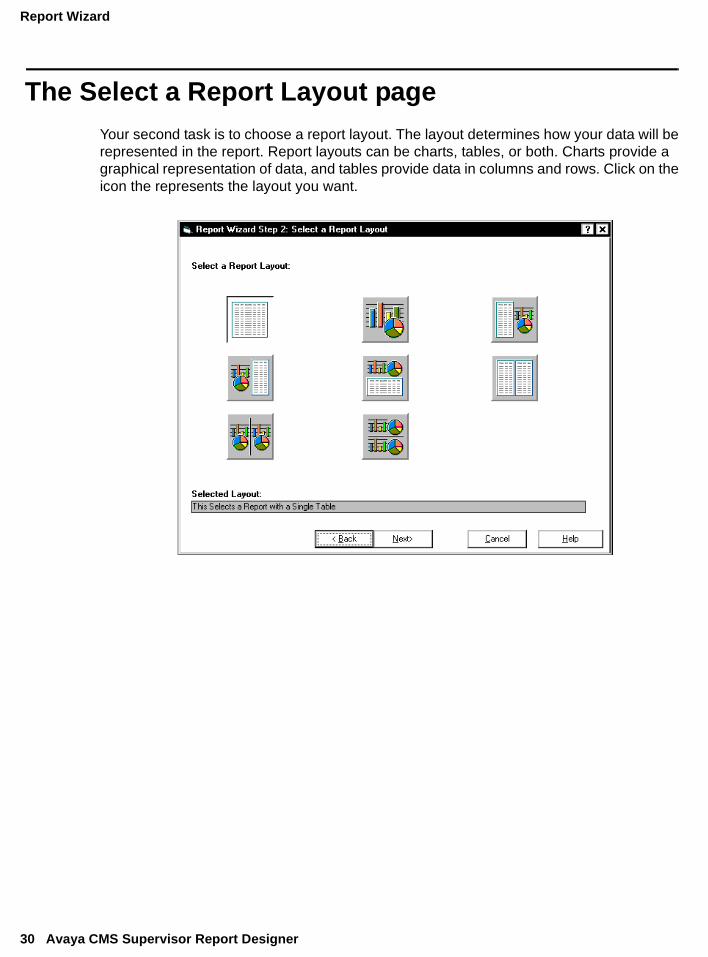
The Select a Report Layout pageYour second task is to choose a report layout. The layout determines how your data will be represented in the report. Report layouts can be charts, tables, or both. Charts provide a graphical representation of data, and tables provide data in columns and rows. Click on the icon the represents the layout you want.

The Selection Layout page
Issue 1 May 2002 31
The Selection Layout pageThe Selection Layout page lets you choose which section of the report you want to design.
Report Wizard will take you to this page only if you selected a report layout that contains a table and a chart, two tables, or two charts.
Example

Report Wizard
32 Avaya CMS Supervisor Report Designer
Define sections
Description Example
A section that is pressed, with an arrow pointing to it, is the section you are about to define.
A section that is not pressed, without an arrow, is the section you have not defined.

The Select a Data Group page
Issue 1 May 2002 33
The Select a Data Group pageUse the Select a Data Group page to select the data you want for this report.
The Select a Data Group page provides only those data groups specific to the type of report you chose earlier, and the current section you want to define. For example, if you selected historical on the Select a Report Type page, and table on the Select a Report Layout or Selection Layout page, you will select data groups only for a historical table.
Example
Levels of data groups
The data groups available are placed in a tree view structure. There can be up to three levels of data, the last level containing the individual data groups. From this tree view structure, you will select an individual data group for the section you want to define.

Report Wizard
34 Avaya CMS Supervisor Report Designer
First level
The first level is the highest classification level of data. For example, the highest classification levels of data for a real-time table are Agent, Split/Skills (multiple), Trunk Group, VDN (single), VDNs (multiple), and Vectors.
Second level
The second level is a breakdown of the first classification level of data. For example, the second level of data for the Split/Skills (multiple) category are Multi-ACD, Top Agent Skills Information, Expected Wait Time at each priority, Number of Agents in AUX Work States, Performance, Type of Agents Staffed, and No Pre-selection. Individual data groups are also contained under this level of data.
Third level
The third level is a breakdown of the second classification levels of data. For example, the third level of data for the Split/Skills (multiple) Top Agent Skills Information category is Top

The Select a Data Group page
Issue 1 May 2002 35
Agents Staffed and No Pre-selection. If there are three levels of data, the individual data groups will be listed under the third level.
Expand and collapse categories
Categories of data and sub-categories of data can be expanded (represented with a plus sign) and collapsed (represented with a minus sign). By default, when the Select a Data Group page of the wizard appears, one category will be expanded with one data group selected. The default is based on the information (report type and report layout) that you provided to the wizard previously.

Report Wizard
36 Avaya CMS Supervisor Report Designer
The Select Data Items pageUse the Select Data Items page to select the specific types of data from the CMS databases that you want displayed in your report.
Related topic
For information on how to perform all the available tasks on this page, see Procedures for the Select Data Items page on page 39.
Example

The Select Data Items page
Issue 1 May 2002 37
Box and button descriptions
Data item column descriptions
The system displays icons if the data type is alphanumeric or has a graphical representation. Synonyms that are defined for data items are in parenthesis.
Box or button Description
Display Data Group items that contain
Use this field to display only specific items in both columns of the Available Data Items box.
For more information, see Filter data group items on page 39.
Available Data Items Contains all the data items associated with the data group. This list allows you to add data items to the Selected Data Items box.
Data Item Definition If you highlight a data item in the Available Data Items box and click this button, Report Wizard displays a topic in Help that defines the data item.
Selected Data Items Contains the predefined database items and calculations from the Available Data Items box that you want in your report.
Edit Item Heading If you highlight an item heading in the Selected Data Items box, and click this button, you can change the item heading.
Data item columns Column description
Item Heading Lists the default heading for the database item or calculation. The item heading is the heading used in standard CMS reports.
Data Item Lists the database item or calculation (internal name).

Report Wizard
38 Avaya CMS Supervisor Report Designer
About No Pre-selection
If you chose the No Pre-selection data group on the Select a Data Group page, the Selected Data Items list view will not be populated with preselected data; however, the Available Data Items list view will contain all the data items available for your report. To select the data items for your report, you need to manually add them from the Available Data Items list view to the Selected Data Items list view. You must have at least one database item or calculation in the Selected Data Items list view before the wizard will let you proceed.

Procedures for the Select Data Items page
Issue 1 May 2002 39
Procedures for the Select Data Items pageFrom the Select Data Items page, you can do the following:
● Filter data group items
● Sort data group items
● Move data group items from one box to another
● Reposition data group items
● Create custom report headings
Filter data group items
To filter data group items, do the following steps:
1. In the Display Data Group items that contain box, enter the characters of the data items that you want Report Wizard to display.
Example:
If you want to list only those data group items that contain the text logonsk, enter
logonsk
2. To redisplay all data group items available to the data group, delete all text in the Display Data Group items that contain box.
Report Wizard
40 Avaya CMS Supervisor Report Designer
Sort data group items
To sort the data group items, select the Item Heading column or the Data Item column.
All data group items are sorted alphabetically.
Move data group items from one box to another
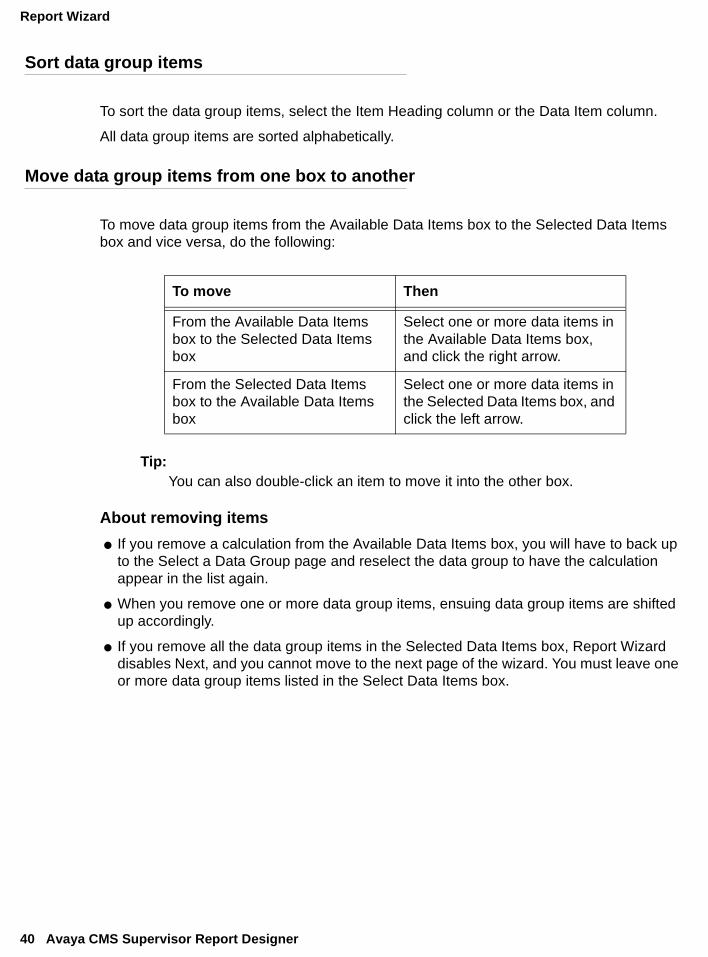
To move data group items from the Available Data Items box to the Selected Data Items box and vice versa, do the following:
Tip:You can also double-click an item to move it into the other box.
About removing items
● If you remove a calculation from the Available Data Items box, you will have to back up to the Select a Data Group page and reselect the data group to have the calculation appear in the list again.
● When you remove one or more data group items, ensuing data group items are shifted up accordingly.
● If you remove all the data group items in the Selected Data Items box, Report Wizard disables Next, and you cannot move to the next page of the wizard. You must leave one or more data group items listed in the Select Data Items box.
To move Then
From the Available Data Items box to the Selected Data Items box
Select one or more data items in the Available Data Items box, and click the right arrow.
From the Selected Data Items box to the Available Data Items box
Select one or more data items in the Selected Data Items box, and click the left arrow.
Procedures for the Select Data Items page
Issue 1 May 2002 41
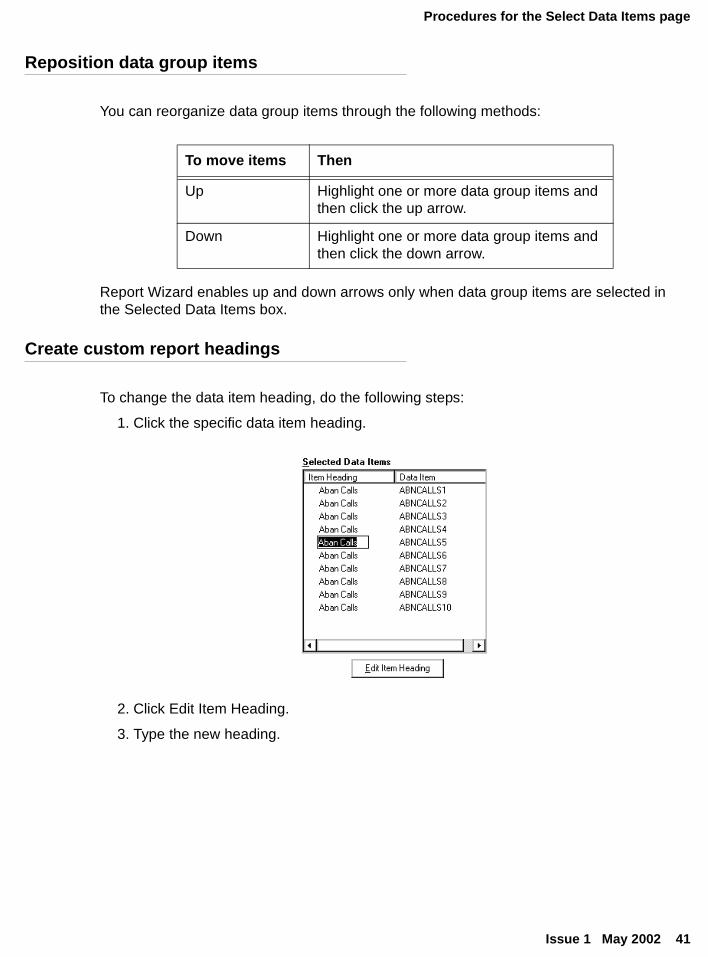
Reposition data group items
You can reorganize data group items through the following methods:
Report Wizard enables up and down arrows only when data group items are selected in the Selected Data Items box.
Create custom report headings
To change the data item heading, do the following steps:
1. Click the specific data item heading.
2. Click Edit Item Heading.
3. Type the new heading.
To move items Then
Up Highlight one or more data group items and then click the up arrow.
Down Highlight one or more data group items and then click the down arrow.

Report Wizard
42 Avaya CMS Supervisor Report Designer
The Select Chart Format pageUse the Select Chart Format page to define the format of your chart. The default is a vertical 2D bar chart that displays the data by value.
Example

The Select Chart Format page
Issue 1 May 2002 43
Field descriptions
Available chart formats
You can use any of the following chart formats.
Field Description
Show Value Displays your data as a numeric value.
Show Percentage Displays your data as a percentage.
Display Legend Displays a legend of the data items in the right corner of the chart.
Display Data Labels Displays the data labels on your report. The data labels are displayed as either values or percentages.
Use First data item as chart title Uses the first data item as the title.
2D Vertical Bar Chart
3D Horizontal Bar Chart
2D Stacked Area Bar Chart
2D Horizontal Bar Chart
3D Vertical Stacked Bar Chart
2D Pie Bar Chart

Report Wizard
44 Avaya CMS Supervisor Report Designer
2D Vertical Stacked Bar Chart
3D Horizontal Stacked Bar Chart
3D Vertical Bar Chart
2D Horizontal Stacked Bar Chart
3D Line Chart 3D Pie Chart
2D Line Bar Chart 3D Stacked Area Chart
3D Vertical Cluster Bar Chart

The Select Table Format page
Issue 1 May 2002 45
The Select Table Format pageUse the Select Table Format page to define the characteristics of your table layout.
Example

Report Wizard
46 Avaya CMS Supervisor Report Designer
Field descriptions
Example of a row-oriented report
Example of a column-oriented report
Field Description
Fill Table by Row Displays your data items horizontally. See Example of a row-oriented report.
Fill Table by Column Displays your data items vertically. See Example of a column-oriented report.
Display Grid Lines The report will display grid lines to separate the data.

The Change Input Captions page
Issue 1 May 2002 47
The Change Input Captions pageWhen you are finished defining all report sections, the Change Input Captions page opens. This page allows you to change the input prompts that will appear in the Report Input window of your new report.
Example
Input Prompts
The number of entries you see displayed in the Change Input Captions page will depend on the data group you assigned to each section of your report. From this page, you can change the input captions, but not the inputs that will appear in your report.

Report Wizard
48 Avaya CMS Supervisor Report Designer
The Preview Option pageThe Preview Option page allows you to preview what you have defined for your report and exit the preview. You can use Back to modify the report section.
A previewed version of a report contains real data for each completed section; however, if the report is designated as real-time, then there will be no refresh of data. The only option while in a previewed version of a report is to exit the preview.
Example
Two-section report
When you preview the first section of the report, you will be prompted to provide input values for that section. When you preview the second section of the report, you will be prompted to provide input for both sections.

The Save Report page
Issue 1 May 2002 49
The Save Report pageUse the Save Report page to save your report and define who has permission to access your report. Your report will be saved when you enter a report name and click Next. The report type and data group selections you made for your report will determine the category your report will be saved under (for example, Real-Time).
You are not required to save your report at this time. If you do not save your report, Report Wizard will still allow you to advance to the next page.
! Important:If you do not enter a report name, your report will not be saved when you advance to the Finish page. Report Wizard will discard your report if you do not save your report on either the Save Report page or the Finish page.
Example

Report Wizard
50 Avaya CMS Supervisor Report Designer
Field descriptions
The following table describes the fields on the Save Report page.
Field Description
Report Name Allows you to enter a name for your report. If there is an existing report with the same name, and you are not the owner of this report, Report Wizard will not allow you to overwrite the existing report.
Report Description Provides a space for you to write a description of your report.
Everyone Anyone can run the report and copy the report design.
The CMS user permission structure is still applicable.
Only Me The only users that can run the report and copy the design are you and CMS administrators.

The Finish page
Issue 1 May 2002 51
The Finish pageWhen all the required tasks are completed to create a report, you will have to determine whether you want to run the report, edit the report with Report Designer, or exit without doing anything.
Example
Run Report for ACD
Allows you to select the ACD for your report.
Run Report
When you run your report from the Finish page of the Report Wizard, it will run with the appropriate inputs, access the CMS database, and produce real data. You will run a live report.
If you run an unsaved report you will be prompted to save the report upon its completion. The report will be saved as a Report Designer report and placed in the appropriate folder
Report Wizard
52 Avaya CMS Supervisor Report Designer
(real-time, historical, or integrated). If you elect not to save your report, you can press Exit, and the report will close, or you can click Return to return to the running report.
Edit Report in Report Designer
When you choose to edit your report from the Finish page, Report Designer starts. All edits to your report are now done through Report Designer. Click Back on the wizard pages to edit your report with the Report Wizard.
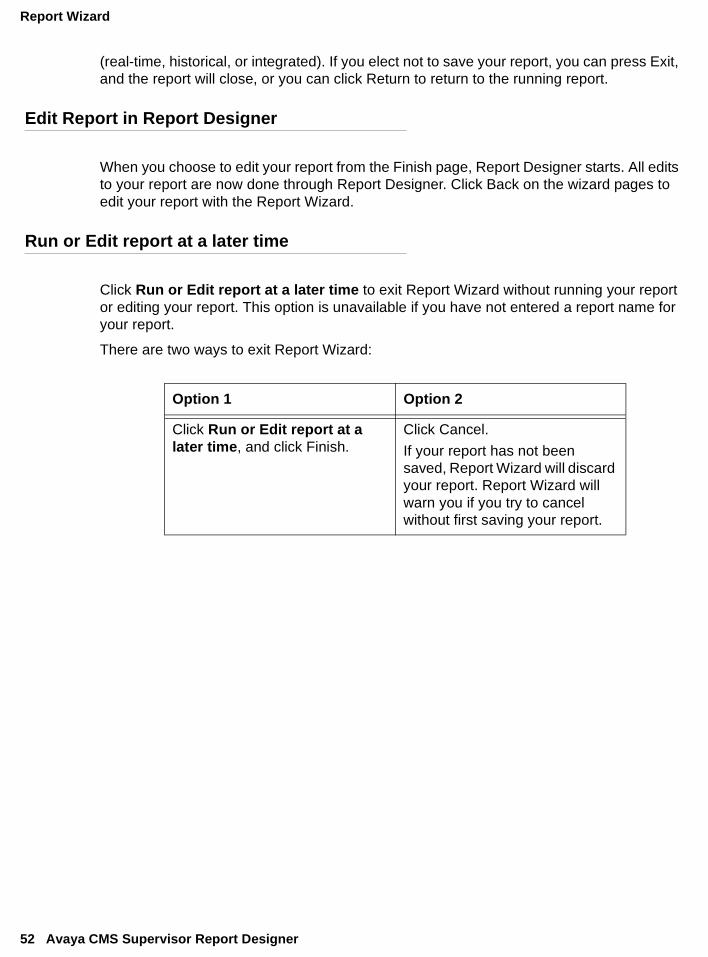
Run or Edit report at a later time
Click Run or Edit report at a later time to exit Report Wizard without running your report or editing your report. This option is unavailable if you have not entered a report name for your report.
There are two ways to exit Report Wizard:
Option 1 Option 2
Click Run or Edit report at a later time, and click Finish.
Click Cancel.
If your report has not been saved, Report Wizard will discard your report. Report Wizard will warn you if you try to cancel without first saving your report.

Issue 1 May 2002 53
Use Report Manager
Use Report Manager describes how to use Report Manager of the Avaya Call Management System (CMS) Supervisor application.
Organization of general information
About Report Manager on page 54
Organization of procedures
Use Report Manager contains the following procedures:
● View or change a report’s properties on page 56
● Copy a report to the designer category on page 57
● Copy a designer report to a file on page 60
● Copy a designer report from a file on page 61
● Delete a report from the designer category on page 62
● Open Report Designer with Edit or New on page 63

Use Report Manager
54 Avaya CMS Supervisor Report Designer
About Report Manager
What is Report Manager?
Report Manager is a feature of the Supervisor application that allows you to view report properties, copy reports, and access Report Designer to edit reports or create new reports.
The Reports Selector window
Buttons on the Report Selector window
Use the buttons on the Report Selector window to do the following:
Button Use to ...
Script Choose from any number of Windows scripts that you have installed on your PC.
Properties Manage the standard CMS and Supervisor reports
Copy Copy reports to the Designer category for editing

About Report Manager
Issue 1 May 2002 55
Delete Delete reports from the Designer category. You cannot delete standard CMS, CMS custom, and standard Supervisor reports.
Help Opens the context-specific help for the current window
Edit Edit the reports
New Create a new Designer report from scratch
Cancel Cancels any changes or additions you have made since the last time you clicked OK.
Button Use to ...

Use Report Manager
56 Avaya CMS Supervisor Report Designer
View or change a report’s propertiesReport Manager gives you the ability to view report properties, such as the report name, description, owner, type, folder, category, permissions; as well as the folder the report is stored in.
To view the report properties, do the following steps:
1. Open the Report Selector window.
2. Select the report for which you want to view properties.
3. Click Properties.
The Properties window for the report opens.
4. To change the name, description, or owner of a report, place the cursor in the appropriate field and make your edits.
5. To specify who can see the report, click either Everyone or Only Me.
6. When you are done making your changes, click OK to save the changes.
If you attempt to give a report the same name as an existing designer report, the Report Already Exists window opens. This window allows you to overwrite the existing report or to give the report you want to save a different name.

Copy a report to the designer category
Issue 1 May 2002 57
Copy a report to the designer categoryUse Report Manager to copy a report from any category (Agent, Other, Queue/Agent, Split/Skill, Trunk/Trunk Group, VDN, Vector, Custom, or Designer) and folder (Real-Time, Historical, or Integrated) into the Designer category of any folder.
Where to access your reports
You can access reports that you create or edit with Report Designer only from the Supervisor interface to the CMS server. Therefore, if you edit an CMS custom report with Report Designer, changes to that report will not be available when the report is run from the Terminal Emulator or from another terminal interface to the CMS.
Who can modify your reports
No CMS user other than a user with CMS administration permissions can modify a report design you create regardless of whether the report is accessible by all or only by you. A user with CMS administration permissions always has the ability to modify your report design, even if you make it available only to yourself.
Procedure
To copy a report, do the following steps:
1. Open the Report Selector window.
2. Select the report that you want to copy.
3. Click Copy.
The Copy Report window opens. This window allows you to select where you want to copy the report (the designer category, a PC file, or from a PC file to the CMS server).
4. Click To Designer Category.
5. Click OK.
The Copy Report To Designer Window opens. This window allows you to define the name, description, folder, and scope of the report.
6. Enter a name for your report in the Name field. The name can have up to 40 alphanumeric characters, including blanks. Because the name you give your report should be unique, you may want to look at existing report names before you enter a name for your report.

Use Report Manager
58 Avaya CMS Supervisor Report Designer
7. Move the cursor to the Description field and enter a description of the report.
The description can have up to 100 alphanumeric characters, including blanks. It is not required that you enter a report description.
Do not use the following characters in your description of the report:
● \ (backslash)
● ; (semicolon)
● ’ (grave accent)
● ~ (tilde)
● “ (double quote)
● | (pipe)
● * (asterisk)
● ? (question mark)
8. Move the cursor to the Folder field. Use the pull-down list to select Real-Time, Historical, or Integrated.
The report is stored in the Designer category of the folder you select here.
When you edit the report, you will access the database for the folder you select here. If you select real-time, you will not be able to access the historical database tables to define queries for the report. If you select historical, you will not be able to access the real-time database tables to define queries for the report. However, if you select integrated, you will be able to access both the real-time and historical databases to define queries for the report.
You must select the historical or integrated folder if you want to include the following:
● Exceptions data
● Agent trace data
● Call record data
Copy a report to the designer category
Issue 1 May 2002 59
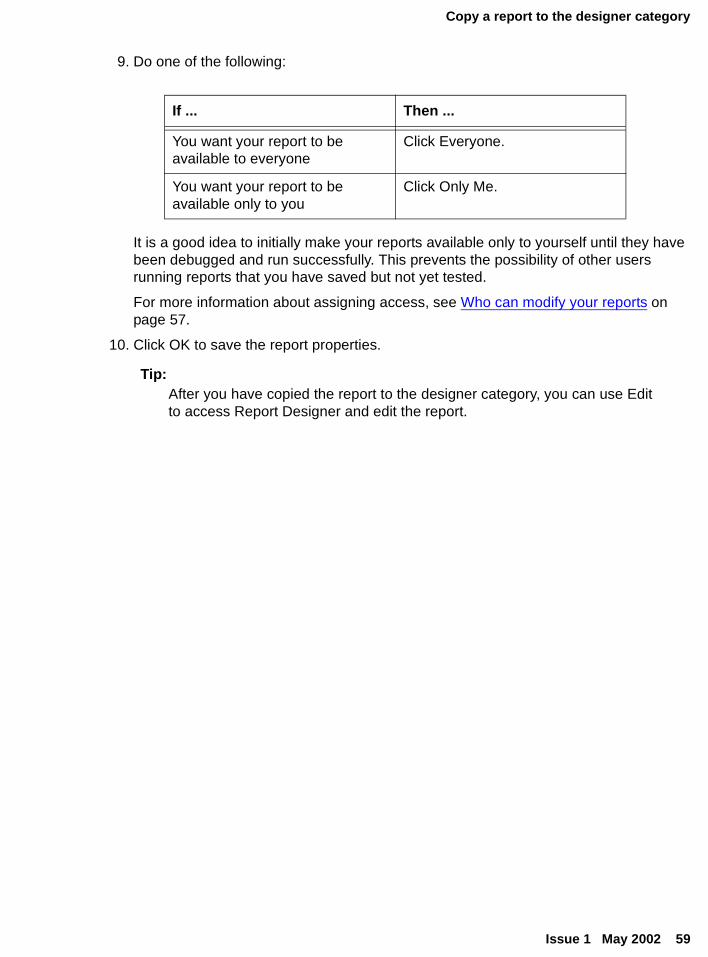
9. Do one of the following:
It is a good idea to initially make your reports available only to yourself until they have been debugged and run successfully. This prevents the possibility of other users running reports that you have saved but not yet tested.
For more information about assigning access, see Who can modify your reports on page 57.
10. Click OK to save the report properties.
Tip:After you have copied the report to the designer category, you can use Edit to access Report Designer and edit the report.
If ... Then ...
You want your report to be available to everyone
Click Everyone.
You want your report to be available only to you
Click Only Me.

Use Report Manager
60 Avaya CMS Supervisor Report Designer
Copy a designer report to a fileUse the Copy button on the Report Selector window to copy any designer report that you create to a file that resides on diskette, on your hard drive, or on a network drive. You can use this feature to easily transport designer reports from one PC to another.
If a report was created by Avaya Inc. Professional Services, only a user with CMS services permissions can copy the report.
To copy a report, do the following steps:
1. Open the Report Selector window.
2. Select the Designer Category.
3. Select the designer report that you want to copy.
4. Click Copy.
The Copy Report window displays with the To a PC File option enabled. This window allows you to select where you want to copy the report (the designer category, a PC file, or from a PC file to the CMS server).
5. Click To a PC File.
6. Click OK.
The Save Report to PC File window opens.
This window is a standard Windows browse window.
7. Select the file name and folder to which you want to save the report.
● You can copy the report to any drive to which you have access, including the floppy (usually a:\) drive on your PC.
● To save the report to a network drive, select Network. This will allow you to access the network drives where you have permissions.
8. Click OK.
The file is saved and, upon successful completion of the save, a confirmation window displays.

Copy a designer report from a file
Issue 1 May 2002 61
Copy a designer report from a fileUse Report Manager Copy to copy any designer report that has been saved to a file (either on diskette or on a network drive) onto the CMS server.
To copy a report from a file to the server, do the following steps:
1. Open the Report Selector window.
2. Click Copy.
The Copy Report window opens. This window allows you to select where you want to copy the report (the Designer category, a PC file, or from a PC file to the CMS server).
3. Click From a PC File to the CMS Server.
4. Click OK.
The Load Report From PC File window opens.
This window is a standard Windows browse window.
5. Select the file that you want to copy to the CMS server.
6. Click OK.
The file is copied to the CMS server and, upon successful completion of the copy, a confirmation window displays.
7. Do one of the following:
● Click Overwrite the existing report to replace the report that currently resides on the CMS server.
● Click Save the report being copied as and enter a new name for the report if you want to retain the version of the report that currently resides on the CMS server.

Use Report Manager
62 Avaya CMS Supervisor Report Designer
Delete a report from the designer categoryReport Manager allows you to delete any report that resides in the designer category except reports purchased from Professional Services. You cannot delete any of the standard CMS, CMS custom, or standard Supervisor reports (reports that reside in the Agent, Other, Queue/Agent, Split/Skill, Trunk/Trunk Group, VDN, Vector, and Custom categories).
To delete a designer report, do the following steps:
1. Open the Report Selector window.
2. Select the Designer category under any tab.
3. Highlight the name of the report that you want to delete.
4. Click Delete.
A message confirming the delete displays.
5. Click OK to delete the report.

Open Report Designer with Edit or New
Issue 1 May 2002 63
Open Report Designer with Edit or NewUse one of the following methods to open Report Designer.
If you want to open from . . . Then . . .
Report Manager Select a report from the designer category and do one of the following:
● Click Edit.
● Click New to create a new report.
A report output window Select Design from the Report menu on the report.
Report Wizard Open from the last page.

Use Report Manager
64 Avaya CMS Supervisor Report Designer

Issue 1 May 2002 65
Report Designer basics
Report Designer basics outlines the features of Report Designer and describes its general use.
Organization of general information
Report Designer menus on page 66
Organization of procedures
Report Designer basics contains the following procedures:
● Access online database definitions on page 72
● Start Report Designer on page 73
● Exit Report Designer on page 74
● Create a new report on page 75
● Edit an existing report on page 77

Report Designer basics
66 Avaya CMS Supervisor Report Designer
Report Designer menusThis section describes Report Designer menus.
Report
The following is a description of the Report menu.
Menu item Function
Run Takes you out of design mode and runs your report. You will use Run to test the changes or additions you have made to a report.
Save Saves your report.
Save As Saves your report with a new name or with the current name.
Exit Closes Report Designer without saving your changes and additions. You are prompted to save any changes you made.

Report Designer menus
Issue 1 May 2002 67
Edit
The following is a description of the Edit menu.
Menu item Function
Undo Cut/Delete
Undo a cut or deletion.
Undo Align Controls
Undo an alignment you made.
Cut Remove an item from the report and place it on the Windows® clipboard.
Copy Copy the items that you have selected on the report and place it on the Windows clipboard. You can copy only entire tables and entire charts, not a portion of a table or chart. If you want to rearrange the order of the columns on a grid, use the Format Table window.
You can copy from one report to another report. To do so, complete these steps:
1. Open the report from which you want to copy.
2. Select the items that you want to copy.
3. Select Copy from the Edit menu.
4. Open the report to which you want to copy.
5. Select Paste from the Edit menu.
Paste Place one or more items currently on the Windows clipboard into the report that is currently selected in Design Mode.
Delete Remove the currently-selected items from the report.

Report Designer basics
68 Avaya CMS Supervisor Report Designer
Format
The following is a description of the Format menu.
Align Controls
Align multiple fields according to the controls in the Align Controls dialog box. This option is enabled only when multiple fields are selected.
Inputs Start the Select Inputs assistant, which enables you to choose the items that will be included on the report input window for this report.
For instructions on how to use the Select Inputs assistant, see Edit | Inputs on page 91.
Queries Start the Create a Query assistant, which is where you define the SQL queries that will be used to retrieve the data to be displayed on the report.
For instructions on how to use the Create a Query assistant, see Edit | Queries on page 109.
Menu item Function
Menu item Function
Chart Opens the Chart Format Options window. Use the Chart Format Options window to format charts on reports.
For more information about the Chart Format Options window, see Format | Chart on page 155.
Field Opens the Field Format Options window. Use the Field Format Options window to format fields defined in queries.
For more information about the Field Format Options window, see Format | Field on page 203.

Report Designer menus
Issue 1 May 2002 69
Options
The following is a description of the Options menu.
Table Opens the Table Format Options window. Use the Table Format Options window to format tables on reports.
For more information on the Table Format Options window, see Format | Table on page 185.
Sort by Opens the Table Format Options window with the Sort tab active. Use the Table Format Options window to access the General and Sort by tabs to format tables on reports.
For more information on the Table Format Options window, see see Format | Table on page 185.
Text Opens the Text Format Options window when a text item on the report is selected. Use the Text Format Options window to change the font display characteristics for the selected text.
For more information on the Text Format Options window, see Format | Text on page 209.
Menu item Function
Menu item Function
Status Bar Include a status bar on the bottom of the report you want to design. A check mark next to the menu item means that you have selected Status Bar.
Align To Grid
Align the currently-selected items on the report to the Design Mode grid when they are moved. The Design Mode grid is the grid that is shown on the window, behind any charts, tables, or text, when you are in Design Mode. Align To Grid is selected when there is a check mark next to the menu item.

Report Designer basics
70 Avaya CMS Supervisor Report Designer
Insert
The following is a description of the Insert menu.
Menu item Function
Chart Opens the Chart Assistant, which is where you define the contents of a chart (graphical presentation of the report information).
This menu item is unavailable if no queries have been defined.
For more information about the Chart Assistant, see Insert | Chart on page 131.
Field Opens the Field Assistant, which is where you define the contents of a field to be placed on the report.
For more information with the Field Assistant, see Insert | Field on page 137.
Table Opens the Table Assistant, which is where you define the contents of a table [standard Avaya Call Management System (CMS) report presentation format] to be placed on the report.
This menu item is unavailable if no queries have been defined.
For more information with the Table Assistant, see Insert | Table on page 145.
Text Opens the Text Assistant, which is where you can enter plain text that will appear on the report.
For more information with the Text Assistant, see Insert | Text on page 151.

Report Designer menus
Issue 1 May 2002 71
Help
The following is a description of the Help menu.
Other ways to access Help
You can access Supervisor Help from all of the windows in Report Designer. You can also use one of the following ways to access Help:
● Press F1
● Click Help (if available)
These methods will provide Help that is specific to the current window.
Menu item Function
Contents Opens the Help Topics dialog for Report Designer.
Technical Support Opens a window that provides technical support information.
About Avaya CMS Supervisor
Opens the Supervisor Help About window, which shows the software version number.

Report Designer basics
72 Avaya CMS Supervisor Report Designer
Access online database definitionsReport Designer provides access to online database item definitions when you want to add database items and calculations to a query. With this feature, you do not have to refer to hard-copy documentation to learn about database items and calculations.
Example
Use this Query Assistant window to access database items and calculations.
Procedure
To access the online database item definitions, do the following steps:
1. From a Query Assistant window, highlight the data group item or calculation for which you want a definition.
2. Click Data Item definition located under the Calculations box.

Start Report Designer
Issue 1 May 2002 73
Start Report Designer
About user permissions
To access Report Designer and to run Designer reports, you must have read and write permissions assigned for Custom Reports. These permissions are set with the User Permissions tool. For more information about user permissions, see the Avaya CMS Administration document.
Different ways to start Report Designer
Use one of the following methods to start Report Designer:
● Select a report from the Designer category in any folder and click Edit on the Reports Selector window.
● Click New on the Reports Selector window to create a new report.
● Run a report and then select Design from the Report menu on the report.
● Enter Report Designer from the final page of the Report Wizard.
Design Mode window
You can use any method to start Report Designer and go to the Design Mode window. The window will be blank if you want to create a new report or will have report information if you want to edit an existing report.

Report Designer basics
74 Avaya CMS Supervisor Report Designer
Exit Report DesignerYou can close Report Designer using any of the standard Windows® methods:
● Select Exit from the Report menu.
● Double-click System.
● Click Close at the top of the window.
If you try to exit Report Designer without first saving the report you have been working on, a warning gives you the opportunity to save the report before you close Report Designer.

Create a new report
Issue 1 May 2002 75
Create a new reportDo all of the steps in Create a new report to create a custom report. If you consistently do all of these tasks for each report you create, your reports will run properly and you will be able to create them efficiently.
Before you begin
You need to know the following before you create a new report:
● If you want to customize the Historical Call Record Report with Report Designer, the Disposition report field will display the numerical values for DISPOSITION, and not the state names. For more information, see the Avaya CMS Database Items and Calculations document.
● With the addition of the split/skill I_OL1TIME and I_OL2 TIME database items, row data will be archived for those items if the skill row spent any time in overload 1 or overload 2. If the row (skill) spent all of its time in the normal state, and has no other reason to be archived (that is, no agent staffed time, no calls handled, and so on), it will not be archived. When you create a report through Report Designer, data should be summed across intervals in order to see meaningful data.
Procedure
To create a new report, do the following steps:
1. Access Report Designer so that you can design the report.
For more information, see Design mode basics on page 79.
2. Define inputs for the report input window so that users can run the report with parameters they choose (what split, agent, time, date, and so on).
You can also define inputs while you create a query. To do so, click Inputs on the WHERE clause window.
For more information, see Edit | Inputs on page 91.
3. Define report type and rows of data from specific CMS database tables that will supply data for the tables and charts on the report.
For more information, see About queries on page 110.

Report Designer basics
76 Avaya CMS Supervisor Report Designer
4. Define what data from the queries should appear in each chart, field, or table on the report.
For more information, see any of the following chapters:
● Insert | Chart on page 131
● Insert | Field on page 137
● Insert | Table on page 145
5. Enter text to provide headings for the tables and charts on the report, and to provide additional information, such as the report name.
This step is optional.
For more information, see Format | Text on page 209.
6. Define fields on the report to show when the report was run and what items the report covers (as defined in the report input window).
This step is optional.
For more information, see Insert | Field on page 137.
7. Edit a report design with the Cut, Copy, and Paste Edit menu options and standard Windows drag-and-drop conventions. Edit an existing report design to rearrange and delete sections of the report quickly and easily.
For more information, see Design mode basics on page 79.
8. Save the report before you test it.
9. Define the name that you use both to run the report and to access the report design if you want to change the design. Define access to specify whether other users can run the report and can copy the report’s design to create their own custom reports. Define the type as real-time, historical, or integrated.
For more information, see View or change a report’s properties on page 56.
10. Test your report immediately after you design and save it. A test helps eliminate wasted time in running a report that has an incomplete design.

Edit an existing report
Issue 1 May 2002 77
Edit an existing reportUse this procedure to edit an exiting report in Report Designer. If you consistently do all of these tasks for each report you want to edit, your reports will run properly and you will be able to create them efficiently.
To edit an existing report, do the following steps:
1. Copy an existing report so that you start the design process with existing report headings, data fields, queries, charts, tables, and other report features. When you copy a report to the Designer category, the original report remains intact and is still located in the original report category.
You can also run a report and then select Design from the Report menu. This takes you directly into design mode, and you will be asked if you want to save the report (with a new name, in the Designer category) when you exit design mode.
For more information, see Copy a report to the designer category on page 57.
2. Define the name that you use both to run the report and to access the report design if you want to change the design. Define access to specify whether other users can run the report and can copy the report’s design to create their own custom reports. Define the type as real-time, historical, or integrated. When you copy a report to the Designer category with Report Manager, the Properties window automatically displays as part of the copy process.
For more information, see View or change a report’s properties on page 56.
3. Access Report Designer so that you can design the report.
For more information, see Open Report Designer with Edit or New on page 63.
4. Edit a report design with the Cut, Copy, and Paste Edit menu options and standard Windows drag-and-drop conventions. Edit an existing report design to rearrange and delete sections of the report quickly and easily.
For more information, see Design mode basics on page 79.
5. Define inputs for the report input window so that users can run the report with parameters they choose (what split, agent, time, date, and so on).
You can also define Inputs while you create a query. To do so, click Inputs on the WHERE clause window.
For more information, see Edit | Inputs on page 91.
6. Define which rows of data from specific CMS database tables will supply data for the grids and charts on the report. If you copy a report design, the definitions of that report’s queries are copied. You can then modify the queries, as required.
This step is optional.
For more information, see About queries on page 110.

Report Designer basics
78 Avaya CMS Supervisor Report Designer
7. Define what data from the queries should appear in each chart, field, or table on the report. If you copy a report design, the definitions of that report’s charts, fields, and tables are copied. You can then modify the definitions as required.
This step is optional.
For more information, see any of the following chapters:
● Insert | Chart on page 131
● Insert | Field on page 137
● Insert | Table on page 145
8. Enter text to provide headings for the tables and charts on the report, and to provide additional information, such as the report name. If you copy a report design, the text of that report is copied. You can then modify the text as desired.
This step is optional.
For more information, see Insert | Text on page 151.
9. Define fields on the report to show when the report was run and what items the report covers (as defined in the report input window). If you copy a report design these fields are copied. You can modify them as required.
This step is optional.
For more information, see Insert | Field on page 137.
10. Save the report before you test it.
11. Test your report immediately after you design and save it. A test helps eliminate wasted time in running a report that has an incomplete design.

Issue 1 May 2002 79
Design mode basics
Design mode basics describes how to use the basic Windows® features of the Report Designer Design Mode window.
Organization of procedures
Design mode basics contains the following procedures:
● Copy an item and paste the item into the same report on page 80
● Copy and paste items on page 81
● Cut an item on page 82
● Delete an item on page 83
● Drag and drop to arrange items on page 84
● Resize an item on page 85
● Select and move multiple items on page 86
● Change the width of a column in a table on page 87
● Change the column headings on page 88
● Align fields on page 89
● Scale to page on page 90

Design mode basics
80 Avaya CMS Supervisor Report Designer
Copy an item and paste the item into the same reportTo copy an item in a report and paste the copy into the same report, do the following steps:
1. Open the report from which you want to copy.
2. Select one or more items that you want to copy.
3. Select Copy from the Edit menu, or press CTRL+C.
4. Select Paste from the Edit menu, or press CTRL+V.
The system places items in the upper-left corner of the Design Mode window.

Copy and paste items
Issue 1 May 2002 81
Copy and paste items
Copy from a Designer report
To copy items from one report to another report, do the following steps:
1. Open the report from which you want to copy.
2. Select the items that you want to copy.
3. Select Copy from the Edit menu, or press CTRL+C.
4. Open the report to which you want to paste what you have copied.
5. Select Paste from the Edit menu, or press CTRL+V.
Note:
Open both reports in design mode to copy from one report to another report.
Copy from a report that is not a Designer report
If you want to copy an item from a report that is not a Designer report, do the following steps:
1. Run the report.
2. Select Design from the Report menu.
3. Copy the item to the clipboard.
See Copy from a Designer report on page 81.
4. Select Run from the Report menu.
One of the following occurs:
● If you did not make any changes to the report, you will automatically be returned to the run mode.
● If you inadvertently made changes to the report, Supervisor displays a message that gives you the option to save the changes.
5. Click No if you made changes that you do not want to save.

Design mode basics
82 Avaya CMS Supervisor Report Designer
Cut an itemTo cut an item from a report and place the information on the Windows clipboard, do the following steps:
1. Click the item.
2. Select Cut from the Edit menu, or press CTRL+X.

Delete an item
Issue 1 May 2002 83
Delete an itemUse this procedure to permanently remove the currently-selected items from the report.
Procedure
To delete an item from a report, do the following steps:
1. Click the item.
2. Select Delete from the Edit menu, or press DELETE.
The item is removed from the report and is no longer available to be pasted into the report.
Restore an accidently-deleted item
If you accidentally delete an item that you want to keep in the report, you can select Undo from the Edit menu if you haven’t done anything else. If you do not immediately realize that you inadvertently deleted an item, you can use the Insert menu to recreate the item.

Design mode basics
84 Avaya CMS Supervisor Report Designer
Drag and drop to arrange itemsTo reposition one or more items on a report with the drag-and-drop method, do the following steps:
1. Point the cursor at the item and click one time to select one or more items.
To select additional items, hold down CTRL and click the cursor on the items.
You will know when an item is selected because there will be a frame around the item or sizing handles will display on the corners of the item.
2. Hold down the left mouse button.
3. Move the cursor to the position where you want the item to reside.
4. Let go of the mouse button.

Resize an item
Issue 1 May 2002 85
Resize an itemTo resize an item on a report, do the following steps:
1. Click the item.
2. Place the mouse cursor over one of the sizing handles on the item.
3. Press the left mouse button.
4. Drag the mouse cursor until the item is the appropriate size.
5. Release the mouse button.

Design mode basics
86 Avaya CMS Supervisor Report Designer
Select and move multiple items
Select multiple items
To select multiple items on a report (for instance, to copy more than one item at a time), do the following steps:
1. Select the first item.
2. Hold down CTRL.
3. Select the second item.
Handles are displayed around the items.
Move multiple items
To move the group of items on a report, do the following steps:
1. Place the cursor within the selected items.
2. Hold down the left mouse button and drag the selected items to the desired area. There is a visual indication that your selected items will move as a group with the cursor. As you move the selected items, an outline of the items is displayed and then moves with your cursor.
3. Once the items are in the desired location, release the mouse button. The selected items are displayed in the desired location.

Change the width of a column in a table
Issue 1 May 2002 87
Change the width of a column in a tableYou can quickly and easily change the column widths in your table while in the design mode.
To change a column width, do the following steps:
1. Place the mouse pointer on the border between the column heading. The mouse pointer changes to the following shape:
2. Hold down the left mouse button and drag the column border to the left or right. The column width automatically decreases or increases depending on how you move the column border.

Design mode basics
88 Avaya CMS Supervisor Report Designer
Change the column headingsYou can quickly and easily change the column headings in your table while in the design mode.
To change a column heading, do the following:
1. Click the heading name you want to change. A dialog box opens with the current heading highlighted.
2. Enter the new name of the heading in the Name text box.
3. Click OK.

Align fields
Issue 1 May 2002 89
Align fields
Align menu items
The Report Designer Edit menu has two menu items:
● Align Controls
● Undo Align Controls
How to use align
You can select multiple fields and align them in various ways. You can undo the alignment if you are not satisfied with the results.The Align Controls dialog box provides six alignment choices. When you select multiple fields, an outline around the fields appears. Any alignment choice you select will align the fields within this outline.

Design mode basics
90 Avaya CMS Supervisor Report Designer
Scale to pageWhen you print a report that is too large to fit on one page, you will be prompted with one or more messages. The number of messages will depend on the size of your report. The messages will ask if you want Report Designer’s Scale to Page function to attempt to fit your report onto one page.

Issue 1 May 2002 91
Edit | Inputs
Edit | Inputs describes the Edit | Inputs menu option.
Use the Edit | Inputs menu option to add, delete, and edit the input fields for a Report Designer report.
Organization of general information
Edit | Inputs contains the following general information:
● The Report Input fields on page 92
● Information about how to add input fields on page 94
● Input fields for pattern matching on page 95
● Input types on page 97
Organization of procedures
Edit | Inputs contains the following procedures:
● Add input fields to the input window on page 100
● Delete input fields from the input window on page 101
● Edit the order of input fields on page 102
● Edit the appearance of input fields on page 103
● Set up inputs for a multi-ACD report on page 105
● View the input window on page 108

Edit | Inputs
92 Avaya CMS Supervisor Report Designer
The Report Input fields
The Report Input window
To run a report, you first access a Report Input window. The Report Input window gives you control over what data (which splits/skills, trunks, dates, intrahour intervals, and so on) are included in the report.
The Define Input window
To define report input fields for a designer report, use the Define Input window. When you or another user runs the report, this input window opens with the field prompts and the input fields you defined.
You define fields for the Report Input window when you use the steps described in the following pages.
Example of input window
In the example input window that is shown below, the user has entered a split number of 1, a date of 07/01/96, and intrahour intervals of 8:00 a.m. to 11:00 a.m.

The Report Input fields
Issue 1 May 2002 93
How CMS stores and retrieves data
Because the report this input window is associated with is a Historical Interval report, Avaya Call Management System (CMS) will retrieve the data for the report from the historical database tables, which are designated with an h (hagent, hsplit, htrunk, and so on). For more information on how CMS stores and retrieves data, refer to either of the following:
● How CMS stores and retrieves data on page 223
● Avaya CMS Database Items and Calculations document

Edit | Inputs
94 Avaya CMS Supervisor Report Designer
Information about how to add input fields
Why define an input field?
When you define the type of an input field, CMS will be able to do the following when your users run the report:
● Check that your user’s entries are valid system values and are values CMS can use to search the database tables.
● Check your users for permission to run a report for the entries.
● Allow your users to enter names defined in the Dictionary subsystem.
Add only relevant information
Add inputs that are only used in the report queries. If you add additional inputs that are not used in the queries, then irrelevant information that references those inputs will display on the input window for the report.
Fields you do not define
You will not need to define the following input fields:
● If you want to define a real-time report, you cannot and do not need to define an Update Rate in Seconds input field because the field is automatically included in the Report Input window.
● If you want to define a historical report, you cannot and do not need to define a Report Destination input field because the field is automatically included in the Report Input window.
● If you want to define an integrated report, you cannot and do not need to define a Start Time input field because the field is automatically included in the Report Input window.
Related topic
For the procedure, see Add input fields to the input window on page 100.
Input fields for pattern matching
Issue 1 May 2002 95
Input fields for pattern matching
What is pattern matching?
CMS can search for values in certain database items according to wild card search patterns. As a result, you can create a report that allows inputs based on the following:
● Character strings
● An asterisk, which matches blank and all characters
● A question mark, which matches any single character
CMS then reports data for all items that match entered values.
Database items that allow search
The standard database items that allow pattern matching are as follows:
● VDN (the value is a VDN number)
● EXTENSION (the value is an extension number)
● LOGID (the value is an agent login ID)
● EQLOC (the value is a 9-digit trunk location number)
● CWC (the value is a call work code)
● ROW_DATE (the value is a date)
In addition, any custom database items that you define as CHAR columns in INFORMIX also allow pattern matching.
Example using an asterisk
You can search with an asterisk (*). If an input field is a string type and is associated with the LOGID database item, the user can enter 1*, and CMS reports data for all agents with login IDs that start with 1 (1, 10, 1238, 190, and so on, depending on the switch’s administered login length).
Edit | Inputs
96 Avaya CMS Supervisor Report Designer
Example using a question mark
You can search with a question mark (?). If an input field is a string type and is associated with the VDN database item, the user can enter 21?0, and CMS reports data for all VDNs that start with 21, end with 0, and have any single character appearing between the 21 and the 0 (2100, 2110, 2120, 2130, and so on).
Example using String as an input field
If you select String for an input field, CMS does not check a user’s inputs in that field for appropriate read permissions or valid switch parameters. If you want CMS to check permissions for a VDN input field, you must select the VDN field type. If you want CMS to check switch parameters for a VDN, login ID, extension, or call work code input field, you must select that field type, not String. In addition, if you select String for a field, the user will not be able to enter Dictionary names. So, again, if you want to let the user enter VDN, login ID, or call work code names to run a report, you must select that specific field type, not String.

Input types
Issue 1 May 2002 97
Input types
For this type of input: The user must enter the following information:
ACD An ACD number or name.
Agent An agent name (as defined in the Dictionary) or agent login ID.
The Agent input field can only be a single-value input for integrated reports.
Agent group An agent group name (as defined in the Dictionary).
Use the following query:
ACD=$acd and OLDEST_LOGON > 0 and LOGID in (select value from agroups where acd_no=$acd and item_name = [Agent Group:])
Agent state An agent state name (standard or new name as defined in the Dictionary). Standard names are ACD, AUX, ACW, and so on.
Call Work Code Call work code names or numbers.
Date A date in region-specific format or as a relative number (for example, -7 for 7 days ago).
Extension An extension number.

Edit | Inputs
98 Avaya CMS Supervisor Report Designer
Location ID A location ID can be assigned to either an agent or to a trunk equipment location. Location IDs are between 1 and 44 characters.
● The location IDs are actually assigned to the agent’s terminal, and are associated with the MultiVantageTM port network to which terminals are assigned. Agent location IDs are available only for reports for agents who are currently logged in. Agent location IDs are part of the Agent Site Tracking feature.
● Trunk location IDs are assigned to the trunk equipment location, and are associated with the switch port network location. Trunk equipment location ID is part of the Multi-Locations feature on the switch.
Login ID A login ID.
Number A number, which may include digits to the right of the decimal point. This type applies if your variable field asks for specific values about ACD performance (for example, number of ACD calls or percent within service level).
Split/Skill A split/skill number or name.
String A character string. Select this type only if one of the following is true:
● Your variable field is linked to a custom database item that you identify in INFORMIX® as a CHAR column.
● Your variable field is linked to a standard database item that is a CHAR column, and you want to allow the user to do a pattern search when running the report. For more information, see Input fields for pattern matching on page 95.
Time(duration)
A number, including decimals, of seconds. This type applies only if your variable field asks for specific values regarding ACD performance (for example, time in AUX work, average speed of answer, or average talk time).
For this type of input: The user must enter the following information:

Input types
Issue 1 May 2002 99
Time (point in time)
A specific time of day in hh:mm format, either as 24-hour time or with AM or PM appended.
Trunk A trunk name or number.
The Trunk input field can only be a single-value input for integrated reports.
Trunk group The number or name of a trunk group.
Trunk state A trunk state name (standard name or new name as defined in the Dictionary subsystem). Standard names are IDLE, SEIZED, QUEUED, and so on.
Note:
If you use Trunk state as an input in an integrated report, use a real-time query. You cannot use Trunk state in an integrated query.
VDN A Vector Directory Number (VDN) name.
The VDN input field can only be a single-value input for integrated reports.
Vector A vector number or name.
The Vector input field can only be a single-value input for integrated reports.
For this type of input: The user must enter the following information:

Edit | Inputs
100 Avaya CMS Supervisor Report Designer
Add input fields to the input window
Before you begin
Read the following topics before you do this procedure if you have not done so already:
● Information about how to add input fields on page 94
● Input fields for pattern matching on page 95
● Input types on page 97
Procedure
To define the input fields for a report, do the following steps:
1. Select Inputs from the Edit menu.
An Edit Inputs window opens.
● If you want to edit an existing report, the items that already appear on the input window for the report are shown in the Inputs list.
● If you want to create a new report, the Inputs list is blank.
2. In the Input Types list, highlight the first input you want to require for the report.
For definitions of the available input types, see Input types on page 97.
3. Click Add.
The item is displayed on the Inputs list.
4. Repeat Step 2 until you have added all of the inputs required for the report.

Delete input fields from the input window
Issue 1 May 2002 101
Delete input fields from the input window
Before you begin
If a field is used in a query, you cannot remove the input until you remove or modify the query.
Procedure
To delete one of the inputs you have added for a report input window, do the following steps:
1. Select Inputs from the Edit menu.
2. On the Inputs table, click on the left-numbered column of the row to highlight the row of the item.
3. Click Remove.

Edit | Inputs
102 Avaya CMS Supervisor Report Designer
Edit the order of input fieldsTo change the order in which input fields appear on the report input window, do the following steps:
1. Select Inputs from the Edit menu.
2. Add the Input Types that will appear on the input window to the Inputs table.
3. Click on the left-numbered column of the row to select the entire row of the input that contains the fields you want changed.
4. Use Up and Down to move the entire row up or down one row at a time.
5. Use the Inputs list to edit the name of the prompt for each input field, control whether multiple values are allowed in the input field, and define the ACD with which the input will be associated.
6. When you are finished with your edits, click OK.

Edit the appearance of input fields
Issue 1 May 2002 103
Edit the appearance of input fieldsUse the Inputs list to edit the name of the prompt for each input field, control whether multiple values are allowed in the input field, and define the ACD with which the input will be associated.
Example
Edit columns
When you add an item from the Input Types list to the Inputs list, the columns of the Inputs table are populated with the default values for that input item. The columns of the Inputs table are as follows:
Column Function
Type The Type column shows the input field name. You can use the pull-down list to the right of the column to change the input in a particular row to another type.
Multi-value Click Multi-Value if you want to allow users to enter multiple values in the input field.

Edit | Inputs
104 Avaya CMS Supervisor Report Designer
Prompt The prompt column shows the text that will display on the report input window for this input field. To edit the text for the prompt, select the cell in the table and then type the text that you want to display. If you want to delete the existing prompt text, use backspace to erase the letters.
You can enter a name of up to 30 characters long, including blank spaces.
The prompt name should describe the information (what split/skill, what date, what time, and so on) you must enter in the field when you order the report. For example, if you want to enter a date, Date would be an appropriate prompt. However, if you can enter more than one date in the field, Dates would be more appropriate.
Associated ACD
The Associated ACD column lets you use the Current ACD or assign a specific ACD to be used for this input. The default for this column is Current ACD. If you want to allow the user to pick a specific ACD for the input field, use the pull-down list to the right of the column to select ACD. If the Associated ACD column is blank, the input cannot be associated with a specific ACD.
Select Current ACD if either of the following conditions is true:
● You have only one ACD
● You always want the report to show data for the user’s current ACD
Select ACD if the people who run the report have read permissions for more than one ACD. Allowing the user to select the ACD for the input is most useful when you create a multi-ACD report.
Default Value
You can define a default value for most input fields. To do this, select browse to the right of the column. The available values for this type of input are displayed. Highlight one and click OK.
If you select a default value, the user can change the value on the input window.
Column Function

Set up inputs for a multi-ACD report
Issue 1 May 2002 105
Set up inputs for a multi-ACD reportUse this procedure to create a multi-ACD report. Make sure that you set up the inputs as detailed in this procedure so that the query for the report will work properly.
Types of multi-ACD reports
The following types of multi-ACD reports are available:
● Multi-ACD reports that show data for multiple splits/skills on multiple ACDs
● Multi-ACD reports that show data for multiple VDNs on multiple ACDs
Procedure
The following instructions use the split/skill multi-ACD report inputs as an example. To create the inputs for a VDN multi-ACD report, use the same instructions, but use the VDN input instead of the Split/Skill input.
The following instructions show you how to create the inputs for a multi-ACD report that allows inputs for up to four ACDs:
1. Select Inputs from the Edit menu.
2. Select ACD from the Input Types box.
3. Click Add.

Edit | Inputs
106 Avaya CMS Supervisor Report Designer
4. Repeat Steps 2 and 3 three times.
The Inputs table looks like this:
5. Select Split/Skill from the Input Types box.
6. Click Add.
7. Repeat Steps 5 and 6 three times.
The Inputs table now looks like this:

Set up inputs for a multi-ACD report
Issue 1 May 2002 107
8. For the Split/Skill(2) prompt (line 6 of the Inputs table), use the Associated ACD drop-down list to select ACD(2) as the associated ACD.
9. For the Split/Skill(3) prompt (line 7 of the Inputs table), use the Associated ACD drop-down list to select ACD(3) as the associated ACD.
10. For the Split/Skill(4) prompt (line 8 of the Inputs table), use the Associated ACD drop-down list to select ACD(4) as the associated ACD.
The Inputs table now looks like this:
11. Click OK to save the inputs for this multi-ACD report.

Edit | Inputs
108 Avaya CMS Supervisor Report Designer
View the input window
When to view
To view what the input window will look like, select Run from the Report menu.
Return to design mode
To return to the design mode from the report input menu, click Cancel.
Issue 1 May 2002 109
Edit | Queries
Edit | Queries describes the Edit | Queries menu option.
A report consists of fields, charts, and grids that display data that is retrieved from the Avaya Call Management System (CMS) database tables. Use a query to define what data is retrieved for a specific report.
Organization of general information
Edit | Queries contains the following general information:
● About queries on page 110
● The Query Assistant window on page 111
● The Query Assistant: Select a database and one or more tables for the query window. on page 113
● The Query Assistant: Add the database items and calculations for the SELECT portion of the query window on page 114
● The Query Assistant: Choose functions for the SELECT items window on page 115
● The Query Assistant: Enter the SQL WHERE criteria window on page 116
● The Query Assistant: Specify all field joins for the tables window on page 118
Organization of procedures
Edit | Queries contains the following procedures:
● Create a new query for a real-time report on page 119
● Create a new query for a historical report on page 121
● Create a new query for an integrated report on page 123
● Edit an existing real-time or historical query on page 125
● Edit an existing integrated query on page 127
● Copy a query on page 128
● Delete a query on page 129

Edit | Queries
110 Avaya CMS Supervisor Report Designer
About queriesTo complete the definition of a report’s tables, charts, or fields, you must define the queries that select the rows of the appropriate tables in the CMS database.
What are queries?
Queries are values for either database items or calculations. In most cases, the queries specify the input variables, rather than specific values, as criteria to retrieve information from the database. The input variables allow CMS to use the values entered in the Report Input window as the query criteria for the report.
If you change the prompt in the Edit Inputs window, it is automatically updated in the query.
Queries tell CMS two things:
● Where to get the data
● How to use the data
About columns and rows
CMS selects values from a table with both row and column identifiers. CMS identifies rows of data according to the user’s inputs and the row search conditions you define. CMS identifies columns according to the data expression you define.
Related topics
For more information, see the Avaya CMS Database Items and Calculations document.

The Query Assistant window
Issue 1 May 2002 111
The Query Assistant windowUse the Query Assistant window to define what data is retrieved for a specific report.
Example

Edit | Queries
112 Avaya CMS Supervisor Report Designer
Query Assistant input fields
Data Item definition
Use Data Item definition to see a definition of the database item or calculation.
Field Description
Database Items
Shows a list of all of the available database items, based on the tables you selected on the Select a database and one or more tables for the query window. If you selected more than one historical database table to be used in the query, the table names are appended to the database item names. For example, wsplit.acdtime.
Calculations Shows a list of all of the available calculations, based on the tables you selected on the Select a database and one or more tables for the query window.
Other Use this box to type in a database item name, calculation name, or other acceptable SELECT statement item (such as ACD) for the query.
Query Items Shows a list of all of the database items and calculations that you have made available for use in the query.
The Query Assistant: Select a database and one or more tables for the query window.
Issue 1 May 2002 113
The Query Assistant: Select a database and one or more tables for the query window.
The Table list includes the database items you can include in the query. For real-time and integrated reports, you can select only one table name. For historical reports, you can select up to three table names.
Note:The calculations that are associated with the database items in the tables you choose will also be available for you to use in your query.
Related topic
For information on the database items and calculations available in each table, see the Avaya CMS Database Items and Calculations document.
Edit | Queries
114 Avaya CMS Supervisor Report Designer
The Query Assistant: Add the database items andcalculations for the SELECT portion of the query window
Use this window to add and remove database items and calculations that you want included in the query.
Tasks
Use the Query Assistant window to do the following:
● Use Move Up and Move Down to change the order of the items in the Query Items box.
● To remove an item from the list, highlight an item in the Query Items list, and then click Remove.
● To edit an item in the Query Items box, highlight the item, and then click Edit. The Select Edit window opens.
Example: To create a custom calculation in the edit box, add callsoffered - to the abncalls item, to change the item to callsoffered - abncalls.
Database Items or Calculations
Enter the names of Database Items or Calculations, strings, or constants that you want to use in the query by typing them in the Other text box.
Example: If you want the report to include information that subtracts the quantity of one database item from the quantity of another database item (for instance, ACDCALLS - ACDAUXOUTCALLS), then type a - in the Other text box and add it to the list list of Query Items. When you create the WHERE clause for the query, you can specify a calculation of ACDCALLS - ACDAUXOUTCALLS for the report.
Note:Constants that have been defined in the Dictionary are listed in the Calculations box in addition to the calculation.

The Query Assistant: Choose functions for the SELECT items window
Issue 1 May 2002 115
The Query Assistant: Choose functions for the SELECT items window
Use the Query Assistant window to assign aggregate (AVG, MAX, MIN, and SUM) functions to the Query Items.
Definition of function
A function is a prefix that is attached to a database item, a calculation, parts of a calculation, or a calculation name. Avaya CMS will display only one value on the report if an aggregate function (SUM, AVG, MIN, or MAX) is assigned to a database item or calculation.
Types of functions
The available aggregate functions are as follows:
Aggregate function Description
MAX Retrieves the highest value for a calculation or database item over the time frame of the report
MIN Retrieves the lowest value for a calculation or database item over the time frame of the report
SUM Retrieves the sum of all values for a calculation or database item over the time frame of the report
AVG Retrieves the average of all values found over the time frame of the report

Edit | Queries
116 Avaya CMS Supervisor Report Designer
The Query Assistant: Enter the SQL WHERE criteria window
Use this Query Assistant window to define the SQL WHERE clauses that you want to use to retrieve data for the report. The SQL WHERE clause tells the CMS to retrieve the data defined in the SELECT box that matches the criteria defined in the WHERE box. The SELECT box specifies which columns of data to consider in the database tables. The WHERE box species which rows of data to consider in the database tables.
Tips using this window
You can add your own text in the WHERE clause (such as parenthesis and numbers) by placing your cursor where you want the text to display and type in the text.
If you want to create a report that will display data for multiple splits/skills or VDNs on multiple ACDs, you can type MULTI_ACD in the WHERE clause, instead of entering each individual OR statement. This will only work if you have correctly set up the inputs for the multi-ACD report.
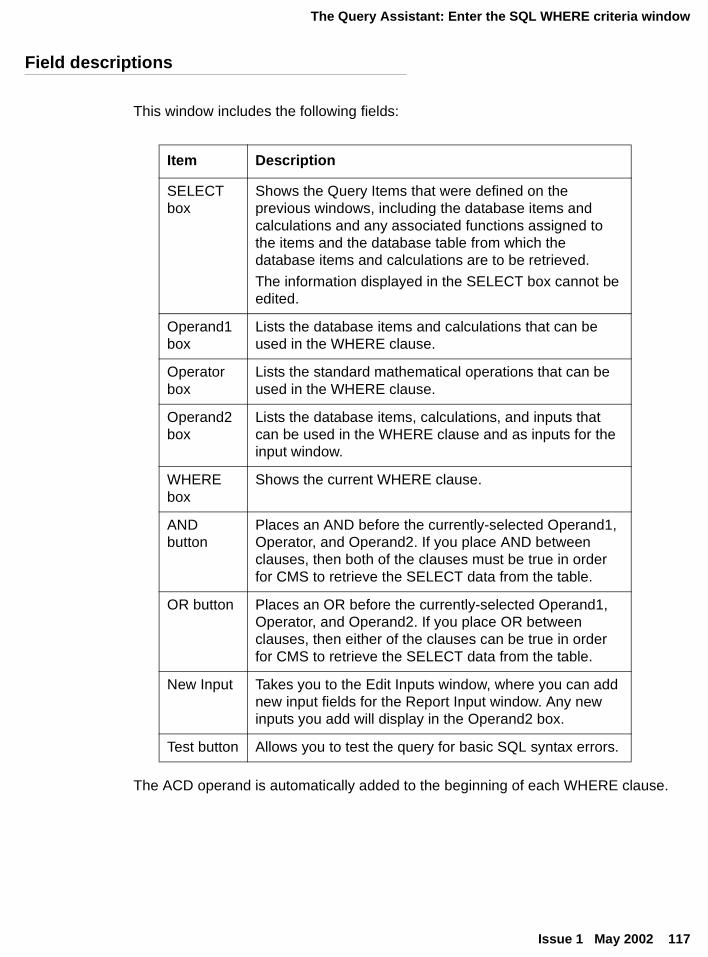
The Query Assistant: Enter the SQL WHERE criteria window
Issue 1 May 2002 117
Field descriptions
This window includes the following fields:
The ACD operand is automatically added to the beginning of each WHERE clause.
Item Description
SELECT box
Shows the Query Items that were defined on the previous windows, including the database items and calculations and any associated functions assigned to the items and the database table from which the database items and calculations are to be retrieved.
The information displayed in the SELECT box cannot be edited.
Operand1 box
Lists the database items and calculations that can be used in the WHERE clause.
Operator box
Lists the standard mathematical operations that can be used in the WHERE clause.
Operand2 box
Lists the database items, calculations, and inputs that can be used in the WHERE clause and as inputs for the input window.
WHERE box
Shows the current WHERE clause.
AND button
Places an AND before the currently-selected Operand1, Operator, and Operand2. If you place AND between clauses, then both of the clauses must be true in order for CMS to retrieve the SELECT data from the table.
OR button Places an OR before the currently-selected Operand1, Operator, and Operand2. If you place OR between clauses, then either of the clauses can be true in order for CMS to retrieve the SELECT data from the table.
New Input Takes you to the Edit Inputs window, where you can add new input fields for the Report Input window. Any new inputs you add will display in the Operand2 box.
Test button Allows you to test the query for basic SQL syntax errors.

Edit | Queries
118 Avaya CMS Supervisor Report Designer
The Query Assistant: Specify all field joins for the tables window
Use this Query Assistant window to ensure that items between two or three tables are equal in order to be used in the report.
Example: You might want to select the acd item from each agent and make a join clause to ensure that the report is for the same ACD information across the tables.

Create a new query for a real-time report
Issue 1 May 2002 119
Create a new query for a real-time reportTo create a new query for a real-time report, do the following steps:
1. Select Query from the Edit menu.
The Query Select window opens.
2. Click New.
A Query Assistant window opens. For more information on this window, see The Query Assistant: Select a database and one or more tables for the query window. on page 113.
3. Click Real-Time Database.
4. In the Table list, highlight the name of the table that include the database items that you want to include in the query. For real-time reports, you can select only one table name.
5. Click Next.
A Query Assistant window opens. For more information on this window, see The Query Assistant: Add the database items and calculations for the SELECT portion of the query window on page 114.
6. In either the Database Items or Calculations box, highlight the first database item or calculation that you will reference in the query.
7. Click Add or double-click the item.
The item is listed in the Query Items box.
8. Repeat Steps 6 and 7 until all of the database items and calculation that you want referenced in the query are listed in the Query Items box.
9. Click Next.
A Query Assistant window opens. For more information on this window, see The Query Assistant: Choose functions for the SELECT items window on page 115.
10. Highlight the first Query Item that you want to assign an aggregate function.
11. Highlight the Function that you want to assign an aggregate function.
12. Repeat Steps 10 and 11 until you have assigned Functions to the appropriate Query Items.
13. Click Next.
A Query Assistant window opens. For more information on this window, see The Query Assistant: Enter the SQL WHERE criteria window on page 116.
14. In the Operand1 box, highlight the first database item or calculation that you want considered in the WHERE clause.
15. In the Operator box, highlight the appropriate operation.

Edit | Queries
120 Avaya CMS Supervisor Report Designer
16. In the Operand2 box, highlight the second database item or calculation that you want considered in the WHERE clause.
Example: If you wanted the report to select the data from the table when the number of ACDCALLS is greater than the number of ACWINCALLS, then you would select acdcalls in the Operand1 box, the > sign in the Operator box, and ACWINCALLS in the Operand2 box.
17. Select AND or OR, as appropriate.
18. Repeat Steps 14 through 17 until you have completed the query.
19. Click Test.
CMS checks the syntax of the query and returns a message with any errors. For more information, see Error messages on page 213.
20. Correct any of the errors detected in the test.
21. Click Next.
A Query Assistant window opens. Use this window to give your query a new name.
22. In the Name text box, type the name that you want to assign to the query you created.
23. Click Done.

Create a new query for a historical report
Issue 1 May 2002 121
Create a new query for a historical reportTo create a new query for a historical report, do the following steps:
1. Select Query from the Edit menu.
The Query Select window opens.
2. Click New.
A Query Assistant window opens. For more information, see The Query Assistant: Select a database and one or more tables for the query window. on page 113.
3. Click Historical Database.
The tables that are available for the historical database display.
4. In the Table list, highlight the names of the tables that include the database items that you want to include in the query. For historical reports, you can select up to three table names.
5. Click Next.
A Query Assistant window opens. For more information, see The Query Assistant: Add the database items and calculations for the SELECT portion of the query window on page 114.
6. In either the Database Items or Calculations box, highlight the first database item or calculation that you will reference in the query.
7. Click Add or double-click the item. The item is listed in the Query Items box.
8. Repeat Steps 6 and 7 until all of the database items and calculations that you believe will be referenced in the query are listed in the Query Items box.
9. Click Next.
A Query Assistant window opens. For more information, see The Query Assistant: Choose functions for the SELECT items window on page 115.
10. Highlight the first Query Item that you want to assign an aggregate function.
11. Highlight the function that you want to assign to the item.
12. Repeat Steps 10 and 11 until you have assigned functions to the appropriate Query Items.
13. Click Next.
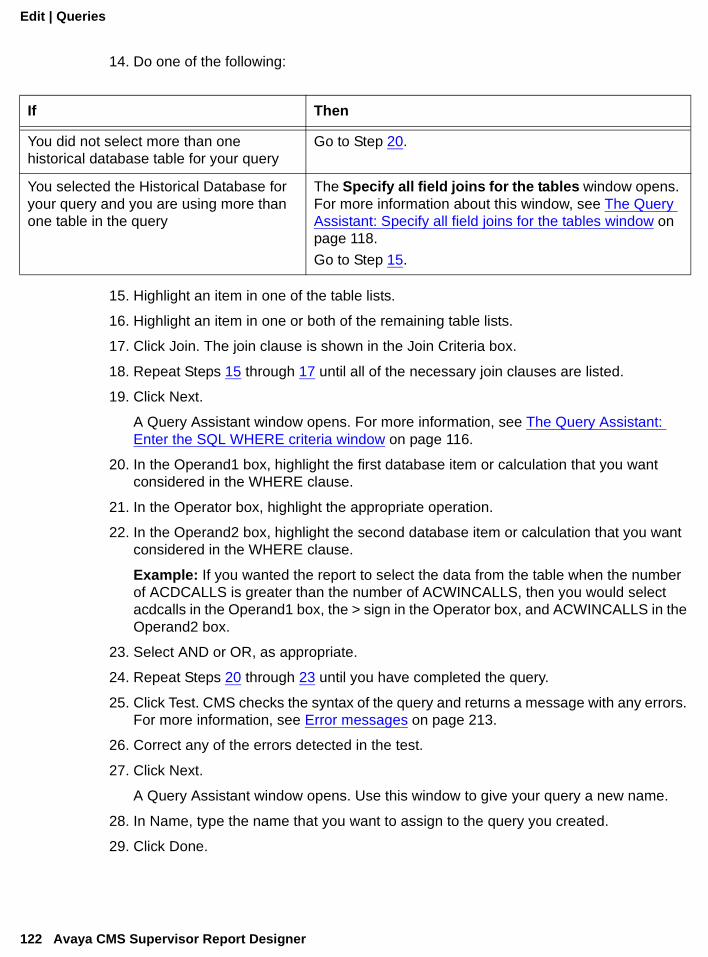
Edit | Queries
122 Avaya CMS Supervisor Report Designer
14. Do one of the following:
15. Highlight an item in one of the table lists.
16. Highlight an item in one or both of the remaining table lists.
17. Click Join. The join clause is shown in the Join Criteria box.
18. Repeat Steps 15 through 17 until all of the necessary join clauses are listed.
19. Click Next.
A Query Assistant window opens. For more information, see The Query Assistant: Enter the SQL WHERE criteria window on page 116.
20. In the Operand1 box, highlight the first database item or calculation that you want considered in the WHERE clause.
21. In the Operator box, highlight the appropriate operation.
22. In the Operand2 box, highlight the second database item or calculation that you want considered in the WHERE clause.
Example: If you wanted the report to select the data from the table when the number of ACDCALLS is greater than the number of ACWINCALLS, then you would select acdcalls in the Operand1 box, the > sign in the Operator box, and ACWINCALLS in the Operand2 box.
23. Select AND or OR, as appropriate.
24. Repeat Steps 20 through 23 until you have completed the query.
25. Click Test. CMS checks the syntax of the query and returns a message with any errors. For more information, see Error messages on page 213.
26. Correct any of the errors detected in the test.
27. Click Next.
A Query Assistant window opens. Use this window to give your query a new name.
28. In Name, type the name that you want to assign to the query you created.
29. Click Done.
If Then
You did not select more than one historical database table for your query
Go to Step 20.
You selected the Historical Database for your query and you are using more than one table in the query
The Specify all field joins for the tables window opens. For more information about this window, see The Query Assistant: Specify all field joins for the tables window on page 118.
Go to Step 15.

Create a new query for an integrated report
Issue 1 May 2002 123
Create a new query for an integrated reportTo create a new query for an integrated report, do the following steps:
1. Select Query from the Edit menu.
The Query Select window opens.
2. Click New.
A Query Assistant window opens. For more information, see The Query Assistant: Select a database and one or more tables for the query window. on page 113.
3. Select Database next to Integrated.
The tables that are available for integrated reports are displayed.
4. In the Table list, highlight the name of the table that includes the database items or calculations that you want to include in the query.
For integrated reports, you can select one table per query.
For information on the database items and calculations available in each table, see the Avaya CMS Database Items and Calculations document.
5. Click Next.
A Query Assistant window opens. For more information, see The Query Assistant: Add the database items and calculations for the SELECT portion of the query window on page 114.
6. In either the Database Items or Calculations box, highlight the first database item or calculation that you will reference in the query.
7. Click Add.
The item is listed in the Query Items box.
8. Repeat Steps 6 and 7 until all of the database items and calculations that you believe will be referenced in the query are listed in the Query Items box.
9. Click Next.
A Query Assistant window opens.
10. Click Input Start Time or Select Start Time Now.

Edit | Queries
124 Avaya CMS Supervisor Report Designer
11. Do one of the following:
12. Click Next.
A Query Assistant window opens. On this window, you can choose the input item that will be used for the query.
13. Highlight the inputs you want to use as criteria for the query. You can create a new input by selecting New Input, that takes you to the Edit Inputs assistant.
Only the inputs that apply to the table you selected for this query are displayed.
14. Click Next.
A Query Assistant window opens. On the Query Assistant: Select the input used to indicate the agent or split/skill for this query window, you can choose the input item that will be used for the query.
15. In the Name text box, type the name that you want to assign to the query you created.
16. Click Done.
If you selected Then
Select Start Time Now
Define the time that the integrated data will always begin accumulating for this report.
Input Start Time
A Start Time field will be added to the report input window and users can individually define the time that data will begin accumulating for the report.

Edit an existing real-time or historical query
Issue 1 May 2002 125
Edit an existing real-time or historical queryTo edit an existing real-time or historical query used in a Designer Report, complete the following steps from the Report Designer Design Mode window:
1. Select Query from the Edit menu.
The Query Select window opens.
2. In the Queries box, highlight the name of the query you want to edit.
3. Click Edit.
A Query Assistant window opens. The Database Items and Calculations that are already included in the query are listed in the Query Items list.
4. Do one of the following:
Example:
To edit an item, create a custom calculation in the edit box. For instance, you may add callsoffered - to the abncalls item, so that the item would then read callsoffered - abncalls. That is the calculation that would be available for you to use in the query.
5. Repeat Step 4 until all of the database items and calculations that you believe will be referenced in the query are listed in the Query Items box.
6. Click Where.
A Query Assistant window opens. For more information, see The Query Assistant: Enter the SQL WHERE criteria window on page 116.
7. In the Operand1 box, highlight the first database item or calculation that you want considered in the WHERE clause.
8. In the Operator box, highlight the appropriate operation.
If you want to ... Then ...
Add database items or calculations to the Query Items list
Click Add.
Remove a database item or calculation from the Query Items list
Highlight the item in the list and then click Remove.
Edit a database item or calculation on the Query Items list
Highlight the item in the list and then click Edit.

Edit | Queries
126 Avaya CMS Supervisor Report Designer
9. In the Operand2 box, highlight the second database item or calculation that you want considered in the WHERE clause.
Example: If you want the report to select the data from the table when the number of ACDCALLS is greater than the number of ACWINCALLS, you would select acdcalls in the Operand1 box, the > sign in the Operator box, and ACWINCALLS in the Operand2 box.
10. Select AND or OR, as appropriate.
11. Repeat Steps 7 through 10 until you have completed the query.
You can add your own text in the WHERE clause (such as parenthesis and numbers) by placing your cursor where you want the text to display and type in the text.
12. Click Test.
CMS checks the syntax of the query and returns a message with any errors.
13. Correct any of the errors detected in the test.
14. Click Save.
The changes to the query are saved and the Query Select window opens.

Edit an existing integrated query
Issue 1 May 2002 127
Edit an existing integrated queryTo edit an existing integrated query used in a Designer Report, complete the following steps from the Report Designer Design Mode window:
1. Select Query from the Edit menu.
The Query Select window opens.
2. In the Queries box, highlight the name of the integrated query you want to edit.
3. Click Edit.
A Query Assistant window opens. For more information, see The Query Assistant: Add the database items and calculations for the SELECT portion of the query window on page 114.
4. In either the Database Items or Calculations box, highlight the first database item or calculation that you will reference in the query.
5. Select Add or double-click the item.
The item is listed in the Query Items box.
6. Repeat Steps 4 and 5 until all of the database items and calculations that you believe will be referenced in the query are listed in the Query Items box.
7. Click Next.
A Query Assistant window opens.
8. Click Input Start Time or Select Start Time Now.
● If you click Select Start Time Now, you need to define the time that the integrated data will always begin accumulating for this report.
● If you select the Input Start Time, a Start Time field will be added to the report input window and users can individually define the time that data will begin accumulating for the report.
9. Click Next.
A Query Assistant window opens. Use this window to choose the input item that will be used for the query.
10. Highlight the inputs you want to use as criteria for the query. You can create a new input by selecting New Input, that takes you to the Edit Inputs assistant.
Only the inputs that apply to the table you selected for this query are displayed.
11. Click Save.

Edit | Queries
128 Avaya CMS Supervisor Report Designer
Copy a queryTo copy an existing query, complete the following steps from Report Designer Design Mode:
1. Select Query from the Edit menu.
The Query Select window opens.
2. In the Queries box, highlight the name of the query you want to copy.
3. Click Copy.
The Copy Query window opens.
4. In the To text box, type the name you want to assign to the copied query.
5. Click OK.
The query is copied to the new name and the Query Select window opens, including the new query in the Queries list.
Delete a query
Issue 1 May 2002 129
Delete a query
! Important:If you delete a query that is used in the report, the report will not run.
To delete an existing query, complete the following steps from Report Designer Design Mode:
1. Select Query from the Edit menu.
The Query Select window opens.
2. In the Queries box, highlight the name of the query you want to delete.
3. Click Delete.
A message confirming the delete is displayed.
4. Click OK to delete the query.

Edit | Queries
130 Avaya CMS Supervisor Report Designer

Issue 1 May 2002 131
Insert | Chart
Insert | Chart describes the Insert | Chart menu option.
Once you have defined queries (see Edit | Queries on page 109) for a report, you can use those queries to add a chart to your report using the Chart Assistant, which is accessed by selecting Chart from the Insert menu.
Organization
Information about how to insert charts on page 132
Insert a chart on page 133

Insert | Chart
132 Avaya CMS Supervisor Report Designer
Information about how to insert charts
About inserting charts
There are two things to keep in mind when inserting charts onto a report:
● When you insert a chart on a report, the chart is shown with sample data. This helps you visualize how the chart will display when you run the report.
● Each item is initially inserted in the upper-left corner of the report. You need to drag-and-drop the chart to the location where you want it to be displayed on the report.
If you want to edit a chart, select the chart and then choose Chart from the Format menu.
About charts and tables
If the report includes both a chart and a table, you need to place the chart above the table on the report. The reason for this is that if the table spans multiple pages when printed and if the chart is below the table, the table will print above the chart.
About fields and text
Do not position any fields or text over the chart because the chart will be displayed over the field or text, so that the field or text are not visible.

Insert a chart
Issue 1 May 2002 133
Insert a chart
Before you begin
Read Information about how to insert charts on page 132, if you have not already done so.
Procedure
To insert a chart in your report, do the following steps:
1. Select Chart from the Insert menu.
The first window of the Chart Assistant opens.
2. From the Queries drop-down list, select the query from which you want to take data for the chart.
Note:Any created queries that still include errors are unavailable.
The Available Data box is populated with the data that was previously defined for the query.
3. Use Add, Add All, Remove, and Remove All to add items from the Available Data box to the Data on Chart box and to remove items.
Consider the following:
● Use Move Up and Move Down to arrange the items in the order in which you want them displayed on the chart.
● Items that are added to the Data on Chart box are shown in the chart you want to create.
● The maximum number of columns that can be included on a chart is 16.
● If you want to create a chart that uses categories and series as controls on the axis, you need to verify that the first item listed on the Data on Chart box is the item that you want to use as the series for the chart.
4. Click Next.
A Chart Assistant window opens.
To change any of the options you select in the following steps at any time after you insert the chart on the report, select the Format | Chart menu item.

Insert | Chart
134 Avaya CMS Supervisor Report Designer
5. Do one of the following:
6. From the Chart Types box, select which type of chart you want to display. If you are not sure what each type of chart will look like, you can highlight the type and an example of the chart displays on the right side of the window.
7. Select the Stacked, % Axis, and Gradient, as appropriate.
Note:Select Stacked if you want to select % Axis.
1. Select the Rolling check box if you want the real-time chart report to scroll through the refreshes as they occur. If you select the Rolling check box, you need to define the Number of Data Points (refreshes) that will be included on the chart.
If you want the chart to display in ... Then click ...
Two-dimensional format 2D
Three-dimensional format 3D
Field Description
Stacked Displays the data for all series as stacked rather than displaying the data separately. This check box is disabled for pie charts.
% Axis Displays the value axis (y-axis) as percentages rather than as actual data values. You can combine this with the stacked check box to produce a percentage-stacked chart.
Gradient Specifies the backdrop of a chart as a solid color, a gradient, or as a smooth transition from one color to another. The gradient transition can be one of the following:
● Horizontal
● Vertical
● Rectangle
● Oval
The quality of the gradient effect will vary, depending on the video card installed in the PC, and for printed reports, on the capabilities of the printer.

Insert a chart
Issue 1 May 2002 135
2. Click Next.
A Chart Assistant window opens.
Use this window to define how the data will be displayed on the axis of the chart.
There are three columns used to define the category and series for the chart. The information gathered by each column is as follows:
● Column 1 — Category (can be none)
● Column 2 — Series (usually Split)
● Column 3 — Data
In the following example, the Category (Column 1) is the Time that was selected on the input window, the Series are the Splits that were selected on the input window, and the Data is the data that was retrieved from the Avaya Call Management System (CMS) database for those splits/skills on the specified date for the specified time period.
3. In the Category Available Data box, select the database item that you want to use as the category for the chart. The Category is usually none for real-time charts, or a time database item for historical charts. As you select from the list of available items, the currently selected item moves to the top of the Available Data list and the example on the right side of the window reflects what the chart might look like with that item selected as the chart Category.
CategorySeries
Data
(Column 1)
(Column 2)
(Column 3)

Insert | Chart
136 Avaya CMS Supervisor Report Designer
4. Select the Show Value as Name check box if you want to show the selected category as a Dictionary name.
Note:This check box is available only when the selected category is an item that can be defined in the Dictionary.
5. Select the Format in which the category will display. Use the drop-down list to select from the applicable formats for the selected category. If you want to view all of the available formats for all types of data, select the Show All Formats check box.
6. Select the One Data Value per Row check box to show one line of data when multiple rows of data are retrieved in the query. When One Data Value per Row is selected, the first item listed in the Category Available Items box is the item that is used for the chart category.
The previous example showed a report with One Data Value per Row selected. Below is an example of the same report, using the same Category item (STARTTIME), without One Data Value per Row selected.
In the first example, you can see that the report shows one row of data for the interval beginning at 10:00 AM, one row of data that includes information for each split/skill for the interval beginning at 10:30 AM, and one row of data for the interval beginning at 11:00 AM. In the second example, there is a row of data shown for each split/skill for each interval.
7. Click Done.

Issue 1 May 2002 137
Insert | Field
Insert | Field describes the Insert | Field menu option.
The time or date when a report is run is not stored in any database table. The Avaya Call Management System (CMS), if requested, displays information from the start time specified by the user (for integrated and historical data). Similarly, CMS knows what the currently selected ACD is when you run a report and can display the current ACD name or number on the report.
Organization of general information
Information about how to insert fields on page 138
Organization of procedures
Insert | Field contains the following procedures:
● Use the Field Assistant window on page 139
● Insert an ACD Name field on page 140
● Insert Data Item fields on page 141
● Insert Input Value fields on page 142
● Insert Report Data Start Time field on page 143
● Insert Time Report Run field on page 144

Insert | Field
138 Avaya CMS Supervisor Report Designer
Information about how to insert fields
About Field Assistant
The Field Assistant allows you to insert fields in a designer report to display the report’s run-time, run-date, current ACD, data, or any of the fields that were specified as being required in the report input window. Select Field from the Insert menu to access the Field Assistant.
How to position a field
Each item is initially inserted in the upper-left corner of the report. You will need to drag-and-drop the field to the location where you want it to be displayed on the report.
How to edit a field
If you want to edit a field, select the field. Then choose Field from the Format menu.
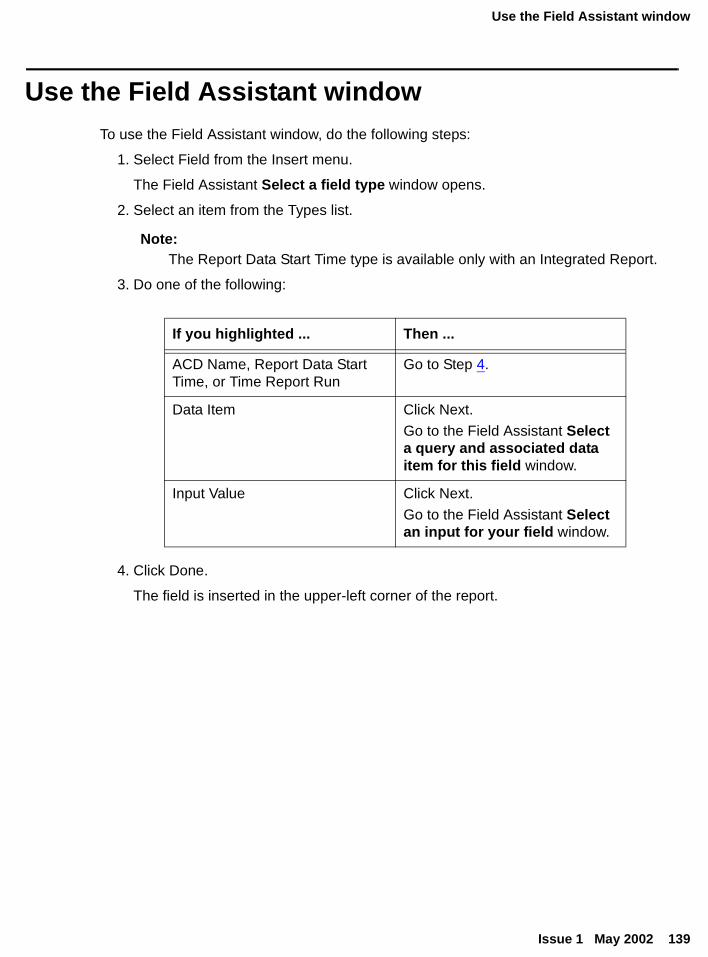
Use the Field Assistant window
Issue 1 May 2002 139
Use the Field Assistant windowTo use the Field Assistant window, do the following steps:
1. Select Field from the Insert menu.
The Field Assistant Select a field type window opens.
2. Select an item from the Types list.
Note:The Report Data Start Time type is available only with an Integrated Report.
3. Do one of the following:
4. Click Done.
The field is inserted in the upper-left corner of the report.
If you highlighted ... Then ...
ACD Name, Report Data Start Time, or Time Report Run
Go to Step 4.
Data Item Click Next.
Go to the Field Assistant Select a query and associated data item for this field window.
Input Value Click Next.
Go to the Field Assistant Select an input for your field window.

Insert | Field
140 Avaya CMS Supervisor Report Designer
Insert an ACD Name field
! Important:Do not position the field over any tables or charts because the table or chart will be displayed over the field so that the field will not be visible.
To insert the name of the ACD for which the report was run, do the following steps:
1. Select Field from the Insert menu.
The Field Assistant wizard opens.
2. Highlight ACD Name in the Types box.
3. Click Done.
The ACD name field is placed in the upper-left corner of the report.
4. Click the item and drag-and-drop it to the location where you want it displayed in the report.

Insert Data Item fields
Issue 1 May 2002 141
Insert Data Item fields
Before you begin
Before you can insert a data item on a report, the data item must be used in a query that is associated with this report.
Procedure
! Important:Do not position the field over any tables or charts because the table or chart will be displayed over the field, and the field will not be visible.
To insert data item fields on the report, do the following steps:
1. Select Field from the Insert menu.
The Field Assistant wizard opens.
2. Highlight Data Items in the Types box.
3. Click Next.
A Field Assistant window opens.
4. Highlight the name of the query from which you want to select the data item.
The available data items for the selected query display in the Available Data box.
5. Highlight the data item that you want to display on the report.
6. Click Done.
The Data Item field is placed in the upper left corner of the report.
7. Click the item and drag-and-drop it to the location where you want it displayed in the report.

Insert | Field
142 Avaya CMS Supervisor Report Designer
Insert Input Value fields
! Important:Do not position the field over any tables or charts because the table or chart will be displayed over the field, and the field will not be visible.
To insert input value fields on the report, do the following steps:
1. Select Field from the Insert menu.
The Field Assistant wizard opens.
2. In the Types box, highlight the Input Value.
3. Click Next.
The Select an input for your field window opens.
4. Highlight the name of the input that you want to show on the report, or create a new input by selecting New Input. The Edit Inputs wizard opens. For information about how to create inputs for a report, see Edit | Inputs on page 91.
5. Click Done.
The Input Value field is placed in the upper left corner of the report.
6. Click the item and drag-and-drop it to the location where you want it displayed in the report.

Insert Report Data Start Time field
Issue 1 May 2002 143
Insert Report Data Start Time field
! Important:Do not position the field over any tables or charts because the table or chart will be displayed over the field, and the field will not be visible.
This type of field applies to only integrated reports.
To insert the initial start time (the time at which data begins accumulating) for an integrated report, do the following steps:
1. Select Field from the Insert menu.
The Field Assistant wizard opens.
2. In the Types box, highlight Report Data Start Time.
3. Click Done.
The Report Data Start Time field is placed in the upper-left corner of the report.
4. Click the item and drag-and-drop it to the location where you want it displayed in the report.

Insert | Field
144 Avaya CMS Supervisor Report Designer
Insert Time Report Run field
! Important:Do not position the field over any tables or charts because the table or chart will be displayed over the field, and the field will not be visible.
To insert on the report the time at which the report was run, do the following steps:
1. Select Field from the Insert menu.
The Field Assistant wizard opens.
2. In the Types box, highlight Time Report Run.
3. Click Done.
The Time Report Run field is placed in the upper left corner of the report.
4. Click the item and drag-and-drop it to the location where you want it displayed in the report.
Issue 1 May 2002 145
Insert | Table
Insert | Table describes the Insert | Table menu option.
Once you have defined the queries (see Edit | Queries on page 109) that you want to use for a report, you can use those queries to add a table to the report with the Table Assistant. To access Table Assistant, select Table from the Insert menu.
Organization of procedures
Insert | Table contains the following procedures:
● How to position and edit tables on page 146
● Insert a table on page 147

Insert | Table
146 Avaya CMS Supervisor Report Designer
How to position and edit tables
Position a field on a table
Each item is initially inserted in the upper-left corner of the report. Drag-and-drop the field to the location where you want it to be displayed on the report.
Edit a table
To edit a table, do the following:
1. Select the table.
2. Choose Table from the Format menu.

Insert a table
Issue 1 May 2002 147
Insert a table
Before you begin
If the report includes both a chart and a table, place the chart over the table on the report. The reason for this is, if the table spans multiple pages when printed and if the chart is below the table on the report, the table will print over the chart so that you cannot see the chart.
Procedure
! Important:Do not position text and fields over the table because the table will be displayed over the text/field, and the text/field will not be visible.
To insert a table on a report, do the following steps:
1. Select Table from the Insert menu.
A Table Assistant window opens.
2. From the Queries drop-down list, select the query from which you want to take data for the table.
Note:Any created queries that still include errors are unavailable.
The Available Data box populates with the data that was previously defined for the query.
3. Use Add, Add All, Remove, and Remove All to add items from the Available Data box to the Data on Table box and remove items.
● Use Move Up and Move Down to place the data items shown in the Data on Table box in the order you want them to be displayed on the table.
● Items that are added to the Data on Table box are shown in the table you want to create.
4. Click Next.
The Table Assistant window opens.
Note:You can change any of the options you select in Steps 5 through 10 after you have inserted the table with Format | Table.
5. Select either Horizonal or Vertical to define the orientation of the table.

Insert | Table
148 Avaya CMS Supervisor Report Designer
6. Add a Summary line to the table by doing one of the following:
7. Select the Headers On check box if you want to include column headers on the table.
8. Select the Grid Lines On check box if you want the table to include lines between the columns and rows.
9. Choose one of the following:
10. Choose one of the following:
11. Click Build a New Query.
12. Type a name for the summary query in the Name field.
13. Edit the table to include the database items and summary information that is appropriate for this summary query.
If ... Then ...
You want to place the Totals line at the top of the table (as standard CMS reports do)
Select the Top.
You want to place the Totals line at the bottom of the table
Select the Bottom.
You do not want to include a Totals line on this table
Select the None.
If ... Then ...
You elected not to include a Summary line on the table
Click Done.
The Table Assistant closes and the table is placed on the report template.
You elected to include a Summary line on the table
Click Next and go to the next step.
A Table Assistant window opens.
If you want to: Then ...
Create a new query for the summary line on this table
Go to Step 11.
Use an existing query for the summary line on this table
Go to Step 15.

Insert a table
Issue 1 May 2002 149
14. Go to Step 17.
15. Click Select an Existing Query.
A Table Assistant window opens.
16. Select the name of one of the existing queries from the drop-down Queries list.
17. Click Done.

Insert | Table
150 Avaya CMS Supervisor Report Designer

Issue 1 May 2002 151
Insert | Text
Insert | Text describes the Insert | Text menu option.
Report Designer allows you to include text strings (with no associated data) on your report. You will use the Text option from the Insert menu to add items such as the report name to your designer reports.
Organization of procedures
Insert | Text contains the following procedures:
● How to position and edit text on page 152
● Insert text on page 153

Insert | Text
152 Avaya Supervisor Report Designer
How to position and edit text
Position text
Each item is initially inserted in the upper-left corner of the report. You will need to drag-and-drop the text to the location where you want it to be displayed on the report.
Edit text
If you want to edit text, select the text. Then choose Text from the Format menu.

Insert text
Issue 1 May 2002 153
Insert text
! Important:Do not position the text over any tables or charts because the table or chart will be displayed over the text, and the text will not be visible.
To insert a text string on a report, do the following steps:
1. Select Text from the Insert menu.
The Text Assistant opens.
2. Type the text that you want to display on the report in the Text contents field.
3. Do one of the following:
4. Click Font.
The Font selector window opens.
5. Select the Font, Style, Point size, Effects, and Script that apply to the text string you want to create.
6. Click OK.
7. On the Text Assistant window, click OK to insert the text string and close the window, or click Apply to apply the changes you made and keep the window open.
The text is inserted, by default, in the upper-left corner of the Design Mode window. You can use the cut, copy, or drag-and-drop method, as outlined in Report Designer basics on page 65, to move the text to the appropriate location on the report.
If you want to ... Then
Select a specific font for the text Go to Step 4.
The default font set Go to Step 7.

Insert | Text
154 Avaya Supervisor Report Designer

Issue 1 May 2002 155
Format | Chart
Format | Chart describes the Format | Chart menu option.
Report Designer allows you to format report charts after they have been inserted on the report. You will use the Chart option from the Format menu to edit charts on your designer reports.
Organization of general information
Format | Chart contains the following general information:
● Information about how to format charts on page 157
● General tab on page 159
● Axis tab on page 161
● Data tab on page 165
● Data Labels tab on page 167
● Fonts tab on page 170
● Legend tab on page 172
● Series Labels tab on page 174
● Title tab on page 176
● Type tab on page 178
● 3D Effects tab on page 181
Organization of procedures
Format | Chart contains the following procedures:
● Change general chart parameters on page 160
● Change axis titles on page 164
● Add, remove, or rearrange data items on page 166
● Define data labels on data points on page 169
● Change fonts on page 171
● Format the chart legend on page 173
● Edit data item headings on page 175

Format | Chart
156 Avaya CMS Supervisor Report Designer
● Format the title on page 177
● Select a chart type on page 180
● Control the 3D appearance on page 183
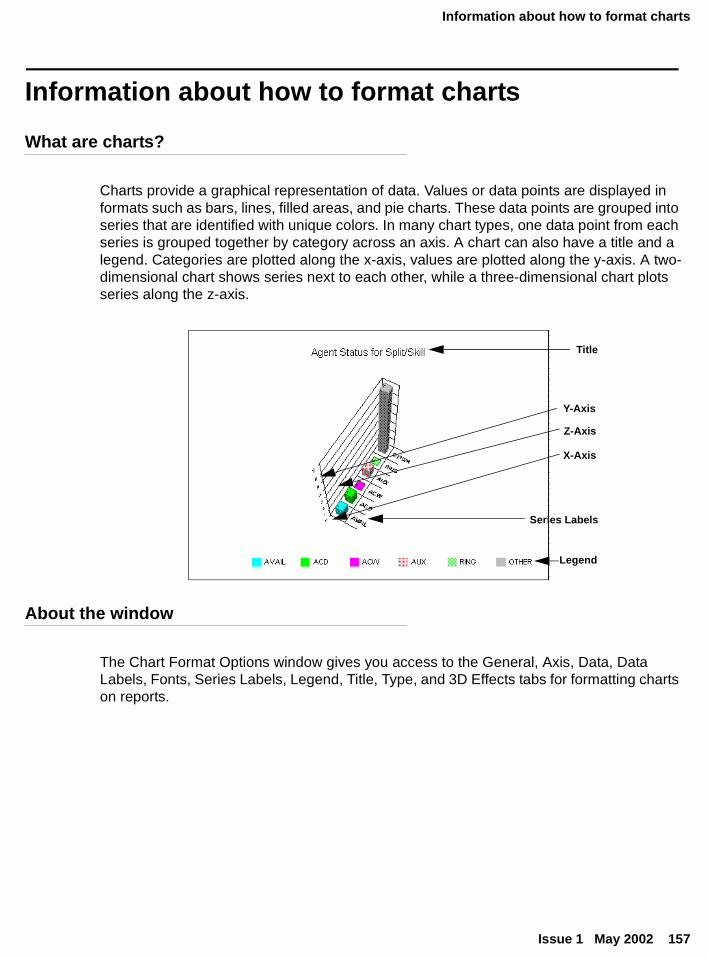
Information about how to format charts
Issue 1 May 2002 157
Information about how to format charts
What are charts?
Charts provide a graphical representation of data. Values or data points are displayed in formats such as bars, lines, filled areas, and pie charts. These data points are grouped into series that are identified with unique colors. In many chart types, one data point from each series is grouped together by category across an axis. A chart can also have a title and a legend. Categories are plotted along the x-axis, values are plotted along the y-axis. A two-dimensional chart shows series next to each other, while a three-dimensional chart plots series along the z-axis.
About the window
The Chart Format Options window gives you access to the General, Axis, Data, Data Labels, Fonts, Series Labels, Legend, Title, Type, and 3D Effects tabs for formatting charts on reports.
Title
Legend
X-Axis
Y-Axis
Z-Axis
Series Labels

Format | Chart
158 Avaya CMS Supervisor Report Designer
How to access the window
If the report you want to design includes a chart, you can format how the chart is displayed and what is displayed on the chart. Access the Chart Format Options window by doing any of the following:
● Double-click a chart in the report.
● Select Chart from the Format menu.
● Select Format Chart from the right mouse button pop-up menu.
How your changes affect others
The changes you make to a report’s format affect only your view of the report. The changes do not affect how other CMS users see the report unless you are in Design Mode.

General tab
Issue 1 May 2002 159
General tabSelect the General tab to specify several general options that apply to the chart.
Example
General tab options
You can change the following chart parameters:
● Background Color — You can specify whether the backdrop of the chart is a solid color or whether it is displayed as a gradient, a smooth transition from one color to another. The gradient transition can be one of the following: Horizontal, Vertical, Rectangle, or Oval. The quality of the gradient effect will vary depending on what video card was installed in the PC, for printed reports, on the capabilities of the printer.
● Options — Select the check boxes, as appropriate, to include or omit grid lines, chart borders, and legend borders on the report.
● Real-Time — If the chart is part of a real-time report and is a rolling chart, you can specify the number of data points to be displayed in the chart. Permitted values are 2 through 100, with 10 the default. A rolling chart is a line chart that is initially displayed with no data points. For each refresh of the report, a data point is added. As data points are added, the chart “rolls” from left to right. When enough refreshes have occurred that the chart displays the number of specified data point, at the next refresh, the oldest data point is dropped from the display and the newest data point is displayed.

Format | Chart
160 Avaya CMS Supervisor Report Designer
Change general chart parametersTo change general chart parameters, do the following steps:
1. In the Background Color box, select Report Background, Solid, or Gradient.
2. In the Options box, select the check boxes, as appropriate.
● Select Grid Lines On to include the lines between rows and columns on any grid that displays on the chart.
● Select Chart Border On to include a border around the chart.
● Select Legend Border On to include a border around the chart legend.
3. If the report you want to design is a real-time report, or if it is a real-time component of an integrated report, you can make the chart a rolling chart. To do this, select the Rolling Chart check box and then define the Number of Data Points that you want displayed on the chart.
Permitted values for the number of data points are 2 through 100.
4. Click Apply to make the changes and to keep the Chart Format Options window open.
5. Click OK to make the changes and to close the Chart Format Options window.
If you select ... Then ...
Report Background The background of the report will default to the color you set on the Options Report Colors tab which is accessed from the Controller Tools menu.
Solid Click the square next to the Background Color option to set the color of the report background.
Gradient The report background will combine the two colors you select in the squares to the right of the Gradient Colors option.
You can select the type of gradient that will be used from the drop-down list below the Gradient option. The available types are Horizontal, Vertical, Rectangle, and Oval.

Axis tab
Issue 1 May 2002 161
Axis tabUse the Axis tab to specify the title that will be displayed on each axis of the chart report.
Example
Axis tab options
You can change the following chart parameters:
● Axis Display — Makes each of the axes visible or invisible. The choices are X Axis, Y Axis, 2nd Y Axis, and Z Axis.
The 2nd Y Axis is available only for bar charts. Select this check box to display the y-axis information on the right side of the bar chart (in contrast to the standard y-axis display on the left side of the chart).
The Z Axis is available only for 3D bar charts. Select this check box to make the chart look 3-dimensional.
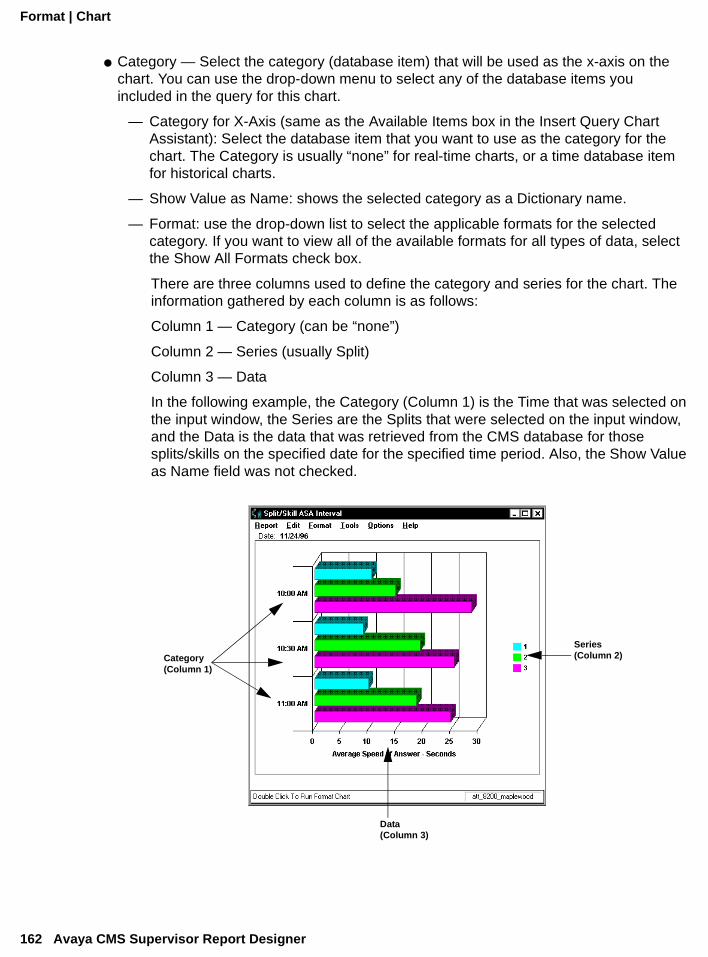
Format | Chart
162 Avaya CMS Supervisor Report Designer
● Category — Select the category (database item) that will be used as the x-axis on the chart. You can use the drop-down menu to select any of the database items you included in the query for this chart.
— Category for X-Axis (same as the Available Items box in the Insert Query Chart Assistant): Select the database item that you want to use as the category for the chart. The Category is usually “none” for real-time charts, or a time database item for historical charts.
— Show Value as Name: shows the selected category as a Dictionary name.
— Format: use the drop-down list to select the applicable formats for the selected category. If you want to view all of the available formats for all types of data, select the Show All Formats check box.
There are three columns used to define the category and series for the chart. The information gathered by each column is as follows:
Column 1 — Category (can be “none”)
Column 2 — Series (usually Split)
Column 3 — Data
In the following example, the Category (Column 1) is the Time that was selected on the input window, the Series are the Splits that were selected on the input window, and the Data is the data that was retrieved from the CMS database for those splits/skills on the specified date for the specified time period. Also, the Show Value as Name field was not checked.
CategorySeries
Data
(Column 1)
(Column 2)
(Column 3)

Axis tab
Issue 1 May 2002 163
● One data value per row — Shows one line of data when multiple rows of data are retrieved in the query. When One Data Value per Row is selected, the first item listed in the Category for X-Axis drop-down list is the item that is used for the chart category.
The previous example showed a report with One Data Value per Row selected. Following is an example of the same report, with the same Category item (STARTTIME), without One Data Value per Row selected.
In the first example, you can see that the report shows one row of data for the interval beginning at 10:00 AM, one row of data that includes information for each split/skill for the interval beginning at 10:30 AM, and one row of data for the interval beginning at 11:00 AM. In the second example, there is a row of data shown for each split/skill for each interval.

Format | Chart
164 Avaya CMS Supervisor Report Designer
Change axis titlesTo change the title that will display on each axis of the chart report, do the following steps:
1. Depending on the type of chart (bar, line, area, step, clustered bar, horizontal bar, or pie, as selected on the Type tab) you are formatting, select the appropriate Axis check box.
2. In the appropriate text box, type the title you want assigned to the axis.
3. In the Category for X-Axis box (same as the Available Items box in the Insert Query Chart Assistant), select the database item that you want to use as the category for the chart. The Category is usually none for real-time charts, or a time database item for historical charts.
4. Select the Show Value as Name check box if you want to show the selected category as a Dictionary name. This check box is available only when the selected category is an item that can be defined in the Dictionary.
5. Select the Format in which the category will be displayed. Use the drop-down list to select from the applicable formats for the selected category. If you want to view all of the available formats for all types of data, select the Show All Formats check box.
6. Select the One Data Value per Row check box to show one line of data when multiple rows of data are retrieved in the query. When One Data Value per Row is selected, the first item listed in the Category for X-Axis drop-down list is the item that is used for the chart category.
7. Click Apply to make the changes and to keep the Chart Format Options window open.
8. Click OK to make the changes and to close the Chart Format Options window.

Data tab
Issue 1 May 2002 165
Data tabUse the Data tab to add, remove, or rearrange data items in the chart. The available data items are the data items that are specified in the query that this chart uses.
Example
Data tab options
You can change the following chart parameters:
● Available Data — Lists all of the data items that are available, based on the query you used for the chart or table.
● Data on Chart — Displays the data items that are currently used in the chart.
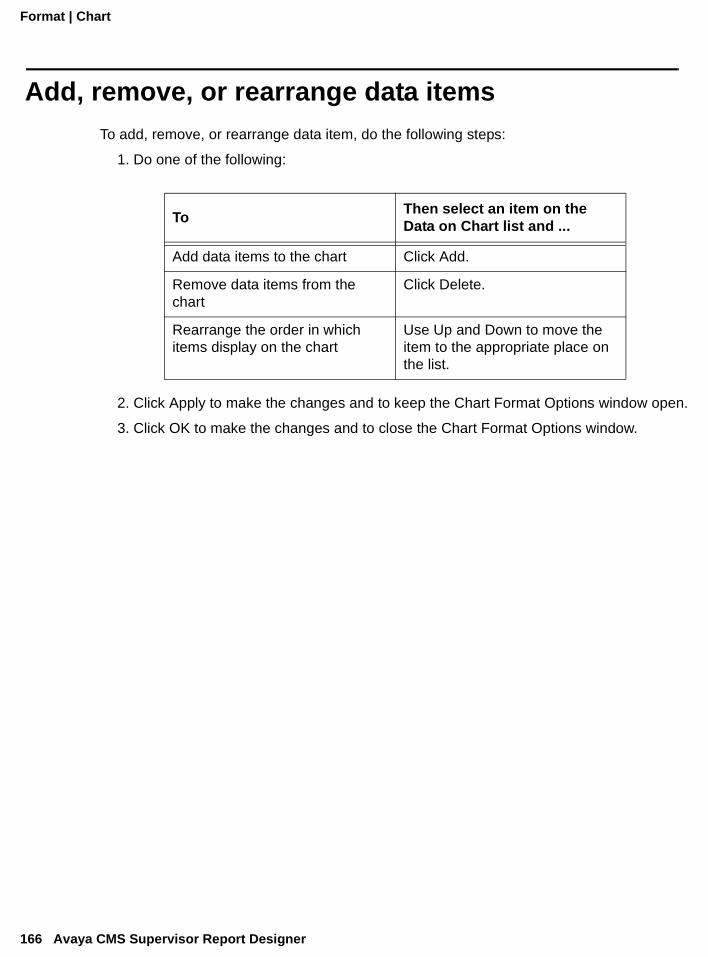
Format | Chart
166 Avaya CMS Supervisor Report Designer
Add, remove, or rearrange data itemsTo add, remove, or rearrange data item, do the following steps:
1. Do one of the following:
2. Click Apply to make the changes and to keep the Chart Format Options window open.
3. Click OK to make the changes and to close the Chart Format Options window.
ToThen select an item on the Data on Chart list and ...
Add data items to the chart Click Add.
Remove data items from the chart
Click Delete.
Rearrange the order in which items display on the chart
Use Up and Down to move the item to the appropriate place on the list.

Data Labels tab
Issue 1 May 2002 167
Data Labels tabUse the Data Labels tab to define where the labels of each data point on the chart will be displayed and to define how the labels will be displayed.
Example
Data Labels tab options
You can specify the following parameters:
● None — No labels displayed.
● Above Point — The label is displayed above the data point. This location is valid only for bar, line, area, and step charts.
● Below Point — The label is displayed below the data point. This location is valid only for bar, line, area, and step charts.
● Center — The label is displayed centered on the data point. This location is valid only for bar, line, area, and step charts.
● Base — The label is displayed along the category axis, directly beneath the data point. This location is valid only for bar, line, area, and step charts.
● Inside — The label is displayed inside a pie slice. This location is valid only for pie charts.

Format | Chart
168 Avaya CMS Supervisor Report Designer
● Outside — The label is displayed outside a pie slice. This location is valid only for pie charts.
● Left — The label is displayed to the left of the related data point.
● Right — The label is displayed to the right of the related data point.
If data point labels are displayed, you can specify that they include one of the following:
● Value — The value of the data point displays in the label.
● Percent — The value of the data point displays in the label as a percentage.
● Series Name — The series name is used to label the data point.
● Category Name — The category name is used to label the data point.
The position of data point labels can affect the readability of the chart. The label text may overlap in some situations, making it difficult or impossible to read the labels.
Define data labels on data points
Issue 1 May 2002 169
Define data labels on data pointsTo define where the labels of each data point on the chart will be displayed, and to define how the labels will be displayed, do the following steps:
1. In the Location box, select the location where you want the data point labels to display on the chart.
2. In the Show Label Text box, select the option that corresponds with how you want the data point labels to display on the chart.
3. Click Apply to make the changes and to keep the Chart Format Options window open.
4. Click OK to make the changes and to close the Chart Format Options window.

Format | Chart
170 Avaya CMS Supervisor Report Designer
Fonts tabUse the Chart Format Options Fonts tab to edit the fonts of the title, data point labels, legend, axes, and series labels on the chart report.
Example
Fonts tab options
● Fonts — Lists all of the available report items for which you can edit the fonts.
● Choose Font — Takes you to the Font selector window, where you can edit the font size and style for each type of text.

Change fonts
Issue 1 May 2002 171
Change fontsTo change the fonts, do the following steps:
1. Select Choose font next to the report item for which you want to change the font.
The Font window opens.
2. Select the Font, Font style, Size, Effects, Color, and Script which you want assigned to the selected text.
3. Click OK.
The Chart Format Options window opens.
4. Click Apply to make the changes and to keep the Chart Format Options window open.
5. Click OK to make the changes and to close the Chart Format Options window.
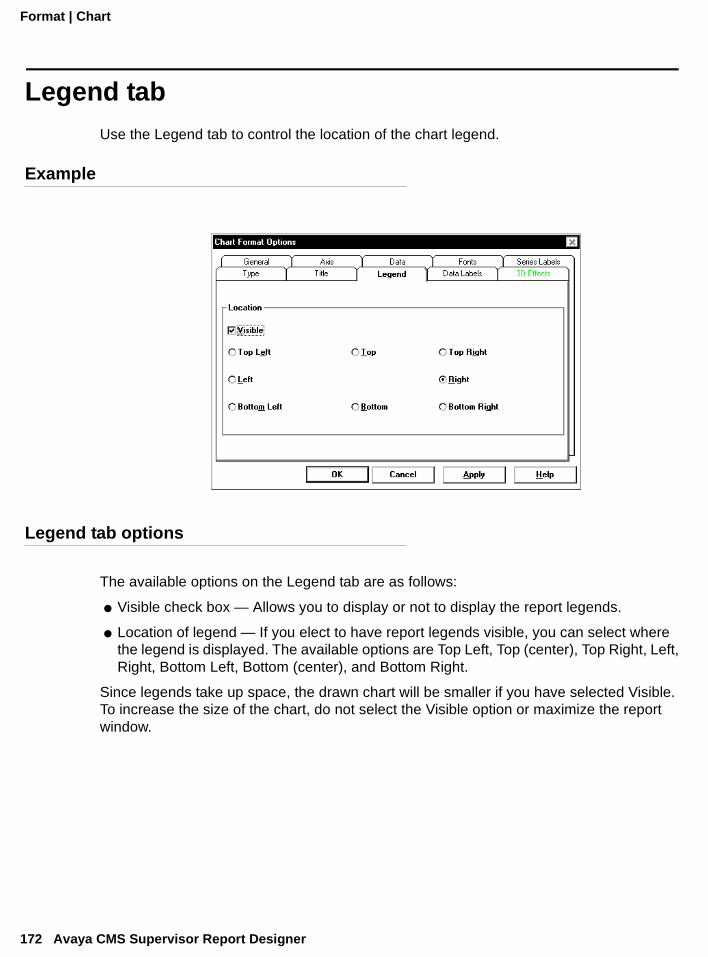
Format | Chart
172 Avaya CMS Supervisor Report Designer
Legend tabUse the Legend tab to control the location of the chart legend.
Example
Legend tab options
The available options on the Legend tab are as follows:
● Visible check box — Allows you to display or not to display the report legends.
● Location of legend — If you elect to have report legends visible, you can select where the legend is displayed. The available options are Top Left, Top (center), Top Right, Left, Right, Bottom Left, Bottom (center), and Bottom Right.
Since legends take up space, the drawn chart will be smaller if you have selected Visible. To increase the size of the chart, do not select the Visible option or maximize the report window.

Format the chart legend
Issue 1 May 2002 173
Format the chart legendTo format the chart legend, do the following steps:
1. Select the Visible check box to make the legend of the chart display on the report.
2. Select the Location (Top Left, Top, Top Right, Left, Right, Bottom Left, Bottom, or Bottom Right) where you want the legend to display on the chart.
3. Click Apply to make the changes and to keep the Chart Format Options window open.
4. Click OK to make the changes and to close the Chart Format Options window.

Format | Chart
174 Avaya CMS Supervisor Report Designer
Series Labels tabUse the Chart Format Options Series Labels tab to edit the labels (headings) that are assigned to each data item that is used in a chart.
Example
Series Labels tab option
Labels table — Shows the labels that are currently used in the chart. To edit the text, place the cursor in the Label column and type the appropriate information.

Edit data item headings
Issue 1 May 2002 175
Edit data item headingsTo edit data item headings, do the following steps:
1. Place the cursor in the table cell that contains the heading, or label, you want to modify.
2. Type the new name or edit the existing name.
3. Click Apply to make the changes and to keep the Chart Format Options window open.
4. Click OK to make the changes and to close the Chart Format Options window.

Format | Chart
176 Avaya CMS Supervisor Report Designer
Title tabUse the Title tab to control the location of the chart title.
Example
Title tab options
The available options on the Title tab are as follows:
● Visible check box — Allows you to display or not to display the report titles.
● Location of title — If you elect to have report titles visible, you can select where the titles are displayed. The available options are Top Left, Top (center), Top Right, Left, Right, Bottom Left, Bottom (center), and Bottom Right.
Since the title takes up space, the drawn chart will be smaller if you have selected Visible. To increase the size of the chart, do not select the Visible option or maximize the report window.
Format the title
Issue 1 May 2002 177
Format the titleTo format the title, do the following steps:
1. Select the Visible check box to make the title of the chart display on the report.
2. In the Title text box, edit the content of the chart title.
3. Select the Location (Top Left, Top, Top Right, Left, Right, Bottom Left, Bottom, or Bottom Right) where you want the title to be displayed on the chart.
4. Click Apply to make the changes and to keep the Chart Format Options window open.
5. Click OK to make the changes and to close the Chart Format Options window.

Format | Chart
178 Avaya CMS Supervisor Report Designer
Type tabUse the Type tab to change the chart type from 2-dimensional to 3-dimensional, and vice versa. You can also use this tab to specify the type of table you want. For example, you can choose a bar chart or a pie chart.
Example
Type tab
Issue 1 May 2002 179
Type tab options
The available options on the Type tab are as follows:
● 2D and 3D — Changes the chart to 2-dimensional or 3-dimensional views. 2D charts update faster than 3D charts, so if the drawing speed seems too slow, you may want to display charts as 2D.
● Chart Type — Specifies how the data is presented. You choose a chart type from the list. The types of charts available vary slightly depending on whether a 2D or 3D chart has been selected. All possible chart types are listed here:
— Bar Chart (2D and 3D)
— Line Chart (2D and 3D)
— Area Chart (2D and 3D)
— Step Chart (2D and 3D)
— Horizontal Bar Chart (2D and 3D)
— Clustered Bar Chart (3D only)
— Pie Chart (2D and 3D)
● Stacked check box — Causes the data for all series to be stacked rather than shown separately. This check box is disabled for pie charts.
● % Axis check box — Causes the value axis (y-axis) to be displayed as percentages rather than as actual data values. This can be combined with the stacked format to produce a percentage stacked chart.
Format | Chart
180 Avaya CMS Supervisor Report Designer
Select a chart typeTo select a chart type, do the following steps:
1. Based on whether you want the report to display two-dimensionally or three-dimensionally, click 2D or 3D.
2. Select the Chart Type.
● The available types for two-dimensional charts are Bar, Line, Area, Step, Horizontal Bar, and Pie.
● The available types for three-dimensional charts are Bar, Line, Area, Step, Clustered Bar, Horizontal Bar, and Pie.
3. For any type of report other than Pie, you can select the Stacked check box to display all series together rather than separately.
If you select the Stacked check box, you can also select the % Axis check box, which causes the y-axis to be displayed as percentages rather than as data values.
4. Click Apply to make the changes and to keep the Chart Format Options window open.
5. Click OK to make the changes and to close the Chart Format Options window.

3D Effects tab
Issue 1 May 2002 181
3D Effects tabUse the 3D Effects tab to control the 3D appearance of the chart. If the current chart is a 2D chart, this tab is disabled.
Example
3D Effects tab options
You can change the following parameters:
● Elevation — This is a number from 0 through 90 degrees, and describes the relative height from which a chart is viewed. An elevation of 90 looks directly down on the top of the chart, while an elevation of 0 looks directly at the side of the chart. The example charts throughout this document use an elevation of 30 degrees.
● Rotation — This is a number from -360 through 360 degrees, and specifies the angle that the chart is turned relative to the viewing position. The example charts throughout this document use a rotation of 60 degrees. Rotation does not apply to 3D pie charts.
● Projection — This selects one of three mathematical algorithms used to give a 3D appearance on a 2D sheet of paper or computer screen. The following values can be chosen:

Format | Chart
182 Avaya CMS Supervisor Report Designer
— Oblique: The chart has depth but the X-Y plane does not change when the chart is rotated or elevated.
— Orthogonal: Perspective is not applied to the chart, resulting in less of a 3D effect. The advantage of this type of projection is that vertical lines remain vertical, making some charts easier to read.
— Perspective: This provides the most realistic 3D appearance. Objects farther away from you converge toward a vanishing point.
● Viewing Distance — This is a number from 50 through 1000 that represents the distance from which the chart is viewed as a percentage of the depth of the chart.
● Width to Height — This is a number from 5 through 2000 that represents the percentage of the chart’s height that is used to draw the chart’s width.
● Depth to Height — This is a number from 5 through 2000 that represents the percentage of the chart’s height that is used to draw the chart’s depth.

Control the 3D appearance
Issue 1 May 2002 183
Control the 3D appearanceTo control the 3D appearance of the chart, do the following steps:
1. To change the degree of Elevation (top to bottom) of the chart, type a new number in the Elevation box.
2. To change the degree of Rotation of the chart, type a new number in the Rotation box.
3. To change the type of Projection used for the chart, select a type from the Projection drop-down list.
4. Edit the ratios of width to height and depth to height, as appropriate.
5. Click Apply to make the changes and to keep the Chart Format Options window open.
6. Click OK to make the changes and to close the Chart Format Options window.

Format | Chart
184 Avaya CMS Supervisor Report Designer

Issue 1 May 2002 185
Format | Table
Format | Table describes the Format | Table menu option.
Report Designer allows you to format report tables after they have been inserted on the report. You will use the Table option from the Format menu to edit tables on your designer reports.
Organization of general information
Format | Table contains the following general information:
● Information about how to format tables on page 186
● General tab on page 187
● Data tab on page 189
● Fonts tab on page 191
● Format tab on page 193
● Headers tab on page 196
● Sort tab on page 198
● Summary tab on page 200
Organization of procedures
Format | Table contains the following procedures:
● Use the General tab on page 188
● Use the Data tab on page 190
● Use the Fonts tab on page 192
● Use the Format tab on page 195
● Use the Headers tab on page 197
● Use the Sort tab on page 199
● Use the Summary tab on page 201

Format | Table
186 Avaya CMS Supervisor Report Designer
Information about how to format tablesIf you are in a report that contains a table, you can format how the table displays and what is displayed in the table.
About the window
Use the Table Format Options window to make layout changes to a table. All changes made are saved as part of the report view when you save the report.
How to access the window
You can access the Table Format Options window in any of the following ways:
● Double-click a column heading in the report
● Select Format Table or Sort by from the Format menu list or the right mouse button pop-up menu.
How your changes affect others
The changes you make to a report’s format affect only your view of the report. The changes do not affect how other Supervisor users see the report.
If you select ...Then the Table Format Option window is displayed with the ...
Format Table General tab active
Sort by Sort tab active

General tab
Issue 1 May 2002 187
General tabUse the General tab to make table format changes to gridlines, column and row scrolling, and orientation.
Example
General tab options
You can change the following table parameters:
● Show Gridlines — This specifies whether grid lines are shown in the table.
● Fixed Columns — This specifies the number of columns from the left of the table that are fixed in place and do not scroll. Valid values are in the range of 0 through 99. You can use the spin boxes to select a valid value or type the value in.
● Fixed Rows —This specifies the number of rows from the top of the table that are fixed in place and do not scroll. Valid values are in the range of 0 through 99. You can use the spin boxes to select a valid value or type the value in.
● Orientation —Horizontal builds the table with the column names across the top of the table, so that the table reads from left to right. Vertical builds the table with the column names down the left side of the table, so that the table reads from top to bottom.

Format | Table
188 Avaya CMS Supervisor Report Designer
Use the General tabTo use the General tab, do the following steps:
1. Select the Show Gridlines check box if you want the table to include lines between the columns and rows.
2. In the Fixed Region box, define the number of Columns on the table that will not scroll. You can type the appropriate number or use the up and down arrows to select a valid number.
3. In the Fixed Region box, define the number of Rows on the table that will not scroll. You can type the appropriate number or use the up and down arrows to select a valid number.
4. In the Orientation box, select Horizontal if you want the table to display with the column names across the top of the table. Select Vertical if you want the table to display with the column names down the left side of the table.
5. Click Apply to make the changes and to keep the Table Format Options window open.
6. Click OK to make the changes and to close the Table Format Options window.
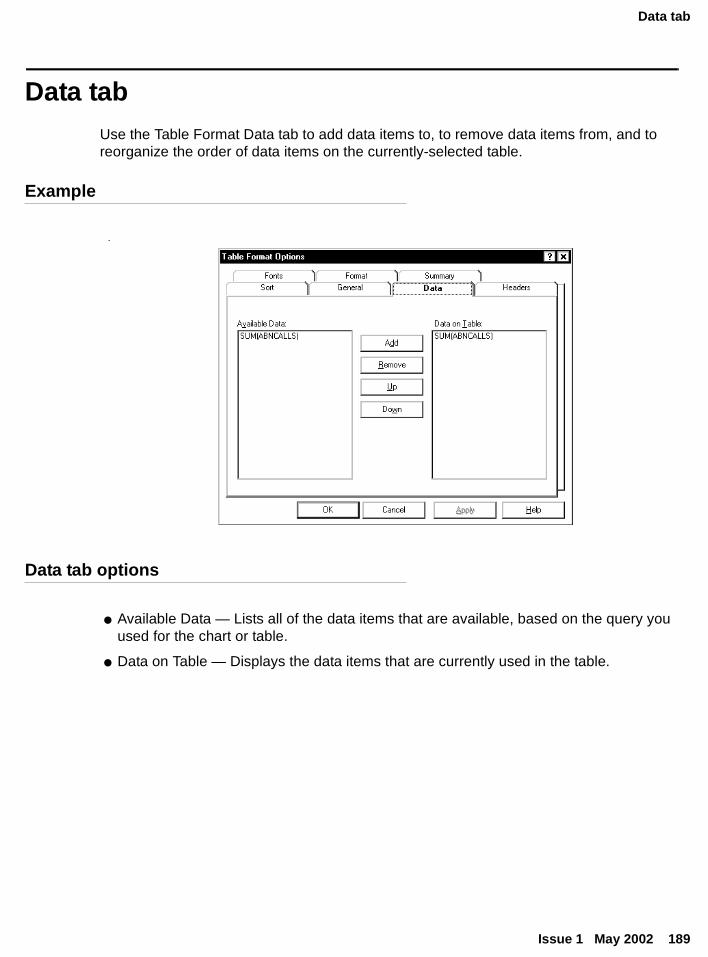
Data tab
Issue 1 May 2002 189
Data tabUse the Table Format Data tab to add data items to, to remove data items from, and to reorganize the order of data items on the currently-selected table.
Example
.
Data tab options
● Available Data — Lists all of the data items that are available, based on the query you used for the chart or table.
● Data on Table — Displays the data items that are currently used in the table.

Format | Table
190 Avaya CMS Supervisor Report Designer
Use the Data tabTo use the Data tab window, do the following steps:
1. To add data items to the table, select an item from the Available Data list and click Add.
2. To remove data items from the table, select an item from the Data on Table list and click Delete.
3. To rearrange the order in which items appear on the table, select an item on the Data on Table list and use Up and Down to move the item to the appropriate place on the list.
4. Click Apply to make the changes and to keep the Table Format Options window open.
5. Click OK to make the changes and to close the Table Format Options window.

Fonts tab
Issue 1 May 2002 191
Fonts tabUse the Table Format Options Fonts tab to edit the fonts of the data, headers, and summary information on the table report.
Example
.
Fonts tab options
● Fonts — Lists all of the available report items for which you can edit the fonts.
● Choose Font — Takes you to the Font selector window, where you can edit the font size and style for each type of text.

Format | Table
192 Avaya CMS Supervisor Report Designer
Use the Fonts tabTo change the fonts, do the following steps:
1. Select Choose font next to the report item that you want to change the font.
The Font window opens.
2. Select the Font, Font style, Size, Effects, Color, and Script that you want assigned to the selected text.
3. Click OK.
The Table Format Options window opens.
4. Click Apply to make the changes and to keep the Table Format Options window open.
5. Click OK to make the changes and to close the Table Format Options window.

Format tab
Issue 1 May 2002 193
Format tabUse the Table Format tab to alter the format of each column that is included in the table. The Database Items that make up the columns of the table are listed in the Item column of the Table table. For each Item, you can assign a variety of formatting characteristics.
Example
Format tab options
● Item — Shows the database item (and table from which the data is retrieved) that is used for this column of the table.
● Show Value As — Use the drop-down list to select the format in which you want the value to be displayed. The Show Value As formatting applies only to data types that can be defined in the Dictionary.
● Align — Allows you to select the alignment of a field or column in a table. Available options for alignment are Left, Right, and Center.
● Format — The options available for the format will depend on the type of item you want to edit. For instance, a field that displays time will allow you to choose from a variety of time formats. A field that is a number will allow you to choose from a variety of number formats.

Format | Table
194 Avaya CMS Supervisor Report Designer
● Show All Formats — You can select the Show All Formats check box to display the formats that are available for all field types. This check box is active only during the current use of the Format Table window. The next time you access the window, the check box will not be active.
● Zeros as Blanks — Select this check box to display cells on the table that contain zeros as blank. If you do not select the check box, the cells that contain zeros will display zeros.
● Merge with Next — Select the check box to merge this column with the column to the right on the table.

Use the Format tab
Issue 1 May 2002 195
Use the Format tabTo edit the formatting on a table, do the following steps:
1. In the Item column of the table, select the data item that you want to edit.
2. In the Show Value As column, use the drop-down list to select how you want to have the data item displayed. The available values vary, depending on the data item.
3. In the Align column, use the drop-down list to select how you want the data item to be aligned on the table. Available values are Left, Right, and Center.
4. In the Format column (if available), select the time format or the number format (as appropriate) in which you want the data item displayed. The available choices reflect the specific data item you are formatting.
5. In the Show All Formats column, select the check box if you want the Format column to display all of the available data formats, regardless of the type of data item that you have.
6. In the Zeros as Blanks column, select the check box if you want to display cells on the table that contain zeros as blank. If you do not select the check box, the cells that contain zeros will display zeros.
7. In the Merge with Next column, select the check box to merge this column with the column to the right.

Format | Table
196 Avaya CMS Supervisor Report Designer
Headers tabUse the Headers tab to turn table headers on and off and to edit the text that appears in each column heading of the table.
Example
Headers tab options
● Header Option — Select the Show Headers check box if you want the table report to include the headers.
● Table Header — This table shows the column headings that are currently used on the report.

Use the Headers tab
Issue 1 May 2002 197
Use the Headers tabTo change the column headings on the table, do the following steps:
1. Place the cursor in the table cell that contains the heading you want to modify.
2. Type the new name or edit the existing name.
3. Click Apply to make the changes and to keep the Table Format Options window open.
4. Click OK to make the changes and to close the Table Format Options window.

Format | Table
198 Avaya CMS Supervisor Report Designer
Sort tabUse the Sort tab to specify the order in which the information on the real-time table report is displayed.
Example
Sort tab options
Sort by — When you set up display order for a real-time report, specify the sort column (Sort By) and the sort order (Ascending or Descending). The drop-down list for Sort By lists all of the database table and item names used in the report.
Sort By Criteria Sort OrderDrop-Down Lists
Use the Sort tab
Issue 1 May 2002 199
Use the Sort tabWhen you set up display order for a report, specify the sort column (Sort By) and the sort order (Ascending or Descending). The drop-down list for Sort By lists all of the database table and item names used in the report.
Some examples of sorting are as follows:
● View a list of agents alphabetically — Select Name from the first Sort By drop-down list, select Ascending as the sort order, and leave the other two Sort By boxes set to (none).
● Search for agents who have been in a certain state for too long — Select WORKMODE from the first Sort By drop-down list, then select TIME from the second Sort By drop-down list, and then select Descending as the sort order for the second Sort By.
Sorting may cause the report to take longer to refresh. If you want to speed up the refresh rate, select (none) for all of the Sort By criteria to turn off the sort options.

Format | Table
200 Avaya CMS Supervisor Report Designer
Summary tabUse the Table Format Summary tab to include or exclude summary lines from the currently-selected table. You can include a summary line for each query that is used in the report.
If this table includes an integrated query, the Summary tab will not display.
Example
Summary tab options
Summary Options — Allows you to include or exclude summary (totals) lines on table reports.
Select the check box to include a summary line on the table, then select the query for which you want to include a summary.
Use the Summary tab
Issue 1 May 2002 201
Use the Summary tabTo include a summary line, do the following steps:
1. Click Show Summary.
2. Select a query from the Query box.
3. Select Top or Bottom, based on where you want the summary line to be located.
4. Click Apply to make the changes and to keep the Table Format Options window open.
5. Click OK to make the changes and to close the Table Format Options window.

Format | Table
202 Avaya CMS Supervisor Report Designer

Issue 1 May 2002 203
Format | Field
Format | Field describes the Format | Field menu option.
Use Report Designer to format report fields after they have been inserted on the report. You will use the Field option from the Format menu to edit fields on your designer reports.
Organization of general information
The Field Format Options window on page 204
Organization of procedures
Format | Field contains the following procedures:
● Create or change a label for the field on page 206
● Edit the format of a field on page 207

Format | Field
204 Avaya CMS Supervisor Report Designer
The Field Format Options windowTo open the Field Format Options window, select Field from the Format menu. The Field Format Options window is where you will choose the formats for fields defined in queries.
Example
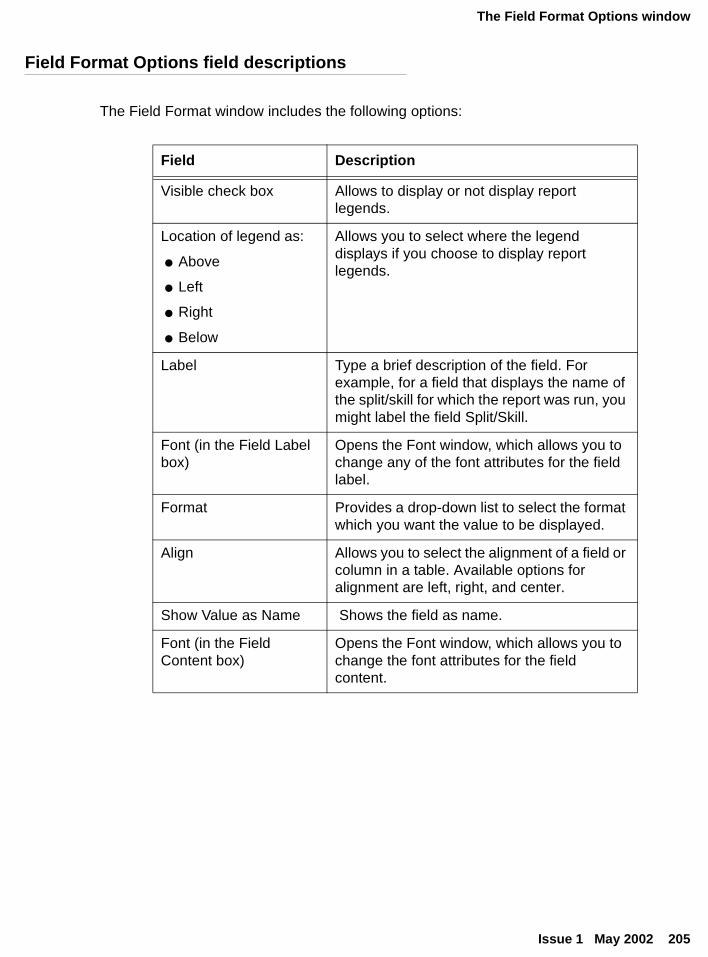
The Field Format Options window
Issue 1 May 2002 205
Field Format Options field descriptions
The Field Format window includes the following options:
Field Description
Visible check box Allows to display or not display report legends.
Location of legend as:
● Above
● Left
● Right
● Below
Allows you to select where the legend displays if you choose to display report legends.
Label Type a brief description of the field. For example, for a field that displays the name of the split/skill for which the report was run, you might label the field Split/Skill.
Font (in the Field Label box)
Opens the Font window, which allows you to change any of the font attributes for the field label.
Format Provides a drop-down list to select the format which you want the value to be displayed.
Align Allows you to select the alignment of a field or column in a table. Available options for alignment are left, right, and center.
Show Value as Name Shows the field as name.
Font (in the Field Content box)
Opens the Font window, which allows you to change the font attributes for the field content.
Format | Field
206 Avaya CMS Supervisor Report Designer
Create or change a label for the fieldTo create or change a label for the field, do the following steps:
1. Select the field on the report.
2. Select Field from the Format menu.
The Field Format Options window opens. This window allows you to create a label or heading for the field, and to edit the format of the field itself.
3. From the Field Label box, select the Visible check box.
4. Select the location (Above, Below, Left, or Right) where you want the label to appear.
5. In the Label field, type the words that you want the label to display.
6. To change the font of the label, click Font to access the Font window.
7. To make the changes but to keep the Field Format Options window open for additional changes, click Apply.
8. Click OK.

Edit the format of a field
Issue 1 May 2002 207
Edit the format of a fieldTo edit the format of a field on your report, do the following steps:
1. Select the field on the report.
2. Select Field from the Format menu.
The Field Format Options window opens. This window allows you to create a label or heading for the field, and to edit the format of the field itself.
3. From the Format drop-down list, select the format in which the field will display.
The options available for the field format will depend on the type of field you want to edit. For instance, a field that displays time will allow you to choose from a variety of time formats. A field that is a number will allow you to choose from a variety of number formats.
You can select the Show All Formats check box to display the formats that are available for all field types.
4. .To align the field, select Left, Right, or Center from the Align drop-down list.
5. Select the Show Value as Name check box if you want to edit a field that displays an Avaya Call Mangement System (CMS) entity (split/skill, agent, and so on) that can be named in the Dictionary and you want the Dictionary name for the field to display instead of the number.
6. To change the font of the field, click Font to access the Font window.
7. To make the changes but to keep the Field Format Options window open for additional changes, click Apply.
8. Click OK.

Format | Field
208 Avaya CMS Supervisor Report Designer

Issue 1 May 2002 209
Format | Text
Format | Text describes how to use the Format | Text menu option.
Report Designer allows you to format the font style and size of text that appears on a report. You will use the Text option from the Format menu to edit text on a report.
Organization
The Text Format Options window on page 210
Format text on page 211

Format | Text
210 Avaya Supervisor Report Designer
The Text Format Options windowTo open the Text Format Options window, select a text item on the report and then select Text from the Format menu. The Text Format Options window allows you to change the font display characteristics for the selected text.
Example
Text Format Options parameters
● Text contents — Type the word or phrase that you want to insert on the report in this text box.
● Text font — Opens the Font window, which allows you to change the Font, Font style, Size, Effects, Color, or Script box.

Format text
Issue 1 May 2002 211
Format textTo format text on a report, do the following steps:
1. Select the text on the report.
2. Select Text from the Format menu.
The Text Format Options window opens.
3. Click Font.
The Font selector window opens.
4. Select the Font, Style, Point size, Effects, and Script that will apply to the text string you want to edit.
5. Click OK.
The Font selector window closes.
6. On the Text Format Options window, click OK to accept the font changes and to close the window.
7. Click Apply to apply the changes you have made and to keep the window open.

Format | Text
212 Avaya Supervisor Report Designer

Issue 1 May 2002 213
Error messages
Error messages describes Report Designer error messages and what to do to resolve the error messages.
The errors described in Error messages usually are the result of a problem in the query that you want to test.
Organization of general information
Error messages contains the following general information:
● Phase 1 error messages on page 214
● Phase 2 historical report error codes on page 216
● Phase 3 real-time report error codes on page 220
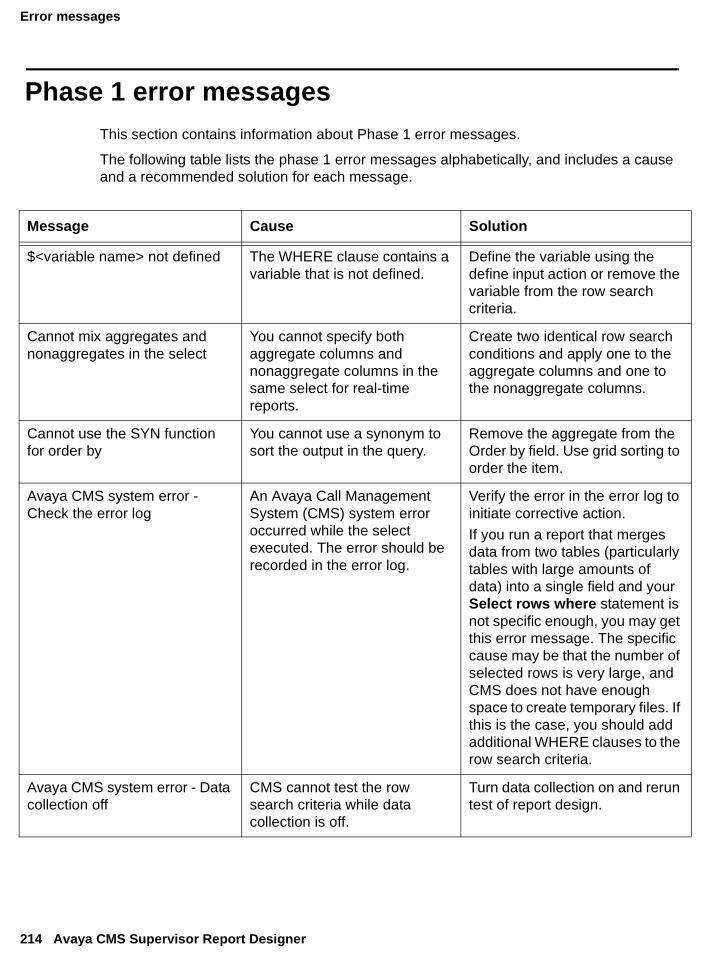
Error messages
214 Avaya CMS Supervisor Report Designer
Phase 1 error messagesThis section contains information about Phase 1 error messages.
The following table lists the phase 1 error messages alphabetically, and includes a cause and a recommended solution for each message.
Message Cause Solution
$<variable name> not defined The WHERE clause contains a variable that is not defined.
Define the variable using the define input action or remove the variable from the row search criteria.
Cannot mix aggregates and nonaggregates in the select
You cannot specify both aggregate columns and nonaggregate columns in the same select for real-time reports.
Create two identical row search conditions and apply one to the aggregate columns and one to the nonaggregate columns.
Cannot use the SYN function for order by
You cannot use a synonym to sort the output in the query.
Remove the aggregate from the Order by field. Use grid sorting to order the item.
Avaya CMS system error - Check the error log
An Avaya Call Management System (CMS) system error occurred while the select executed. The error should be recorded in the error log.
Verify the error in the error log to initiate corrective action.
If you run a report that merges data from two tables (particularly tables with large amounts of data) into a single field and your Select rows where statement is not specific enough, you may get this error message. The specific cause may be that the number of selected rows is very large, and CMS does not have enough space to create temporary files. If this is the case, you should add additional WHERE clauses to the row search criteria.
Avaya CMS system error - Data collection off
CMS cannot test the row search criteria while data collection is off.
Turn data collection on and rerun test of report design.

Phase 1 error messages
Issue 1 May 2002 215
Avaya CMS system error - Too much data retrieved - try a more restrictive search
Too much data was retrieved with the given row search criteria.
Add more conditions to the row search criteria so that fewer rows are retrieved.
Avaya CMS system error - Updating translations
CMS cannot test the row search criteria while CMS is receiving the set of configuration data from the switch.
Wait until configuration data has been sent. Then rerun the test of report design.
keyword <variable> invalid in where clause
You cannot use the specified keyword in a row search criteria.
Remove the specified keyword from the row search criteria.
Message Cause Solution

Error messages
216 Avaya CMS Supervisor Report Designer
Phase 2 historical report error codesThis section contains the INFORMIX® error codes that are most likely to appear for CMS historical reports.
Format
These errors are reported in the following format:
INFORMIX error: <error number>
In addition, a circumflex (^) may appear to mark the location of an error.
Related topic
If an error code appears that is not listed in this document, see the INFORMIX SQL Relational Database Management System Reference guide for INFORMIX SQL.
List of phase 2 error codes
The following table describes each phase 2 error code and the recommended corrective action.
Error Description Solution
201 A syntax error has occurred. Verify that you have not misspelled an RDSQL statement, placed key words out of sequence, or included an INFORMIX-SQL reserved word in your query.
202 An illegal character has been found in the statement.
Remove the illegal character (often a nonprintable control character) and resubmit the statement.
203 An illegal integer has been found in the statement.
Integers must be whole numbers from -2,147,483,647 to 2,147,483,647. Verify that you have not included a number with a fractional portion or a number outside the acceptable range. Verify also that you have not inadvertently entered a letter in place of a number (for example, 125p3 instead of 12503).
204 An illegal floating-point number has been found in the statement.
Verify that you have not inadvertently entered a letter in place of a number (for example, 125p3 instead of 125.03).

Phase 2 historical report error codes
Issue 1 May 2002 217
206 The specified table name is not in the database.
Verify the spelling of the table name in your statement.
217 Column column-name not found in any table in the query.
Correct the spelling of the database item and ensure that the item exists in the database table. Verify for the presence of required commas and quotes.
219 Wildcard matching may not be used with noncharacter types.
Wildcards (*, ?) and characters enclosed in brackets [ ] can be used only with CHAR data types. Verify the data type for the offending column.
220 There is no “FROM” clause in the query.
You must include a FROM clause in the query. Verify that you do not have an illegal character ($, #, &, and so on) or a CONTROL character in the line prior to the FROM keyword.
223 Duplicate table name table-name in the FROM clause.
Remove the redundant table name from the statement or use an alias to rename one of the tables.
228 Cannot have negative characters. Verify that you have not included a negative CHAR data type (for example, -a or -p) in your statement.
278 Too many ORDER BY columns; maximum is eight.
Reduce the number of columns included in the ORDER BY clause to eight or fewer.
280 Total size of ORDER BY columns exceeds 120 bytes.
Reduce the number of columns included in the ORDER BY clause so that the total number of characters is fewer than or equal to 120 (perhaps delete a CHAR column of 30 or more characters).
282 Found a quote for which there is no matching quote.
Verify that all quoted strings are properly terminated with a quote.
284 A subquery has not returned exactly one value.
Verify data for the subquery. Restructure the subquery by adding more components in the WHERE clause so that only one value is returned.
297 The SELECT list may not contain a subquery.
Remove the subquery from the SELECT list in the statement.
300 There are too many GROUP BY columns (maximum is eight).
Reduce to eight or fewer the number of nonaggregate database items that are assigned the same row search ID as that assigned to an aggregate function.
301 The total size of the GROUP BY columns exceeds 120 characters.
The total number of characters in all columns listed in the GROUP BY list exceeds 120 characters. Reduce the number of nonaggregate database items that are assigned to a row search ID that is also assigned to an aggregate function.
Error Description Solution

Error messages
218 Avaya CMS Supervisor Report Designer
303 Expression mixes columns with aggregates.
Restructure your query so that columns and aggregates are not included in the same expression.
309 ORDER BY database item must be included in a report field to which the row search ID is assigned.
Verify that database items included in the ORDER BY clause appear in the report and are assigned to row search ID.
324 Ambiguous database item. A database item in your row search criteria exists in more than one table also cited in your row search criteria. Precede each database item with the appropriate table name.
352 Database item not found. Verify the spelling of the database item.
367 Sums and averages cannot be computed for character columns.
Verify that you have not included a database item of a string type (VDN, LOGID, and so on) in the aggregate function statement.
522 A database item in a field/bar does not exist in the table specified in the field’s row search ID.
Verify the Select statement that has the error. The database item that does not exist in the table will be marked with a circumflex (^). Change or delete the database item or change the table in the field’s row search ID.
809 RDSQL syntax error has occurred. Verify that you have not misspelled an RDSQL statement, placed key words out of sequence, or included an INFORMIX SQL reserved word in your query.
1202 An attempt was made to divide by zero.
Verify that you are not attempting to divide a numerical column type by a character column type (for example, 16/Jones). Also verify that the value of the divisor does not equal zero.
1203 Values used in a MATCH must both be type CHARACTER.
Verify that the values included in your MATCH condition are both CHAR types. Use an alternate comparison condition for nonCHAR types.
1204 Invalid year in date. Acceptable years are 0001 to 9999. If two digits are used, RDSQL assumes that the year is 19xx. Verify the value entered in the date field.
1205 Invalid month in date. Months must be represented as the number of the month (01 through 12). Verify the value entered in the date field.
Error Description Solution

Phase 2 historical report error codes
Issue 1 May 2002 219
1206 Invalid day in date. Days must be represented as the number of the day (01 through 31). Verify the value entered in the date field.
1226 Decimal or money value exceeds maximum precision.
Increase the precision of the DECIMAL or MONEY field.
Error Description Solution

Error messages
220 Avaya CMS Supervisor Report Designer
Phase 3 real-time report error codesPhase 3 real-time report error codes contains the Real-Time Database Manager error codes. Each code includes a description of the error and a recommended solution.
Format
These errors are reported in the following format:
Avaya CMS Database Manager error: <error number>
In addition, a circumflex (^) appears to mark the location of an error.
List of phase 3 error codes
The following table describes each phase 3 error code and the recommended corrective action.
Error Description Solution
1 A syntax error has occurred. Verify the select for misspelled keywords or keywords that are out of order.
2 An illegal character has been found in the select statement.
Remove the illegal character (often a nonprintable control character).
3 The specified table name is invalid.
Verify the spelling of the table name and verify that you have included required commas in the From tables field.
4 An invalid column has been specified (it is not found in any of the specified tables).
Verify the spelling of the column names.

Phase 3 real-time report error codes
Issue 1 May 2002 221
5 A mixture of aggregates and nonaggregates are being selected, and this is not allowed in real-time reports. (This error code can also mean mismatched types in comparison.)
Create two identical row search conditions, and apply one to the aggregate columns and one to the nonaggregate columns.
6 Bad column in the order by clause.
Verify that the column name in the order by clause is spelled correctly and that it is being selected by one of the fields included in this row search.
7 Bad index in order by clause. Verify that the order by clause has a column in the SELECT clause or a number that indicates a position of the column in the select clause.
8 Bad argument given to an aggregate function. For example, you cannot take the SUM or AVG of a character column.
Verify the arguments for the aggregates and be sure that data type is appropriate.
9 In the Select of one of the fields associated with this row search, an action is being performed with the wrong data types. For example, you cannot use arithmetic with character fields.
Verify for these types of errors in the fields associated with the row search.
10 Error with subquery There may be a subquery in the WHERE clause that CMS does not support. Verify the subqueries. This typically happens with an Agent Group report (a SELECT embedded within a SELECT).
11 Avaya CMS system error Verify the error logs.
12 Memory allocation error Verify the error logs.
13 Query cannot select more than one table.
Verify the error logs.
Error Description Solution

Error messages
222 Avaya CMS Supervisor Report Designer

Issue 1 May 2002 223
How CMS stores and retrieves data
The most important and difficult part of designing a report is defining the data that goes into the report. To define report data, you must first understand how the Avaya Call Management System (CMS) stores and retrieves data.
Organization of general information
How CMS stores and retrieves data contains the following general information:
● How CMS stores data on page 224
● How CMS retrieves data on page 225

How CMS stores and retrieves data
224 Avaya CMS Supervisor Report Designer
How CMS stores data
Table
CMS stores data in a CMS database that is divided into 52 different tables. A table is an array of columns and rows that stores data for a type of ACD element (split/skill, agent, trunk, trunk group, VDN, vector, call work code, forecasting, agent trace, call records, or exceptions) and for a specific time frame (for the current intrahour interval, for past intrahour intervals, for past day, summarized by day, and so on). If data in a table is in real time, data changes second by second.
Database items
The CMS database uses names to refer to columns of data in a table. These names are called database items. For a complete listing of database items, see the Avaya CMS Database Items and Calculations document.
Row
Each row in a table contains data that is related by the values of one or more of the columns. For example, each row in the Current Interval Agent table contains data related by agent login ID.
Index
A column that causes the values in a row to be related is called an index. An index stores data sequentially and adds structure for the storage of data in the other columns. For each value in an index column, the remaining values in the corresponding row are related to that value.

How CMS retrieves data
Issue 1 May 2002 225
How CMS retrieves data
Three types of information
CMS retrieves data from the database based on the following types of information that you supply when you design a report:
● The name of the table
● The database items in the table
● The rows of data in the table
How to tell CMS to retrieve data
To tell CMS how to retrieve data, you must tell CMS to access the appropriate database table. Then, for each report field, you assign the appropriate database items. When you run the report, CMS will find in the table the columns of data associated with the database items.
Identify rows
Next, you identify the appropriate rows that supply data. If you want agents in Split 1, you must tell CMS to find rows that have the value 1 for the SPLIT database item. When you run the report, CMS finds the appropriate rows of data in the cagent table.
The data that CMS reports is the data found in the intersection of the selected database items and rows. Therefore, the report shows data that is similar to the data shown in this figure.
Split: 1
Current ACD ACD AverageAgent ID: State Calls Time Talk Time
1001 AVAIL 21 988 47:001002 AVAIL 19 777 40:091003 ACD 15 400 26:071004 ACD 9 58 6:441005 ACD 11 644 58:541006 AUX 20 245 12:251008 ACW 18 603 33:501010 AVAIL 18 203 11:28

How CMS stores and retrieves data
226 Avaya CMS Supervisor Report Designer
Actually, when you design a report, you normally set up the row selection so that the users running the report can choose the rows in the report’s input window. For example, to run the report in the previous figure, you would set up the row selection so users would fill out a Report Input window that asked them for a Split number.
Indexes for search
CMS uses indexes to create a structure for storing data. Similarly, CMS uses these indexes to search for data. Indexes allow CMS to find data much faster than if data were stored more randomly. Therefore, when you design a report, the rows of data for the report should be defined on the basis of index values.
About creating new database tables
The indexes for each standard table are fixed and cannot be changed or deleted. However, if you define a custom table in the CMS database through INFORMIX SQL, you can define any indexes desired for that new table.
Example
As an example of how CMS retrieves report data, if you want a custom intrahour interval split report that lists, by intrahour interval, data for a split in a single day, you must tell CMS to access the hsplit (Historical Intrahour Interval Split) table. You must then assign the appropriate database items to the fields. When you run the report, CMS finds the columns of data associated with the database items in the hsplit table.
Next, you must identify the appropriate rows that supply data. You might want data for the following:
● Split 1, which means you must identify rows that have the value 1 for the SPLIT database item.
● The date 07/02/02, which means you must identify rows with the value 070202 for the ROWDATE database item.
● The intrahour intervals 8:00 a.m. to 11:00 a.m., which means you must identify rows with the values 0800 through 1100 for the one database item.
CMS then finds the appropriate rows of data.

How CMS retrieves data
Issue 1 May 2002 227
The data that CMS reports is the data found in the intersection of the selected database items and columns.
Defining data is the central task of creating and designing a report. However, you must do many other tasks to create a report.
Split: 1
ACDInterval Calls Abandons
08:00am 399 36
Date: 07/02/02
09:00am 400 4610:00am 394 4011:00am 418 41

How CMS stores and retrieves data
228 Avaya CMS Supervisor Report Designer

Issue 1 May 2002 229
Report Designer examples
Report Designer examples provides examples to help you create and modify reports with Report Designer.
Organization of procedures
Report Designer examples contains the following procedures:
● Create an integrated report on page 230
● Modify an integrated report on page 232
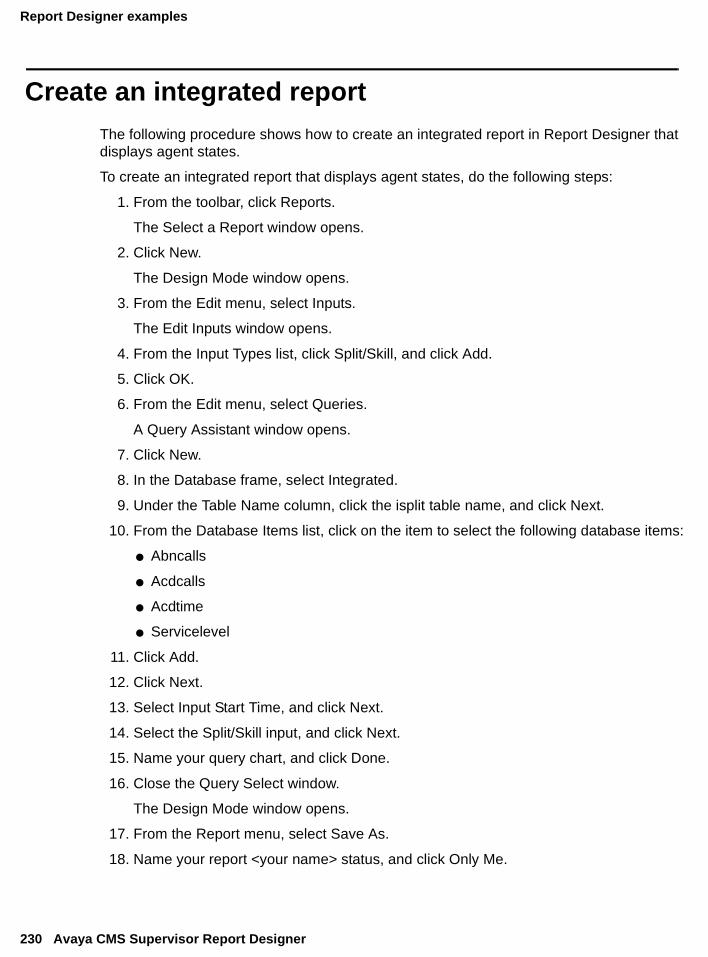
Report Designer examples
230 Avaya CMS Supervisor Report Designer
Create an integrated reportThe following procedure shows how to create an integrated report in Report Designer that displays agent states.
To create an integrated report that displays agent states, do the following steps:
1. From the toolbar, click Reports.
The Select a Report window opens.
2. Click New.
The Design Mode window opens.
3. From the Edit menu, select Inputs.
The Edit Inputs window opens.
4. From the Input Types list, click Split/Skill, and click Add.
5. Click OK.
6. From the Edit menu, select Queries.
A Query Assistant window opens.
7. Click New.
8. In the Database frame, select Integrated.
9. Under the Table Name column, click the isplit table name, and click Next.
10. From the Database Items list, click on the item to select the following database items:
● Abncalls
● Acdcalls
● Acdtime
● Servicelevel
11. Click Add.
12. Click Next.
13. Select Input Start Time, and click Next.
14. Select the Split/Skill input, and click Next.
15. Name your query chart, and click Done.
16. Close the Query Select window.
The Design Mode window opens.
17. From the Report menu, select Save As.
18. Name your report <your name> status, and click Only Me.
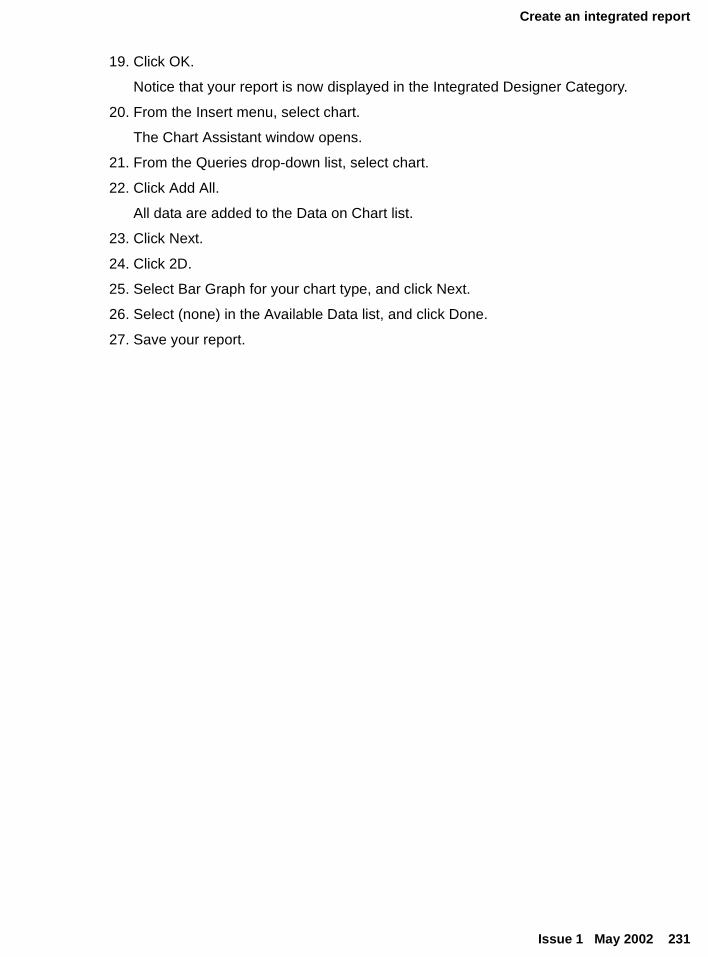
Create an integrated report
Issue 1 May 2002 231
19. Click OK.
Notice that your report is now displayed in the Integrated Designer Category.
20. From the Insert menu, select chart.
The Chart Assistant window opens.
21. From the Queries drop-down list, select chart.
22. Click Add All.
All data are added to the Data on Chart list.
23. Click Next.
24. Click 2D.
25. Select Bar Graph for your chart type, and click Next.
26. Select (none) in the Available Data list, and click Done.
27. Save your report.
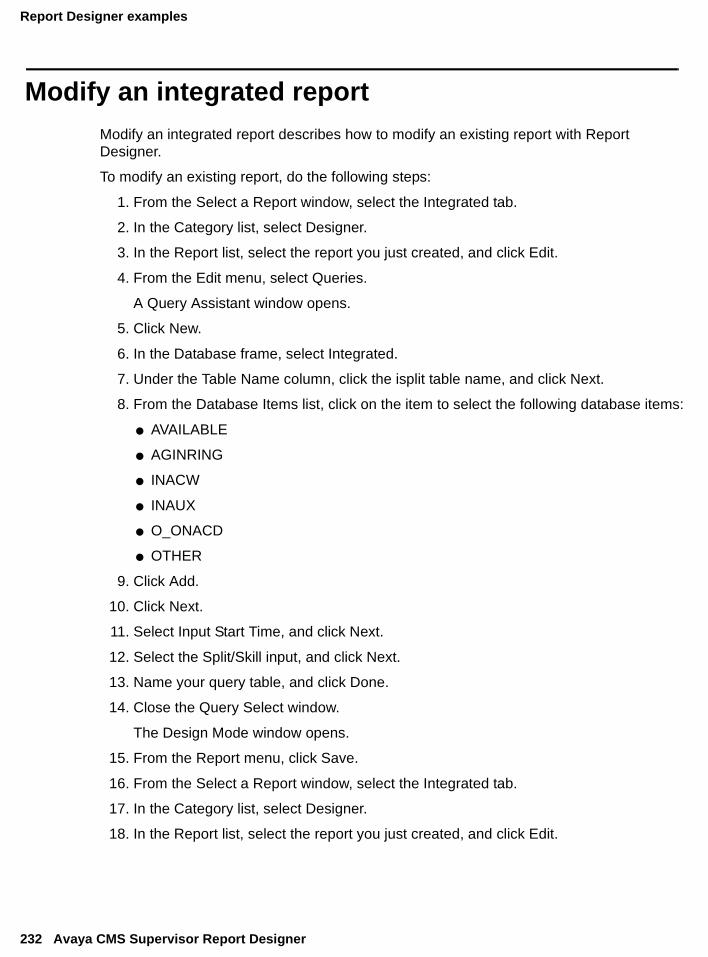
Report Designer examples
232 Avaya CMS Supervisor Report Designer
Modify an integrated reportModify an integrated report describes how to modify an existing report with Report Designer.
To modify an existing report, do the following steps:
1. From the Select a Report window, select the Integrated tab.
2. In the Category list, select Designer.
3. In the Report list, select the report you just created, and click Edit.
4. From the Edit menu, select Queries.
A Query Assistant window opens.
5. Click New.
6. In the Database frame, select Integrated.
7. Under the Table Name column, click the isplit table name, and click Next.
8. From the Database Items list, click on the item to select the following database items:
● AVAILABLE
● AGINRING
● INACW
● INAUX
● O_ONACD
● OTHER
9. Click Add.
10. Click Next.
11. Select Input Start Time, and click Next.
12. Select the Split/Skill input, and click Next.
13. Name your query table, and click Done.
14. Close the Query Select window.
The Design Mode window opens.
15. From the Report menu, click Save.
16. From the Select a Report window, select the Integrated tab.
17. In the Category list, select Designer.
18. In the Report list, select the report you just created, and click Edit.

Modify an integrated report
Issue 1 May 2002 233
19. From the Insert menu, select Table.
The Table Assistant window opens.
20. From the Queries drop-down list, click table, and click Add All.
21. Click Next.
22. In the Orientation frame, select Vertical.
23. In the Options frame, select Headers On and Grid Line On.
24. Click Done.
Your report now has a chart and a table.
25. Move the table so that you can see both the chart and table. By default, the second section (your table) will overlay the first section (your chart).
26. From the Report menu, click Save.

Report Designer examples
234 Avaya CMS Supervisor Report Designer

Issue 1 May 2002 235
Glossary
ACD See Automatic Call Distribution.
Actions Menu A menu in the upper-left corner of the Avaya CMS Supervisor Operations windows. The menu lists the actions available for that particular user window (for example, add, modify, and delete). You select an action after entering the necessary data in the user window.
Add An Avaya CMS Supervisor action that adds the data entered in the given window to the Avaya CMS database.
Add/Remove Programs Wizard
A Microsoft® Windows® feature that guides you through a series of steps in order to remove programs that have been installed on your computer. The Add/Remove icon is found in the Control Panel dialog box.
Administrator Privileges Permissions assigned to an Avaya CMS Supervisor user in order to administer specific elements, such as installing Avaya CMS Supervisor on a network. Access permissions are specified as read or write permission. Read permission means the user can only access and view Avaya CMS Supervisor data. Write permission means the Avaya CMS Supervisor user can add, modify, or delete Avaya CMS Supervisor data.
Agent A person who answers calls to an extension in an ACD split/skill. The agent is known to Avaya CMS by a login identification keyed into a voice terminal.
Agent Reports A group of reports that give the status of agents in an agent group, selected splits or skills, or real-time information and statistics.
Agent Skill An attribute that is associated with an ACD agent. Agent Skills can be thought of as the ability for an agent with a particular set of skills to handle a call that requires one of a set of skills. An agent can be assigned up to four skills.
Application Folder A folder on the network server that holds the Avaya CMS Supervisor application software —executables and components.
Automatic Call Distribution (ACD)
A switch feature that uses software to channel high-volume incoming and outgoing call traffic to agent groups (splits or skills).
Also an agent state where the extension is engaged on an ACD call.
Automatic Script An Avaya CMS Supervisor feature that launches a new Avaya CMS Supervisor session that logs into Avaya CMS and runs the requested tasks in the background. Actions do not display on the PC. See also Interactive Script and Script.

236 Avaya CMS Supervisor Report Designer
AutoPlay A Microsoft Windows feature that causes an application on a CD-ROM to run without any user interaction as soon as the CD-ROM is inserted into the drive.
Avaya Business Advocate
A collection of ECS features that provide new flexibility in the way a call is selected for an agent in a call surplus situation and in the way that an agent is selected for a call.
Avaya Call Management System (CMS)
A software product used by business customers that have Avaya telecommunications switches and receive a large volume of telephone calls that are processed through the Automatic Call Distribution (ACD) feature of the switch. The Avaya CMS collects call-traffic data, formats management reports, and provides an administrative interface to the ACD feature in the switch.
Avaya CMS See Avaya Call Management System.
Client A single PC that uses Avaya CMS Supervisor.
Controller An Avaya CMS Supervisor feature that allows the user to access Avaya CMS reports and operations. The Controller includes a toolbar, a menu bar, a status bar, tooltips, and indicators.
Custom Reports Real-time or historical reports that have been customized from standard reports or created from scratch.
Database A group of tables that store ACD data according to a specific time frame: current and previous intrahour real-time data and intrahour, daily, weekly, and monthly historical data.
Database Item A name for a specific type of data stored in one of the Avaya CMS databases. A database item may store ACD identifiers (split numbers or names, login IDs, VDNs, and so forth) or statistical data on ACD performance (number of ACD calls, wait time for calls in queue, current states of individual agents, and so forth).
Database Table Avaya CMS uses these tables to collect, store, and retrieve ACD data. Standard Avaya CMS items (database items) are names of columns in the Avaya CMS database tables.
Data Points Points of historical data. A data point should include data for each interval of the working day.
Delete An Avaya CMS Supervisor action that removes the entry on the window from the Avaya CMS database.
Designer Reports Customized reports that can be created with Avaya CMS Supervisor’s Report Designer feature. Designer Reports are run from Avaya CMS Supervisor.

Issue 1 May 2002 237
Dialog Box A small on-screen window that conveys or requests information from the user. This window can contain list boxes, text boxes, tabbed pages, and so forth.
Dictionary An Avaya CMS subsystem that can be used to assign names to various call center elements such as login IDs, splits/skills, trunk groups, VDNs and vectors. These names appear on reports, making them easier to interpret.
Edit Menu A menu on the Avaya CMS Supervisor Operations windows. The menu lists the actions available for that particular user window (for example, cut, copy, and paste).
Exception A type of activity on the ACD which falls outside of the limits you have defined. An exceptional condition is defined in the Avaya CMS Exceptions subsystem, and usually indicates abnormal or unacceptable performance on the ACD (by agents, splits/skills, VDNs, vectors, trunks, or trunk groups).
Exceptions Reports Display occurrences of unusual call-handling events.
Find One An Avaya CMS action that searches the database for entries thatch the input value.
Graphics An Avaya CMS reporting option that allows you to view some reports in bar graph format.
Grayed Out When you do not have access to a menu or action list item, it will be dimmed or displayed in a different color from the rest of the menu or action list.
Historical Reports Display past ACD data for various agent, split/skill, trunk, trunk group, vector, or VDN activities. A report summary of call data into daily, weekly or monthly totals
HTML See HyperText Markup Language.
Hypertext A linkage between related text. For example, if you select a word in a sentence, information about that word is retrieved if it exists, or the next occurrence of the word is found.
HyperText Markup Language
A standard for defining documents with hypertext links. See also Hypertext.
Input Field An area on window where you specify information that you want to view, add, modify, or delete.
Installation Folder A folder on the network that holds all of the Avaya CMS Supervisor files. Setup.exe is run from this folder to install Avaya CMS Supervisor on each client computer.
Integrated Reports Integrated reports compile call center information from any starting point in the last 24 hours up to and including the current interval.

238 Avaya CMS Supervisor Report Designer
Interactive Script An Avaya CMS Supervisor feature that runs the requested tasks in the current Avaya CMS Supervisor session and displays the actions on the PC. You can input requested information while the script is running. See also Automatic Script and Script.
Jump In Help, a command that moves you from the currently displayed topic to another topic.
LAN See Local Area Network.
List All An Avaya CMS action that lists all the entries that matched the current field values.
Local Area Network (LAN)
Two or more computers connected by cable and using a suitable operating system and application software so they can directly share hard disks, printers, and other peripherals, and files.
Local Installation With this type of installation, you install all of the Avaya CMS Supervisor software to disk space on each local computer from a CD-ROM or from the network.
Log A file that contains a record of computer activity as well as backup and recovery data.
Maintenance An Avaya CMS subsystem that is used for doing routine maintenance of the Avaya CMS, such as backing up data, checking on the status of the connection to the switch, and scanning the error log.
Name Fields Fields in which you may enter a name (synonym) that has been entered in the Dictionary subsystem (for example, names of agents, splits/skills, agent groups, trunk groups, vectors, VDNs).
Network Server A computer in a network shared by multiple users.
Queue/Agent Reports A group of reports that give the status of all top agents in a skill and queue status, or skill status for a selected skill.
Readme File A file that provides up-to-the-minute information on a newly released product; in this case, Avaya CMS Supervisor.
Read-Only A folder or file that can be read, but not updated or erased.
Real-Time Reports Display current ACD call activity on agents, splits/skills, trunks, trunk groups, vectors, and VDNs for the current or previous intrahour interval. Current intrahour interval real-time reports are constantly updated as data changes during the interval. Previous intrahour interval real-time reports show data totals for activity that occurred in the previous intrahour interval.

Issue 1 May 2002 239
Registry The system-wide depository of information supported by Microsoft Windows. The registry contains information about the system and its applications, including clients and servers.
Report Designer An Avaya CMS Supervisor feature that enables users to design their own reports.
Report Wizard An Avaya CMS Supervisor feature that delivers user assistance, by way of a wizard, to quickly and easily generate new customized reports. The wizard provides instructional help that guides the user through a series of tasks that create a new customized report. Report Wizard is a supplement to Report Designer.
Run A Microsoft Windows command that lets you execute a program, such as Avaya CMS Supervisor installation.
Scripting An Avaya CMS feature that lets you automate actions such as changing an agent’s skills, running reports, exporting report data, and many other Avaya CMS functions. For example, you can create a script to run a specified report and export the data on schedule.
Scroll To use the bar on the side of the report window to move forward, backward, up, or down within a window.
Setup Program A program that configures a system for a particular environment; for example, it informs the system of a new device or interface, such as Avaya Framework.
Shared Installation With this type of installation, the Avaya CMS Supervisor application software is installed to a shared application folder on the network server, but user-specific files and logs are stored in an Avaya CMS Supervisor folder on each user’s PC or on their own network drive.
Shortcut An icon on your computer screen that enables you to select and run an application (for example, Avaya CMS Supervisor) quickly and easily.
Skill An attribute that is assigned to an ACD Agent. Agent Skills can be thought of as the ability for an Agent with a particular set of skills to handle a call which requires one of those skills.
Solaris System A multi-user operating system developed by Sun Microsystems. The operating system on which Avaya CMS runs.
Split A group of extensions that receives special-purpose calls in an efficient, cost-effective manner. Normally, calls to a split arrive primarily over one or a few trunk groups.
Standard Reports The set of reports that are delivered with the Avaya CMS or Avaya CMS Supervisor software.

240 Avaya CMS Supervisor Report Designer
Start Menu The menu that appears when you click Start in the Microsoft Windows taskbar. This menu contains programs and other Microsoft Windows applications.
Taskbar The bar that appears by default at the bottom of the Microsoft Windows desktop. You can click buttons that appear on this bar to switch between running programs.
Terminal A combination of monitor (video display) and keyboard used to communicate with a remote computer to type and display information.
Terminal Emulator An Avaya CMS Supervisor software application that emulates a 615 Color (615C) terminal.
Toolbar A row of controller buttons used to activate various functions of the Avaya CMS Supervisor application.
Tooltips Brief descriptions that display when the mouse pointer is over a toolbar button.
Trunk Group Report Displays the status of each trunk in a selected trunk group.
UNIX System A multi-user operating system developed by AT&T in 1969. The operating system that runs on the Avaya CMS computer.
User ID The login ID for an Avaya CMS user.
VDN See Vector Directory Number.
VDN Reports A group of reports that show profiles of current VDN performance, call handling information for a specific VDN based on skill preference, and how calls to specific VDNs have been handled.
Vector A list of steps that process calls in a user-defined manner. The steps in a vector can send calls to splits, play announcements and music, disconnect calls, give calls a busy signal, or route calls to other destinations.
Vector Directory Number (VDN)
An extension number that enables calls to connect to a vector for processing. A VDN is not assigned an equipment location. It is assigned to a vector. A VDN can connect calls to a vector when the calls arrive over an assigned automatic-in trunk group or when calls arrive over a dial-repeating (DID) trunk group and the final digits match the VDN.
Vector Report A report that lists the number of calls to specific vectors.
Window A rectangular, on-screen frame through which you can view a menu, data entry fields, reports, or messages.
Wizard A tutor built into the software that guides you through procedures.

Issue 1 May 2002 241
Index
Symbols% Axis check box . . . . . . . . . . . . . . . . . 179
Numerical2D field . . . . . . . . . . . . . . . . . . . . . . 1792D Horizontal Bar Chart . . . . . . . . . . . . . . 432D Horizontal Stacked Bar Chart . . . . . . . . . . 442D Line Bar Chart . . . . . . . . . . . . . . . . . 442D Pie Bar Chart . . . . . . . . . . . . . . . . . 432D Stacked Area Bar Chart . . . . . . . . . . . . 432D Vertical Bar Chart . . . . . . . . . . . . . . . 432D Vertical Stacked Bar Chart . . . . . . . . . . . 442D, change to 3D . . . . . . . . . . . . . . . . . 1793D appearance, control . . . . . . . . . . . . . . 1833D Effects tab
about . . . . . . . . . . . . . . . . . . . . . 181control 3D appearance . . . . . . . . . . . . . 183Depth to Height field . . . . . . . . . . . . . . 182Elevation field . . . . . . . . . . . . . . . . . 181field options . . . . . . . . . . . . . . . . . . 181Oblique field . . . . . . . . . . . . . . . . . . 182Orthogonal field . . . . . . . . . . . . . . . . 182Perspective field . . . . . . . . . . . . . . . . 182Projection field . . . . . . . . . . . . . . . . . 181Rotation field. . . . . . . . . . . . . . . . . . 181Viewing Distance field . . . . . . . . . . . . . 182Width to Height field . . . . . . . . . . . . . . 182
3D field . . . . . . . . . . . . . . . . . . . . . . 1793D Horizontal Bar Chart . . . . . . . . . . . . . . 433D Horizontal Stacked Bar Chart . . . . . . . . . . 443D Line Chart . . . . . . . . . . . . . . . . . . . 443D Pie Chart . . . . . . . . . . . . . . . . . . . 443D Stacked Area Chart . . . . . . . . . . . . . . 443D Vertical Bar Chart . . . . . . . . . . . . . . . 443D Vertical Cluster Bar Chart . . . . . . . . . . . . 443D Vertical Stacked Bar Char . . . . . . . . . . . 433D, change to 2D . . . . . . . . . . . . . . . . . 179
AAbout Avaya CMS Supervisor menu item . . . . . . 71Above Point field . . . . . . . . . . . . . . . . . 167ACD Name field . . . . . . . . . . . . . . . . . . 140add
data items . . . . . . . . . . . . . . . . . . . 166input fields . . . . . . . . . . . . . . . . . . . 100status bar . . . . . . . . . . . . . . . . . . . 69
Agent field . . . . . . . . . . . . . . . . . . . . 97
Agent group field . . . . . . . . . . . . . . . . . . 97Agent state field . . . . . . . . . . . . . . . . . . 97agent trace data . . . . . . . . . . . . . . . . . . 58align
Design Mode grid . . . . . . . . . . . . . . . . 69multiple fields . . . . . . . . . . . . . . . . . . 68undo . . . . . . . . . . . . . . . . . . . . . . 67
Align Control field . . . . . . . . . . . . . . . . . 68Align field
on Field Format Options window . . . . . . . . 205on Format tab . . . . . . . . . . . . . . . . 193
Align to Grid field . . . . . . . . . . . . . . . . . . 69alphabetical sorting. . . . . . . . . . . . . . . . 199AND button . . . . . . . . . . . . . . . . . . . .117appearance of input fields, edit . . . . . . . . . . 103area chart, select. . . . . . . . . . . . . . . . . 179Associated ACD field . . . . . . . . . . . . . . . 104available data . . . . . . . . . . . . . . . . 165, 189Available Data Items on Report Wizard . . . . . . . 37Axis Display . . . . . . . . . . . . . . . . . . . 161Axis tab
about. . . . . . . . . . . . . . . . . . . . . 161Axis Display . . . . . . . . . . . . . . . . . 161category . . . . . . . . . . . . . . . . . . . 162change axis titles . . . . . . . . . . . . . . . 164field options . . . . . . . . . . . . . . . . . 161
axis values displayed as percentages . . . . . . . 179
BBack button on Report Wizard . . . . . . . . . . . 23background color. . . . . . . . . . . . . . . . . 159bar chart, select . . . . . . . . . . . . . . . . . 179Base field . . . . . . . . . . . . . . . . . . . . 167basics of Report Designer . . . . . . . . . . . . . 65Below Point field . . . . . . . . . . . . . . . . . 167buttons
Data Item definition . . . . . . . . . . . . . . .112on Report Selector window . . . . . . . . . . . 54on Report Wizard . . . . . . . . . . . . . . . . 23
CCalculations field . . . . . . . . . . . . . . . . . .112call record data . . . . . . . . . . . . . . . . . . 58call work code data . . . . . . . . . . . . . . . . . 58Call Work Code field . . . . . . . . . . . . . . . . 97Cancel button on Report Wizard. . . . . . . . . . . 23category . . . . . . . . . . . . . . . . . . . . . 162Category Name field . . . . . . . . . . . . . . . 168Center field . . . . . . . . . . . . . . . . . . . 167

242 Avaya CMS Supervisor Report Designer
changeaxis titles . . . . . . . . . . . . . . . . . . . 164charts from 2D to 3D and vice versa . . . . . . 179fonts . . . . . . . . . . . . . . . . . . . . . 171general chart parameters . . . . . . . . . . . 160properties on a report . . . . . . . . . . . . . . 56
Change Input Captions page in Report Wizard . . . . 47Chart menu item . . . . . . . . . . . . . . . . 68, 70Chart Type field . . . . . . . . . . . . . . . . . 179charts
change axis titles . . . . . . . . . . . . . . . 164change data items . . . . . . . . . . . . . . 166change fonts . . . . . . . . . . . . . . . . . 171changing general parameters . . . . . . . . . 160control 3D appearance . . . . . . . . . . . . 183creating and inserting . . . . . . . . . . . . . 131define data labels . . . . . . . . . . . . . . . 169edit data item headings . . . . . . . . . . . . 175format legend. . . . . . . . . . . . . . . . . 173format the title . . . . . . . . . . . . . . . . 177formats in Report Wizard . . . . . . . . . . . . 43formatting . . . . . . . . . . . . . . . . . . 155formatting Fonts tab. . . . . . . . . . . . . . 170order of items. . . . . . . . . . . . . . . . . 133select type . . . . . . . . . . . . . . . . . . 180types of . . . . . . . . . . . . . . . . . . . 179
choose font . . . . . . . . . . . . . . . . . 170, 191clustered bar chart, select. . . . . . . . . . . . . 179CMS
data retrieval . . . . . . . . . . . . . . . . . 225data storage . . . . . . . . . . . . . . . . . 224reports . . . . . . . . . . . . . . . . . . . . . 62
CMS system errors . . . . . . . . . . . . . . . . 214collapse and expand categories on Report Wizard . . 35column-oriented reports . . . . . . . . . . . . . . 46Contents menu item . . . . . . . . . . . . . . . . 71control 3D appearance of chart . . . . . . . . . . 183copy. . . . . . . . . . . . . . . . . . . . . . . . 60
designer report from a file . . . . . . . . . . . . 61designer report to a file . . . . . . . . . . . . . 60from diskette . . . . . . . . . . . . . . . . . . 61items on report . . . . . . . . . . . . . . . . . 67query . . . . . . . . . . . . . . . . . . . . 128report to a designer category . . . . . . . . . . 57report to the designer category. . . . . . . . . . 57to a file . . . . . . . . . . . . . . . . . . . . . 60to diskette . . . . . . . . . . . . . . . . . . . 60
copy and paste. . . . . . . . . . . . . . . . . 80, 81Copy button on Report Selector window . . . . . . . 54Copy field . . . . . . . . . . . . . . . . . . . . . 67
createcustom report headings. . . . . . . . . . . . . 41field . . . . . . . . . . . . . . . . . . . . . . 137historical query . . . . . . . . . . . . . . . . . 121integrated query . . . . . . . . . . . . . . . . 123new report . . . . . . . . . . . . . . . . . . . 75real-time query . . . . . . . . . . . . . . . . . 119table. . . . . . . . . . . . . . . . . . . . . . 145text . . . . . . . . . . . . . . . . . . . . . . 151
Create a Query assistant . . . . . . . . . . . . . . 68current ACD. . . . . . . . . . . . . . . . . . . . 104custom report headings . . . . . . . . . . . . . . 41custom reports . . . . . . . . . . . . . . . . 62, 73cut
items from report . . . . . . . . . . . . . . . . 82undo . . . . . . . . . . . . . . . . . . . . . 67
Cut field. . . . . . . . . . . . . . . . . . . . . . 67
Ddata group items
filter . . . . . . . . . . . . . . . . . . . . . . 39move . . . . . . . . . . . . . . . . . . . . . 40removing . . . . . . . . . . . . . . . . . . . 40reposition . . . . . . . . . . . . . . . . . . . 41sorting . . . . . . . . . . . . . . . . . . . . . 40
data item columns in Report Wizard . . . . . . . . 37Data Item definition button . . . . . . . . . . . . . 112Data Item Definition in Report Wizard . . . . . . . . 37data items
add, remove, or rearrange . . . . . . . . . . . 166edit headings . . . . . . . . . . . . . . . . . 175fields . . . . . . . . . . . . . . . . . . . . . 141
Data Labels tababout . . . . . . . . . . . . . . . . . . . . . 167Above Point . . . . . . . . . . . . . . . . . . 167Base . . . . . . . . . . . . . . . . . . . . . 167Below Point . . . . . . . . . . . . . . . . . . 167Category Name . . . . . . . . . . . . . . . . 168Center field . . . . . . . . . . . . . . . . . . 167define data labels . . . . . . . . . . . . . . . 169field options . . . . . . . . . . . . . . . . . . 167Inside field . . . . . . . . . . . . . . . . . . . 167Left . . . . . . . . . . . . . . . . . . . . . . 168None . . . . . . . . . . . . . . . . . . . . . 167Outside . . . . . . . . . . . . . . . . . . . . 168Percent . . . . . . . . . . . . . . . . . . . . 168Right . . . . . . . . . . . . . . . . . . . . . 168Series Name. . . . . . . . . . . . . . . . . . 168Value . . . . . . . . . . . . . . . . . . . . . 168
data on chart . . . . . . . . . . . . . . . . . . . 165

Issue 1 May 2002 243
data on table . . . . . . . . . . . . . . . . . . . 189data retrieval . . . . . . . . . . . . . . . . . . . 225data storage. . . . . . . . . . . . . . . . . . . . 224Data tab
about . . . . . . . . . . . . . . . . . . 165, 189available data . . . . . . . . . . . . . . 165, 189change data items . . . . . . . . . . . . . . . 166data on chart. . . . . . . . . . . . . . . . . . 165data on table . . . . . . . . . . . . . . . . . . 189field options . . . . . . . . . . . . . . . . . . 165
data values vs. percentages . . . . . . . . . . . . 179database
how CMS retrieves data . . . . . . . . . . . . 225item definition . . . . . . . . . . . . . . . . . 224what is a database item. . . . . . . . . . . . . 224what is a database table . . . . . . . . . . . . 224
Database Items field . . . . . . . . . . . . . . . . 112Date field . . . . . . . . . . . . . . . . . . . . . 97Default Value field . . . . . . . . . . . . . . . . . 104define
data labels . . . . . . . . . . . . . . . . . . . 169input fields . . . . . . . . . . . . . . . . . . . 92queries . . . . . . . . . . . . . . . . . . . . 110sections in Report Wizard. . . . . . . . . . . . 32
Define Input window . . . . . . . . . . . . . . 92, 100delete
input fields from the Input window . . . . . . . . 101item from a report . . . . . . . . . . . . . . . 83items from a report . . . . . . . . . . . . . . . 67query . . . . . . . . . . . . . . . . . . . . . 129undo . . . . . . . . . . . . . . . . . . . . . 67
Delete button on Report Selector window . . . . . . 55Delete field . . . . . . . . . . . . . . . . . . . . 67Depth to Height field . . . . . . . . . . . . . . . . 182design mode . . . . . . . . . . . . . . . . . 73, 79Design Mode grid, align . . . . . . . . . . . . . . 69designer category . . . . . . . . . . . . . . . . . 57Display Data Group items that contain . . . . . . . 37Display Data Labels field . . . . . . . . . . . . . . 43Display Grid Lines field. . . . . . . . . . . . . . . 46Display Legend field . . . . . . . . . . . . . . . . 43documents . . . . . . . . . . . . . . . . . . . . 19drag-and-drop to arrange items on the report . . . . 84
Eedit
an existing integrated query . . . . . . . . . . . 127an existing real-time or historical query . . . . . 125appearance of input fields. . . . . . . . . . . . 103data item headings . . . . . . . . . . . . . . . 175existing report in Report Designer . . . . . . . . 77order of input fields . . . . . . . . . . . . . . . 102
Edit | Inputs . . . . . . . . . . . . . . . . . . . . 91Edit | Queries . . . . . . . . . . . . . . . . . . 109Edit button
on Report Selector window . . . . . . . . . . . 55use to open Report Designer . . . . . . . . . . 63
Edit Inputs window . . . . . . . . . . . . . . . . 100Edit Item Heading button on Report Wizard . . . . . 24Edit Item Heading in Report Wizard . . . . . . . . . 37Edit menu . . . . . . . . . . . . . . . . . . . . . 67Edit Report in Report Designer field . . . . . . . . . 52Elevation field . . . . . . . . . . . . . . . . . . 181error codes . . . . . . . . . . . . . . . . . . . 220
historical . . . . . . . . . . . . . . . . . . . 216real-time . . . . . . . . . . . . . . . . . . . 220
error messages . . . . . . . . . . . . . . . . . 213CMS system errors . . . . . . . . . . . . . . 214historical . . . . . . . . . . . . . . . . . . . 216INFORMIX-SQL . . . . . . . . . . . . . . . 216real-time . . . . . . . . . . . . . . . . . . . 220
Everyone field . . . . . . . . . . . . . . . . . . . 50exceptions data . . . . . . . . . . . . . . . . . . 58Exit menu item . . . . . . . . . . . . . . . . . . . 66exit Report Designer . . . . . . . . . . . . . . . . 74expand and collapse categories in Report Wizard . . 35Extension field . . . . . . . . . . . . . . . . . . . 97
Ffield assistant . . . . . . . . . . . . . . . . . . 138
select a field type . . . . . . . . . . . . . . . 139select an input for your field . . . . . . . . . . 142
field format options . . . . . . . . . . . . . . 204, 206Field menu item . . . . . . . . . . . . . . . . 68, 70fields
ACD Name . . . . . . . . . . . . . . . . . . 140add input . . . . . . . . . . . . . . . . . . . 100alignment. . . . . . . . . . . . . . . . . . . . 68Associated ACD . . . . . . . . . . . . . . . 104create and insert . . . . . . . . . . . . . 137, 141Default Value . . . . . . . . . . . . . . . . . 104define . . . . . . . . . . . . . . . . . . . . . 92Font . . . . . . . . . . . . . . . . . . . . . 205Format . . . . . . . . . . . . . . . . . . . . 205format . . . . . . . . . . . . . . . . . . 203, 206Input Values . . . . . . . . . . . . . . . . . 142Label (format) . . . . . . . . . . . . . . . . 205Location on Field Format Options window . . . 205Location on Legend tab . . . . . . . . . . . . 172Multi-value . . . . . . . . . . . . . . . . . . 103New Input . . . . . . . . . . . . . . . . . . .117pattern matching . . . . . . . . . . . . . . . . 95Prompt . . . . . . . . . . . . . . . . . . . . 104
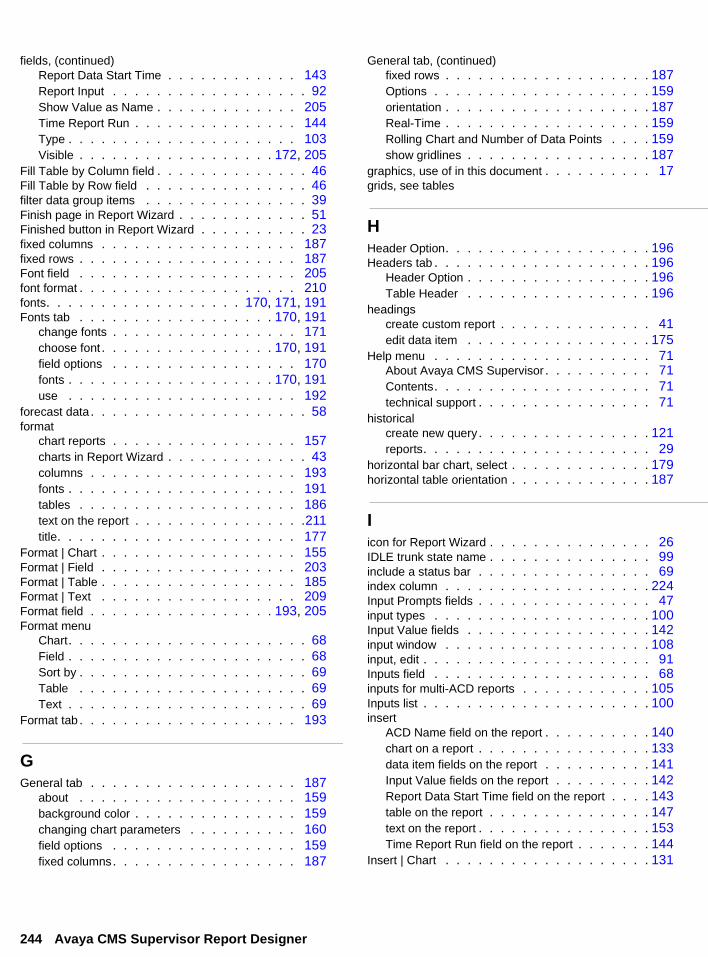
244 Avaya CMS Supervisor Report Designer
fields, (continued)Report Data Start Time . . . . . . . . . . . . 143Report Input . . . . . . . . . . . . . . . . . . 92Show Value as Name . . . . . . . . . . . . . 205Time Report Run . . . . . . . . . . . . . . . 144Type . . . . . . . . . . . . . . . . . . . . . 103Visible . . . . . . . . . . . . . . . . . . 172, 205
Fill Table by Column field . . . . . . . . . . . . . . 46Fill Table by Row field . . . . . . . . . . . . . . . 46filter data group items . . . . . . . . . . . . . . . 39Finish page in Report Wizard . . . . . . . . . . . . 51Finished button in Report Wizard . . . . . . . . . . 23fixed columns . . . . . . . . . . . . . . . . . . 187fixed rows . . . . . . . . . . . . . . . . . . . . 187Font field . . . . . . . . . . . . . . . . . . . . 205font format . . . . . . . . . . . . . . . . . . . . 210fonts. . . . . . . . . . . . . . . . . . 170, 171, 191Fonts tab . . . . . . . . . . . . . . . . . . 170, 191
change fonts . . . . . . . . . . . . . . . . . 171choose font . . . . . . . . . . . . . . . . 170, 191field options . . . . . . . . . . . . . . . . . 170fonts . . . . . . . . . . . . . . . . . . . 170, 191use . . . . . . . . . . . . . . . . . . . . . 192
forecast data. . . . . . . . . . . . . . . . . . . . 58format
chart reports . . . . . . . . . . . . . . . . . 157charts in Report Wizard . . . . . . . . . . . . . 43columns . . . . . . . . . . . . . . . . . . . 193fonts . . . . . . . . . . . . . . . . . . . . . 191tables . . . . . . . . . . . . . . . . . . . . 186text on the report . . . . . . . . . . . . . . . .211title. . . . . . . . . . . . . . . . . . . . . . 177
Format | Chart . . . . . . . . . . . . . . . . . . 155Format | Field . . . . . . . . . . . . . . . . . . 203Format | Table . . . . . . . . . . . . . . . . . . 185Format | Text . . . . . . . . . . . . . . . . . . 209Format field . . . . . . . . . . . . . . . . . 193, 205Format menu
Chart. . . . . . . . . . . . . . . . . . . . . . 68Field . . . . . . . . . . . . . . . . . . . . . . 68Sort by . . . . . . . . . . . . . . . . . . . . . 69Table . . . . . . . . . . . . . . . . . . . . . 69Text . . . . . . . . . . . . . . . . . . . . . . 69
Format tab . . . . . . . . . . . . . . . . . . . . 193
GGeneral tab . . . . . . . . . . . . . . . . . . . 187
about . . . . . . . . . . . . . . . . . . . . 159background color . . . . . . . . . . . . . . . 159changing chart parameters . . . . . . . . . . 160field options . . . . . . . . . . . . . . . . . 159fixed columns. . . . . . . . . . . . . . . . . 187
General tab, (continued)fixed rows . . . . . . . . . . . . . . . . . . . 187Options . . . . . . . . . . . . . . . . . . . . 159orientation . . . . . . . . . . . . . . . . . . . 187Real-Time . . . . . . . . . . . . . . . . . . . 159Rolling Chart and Number of Data Points . . . . 159show gridlines . . . . . . . . . . . . . . . . . 187
graphics, use of in this document . . . . . . . . . . 17grids, see tables
HHeader Option. . . . . . . . . . . . . . . . . . . 196Headers tab . . . . . . . . . . . . . . . . . . . . 196
Header Option . . . . . . . . . . . . . . . . . 196Table Header . . . . . . . . . . . . . . . . . 196
headingscreate custom report . . . . . . . . . . . . . . 41edit data item . . . . . . . . . . . . . . . . . 175
Help menu . . . . . . . . . . . . . . . . . . . . 71About Avaya CMS Supervisor . . . . . . . . . . 71Contents. . . . . . . . . . . . . . . . . . . . 71technical support . . . . . . . . . . . . . . . . 71
historicalcreate new query. . . . . . . . . . . . . . . . 121reports. . . . . . . . . . . . . . . . . . . . . 29
horizontal bar chart, select . . . . . . . . . . . . . 179horizontal table orientation . . . . . . . . . . . . . 187
Iicon for Report Wizard . . . . . . . . . . . . . . . 26IDLE trunk state name . . . . . . . . . . . . . . . 99include a status bar . . . . . . . . . . . . . . . . 69index column . . . . . . . . . . . . . . . . . . . 224Input Prompts fields . . . . . . . . . . . . . . . . 47input types . . . . . . . . . . . . . . . . . . . . 100Input Value fields . . . . . . . . . . . . . . . . . 142input window . . . . . . . . . . . . . . . . . . . 108input, edit . . . . . . . . . . . . . . . . . . . . . 91Inputs field . . . . . . . . . . . . . . . . . . . . 68inputs for multi-ACD reports . . . . . . . . . . . . 105Inputs list . . . . . . . . . . . . . . . . . . . . . 100insert
ACD Name field on the report . . . . . . . . . . 140chart on a report . . . . . . . . . . . . . . . . 133data item fields on the report . . . . . . . . . . 141Input Value fields on the report . . . . . . . . . 142Report Data Start Time field on the report . . . . 143table on the report . . . . . . . . . . . . . . . 147text on the report . . . . . . . . . . . . . . . . 153Time Report Run field on the report . . . . . . . 144
Insert | Chart . . . . . . . . . . . . . . . . . . . 131
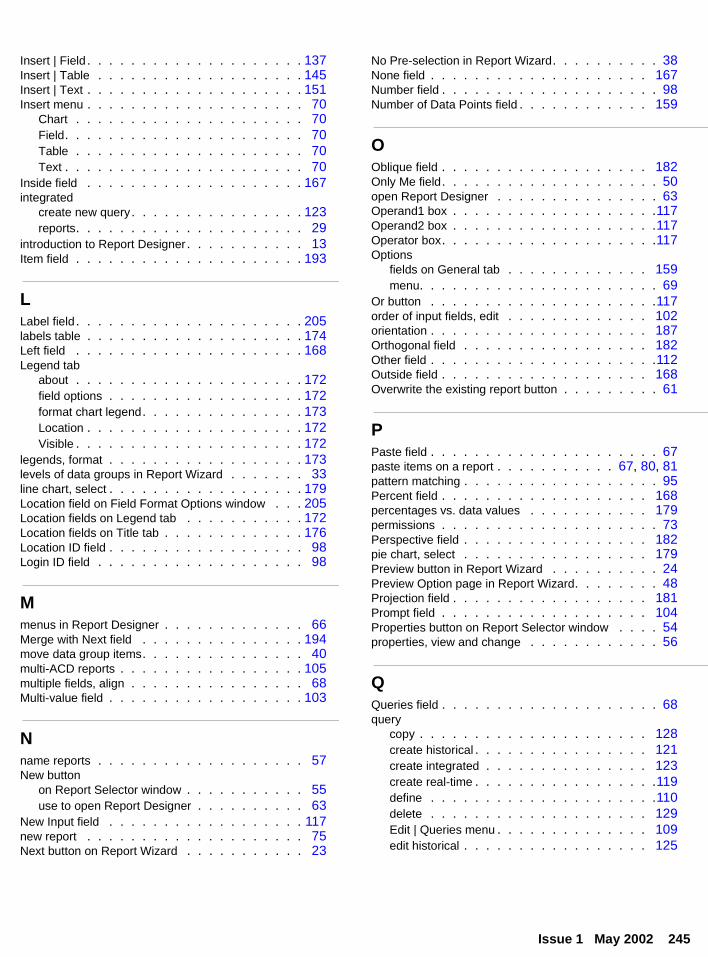
Issue 1 May 2002 245
Insert | Field. . . . . . . . . . . . . . . . . . . . 137Insert | Table . . . . . . . . . . . . . . . . . . . 145Insert | Text . . . . . . . . . . . . . . . . . . . . 151Insert menu . . . . . . . . . . . . . . . . . . . . 70
Chart . . . . . . . . . . . . . . . . . . . . . 70Field. . . . . . . . . . . . . . . . . . . . . . 70Table . . . . . . . . . . . . . . . . . . . . . 70Text . . . . . . . . . . . . . . . . . . . . . . 70
Inside field . . . . . . . . . . . . . . . . . . . . 167integrated
create new query. . . . . . . . . . . . . . . . 123reports. . . . . . . . . . . . . . . . . . . . . 29
introduction to Report Designer. . . . . . . . . . . 13Item field . . . . . . . . . . . . . . . . . . . . . 193
LLabel field. . . . . . . . . . . . . . . . . . . . . 205labels table . . . . . . . . . . . . . . . . . . . . 174Left field . . . . . . . . . . . . . . . . . . . . . 168Legend tab
about . . . . . . . . . . . . . . . . . . . . . 172field options . . . . . . . . . . . . . . . . . . 172format chart legend. . . . . . . . . . . . . . . 173Location . . . . . . . . . . . . . . . . . . . . 172Visible . . . . . . . . . . . . . . . . . . . . . 172
legends, format . . . . . . . . . . . . . . . . . . 173levels of data groups in Report Wizard . . . . . . . 33line chart, select . . . . . . . . . . . . . . . . . . 179Location field on Field Format Options window . . . 205Location fields on Legend tab . . . . . . . . . . . 172Location fields on Title tab . . . . . . . . . . . . . 176Location ID field . . . . . . . . . . . . . . . . . . 98Login ID field . . . . . . . . . . . . . . . . . . . 98
Mmenus in Report Designer . . . . . . . . . . . . . 66Merge with Next field . . . . . . . . . . . . . . . 194move data group items. . . . . . . . . . . . . . . 40multi-ACD reports . . . . . . . . . . . . . . . . . 105multiple fields, align . . . . . . . . . . . . . . . . 68Multi-value field . . . . . . . . . . . . . . . . . . 103
Nname reports . . . . . . . . . . . . . . . . . . . 57New button
on Report Selector window . . . . . . . . . . . 55use to open Report Designer . . . . . . . . . . 63
New Input field . . . . . . . . . . . . . . . . . . 117new report . . . . . . . . . . . . . . . . . . . . 75Next button on Report Wizard . . . . . . . . . . . 23
No Pre-selection in Report Wizard. . . . . . . . . . 38None field . . . . . . . . . . . . . . . . . . . . 167Number field . . . . . . . . . . . . . . . . . . . . 98Number of Data Points field . . . . . . . . . . . . 159
OOblique field . . . . . . . . . . . . . . . . . . . 182Only Me field. . . . . . . . . . . . . . . . . . . . 50open Report Designer . . . . . . . . . . . . . . . 63Operand1 box . . . . . . . . . . . . . . . . . . .117Operand2 box . . . . . . . . . . . . . . . . . . .117Operator box. . . . . . . . . . . . . . . . . . . .117Options
fields on General tab . . . . . . . . . . . . . 159menu. . . . . . . . . . . . . . . . . . . . . . 69
Or button . . . . . . . . . . . . . . . . . . . . .117order of input fields, edit . . . . . . . . . . . . . 102orientation . . . . . . . . . . . . . . . . . . . . 187Orthogonal field . . . . . . . . . . . . . . . . . 182Other field . . . . . . . . . . . . . . . . . . . . .112Outside field . . . . . . . . . . . . . . . . . . . 168Overwrite the existing report button . . . . . . . . . 61
PPaste field . . . . . . . . . . . . . . . . . . . . . 67paste items on a report . . . . . . . . . . . 67, 80, 81pattern matching . . . . . . . . . . . . . . . . . . 95Percent field . . . . . . . . . . . . . . . . . . . 168percentages vs. data values . . . . . . . . . . . 179permissions . . . . . . . . . . . . . . . . . . . . 73Perspective field . . . . . . . . . . . . . . . . . 182pie chart, select . . . . . . . . . . . . . . . . . 179Preview button in Report Wizard . . . . . . . . . . 24Preview Option page in Report Wizard. . . . . . . . 48Projection field . . . . . . . . . . . . . . . . . . 181Prompt field . . . . . . . . . . . . . . . . . . . 104Properties button on Report Selector window . . . . 54properties, view and change . . . . . . . . . . . . 56
QQueries field . . . . . . . . . . . . . . . . . . . . 68query
copy . . . . . . . . . . . . . . . . . . . . . 128create historical . . . . . . . . . . . . . . . . 121create integrated . . . . . . . . . . . . . . . 123create real-time . . . . . . . . . . . . . . . . .119define . . . . . . . . . . . . . . . . . . . . .110delete . . . . . . . . . . . . . . . . . . . . 129Edit | Queries menu . . . . . . . . . . . . . . 109edit historical . . . . . . . . . . . . . . . . . 125

246 Avaya CMS Supervisor Report Designer
query, (continued)zedit integrated . . . . . . . . . . . . . . . . 127edit real-time . . . . . . . . . . . . . . . . . 125
Query Assistantinput fields . . . . . . . . . . . . . . . . . . .112window. . . . . . . . . . . . . . . . . . . . .111
Query Items field . . . . . . . . . . . . . . . . . .112query select . . . . . . . . . . . . . . . . . 127, 128QUEUED trunk state name . . . . . . . . . . . . . 99
Rreal-time
create new query . . . . . . . . . . . . . . . .119reports . . . . . . . . . . . . . . . . . . . . . 29
Real-Time fields on General tab . . . . . . . . . . 159rearrange data items . . . . . . . . . . . . . . . 166related documents . . . . . . . . . . . . . . . . . 19remove
data group items in Report Wizard . . . . . . . . 40data items . . . . . . . . . . . . . . . . . . 166input fields . . . . . . . . . . . . . . . . . . 101item from a report . . . . . . . . . . . . . . . . 67
Report Data Start Time field . . . . . . . . . . . 143Report Description field . . . . . . . . . . . . . . . 50Report Designer
basics . . . . . . . . . . . . . . . . . . . . . 65definition . . . . . . . . . . . . . . . . . . . . 14introduction. . . . . . . . . . . . . . . . . . . 13menus . . . . . . . . . . . . . . . . . . . . . 66start . . . . . . . . . . . . . . . . . . . . . . 73
report destination. . . . . . . . . . . . . . . . . . 94Report Input window and fields . . . . . . . . . . . 92Report Manager
about . . . . . . . . . . . . . . . . . . . . . 53copy report to designer category . . . . . . . . . 57definition . . . . . . . . . . . . . . . . . . . . 54
Report menu. . . . . . . . . . . . . . . . . . . . 66Exit . . . . . . . . . . . . . . . . . . . . . . 66Run . . . . . . . . . . . . . . . . . . . . . . 66Save . . . . . . . . . . . . . . . . . . . . . . 66Save As . . . . . . . . . . . . . . . . . . . . 66
Report Name field . . . . . . . . . . . . . . . . . 50Report Selector window . . . . . . . . . . . . . . 54Report Wizard
buttons . . . . . . . . . . . . . . . . . . . . . 23Change Input Captions page . . . . . . . . . . 47chart formats . . . . . . . . . . . . . . . . . . 43create custom report headings. . . . . . . . . . 41data item colums on Select Data Items page . . . 37defining sections . . . . . . . . . . . . . . . . 32Display Data Group items that contain . . . . . . 37
Report Wizard, (continued)expand and collapse categories . . . . . . . . . 35filter data group items. . . . . . . . . . . . . . 39Finish page . . . . . . . . . . . . . . . . . . 51levels of data groups . . . . . . . . . . . . . . 33move data group items . . . . . . . . . . . . . 40No Pre-selection . . . . . . . . . . . . . . . . 38overview of steps. . . . . . . . . . . . . . . . 25Preview Option page . . . . . . . . . . . . . . 48procedures for Select Data Items page . . . . . 39removing data group items . . . . . . . . . . . 40reposition data group items . . . . . . . . . . . 41Save Report page . . . . . . . . . . . . . . . 49Select a Data Group page . . . . . . . . . . . 33Select a Report Layout page . . . . . . . . . . 30Select a Report Type page . . . . . . . . . . . 28Select Chart Format page. . . . . . . . . . . . 42Select Data Items page . . . . . . . . . . . . . 36Select Table Format page . . . . . . . . . . . 45Selection Layout page . . . . . . . . . . . . . 31sorting data group items . . . . . . . . . . . . 40start . . . . . . . . . . . . . . . . . . . . . . 26toolbar icon . . . . . . . . . . . . . . . . . . 26
reportsformat charts. . . . . . . . . . . . . . . . . . 157format tables . . . . . . . . . . . . . . . . . . 186historical . . . . . . . . . . . . . . . . . . . . 29integrated . . . . . . . . . . . . . . . . . . . 29kinds of . . . . . . . . . . . . . . . . . . . . 14name . . . . . . . . . . . . . . . . . . . . . 57real-time . . . . . . . . . . . . . . . . . . . . 29types . . . . . . . . . . . . . . . . . . . . . 29
reposition data group items in Report Wizard . . . . 41resize items on a report . . . . . . . . . . . . . . 85retrieve data. . . . . . . . . . . . . . . . . . . . 225Right field . . . . . . . . . . . . . . . . . . . . . 168Rolling Chart field . . . . . . . . . . . . . . . . . 159Rolling check box . . . . . . . . . . . . . . . . . 134Rotation field . . . . . . . . . . . . . . . . . . . 181row-oriented reports . . . . . . . . . . . . . . . . 46Run menu item . . . . . . . . . . . . . . . . . . 66Run or Edit Report at a later time field . . . . . . . 52Run Report field . . . . . . . . . . . . . . . . . . 51Run Report for ACD field. . . . . . . . . . . . . . 51
SSave As menu item . . . . . . . . . . . . . . . . 66Save menu item . . . . . . . . . . . . . . . . . . 66Save Report page in Report Wizard. . . . . . . . . 49Save the report being copied as button . . . . . . . 61Script button on Report Selector window . . . . . . 54

Issue 1 May 2002 247
SEIZED trunk state name . . . . . . . . . . . . . 99select
chart type . . . . . . . . . . . . . . . . . . . 180field type. . . . . . . . . . . . . . . . . . . . 139multiple items on the report . . . . . . . . . . . 86
Select a Data Group page . . . . . . . . . . . . . 33Select a Data Group page in Report Wizard . . . . . 33Select a Report Layout page in Report Wizard. . . . 30Select a Report Type page in Report Wizard . . . . 28Select an input for your field window . . . . . . . . 142SELECT box . . . . . . . . . . . . . . . . . . . 117Select Chart Format page in Report Wizard . . . . . 42Select Data Items page in Report Wizard . . . . . . 36Select Data Items page procedures . . . . . . . . . 39Select Inputs assistant . . . . . . . . . . . . . . . 68Select Table Format page in Report Wizard . . . . . 45Selected Data Items in Report Wizard . . . . . . . 37Selection Layout page in Report Wizard. . . . . . . 31Series Labels tab
about . . . . . . . . . . . . . . . . . . . . . 174edit data item headings . . . . . . . . . . . . . 175field options . . . . . . . . . . . . . . . . . . 174labels table . . . . . . . . . . . . . . . . . . 174
Series Name field . . . . . . . . . . . . . . . . . 168Show All Formats field . . . . . . . . . . . . . . . 194show gridlines . . . . . . . . . . . . . . . . . . . 187Show Percentage field . . . . . . . . . . . . . . . 43Show Value As field . . . . . . . . . . . . . . . . 193Show Value as Name field . . . . . . . . . . . . . 205Show Value field . . . . . . . . . . . . . . . . . 43Sort By fields . . . . . . . . . . . . . . . . . . . 198Sort by menu item . . . . . . . . . . . . . . . . . 69sort data group items in Report Wizard . . . . . . . 40Sort tab . . . . . . . . . . . . . . . . . . . . . . 198Split/Skill field . . . . . . . . . . . . . . . . . . . 98Stacked check box . . . . . . . . . . . . . . . . 179stacked data . . . . . . . . . . . . . . . . . . . 179standard CMS reports . . . . . . . . . . . . . . . 62start
Create a Query assistant . . . . . . . . . . . . 68Report Designer . . . . . . . . . . . . . . . . 73Report Wizard . . . . . . . . . . . . . . . . . 26Select Inputs assistant . . . . . . . . . . . . . 68
Start Time field . . . . . . . . . . . . . . . . . . 94Status Bar field . . . . . . . . . . . . . . . . . . 69status bar, include on report . . . . . . . . . . . . 69step chart, select . . . . . . . . . . . . . . . . . 179store data . . . . . . . . . . . . . . . . . . . . . 224String field . . . . . . . . . . . . . . . . . . . . 98summary lines. . . . . . . . . . . . . . . . . . . 200Summary Options fields . . . . . . . . . . . . . . 200Summary tab . . . . . . . . . . . . . . . . . . . 200Supervisor reports . . . . . . . . . . . . . . . . . 62
TTable Assistant window. . . . . . . . . . . . . . 147Table field . . . . . . . . . . . . . . . . . . . . . 69Table Header field . . . . . . . . . . . . . . . . 196Table menu item . . . . . . . . . . . . . . . . . . 70tables
add, remove, and reorganize data . . . . . . . 189create and insert . . . . . . . . . . . . . . . 145definition . . . . . . . . . . . . . . . . . . . 224format columns . . . . . . . . . . . . . . . . 193format fonts. . . . . . . . . . . . . . . . . . 192format gridlines, scroll, and orientation . . . . . 187format headers . . . . . . . . . . . . . . . . 196format summary lines . . . . . . . . . . . . . 200insert. . . . . . . . . . . . . . . . . . . . . 147sort information . . . . . . . . . . . . . . . . 198
technical support . . . . . . . . . . . . . . . . . . 71Test button . . . . . . . . . . . . . . . . . . . .117text
create and insert . . . . . . . . . . . . . 151, 153fonts . . . . . . . . . . . . . . . . . . . . . 210format . . . . . . . . . . . . . . . . . . . . .211
Text Assistant window . . . . . . . . . . . . . . 153Text contents field . . . . . . . . . . . . . . . . 210Text font field . . . . . . . . . . . . . . . . . . 210Text menu item . . . . . . . . . . . . . . . . 69, 70Time (duration) field . . . . . . . . . . . . . . . . 98Time (point in time) field . . . . . . . . . . . . . . 99Time Report Run field . . . . . . . . . . . . . . 144title format . . . . . . . . . . . . . . . . . . . . 177Title tab
about. . . . . . . . . . . . . . . . . . . . . 176field options . . . . . . . . . . . . . . . . . 176format the title . . . . . . . . . . . . . . . . 177Location fields . . . . . . . . . . . . . . . . 176Visible check box . . . . . . . . . . . . . . . 176
toolbar icon for Report Wizard. . . . . . . . . . . . 26troubleshooting . . . . . . . . . . . . . . . . . 213Trunk field . . . . . . . . . . . . . . . . . . . . . 99Trunk group field . . . . . . . . . . . . . . . . . . 99Trunk state field . . . . . . . . . . . . . . . . . . 99trunk state names . . . . . . . . . . . . . . . . . 99two-section report . . . . . . . . . . . . . . . . . 48Type field . . . . . . . . . . . . . . . . . . . . 103Type tab
about. . . . . . . . . . . . . . . . . . . . . 178field options . . . . . . . . . . . . . . . . . 179select chart type . . . . . . . . . . . . . . . 180
types of reports . . . . . . . . . . . . . . . . . . 29

248 Avaya CMS Supervisor Report Designer
Uundo
alignment. . . . . . . . . . . . . . . . . . . . 67cuts or deletions . . . . . . . . . . . . . . . . 67
Undo Align Controls field . . . . . . . . . . . . . . 67Undo Cut/Delete field. . . . . . . . . . . . . . . . 67update rate in seconds . . . . . . . . . . . . . . . 94Use First data item as chart title field . . . . . . . . 43user permissions . . . . . . . . . . . . . . . . . . 73
VValue field . . . . . . . . . . . . . . . . . . . . 168VDN field . . . . . . . . . . . . . . . . . . . . . 99Vector field . . . . . . . . . . . . . . . . . . . . 99vertical table orientation . . . . . . . . . . . . . 187view
input window . . . . . . . . . . . . . . . . . 108report’s properties. . . . . . . . . . . . . . . . 56
Viewing Distance field . . . . . . . . . . . . . . 182Visible check box. . . . . . . . . . . . . . . . . 176Visible field . . . . . . . . . . . . . . . . . 172, 205
WWHERE box . . . . . . . . . . . . . . . . . . . 117Width to Height field . . . . . . . . . . . . . . . . 182window
Define Input . . . . . . . . . . . . . . . . . . 92Query Assistant . . . . . . . . . . . . . . . . 111Report Selector . . . . . . . . . . . . . . . . 54
ZZeros as Blanks field. . . . . . . . . . . . . . . . 194