back to basics: endocrinology diabetes (obesity, metabolic syndrome)
TRANSCRIPT

Back to Basics: Back to Basics: EndocrinologyEndocrinology
DiabetesDiabetes(Obesity, Metabolic (Obesity, Metabolic
Syndrome)Syndrome)

Which of the following Which of the following statements is true?statements is true?A.A. Type 1 diabetes is not diagnosed after age Type 1 diabetes is not diagnosed after age
5050
B.B. Type 2 diabetes is more strongly inherited Type 2 diabetes is more strongly inherited than type 1 diabetes.than type 1 diabetes.
C.C. The incidence and prevalence of DM-1 is on The incidence and prevalence of DM-1 is on the risethe rise
D.D. Gestational diabetes does not increase the Gestational diabetes does not increase the risk of developing diabetes in the future.risk of developing diabetes in the future.
E.E. People with type 2 diabetes never get DKAPeople with type 2 diabetes never get DKA

AnswerAnswer
B and CB and C

Classification of DiabetesClassification of Diabetes
Type 1 Type 1 Encompasses diabetes that is Encompasses diabetes that is
primarily a result of pancreatic beta primarily a result of pancreatic beta cell destruction and prone to DKA.cell destruction and prone to DKA.
Includes auto immune (anti islet cell Includes auto immune (anti islet cell antibody, and anti GAD) and antibody, and anti GAD) and unknown etiology.unknown etiology.

Classification of DiabetesClassification of Diabetes
Type 2Type 2 Primarily insulin resistance with a Primarily insulin resistance with a
relative insulin deficiency (but can relative insulin deficiency (but can develop into and include scenario of develop into and include scenario of predominant insulin secretory defect predominant insulin secretory defect with insulin resistance)with insulin resistance)

Diminishedinsulin
Hyperglycemia
Liver
1. Insulin deficiency
2. Excess glucose output
3. Insulin resistance
Pancreas
Muscle and fat
Excess glucagon
Islet
Diminishedinsulin
α-cell produces excess glucagon
β-cell produces less insulin
The pathophysiology of T2DM The pathophysiology of T2DM includes includes
three main defectsthree main defects

Classification of DiabetesClassification of Diabetes
Gestational Diabetes MellitusGestational Diabetes Mellitus
Onset or recognition of diabetes Onset or recognition of diabetes during pregnancyduring pregnancy
Other specific typesOther specific types MODY type 1-5MODY type 1-5 Cystic fibrosisCystic fibrosis Cushing’s syndrome etc.Cushing’s syndrome etc.

TYPE 1 Diabetes
10%
Beta cell destruction (usually autoimmune)
Low or absent
Required for survival
Often <30 (but can occur at any age)
Usually lean
Smaller
Acute, severe
Yes
No
Proportion of diabetes cases
Pathogenesis
Endogenous insulin secretion
Need for insulin therapy
Age of onset
Body habitus
Genetic component
Symptoms at onset
Ketoacidosis
Long-term complications present at dx?
TYPE 2 Diabetes
90%
Insulin resistance, relative insulin deficiency
Variable
Required in <50%, to improve control rather than for survival
Often >40 but even in kids
Often obese
Very large
Often mild, slow onset
Rare
Retinopathy ~20%, CVD relatively common

Diabetes mellitus is NOT a Diabetes mellitus is NOT a Mild DiseaseMild Disease
Stroke
2- to 4-fold increase in cardiovascular mortality and stroke3
Cardiovascular Disease
8/10 diabetic patients die from CV events4
Diabetic Neuropathy
Leading cause of non-traumatic lower extremity amputations5
Diabetic Retinopathy
Leading cause of blindness in
working-age adults1
Diabetic Nephropathy
Leading cause of end-stage renal
disease2
1. Fong DS et al. Diabetes Care 2003; 26(Suppl 1):S99-S102. 2. Molitch ME et al. Diabetes Care 2003; 26(Suppl 1):S94-S98. 3. Kannel WB et al. Am J Heart 1990; 120:672-6. 4. Gray RP and Yudkin JS. In: Textbook of Diabetes. 1997. 5. Mayfield JA, et al. Diabetes Care 2003; 26(Suppl 1):S78-S79.

Diabetes Complications: Diabetes Complications: MacrovascularMacrovascular
DM is a major risk factor for cardiac DM is a major risk factor for cardiac diseasedisease
Acute MI occurs 15-20 years earlier Acute MI occurs 15-20 years earlier in those with DMin those with DM
Heart disease accounts for Heart disease accounts for approximately 50% of all deaths approximately 50% of all deaths among people with diabetes in among people with diabetes in industrialized countries industrialized countries
REF: Diabetes in Ontario, An ICES Practice Atlas, 2002

Several large epidemiological Several large epidemiological studies have found a strong studies have found a strong relationship between relationship between glucose level and subsequent coronary glucose level and subsequent coronary
events, even at ‘pre-diabetes’ levels events, even at ‘pre-diabetes’ levels (IGT and IFG)(IGT and IFG)
glucose levels that are only modestly glucose levels that are only modestly elevated place patients at risk. elevated place patients at risk.
REF: Coutiho M. et al Diabetes Care 1999;22:233-240.& DECODE Study Group. Arch Intern Med 2001;161:397-404.
Diabetes Complications:Diabetes Complications: MacrovascularMacrovascular

Diabetes Complications: Macrovascular
Relationship between FPG and CHD
REF: Coutinho et al. Diabetes Care 1999;22:233-40.
Metaregression - 20 prospective studies n = 95,783 - follow-up 12.4 yrsFPG > 6 mmol/L: RR 1.38 (1.06-1.67)
Fasting glucose (mmol/L)
Rel
ativ
e R
isk
2.5
2
1.5
14 5 6 7 8 9

Diabetes….Diabetes…. Is the leading cause of non traumatic Is the leading cause of non traumatic
amputationamputation Increases the risk of amputation by 20 Increases the risk of amputation by 20
foldfold those living in the north or in low income those living in the north or in low income
neighborhoods and those with poor access neighborhoods and those with poor access to physician services are at particular risk to physician services are at particular risk for amputation.for amputation.
REF: Diabetes in Ontario, An ICES Practice Atlas, 2002
Diabetes Complications: Diabetes Complications: MicrovascularMicrovascular – Amputation– Amputation

DiabetesDiabetes Is a leading cause of adult-onset Is a leading cause of adult-onset
blindnessblindness Prevalence of diabetic retinopathy is ~ Prevalence of diabetic retinopathy is ~
70% in persons with type 1 and 40% 70% in persons with type 1 and 40% with person with type 2 diabetes. with person with type 2 diabetes.
REF: Diabetes in Ontario, An ICES Practice Atlas, 2002
Diabetes Complications: Diabetes Complications: MicrovascularMicrovascular – Retinopathy– Retinopathy

Diabetes Diabetes Is the leading cause of ESRDIs the leading cause of ESRD Increases the risk of developing ESRD Increases the risk of developing ESRD
by up to 13-foldby up to 13-fold
Refs: Meltzer S, et al CMAJ 1998; 159 (8 suppl):S1-S29, &
Parchman ML, et al Medical Care 2002; 40(2):137-144.
Diabetes Complications: Diabetes Complications: MicrovascularMicrovascular - - NephropathyNephropathy

DM-2 Risk FactorsDM-2 Risk Factors
Modifiable Risk FactorsModifiable Risk FactorsPhysical Activity Physical Activity
Obesity Obesity DietDiet
&&
Non-Modifiable Risk FactorsNon-Modifiable Risk FactorsEthnicityEthnicity
Family HistoryFamily History


Diabetes Risk Factors:Diabetes Risk Factors:ModifiableModifiable
0
1
2
Rel
ativ
e Ris
k
>7 4 to 7 2 to 4 .5 to 2 <0.5
Hours per week
Physical Activity: Relative Risk For Developing Diabetes
Source: Choi B, Shi F. Diabetologia 2001, 44:1221-1231.

0
0.5
1
1.5
2
rela
tive
ris
k
5 4 3 2 1quintiles based on fat/fibre content
Healthy Diet: Relative Risk for Developing DM
Source: Choi B, Shi F. Diabetologia 2001, 44:1221-1231.
Diabetes Risk Factors:Diabetes Risk Factors:ModifiableModifiable

0
10
20
30
40
Rela
tive R
isk
<23 23-25 25-30 30-35 <35
BMI = wt/ (ht)2
Obesity: Relative Risk For Developing DM
Source: Choi B, Shi F. Diabetologia 2001, 44:1221-1231.
Diabetes Risk Factors:Diabetes Risk Factors:ModifiableModifiable

Relative risk for developing type 2 is Relative risk for developing type 2 is cumulative.cumulative. A physically inactive individual (less than 30 A physically inactive individual (less than 30
min/wk of exercise) min/wk of exercise) who consumes an unhealthy dietwho consumes an unhealthy diet and is modestly overweight (BMI 25-30) and is modestly overweight (BMI 25-30) would have a 30-fold increased (1.8*2*8) risk of would have a 30-fold increased (1.8*2*8) risk of
developing type 2 DM compared to the general developing type 2 DM compared to the general population, population,
which would translate to a lifetime risk of which would translate to a lifetime risk of nearly 100%nearly 100%
REF: Atlas of Diabetes 2nd Ed, Part 2, JS Sklyer, EditorREF: Atlas of Diabetes 2nd Ed, Part 2, JS Sklyer, Editor
Diabetes Risk Factors:Diabetes Risk Factors:ModifiableModifiable

Run away from diabetes
DM-2DM-2The Epidemic: The Epidemic: Non-Modifiable Non-Modifiable
Risk FactorsRisk FactorsEthnicityEthnicity
AgeAge
Family History / GeneticsFamily History / Genetics

The Epidemic: The Epidemic: Ethnic Groups at High Ethnic Groups at High
Risk for DMRisk for DM Aboriginal Aboriginal
LatinoLatino
South AsianSouth Asian
AsianAsian
African DescentAfrican Descent

77.1% of Canada’s immigrant 77.1% of Canada’s immigrant population are coming from population are coming from populations which from high risk populations which from high risk ethnic groupsethnic groups
7.3% 7.3% LatinosLatinos Central and South America, 7.3%Central and South America, 7.3%
57.0% Asian 57.0% Asian 12.8% African Decent12.8% African Decent
Caribbean and Bermuda, 5.5%Caribbean and Bermuda, 5.5% Africa, 7.3%Africa, 7.3%
Diabetes Risk Factors: Non-Modifiable Other High-risk Groups in Canada
REF: Statistics Canada, 1996 Census
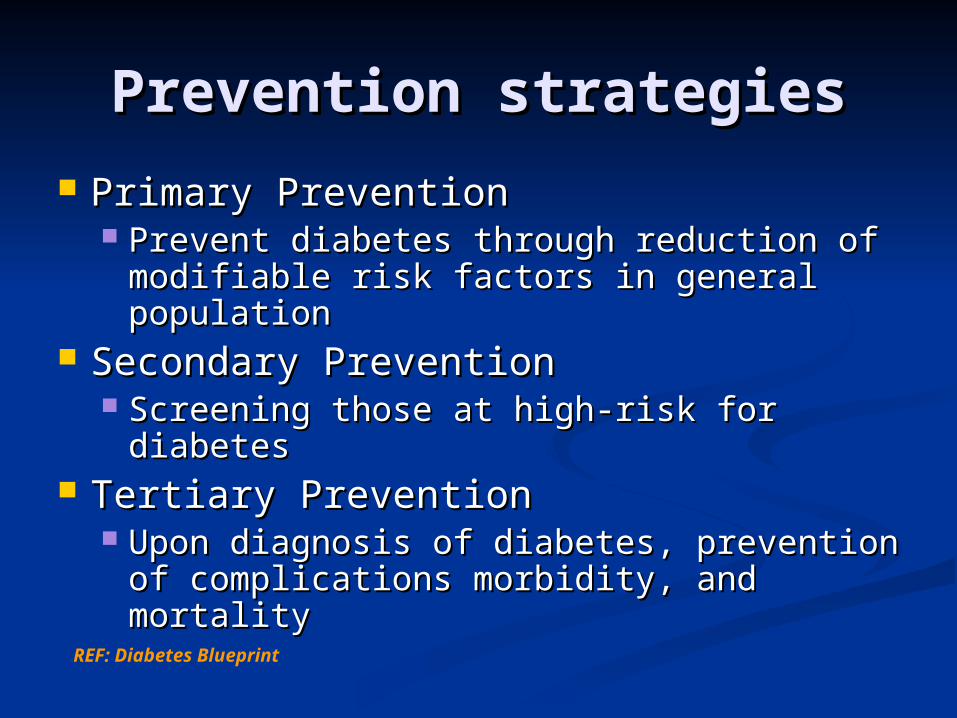
Prevention strategiesPrevention strategies
Primary PreventionPrimary Prevention Prevent diabetes through reduction of Prevent diabetes through reduction of
modifiable risk factors in general modifiable risk factors in general populationpopulation
Secondary PreventionSecondary Prevention Screening those at high-risk for diabetesScreening those at high-risk for diabetes
Tertiary PreventionTertiary Prevention Upon diagnosis of diabetes, prevention of Upon diagnosis of diabetes, prevention of
complications morbidity, and mortalitycomplications morbidity, and mortality
REF: Diabetes Blueprint

Primary Prevention Primary Prevention ModelModel
GoalGoal Reducing modifiable risk factors for diabetesReducing modifiable risk factors for diabetes
Target Target General population & high-risk groups General population & high-risk groups
MessagesMessages Healthy lifestyle choicesHealthy lifestyle choices
Current Delivery Models of Primary Current Delivery Models of Primary PreventionPrevention Population HealthPopulation Health Primary CarePrimary Care

REF: Health Canada
Primary Prevention Model: Primary Prevention Model: Population HealthPopulation Health – National – National
CDS
Health Canada
NADA

GoalGoal Early identification of those with Early identification of those with
dysglycemia dysglycemia Target Target
High-risk individuals and groups High-risk individuals and groups MessagesMessages
Diabetes awarenessDiabetes awareness Current delivery model of secondary Current delivery model of secondary
prevention relies on primary careprevention relies on primary care
Secondary PreventionSecondary Prevention

Secondary Prevention: Secondary Prevention: Is It Effective?Is It Effective?
Yes….Yes…. Patients diagnosed with IGT can be Patients diagnosed with IGT can be
prevented from progressing to type 2 prevented from progressing to type 2 diabetes diabetes 58% reduction with lifestyle changes (DPP, 58% reduction with lifestyle changes (DPP,
DPS) DPS) 30% reduction with medication (DPP, Stop 30% reduction with medication (DPP, Stop
NIDDM) NIDDM)

Tertiary Prevention: Tertiary Prevention: Is it Effective?Is it Effective?
Yes…Yes… Strong evidence for tertiary prevention Strong evidence for tertiary prevention
particularly for microvascular diseaseparticularly for microvascular disease DCCT, UKPDSDCCT, UKPDS And for macrovascular as legacy effect And for macrovascular as legacy effect
(UKPDS and EDIC follow up studies)(UKPDS and EDIC follow up studies) How to translate this evidence into How to translate this evidence into
practice?practice?

Tertiary PreventionTertiary Prevention
GoalsGoals Glucose, blood pressure, and lipid Glucose, blood pressure, and lipid
control to reduce the development of control to reduce the development of complicationscomplications
Complication screening for early Complication screening for early identification and managementidentification and management
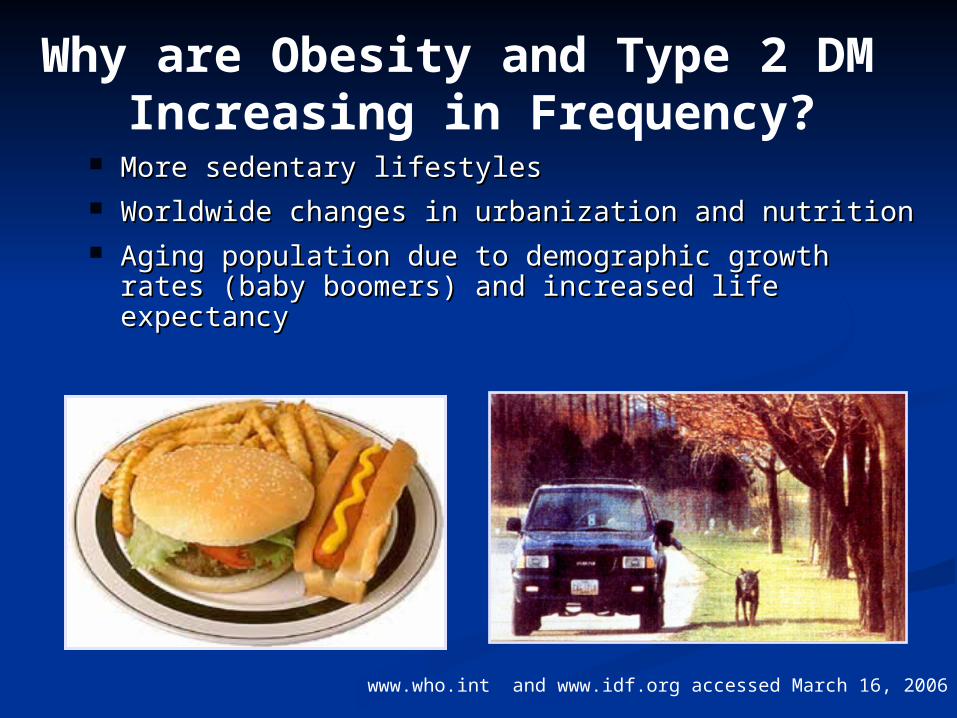
Why are Obesity and Type 2 DM
Increasing in Frequency? More sedentary lifestyles More sedentary lifestyles Worldwide changes in urbanization and nutritionWorldwide changes in urbanization and nutrition Aging population due to demographic growth rates Aging population due to demographic growth rates
(baby boomers) and increased life expectancy (baby boomers) and increased life expectancy
www.who.int and www.idf.org accessed March 16, 2006

ObesityObesity The most common metabolic condition in The most common metabolic condition in
industrialized nationsindustrialized nations Statistics Canada: 48% of Canadians Statistics Canada: 48% of Canadians
between ages 20-64 yr are overweight between ages 20-64 yr are overweight (BMI>25)(BMI>25)
Associated with dyslipidemia, impaired Associated with dyslipidemia, impaired glucose tolerance and insulin resistanceglucose tolerance and insulin resistance
Risk factor for developing metabolic Risk factor for developing metabolic syndrome, type 2 Dm, cardiovascular syndrome, type 2 Dm, cardiovascular diseasedisease
Huge economic costsHuge economic costs

Obesity in Canada: 1978/79 to 2004
Data from Canadian Community Health Survey www.statcan.ca/Daily/English/050706/d050706a.htm
Quick Facts:Quick Facts:
% of obese children increased from 3% to 8%
Among adults, the increase was even more dramatic: from 14% to 23%, a total of 5.5 million people
About 30% of baby boomers (aged 45 to 64) are obese


Weight Management Weight Management StrategiesStrategies
Eating pattern modificationEating pattern modification Behaviour therapy ( including group therapy)Behaviour therapy ( including group therapy) Appetite suppression eg. SibutramineAppetite suppression eg. Sibutramine Fat malabsorption, orlistatFat malabsorption, orlistat Bariatric surgery (Roux en Y, gastric banding)Bariatric surgery (Roux en Y, gastric banding)
Energy ExpenditureEnergy Expenditure Non exercise associated thermogenisis Non exercise associated thermogenisis
(NEAT)(NEAT) ExerciseExercise

Canada’s Food guide to Canada’s Food guide to healthy eatinghealthy eating
Promote a diet with 30% or less Promote a diet with 30% or less energy from fat, 15-20% energy energy from fat, 15-20% energy from protein and 50-55% from from protein and 50-55% from complex carbohydratescomplex carbohydrates
Despite a decrease from 40% of Despite a decrease from 40% of energy from fat in U.S. diet in 1965 energy from fat in U.S. diet in 1965 to 34% in 1991, incidence of obesity to 34% in 1991, incidence of obesity increasedincreased

Metabolic SyndromeMetabolic Syndrome
A constellation of risk factors A constellation of risk factors Significantly increased CVD Significantly increased CVD
risksrisks Significantly increased risks for Significantly increased risks for
type 2 diabetestype 2 diabetes

Clinical Features of the Clinical Features of the Metabolic SyndromeMetabolic Syndrome
Abdominal obesityAbdominal obesity HyperglycemiaHyperglycemia Atherogenic dyslipidemiaAtherogenic dyslipidemia HypertensionHypertension Proinflammatory stateProinflammatory state Prothrombotic stateProthrombotic state

IDF Classification of the IDF Classification of the Metabolic SyndromeMetabolic Syndrome
5.6 mmol/L 5.6 mmol/L Fasting Fasting glucoseglucose
130 Syst. or diast. 130 Syst. or diast. 85 mm 85 mm Hg or RxHg or Rx
Blood Blood pressurepressure
1.10 1.10 WomenWomen
0.900.90 MenMen
1.71.7HDL cholesterolHDL cholesterol
Men Men Waist C.Waist C. Women Women
94 cm 94 cm (37 in)(37 in) 80 cm 80 cm (31.5 in)(31.5 in)
90 cm 90 cm (35 in)(35 in) 80 cm 80 cm (31.5 in)(31.5 in)
85 cm 85 cm (33 in)(33 in) 90 cm 90 cm (35 (35 in)in)
Central obesityCentral obesity Europids, Mid-Europids, Mid-easteast S. Asians, S. Asians, ChineseChinese JapaneseJapanese
Cut PointsCut Points
Plus any 2 of the following for Plus any 2 of the following for diagnosis:diagnosis:
Inadequate evidence to recommend routine measurement of insulin resistance (e.g., plasma insulin), proinflammatory state, or prothrombotic state in the diagnosis of the metabolic syndrome
TriglyceridesTriglycerides
Risk FactorsRisk Factors

Metabolic SyndromeMetabolic Syndrome
A common condition associated with A common condition associated with increased cardiovascular disease risksincreased cardiovascular disease risks
Treatment is aimed at lifestyle Treatment is aimed at lifestyle modification to achieve desirable body modification to achieve desirable body weight and reduce abdominal obesityweight and reduce abdominal obesity
Multiple medical therapy may be Multiple medical therapy may be required to achieve metabolic targets required to achieve metabolic targets (lipids, glucose and BP)(lipids, glucose and BP)
Lifestyle modification benefits Lifestyle modification benefits everyone!everyone!

Definitions of Impaired Fasting Glucose (IFG) and Impaired Glucose Tolerance
(IGT) and Diabetes
Fas
ting
Glu
cose
(mm
ol/
L)
3.5
4.5
5.5
6.5
7.5
8.5
3 4 6 8 10 12 14
2-h Post-load Glucose (mmol/L)
Diabetes
IFG + IGT
NormalGlucose
IGT
IFG6.1
6.9
7.8 11.1
* 1. ADA Diabetes Care 2006;29(Suppl 1):S47,2. CDA Can J Diabetes 2003;27(Suppl 2):S7, 3.WHO 1999 NDC/NCS.99.2 accessed Mar 2 2006 from www.who.int
5.6*

Screening for Type 2 Screening for Type 2 DiabetesDiabetes
6.1-6.9 mmol/L do OGTT5.6-6.0 plus risk factor(s) for DM do OGTT
2hPG in a 75-g OGTT
Every 3 years in individuals 40 years of age Earlier and/or more frequently in individuals with
additional risk factors
FPG
CDA 2003 Clinical Practice Guidelines. Can J Diabetes 2003;27:S11

Therapeutic Therapeutic strategies for the strategies for the management of management of type 2 diabetes.type 2 diabetes.

Targets for Metabolic Targets for Metabolic Control: Control:
Glucose ControlGlucose Control DM-1 and DM-1 and DM-2DM-2
(2008 CDA Guidelines)(2008 CDA Guidelines)Target for Target for Most PatientsMost Patients
A1CA1C 7.07.0
PreprandialPreprandial 4.0 – 7.04.0 – 7.0
2 h 2 h PostprandialPostprandial
5.0 – 10.05.0 – 10.0
5.0-8.0 if not 5.0-8.0 if not at A1c targetat A1c target

Targets for Targets for Glucose ControlGlucose Control Preconception Preconception and in Pregnancyand in Pregnancy (2008 CDA Guidelines)(2008 CDA Guidelines)
Target for Target for Most PatientsMost Patients
A1CA1C
7.0 and 7.0 and <6.0% if <6.0% if
safely safely acheivedacheived
PreprandialPreprandial 3.8-5.2 3.8-5.2 mmol/Lmmol/L
1h 1h PostprandialPostprandial 5.5-7.75.5-7.7
2 h 2 h PostprandialPostprandial
5.0 – 6.65.0 – 6.6
5.0-8.0 if not 5.0-8.0 if not at A1c targetat A1c target

Clinical assessment and initiation of nutrition and physical activity
A1C <9% A1C ≥9%
BMI ≥25 BMI <25
Metformin (first-line)incretin
TZDSecretagogue
Insulinacarbose
Metforminincretin
TZDSecretagogue
Insulinacarbose
2 agents:Metformin
incretinTZD
SecretagogueInsulin
acarbose
Insulin
Achieve Target A1C Achieve Target A1C within 6within 6––12 Months12 Months
Timely adjustments/additions should be made to attain target A1C within 6–12 months.
Canadian Diabetes Association Clinical Practice Guidelines Expert Committee. Can J Diabetes 2003;27(Suppl 2):S1–152.

Oral Medications Oral Medications to Treat Type 2 to Treat Type 2
DiabetesDiabetes

Major Classes of Major Classes of MedicationsMedications
1. Drugs that sensitize 1. Drugs that sensitize the body to insulin the body to insulin and/or control hepatic and/or control hepatic glucose productionglucose production
2. Drugs that stimulate 2. Drugs that stimulate the pancreas to make the pancreas to make more insulinmore insulin
3. Drugs that slow the3. Drugs that slow the absorption of starchesabsorption of starches
ThiazolidinedioneThiazolidinedioness
BiguanidesBiguanides
SulfonylureasSulfonylureasMeglitinidesMeglitinides
Alpha-glucosidase Alpha-glucosidase inhibitorsinhibitors

New Class of New Class of MedicationsMedications
IncretinsIncretins Derived from gut hormone GLP-1 Derived from gut hormone GLP-1 Glucagon like peptide 1Glucagon like peptide 1

GLP-1 Effects in Humans: GLP-1 Effects in Humans: Understanding Glucoregulatory Understanding Glucoregulatory
Role of IncretinsRole of Incretins
Adapted from Flint A, et al. J Chin Invest. 1998;101:515-520; Larsson H, et al. Acta Physiol Scand. 1997;160:413-422; Nauck MA, et al. Diabetologia. 1996;39:1546-1553; Drucker DJ. Diabetes. 1998;47:159-169.

ThiazolidinedionesThiazolidinediones Thiazolidinediones decrease insulin resistance by Thiazolidinediones decrease insulin resistance by
making muscle and adipose cells more sensitive to making muscle and adipose cells more sensitive to insulin. They also suppress hepatic glucose insulin. They also suppress hepatic glucose production.production.
EfficacyEfficacy Decrease fasting plasma glucose ~1.9-2.2 mmol/LDecrease fasting plasma glucose ~1.9-2.2 mmol/L Reduce A1C ~0.5-1.0%Reduce A1C ~0.5-1.0% 6 weeks for maximum effect6 weeks for maximum effect
Other EffectsOther Effects Weight gain, edema Weight gain, edema Hypoglycemia (if taken with insulin or agents that stimulate Hypoglycemia (if taken with insulin or agents that stimulate
insulin release)insulin release) Contraindicated in patients with abnormal liver function or Contraindicated in patients with abnormal liver function or
CHFCHF Improves HDL cholesterol and plasma triglycerides; usually Improves HDL cholesterol and plasma triglycerides; usually
LDL neutralLDL neutral Medications in this Class: pioglitazone (Actos), Medications in this Class: pioglitazone (Actos),
rosiglitazone (Avandia), rosiglitazone (Avandia),

BiguanidesBiguanides Biguanides decrease hepatic glucose production and Biguanides decrease hepatic glucose production and
increase insulin-mediated peripheral glucose uptake.increase insulin-mediated peripheral glucose uptake. EfficacyEfficacy
Decrease fasting plasma glucose 3.3-3.9 mmol/LDecrease fasting plasma glucose 3.3-3.9 mmol/L Reduce A1C 1.0-2.0%Reduce A1C 1.0-2.0%
Other EffectsOther Effects Diarrhea and abdominal discomfortDiarrhea and abdominal discomfort Risk of Lactic acidosis in those at risk (renal failure, CHF)Risk of Lactic acidosis in those at risk (renal failure, CHF) Cause small decrease in LDL cholesterol level and triglyceridesCause small decrease in LDL cholesterol level and triglycerides No specific effect on blood pressureNo specific effect on blood pressure No weight gain, with possible modest weight lossNo weight gain, with possible modest weight loss Contraindicated in patients with impaired renal function Contraindicated in patients with impaired renal function
(eGFR<33 ml/min)(eGFR<33 ml/min) Medications in this Class: metformin (Glucophage), Medications in this Class: metformin (Glucophage),
metformin hydrochloride extended release metformin hydrochloride extended release (Glumetza)(Glumetza)
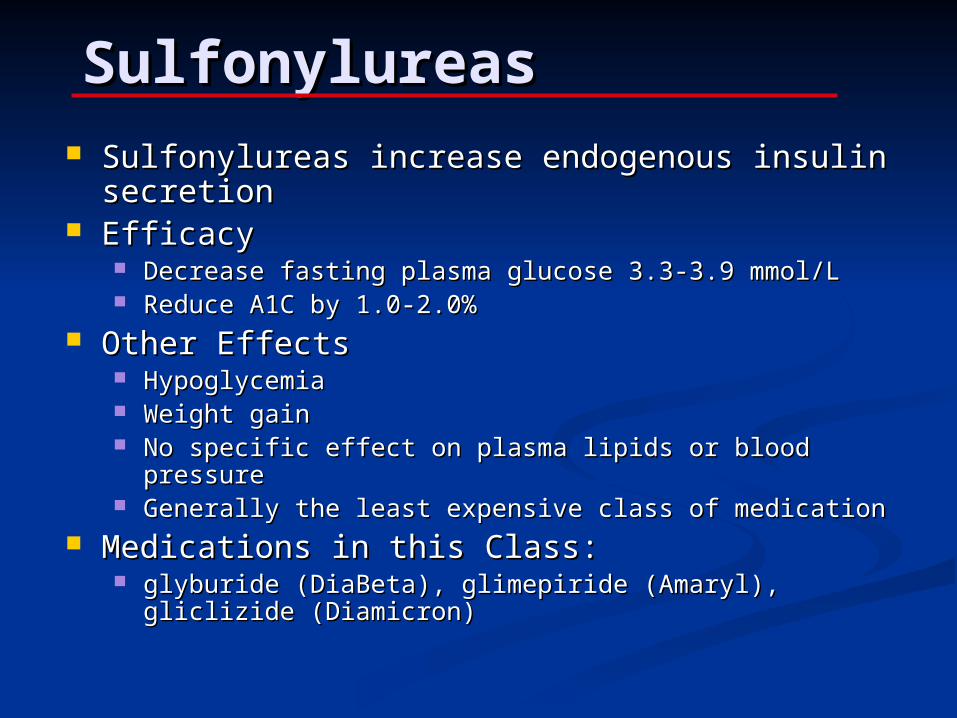
SulfonylureasSulfonylureas Sulfonylureas increase endogenous insulin Sulfonylureas increase endogenous insulin
secretionsecretion EfficacyEfficacy
Decrease fasting plasma glucose 3.3-3.9 mmol/LDecrease fasting plasma glucose 3.3-3.9 mmol/L Reduce A1C by 1.0-2.0%Reduce A1C by 1.0-2.0%
Other EffectsOther Effects HypoglycemiaHypoglycemia Weight gain Weight gain No specific effect on plasma lipids or blood pressureNo specific effect on plasma lipids or blood pressure Generally the least expensive class of medicationGenerally the least expensive class of medication
Medications in this Class:Medications in this Class: glyburide (DiaBeta), glimepiride (Amaryl), gliclizide glyburide (DiaBeta), glimepiride (Amaryl), gliclizide
(Diamicron)(Diamicron)

MeglitinidesMeglitinides Meglitinides stimulate insulin secretion Meglitinides stimulate insulin secretion
(rapidly and for a short duration) in the (rapidly and for a short duration) in the presence of glucose.presence of glucose.
EfficacyEfficacy Decreases peak postprandial glucoseDecreases peak postprandial glucose Decreases plasma glucose 3.3-3.9 mmol/LDecreases plasma glucose 3.3-3.9 mmol/L Reduce A1C 1.0-2.0%Reduce A1C 1.0-2.0%
Other EffectsOther Effects Hypoglycemia (although may be less than with Hypoglycemia (although may be less than with
sulfonylureas if patient has a variable eating schedule)sulfonylureas if patient has a variable eating schedule) Weight gain Weight gain No significant effect on plasma lipid levelsNo significant effect on plasma lipid levels Safe at higher levels of serum Cr than sulfonylureasSafe at higher levels of serum Cr than sulfonylureas
Medications in this Class: repaglinide Medications in this Class: repaglinide (Gluconorm), nateglinide (Starlix)(Gluconorm), nateglinide (Starlix)

Alpha-glucosidase Alpha-glucosidase InhibitorsInhibitors Alpha-glucosidase inhibitors block the Alpha-glucosidase inhibitors block the
enzymes that digest starches in the small enzymes that digest starches in the small intestineintestine
EfficacyEfficacy Decrease peak postprandial glucose 2.2-2.8 mmol/LDecrease peak postprandial glucose 2.2-2.8 mmol/L Decrease fasting plasma glucose 1.4-1.7 mmol/LDecrease fasting plasma glucose 1.4-1.7 mmol/L Decrease A1C 0.5-1.0%Decrease A1C 0.5-1.0%
Other EffectsOther Effects Flatulence or abdominal discomfort Flatulence or abdominal discomfort No specific effect on lipids or blood pressureNo specific effect on lipids or blood pressure No weight gainNo weight gain Contraindicated in patients with inflammatory bowel Contraindicated in patients with inflammatory bowel
disease or cirrhosisdisease or cirrhosis Medications in this Class: acarbose Medications in this Class: acarbose
(Glucobay)(Glucobay)

Treatment of Type 2 Treatment of Type 2 DiabetesDiabetes
DiagnosisDiagnosis
Therapeutic Lifestyle ChangeTherapeutic Lifestyle Change
Combination Therapy - Oral Drug with InsulinCombination Therapy - Oral Drug with Insulin
Combination Therapy - Oral Drugs OnlyCombination Therapy - Oral Drugs Only
MonotherapyMonotherapy

Insulin TherapyInsulin Therapy

Normal Pancreatic Normal Pancreatic FunctionFunction
Meal Meal Meal
Bolus: At mealtime, insulin is rapidly released
in response to food.
Basal: Beta cells secrete small amounts of insulinthroughout the day.
Basal Insulin
Bolus Insulin
• Expected insulin changes during the day Expected insulin changes during the day for individuals with a healthy pancreasfor individuals with a healthy pancreas..
*Insulin effect images are theoretical representations and are not derived from clinical trial data.

Action Profiles of Bolus Action Profiles of Bolus & Basal Insulins& Basal Insulins
Pla
sm
a In
sulin
lev
els
HoursNote: action curves are approximations for illustrative purposes. Actual patient response will vary.
regular 6-10 hours
NPH 12–20 hours
lispro/aspart 4–6 hours
BASAL INSULINS
detemir ~ 6-23 hours (dose dependant)
glargine ~ 20-26 hours
Mayfield, JA.. et al, Amer. Fam. Phys.; Aug. 2004, 70(3): 491 Plank, J. et.al. Diabetes Care, May 2005; 28(5): 1107-12
BOLUS INSULINS

• Expected insulin changes during the day Expected insulin changes during the day • for individuals with a healthy pancreas.for individuals with a healthy pancreas.
*Insulin effect images are theoretical representations and are not derived from clinical trial data
Mayfield, JA. et al., Amer. Fam. Phys.; Aug. 2004, 70(3): 489-500
BID NPH and Regular BID NPH and Regular Insulin Therapy - Insulin Therapy -
Compared to Normal Compared to Normal PhysiologyPhysiology
Bolus needs: Regular
Basal needs: NPH
Meal Meal Meal

• Expected insulin changes during the day Expected insulin changes during the day • for individuals with a healthy pancreas.for individuals with a healthy pancreas.
*Insulin effect images are theoretical representations and are not derived from clinical trial data.
Multiple Daily Injections Multiple Daily Injections (MDI) – (MDI) –
Strive to Mimic Normal Strive to Mimic Normal PhysiologyPhysiology
MDI insulin therapy addresses:
Bolus needs: Lispro, Aspart Basal needs: Glargine, Detemir
Meal Meal Meal

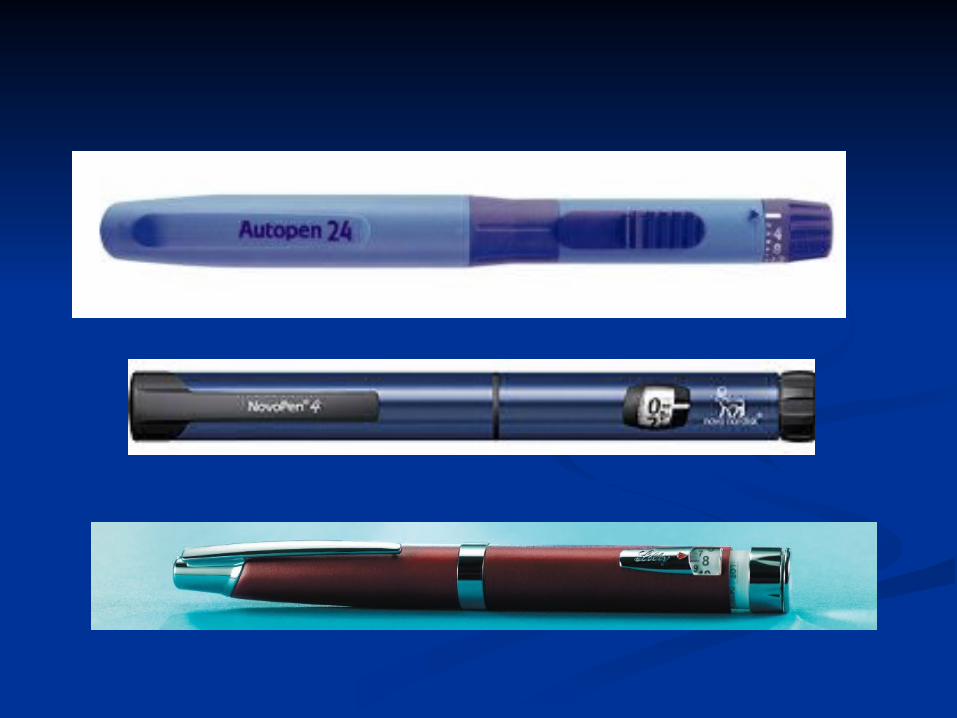
Insulin RegimensInsulin RegimensType 2Type 2
Usually – a single bedtime injection Usually – a single bedtime injection of basal insulin added to OAD. of basal insulin added to OAD.
Occasionally - twice daily injections Occasionally - twice daily injections of basal insulin with OAD.of basal insulin with OAD.
Twice daily injection of “pre-mixed” Twice daily injection of “pre-mixed” insulin (split mix without mixing).insulin (split mix without mixing).
Intensive insulin – basal/bolusIntensive insulin – basal/bolus 40% basal/20% mealtime with each meal40% basal/20% mealtime with each meal

Case 1Case 1
Breakfast Lunch Dinner Bedtime
9.5 7.5 7.1 7.0
Is this patient well controlled? Does this patient require insulin?
55 year old, 84 kg, BMI 29, T2DM 5 yrs, A1C = 8.5% 55 year old, 84 kg, BMI 29, T2DM 5 yrs, A1C = 8.5% On metformin, glyburide, On metformin, glyburide,

Case 1 - Bedtime InsulinCase 1 - Bedtime Insulin
Breakfast Lunch Dinner Bedtime
Start with 10 units1, or use 0.1- 0.2 units/kg and titrate2 Ex. 84 kg X 0.1 = 8 units OR 84 kg X 0.2 = 17 units Continue metformin, glyburide. Continuing TZD would be
off-label in Canada
NPH, Glargine or Detemir - 10 units
55 year old, 84 kg, BMI 29, T2DM 5 yrs, A1C = 55 year old, 84 kg, BMI 29, T2DM 5 yrs, A1C = 8.5% 8.5% On metformin, glyburide, On metformin, glyburide,
- - -
1 Riddle et.al., Diabetes Care, 2003, 26(11):3080-862 CDA 2003 CPG, Can J Diabetes 27(Suppl 2):S135

Hypoglycemia – Hypoglycemia – RecognitionRecognition
Hypoglycemia = development of symptoms or a plasma Hypoglycemia = development of symptoms or a plasma glucose <4.0 mmol/L.glucose <4.0 mmol/L.
Symptoms of hypoglycemiaSymptoms of hypoglycemia
AutonomicAutonomic NeuroglycopenicNeuroglycopenicTremblingTremblingPalpitationsPalpitationsSweatingSweatingAnxietyAnxiety
HungerHungerNauseaNauseaTinglingTingling
Difficulty Difficulty concentrating concentrating Vision changesVision changesDifficulty speakingDifficulty speakingHeadacheHeadacheDizzinessDizziness
ConfusionConfusionWeaknessWeaknessDrowsinessDrowsinessTirednessTiredness
Severity of hypoglycemiaSeverity of hypoglycemiaMild: Mild: Autonomic symptoms are present. The individual is Autonomic symptoms are present. The individual is able to self-treat.able to self-treat.Moderate: Moderate: Autonomic and neuroglycopenic symptoms are Autonomic and neuroglycopenic symptoms are present. The individual is able to self-treat.present. The individual is able to self-treat.Severe: Severe: Individual requires assistance of another person. Individual requires assistance of another person. Unconsciousness may occur. Plasma glucose is typically Unconsciousness may occur. Plasma glucose is typically <2.8 mmol/L. <2.8 mmol/L.
CDA 2003 CPG, Can J Diabetes 27(Suppl 2):S43

Diabetic Diabetic ketoacidosisketoacidosis

Diagnostic criteriaDiagnostic criteria
HyperglycemiaHyperglycemia Glucose >11.1 mmol/l; usually > 15 mmol/lGlucose >11.1 mmol/l; usually > 15 mmol/l
metabolic acidosis (increased anion gap)metabolic acidosis (increased anion gap) pH < 7.35pH < 7.35 decreased bicarbonate <15 (best estimation decreased bicarbonate <15 (best estimation
with venous)with venous) positive serum ketonespositive serum ketones
Urine ketones: may be absent in early stagesUrine ketones: may be absent in early stages

Insulin deficiencyInsulin deficiency
Decreased peripheral glucose Decreased peripheral glucose utilizationutilization
increased glucose productionincreased glucose production liver - gluconeogenesis (from liver - gluconeogenesis (from
aminoacids, glycerol), glycogenolysisaminoacids, glycerol), glycogenolysis increased ketogenesisincreased ketogenesis
increased lipolysis in adipocytes - increased lipolysis in adipocytes - provides free fatty acids for ketones and provides free fatty acids for ketones and glycerol for gluconeogenesisglycerol for gluconeogenesis


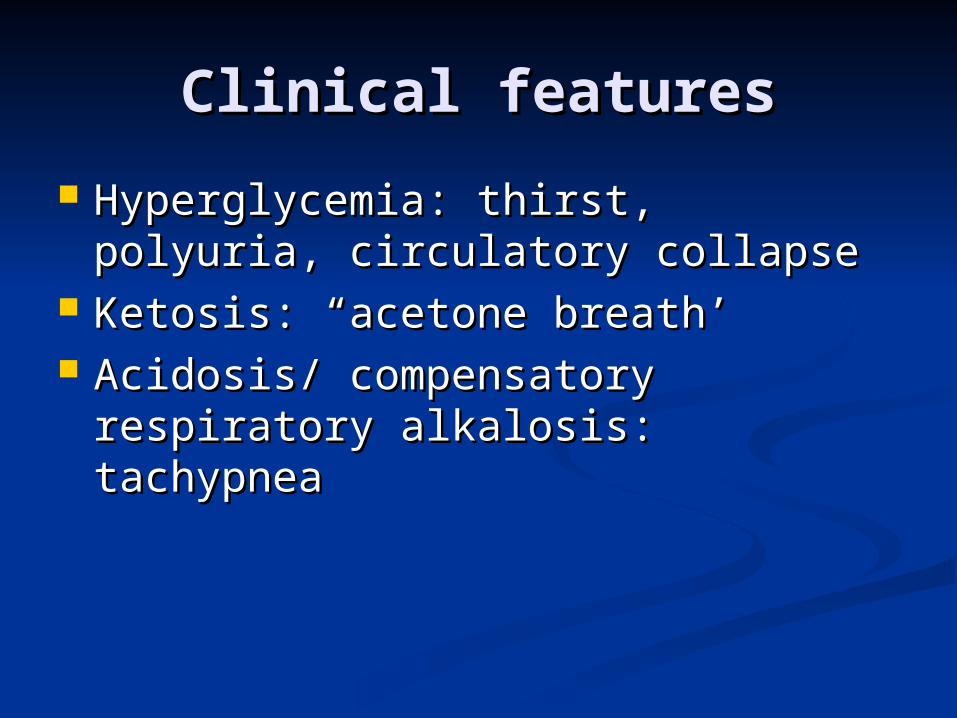
Clinical featuresClinical features
Hyperglycemia: thirst, polyuria, Hyperglycemia: thirst, polyuria, circulatory collapsecirculatory collapse
Ketosis: “acetone breath’Ketosis: “acetone breath’ Acidosis/ compensatory respiratory Acidosis/ compensatory respiratory
alkalosis: tachypneaalkalosis: tachypnea

DKA: Precipitating Causes

Consequences of DKAConsequences of DKA
HyperglycemiaHyperglycemia osmotic diuresisosmotic diuresis
dehydrationdehydration loss of K, Na, HCO3 in urineloss of K, Na, HCO3 in urine
hyperosmolar state hyperosmolar state increase free water into blood increase free water into blood hyponatremia, hyponatremia,
cerebral dehydration cerebral dehydration decreased level of decreased level of consciousnessconsciousness
acidosisacidosis compensatory respiratory alkalosiscompensatory respiratory alkalosis K shifts (hyperkalemia)K shifts (hyperkalemia)

Laboratory Calculations Laboratory Calculations for diagnosis and for diagnosis and
treatmenttreatment Serum osmolalitySerum osmolality 2(Na + K) + glucose +BUN2(Na + K) + glucose +BUN
serum Naserum Na for each 3-4 mmol/l increase in glucose, Na for each 3-4 mmol/l increase in glucose, Na
should decrease by 1should decrease by 1 anion gapanion gap
Na -(Cl+HCO3)Na -(Cl+HCO3) compensation for metabolic acidosiscompensation for metabolic acidosis If suspect other causes for acidosis; If suspect other causes for acidosis;
meausre serum lactate and salicylatemeausre serum lactate and salicylate

TreatmentTreatment
GOAL: GOAL: replace volume loss (with normal replace volume loss (with normal
saline)saline) stop ketone production (with insulin)stop ketone production (with insulin) replace K loss (K initially high but falls replace K loss (K initially high but falls
rapidly with treatment)rapidly with treatment) lower serum glucoselower serum glucose
**Need to correct INSULIN DEFICIENCYNeed to correct INSULIN DEFICIENCY
*Look for precipitating cause and treat*Look for precipitating cause and treat

FluidFluid NS 1L per hour first 2 hours, then 1L over 4 hrsNS 1L per hour first 2 hours, then 1L over 4 hrs NS until glucose < 15 NS until glucose < 15 then D5/NS or D5 depending if still replacing then D5/NS or D5 depending if still replacing
volumevolume insulininsulin
intravenousintravenous 50 units regular in 500 normal saline (0.1U/ml)50 units regular in 500 normal saline (0.1U/ml) Bolus 0.1 unit per kg body weight (IM/IV)Bolus 0.1 unit per kg body weight (IM/IV) Infusion 0.1 unit/kg/hourInfusion 0.1 unit/kg/hour Glucoscans q1h, adjust IV rate and IV D5Glucoscans q1h, adjust IV rate and IV D5* Do not stop insulin infusion until acidosis/ AG * Do not stop insulin infusion until acidosis/ AG
correctedcorrected bicarbonate generally avoidedbicarbonate generally avoided potassiumpotassium
start when K 3.3-5.5, 20 mmol/L (hold insulin if K start when K 3.3-5.5, 20 mmol/L (hold insulin if K is <3.3 and give 40 meq/his <3.3 and give 40 meq/h

Hyperosmolar non-Hyperosmolar non-ketotic stateketotic state
Severe hyperglycemia generally in DM Severe hyperglycemia generally in DM type 2type 2
dehydrationdehydration serum hyperosmolalityserum hyperosmolality lack of significant ketosis (still some lack of significant ketosis (still some
circulating insulin)circulating insulin)
* takes less insulin to prevent ketosis than * takes less insulin to prevent ketosis than to stop hyperglycemiato stop hyperglycemia

Stressor - increased insulin Stressor - increased insulin resistanceresistance
relative insulin deficiencyrelative insulin deficiency increased glucose production, increased glucose production,
decreased utilizationdecreased utilization reduced renal excretion of glucose reduced renal excretion of glucose
secondary to renal disease, aging secondary to renal disease, aging kidneyskidneys

Treatment of HONKTreatment of HONK
Correct increased serum osmolality Correct increased serum osmolality Blood glucose will fall in response to Blood glucose will fall in response to
fluid repletionfluid repletion If Na>155 mmol/L, start 0.45% NS If Na>155 mmol/L, start 0.45% NS
as initial fluidas initial fluid Insulin infusion only if persistent Insulin infusion only if persistent
hyperglycemia after fluid repletehyperglycemia after fluid replete

Screening and prevention of Screening and prevention of complicationscomplications
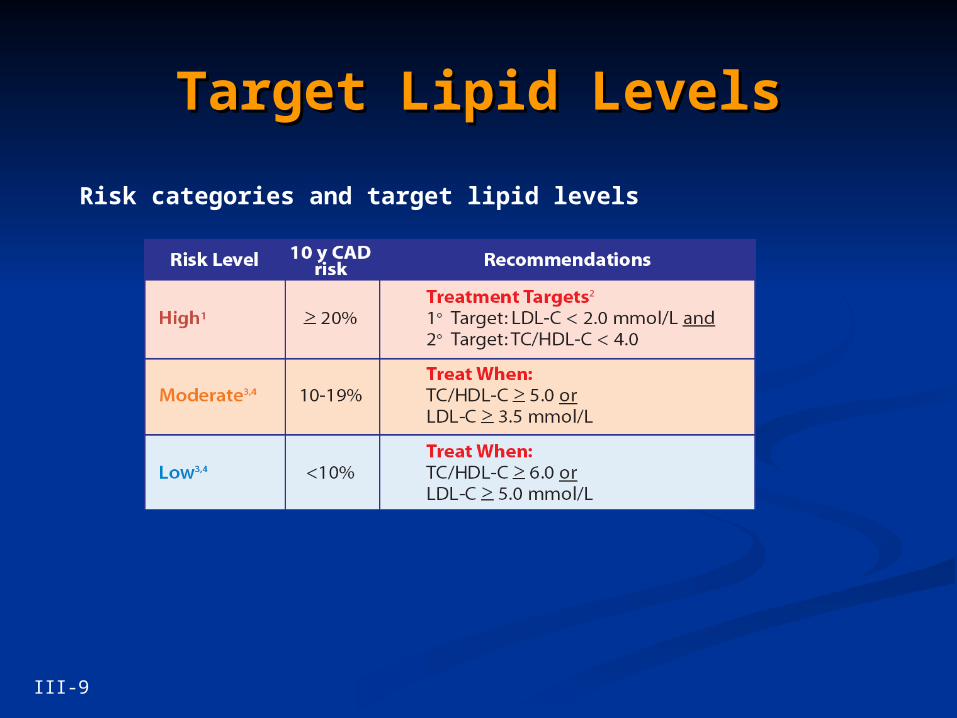
Target Lipid LevelsTarget Lipid Levels
Risk categories and target lipid levels
III-9

Reduce LDL-C to target for high risk patients Reduce LDL-C to target for high risk patients (< 2.0 mmol/L)(< 2.0 mmol/L)
Combinations of lipid-lowering medications can Combinations of lipid-lowering medications can and should be used to achieve lipid targetsand should be used to achieve lipid targets
Statin + cholesterol absorption inhibitorsStatin + cholesterol absorption inhibitors
Statin + fibratesStatin + fibrates
Statin + niacinStatin + niacin
Cholesterol absorption inhibitors + fibratesCholesterol absorption inhibitors + fibrates
Treatment optionsTreatment options

Vascular Protection Through Vascular Protection Through a a
Multifaceted ApproachMultifaceted Approach For ALL High-risk Patients with Diabetes • ACEI• ASA (clopidogrel if intolerance)• Lifestyle management: No smoking, healthy diet / weight, physical activity
Blood Pressure Control
Aim for BP < 130/80 mm Hg
If BP >130/80 mm Hg despite ACEI:Treat as per hypertension recommendations (CHEP/CHS)
Glycemic Control
Aim for A1C < 7.0%(< 6.0% if achievable safely)
If AIC > 7%: Treat as per glycemiarecommendations (CDA)
High CV risk
Renal Protection•Treat as per nephropathy recommendations (CDA)
Lipid Control
Adapted from Can J Diabetes. 2003;27:S58-S65.
When monotherapy fails to achieve lipid targets, the addition of a second drug from another class should be considered
Aim forLDL ≤ 2.0 andTC:HDL < 4.0

Smoking Cessation advice.

Diabetic Diabetic NephropathyNephropathy

Diabetic NephropathyDiabetic Nephropathy Over 40% of new cases of Over 40% of new cases of
end-stage renal disease end-stage renal disease (ESRD) are attributed to (ESRD) are attributed to diabetes. diabetes.
In 2001, 41,312 people In 2001, 41,312 people with diabetes began with diabetes began treatment for end-stage treatment for end-stage renal disease in U.S.renal disease in U.S.
In 2001, it cost $22.8 In 2001, it cost $22.8 billion in public and billion in public and private funds to treat private funds to treat patients with kidney patients with kidney failure.failure.
Minorities experience Minorities experience higher than average rates higher than average rates of nephropathy and kidney of nephropathy and kidney diseasedisease
Incidence of ESRD Resulting from Primary
Diseases (1998)
43%
23%
12%
3%
19%
Diabetes
Hypertension
Glomerulonephritis
Cystic Kidney
Other Causes

Screening for Diabetic Screening for Diabetic NephropathyNephropathy
Test When Normal Range
Blood Pressure1
Each office visit <130/80 mm/Hg
Urinary Albumin1
Type 2: Annually beginning at diagnosis Type 1: Annually, 5-years post-diagnosis
<30 mg/day 30 g/mgcreatinine
1American Diabetes Association: Nephropathy in Diabetes (Position Statement). Diabetes Care 27 (Suppl.1): S79-S83, 2004
ACR </= 2.8 for womenACR </= 2.0 for men

Treatment of Diabetic Treatment of Diabetic NephropathyNephropathy
Hypertension Control -Hypertension Control - Goal: lower Goal: lower blood pressure to <130/80 mmHg blood pressure to <130/80 mmHg Antihypertensive agentsAntihypertensive agents
Angiotensin-converting enzyme (ACE) Angiotensin-converting enzyme (ACE) inhibitorsinhibitors
captopril, enalapril, lisinopril, benazepril, captopril, enalapril, lisinopril, benazepril, fosinopril, ramipril, quinapril, perindopril, fosinopril, ramipril, quinapril, perindopril, trandolapril, moexipriltrandolapril, moexipril
Angiotensin receptor blocker (ARB) therapy Angiotensin receptor blocker (ARB) therapy candesartan cilexetil, irbesartan, losartan candesartan cilexetil, irbesartan, losartan
potassium, telmisartan, valsartan, esprosartan potassium, telmisartan, valsartan, esprosartan
Beta-blockersBeta-blockers
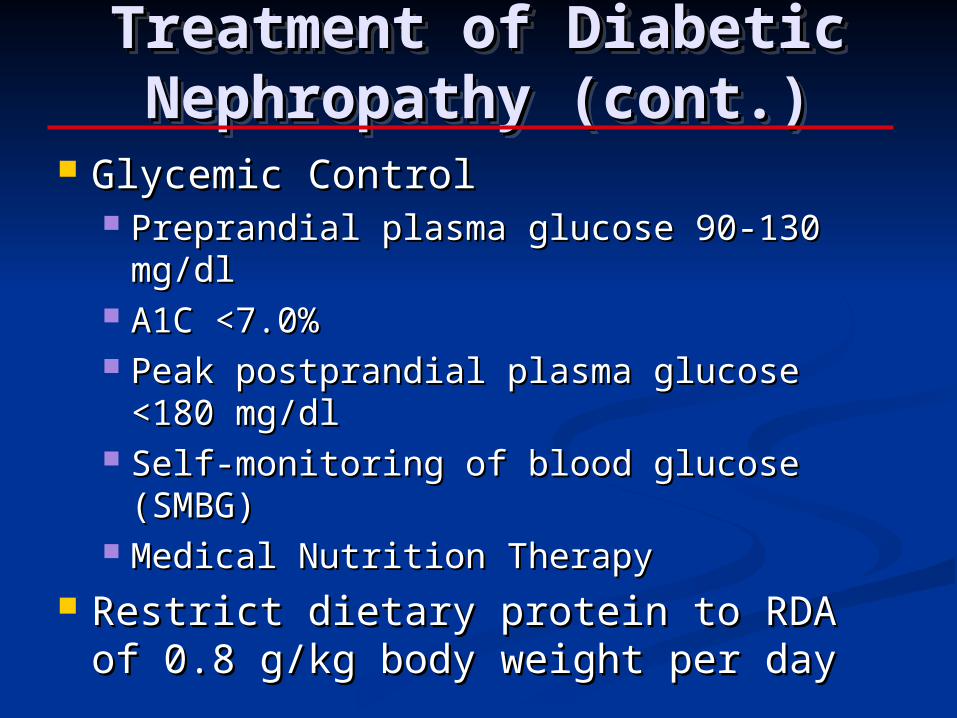
Glycemic Control Glycemic Control Preprandial plasma glucose 90-130 mg/dlPreprandial plasma glucose 90-130 mg/dl A1C <7.0%A1C <7.0% Peak postprandial plasma glucose <180 Peak postprandial plasma glucose <180
mg/dlmg/dl Self-monitoring of blood glucose (SMBG)Self-monitoring of blood glucose (SMBG) Medical Nutrition TherapyMedical Nutrition Therapy
Restrict dietary protein to RDA of 0.8 Restrict dietary protein to RDA of 0.8 g/kg body weight per day g/kg body weight per day
Treatment of Diabetic Treatment of Diabetic Nephropathy (cont.)Nephropathy (cont.)
Treatment of Diabetic Treatment of Diabetic Nephropathy (cont.)Nephropathy (cont.)

Treatment of End-Stage Treatment of End-Stage Renal Disease (ESRD)Renal Disease (ESRD)
There are three primary treatment There are three primary treatment options for individuals who options for individuals who experience ESRD:experience ESRD:
1. Hemodialysis1. Hemodialysis
2. Peritoneal Dialysis2. Peritoneal Dialysis
3. Kidney Transplantation3. Kidney Transplantation

How Can You Prevent How Can You Prevent Diabetic Kidney Diabetic Kidney
Disease?Disease? Maintain blood pressure <130/80 Maintain blood pressure <130/80
mm/Hgmm/Hg Maintain preprandial plasma glucose 4-Maintain preprandial plasma glucose 4-
7 mmol/L7 mmol/L Maintain postprandial plasma glucose Maintain postprandial plasma glucose
<10 mmol/L<10 mmol/L Maintain A1C <7.0%Maintain A1C <7.0% Use ACE inhib or ARB if ACR is Use ACE inhib or ARB if ACR is
elevated even if normotensiveelevated even if normotensive Use antiplatelet therapyUse antiplatelet therapy

Diabetic Diabetic RetinopathyRetinopathy

Diabetic RetinopathyDiabetic Retinopathy
• Diabetic retinopathy is the most common cause of new cases of blindness among adults 20-74 years of age.
• During the first two decades of disease, nearly all patients with type 1 diabetes and over 60% of patients with type 2 diabetes have retinopathy

Risks of Diabetic Risks of Diabetic Retinopathy Related Retinopathy Related
Vision LossVision Loss Duration of diabetes diseaseDuration of diabetes disease type 1 patients experience a 25% rate of type 1 patients experience a 25% rate of
retinopathy after 5 years of disease, and 80% at retinopathy after 5 years of disease, and 80% at 15 years of disease15 years of disease11
Up to 21% of newly diagnosed type 2 patients Up to 21% of newly diagnosed type 2 patients have some degree of retinopathy at time of have some degree of retinopathy at time of diagnosisdiagnosis11
PubertyPuberty PregnancyPregnancy Lack of appropriate ophthalmic examinationLack of appropriate ophthalmic examination
1American Diabetes Association: Retinopathy in Diabetes (Position Statement). Diabetes Care 27 (Suppl.1): S84-S87, 2004

Retinopathy ScreeningRetinopathy Screening Type 1 diabetes - screen within 3-5 Type 1 diabetes - screen within 3-5
years of diagnosis after age 10years of diagnosis after age 1011
Type 2 diabetes - screen at time of Type 2 diabetes - screen at time of diagnosisdiagnosis11
Pregnancy - women with preexisting Pregnancy - women with preexisting diabetes should be screened prior to diabetes should be screened prior to conception and during first trimesterconception and during first trimester11
Follow-up annually; less frequent Follow-up annually; less frequent exams (2-3 yrs) may be consideredexams (2-3 yrs) may be considered11
Examination Methods - Dilated indirect Examination Methods - Dilated indirect ophthalmoscopy coupled with ophthalmoscopy coupled with biomicroscopy and seven-standard field biomicroscopy and seven-standard field steroscopic 30° fundus photographysteroscopic 30° fundus photography11
1American Diabetes Association: Retinopathy in Diabetes (Position Statement). Diabetes Care 27 (Suppl.1): S84-S87, 2004

Natural History of Natural History of Diabetic RetinopathyDiabetic Retinopathy
Mild nonproliferative Mild nonproliferative diabetic retinopathy diabetic retinopathy (NPDR)(NPDR)
Moderate NPDRModerate NPDR Severe NPDRSevere NPDR Very Severe NPDRVery Severe NPDR Proliferative diabetic Proliferative diabetic
retinopathy (PDR)retinopathy (PDR)

Diabetic Diabetic ketoacidosisketoacidosis

Diagnostic criteriaDiagnostic criteria
HyperglycemiaHyperglycemia Glucose >11.1 mmol/l; usually > 15 mmol/lGlucose >11.1 mmol/l; usually > 15 mmol/l
metabolic acidosis (increased anion gap)metabolic acidosis (increased anion gap) pH < 7.35pH < 7.35 decreased bicarbonate <15 (best estimation decreased bicarbonate <15 (best estimation
with venous)with venous) positive serum ketonespositive serum ketones
Urine ketones: may be absent in early stagesUrine ketones: may be absent in early stages

Insulin deficiencyInsulin deficiency
Decreased peripheral glucose Decreased peripheral glucose utilizationutilization
increased glucose productionincreased glucose production liver - gluconeogenesis (from liver - gluconeogenesis (from
aminoacids, glycerol), glycogenolysisaminoacids, glycerol), glycogenolysis increased ketogenesisincreased ketogenesis
increased lipolysis in adipocytes - increased lipolysis in adipocytes - provides free fatty acids for ketones and provides free fatty acids for ketones and glycerol for gluconeogenesisglycerol for gluconeogenesis


Clinical featuresClinical features
Hyperglycemia: thirst, polyuria, Hyperglycemia: thirst, polyuria, circulatory collapsecirculatory collapse
Ketosis: “acetone breath’Ketosis: “acetone breath’ Acidosis/ compensatory respiratory Acidosis/ compensatory respiratory
alkalosis: tachypneaalkalosis: tachypnea

DKA: Precipitating Causes

Consequences of DKAConsequences of DKA
HyperglycemiaHyperglycemia osmotic diuresisosmotic diuresis
dehydrationdehydration loss of K, Na, HCO3 in urineloss of K, Na, HCO3 in urine
hyperosmolar state hyperosmolar state increase free water into blood increase free water into blood hyponatremia, hyponatremia,
cerebral dehydration cerebral dehydration decreased level of decreased level of consciousnessconsciousness
acidosisacidosis compensatory respiratory alkalosiscompensatory respiratory alkalosis K shifts (hyperkalemia)K shifts (hyperkalemia)

Laboratory Calculations Laboratory Calculations for diagnosis and for diagnosis and
treatmenttreatment Serum osmolalitySerum osmolality 2(Na + K) + glucose +BUN2(Na + K) + glucose +BUN
serum Naserum Na for each 3-4 mmol/l increase in glucose, Na for each 3-4 mmol/l increase in glucose, Na
should decrease by 1should decrease by 1 anion gapanion gap
Na -(Cl+HCO3)Na -(Cl+HCO3) compensation for metabolic acidosiscompensation for metabolic acidosis If suspect other causes for acidosis; If suspect other causes for acidosis;
meausre serum lactate and salicylatemeausre serum lactate and salicylate

TreatmentTreatment
GOAL: GOAL: replace volume lossreplace volume loss stop ketone productionstop ketone production replace K loss (K initially high but falls replace K loss (K initially high but falls
rapidly with treatment)rapidly with treatment) lower serum glucoselower serum glucose
**Need to correct INSULIN DEFICIENCYNeed to correct INSULIN DEFICIENCY
*Look for precipitating cause and treat*Look for precipitating cause and treat

FluidFluid NS 1L per hour first 2 hours, then 1L over 4 hrsNS 1L per hour first 2 hours, then 1L over 4 hrs NS until glucose < 15 NS until glucose < 15 then D5/NS or D5 depending if still replacing then D5/NS or D5 depending if still replacing
volumevolume insulininsulin
intravenousintravenous 50 units regular in 500 normal saline (0.1U/ml)50 units regular in 500 normal saline (0.1U/ml) Bolus 0.1 unit per kg body weight (IM/IV)Bolus 0.1 unit per kg body weight (IM/IV) Infusion 0.1 unit/kg/hourInfusion 0.1 unit/kg/hour Glucoscans q1h, adjust IV rate and IV D5Glucoscans q1h, adjust IV rate and IV D5* Do not stop insulin infusion until acidosis/ AG * Do not stop insulin infusion until acidosis/ AG
correctedcorrected bicarbonate generally avoidedbicarbonate generally avoided potassiumpotassium
start when K 4.5-5.0, 20 mmol/Lstart when K 4.5-5.0, 20 mmol/L
Hyperosmolar non-Hyperosmolar non-ketotic stateketotic state
Severe hyperglycemia generally in DM Severe hyperglycemia generally in DM type 2type 2
dehydrationdehydration serum hyperosmolalityserum hyperosmolality lack of significant ketosis (still some lack of significant ketosis (still some
circulating insulin)circulating insulin)
* takes less insulin to prevent ketosis than * takes less insulin to prevent ketosis than to stop hyperglycemiato stop hyperglycemia

Stressor - increased insulin Stressor - increased insulin resistanceresistance
relative insulin deficiencyrelative insulin deficiency increased glucose production, increased glucose production,
decreased utilizationdecreased utilization reduced renal excretion of glucose reduced renal excretion of glucose
secondary to renal disease, aging secondary to renal disease, aging kidneyskidneys

Treatment of HONKTreatment of HONK
Correct increased serum osmolality Correct increased serum osmolality Blood glucose will fall in response to Blood glucose will fall in response to
fluid repletionfluid repletion If Na>155 mmol/L, start 0.45% NS If Na>155 mmol/L, start 0.45% NS
as initial fluidas initial fluid Insulin infusion only if persistent Insulin infusion only if persistent
hyperglycemia after fluid repletehyperglycemia after fluid replete
