background concentrations of metals, a progress report
TRANSCRIPT

Background Concentrations of Metals,a Progress Report
Bruce Garbaccio, P.G.Engineering Geologist
Department of Toxic Substances ControlGeological Services Unit, Glendale


Background Data Sources
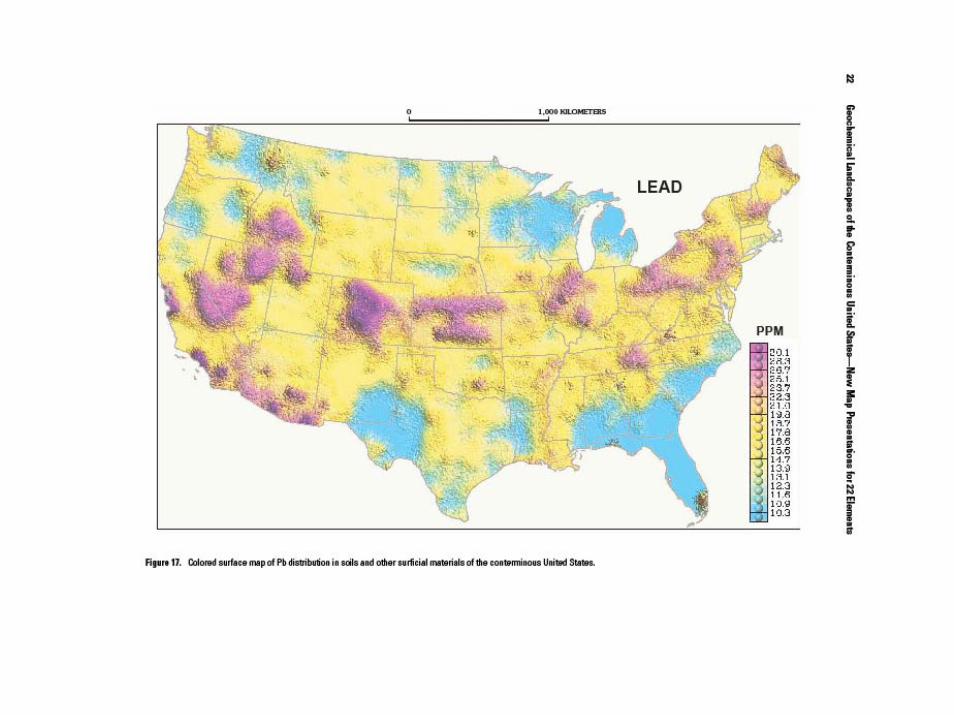
• United States USGS P 1648 (2001)
• California Kearney Report (1996)
• Los Angeles Basin LAUSD Arsenic Study
• Site Specific Data Sets

Background Data ConcentrationsCalifornia Statewide Los Angeles Basin
Sb 0.15 – 1.95 0.2 – 1.5(0.33 – 0.73)
As 0.6 – 11 1 - 6
Cd 0.05 – 1.70 0.2 – 1(0.15-0.44)
Pb 12.4 – 97.1 1 – 20(21 – 26.7)
Cr 23 – 1579 0 – 40(45 – 115)
Ni 9 – 509 0 – 40(21 – 56)
Zn 88 – 236 20 – 150(133-170)


Chromium Variation Los Angeles Area
0
5
10
15
20
25
30
35
40
45
0 2 4 6 8 10 12
Site
Con
cent
ratio
n (m
g/kg
)
SSL-497
Bell New Elem.
Jeff #1
Gabrieleno San Gab
Valle Lindo El Monte
Van Nuys NE #1
North H NE #3
Germain Chatsw orth
Arminta North H
Gratts
Cr concentrations at 10 LA Basin sites

Kearney Lead
0
2
4
6
8
10
12
14
16
5 10 15 20 25 30 35 40 45 50 55 60 65 70 75 80 85 90 95 100
Series1
Histogram of Pb concentrations in California soils

Cleanup Guidelines
Cal EPACHHSLResidential Industrial
USEPAPRG
Residential Industrial
LAUSD
Sb
As
30 380
0.07 0.24
30 750
0.38 3.0 6
Cd 1.7 7.5 37 930(Cal mod 9.0)
Cr
Pb
100,000
150 3,500
210 450
400 1000(Cal mod 130)
255
Ni 1,600 16,000
Zn 23,000 100,000

Anthropogenic Sources of Metals
• Pb lead based paint• Automobile exhaust• automobile batteries
• Cr Plating solutionsStainless steel scrap
• As pesticide/herbicide application


Common Geologic Associations
• Ultramafic Rocks Mg-Cr-Ni-Co-Cu-V
• Epithermal Gold Au-As-Sb-Hg
• Volcanogenic Massive Sulphide Cu-Zn-Pb
• K/Rb Ca/Sr Zn/Cd As/Sb


Positive correlation of Cr and Ni in soil
Statewide (Kearney) Cr vs Ni
0
50
100
150
200
250
300
350
400
450
0 10 20 30 40 50 60
Con
cent
ratio
n (m
g/kg
)
Ni
Cr

Epithermal Gold Deposits
0
500
1000
1500
2000
2500
0 2 4 6 8 10 12 14 16 18 20
Con
cent
ratio
n (m
g/kg
)
AsSb
As and Sb concentrations in Epithermal Gold Deposits

California (Kearney)
0
50
100
150
200
250
1 3 5 7 9 11 13 15 17 19 21 23 25 27 29 31 33 35 37 39 41 43 45 47 49
Con
cent
ratio
n (m
g/kg
)
Cd X 100Zn
Relationship of Cd with Increasing Zn in California Soils
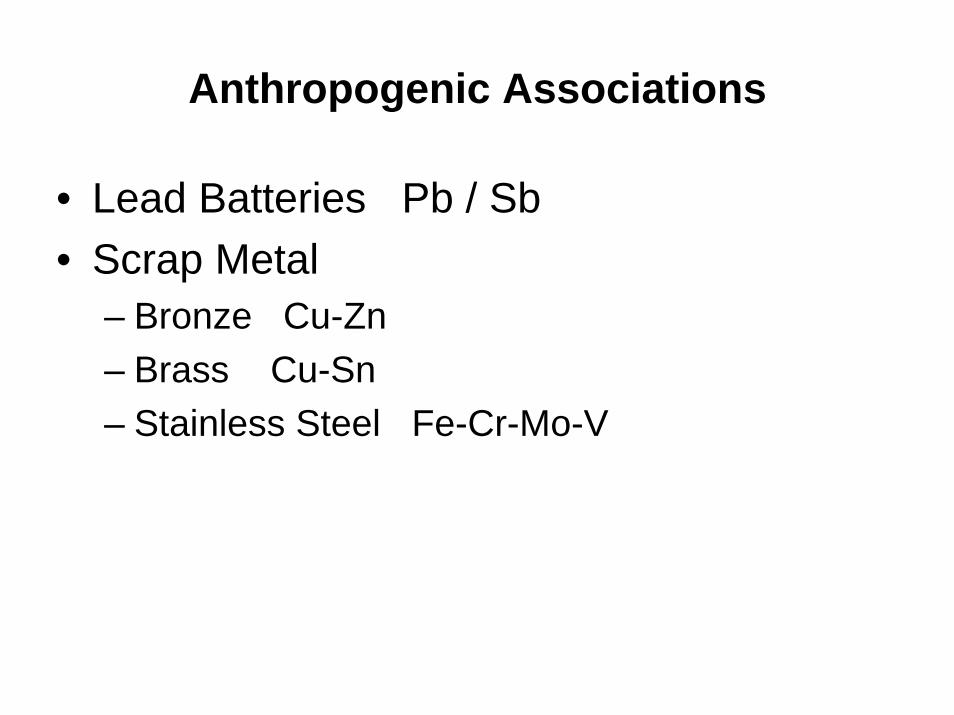
Anthropogenic Associations
• Lead Batteries Pb / Sb• Scrap Metal
– Bronze Cu-Zn– Brass Cu-Sn– Stainless Steel Fe-Cr-Mo-V
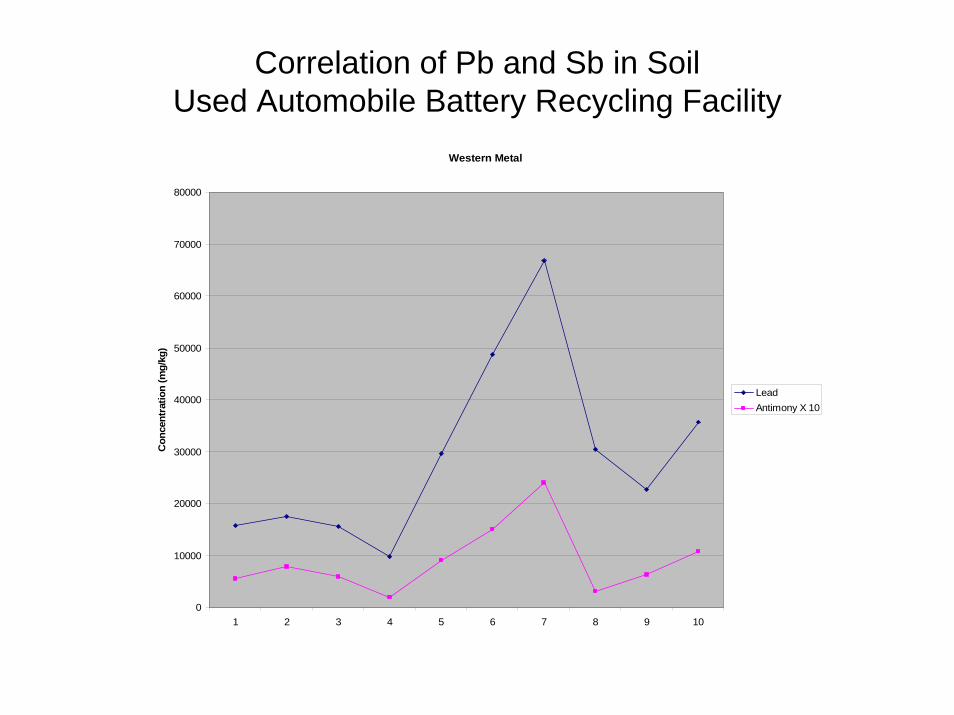
Western Metal
0
10000
20000
30000
40000
50000
60000
70000
80000
1 2 3 4 5 6 7 8 9 10
Con
cent
ratio
n (m
g/kg
)
LeadAntimony X 10
Correlation of Pb and Sb in SoilUsed Automobile Battery Recycling Facility

SELC South Gate Plating Shop
0
5000
10000
15000
20000
25000
30000
35000
40000
0 2 4 6 8 10 12 14 16
Con
cent
ratio
n (m
g/kg
)
Cr
Ni
Cr and Ni variation in soil, former plating shop,South Gate

SRHS 2 Railroad Easement 2
0
2
4
6
8
10
12
14
16
0 5 10 15 20 25
Con
cent
ratio
n (m
g/kg
)
Sb
As
As and Sb in soil, former railroad line,Los Angeles

Non-Point Sources
• Automobile Exhaust Pb
• Pesticide/Herbicide Application As

Los Angeles Area Lead Variation
0
20
40
60
80
100
120
140
160
0 1 2 3 4 5 6 7 8 9 10
Site
Con
cent
rtat
ion
(mg/
kg) SSL-497
Bell New Elem
Jeff #1
Valle Lindo El Monte
North H NE #3
Germain Chatsw orth
Arminta North H
Pb concentrations, surface and subsurface samples,Los Angeles Basin

Lead LA-SG-SF 5 foot data
0
5
10
15
20
25
0 1 2 3 4 5 6 7 8 9 10
Con
cent
ratio
n (m
g/kg
)
SSL-497
Bell New
Jeff #1
Gabrieleno
Van Nuys
North H
Germain
Arminta
Pb concentrations, 5-foot depthLos Angeles Basin

Summary
• Site Specific and Regional Geology may have an influence on metals concentrations
• Anthropogenic impacts may mask true background
• All data should be evaluated to help differentiate between geologic and anthropogenic associations

Questions and Comments