background concentrations of metals in soils from selected
TRANSCRIPT

Background Concentrations of Metals in Soils from Selected Regions in the State of Washington
By Kenneth C. Ames and Edmund A. Prych
U.S. GEOLOGICAL SURVEY
Water-Resources Investigations Report 95-4018
Prepared in cooperation withSTATE OF WASHINGTON DEPARTMENT OF ECOLOGY
Tacoma, Washington 1995

U.S. DEPARTMENT OF THE INTERIOR
BRUCE BABBITT, Secretary
U.S. GEOLOGICAL SURVEY
Gordon P. Eaton, Director
Any use of trade, product, or firm names is for descriptive purposes only and does not imply endorsement by the U.S. Geological Survey.
For additional information write to: Copies of this report may be purchased from:
District Chief U.S. Geological Survey U.S. Geological Survey Earth Science Information Center 1201 Pacific Avenue, Suite 600 Open-File Reports Section Tacoma, Washington 98402 Box 25286, MS 517
Denver Federal Center Denver, CO 80225

CONTENTS
Abstract 1
Introduction 1
Background 1
Purpose and scope 4
Acknowledgments 4
Study area and soil regions 4
Sampling design 4
Description of soils 10A ... ..........-......................................................................*..............--_ 1O-rV «» »«» » » »»» ........... £^j
\^ i\J
Region D - 11
jxG&ion s? j^ j^
Region G 11
P per inn T ______________________________________________________________________ 11JXwglUli J _ » ».»» _ _.» _ ^ ^
Region L 11
Region M 11
Region O ------------------------------------------------------------------------ 11
Region P - - 12
J\.egion K. -- -- - i
Region U - 12
Methods------------------------------------------------------------------------------------------------------- 12
Sample collection and processing 12
Laboratory methods 13
Analytical precision 14
Determination of background metals concentrations 14
Summary statistics 16
Frequency distributions of metals concentrations 17
Comparison of metal concentrations among regions 49
Kraskal-Wallistest - 49
Fisher's least significant difference test 50
Cluster analysis 50
Relations among metal concentrations 50
Relations among leachate 53
Relations between metal concentrations and other chemical and physical soil characteristics 53Summary and conclusions 54
References cited 56
Appendix A. Data tables 59
in

FIGURES
1. Map showing counties and major rivers of Washington State 3
2. Map showing location of sampled sites in selected soil regions of Washington State 5
3. Boxplots of concentrations of metals in soils of Washington State, determined by fivelaboratory methods 24
4-23. Maps showing the State of Washington, county boundaries, and:
4. Concentrations of silver determined by 5 analytical methods for 12 soil regions 28
5. Concentrations of aluminum determined by 5 analytical methods for 12 soil regions 29
6. Concentrations of arsenic determined by 5 analytical methods for 12 soil regions 30
7. Concentrations of barium determined by 5 analytical methods for 12 soil regions 31
8. Concentrations of beryllium determined by 5 analytical methods for 12 soil regions 32
9. Concentrations of cadmium determined by 5 analytical methods for 12 soil regions 33
10. Concentrations of chromium determined by 5 analytical methods for 12 soil regions 34
11. Concentrations of copper determined by 5 analytical methods for 12 soil regions 35
12. Concentrations of iron determined by 5 analytical methods for 12 soil regions 36
13. Concentrations of mercury determined by 5 analytical methods for 12 soil regions 37
14. Concentrations of manganese determined by 5 analytical methods for 12 soil regions 38
15. Concentrations of nickel determined by 5 analytical methods for 12 soil regions 39
16. Concentrations of lead determined by 5 analytical methods for 12 soil regions 40
17. Concentrations of antimony determined by 5 analytical methods for 12 soil regions 41
18. Concentrations of selenium determined by 5 analytical methods for 12 soil regions 42
19. Concentrations of thallium determined by 5 analytical methods for 12 soil regions 43
20. Concentrations of zinc determined by 5 analytical methods for 12 soil regions 4421. Particle-size distributions determined for 12 soil regions 45
22. Soil-solution pH determined by 2 analytical methods for 12 soil regions 4623. Carbon content determined for 12 soil regions 47
TABLES
1. Sampling locations and physical descriptions of soils in Washington 6
2. Reporting levels for metals in soils in Washington analyzed by different methods 9
3. Average differences between metals concentrations determined in duplicate soil samples 15
4. Summary statistics for concentrations of metals in soils in Washington as determinedby the total method 18
5. Summary statistics for concentrations of metals in soils in Washington as determinedby the total-recoverable method 20
6. Summary statistics for concentrations of metals in soils in Washington as determinedby the American Society for Testing and Materials method D3987-85 21
IV

TABLES-Continued
7. Summary statistics for concentrations of metals in soils in Washington as determinedby the Extraction Procedure Toxicity method 22
8. Summary statistics for concentrations of metals in soils in Washington as determinedby the Toxicity Characteristic Leaching Procedure 23
9. Frequency distributions of metals concentrations in soils in Washington determinedby the total and total-recoverable methods 48
10. Mean ranks of total and total-recoverable concentrations of selected metals in differentsoil regions in Washington 51
11. Correlation coefficients and regression statistics between total-recoverable concentrationsand total concentrations of selected metals in soils in Washington 52
12. Correlation coefficients between concentrations of selected metals determined by the totalmethod and organic carbon concentration and amount of silt and clay in soils in Washington 54
Al. Concentrations of metals in soils in Washington determined by the total method 60
A2. Concentrations of metals in soils in Washington determined by different laboratory methods 66 A3. Particle-size distribution of soil samples in Washington 100
A4. Miscellaneous characteristics of soil samples in Washington 102
CONVERSION FACTORS AND VERTICAL DATUM
Multiply By To obtain
inch (in.) 25.4 millimeter
foot (ft) 0.3048 meter
acre 0.4047 hectare
square mile (mi2) 2.590 square kilometer
Sea Level: In this report "sea level" refers to the National Geodetic Vertical Datum of 1929 (NGVD of I929)~a geodetic datum derived from a general adjustment of the first-order level nets of both the United States and Canada, formerly called Sea Level Datum of 1929.

Background Concentrations of Metals in Soils from Selected Regions in the State of Washington
By Kenneth C. Ames and Edmund A. Prych
ABSTRACT
Soil samples from 60 sites in the State of Washington were collected and analyzed to determine the magnitude and variability of background concentrations of metals in soils of the State. This study, done in cooperation with the Washington State Department of Ecology, was conducted because the data are needed to determine if, and to what degree, soils are contaminated at sites where contamina tion is suspected and to enable the application of consis tent clean-up guidelines that accurately reflect specific soil environments. Samples were collected from the predomi nant taxonomic soil series in 12 different regions that are representative of large areas of Washington. Individual sites were chosen in areas that were relatively undisturbed by human activities.
Concentrations of metals were determined by five different laboratory methods that used different extraction procedures to recover metals from samples for analysis. Concentrations of 43 metals were determined by a total method that uses strong acids to extract at least 95 percent of each metal from the sample. Concentrations of 16 met als were determined by a total-recoverable method that also uses strong acids but that extracts less of a metal than does the total method. Concentrations of 17 metals were also determined by 3 methods that used distilled water or a weak acid to leach metals that are bound to the soil. These methods are the American Society for Testing and Materi als method D3987-85, the Extraction Procedure Toxicity test, and the Toxicity Characteristic Leaching Procedure. Concentrations of metals determined by these methods were typically less than 1 percent of the concentrations
determined by the total method, and concentrations of most metals determined by these methods were less than the laboratory's minimum reporting levels.
The concentrations of metals in uncontaminated soils collected in Washington State varied by as much as 62-fold. However, concentrations of metals determined by the total method generally displayed less variability than values determined by the other laboratory methods. Concentrations of mercury determined by the total method and nickel determined by both the total and total-recover able methods displayed the greatest variability, followed by chromium and copper determined by the total-recover able method; all have arithmetic standard deviations greater than two-thirds of their respective arithmetic means. Concentrations of other metals, such as aluminum and barium determined by the total method, varied less; both have arithmetic standard deviations less than one-third of their respective means.
Most metals concentrations determined by either the total or the total-recoverable methods were found to be from log-normally distributed populations or were more nearly log-normally than normally distributed. However, concentrations of four metals determined by the total method and three metals determined by the total-recover able method were found to have been sampled from populations that were normally distributed.
The Kruskal-Wallis test indicated that metals con centrations determined by either the total or the total- recoverable methods were significantly different among the 12 regions, with the exceptions of total copper and total manganese concentrations. However, the Fisher's

Least Significant Difference test, used to locate differences among the 12 population means for each metal, indicated that total metals concentrations between many regions were not statistically distinct. In contrast, metals concen trations determined by the total-recoverable method were not as similar among different regions, and only total- recoverable concentrations of arsenic and lead were statis tically similar (at a 95 percent confidence level) among the different regions. Cluster analysis revealed that sampling sites in three regions encompassing the Puget Sound could be regrouped to form two new regions. One group con sists of sites located in an inner ring encompassing Puget Sound, and the other group forms an outer ring in the Puget Sound uplands. Sites in three regions in south- central and southeastern Washington State could also be regrouped into two new regions.
For 7 of 11 metals tested, concentrations of metals determined by the total method correlated with concentra tions of metals determined by the total-recoverable method at a 95 percent confidence level. For 6 of 18 met als tested, concentrations of metals determined by the total method also correlated positively with organic carbon con centrations. Concentrations of metals determined by the total-recoverable method did not correlate at a 95 percent confidence level with either organic carbon concentrations or the amounts of fines, suggesting that concentrations of metals determined by this method are primarily dependent upon the partial digestion of the various mineral phases within each sample. Concentrations of most metals deter mined by the leaching methods did not correlate with con centrations of metals determined by either the total or the total-recoverable methods and did not correlate with the amount of carbon or silt- and clay-sized particles. There fore, the concentrations of metals in the leachates are probably independent of the exchange capacity in the soils. The analytical method for total concentrations was typically about twice as precise as was the total-recover able method, and the leaching methods were much less precise than either the total or total-recoverable method.
INTRODUCTION
In 1987 the Washington State Department of Ecology (Ecology) and the U.S. Geological Survey (USGS) began a series of cooperative studies to obtain information on the magnitude and variability of back ground metals concentrations in soils. This information was needed to determine if, and to what degree, soils were contaminated at sites where contamination is suspected and to enable the application of consistent clean-up guide lines that accurately reflected specific soil environments.
Background
The first of these studies was a pilot investigation of a part of the Big Soos Creek drainage basin in King County. In that study (Prych and others, 1995) 27 soil samples were collected from 9 sites over an area of about 30 mi2 at depths up to 5 feet (fig. 1). The samples were analyzed for 17 to 44 different elements by 4 different laboratory methods. The U.S. Environmental Protection Agency's priority pollutants of primary interest included antimony (Sb), arsenic (As), beryllium (Be), cadmium (Cd), chromium (Cr), copper (Cu), lead (Pb), mercury (Hg), nickel (Ni), selenium (Se), silver (Ag), thallium (Tl), and zinc (Zn) (U.S. Environmental Protection Agency, 1988). (For convenience, all elements will hereafter be referred to as metals.)
The method used to extract metals from a soil sample in the laboratory can strongly influence the reported con centrations of metals in the soil. Although several differ ent methods are commonly used in environmental investigations, four of the most common methods were used in the Soos Creek study. Two of them were a total and a total-recoverable method. The total method involved complete digestion of the solid material, whereas the total-recoverable method removed less than 95 percent of the solid material (Fishman and Friedman, 1985). Met als concentrations determined by the two methods were found to differ by as much as an order of magnitude. Metal concentrations were also determined from leachates produced by two different methods used to simulate leach ing processes in soils under extreme conditions: ASTM (method D3987-85, American Society for Testing and Materials, 1985) and EP-TOX (Extraction Procedure Tox- icity Test; method 1310, U.S. Environmental Protection Agency, 1986). Because the distribution of metals in soil and the extractability of metals from soil samples are influ enced by such soil characteristics as particle-size distribu tion, pH, and content of organic matter, the Soos Creek study determined these characteristics for each of the samples collected.
The Big Soos Creek drainage basin study provided both a foundation of information and a model from which future study designs could be formulated. However, the' knowledge about background metals concentrations in soils was limited by the relatively small study area and small number of samples, and the transferability of the results of the Soos Creek study to areas outside of its drainage basin was unknown. This present study was designed to cover a much larger area of the State so that the distribution and variability of metals in soils in

124°
118°
49°
46°
WH
ATC
OM
C
OU
NTY
OK
AN
OG
AN
C
OU
NT
YP
uget
Sou
nd,
CLA
LLA
M
CO
UN
TY
SN
OH
OM
ISH
_
CO
UN
TY
< CC
CH
ELA
N
CO
UN
TY
DO
UG
LAS
C
OU
NT
YJE
FF
ER
SO
N
KIT
SA
P
CO
UN
TY
C
OU
NT
Y
GR
AY
S
MA
SO
N
HA
RB
OR
C
OU
NT
Y
CO
UN
TY
Pac
ific
Oce
anP
IER
CE
C
OU
NT
YiT
HU
RS
TO
N
CO
UN
TY
PA
CIF
IC
CO
UN
TY
YA
KIM
A
CO
UN
TY
CO
LU
MB
IA
i C
OU
NT
Y
WA
LLA
~
~\_
CO
WU
TZ
C
OU
NT
YB
EN
TO
N
CO
UN
TY
WA
HK
IAK
UM
C
OU
NT
YS
KA
MA
NIA
C
OU
NT
YK
UC
KIT
AT
C
OU
NT
YC
oium
b/a
OR
EG
ON
Figu
re 1
.-C
ount
ies
and
maj
or r
iver
s of
Was
hing
ton
Sta
te.

representative regions in the State could be assessed and the qualitative and quantitative differences between these regions could be compared.
Purpose and Scope
This report presents data on the magnitude and vari ability of background concentrations of metals in soils in selected regions throughout the State of Washington and the determinations of differences among selected regions. The report presents, in tabular form, all the data collected for this study and summary statistics for all metals deter mined by the five laboratory methods. The frequency dis tributions of the data are discussed, and analyses of the variability of concentrations of metals determined by the total and total-recoverable methods among regions are presented, as are the matrices of correlation coefficients between total and total-recoverable metals concentrations and between metals concentrations and other soil characteristics.
Acknowledgments
Appreciation is expressed to Ward Staubitz and Laura Forsman for their extraordinary contributions to this report and to Charles San Juan of the Washington State Department of Ecology, whose cooperation was essential to the study.
STUDY AREA AND SOIL REGIONS
Samples were collected from regions A, C, D, F, G, J, L, M, O, P, R, and U (fig. 2). Even though a region con tains a number of different soil series, the number of soil series sampled within a single region depended on the original sampling design. Certain regions were chosen to have multiple samples retrieved from a single soil series at different locations, while other regions had samples collected from five different soil series. Table 1 lists the locations and physical descriptions of the soils sampled from every region, and the Description of Soils section lists the characteristics of soils common within a region and of the series sampled for each region.
Sampling Design
A stratified sampling design, described by Bennett and Franklin (1954) and Iman and Conover (1983), was used to incorporate the areal differences among soils in Washington State. The State was divided into 24 different regions (fig. 2), which were adapted from the general soil groups of Washington (Chapin, 1968), the physiographic regions presented by Livingston (1969) and Lasmanis (1991), and the major geologic units that compose the State (Hunting and others, 1961). Twelve of these regions, which compose the majority of land most affected by urban, agricultural, and industrial development, were sam pled in this study. Samples were collected from the pre dominant taxonomic soil series in each region. In most regions, soils from three or more different soil series were collected; however, in some regions, one or two soil series were so extensive that samples were collected only from those series. Soil samples were collected at 5 sites in each region (for a total of 60 samples). The locations of indi vidual collection sites within a specified soil series were chosen at random in areas that were relatively undisturbed by man (that is, away from major roads or highways, housing developments, farming or cultivated areas, and so on).
For this report, the term sampling site, or site, refers specifically to an area of approximately 1 acre, from which a composite was made from five samples collected at shal low depth (less than 38 inches) and thoroughly mixed to produce one representative sample to reduce the effect of local variability. Samples are designated by region and site (for example, sample A2 denotes a sample collected in region A at site 2). Duplicate samples are always desig nated as site location 6, and a duplicate designation imme diately follows the designation of the sample from which a duplicate was made. For example, sample F6 is the duplicate of sample F2 (see table 1).
Five samples from each of the 12 regions were collected and analyzed for 16 metals by the total-recover able method, for PCB's, for TPH, and for particle-size dis tribution. Three samples from each region were analyzed for 43 metals by the total method and for organic and inor ganic carbon. One sample from each region was analyzed for 17 metals by the ASTM, EP-TOX, and TCLP methods. Table 2 lists the individual metals determined by each lab oratory method and their respective laboratory minimum reporting levels. Explanations of each of the different ana lytical methods are presented in the "Laboratory Methods" section.

118°
49°
46°
Soi
ls d
evel
oped
in:
EX
PLA
NA
TIO
N
Soi
l reg
ion
boun
dary
P4
Sam
plin
g si
te u
nit d
esig
natio
n
40 IJ_
__
_|_
__
_L
40
r80
KIL
OM
ET
ER
S
80
MIL
ES
_J
A - C
ontin
enta
l and
mar
ine
sedi
men
tsal
ong
the
Pac
ific
Coa
st
C -
Bea
ch s
ands
D
- S
edim
enta
ry r
ocks
on
the
wes
tsl
ope
of th
e N
orth
Cas
cade
s F
- Gla
cial
dep
osits
in th
e P
uget
Sou
ndTr
ough
G
- A
lluvi
um a
long
the
Col
umbi
a R
iver
J -
Unc
onso
lidat
ed s
edim
ents
in th
eO
kano
gan
Riv
er V
alle
y L
- Old
er s
edim
enta
ry r
ocks
in th
eW
enat
chee
Riv
er V
alle
y M
- U
ncon
solid
ated
sed
imen
ts in
the
Elle
nsbu
rg B
asin
O
- Fi
ne-g
rain
ed U
ncon
solid
ated
sed
imen
tsin
the
Yak
ima
Riv
er V
alle
y
P - L
oess
, in
var
ious
are
as o
f so
uthe
aste
rn W
ashi
ngto
nR
- Unc
onso
lidat
ed s
edim
ents
,pr
imar
ily lo
ess,
gla
cial
out
was
h,
and
allu
vium
, in
the
Cen
tral
Col
umbi
a B
asin
U -
Unc
onso
lidat
ed s
edim
ents
in
the
Spo
kane
Riv
er V
alle
y
Figu
re 2
.--L
ocat
ion
of s
ampl
ed s
ites
in s
elec
ted
soil
regi
ons
of W
ashi
ngto
n S
tate
(ad
apte
d fro
m A
mes
, 19
94).

Table I.-Sampling locations and physical descriptions of soils in Washington
[Soil description abbreviations of colors and qualifiers: brn, brown; ol, olive; It, light; dk, dark; pi, pale; yl (preceding color), yellowish; brn (preceding color), brownish; gry (preceding color), grayish; ext, extremely; grv, gravelly; fn, fine]
Sam- Land pie surface num- Lat- Long- elevation ber itude itude (feet)
Soil samples from Region A:
Al 46 39 37 123 45 36A2 46 59 52 123 35 42A3 46 31 10 123 33 52A4 46 41 20 122 55 27A5 46 33 37 123 06 23A6 (duplicate of sample A5)
Soil samples from Region C:
Cl 46 55 53 124 09 57C2 465125 1240634C3 46 36 28 124 02 32C4 46 26 02 124 03 17C5 46 21 16 124 01 57
Soil samples from Region D:
Dl 48 39 04 122 29 30D2 48 39 08 122 29 26D3 48 41 52 122 29 29D4 48 48 09 122 10 33D5 48 43 32 122 05 27
Soil samples from Region F:
Fl 47 03 53 122 18 24F2 46 55 01 122 33 33F6 (duplicate of sample F2)F3 46 57 28 122 39 04F4 475451 1221040F5 482413 1221025
280160360480520
102
205
20
34070
250310
1,150
540380
370120800
Soil series1
WillapaZenkerZenkerMelbourneMelbourne
Dune landDune landNetartsDune landYaquina
CathcartCathcartCathcartSchnorbushHeisler
EverettSpanaway
EverettEverettEverett
Soil description2
yl. brn. silty clay loamdk. brn. loamdk. brn. loamdk. brn. silty claydk. brn. silty clay
gray sandgray sandIt. brn. gray fine sandgray sandol. brn. fine sand
It. brn. sandy loamIt. brn. sandy loamIt. brn. sandy loamIt. brn. clay loambrn. clay loam
brn. sandy loamIt. brn. gray loamy sand
ol. brn. loamy sandbrn. sandy loambrn. sandy clay loam
Soil horizon3
B2B2B2B21B21
--C~C
B2B2B2B3B2
CC
CCC
Sample depth finches')
top
2424242424
2625252624
2222252624
2624
242426
bottom
3030302727
3031313030
2828313230
3230
303032

Table 1. Sampling locations and physical descriptions of soils in Washington Continued
Sam- Land pie surface num- Lat- Long- elevation her itude itude (feet)
Soil samples from Region G:
Gl 45 41 59 122 30 43G2 45 40 14 122 40 57G3 45 40 50 122 44 24G4 45 46 53 122 35 58G5 454742 1224135
Soil samples from Region J:
Jl 484833 1192416J2 483446 1192836J3 480522 1194153J4 482415 1192705J5 484313 1192153
Soil samples from Region L:
LI 473642 1204021L2 473251 1203128L3 47 37 40 120 38 24L4 472924 1202000L6 (duplicate of sample L4)L5 47 29 43 120 21 17
Soil samples from Region M:
Ml 47 04 33 120 22 47M2 46 58 46 120 39 19M3 465114 1201724M4 46512 1201624M5 47 00 58 120 38 55
Soil samples from Region O:
Ol 461432 1191954O2 461727 1194435O3 46 25 22 120 45 26O4 461843 1202937O5 464114 1203916
2675010
215175
255950770
1,2001,480
1,6001,2001,5001,250
1,280
2,3201,9002,1402,2151,760
1,3001,1801,1201,0001,335
Soil series 1
LaurenWind RiverSauvieDollarGee
ColvillePougePougePougeCashmere
BurchBurchBurchBurch
Burch
WenasNachesRenslowSelahReeser
ShanoWardenShanoWardenWeirman
Soil description2
brn. loamdk. gry. brn. loamy sanddk. gr. brn. clay loambrn. loamdk. brn. silty clay loam
It. gray silty clay loambrn. sandy loambrn. sandy loambrn. sandy loampi. brn. sandy loam
yl. brn. sandy loamyl. brn. sandy loamyl. brn. sandy loamyl. brn. sandy loam
yl. brn. sandy loam
dk. gry. brn. sandy loamdk. yl. brn. clay loambrn. loamIt. brn. gray claybrn. silt loam
pi. brn. silt loampi. brn. silt loampi. brn. silt loampi. brn. silt loamgry. brn. ext. grv. sand
Soil horizon3
B2ClB2B2B
B2IICIICIICCl
ClClClCl
Cl
B2B3B2tB22B2
B3B2B3B2IIC2
Sample depth finches')
top
2424242424
2630283230
26262626
25
2425252524
2424242420
bottom
3030303030
3236343836
32323232
31
3031313127
3030302726

Table 1. Sampling locations and physical descriptions of soils in Washington Continued
Samplenumher
Latitude
Longitude
Landsurfaceelevation Soil(feet) series 1 Soil description2
Soilhorizon3
Sample depth(inches')
top bottom
Soil samples from Region P:
PI 470608 1175445 1,710P2 465848 1174302 470P3 462437 1180414 1,680P6 (duplicate of sample P3)P4 461153 1180928 1,770P5 461307 1181528 1,230
Walla Walla dk. bra. silt loamAthena bra. silt loamAthena brn. silt loam
Athena Walla Walla
bra. silt loam dk. bra. silt loam
B3B22B22
B22 B3
283030
3032
343636
3638
Soil samples from Region R:
Rl R2 R3 R4 R6 R5
470446 1191953 1,060 470053 1194611 1,150 464554 1184944 1,000 465250 1194216 1,110 (duplicate of sample R4) 46 25 24 1 19 04 52 900
Quincy Quincy Shano Taunton
Taunton
bra. fn. sand bra. fn. sand pi. bra. silt loam pi. bra. silt loam
pi. bra. silt loam
C2 C2Cl B2
B2
24242424
24
30323030
27
Soil samples from Region U:
Ul 473743 1171000 2,220U2 474313 1173053 1,710U3 475037 1175147 1,430U6 (duplicate of sample U3)U4 475002 1175805 1,300U5 475232 1180911 1,480
Reference soil samples:
Marble dk. bra. loamy sand Cl 22 28Springdale It. bra. sand C3 24 30Ewall pi. bra. sand C2 28 34
Spens brn. loamy sand C2 25 31Ewall pi. brn. sand C2 25 31
mixture of soils collected within the Soos Creek Basin, Washington (duplicate of sample RS1) _______________________
RS1 RS2
1 Soil series names from Soil Conservation Service publications; note that names of soils in regions D and M may change in the future because surveys for Whatcom and Kittitas Counties are being updated.
2 U.S. Department of Agriculture (1962) soil textural classes determined; samples were sieved in the field to remove material larger than 19 millimeters; as a result, qualifiers for coarse gravel or cobble, which would otherwise be included, may not be included in the soil description. Note that soils from the following series commonly contain gravel or cobbles at the sampled horizon level: Everett, Spanaway, Lauren, Pouge, Springdale, and Spens.
3 Soil horizons determined in office using sample depth and physical soil characteristics. Horizons are relatively parallel layers of soil that have distinct characteristics which represent departures from the parent material. Typically the A horizon overlies the B horizon, together composing the solum. The C horizon overlies the parent material and is beneath the solum. For additional information see U.S. Department of Agriculture (1962).

Table 2.-Reporting levels for metals in soils in Washington analyzed by different methods
[Values in parentheses are given in milligrams per liter of leachate; level of detection may exceed minimum reporting level; , lack of a reporting level indicates that analysis was not performed; ASTM, American Society for Testing and Materials method D3987-85; EP-TOX, Extraction Procedure Toxicity Test, U.S. Environmental Protection Agency method 1310; TCLP, Toxicity Characteristic Leaching Procedure, U.S. Environmental Protection Agency method 1311]
Metal
Symbol
AgAlAsAuBa
BeBiCaCdCe
CoCrCuEuFe
GaHoHgKLa
LiMgMnMoNa
NbNdNiPPb
Minimum laboratory reporting levels, by analytical method, in milligrams oer kilosram of drv soil
Name
SilverAluminumArsenicGoldBarium
BerylliumBismuthCalciumCadmiumCerium
CobaltChromiumCopperEuropiumIron
GalliumHolmiumMercuryPotassiumLanthanum
LithiumMagnesiumManganeseMolybdenumSodium
NiobiumNeodymiumNickelPhosphorusLead
Total
2500
1081
110
50024
1112
500
44
.02500
2
250
42
50
442
504
Total recoverable ASTM, EP-TOX, and TCLP
0.27.0
.5~--
.5~
.2~
_1.51.0
--
2.0
.004---
_~
1.0--~
_
--7--
10
0.041.0
.6~
.1
.4~~
.04
_.1.4
--
.4
~
.0008~~
_--
.4--~
_--
.4--
.4
(0.002)(.1)(.03)
--(.01)
(.02)-~(.002)
~
_(.01)(.02)
--
(.02)
~a(.00004)--~
--
(.02)--~
_--(.02)-
(-02)

Table 2.~Reporting levels for metals in soils in Washington analyzed by different methods Continued
MetalMinimum laboratory reporting levels, by analytical method,
in milligrams per kilogram of dry soil
Symbol
SbScSeSnSr
TaThTiTlU
VYYbZn
Name
AntimonyScandiumSeleniumTinStrontium
TantalumThoriumTitaniumThalliumUranium
VanadiumYttriumYtterbiumZinc
Total
0.12
.1102
404
50~
100
2214
Total recoverable
3.0~
.5~--
_ 1.55.0
__ 2.0
ASTM, EP-TOX, and TCLP
0.4 (0.02)__1.0 (.1) --
___
.4 b(.02)--
_____.
.4 (.02)
a Minimum reporting level for TCLP mercury is 0.001 milligram per kilogram of dry soil or 0.0001 milligram per liter of leachate.
b Minimum reporting level for TCLP thallium is 2.0 milligrams per kilogram of dry soil or 0.1 milligram per liter of leachate.
Duplicates of samples A5, F2, L4, P3, R4, and U3 were obtained from sample splits. For quality assurance, these duplicates were submitted to the laboratories without the laboratories being informed that the samples were duplicates (so-called blind samples). A reference sample (RS1) constructed during the Soos Creek study from many different sites (Prych and others, 1995) was also submitted to the laboratories. A duplicate of RS1 was also submitted to various laboratories blind with the other duplicates.
Description of Soils
The soils in the State of Washington are diverse. They have developed over different lengths of time, in a great variety of parent materials, upon diverse terrains, with highly contrasting climates. In fact, they range from highly developed soils formed in marine volcanoclastic sediments to soils with little profile development formed in recently deposited glacial sediments. Twelve of the 24 regions were chosen for this study (fig. 2).
Region A
Soils in region A developed mainly in continental and marine sedimentary beds deposited in southwestern Washington (Pringle, 1986), and all soils sampled in this region developed on upland marine sediments. Samples were collected from the Willapa, Zenker, and Melbourne series. Willapa soils developed on marine terraces that were cut into marine sediments and bedrock following changes in sea level (Pringle, 1986). Zenker soils formed in material weathered from sandstones derived from a vol canic range to the east of the present Washington coast. Melbourne soils formed in material weathered from marine deposited siltstone, shale, and fine-grained sandstone.
Region C
All soils in region C formed in beach sands located along the southwestern Washington coast. Three of the five samples were collected from "dune lands," which con sist of excessively drained ridges formed in fine beach
10

sand, and the other two were collected from the Netarts and Yaquina series. Soils from the Netarts series formed in upland areas, and soils from the Yaquina series formed in basin-like areas between sand dunes (Pringle, 1986).
Region D
Soils in region D typically developed in older sedi mentary rocks on the northwestern side of the Cascade Range (Poulson, 1953). Samples were collected from the Cathcart, Heisler, and Schnorbrush series. Soils from the Cathcart series formed in sandstones and shales developed from glacially scoured consolidated sandstone. Soils from the Heisler series commonly occur in high mountain val leys west of Mt. Baker and formed in glacial moraines developed from argillite, schist, and shale, which appar ently accumulated from alpine and continental glaciations (Poulson, 1953). Schnorbrush soils are confined to the valley of the Nooksack River and were derived from arko- sic sandstone and drift material that border the mountain sides. Talus rubble from alpine glaciers may also have contributed to the parent material.
Region F
Most soils in region F formed in glacial deposits in the Puget Sound lowlands of western Washington (Zulauf, 1979). Samples were collected from both the Everett and Spanaway soil series. Soils from the Everett series formed on gravelly glacial outwash located on terraces and terrace breaks. Spanaway soils, which also formed in glacial out- wash, commonly contain volcanic ash in the upper solum and are the "most extensive soil on the outwash plain of the last continental, or Vashon, glaciation period" (Ness, 1958, p. 54).
Region G
Soils in region G along the lower Columbia River commonly are derived from alluvium deposited from vastly different sources (McGee, 1972). Soils were col lected from the Lauren, Wind River, Sauvie, Dollar, and Gee series. Lauren soils developed on Columbia River terraces 50 to 300 feet above the present level of the river in mixed alluvium that contains some volcanic ash. Wind River soils also developed in Columbia River mixed- alluvium deposits 150 to 500 feet above the present river level. Soils of the Sauvie series formed in alluvial bottom lands along the river. Soils from both the Dollar and Gee
series formed in older Columbia River alluvium. Dollar soils developed on low nearly level terraces, whereas Gee soils are found in rolling hills on eroded terraces.
Region J
Soils in region J commonly developed in unconsoli- dated deposits in the Okanogan River Valley located in north-central Washington, and samples were collected from the Colville, Pouge, and Cashmere series. Soils from the Colville series formed in mixed alluvium derived from acidic igneous rocks and volcanic ash. Pouge soils devel oped on terraces and terrace breaks and are underlain by gravelly sandstones deposited as glacial outwash. Cash mere soils also formed in glacial outwash and more recent alluvium (Lenfesty, 1980).
Region L
Region L is located in the northeastern foothills of the Cascade Range. Soils in this region developed prima rily on older sedimentary rocks in the Wenatchee River Valley. All samples collected from this region were from the Burch soil series. Burch soils specifically formed on terraces composed of old alluvium derived from sandstone (Beieler, 1972).
Region M
Soils in region M commonly formed in unconsoli- dated loess and alluvium deposits in the Ellensburg Basin located in central Washington. Samples were collected from the soils of the Renslow, Selah, Naches, Reeser, and Wenas series. Renslow and Selah soils formed in loess; Selah soils may also contain a sub-layer of caliche and are commonly underlain by gravelly old valley fill. Soils in the Naches series also developed in old valley fill. Reeser soils formed over cemented gravels, and soils from the Wenas series developed in stream bottom material composed chiefly of weathered basalt (Smith and others, 1945).
Region O
Region O is located immediately south of the Ellensburg basin. The soils sampled in this region devel oped in fine-grained sediments deposited in the Yakima River Valley. Soils were collected from the Shano, Warden, and Weirman series. Shano soils formed in loess,
11

whereas Warden soils formed in a "thin mantle of loess" underlain by glaciolacustrine sediments (commonly referred to as Touchet beds) (Lenfesty and Reedy, 1985; and Rasmussen, 1971). Weirman soils formed in mixed alluvium located in flood plains or low terraces.
Region P
Region P extends throughout much of southeastern Washington, and soils in this area formed in thick deposits of loess (Harrison and others, 1964; Harrison and others, 1973; and Donaldson, 1980). Samples were collected from both the Walla Walla and Athena series. Both the Walla Walla and Athena soils formed in loess interstrati- fied with volcanic ash (Donaldson, 1980), and at some localized depressions, deposits of ash may be from 1 to 6 feet thick. Athena soils, however, are commonly located in higher elevations, whereas Walla Walla soils are commonly found at elevations below 2,000 feet.
Region R
Soil samples collected in this region commonly formed in unconsolidated wind-blown and alluvial sedi ments in the central Columbia Basin located in southeast ern Washington. The Quincy, Shano, and Taunton series were sampled. Quincy soils are located on terraces or active sand dunes and were formed in eolian sands (Gen try, 1984; Lenfesty, 1967; and Van Duyne and others, 1917). Shano soils formed in thick deposits of loess inter- stratified with volcanic ash. Taunton soils developed in wind-worked alluvium and are commonly underlain by lime- and silica-cemented hardpans at shallow depth (Gentry, 1984).
Region U
All samples in this region were from soils that devel oped in unconsolidated deposits in the Spokane River Valley located in northeastern Washington. Samples of Marble, Springdale, Ewall, and Spens soils were collected. Marble soils formed on terraces in wind-worked mixed sandy outwash (Donaldson and others, 1982; and Donald- son and Giese, 1968). Springdale soils developed in out- wash mantled with volcanic ash and loess (Donaldson and others, 1982; Donaldson and others, 1968; and Stockman, 1981). Ewall and Spens soils also formed in glacial out- wash. Ewall soils typically are located on terraces, whereas Spens soils are located on terrace breaks (Stockman, 1981).
METHODS
This chapter presents the procedures used to collect and process soil samples and the individual laboratory methods used to determine metals concentrations and other chemical and physical soil characteristics. The analytical precision of laboratory determinations are pre sented, and the ranges of precision among the total, total- recoverable, ASTM, EP-TOX, and TCLP methods are discussed.
Sample Collection and Processing
Samples were collected during July, August, and September of 1990. In the earlier Big Soos Creek pilot study, samples collected closer to the surface displayed a greater variability in metals concentrations than those samples collected at greater depths (Prych and others, 1995). For the current study, soil samples were collected from a depth of at least 20 inches below ground surface and were located within either the B or C horizon to (1) decrease variability and (2) minimize contamination from possible surface pollutants. A shovel was used to dig a hole from 12 to 24 inches in diameter by 24 inches deep at the center and at each corner of a 1-acre plot. A stain less-steel soil auger was used to collect 1 to 2 liters of material from approximately a 6-inch layer below the bot tom of the hole. The material from each hole was sieved in the field through a 19.0 mm stainless-steel crimped sieve and was placed in a 20-liter plastic bucket. The five samples in the bucket were mixed thoroughly to form one representative composite sample to reduce the effect of areal variability. A subsample (approximately 3 to 4 liters in volume) of the composite sample was placed in a 4-liter plastic container for further sieving and sample splitting in the laboratory. A second subsample, approximately 0.3 liter in volume, was sieved through a 2.0-mm stain less-steel crimped sieve in the field and was placed in a cleaned glass jar and stored on ice for later analysis for PCB's and TPH. After all the soil samples at a site had been collected, all sampling and processing equipment was washed with tap water and detergent (Alconox), then rinsed sequentially with tap water, with a 60/40 acetone/hexane solution, and finally with deionized water.
The primary subsample was further divided into rep resentative sample splits at the USGS field services unit in Tacoma, Wash. The sample splits were produced by flat tening, mixing, and quartering the soil as described by the ASTM method D3987-85 (American Society for Testing and Materials, 1985). The sample splits were used as allotments for the various analyses and duplicates.
12

Sample splits for determining particle-size distribution and soil-solution pH were analyzed without further treatment. Splits that were to be analyzed by the total-recoverable, ASTM, EP-TOX, and TCLP methods were dry sieved to remove particles larger than 2.0 mm (millimeters). All sample splits to be analyzed by the total method were additionally wet sieved using a polypropylene sieve to obtain only material less than 63 |im (micrometers) in size for analyses, because trace metals tend to concentrate in finer sized (silt- and clay-sized) particles (Kabata-Pendias and Pendias, 1984).
Laboratory Methods
Five different laboratory methods were used to deter mine metal concentrations in the soil samples. Each method produced a liquid extract that was analyzed either by atomic-absorption or by inductively-coupled plasma emission spectrometry. Differences among solvents and extractive processes have the most significant effect on the metal concentrations in the resulting liquid extracts; differ ences in the methods for determining metals concentra tions in the extracts are not expected to affect the results greatly.
For all metals except mercury, the total method determined total metal concentrations in the soil by nearly complete digestion of the solid phase of soil samples. At least 95 percent of the solid material was digested by hydrochloric, nitric, hydrofluoric, and perchloric acids (Fishman andFriedman, 1985; and Briggs, 1990). The digested material was then analyzed by inductively- coupled plasma emission spectrometry (ICPES). Samples were also analyzed by hydride-generation atomic-absorp tion spectrometry (HGAAS) to determine total arsenic, antimony, and selenium concentrations (Welsch and oth ers, 1990). Total mercury concentrations in the soil were determined from a partial digestion of the solid phase. Samples were digested with nitric acid and sodium dichro- mate, and the mercury in solution was reduced and vapor ized and then analyzed by cold-vapor atomic-absorption spectrometry (CVAAS) (O'Leary and others, 1990). These analyses were performed by the Geologic Division Laboratory of the USGS in Arvada, Colo.
The total-recoverable method used a digestion proce dure involving a mixture of nitric and hydrochloric acids that removes most material bound by surficial coatings on soil particles but removes less than 95 percent of the metals from the mineral matrix (method 3050; U.S. Envi ronmental Protection Agency, 1986). This method is commonly used by regulatory agencies to determine the
amount of material that ultimately may be bioavailable. Concentrations of arsenic in the extracts were determined by graphite-furnace atomic-absorption spectrometry (GFAAS), and concentrations of mercury were determined by CVAAS. The remaining metals were determined by ICPES. Determinations of total-recoverable selenium for selected samples used HGAAS to obtain a lower reporting limit (Randy Knox, Washington State Department of Ecol ogy, oral commun., 1993). Analysis by this method and the leaching methods described in the following para graphs was performed by Ecology's Manchester Environmental Laboratory in Manchester, Wash.
Metal concentrations were also determined by three different leaching methods. Each method was designed to estimate the solubility and mobility of organic and inor ganic components in contaminated soils. The ASTM method used was D3987-85 (American Society for Testing and Materials, 1985), in which distilled water was mixed with the soil (solution ratio: 70 grams of soil to 1.4 liters of water) and shaken for approximately 18 hours, and then the solution was extracted, filtered, preserved overnight with nitric acid, and analyzed the next day. The EP-TOX method (method 1310; U.S. Environmental Protection Agency, 1986), which was also used, was the same as the ASTM leaching procedure, except that it used a 0.5 nor mal acetic acid solution rather than distilled water as the solvent and it maintained the pH of the solution at 5. The TCLP method (method 1311; U.S. Environmental Protec tion Agency, 1990a, b) used in this study, like the EP-TOX method, used an acetic acid solution rather than distilled water and maintained the solution pH at 5. In addition, the TCLP method involved a stronger acetic acid solution and sodium hydroxide, which allowed for greater control of the solution pH. As a result, the TCLP method achieved a solution pH of 5 more consistently than in the EP-TOX method. Concentrations of mercury in the leachate sample were determined by CVAAS, and the remaining metals in the leachate were determined by ICPES.
Particle-size distributions of the soils were deter mined for grains between 63 |im and 19 mm by the USGS Cascades Volcano Observatory sediment laboratory in Vancouver, Wash. Samples were dried and then sieved through screens with mesh openings of 16, 8, 4,2, I, 0.5, 0.25, 0.125, and 0.063 mm (described by Guy, 1977).
Total carbon concentrations were determined by measuring the amount of material volatilized from a com plete combustion of a sample split. Concentrations of inorganic carbon were determined by measuring the amount of material dissolved from applications of hydro chloric acid to a sample, and organic carbon was
13

calculated as the difference between total and inorganic carbon (Wershaw and others, 1987). The determinations were performed by the USGS National Water Quality Laboratory in Arvada, Colo.
Soil-solution pH was determined by project person nel using two different methods. A 1:1 solution by weight of soil to deionized water (10 grams soil, 10 mL, millili- ters, of water) was made from a sample split and was allowed to equilibrate for 30 minutes, after which the solu tion was mixed and the pH measured. The second method used the same solution. After the first pH measurement, 1 mL of 1 molar calcium chloride was added to the solu tion. The sample was then mixed and allowed to equili brate for an additional 30 minutes, after which the solution was mixed again and the second pH measurement was made.
Analytical Precision
The analytical precision of laboratory determinations was calculated from differences between laboratory results for duplicate samples (table 3). The percent difference between a sample value and its duplicate was calculated by dividing the absolute difference between the sample and duplicate by the mean value for the duplicate pair and multiplying by 100. An average difference for a metal was not calculated if the concentration in one or more duplicates was less than the laboratory minimum reporting level.
The ranges of precision for the total and total- recoverable methods were similar, about 0 to 20 percent; however, the precision of the total method was typically about twice as good as of the total-recoverable method. The precision for the ASTM, EP-TOX, and TCLP meth ods was typically much less than for either the total or total-recoverable methods and ranged from 0 to 179 per cent from metal to metal. The large variance observed in analytical precision for the three leaching methods could, in part, be due to the fact that only one duplicate pair was used to test precision for these methods. Regardless, for this study, determinations of background concentrations of metals in soils based on leaching procedures have a much larger uncertainty than background concentrations of met als determined by the total and total-recoverable methods.
DETERMINATION OF BACKGROUND METALS CONCENTRATIONS
All data from this study are presented in tables Al to A4 at the end of this report. Summary statistics of the data are presented to illustrate the magnitude and variability of the concentrations of specific metals on a statewide basis as determined by the five laboratory methods. The data for each metal were tested to determine if they are normally or log-normally distributed, and other statistical methods were used to demonstrate differences in the con centrations of metals within or among regions. Relations between the concentrations of metals determined by the total and total-recoverable methods are also presented, and relations between metals and other soil characteristics are discussed. Finally, the results from the leaching proce dures are compared and the analytical precision of the various methods are discussed.
Differences among the population means of metals concentrations among the 12 regions suggest that sample variance may be minimized by dividing the State into various regions or groups of regions. Minimizing sample variance would in turn minimize the number of samples required to determine accurate baseline metals concentra tions. Although concentrations of some metals may differ significantly among regions, summary statistics for indi vidual or groups of regions were not given in this report because of the small number of samples and because these regions may be the focus of future investigations. The data in table A2 are given in a format so that summary sta tistics of metals concentrations for individual or groups of regions may be calculated if needed. For the purpose of this report, summary statistics that include all data were calculated to provide an initial assessment of the magni tude and variability of metals concentrations for the entire State.
Strong associations between or among individual regions may provide useful information. If sample vari ance remains relatively low and sampling size increases, the accuracy of the estimated baseline metals concentra tions will increase. Therefore grouping data, for example from regions A and F, that demonstrate a strong associa tion may provide more accurate information than data generated for an individual region. However, other considerations, such as location, soils, parent material, and climate, should also be made when data from different groups are combined.
14

Table 3. Average differences between metals concentrations determined in duplicate soil samples
["a" denotes that concentrations in one or more duplicates are less than laboratory minimum reporting level and differences were not computed; ~ indicates no data; statistics for the total, total-recoverable, ASTM (American Society for Testing and Materials), EP-TOX (Extraction Procedure Toxicity Test), and TCLP (Toxicity Character istic Leaching Procedure) methods were determined using 4, 7, 1, 1, and 1 pairs of duplicates, respectively]
Average difference, in percent1 , for indicated method of analysis
Metal
SilverAluminumArsenicGoldBarium
BerylliumBismuthCalciumCadmiumCerium
CobaltChromiumCopperEuropiumIron
GalliumHolmiumMercuryPotassiumLanthanum
LithiumMagnesiumManganeseMolybdenumSodium
NiobiumNeodymiumNickelPhosphorusLead
AntimonyScandiumSeleniumTinStrontium
Total
a29a1
0a4a5
168a5
3a
2043
422a8
176728
124
12a3
Total recoverable
a6
13 --
13~~a~
_107~6
~a~~
__~8~~
__~
15--
18
a~a~
ASTM
a45
a
179
a~~a~
aa~a
~
120~~
-a~~
~a~a
a~a~~
EP-TOX
aaa
40
a~~a~
aa~
40
~a-~
~a
--
~a~a
a~a~~
TCLP
aaa~2
a ~a~
aa~67
~a-~
~0~~
~a~a
a~a-~
15

Table 3.--Average differences between metals concentrations determined in duplicate soil samples-Continued
Average difference, in percent1 , for indicated method of analysis
Metal
TantalumThoriumTitaniumThalliumUranium
VanadiumYttriumYtterbiumZinc
Total Total recoverable ASTM EP-TOX
ao3 a a aa
51o27 a a
TCLP
_ a~
_ -18
Average of absolute values of differences, in percent, between concentrations in duplicate samples.
Regions A and F are located adjacent to each other and lie primarily within or adjacent to the Puget Sound Lowland (fig. 2). Soils in region A formed primarily in marine sediments, which were derived from a volcanic range to the east of the present Washington coast (Pringle, 1986). Similar marine sediments are also exposed in the northern part of the Cascade Range of Washington and British Columbia and on Vancouver Island (Wolfe and McKee, 1972). During the Vashon stage of the upper Pleistocene Fraser Glaciation, a lobe of the Cordilleran ice sheet extended into the Puget Lowland, which resulted in deposits of till and various outwash sediments that are found in region F today. The glacial sediments were derived from material originally located in the northern part of the Cascade Range and Western British Columbia, which indicates that the soils in regions A and F developed in parent material derived from similar sources.
Based on this information and the results of the Fisher's Least Significant Difference test and the Cluster analyses, further investigation could provide more defini tive relations between regions such as A and F and among O, P, and R, which were shown to be associated and simi larly could test whether regions that were not associated with other regions can be characterized individually. These investigations could continue to include determina tions of other soil characteristics (for example, particle size, organic carbon) as well as additional analyses, such as cation-exchange capacity so that mechanisms control ling the chemistry and the associated distribution of metals in the soil may be better understood.
Summary Statistics
Summary statistics of metals concentrations in soils measured in this study are listed in tables 4 through 8. Each table gives the summary statistics of unadjusted and log-transformed values of the data for all metals deter mined by one of the laboratory methods. When the con centration of a metal in a sample was smaller than the laboratory's minimum reporting level, the minimum reporting level was used for calculating statistics, and the statistics were qualified as less than or greater than the value given.
The concentrations of metals in uncontaminated soils in Washington State varied by as much as 62-fold. How ever, concentrations of metals determined by the total method were consistently greater and varied less than values for metals determined by the total-recoverable, ASTM, EP-TOX, or TCLP methods (see fig. 3). Mean concentrations of individual metals determined by the total-recoverable method ranged from 7 to 56 percent of mean concentrations determined by the total method, and detectable concentrations of metals determined by the ASTM or TCLP methods were typically less than 1 per cent of the concentrations determined by the total method. Total concentrations of mercury and nickel and total- recoverable concentrations of nickel, chromium, and copper displayed the greatest variability, and all have arithmetic standard deviations greater than two-thirds of their respective arithmetic means (tables 4 and 5). Con centrations of other metals, such as aluminum and barium
16

determined by the total method, varied less; both have arithmetic standard deviations less than one-third of their respective means (table 4). The box plots of figure 3 dem onstrate the variability for the entire data set but do not illustrate how the concentrations of metals differ among regions and how values for a specific region may influence the variability observed for all the data. Figures 4 to 20 show variations of concentration within and among regions. For example, concentrations of mercury, chro mium, copper, and iron vary greatly among regions, whereas concentrations of other metals, such as zinc, lead, or arsenic, vary less, although arsenic concentrations within a given region may be fairly variable. Other met als, such as aluminum, exhibit consistent concentrations when analyzed by the total method but greater variability when analyzed by the other four methods. Particle size, carbon content, and soil-solution pH are also highly vari able throughout the State. For example, region C is com posed almost entirely of sand, whereas regions O and P contain greater amounts of silt and clay than other regions (see fig. 21). Carbon concentrations generally are greater in samples collected in the regions west of the Cascade Range than those collected in the east, and the soil- solution pH is also more acidic west of the Cascade Range and more alkaline east of the Cascade Range (see figs. 22 and 23). The variability of TPH and PCB's in soils could not be determined because the concentrations of each were always less than the laboratory's minimum reporting level.
Frequency Distributions of Metals Concentrations
Understanding the nature of the data and applying the proper statistical analyses requires knowing whether the sampled data came from a population that follows a normal distribution. The probability plot correlation coef ficient test (Looney and Gulledge, 1985a, b) was used to test whether the metals concentrations determined by the total and total-recoverable methods are from populations that are normally or log-normally distributed. The proba bility plot correlation coefficient test was used to test two null hypotheses: (1) that the data were sampled from pop ulations that are normally distributed and (2) that the data were sampled from populations that are log-normally dis tributed. Correlation coefficients between the data and their respective normal quantiles (the x axis on a probabil ity plot) were determined and compared to that of a normal distribution, in which the coefficient would be 1.0 (Looney and Gulledge, 1985a, b). A null hypothesis was rejected when the correlation coefficient was sufficiently small such that there was less than a 5-percent chance of reject ing the null hypothesis when it should not be rejected.
When one or more concentrations were below the laboratory minimum reporting level, normal quantiles were computed using all the data; however, data for sam ples with concentrations less than the minimum reporting level were not included in computations of the correlation coefficients.
Concentrations of 13 metals determined by the total method and of 5 metals determined by the total-recover able method in this study were determined to have been sampled from populations that were distributed log-nor mally (at a 95 percent confidence level) (table 9). Con centrations of four metals determined by the total method and three total-recoverable metals were found to have been sampled from populations that were distributed nor mally. The concentrations of three metals determined by the total method were determined to have been sampled from populations that were neither normally nor log- normally distributed, and the population distributions for concentrations of three other metals could not be deter mined because all values were less than laboratory report ing limits. Concentrations of 12 metals determined by the total method and of 3 metals determined by the total- recoverable method were apparently more nearly log-normally than normally distributed.
Metals concentrations in various igneous rocks, sam pled from different locations, have been shown to be sam pled from populations that are not normally distributed (Ahrens, 1954). Furthermore, Ahrens (1954) found that the sample distributions became normal (or nearly normal) when the data were log-transformed (that is, log-normally distributed). Kulp and others (1952) and David (1977) observed similar sample frequency distributions for metals concentrations in marine and other sediments as well as various igneous rocks. Therefore, it is not surprising that concentrations of various metals in soils are likewise log- normally distributed, as observed in this study. This distri bution would especially be true for those metals, specifi cally transition metals, that are primarily contained within the mineral matrices. In this study, all transition metals, with the exceptions of gallium determined by the total method and lead and manganese determined by the total- recoverable method, are more nearly log-normally than normally distributed. The same is true for most alkali and alkali earths, with the exceptions of barium, potassium, and strontium determined by the total method and of beryllium determined by the total-recoverable method. The statistical tests presented in the following sections are non-parametric because the majority of metals concentra tions were either sampled from populations that are decid edly log-normally distributed or more nearly log-normally than normally distributed.
17

Table 4.--Summary statistics for concentrations of metals in soils in Washington as determined by the total method
[Concentrations are in milligrams per kilogram of dry soil (except values for Al, Ca, Fe, K, Mg, Na, P, and Ti, which are given in percent); ~ indicates statistic not computed because concentrations in all samples were less than laboratory's minimum reporting value; <, less than]
Metal
SilverAluminumArsenicGoldBarium
Beryllium BismuthCalciumCadmiumCerium
CobaltChromiumCopper Europium Iron
GalliumMercury HolmiumPotassiumLanthanumLithium
Magnesium Manganese Molybdinum SodiumNiobium
Total number of samples/ detects 1
37/037/3737/3737/037/37
37/34 37/037/3737/437/37
37/3737/3737/37 37/3 37/37
37/3737/37 37/037/3737/3737/37
37/37 37/37 37/7 37/3737/36
Arith
metic mean
<2.08.16.6
<8600
<1.5 <10
2.0<2.264
2010036<2
5.0
20.4
<41.5
3534
1.3 790<2
1.8<9
Geo
metric mean
<2.08.05.3
<8580
<1.5 <10
1.8<2.261
188232 <2
4.7
19.09
<41.4
3332
1.1750 <2
1.7<9
Median
<2.07.95.5
<8650
2.0 <10
1.8<2.064
176929 <2
4.6
20.06
<41.6
3329
1.1 690<2
1.79
Arithmetic standard deviation
1.14.2
140
>.5
1.0>.9
17
109720 >.3 1.8
41.3
.51013
.6 280
>.4 .9
>3
Geometric deviation factor2
1.12.0-
1.3
>1.4
1.7>1.3
1.3
1.61.91.5
>1.1 1.4
1.23.4
1.51.31.4
1.5 1.4
>1.11.4
>1.4
Mini
mum
<2.06.7
.8<8
300
<1.0 <10
.4<2.026
82813<2
2.5
10.04
<4.5
1520
.6410 <2
.9<4
Maxi
mum
<2.011.020.0
<20920
2.0 <20
5.56.0
110
48540120 <4
9.3
286.0
<42.3
6189
3.5 1,600
<4 6.2
14
90th percen-
tile
<2.010.013.0<8
760
2.0 <10
3.7<2.386
3619056<2
7.9
24.4
<42.2
4850
2.0 1,320
<2 2.3
13
18

Table 4.--Summary statistics for concentrations of metals in soils in Washington as determined by the total method Continued
Total number of Arith- samples/ metic
Metal detects 1 mean
NeodymiumNickelPhosphorusLeadAntimony
SeleniumScandinumTinStrontiumTantalum
ThoriumTitaniumUraniumVanadiumYttrium
YtterbiumZinc
37/3737/3737/3737/3737/36
37/2937/3737/037/3737/0
37/3637/3737/037/3737/37
37/3737/37
3246
.113<1.4
<.319<5
290<41
<9.7
<10014023
2100
Geo
metric mean
3231
.112<1.3
<.217<5
260<41
<9.6
<10013022
295
Arithmetic Geometric standard deviation Mini-
Median deviation factor2 mum
33 827 75
.1 .112 5
1.3 >.7
.1 >.316 8<5
290 86<40
9 <3.6 .3
<100130 6923 7
2 189 41
1.32.11.71.5
>1.5
>2.31.5~
1.4-
>1.41.4~
1.61.4
1.51.4
1611
.024<.6
<.l9
<592
<40
<5.3
<1005710
161
Maxi
mum
55470
.536
3.8
1.238
<10460<80
171.3
<20037044
4280
90th percen-
tile
4374
.2183.8
1.034<5
370<40
141.2
<100254
36
4140
1 Detects are the number of samples with concentrations greater than the laboratory reporting limit.
2 To obtain concentration at n geometric deviations above and below the geometric mean, multiply and divide the geometric mean by the geometric deviation factor to the n* power. For example, barium concentrations at two geometric deviations above and below the geometric mean are
580 X (1.3)2 = 980 mg/kg, and 580/(1.3)2 = 340 mg/kg, respectively.
19

Table 5.~Summary statistics for concentrations of metals in soils in Washington as determined by the total-recoverable method
[Concentrations are in milligrams per kilogram of dry soil (except Al and Fe, which are in percent); ~ indicates statistic not computed because concentrations in most samples were less than laboratory's minimum reporting value]
Metal
SilverAluminumArsenicBeryllium Cadmium
ChromiumCopper IronMercury Manganese
NickelLeadAntimony Selenium Thallium3
Total number of samples/ detects 1
60/1260/6060/5960/60 60/0
60/6060/60 60/6060/52 60/60
60/6060/6060/0 60/0 60/21
Arith
metic mean
<0.22.1
<3.4.6
3020
2.5<.027
420
257
<3.0
Geo
metric mean
<0.21.8
<2.8.5
2117 2.3<.016
370
177
<3.0
Median
<0.21.72.8
.5
18192.3
.013 380
167
<3.0
<5.0
Arithmetic standard deviation
>0.11.2
>2.2.3
4414
1.1<.032
190
463
-
Geometric deviation factor2
>1.31.8
>2.01.9
2.11.8 1.5
>2.7 1.7
2.01.6
-
Mini
mum
<0.2.6
<.5
:i54
.9<.004
78
62
<3.0
<5.0
Maxi
mum
0.65.49.41.4
31099
6.3.19
930
36014<3.0 <5.4
>14.0
90th percen-
tile
0.34.06.8
.9
5131 4.2
.06 680
3412<3.0 <5.0 >9.0
Zinc 60/60 50 47 45 19 1.4 21 116 80
1 Detects are the number of samples with concentrations greater than the laboratory reporting limit.
2 To obtain concentrations at n geometric deviations above and below the geometric mean, multiply and divide the geometric mean by the geometric deviation factor to the n* power. For example, nickel concentrations at two geometric deviations above and below the geometric mean are
17 X (2.0)2 = 68 mg/kg, and 17/(2.0)2 = 4.3 mg/kg, respectively.
3 All detected thallium values were estimated to be greater than those values given.
20

Table ^.--Summary statistics for concentrations of metals in soils in Washington as determined by the American Society for Testing and Materials method D3987-85
[Concentrations are in milligrams per kilogram of dry soil; to convert to values in milligrams per liter of leachate, divide values given by 20; ~ indicates statistic not computed because concentrations in most samples were less than laboratory's minimum reporting value]
Metal
SilverAluminumArsenicBariumBeryllium
CadmiumChromiumCopper IronMercury
Manganese NickelLeadAntimony Selenium
ThalliumZinc
Total number of samples/ detects 1
12/012/912/112/1212/0
12/312/012/1 12/1012/12
12/1 12/012/012/0 12/0
12/012/4
Arith
metic mean
<0.04<2.0
<.7.7
<A
<.04<.l<A
.003
<A<A<A<A
<A<.5
Geo
metric mean
<0.04<1.8
<.7.5
<A
<.04<.l<.4
.003
<A <A<A<A
<A<5
Median
<0.041.8<.6
.4<A
<.04<.l<A
.9
.003
<4<A<A<A
<A<A
Arithmetic Geometric standard deviation Mini- deviation factor2 mum
<0.04>0.9 >1.6 <1
>.3 >1.3 <6.6 2.2 .1
<A
>.003 >1.1 <.04<.l
>.l >1.2 <A >2.0 >2.6 <A
.001 1.3 .002
>.l >1.2 <A <A<A<A
<A>A >1.3 <A
Maxi
mum
<0.043.61.62.4<A
<.05<.l
.7 6.3
.004
.7 <A<A<A
<A.8
90th percen-
tile
<0.043.5
<1.22.0<A
.05<.l
6.0.004
<A<A<A
<A.7
1 Detects are the number of samples with concentrations greater than the laboratory reporting limit.
2 To obtain concentrations at n geometric deviations above and below the geometric mean, multiply and divide the geometric mean by the geometric deviation factor to the nth power. For example, barium concentrations at two geometric deviations above and below the geometric mean are
0.5 X (2.2)z = 2 mg/kg, and 0.5/(2.2)2 = 0.1 mg/kg, respectively.
21

Table 7.--Summary statistics for concentrations of metals in soils in Washington as determined by the Extraction Procedure Toxicity method
[Concentrations are in milligrams per kilogram of dry soil; to convert to values in milligrams per liter of leachate, divide values given by 20; ~ indicates statistic not computed because concentrations in most samples were less than laboratory's minimum reporting value]
Metal
SilverAluminumArsenicBariumBeryllium
CadmiumChromiumCopper IronMercury
Manganese NickelLeadAntimony Selenium
ThalliumZinc
Total number of Arith- Geo- Arithmetic samples/ metic metric standard detects 1 mean mean Median deviation
12/0 <0.04 <0.04 <0.0412/2 <2.9 <1.3 <1 >6.612/1 <.7 <.7 <.6 >.312/12 2.9 1.7 1.5 4.812/0 <A <A <A
12/0 <.04 <.04 <.0412/0 <.l <.l <.l12/0 <.4 <.4 <.4 12/10 <.8 <.7 .7 >.512/0 <.0008 <.0008 <.0008
12/3 <.8 <.5 <.4 >1.1 12/0 <.4 <.4 <.412/0 <.4 <.4 <.412/0 <.4 <.4 <.4 12/0 <1 <1 <1
12/0 <.4 <.4 <.412/11 <.6 <.6 .6 >.2
Geometric deviation Mini- Maxi- factor2 mum mum
<0.04 <0.04>2.5 <1 24>1.3 <.6 1.6
2.4 .8 18<.4 <.4
<.04 <.04<.l <.l
>1.6 <.4 1.9<.0008 <.0008
>2.0 <.4 4.4__ ^ 4 ^ 4
^ 4 ^ 4~~ ^ 4 ^ 4
^ 4 ^ 4
>1.4 <.4 1.1
90th percen- tile
<0.0410.4<1.210.5<.4
<.04<.l
1.8<.0008
2.7 ^ 4^ 4^ 4
^ 4
1.1
1 Detects are the number of samples with concentrations greater than the laboratory reporting limit.
2 To obtain concentrations at n geometric deviations above and below the geometric mean, multiply and divide the geometric mean by the geometric deviation factor to the n* power. For example, barium concentrations at two geometric deviations above and below the geometric mean are
1.7 X (2.4)2 = 9.8 mg/kg, and 1.7/(2.4)2 = 0.3 mg/kg, respectively.
22

Table 8.-Summary statistics for concentrations of metals in soils in Washington as determined by the Toxicity Characteristic Leaching Procedure
[Concentrations are in milligrams per kilogram of dry soil; to convert to values in milligrams per liter of leachate, divide values given by 20; -- indicates statistic not computed because concentrations in most samples were less than laboratory's minimum reporting value]
Metal
Totalnumber of Arith- Geo- samples/ metic metric
mean meandetects 1 Median
Arithmetic Geometric 90thstandard deviation Mini- Maxi- percen-deviation factor2 mum mum tile
Silver 12/0Aluminum 12/11Arsenic 12/1Barium 12/12Beryllium 12/0
<0.04 <0.04 <0.04 <12.7 <7.1 8.6 >13.2
11.1 9.9 11.1 5.0
>3.4
1.7
<0.04 <0.04 47
2.3 19.1
<0.04
37.7
18.9
Cadmium 12/0Chromium 12/0Copper 12/0Iron 12/11Mercury 12/0
<.04 <.04 <.04
<2.8 <1.4 1.2 >4.8 <.001 <.001 <.001
<.04 <.04 <.04
>2.8 <.4 17.5 12.1<.001 <.001 <.001
ManganeseNickelLeadAntimonySelenium
ThalliumZinc
12/10 <2.0 <1.3 1.3 >1.8 >2.512/0 <.4 <.4 <.412/0 <.4 <.4 <.412/3 <.4 <.4 <.4 >.02 >1.112/0 <1 <1 <1
12/0 <.5 <.5 <.412/12 1.6 1.5 1.7 .4 1.4
<.4 6.5<.4 <.4<.4 <.4<.4 .5
<1 <1
<.4 <2.0.7 2.1
5.5<.4<.4
.5<l
<1.22.1
1 Detects are the number of samples with concentrations greater than the laboratory reporting limit.
2 To obtain concentrations at n geometric deviations above and below the geometric mean, multiply and divide the geometric mean by the geometric deviation factor to the nth power. For example, barium concentrations at two geometric deviations above and below the geometric mean are
9.9 X (1.7)2 = 29 mg/kg, and 9.9/(1.7)2 = 3.4 mg/kg, respectively.
23

10
Z O
Z Ul O
O 0.1 O
0.01
SILVER :
-36
- 12 - 12 - 12
1234
ANALYTICAL METHOD
100
10
0.1
0.01
ALUMINUM
3 -102345
ANALYTICAL METHOD
EXPLANATION
ANALYTICAL METHOD
O Individual value, greater than 90th percentile
i
T
90th percentile
75th percentile
50th percentile
25th percentile
10th percentile
1 Total method: 37 samples, all units in milli grams per kilogram (mg/kg): except Aluminum and Iron, which are in percent
2 Total recoverable method: 60 samples, all units in milligrams per kilogram (mg/kg): except Aluminum and Iron, which are in percent
3 ASTM (American Society for Testing Materials, leaching test): 12 samples, all units in milligrams per kilogram (mg/kg)
4 EP-TOX (Extraction Procedure Toxicity Test): 12 samples, all units in milligrams per kilogram (mg/kg)
5 TCLP (Toxicity Characteristic Leaching Procedure): 12 samples, units in milligrams per kilogram (mg/kg)
O individual value, less than 10th percentile
36 Horizontal bar denotes (laboratory reporting limit). Number of samples with concentrations less than values shown
Figure 3.-Concentrations of metals in soils of Washington State, determined by five laboratory methods.
24

IUU
10
1
0.1
10
z 0 1
CONCENTRAl
pL*
0.01
1,000
100
10
1
0.1
001
: ARSENIC :
o
; A i ]: v n :! v . . i: o ° :
: A1 11 11 11 :
: BERYLLIUM
: n; i :\ 6 i
U - 12 - 12 - 12
o
- o -
1 1 1 1
CHROMIUMI[ °
o 1 '
T :
o
- 12 ~ 12 - 12
l.UUU
100
10
0
0.1
10
1
0.1
0.01
1,000
100
10
1
A 4
; 1 ' ' ' ' ; : 9 BARIUM ;
o -
: -
o 9
: H :
: T :0
1 p
1 p o
1 ' 1 ' '
1 1 1 1 1 .
: o CADMIUM o- 1
-32
-60
: -Lg -12 -12
: COPPER :
0o
: o :0
: 1 :: ? A :r ' T: 8 :
; o ;
; 11 12 12 :
234
ANALYTICAL METHOD
234
ANALYTICAL METHOD
Rgure 3.~Continued
25

<DC
UJ O z. o o
TOO
10
1
0.1
10,000
1,000
100
10
1
0.1
100
10
1
n 1
IRON :
o
: 8 "
: M I :' I I R
' ' - 1 u T I 2 I 2 -i- 1
1 I 1 1 1
: 1 I i i I :
= MANGANESE '-
i * $ !8
_ 0 .
-
i o :
8 :
i2 :
: LEAD '.o
8
h i: T 6: . d
0
8
-12 -12 -12
i i i i i
10
1
0.1
0.01
0.001
0.0001
1,000
100
10
1
0.1
10
1
0 1
I MERCURY :
; O |
' 1 '
ft .
; 8 i :r - 12 - 12 i
i i i i i
j o NICKEL ;o
o
IS ;
: A :PM
i 8 i
: -12 -12 -12 ;
i i i i i
; ANTIMONY ;
o
-60
,
n
8
- 12 - 12 ^- 0
i i i i i234
ANALYTICAL METHOD
1234
ANALYTICAL METHOD
Figure 3.~Continued
26

CO
NC
EN
TR
AT
ION
c
I! (O § o
>o
z
5'
^
1
g F
co
2
m o
01
> o
"c
L _L
O
O
C
o oQ
J-o
o
o
- EH
>00 K
TZ
h
o Q
]c
N
-
0
1 O * m O
o
> c
5 £ c
ro CO "* 01
\ 2
- c
, |
i II
-O
I C
O _
L
O)
1 ro 1 ^
to
M
m
1 ?
-
-*
c
* -»
si.
-i.
0
C
CO
CO
1 ro 1 II
F
--*
-1
C
-1
2

124°
122°
120°
118°
to oo
49'
46'
12345
^ A
NA
LYT
ICA
L M
ET
HO
D
12
34
5
, A
NA
LYJ1
CA
L, M
ET
HO
D
\r"
1E
XP
LAN
ATI
ON
12
34
5
AN
ALY
TIC
AL
ME
TH
OD
12
34
5
-AN
ALYT
JC.A
L M
ET
HO
D-
AN
ALY
TIC
AL
ME
TH
OD
40 I
i i
80
MIL
ES
I
4080
K
ILO
ME
TE
RS
CO
NC
EN
TR
AT
ION
, IN
MIL
LIG
RA
MS
PE
R K
ILO
GR
AM
Soi
l reg
ion
1 N
umbe
r of
ana
lysi
s be
low
rep
ortin
g le
vel
3 N
umbe
r of
ana
lysi
s at
rep
ortin
g le
vel
1 To
tal m
etho
d
2 To
tal-r
ecov
erab
le m
etho
d
3 A
mer
ican
Soc
iety
for T
estin
g an
d M
ater
ials
met
hod
D39
87-8
5 (A
STM
le
acha
ble
met
hod)
4 U
.S. E
nviro
nmen
tal P
rote
ctio
n A
genc
y m
etho
d 13
10 (
EP-T
OX
leac
habl
e m
etho
d)
5 U
.S.
Env
ironm
enta
l Pro
tect
ion
Age
ncy
met
hod
1311
(TC
LP le
acha
ble
met
hod)
Figu
re 4
.-S
tate
of W
ashi
ngto
n, c
ount
y bo
unda
ries,
and
con
cent
ratio
ns o
f silv
er d
eter
min
ed b
y 5
anal
ytic
al m
etho
ds f
or 1
2 so
il re
gion
s.

o
iCO3; 3'
(Q
or oc3 Q. 0> 3. CD 0)
0>3 Q.O O3 O CDi-»
5O
0)
3Q.CD » » CD
CD Q.cr «<01 0>
Jtt
O9L
CDE? oQ. 0)o*
CONCENTRATIONCONCENTRATION
'CONGE!* TRATION
CONCENTRATION
CONCENTRATION CONCENTRATION
CONCENTRATION
CONCENTRATION
ONCENTRATION > _^
- 3 8 3
2 *!- i -10m *«"
Lo o
CONCENTRATION - I/"""> _» g \ _
-.08 /^
O ~l" "" 1 ^ CONCENTRATION
p - ^, -T. 2*. i . ^'~>- o 8
\ CONCENTRATION
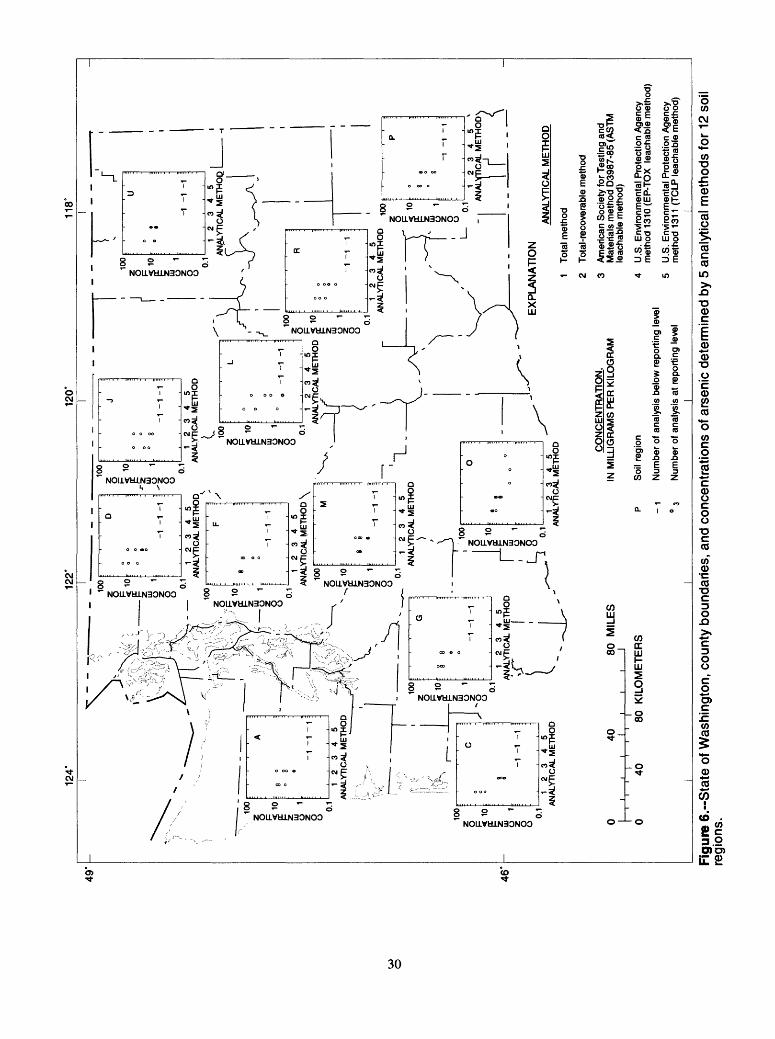
32! (Q«O '
o>~r
CO1 *05I *<D O
ico
(Qi * O
C7 OC3Q. 0)2. <D 0)
0)3 Q.O O3 O <D
o coo^0)53<D2 o'
Q. <Di *<D
13 <D Q.CT »<
O1 0)
oo?_
<Df*3- oQ. COQ"
ro co o
o 8 CONCENTRATION _

3 I! (Q(QO
COr-f
SCD O
01 (05'
(Or-f
O 3
O O
o-OC 3 Q. 01 3. CD CO
013 Q.O O
O CD
I6'
CO
o-0}3. C
a CDCD
3 CDa.
01QJ3
Ott.
CD31 O Q. CO-* O
toCO O
O"
00o
Im Rl
S S <Q.a a i sa so.=-.=
22.w wB> cr * « So
5" "2
- I.
01 «
3C 3C2.CO 2.CO =r- =r-o m o m Q.3 Q.3
5 3 S S.i, ^ O ^
O1! ?§
£B O OQ.<D 5"®»S. Sa2o S-o (D 3 Q) 33 ^ O"^!<! ®«|O f^ (DO
>
p bo
9fe m
CO Z -0 dm 53J 2d
O
co ro
S M 3 2.?§§. ^

Figure 8.--State of Washington, county boundaries, and concentrations of beryllium determined by 5 analytical methods for 12 soil
regions.o>
CONCENTRATION
o-r-o i 2 - o
5 " "* * d 10 oo - f
*. "" £" i '
°~ S*- i - g - o £ 01 I
- .u 9
- <1_ o -- ^ CONCENT?
P - i 2o i i 2 - / *~-{£^ m / V5-J i d N> o «m oo o 3) 0 ' £w iV> * } 2
2 / m * ' '
£ \ "'I"1 - CO * § ,, , ,,,,
V-T--JCONCENTRATION *
1 2 - 8 0 , | ......... ........ ........
» - £- .
5 u d 10 o.
? § g> z S«-
1 1 a 1 m- . - 3 5 <§. Eo S«n. 7 ° - o o 2 O O O -1
§ § io 1- 1- wS \ " » TJ d »
o> o> rn ^ 4
35" So V? * 5-z \ a 3 0 ) 3 "2 33 *« s i - f ( f'~ i. rn V ^\
i r\ 01 *. w ro -* ^ >
|W £w |£§ s; 5;
as1 a? |s-J n 3 r- a| »| 33^ 1 | ^ oco ^ -= 0| gfflg « §. f b '!!5S'S5!¥3'S-Si F ' ^. ~* "1<Dm<D-'QCOO^ ^ . i ^^O3 753 &oL>? 5" 3 ' f r^SL ^.» ^03- 3 O C " "
S3 §J SH I ^ ""i10 H-ffl ffS 7^8 g^ 2 Ijfe w
11 II M S i- (D 3 0) 3 SO> O 1 ^ rn
l-s- fi- §a o I" JJ.O ffl gJ O L- "-1
S1* |<
CONCENTRATION
,wip - s __. ___ - r"^' a ; 2=«-;; < p - - 1 - -' " vl \' 3--i ; j: i _ J i.. 0J -1 ,o 1
NATION J ____ - j
o A, h C
t^&>^ Ur ^^-^-.'1 :>*r vr\»r s .:-
1 2 - «
r dlO ,,00
^-£U ^
i* 'i-. 7 *-
HJ /' *
^~4 ( ^ u
V 1* \ S01
_/'V- 8 / CONCENTRAl
1 Is.
1~- J>w j^
"/ 1 m * ' 1 ) So-
-L~4 o ......... ..-.. NCENTRATION
O _! ~ " '
i* -» O
* "u
1
-» "0 1
a
**
*A
J
/-I ^V """ 12345 r^ §
x/| /'( ANALYTICAL METHOD \ «nnl
»
MB
-1
^ » ^"V;
^Lv.^r !!--" CONCENTF
1 S
o a
1
^
-Ur-
CENTRATIO
p
I)
i
i * i- i
ION
c
10
JJ
"s " ~~l
<^ iI __
CD
'/'
1 »
^ ^WT^^/I
1ATION "5l<K ' ^ *
CONCENTRATION -op ."" '""" ^2 2 - o ' ^o - | "" ' " -" 1
- §- « d 10 . ... O
. (Sw I~n f ~*
- Sn*' i o
\vXJ '; iCONCENTRATION \
« 2 . s- !- , S /^3^ «. . -
/ jfew i
: |- i .- _ v 501 - i-V 8 , -,--,.. . . i w
K -, 11
CONCENTRATION '
- 1 2 - 8 - ' '" '" d 10 - - _
jfe w j^ - |
§*" ^ c " '
o"1 -
ro ^
ro ro
ro o
00

124°
122°
120°
118°
u>
u>
49°
46*
12345
AN
ALY
TIC
AL
ME
THO
D12345
AN
ALY
TIC
AL
ME
THO
D1
23
45
A
NA
LYTI
CA
L M
ETH
OD
12345
AN
ALY
TIC
AL
ME
THO
D
12
34
5
AN
ALY
TIC
AL
ME
THO
D
12
34
5
AN
ALY
TIC
AL
ME
TH
OD
12345
AN
ALY
TIC
AL
ME
THO
D
12345
AN
ALY
TIC
AL
ME
THO
D
12345
AN
ALY
TIC
AL
ME
THO
D
12345
AN
ALY
TIC
AL
ME
TH
OD
.._LL
.J12345
AN
ALY
TIC
AL
ME
THO
D 40
i i
i I
80
MIL
ES
i 4
5A
NA
LYTI
CA
L M
ET
HO
D
CO
NC
EN
TR
AT
ION
. IN
MIL
LIG
RA
MS
PE
R K
ILO
GR
AM
T
40
EX
PL
AN
AT
ION
AN
ALY
TIC
AL
ME
TH
OD
1 To
tal m
etho
d
2 To
tal-r
ecov
erab
le m
etho
d
3 A
mer
ican
Soc
iety
for T
estin
g an
d M
ater
ials
met
hod
D39
87-8
5 (A
STM
te
acha
ble
met
hod)
80
KIL
OM
ET
ER
SP
Soil
regi
on
- 1
Num
ber
of a
naly
sis
belo
w r
epor
ting
leve
l
0 3
Num
ber o
f ana
lysi
s at
rep
ortin
g le
vel
4 U
.S.
Env
ironm
enta
l Pro
tect
ion
Age
ncy
met
hod
1310
(EP
-TO
X te
acha
ble
met
hod)
5 U
.S.
Env
ironm
enta
l Pro
tect
ion
Age
ncy
met
hod
1311
(TC
LP te
acha
ble
met
hod)
Figu
re 9
.-S
tate
of W
ashi
ngto
n, c
ount
y bo
unda
ries,
and
con
cent
ratio
ns o
f cad
miu
m d
eter
min
ed b
y 5
anal
ytic
al m
etho
ds fo
r 12
soi
l re
gion
s.

33 (Qua
p "iGO«-*0} «-* CDO *»
0)o>
(Q«-*O
CT OC
Q. 0>13. CD CO
0)3 Q.O O
O CD«-*
3«o'
0>
o3-
3E'
3Q.CD«-* CD
3 CD Q.CT *<
<Jt0>3
3CD
IT O Q. COo"^
loCOo
CONCENTRATION ^r\^r.- \
b ° _L 5 X i .1 "-'^',-^ 2 L. _ o g
_£ -I- « -I b^ j'
, A O J ^ ( CONCENTRATION^ CONCENTRATION,
O ,, . , , . , ,, , , ,, CONCENTRATION > S S _ g g g go _. 5I *^ i i iiim i MIN^ i Muni i inim i inim .^ ^ ^ .^ o Q I °t^-. . b P - o - - - - o o^^
00 .
CONCENTRATION^ ^ _" ^ uu O
2*1-' HO __;_____ o
2 u O | ""l- '""" "'""' ""'" ^ CONCENTRATION^
> I - - o 8 I x . ^ O - I I CONCENTRATION^ / |O ,, .. ....^ .,,,,^ ......^ ,,,,.. r~ o . -- r- o ' ""'" """ """' '""" ""'"' I . -^ 1 0 p _ g
^ _L _L _L o o o vro- ooo
V\ V 3 t\3l- coo
TL x r " \ ' ~ ' CONCENTRATION^
b P -i o o > -L _L -L O O O
_i_id' \!^_- o»- J CONCENTRATIONa 2 o ' ( \5 C^, o - £ g Z ) 5M' «* - ^ b P - S g l _ t' ^J»- J^-i-i-iOO S3 ] r
" "" CONCENTRATION . _i o _ -o x w ' 1 ____
cr ^ i2° -»ogO ....... .....I ,,,,ud ,,,,,y ...,J \ >_ ,-, , _ ^^ ^
m L' S
i' OlU I

cB Z! CQ<Q
CO« *
2. CD O^
0)
CQ 3"
a- oc isQ. 0)U. CD
QL O O3 O CD
o o
T3 T3
CD ia. CDCD
CD Q.O"
Ul 0)
2L S
O
3CD
O Q.
ro w o
COo~-
33 =
X X 3
3C
-i S.ESS
ol
3C2.05
Is123
Tnai
g; 5" (D 3
" -'
!>cFici 3? (D O
mCO
3 FO
w" a-<
jfJ(Q >£D^2
S CT(D
3(D
CONCENTRATION

-ti. «>. O) CO
(32! CQ (Q 5'53 J CO
ro
0)
Io-*
(u(03; 3'
(Q .-* O 3
Ooc
a- oc3 Q. ff) 3. (D OT
Q. O O3 O CD.-*53o'3 COO
IQ. CD.-*
(D
3 (D Q.CT <
cnff)3
o
ogo.
CD:? oQ. CO-+lo
JO COo
CONCENTRATION^
> * * O O
-CONCENTRATION
P o ' > -» -» o o
CONCENTRATIONO
-> o o

CD -M (Q<QO =
PiCO
CD CD O
iCO
(Q O
CT Oc13 Q. 0) 3. CD CO
0)13 Q.O O13 O CD13
I O=3 CO
Q. CDS"
13 CD Q.CT »<
Ol0)3
o 9L3CDi cIT O Q. CO31
roCOo
00o-
mm 33CO
mCO
I I I
III. 2. 9. iQ) Q)3 3 E. E.
3 6"
1 I 5' -a(Q O
C71 .*>.
3C 3CSen 2cn 3" 3"
2 m 2 m 0.3 0.3-.. £. -j. £."3 "3_i= O3 3 ^3HO) ma>
II §1 So 3-0 <D 3 Q] 3
3 > S> 2 to coco 2.tD ^ to 3-3 33 o o to o a1* 3^o
z
Eo Q O 33 > O
-Q 3D>
to 2 tu m 3^?§8-»§' oT01 = g3W I|8
Us

124°
122°
120°
118°
49°
46'
12345
AN
ALY
TIC
AL
ME
TH
OD
z 1
0,00
0
p
1,00
0 "~
10
0
12345
AN
ALY
TIC
AL
ME
TH
OD
40
80
MIL
ES
CO
NC
EN
TR
AT
ION
. IN
MIL
LIG
RA
MS
PE
R K
ILO
GR
AM
EX
PLA
NA
TIO
NAN
ALYT
ICAL
ME
THO
D
Tota
l met
hod
Tota
l-rec
over
able
met
hod
3 A
mer
ican
Soc
iety
for T
estin
g an
d M
ater
ials
met
hod
D39
87-8
5 (A
STM
te
acha
ble
met
hod)
4080
K
ILO
ME
TE
RS
p -1 °3
Soi
l reg
ion
Num
ber o
f ana
lysi
s be
low
rep
ortin
g le
vel
Num
ber o
f ana
lysi
s at
rep
ortin
g le
vel
__
__
__
__
__
I__
__
__
__
__
__
U.S
. Env
ironm
enta
l Pro
tect
ion
Age
ncy
met
hod
1310
(EP
-TO
X te
acha
ble
met
hod)
U.S
. E
nviro
nmen
tal P
rote
ctio
n A
genc
y m
etho
d 13
11 (
TCLP
teac
habl
e m
etho
d)
Figu
re 1
4.-S
tate
of W
ashi
ngto
n, c
ount
y bo
unda
ries,
and
con
cent
ratio
ns o
f man
gane
se d
eter
min
ed b
y 5
anal
ytic
al m
etho
ds fo
r 12
so
il re
gion
s.

cB Z!(Q(Q O C
*iO1
0) CO IT3'
CQ«-* O 3
O OC
CT OC 3 Q. 0) a. 0 w
0) 3 Q. O O 3 O CD
Q.CD«-* CD
3 CD Q.CT »<
OI0)3
o
iCD5 O Q. COS'
IV) CO O

.S~Z.
CONCENTRATION / > _ 'I *

(Q(QO 5 =>
CD
a0) CO 17D'
CQO
O Oc13 »<"
CT Oc DQ.
Q. O OD O CDD
Io'
3'
oD *<Q. CDCD
CD Q.CT *<
Oi
oSL
CD5 oQ.(fl t*o
ro u> o

(Q(O
l|oo
COft-
Si CD
CQ*-* o po oc13
or oc 13Q. 03 =!. CD W
Q.O O3 O (D
C/)5L CD:3_c3Q. CD*-*
CD
13 CD Q.cr <01
ow_
ro E? oQ. 0)o1
roC/)o
\ ' 5 I '"".HI ,.,..,.. ...H,
TRATION - I

(Q(O O =
(Q-* O3
O Oc
CT Oc 3Q. 0) 13.CD W
Q. O O3 O (D
3Q.CDt » (D
(D Q.CT *<
010)3
oBL3(Di
O Q. COO*
CONCENTRATION _. .<£ *- I- , -1 / -i. *" °
o ^ ~"___________z z CO Z > I I O ."-. "- "- " O
3 3"' io i: , H ^ ° 9 ^ i I y- CONCENTRATION
05 * >S 3 " L o ' I /'^^,. / m m H 01 . | . / \^- j- CO Z S I A CONCENTRATION
': » a? - , . .^^- t=,,,,-,,,,o,.,8^ L.
3 o" ) N o~T '""TVD 3Do > ____ a- ^ / i i -, < . o
4 T ^ \° m v x\ i L_ _ ___§
"° " CONCENTRATION > K c
*. w ro -^ Z>
^. |S §|| I I O *) I 3M "^"^ CONCENTRATION omom?=.S-A= - ' -J °
8 I -> "3 »3 ^3co §?1 ___! \
3 °" ^ ' ^ m<D ?oO) a; ^ , CONCENTRATION O
3 d
_ -n {J -n CO -s m <D^'v4'«5_i*'Fb- S^ ...... m^ cSB O
osr «« ia - mO ?<Q 5
O0)(Q ^"-
l^«
oD

Figure 20.--State of Washington, county boundaries, and concentrations of zinc determined by 5 analytical methods for 12 soil
regions.
i i i i i i i i i
0 40 80 KILOMETERS P Soil region
- 1 Number of analysis 0 3 Number of analysis
> below reporting leve > at reporting level
4 U.S. Environmental Protection Agencymethod 1310 (EP-TOX leachable method)
5 U.S. Environmental Protection Agencymethod 1311 (TCLP leachable method)
I
- ]""'//
CONCENTRATION , : CONCENTRATION^ , /
.t -ox ; =-* ; ]^\. P - s s .,- ' P -too '<&^, 7.*. '; } > -* ~* ° ° ° ' . > -t -t 0 0 0 / ,', ' ' ? | i i.,,., 1.1111, i i.iim I.HIIII, , /z M1"' ' ' ' " "" "11- ' i X > . "to r~ * - (D ' /
§:: . °°:n ' i- . . ; ; / * 2 M " ' £ « . . r / o ? w l - - r'\
S * - o - "'"" m * ' ° - '"' VQ] 0 H oi o . \ Hoi-o - -I"1'0 - ;»
0 ...... ........ ........ ,. .... . § - - - 'u K^...-*A /
m 1 CONCENTRATION^ i ^^^/-"J >./-- ' " "^*\? v-^§/ >?x .^~^~^^XV.,. /^'^
2 ^ > -1,11,r,,,,,,?,M,,°,,,,,° [y ^ ^^^^.^^-^^^Y^^'''"^--1'"'S ^~l;: ." : ; /' "'':y:"" "
S^'1. 'coHC» L =CONCEN :°S oo-ce* -. {2U D 0 --o^--S88o ^ s 8
fn ^--ooof g i """i .in" . MI., .I.M...IWO 1 "" ^ -il"*' MU..J £ ,,, ,, , ., , ,«. '-. °° " >^
CONCENTRATION^ ^co-i S^.'o' . * W " i -to ^ ~^ rn -nS*.-o
P -too SA-O -Hoi-o .rn Q _t_t0oo m si ^ioi-o > ,,, ,,,, . ,., ., , HO]_ n - P .............................. ''g0'
>_, 5 'o O ......^ ,,.. ., .., ., ....... v
^ 3ro. . "_j ( - J5~^ Si^/" " ~^
F > co . o . ^ i CONCENTRATION^
082*0 , { ^P-S'o' 33 Z m o ' . O*. - - o o o^O i"1- ° - CONCENTRATION^ / z """"' ' """" """" ' '""" ' W Z § ' " ' "" "' """ " "'"' r~ ° _ S o 5 °°-0 H \ ^ ^*» » . lt-tooo ^ivj- coo
H i i r-_t. ooo-\^-t ^ 0 k v ^ » 2 *. - i6-z \ V p- -' m. -, S f > -« l -^o.. ,.r . ,......,. .> v ''U ___ . 2 * o - 0 Ss , / 1 3 f" ~7 / / - ' 3 01 - o - ^
( / i o .............................. ^;m \ x< ' 1 u , /-^'x N \ l~ _ _ ,__^ - CONCENTRATION^ (f
W IV) -t ? ^~~x o -to
H1 %l >--ooo{' CONCENTRATIONS^f 2* 2* 0 ' (1 ^ ........................... .^OJCD B B Z ) 1 [^- .0 - ^^ ^ ^ 3 o o ^^ ., a_^ 3M. . - / z ....-.."«... ., ,,, ^,
5-5TS 8 | > , ' \ >oo- , - C ^ " " " flo ^ o 1 CONCENTRATION^^- 2 A . ^ - \ o
f|i | 5 p -o-§ 5- - "-"V *"- - g.o.x:eD d L^-tooog S^*.. -Off 3Q z , , , ,, o __ , , s L
W-, CD ^ >^. . . £ en. - - n 1°Re? ? 2- 3 O .... ..,..,,.,.,..,.,. .., .T^SlQ-m O <w»- D """"' """"'00 =? i > 1^J(Q 2 1 * W °
">0) O 1 S *. o - _ _____
d ^ O! 0
O ' '"""' ' """ ' """* ' '"""
i
A i i
J
i i

(c3IS)
CO
OpO O
CTo
Q. 0>3. CD W
0>D Q. O
0>3.o]CD
N CD Q. co'
=T. CT
"D enQ.CDCD
CD Q.
ro c/> o
SCOo'DCO

124°
122°
120°
118°
46° - Fi
gure
22.
-Sta
te o
f Was
hing
ton,
cou
nty
boun
darie
s, a
nd s
oil-s
olut
ion
pH d
eter
min
ed b
y 2
anal
ytic
al m
etho
ds fo
r 12
soi
l reg
ions
.

*.(O
3<QC
10w
U) r-+Q) r-+
CD O
to3; 3'
(Q*O3
Ooc
CT OC 3 O. Q) =3. CD 0)
0) 3 O.O Q>3- o3 Oo3r-+
CDr+
a. CDr-+CD
3 CD O.
cBCQo'3 O)
CONCENlO-r-0 P Q
8 b Pz '
S-" o^".. ^M- - ^ nj »- i . _ O T ro
00 § n.Nil ,.,.LI. Io -
Ti.
B 1 2 - / > "
21 ,O5 L§ , g-- w 2 / S* r s
m N mu\ 0
VCONCENTR
1 1 2 .?i-o> to . ox>
Z m o> - ooo
o 1 TJ I
10 -1 ° , ii
Z Z CO \
ill \ cr cr S \ ? ? <S o \ o o o § ,
EXPUNATION
NCENTRATION. ANALYTICAL METHOD
IN PERCENT
1 Total carbon
analysis below reporting level 2 Organic carbon analysis at reporting level 3 Inorganic carbon
I
RATION CONCENTRATK
-38 P o -., t _::, § 1 2 - 3 ;-;.:; --;; ' / I -^ > Ml|l»!i "" "|1||«l 1|"111
- ( y- vl u ... - - /n -5 ,1 > to - ooo
0 '/ I 2 / _ __ m w. ,.. j JL-mi 3CONCENTRATION ^ , """" ' " "'' .'..1 ' ' '"""'
o \, F'^t- 2 2 - 3 8 ^%:^, ^ p1
- < j ^"fti^Je- - if fS^,
j, ° ; i' - CONC / y o,. ,i,,i IIIIIILI ,,, / / b P
/ < 2 2<, >
CONCENTRATION >ATION o 5 -L
_. bP0 ^ * 3"^ 22iL^o8Q 08 > I'M, '.niiiinnii, in n ^ ro -
I m 5 ^^
^-^ - , |«- ^00
0 §ffc tO . o. -| 0 IN Mh
o- |-i «' /2 ,r,,,l . ,.,nl ii.il I, ml ,.,! /
< , Mini .
CONCEN
, i S Sj^_,^_|
\ O l ^ tol-
\ 2^ /j^ ____ ni o> - i
- ^ / 1 O
V /\ , CONCENTRATIONr~^\ ° n\ V §12-38
1 ' 5-- ooo -
( \ « ) J f£ ro - oooJ-- <-^ 1
CONCENTRATION \H w ' _J ° B " . o o I x P -^ S "Li " J|J IL1" ' '-' "i|J'-i § o P ^ o ° 1 - - - -x 0 0I I -" -.
g - J i0 >ro- - -
12_,W ^ T, J _
g M,,l UUIJ MHM.irt,,,,
-' ]"""//J ; II MI'11 ... /
: ! ; 7i
I \ N^-/A /
ENTRATION i CONCENTRATION
° - o 8 P o §22-38 > n-i,,,, ,, ! mr, ,., ! ,, ;,;
0 °° ' §-, .. : -1 1 :>ror o.
n - 2 , !
,,.- . AH"; i°MVg 1 ';,i| mnl 'Hii'l * -
CONCENTRATION 'p o
TRATION 2 2 2 -* o 8 1- ,z i "" "'"" "" ' '"" "'""i |
-38 /£ 1
o
^ 2
ooo - (~'H "^ ' «- -x| w « r- - ' ° 1
n, , , \^'
~~Tr~~ "H
J CONCENTRATION
° 08 b P - o ,-^~- "* ""*" "* -^ O O ^_.
« ;- ; ....., _ ^0
v> ro .'"" " r-,
'-15 -1 "L-i 5 » - i c -I '- o
1
A 1 1
,j
I 1
fo^
ro ro
ro o
CO

Table 9.-Frequency distributions of metals concentrations in soils in Washington determined by the total and total-recoverable methods
[N and L indicate that the null hypotheses that the data are distributed normally or log-normally could not be rejected at a 95 percent confidence level; (L) indicates that the null hypothesis could be rejected but the correlation coefficients and graphical inspection of the plots demonstrate that the distributions are more nearly log-normal than normal; O indicates that both null hypotheses could be rejected; signifies that hypothesis was not tested because concentrations were not determined or too many were less than the laboratory's minimum reporting level]
Total method
Metal
AgAlAsAuBa
BeBiCaCdCe
CoCrCuEuFe
GaHgHoKLa
LiMgMnMoNa
NbNdNiPPb
Distribution
LL N
__ L 0
L(L)(L)~L
N(L)~NL
(L)LL
(L)
OL
(L)(L)(L)
Total number of samples/ detects1
37/037/3737/37
37/037/37
37/3437/0
37/3737/4
37/37
37/3737/3737/37
37/337/37
37/3737/3737/0
37/3737/37
37/3737/3737/37
37/737/37
37/3637/3737/3737/3737/37
Total-recoverable method
Distribution
LL«
N--~~--
_(L)(L)
~L
_L
__~N~
__~
(L)~N
Total number of samples/ detects 1
60/1260/6060/59
0/00/0
60/600/00/0
60/00/0
0/060/6060/60
0/060/60
0/060/52
0/00/00/0
0/00/0
60/600/00/0
0/00/0
60/600/0
60/60
48

Table 9.--Frequency distributions of metals concentrations in soils in Washington determined by the total and total-recoverable methods-Continued
Metal
SbSeScSnSr
TaThTlTiU
VYYbZn
Total method
Distribution
(L)(L)
L N
O L--
LL
(L)(L)
Totalnumber ofsamples/ detects 1
37/3637/2937/3737/0
37/37
37/037/36
0/037/3737/0
37/3737/3737/3737/37
Total-recoverable method
Totalnumber ofsamples/
Distribution detects 1
60/060/0
0/00/00/0
0/00/0
60/210/00/0
0/00/00/0
L 60/60
1 Detects are the number of samples with concentrations greater than laboratory minimum reporting level.
Comparison of Metal Concentrations Among Regions
Concentrations of metals in the various regions were compared to determine whether the regions are different from one another or whether data in individual regions are sufficiently similar so that regions can be grouped. If the metals concentrations in the individual regions are statisti cally different from one another, then sets of data should probably be developed and statistically analyzed sepa rately for each region to define baseline concentrations. If not, then data sets from different regions could be grouped and statistically analyzed to define baseline concentra tions, if geology and pedology support making such groups.
Kruskal-Wallis Test
The Kruskal-Wallis test, which is a non-parametric one-way analysis of variance (see, for example, Iman and Conover, 1983), was used to compare the mean ranks of metal concentrations determined by the total and total- recoverable methods in a region with the corresponding mean ranks in other regions (at a 95 percent confidence level). The test was performed separately for each metal. The null hypothesis, that the population means of metals concentrations in each of the 12 regions were equal with one another, was rejected for all metals tested, except total copper and manganese. However, this does not imply that the population means of all metals tested for each region are different from one another, nor does it indicate where differences are located.
49

Fisher's Least Significant Difference Test Cluster Analysis
To determine where differences are located among the 12 population means for each metal, the Fisher's Least Significant Difference test was used (Iman and Conover, 1983). A test statistic was calculated for each metal from the values generated by the analysis of variance of the ranks. The mean ranks of the 12 regions were then com pared, and the test statistic was used to determine whether the mean ranks, and therefore the concentrations of metals in the regions, were similar (at a 95 percent confidence level) (table 10). For illustrative purposes, table 10 shows a comparison of concentrations of metals in region A with those in the other regions, in which concentrations of met als are not significantly different from those in region A (underlined values). The concentrations of metals deter mined by the total method in region A are similar to con centrations in all other regions, with the possible exception of regions J and U, where 4 of 11 metals did not compare well, and region P, where 7 of 11 metals did not compare well. Concentrations of arsenic, copper, and manganese for region A are similar to concentrations in each of the 11 other regions, and concentrations of lead and zinc are similar to concentrations in 9 of the 11 other regions.
The total-recoverable metals concentrations are not as similar among regions as the total metals concentrations (table 10). Only concentrations of total-recoverable arsenic and lead in region A are similar to concentrations among other regions. The concentrations of total-recover able arsenic and lead for region A compare well with concentrations from 10 of the 11 other regions. Concen trations of all metals in region A are similar to concentra tions in region F and to concentrations of 8 of 11 metals in regions G and L. The association between regions A and F is particularly strong and may result from the similar nature of the parent material from which these soils were derived and the similar climatic environment in which these soils were developed.
A comparison of differences between the mean ranks of metals for regions O, P, and R with the test statistic indi cates that concentrations of metals in these regions are similar at least to one other. For example, the rank means for total-recoverable beryllium of region O and region P are not statistically different; likewise, the rank means between region O and region R are not statistically differ ent; however, the rank means between regions P and R are statistically different. The three regions are located adja cent to one another and are composed primarily of soils that developed in fine wind blown sediments under fairly similar climatic conditions.
Cluster analyses (see, for example, Kaufman and Rousseeuw, 1990; and Romesburg, 1984) of total and total-recoverable metals concentrations were also per formed so that data could be placed into distinct groups without presupposition of existent regions. This analysis was also performed with ranks of the data. Cluster analy sis is designed to classify data by assigning observations into more or less homogeneous groups that are distinct from other groups. Well-separated cases of the data were chosen as cluster centers to which individual sites were assigned to form distinct cluster groups.
Cluster analyses indicate that samples collected from regions A and F and sites 4 and 5 from region D may be combined into two distinct groups. One group consists of sites that are located in an inner ring encompassing Puget Sound (sites F3, F5, A2, A4, and D4). The remaining sites, of regions A and F and site 5 from region D, com pose the other cluster group, which forms an outer ring in the Puget Sound uplands.
Cluster analyses also indicate that samples from regions O, P, and R may be placed into two distinct groups. One cluster group consists of sites located in the southern extent of region R and the southwestern extent of region P (sites Rl, R3, R4, R5, P4, and P5). The other cluster group consists of all sites located in region O and the remaining sites in regions P and R (sites 01,02,03,04, 05,Pl,P2,P3,andR2).
Relations Among Metal Concentrations
Correlation coefficients and regression statistics between total-recoverable and total metal concentrations were calculated for those metals for which concentrations were determined by both methods and for which concen trations were greater than the laboratory's minimum reporting level. The Spearman ranked correlation coeffi cients for 11 metals ranged from 4 to 70 percent (table 11). For 7 of the 11 metals tested, total-recoverable metals con centrations correlated with the total metal concentrations in the soil at a 95 percent confidence level. For the remaining metals, the total and total-recoverable concen trations were statistically independent of one another. Pearson correlation coefficients were calculated from non-transformed data for the seven metals that displayed significant Spearman ranked correlation coefficients. The Pearson correlation coefficients ranged from 41 to 98 per cent and confirmed that for all of the seven metals tested, including aluminum, arsenic, copper, chromium, iron,
50

Table IQ.-Mean ranks of total and total-recoverable concentrations of selected metals in different soil regions in Washington
[Values in parentheses are test statistics determined from an analysis of variance of the ranks, and underlined ranks are not statistically different at the 95 percent confidence level from mean ranks for region A; n, number of samples used for statistical calculation]
Mean ranks of concentrations from total method bv soil reeion. n = 37
Metal
Al
As
Be
Cr
Cu
Fe
Hg
Mn
Ni
Pb
Zn
(13.2)
(15.1)
(12.5)
(12.5)
(18.3) 1
(14.2)
(11.8)
(16.5) 1
(12.0)
(14.4)
(14.1)
A
25.8
19.0
£Q28.024.2
24.5
30.5
18.0
25.3
11.3
20.0
C
14.7
34.0
152
31.2
11130.3
34.5
29.0
29.0
26.2
34.3
D
30.8
24.5
m32.3
17.2
15.8
26.3
10.2
34.0
8.0
26.0
F
21.8
16.7
112
23.2
25.7
16.2
24.8
26.2
26.5
11.0
117
G
27.3
23.5
21.3
17.0
23.8
29.0
19.7
24.7
14.7
25.0
27.5
J
12.2
&Q21.3
10.8
24.3
6.2
10.5
16.7
11.5
21.0
£3
L
30.5
16.3
27.5
27.0
25.3
18.5
7.0
21.3
27.5
25.2
25.7
M
23.5
4.8
m18.3
20.7
28.8
21.8
26.5
13J
10.8
21.7
O
11.8
21.5
27.5
173
18.0
17.7
14.0
16.5
19.8
23.3
12.3
P
8.8
14.8
22.9
5.4
128.0
7.0
11.0
3.6
12.0
5.5
Mean ranks of concentrations from total-recoverable method bv soil reeion
Metal
AlAs2
Be
Cr
Cu
FeHg3
Mn
Ni
Pb
Zn
(9.8)
(19.2)
(15.4)
(11.6)
(15.9)
(15.2)
(13.2)
(16.8)
(14.4)
(17.4)
(16.3)
A
554
34.4
36.5
50.6
49.3
51.7
54.4
38.4
39.6
33.5
45.1
C
4.0
23.3
3.0
14.9
3.0
5.7
22.2
3.0
8.3
3.0
3.2
D
38.4
35.9
22.0
48.7
22.0
25.9
46.0
19.8
50.2
23.2
34.3
F
49.0
27.5
33.0
47.1
47.0
37.2
49.0
39.2
53.0
25.5
38.0
G
45.0
36.2
411
36.7
43.3
51.0
40.7
50.3
37.1
39.5
49.5
J
16.6
20.3
17.6
26.1
26.8
14.4
26.4
21.0
23.723.0
21.2
L
40.9
22.6
4L5_
48.0
34.7
29.4
19.9
26.2
38.7
29.1
44.2
M
38.3
16.2
52.4
35.2
4L8
47.0
33.6
47.4
36.5
34.8
33.2
O
17.4
42.2
32.0
19.9
32.9
31.3
37.3
33.0
31.4
39J.
25.1
P
28.8
25.7
39.3
13.9
24.3
26.8
26.5
34.8
16.1
37.5
23.4
R
4.7
18.2
21.3
10.0
16.3
25.2
16.3
23.7
15.5
22.0
18.7
.n = 60
R
8.0
31.0
14.8
4.7
14.5
22.6
22.0
21.4
11.2
22.8
15.0
U
19.5
28.2
27.5
12.0
13.7
11.5
19.5
1Q12.0
34.5
15.8
U
24.2
55.0
28.8
20.2
26.4
23.0
16.9
3L5_
20.2
51Q
33.8
Test statistic probability of error greater than 10 percent.0 n = 59; values below reporting limit not used in calculations of mean rank or test statistic. 3 n = 52; values below reporting limit not used in calculations of mean rank or test statistic.
51

Table 11. --Correlation coefficients and regression statistics between total-recoverable concentrations and total concentrations of selected metals in soils in Washington
[Rs , Spearman ranked correlation coefficient; RP, Pearson correlation coefficient for goodness of fit for the regression equations; a, regression coefficient (slope); b, regression coefficient (intercept); total-recoverable concentration = a x (total concentration) + b; ratio, total:total-recoverable; underlined values demonstrate a significant correlation at a 95 percent confidence level; ~ indicates no value calculated]
Ratio
Element
AgAlAsBeCeCuCrFeHg1
MnNiPbSbSeZn
RS
6856
4
58705158276523 ~
29
RP
II46
77M6141
98-~-
a b
__0.87 -4.9
.27 2____
.62 -.8
.53 -22
.47 .4
.12 2..
.76 -7-.__-.
Mean
0.27
.59
.42
.60
.28
.53
.32
.58
.58
.66 ~
.55
Standard deviation
0.14
.25
.29
.21
.11
.17
.23
.23
.22
.31
.19
Example: If total aluminum = 7.3 percent, then the estimated total-recoverable aluminum concentration equals (0.87 X 7.3 percent) - 4.9 percent = 1.5 percent.
1 Values for mercury do not include data for samples collected from region C.
mercury, and nickel, total-recoverable concentrations cor related with total metal concentrations at a 95 percent con fidence level. Therefore, the amount of these metals that may ultimately be bioavailable is dependent upon total concentrations in the silt and clay fractions of the soil. A poor correlation between the total-recoverable and total metals concentrations of beryllium, manganese, lead, and zinc suggests that the form in which the metal was held within the mineral matrices, on various exchanger sites, or in poorly crystalline to amorphous compounds varied among samples.
A dilution factor for silt- and clay-sized particles in streambed sediments, described by Horowitz (1991), was used to correct for particle-size differences between the metals concentrations determined by the total method and those determined by the total-recoverable method.
Spearman ranked correlation coefficients were calculated for the corrected total metals concentrations and the total- recoverable metals concentrations (not shown). For all 11 metals tested, the correlation coefficients calculated for the corrected total metals concentrations were less than those calculated for the non-corrected total metals concen trations. This suggests that the bioavailability of metals in soils does not depend upon the total metals concentrations in coarser (sand) sized particles.
Table 11 also lists regression equation constants for the same seven metals, as well as means and standard deviations of the total-recoverable to total ratios for each metal. The mean ratios range from 0.27 to 0.66, and there are apparently no relations between the correlation coeffi cients and the mean ratios. The ratios between total- recoverable and total values (not shown) also vary from
52

region to region. For example, in region C, the ratios for both manganese and zinc approach 0, whereas in region F, ratio values more nearly approach 1.0. Low total-recover able to total ratios suggest that most of the metal is held within the mineral matrix and is only removed when hydrofluoric acid is used during the total extraction pro cesses. Conversely, high total-recoverable to total ratios suggest that a larger fraction of the metal is held on exchanger sites or within poorly crystalline to amorphous compounds and thus can be removed more readily by weaker extraction procedures. Therefore, in region C, most of the manganese and zinc are held within the min eral matrices, whereas in region F, where higher amounts of organic carbon are available to adsorb the manganese or zinc, more of these metals may be found sorbed as organic chelates.
Relations Among Leachate
The ASTM, EP-TOX, and TCLP methods simulate leaching processes in soils under extreme conditions. Even though most metal concentrations in the leachates of soil samples from this study were below laboratory mini mum reporting levels for all three methods, barium, and less commonly aluminum, iron, mercury, and zinc, were detected, and concentrations of these metals in the leachate were always a factor of 100 or more less than corresponding total or total-recoverable concentrations.
Spearman ranked correlation coefficients were calcu lated for barium, aluminum, iron, mercury, and zinc con centrations determined by the total or total-recoverable methods and by the ASTM, EP-TOX, and TCLP methods from 12 or fewer samples (results not shown). The only significant correlation at a 95 percent confidence level was for aluminum determined by the total-recoverable and TCLP methods. Therefore, for those metals tested, the readily soluble metals concentrations in these soils were apparently not dependent upon metals concentrations in the soil matrices.
Spearman ranked correlation coefficients were also calculated for barium, aluminum, iron, mercury, and zinc concentrations determined by the ASTM, EP-TOX, and TCLP methods, and particle size and organic carbon, from 12 or fewer samples (results not shown). The concentra tions of most metals in the leachate did not significantly correlate with particle size or organic carbon either. Only concentrations of barium in the EP-TOX leachate signifi cantly correlated with the amount of fine particles in the soil, and only concentrations of aluminum in the ASTM leachate significantly correlated with the amount of
organic carbon in the soil at a 95 percent confidence level. Therefore, for those metals tested, concentrations in the leachates are apparently not only independent of the con centrations of metals in the soil matrices, but also appear to be independent of the exchange capacity of the soils because the exchange capacity usually depends in part on the amount of organic material and fine particles in the soil.
Relations Between Metal Concentrations and Other Chemical and Physical Soil Characteristics
To gain further insight into factors that may affect the distribution of metals in the soils, Spearman ranked corre lation coefficients between total or total-recoverable metals concentrations and between organic carbon con centrations or size fractions of soil particles were com puted, and those pairs for which there is a 95 percent confidence that a correlation exists are identified (table 12).
Concentrations of most transition metals (specifi cally cobalt, copper, mercury, manganese, nickel, and zinc) determined by the total method correlate with organic carbon concentrations in the soil. Concentrations of other metals determined by the total method, such as aluminum, gallium, and phosphorus, likewise correlate with the content of organic carbon. Bohn and others (1985, p. 37) state, "Soil organic matter strongly adsorbs Cu2+, Zn2+, Fe (II and III), and other transition metal ions, probably as chelates." Therefore, it is likely that most metals listed in table 12 that demonstrate positive correla tions with organic carbon are bound in part by organic chelates.
Trace metals may be adsorbed to exchanger sites on clays more preferentially than other cations (Kabata- Pendias and Pendias, 1984). Therefore metals concentra tions will typically increase as the amount of material in the fine (silt and clay) fraction of the soil sample increases. In this study, total metals concentrations were determined only in the fine fraction; therefore, this concept could not be tested.
Unlike metals concentrations determined by the total method, those determined by the total-recoverable method for this study do not correlate with either organic carbon content or the fraction of fines in a sample (results not shown). Although organic carbon concentrations were only determined for fine fractions of soil, these results are surprising. They suggest that the metals concentrations
53
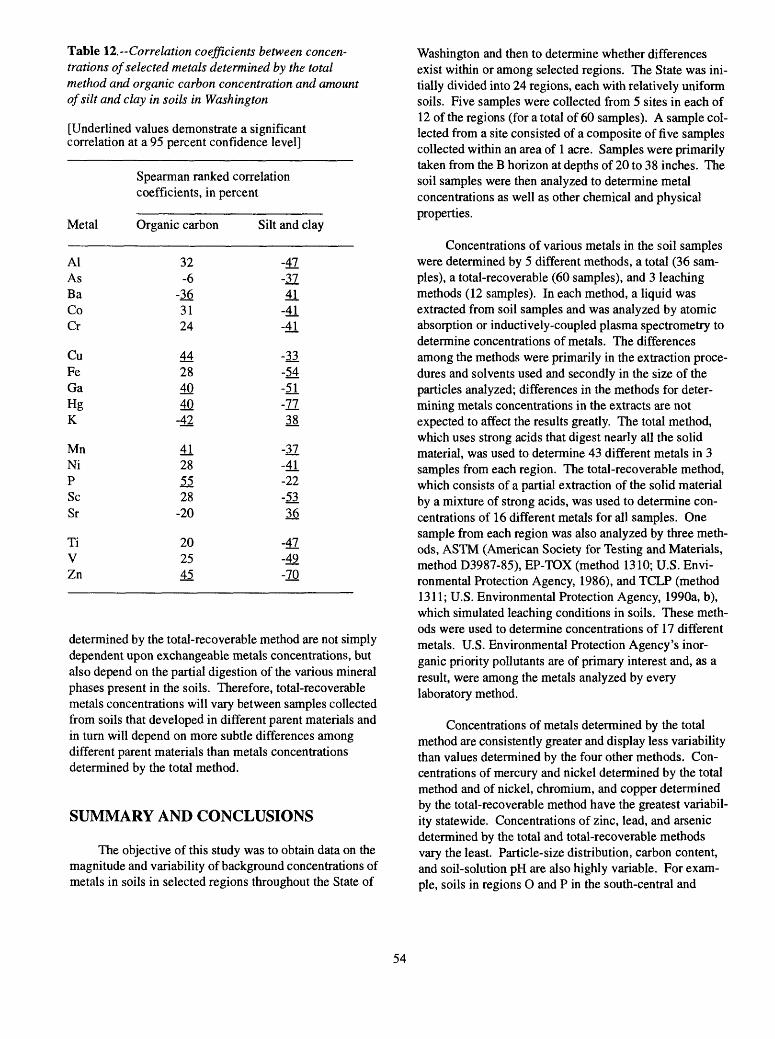
Table 12.--Correlation coefficients between concen trations of selected metals determined by the total method and organic carbon concentration and amount of silt and clay in soils in Washington
[Underlined values demonstrate a significant correlation at a 95 percent confidence level]
Spearman ranked correlation coefficients, in percent
Metal Organic carbon Silt and clay
AlAsBaCoCr
CuFeGaHgK
MnNiPScSr
TiVZn
32-6
-363124
44284040-42
11285528-20
202545
-47-3741-41-41
-33-54-51-7738
-37-41-22-5336
-47-49-70
determined by the total-recoverable method are not simply dependent upon exchangeable metals concentrations, but also depend on the partial digestion of the various mineral phases present in the soils. Therefore, total-recoverable metals concentrations will vary between samples collected from soils that developed in different parent materials and in turn will depend on more subtle differences among different parent materials than metals concentrations determined by the total method.
SUMMARY AND CONCLUSIONS
The objective of this study was to obtain data on the magnitude and variability of background concentrations of metals in soils in selected regions throughout the State of
Washington and then to determine whether differences exist within or among selected regions. The State was ini tially divided into 24 regions, each with relatively uniform soils. Five samples were collected from 5 sites in each of 12 of the regions (for a total of 60 samples). A sample col lected from a site consisted of a composite of five samples collected within an area of 1 acre. Samples were primarily taken from the B horizon at depths of 20 to 38 inches. The soil samples were then analyzed to determine metal concentrations as well as other chemical and physical properties.
Concentrations of various metals in the soil samples were determined by 5 different methods, a total (36 sam ples), a total-recoverable (60 samples), and 3 leaching methods (12 samples). In each method, a liquid was extracted from soil samples and was analyzed by atomic absorption or inductively-coupled plasma spectrometry to determine concentrations of metals. The differences among the methods were primarily in the extraction proce dures and solvents used and secondly in the size of the particles analyzed; differences in the methods for deter mining metals concentrations in the extracts are not expected to affect the results greatly. The total method, which uses strong acids that digest nearly all the solid material, was used to determine 43 different metals in 3 samples from each region. The total-recoverable method, which consists of a partial extraction of the solid material by a mixture of strong acids, was used to determine con centrations of 16 different metals for all samples. One sample from each region was also analyzed by three meth ods, ASTM (American Society for Testing and Materials, method D3987-85), EP-TOX (method 1310; U.S. Envi ronmental Protection Agency, 1986), and TCLP (method 1311; U.S. Environmental Protection Agency, 1990a, b), which simulated leaching conditions in soils. These meth ods were used to determine concentrations of 17 different metals. U.S. Environmental Protection Agency's inor ganic priority pollutants are of primary interest and, as a result, were among the metals analyzed by every laboratory method.
Concentrations of metals determined by the total method are consistently greater and display less variability than values determined by the four other methods. Con centrations of mercury and nickel determined by the total method and of nickel, chromium, and copper determined by the total-recoverable method have the greatest variabil ity statewide. Concentrations of zinc, lead, and arsenic determined by the total and total-recoverable methods vary the least. Particle-size distribution, carbon content, and soil-solution pH are also highly variable. For exam ple, soils in regions O and P in the south-central and
54

southeastern parts of the State contain large amounts of silt and clay-size particles, whereas samples collected in region C on the west coast are primarily sand. Samples collected west of the Cascade Range also commonly con tain greater amounts of organic carbon and are more acidic than samples collected in eastern Washington.
Most metals concentrations determined by either the total or total-recoverable method were sampled from pop ulations that are either log-normally distributed or more nearly log-normally than normally distributed. Exceptions were concentrations of barium, gallium, potassium, and strontium determined by the total method, and concentra tions of beryllium, manganese, and lead determined by the total-recoverable method that were sampled from populations that are normally distributed.
Results of the Kruskal-Wallis test show that, with the exceptions of copper and manganese concentrations deter mined by the total method, metals concentrations deter mined by either the total or the total-recoverable methods were significantly different among the different regions. However, this does not imply that the population means of all metals tested for each region are unique, nor does this statistical method indicate where differences of metals concentrations among the 12 regions are located.
The Fisher's Least Significant Difference test, used to distinguish differences among the 12 population means for each metal, showed that metals concentrations deter mined by the total method between many regions were not statistically distinct. Yet significant differences, such as those between region A and regions J and U, for which 4 of 11 metals tested were not statistically similar, do exist. Concentrations of metals determined by the total-recover able method were not as similar among different regions as total metals concentrations. However, strong similari ties exist between concentrations of total-recoverable met als in regions A and F and among concentrations of metals in regions O, P, and R. Furthermore, cluster analysis sug gests that regions A, F, and part of D could be combined into two distinct groups, which would form an inner and outer ring of regions encircling Puget Sound. Cluster analysis also showed that regions O, P, and R could be combined to create two distinct regions in south-central and southeastern Washington. Based on this information and the results of the Kruskal-Wallis and Fisher's Least Significant Difference tests, further investigation could be conducted to provide more definitive relations between regions A and F and among regions O, P, and R.
Total and total-recoverable concentrations of seven metals (aluminum, arsenic, copper, chromium, iron, mer cury, and nickel) were significantly correlated at a 95 per cent confidence level. For these metals, Spearman ranked correlation coefficients ranged from 51 to 70 percent, and Pearson correlation coefficients ranged from 41 to 98 percent. Therefore, the bioavailability of these metals depended on the total concentrations in the fine-sized frac tions of the soil. However, the form in which beryllium, manganese, lead, and zinc were held within the soil appar ently varied too greatly to reach the same conclusion for these metals.
Concentrations of six metals determined by the total method correlated positively with organic carbon concen trations in the soil; a comparison between total metals concentrations and the amount of fines could not be deter mined. Total-recoverable metal concentrations did not correlate with either organic carbon content or amount of fines, which suggests that total-recoverable concentrations depend strongly upon the degree of partial digestion of various mineral phases. Therefore, total-recoverable metals concentrations reflect more subtle differences among different parent materials than total metals concentrations do.
Although the concentrations of most metals deter mined by the ASTM, EP-TOX, and TCLP methods were below laboratory minimum reporting levels, concentra tions of barium, and less commonly aluminum, iron, mercury, and zinc, were detected in the leachate. These concentrations were always a factor of 100 or more less than concentrations determined by the total or total-recov erable methods. Readily soluble metals concentrations in the soils were apparently not dependent upon metals concentrations in the soils matrices or on the amount of organic material and fine particles in the soil. However, the analytical precision of these methods is poor, and the concentrations did not correlate well with concentrations determined by the total or total-recoverable method or with the amount of fines or organic carbon in the soil. As a result, estimations of baseline concentrations of metals determined by the ASTM, EP-TOX, and TCLP methods for this study are much less accurate than estimations of baseline concentrations of metals determined by the total and total-recoverable methods.
Finally, this study provides a good foundation from which future studies may develop. Benefits of regional ized studies, as well as benefits from the implementation of additional analytical tools, more complete inferences may be made from the various mechanisms driving the chemistry in the soils.
55

REFERENCES CITED
Ahrens, L.H., 1954, The lognormal distribution of the elements: Geochimica et Cosmochimica acta, v. 5, p. 49-73.
American Society for Testing and Materials, 1985, 1985 Annual book of ASTM standards; section 11, water and environmental technology: American Society of Testing and Materials, v. 11.04, p. 33-38.
Ames, Kenneth C., 1994, Washington State metals in soils program preliminary results: Hydrological Science and Technology, vol. 10, no. 1-4, 1994, ISSN 0887-686X, p. 15-30.
Beieler, V.E., 1972, Soil survey of Chelan area,Washington-parts of Chelan and Kittitas Counties: Washington D.C., U.S. Department of Agriculture Soil Conservation Service, 104 p.
Bennett, C.A., and Franklin, N.L., 1954, Statistical analysis in chemistry and the chemical industry: New York, J. Wiley and Sons, p. 61-65.
Bonn, H.L., McNeal, B.L., and O'Connor, G.A., 1985, Soil chemistry (2nd ed.): New York, NY, J. Wiley and Sons, 341 p.
Briggs, P., 1990, Elemental analysis of geological material by inductively coupled plasma-atomic emission spectrometry, in Arbogast, B.F., ed., Quality Assurance Manual for the Branch of Geochemistry, U.S. Geological Survey: U.S. Geological Survey Open File Report 90-668, p. 83-91.
Chapin, R.W., 1968, General soil map Washington:Washington, D.C., U.S. Department of Agriculture, Soil Conservation Service.
David, M., 1977, Geostatistical ore reserve estimation: New York, Elsevier Scientific Publications, 364 p.
Donaldson, N.C., 1980, Soil survey of Whitman County, Washington: Washington D.C., U.S. Department of Agriculture Soil Conservation Service, 185 p.
Donaldson, N.C., DeFrancesco, J.T., and Barron, D.W, 1982, Soil survey of Stevens County, Washington: Washington D.C., U.S. Department of Agriculture Soil Conservation Service, 459 p.
Donaldson, N.C., and Giese, L.D., 1968, Soil survey of Spokane County, Washington: Washington D.C., U.S. Department of Agriculture Soil Conservation Service, 143 p.
Fishman, M.J., and Friedman, L.F, 1985, Methods for determinations of inorganic substances in water and fluvial sediments: U.S. Geological Survey Techniques of Water-Resources Investigations, bookS, chap. Al, 709 p.
Gentry, H.R., 1984, Soil survey of Grant County,Washington: Washington D.C., U.S. Department of Agriculture Soil Conservation Service, 329 p.
Guy, H.P., 1977, Laboratory theory and methods for sediment analysis: U.S. Geological Survey Techniques of Water-Resources Investions, book 5, chap. C 1,58 p.
Harrison, E.T., Donaldson, N.C., McCreary, F.R., Ness, A.O., and Krasheuski, S., 1964, Soil survey of Walla Walla County, Washington: U.S. Department of Agriculture Soil Conservation Service, Washington D.C., 138 p.
Harrison, E.T., McCreary, F.R., and Nelson, F.L., 1973, Soil survey of the Columbia County area, Washington: Washington D.C., U.S. Department of Agriculture Soil Conservation Service, 88 p.
Horowitz, A.J., 1991, A primer on sediment-trace element chemistry: Chelsea, Michigan, Lewis Publishers Inc., 136 p.
Hunting, M.T., Bennett, W.A.G., Livingston, V.E., Jr., and Moen, W.S., 1961, Geologic map of Washington: State of Washington Department of Natural Resources, Division of Mines and Geology, 2 sheets.
Iman, R.L., and Conover, W.J., 1983, A modern approach to statistics: New York, J. Wiley and Sons, 497 p.
Kabata-Pendias, Alina, and Pendias, Henryk, 1984, Trace elements in soils and plants: Boca Raton, Florida, CRC Press, p. 27-30.
Kaufman, Leonard, and Rousseeuw, P.J., 1990, Finding groups in data an introduction to cluster analysis: New York, J. Wiley and Sons, 342 p.
56

Kulp, J.L., Turekian, K., and Boyd, D.W., 1952, Strontium content of limestones and fossils: Geological Society of America Bulletin, v. 63, p. 701-716.
Lasmanis, R., 1991, The geology of Washington: Rocks and Minerals, v. 66, no. 4, p. 262-277.
Lenfesty, C.D., 1967, Soil survey of Adams County,Washington: Washington D.C., U.S. Department of Agriculture Soil Conservation Service, 110 p.
___1980, Soil survey of Okanogan County area,Washington: Washington D.C., U.S. Department of Agriculture Soil Conservation Service, 153 p.
Lenfesty, C.D., and Reedy, T.E., 1985, Soil survey ofYakima County area, Washington: Washington D.C., U.S. Department of Agriculture Soil Conservation Service, 345 p.
Livingston, V.E., Jr., 1969, Geo ogic history and rocks and minerals of Washington: State of Washington Department of Natural Resources, Division of Mines and Geology, Information Circular no. 45,42 p.
Looney, S.W, and Gulledge Jr., T.R., 1985a, Use of the correlation coefficient with normal probability plots: The American Statistician, v. 39, no. 1, p. 75-79.
___1985b, Probability plotting positions and goodnessof fit for the normal distribution: The Statistician, v. 34, no. 3, p. 297-303.
McGee, D.A., 1972, Soil survey of Clark County,Washington: Washington D.C., U.S. Department of Agriculture Soil Conservation Service, 113 p.
Ness, A.O., 1958, Soil survey of Thurston County,Washington: Washington D.C., U.S. Department of Agriculture Soil Conservation Service, 79 p.
O'Leary, R.M., Crock, J.G., and Kennedy, K.R., 1990, Determination of mercury in geological materials by continuous flow-cold vapor atomic absorption spectrophotometry, in Arbogast, B.F., ed., Quality Assurance Manual for the Branch of Geochemistry, U.S. Geological Survey: U.S. Geological Survey Open File Report 90-688, p. 60-67.
Poulson, E.N., 1953, Soil survey of Whatcom County, Washington: Washington D.C., U.S. Department of Agriculture Soil Conservation Service, 153 p.
Pringle, R.F., 1986, Soil survey of Grays Harbor County area, Pacific County, and Wahkiakum County, Washington: Washington D.C., U.S. Department of Agriculture Soil Conservation Service, 296 p.
Prych, E.A., Kresch, D.L., Ebbert, J.C., and Turney, G.L., 1995, Data and statistical summaries of background concentrations of metals in soils and streambed sediments in part of Big Soos Creek drainage basin, King County, Washington: U.S. Geological Survey Water-Resources Investigations Report 94-4047, 81 p.
Rasmussen, J.J., 1971, Soil survey of Benton County area, Washington: Washington D.C., U.S. Department of Agriculture Soil Conservation Service, 72 p.
Romesburg, B.C., 1984, Cluster analysis for researchers: Belmont, Calif., Lifetime Learning Publications, 334 p.
Smith, L.H., Dwyer, C.H., and Schafer, George, 1945, Soil survey of Kittitas County, Washington: Washington D.C., U.S. Department of Agriculture Soil Conservation Service, 69 p.
Stockman, D.D., 1981, Soil survey of Lincoln County, Washington: Washington D.C., U.S. Department of Agriculture Soil Conservation Service, 167 p.
U.S. Department of Agriculture, 1962, Soil surveymanual, Agricultural Handbook no. 18: Washington D.C.,p. 174-188.
U.S. Environmental Protection Agency, 1986, Testmethods for evaluating solid wastes: SW-846, v. 4, unpaged.
_1988, Code of Federal regulations: Federal Register, v. 40, part 401, p. 7-8.
_1990a, Code of Federal regulations hazardous waste management system; identification and listing of hazardous waste; toxicity characteristics revisions; final rule: Federal Register, v. 55, no. 61, part II, p. 11,798-11,877.
57

_1990b, Code of Federal regulations: hazardous waste management system; identification and listing of hazardous waste; toxicity characteristics revisions; final rule: Federal Register, v. 55, no. 126, part V, p. 26,986-26,998.
Van Duyne, Cornelius, Agee, J.H., and Ashton, F.W., 1917, Soil survey of Franklin County, Washington: Washington D.C., U.S. Department of Agriculture Soil Conservation Service, 101 p.
Welsch, E.P., Crock, J.G., and Sanzolone, R., 1990,Trace-level determinations of arsenic and selenium using continuous-flow hydride generation atomic absorption spectrophotometry (HG-AAS), in Arbogast, B.F., ed., Quality Assurance Manual for the Branch of Geochemistry, U.S. Geological Survey: U.S. Geological Survey Open File Report 90-688, p. 38-45.
Wershaw, R.J., Fishman, M.J., Grabbe, R.R., and Lowe, L.E., 1987, Methods for the determination of organic substances in water and fluvial sediments: U.S. Geological Survey Techniques of Water-Resources Investigations, book 5, chap. A3, 80 p.
Wolfe, E.W, and McKee, E.H., 1972, Sedimentary and igneous rocks of the Grays River quadrangle, Washington: U.S. Geological Survey Bulletin no. 1335, 70 p.
Zulauf, A.S., 1979, Soil survey of Pierce County area, Washington: Washington D.C., U.S. Department of Agriculture Soil Conservation Service, 131 p.
58

APPENDIX A.--DATA TABLES
59

Table Al. Concentrations of metals in soils in Washington determined by the total method
[Concentrations are in milligrams per kilogram (except values for Al, Ca, Fe, K, Mg, Na, P, and Ti, which are given in percent); <, less than; (dup), duplicate of preceding sample]
Sample number (fig- 2)
A2A3A5A6(dup)
ClC3C4
DlD4D5
FlF2F6(dup)F5
GlG4G5
J2J3J5
LIL2L4L6(dup)
MlM2M4
0203O4
P2P3P6(dup)P4P5
Ag
<2<2<2<2
<2<2<2
<2<2<2
<2<2<2<2
<2<2<2
<2<2<4
<2<2<2<2
<2<2<2
<2<2<2
<2<2<2<2<2
Al
10.09.07.58.9
6.78.18.0
8.39.310.0
11.08.28.17.0
10.09.27.7
7.17.87.3
9.99.28.88.7
8.38.37.9
7.07.77.5
7.07.57.57.37.0
As
6.43.87.6
11.
9.113.20.
3.98.2
13.
5.44.94.76.
5.58.56.5
1.55.32.2
.813.5.5.3
1.92.42.1
7.25.16.6
4.83.93.9
10.2.1
Au
<8<8<8<8
<8<8<8
<8<8<8
<8<8<8<8
<8<8<8
<8<8<20
<8<8<8<8
<8<8<8
<8<8<8
<8<8<8<8<8
Ba
330340540530
360510480
580700670
570330330300
670590690
750920870
550630710690
520470510
660610650
650670670700680
Be Bi
<1 <101 <101 <101 <10
1 <101 <102 <10
1 <101 <101 <10
2 <101 <101 <10
<1 <10
2 <101 <102 <10
1 <102 <10
<2 <20
2 <102 <102 <102 <10
1 <101 <101 <10
2 <102 <102 <10
2 <102 <102 <102 <101 <10
Ca
0.41.6.7.6
2.32.83.3
1.51.6.8
1.81.11.11.8
1.0.9.8
1.82.02.0
2.31.72.02.0
2.72.12.6
5.53.73.9
1.91.71.71.71.7
Cd
<2<2<2<2
<2<2<2
<2<2<2
<2<2<2<2
<26
<2
<2<2<4
<2<25
<2
<2<2<2
<2<2<2
<2<2<2<2<2
Ce
20655462
496381
705264
67424126
655973
5010069
40525755
414045
825772
7164654952
Co
8481413
352833
171921
19121247
272416
81610
26181414
232618
161623
1514141010
60

Table ^..-Concentrations of metals in soils in Washington determined by the total method-Continued
Samplenumber
RlR3R4
UlU2U5
RS1RS(dup)
Sample number
A2A3A5A6(dup)
ClC3C4
DlD4D5
FlF2F6(dup)F5
GlG4G5
J2J3J5
LIL2L4L6(dup)
Ag
<2<2<2
<2<2<2
<2<2
Cr
1001708379
160120150
140130340
995051540
815964
428449
260967867
Al
6.97.26.8
7.98.37.5
7.77.8
Cu
291202832
422327
132868
53303129
394927
303130
53332830
As
8.13.45.5
16.6.67.1
4.34.3
Eu
<22
<2<2
<2<22
<2<2<2
<2<2<2<2
2<2<2
<2<2<4
<2<2<2<2
Au
<8<8<8
<8<8<8
<8<8
Fe
5.28.84.15.2
6.15.96.9
3.43.96.0
5.23.03.04.9
8.85.85.4
2.54.12.5
5.44.14.14.1
Ba Be
Ga
23231821
162023
212323
28181812
272120
172010
26242121
710 2660 2580 1
670 2650 2780 2
480 <1490 <1
Hg
0.16.22.20.14
5.96..20
.06
.10
.38
.26
.08
.10
.06
.06
.08
.06
.06
.04
.04
.04
.04
.04
.06
«««
«<<
<«
Ho
<4<4<4<4
<4<4<4
<4<4<4
<4<4<4<4
<4<4<4
<4<4<4
<4<4<4<4
Bi
clOclOclO
clOclOclO
clOclO
K
0.9.6
1.11.0
1.11.41.0
1.01.71.4
1.1.5.5.6
.91.21.7
1.82.21.8
1.82.31.81.7
Ca
3.01.93.7
1.31.31.5
1.81.8
La
28272828
243342
402928
27202015
352939
306041
26313533
Cd
<2<2<2
<2<2<2
<2<2
Li
40253134
433725
363662
52201929
242524
273124
89493839
Ce
9372110
646984
4040
Mg
0.72.0.6.7
2.31.61.6
.91.42.0
1.2.6.6
3.5
.9
.8
.8
.61.1.6
2.11.21.11.1
Co
411222
131211
1313
Mn
4101,500680650
1,300820800
550580690
7401,4001,400750
1,100970620
630780670
910720670680
61

Table Al.~ Concentrations of metals in soils in Washington determined by the total method-Continued
Samplenumber(fig. 2)
MlM2M4
0203O4
P2P3P6(dup)P4P5
RlR3R4
UlU2U5
RS1RS2
Sample number (fig. 2)
A2A3A5A6(dup)
ClC3C4
DlD4D5
FlF2F6(dup)F5
Cr
6112057
776861
5356542834
554268
565069
120110
Mo
22
<2<2
<2<22
<2<2<2
<3<2<2<2
Cu
284428
273029
2827252223
852624
263724
2119
Na
6.21.01.0.8
2.02.22.0
2.31.81.2
2.2.9.9
2.2
Eu
<2<2<2
<2<2<2
<2<2<2<2<2
<2<2<2
<2<2<2
<2<2
Nb
10131316
101210
775
1065
<4
Fe
7.77.44.6
3.84.35.7
4.04.04.02.82.8
9.33.86.0
4.63.83.3
3.23.2
Nd
23332221
283748
342528
24191916
Ga
212119
171920
1718181816
201618
201917
1616
Hg
0.08.08.06
.04
.06
.06
.04
.04
.04
.04
.04
.68
.04
.04
.10
.08
.04
.12
.12
Ni
33762424
625534
6673120
492321
470
Ho
<4<4<4
<4<4<4
<4<4<4<4<4
<4<4<4
<4<4<4
<4<4
P
0.04.17.08.08
.10
.12
.17
.06
.09
.17
.13
.47
.47
.02
K
1.11.01.2
1.71.61.6
1.71.61.71.61.7
1.61.71.4
2.21.82.3
.9
.9
Pb
1341011
121515
1197
14885
La
262628
473540
4036392729
444261
394050
1919
Sb
1.31.01.41.2
1.31.41.9
1.31.73.8
1.41.21.01.1
Li
273022
333129
2628272726
262722
364935
1717
Se
1.21.2.2.3
.3
.4
.3
.2
.1
.7
.4
.5
.4
.1
Mg
1.11.21.0
1.51.21.6
.8
.8
.8
.6
.7
2.01.01.6
1.01.51.0
.8
.8
Sc
18341417
232134
111524
18111118
Mn
7501,000790
640600860
690670670560550
1,600550940
560640540
560570
Sn
<5<5<5<5
<5<5<5
<5<5<5
<5<5<5<5
62

Table ^..--Concentrations of metals in soils in Washington determined by the total method Continued
Samplenumber(fig. 2)
GlG4G5
J2J3J5
LIL2L4L6(dup)
MlM2M4
02O3O4
P2P3P6(dup)P4P5
RlR3R4
UlU2U5
RS1RS(dup)
Sample number (fig. 2)
A2A3A5A6(dup)
Mo
22
<2
<2<2<4
<2<2<2<2
<2<2<2
<2<2<2
<22
<2<22
<2<2<2
<2<2<2
<2<2
Sr
92180150130
Na
0.91.11.2
2.32.12.3
1.71.62.01.9
1.51.22.0
1.61.61.6
1.81.71.72.22.2
1.32.01.8
1.31.31.7
2.02.1
Ta
<40<40<40<40
Nb
131012
71410
4978
887
9710
68976
148
11
10812
45
Th
11599
Nd
422535
254735
27293032
272829
413339
3633362627
423755
363638
1820
Ti
0.681.20.77.84
Ni
272223
123020
70363032
154820
282827
1816161111
321824
202421
4544
P
0.18.19.11
.10
.14
.10
.11
.13
.10
.10
.14
.14
.11
.10
.09
.13
.14
.12
.13
.12
.10
.21
.08
.13
.08
.05
.08
.11
.11
U
<100<100<100<100
Pb
121415
121710
13161211
10712
151114
1110111110
361012
202116
87
V
150270130160
Sb
1.31.51.6
.71.71.2
.61.61.01.1
.8
.8
.8
1.61.21.7
1.21.11.2.7
1.0
3.8.8
1.5
1.91.31.2
1.21.3
Y
12351010
Se
0.3.2.3
1.0.1
<.l
.1
.2
.1
.1
.1
.2<.l
<.l.1.1
.1
.1
.1<.l<.l
<.l<.l.1
.1
.1<.l
.3
.3
Sc
341818
10149
24151616
383417
131620
1414141110
271320
161412
1313
Yb
1311
Sn
<5<5<5
<5<5<10
<5<5<5<5
<5<5<5
<5<5<5
<5<5<5<5<5
<5<5<5
<5<5<5
<5<5
Zn
801009596
63

Table ML. Concentrations of metals in soils in Washington determined by the total method Continued
Sample number (fig. 2)
ClC3C4
DlD4D5
FlF2F6(dup)F5
GlG4G5
J2J3J5
LIL2L4L6(dup)
MlM2M4
02O3O4
P2P3P6(dup)P4P5
RlR3R4
Sr
230320300
310350120
280170170150
170180190
350450460
320360390380
270200330
330300300
270280280290290
240300330
Ta
<40<40<40
<40<40<40
<40<40<40<40
<40<40<40
<40<40<80
<40<40<40<40
<40<40<40
<40<40<40
<40<40<40<40<40
<40<40<40
Th
678
10910
7665
11812
8168
791010
576
13910
10101077
121017
Ti
0.68.72
1.20
.51
.43
.67
.72
.34
.35
.46
1.30.90.87
.33
.49
.34
.53
.48
.51
.50
.92
.78
.66
.48
.53
.86
.57
.57
.59
.42
.42
1.20.53.89
U
<100<100<100
<100<100<100
<100<100<100<100
<100<100<100
<100<100<200
<100<100<100<100
<100<100<100
<100<100<100
<100<100<100<100<100
<100<100<100
V
170160370
99120210
1407173130
270180170
5711060
170100110110
210210130
110110190
1001001006669
25098190
Y
232744
141427
19161613
361718
222421
22212222
303621
212225
2323232320
382325
Yb
234
113
2221
422
232
2222
342
223
22232
423
Zn
280140130
11089130
120767769
13012094
679365
1601108282
9711081
707688
7372696361
1806684
64

Table Al.-- Concentrations of metals in soils in Washington determined by the total method Continued
Sample number(fig- 2)
UlU2U5
RS1RS(dup)
Sr
230220350
270270
Ta
<40<40<40
<40<40
Th
141114
55
Ti
0.60.49.39
.45
.45
U
<100<100<100
<100<100
V
1108177
9899
Y
232623
1516
Yb
232
22
Zn
968670
5354
65

Table A2.~ Concentrations of metals in soils in Washington determined by different laboratory methods
[Concentrations are in milligrams per kilogram of dry soil, except total and total- recoverable values for iron and aluminum, which are given in percent, and values in parentheses, which are given in milligrams per liter of leachate; <, less than; >, greater than; --, no data; *, estimated value; +, detected in blank; (dup), duplicate of preceding sample; ASTM, American Society for Testing Materials method D3987-85; EP-TOX, Extraction Procedure-Toxicity test; TCLP, Toxicity Characteristic Leaching Procedure]
Sample number
AlA2A3A4A5A6(dup)
ClC2C3C4C5
DlD2D3D4D5
FlF2F6(dup)F3F4F5
GlG2G3G4G5
JlJ2J3J4J5
LIL2L3L4L6(dup)L5
Total
_<2<2
<2<2
<2
<2<2-
<2~
<2<2
<2<2<2~
<2
<2
<2<2
_<2<2
<4
<2<2
<2<2
Silver
Total recoverable ASTM EP-TOX
<0.2<.2 <0.04 (<0.002) <0.04 (<0.002)<.2<.2<.2<>2
<.2<.2<.2<.2<.2 <.04 (<.002) <.04 (<.002)
<.2 <.04 (<.002) <.04 (<.002)<.2< 2<.2
.34*
<.2 <.04 (<.002) <.04 (<.002)<.2<.2<.2<.2<2
<2<.2<.2<.2<.2 <.04 (<.002) <.04 (<.002)
.31*<.2<.2 <.04 (<.002) <.04 (<.002)<.2<.2
0.29*<.2<.2<.2 <.04 (<.002) <.04 (<.002)<.2 <.04 (<.002) <.04 (<.002)<.2
TCLP
<0.04 (<0.002).. --
_.... <.04 (<.002)
<.04 (<.002)......~
<.04 (<.002) ~....--
.._...<.04 (<.002)
__ <.04 (<.002)..-
....<.04 (<.002)<.04 (<.002)
66

Table A2. Concentrations of metals in soils in Washington determined by different laboratory methods Continued
Sample number
MlM2M3M4M5
OlO2O3O4O5
PIP2P3P6(dup)P4P5
RlR2R3R4R6(dup)R5
UlU2U3U6(dup)U4U5
RS1RS(dup)
Total
<2<2
<2~
__<2<2<2--
__<2<2<2<2<2
<2
<2<2--
<2<2 ~
<2
<2<2
Silver
Total recoverable ASTM EP-TOX
0.58*.58*.24*.35* <0.04 (<0.002) <0.04 (<0.002).39*
< 2<.2 <.04 (<.002) <.04 (<.002)<.2
25*<2
.41*<.2
.32*<2<.2 <.04 (<.002) <.04 (<.002)<.2
<.2 <.04 (<.002) <.04 (<.002)9S* ,^,j - ~ «
<.2<.2^,.2* " " *~ ""*
< 2
<.2 <.04 (<.002) <.04 (<.002)<.2<2<2<.2<.2
<.2 <.04 (<.002) <.04 (<.002)<2
TCLP
__
<0.04 (<0.002)
-.<.04 (<.002)....-
....<.04 (<002)..
<.04 <.002)......----
<.04 (<.002) --_.--
<.04 (<.002)--
67

Table A2. Concentrations of metals in soils in Washington determined by different laboratory methods Continued
Sample number
AlA2A3A4A5A6(dup)
ClC2C3C4C5
DlD2D3D4D5
FlF2F6(dup)F3F4F5
GlG2G3G4G5
JlJ2J334J5
LIL2L3L4L6(dup)L5
MlM2M3M4M5
Total
__10.09.0 7.58.9
6.7 8.18.0--
8.3~ 9.3
10.0
11.08.28.1 7.0
10.0 9.27.7
_7.17.8 7.3
9.99.2 8.88.7~
8.38.3 7.9~
Aluminum
Total recoverable ASTM EP-TOX
5.45.1 2.2 (0.11) <1.0 (<0.05)s i Jt+*
2.93.843
.7
.7
.6
.6
.7 1.8 (.09) <1.0 (<.05)
2.2 2.4 (.12) 1.5 (.08)1.71.62.54.6
3.8 3.6 (.18) <1.0 (<.05)4.03.72.93.02.4
4.71.81.94.03.4 <1.0 (<.05) <1.0 (<.05)
2.01.3
.9 1.5 (.08) <1.0 (<-05)
.81.0
2.62.62.91.7 1.9 (.10) <1.0 (<.05)1.7 1.2 (.06) <1.0 (<.05)2.1
2.82.61.62.0 <1.0 (<.05) <1.0 (<.05)2.6
TCLP
__47.0 (2.35) ._ ~
__....
20.6 (1.03)
14.3 (.72)..__..--
23.2 (1.16)..--~..~
_..... 6.4 (.32)
__._1.4 (.07)..~
--
<1.0 (<.05)1.1 (.06)~
..- 3.0 (.15)-
68
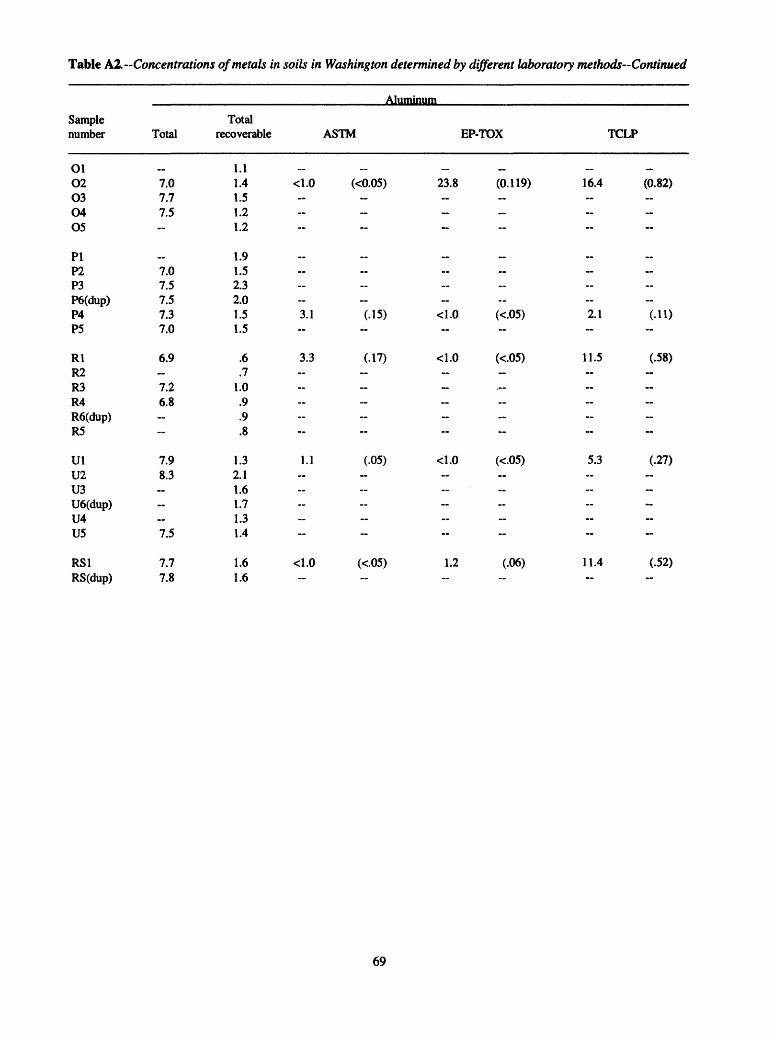
Table A2. Concentrations of metals in soils in Washington determined by different laboratory methods Continued
Sample number
OlO2O3O4O5
PIP2P3P6(dup)P4P5
RlR2R3R4R6(dup)R5
UlU2U3U6(dup)U4U5
RS1RS(dup)
Total
»_
7.07.77.5--
7.07.57.57.37.0
6.9 7.26.8-
7.98.3 - 7.5
7.77.8
Aluminum
Total recoverable ASTM EP-TOX
1.11.4 <1.0 (<0.05) 23.8 (0.119)1.51.21.2
1.91.52.32.01.5 3.1 (.15) <1.0 «05)1.5
.6 3.3 (.17) <1.0 (<.05)
.71.0
Q
9» O
1.3 1.1 (.05) <1.0 (<.05)211 .0 *"*" """ """" "**"
171.31.4
1.6 <1.0 (<.05) 1.2 (.06)1.6
TCLP
~16.4 (0.82)....--
~__..2.1 (.11)
11.5 (.58) ......
5.3 (.27)........-
11.4 (.52)-
69

Table A2. --Concentrations of metals in soils in Washington determined by different laboratory methods Continued
Sample number
AlA2A3A4A5A6(dup)
ClC2C3C4C5
DlD2D3D4D5
FlF2F6(dup)F3F4F5
GlG2G3G4G5
JlJ2J3J4J5
LIL2L3L4L6(dup)L5
Total
__
6.43.8 7.6
11
9.1
1320--
3.9 8.2
13
5.44.94.7 6
5.5 8.56.5
1.55.3«2.2
.813 55.3
Arsenic
Total recoverable ASTM EP-TOX
4.63.5 <0.6 (<0.03) <0.6 (<0.03)1.91.88.18.4
2.92.81.8171 /
2.3 <.6 (<.03) <.6 (<.03)
2.8 <.6 (<.03) <.6 (<.03)1.92.64.79
1.2 <.6 «.03) <.6 «.03)23.32494.2
2.91.52.85.56.9 <.6 «.03) <.6 «.03)
5.31.12.9 <.6 (<.03) <.6 (<.03)111.4
<.57.21.42.3 <.6 (<.03) <.6 (<.03)2.1 <.6 (<.03) <.6 (<.03)>.5
TCLP
-.
<0.6 (<0.03)......~
.._.._ <.6 (<.03)
<.6 (<.03).. ..-
<.6 (<.03)......
__......<.6 «.03)
_...<.6 (<-03) --
_..__<.6 (<.03)<.6 (<.03)..
70

Table \2.-Concentrations of metals in soils in Washington determined by different laboratory methods Continued
Sample number
MlM2M3M4M5
OlO2O3O405
PIP2P3P6(dup)P4P5
RlR2R3R4R6(dup)R5
UlU2U3U6(dup)U4U5
RS1RS(dup)
Total
1.92.4 2.1
7.25.16.6--
__4.83.93.9
102.1
8.1 3.45.5~~
166.6~~ 7.1
4.34.3
Arsenic
Total recoverable ASTM EP-TOX TCLP
11.132.1 <0.6 (<0.03) <0.6 (<0.03) <0.6 (<0.03)1.8
385.5 1.6 (.08) 1.6 (.08) 2.3 (.12)36537
41372.62.31.2 <.6 (<.03) <.6 (<.03) <.6 (<.03)15 i .j -- - - - -
1.4 <.6 «.03) <.6 «.03) <.6 «.03)372.62.52.56.1
9.4 <.6 (<.03) <.6 (<.03) <.6 «.03)5 RJ.O
576.18.86.2
2.5 <.6 «.03) <.6 «.03) <.6 (<.03)27
71

Table A2.--Concentrations of metals in soils in Washington determined by different laboratory methods Continued
Sample number
AlA2A3A4A5A6(dup)
ClC2C3C4C5
DlD2D3D4D5
FlF2F6(dup)F3F4F5
GlG2G3G4G5
JlJ2J3J4J5
LIL2L3L4L6(dup)L5
M2M3M4M5
Barium
Total Total recoverable ASTM EP-TOX
__330 -- 0.2 (0.01) 0.8 (0.04)340
..540 */*tv
530
360
510480
.3 (.02) .8 (.04)
580 -- .4 (.02) 1.8 (.09)..
700670
570 -- .2 (.01) 1.5 (.08)330330
..
..300
670_...
590690 - .7 (.03) 1.4 (.07)
..750920 - 1.2 (.06) 2.0 (.10)
..870
550630
..710 - .1 (.01) .9 (.05)690 -- 1.8 (.09) .6 (.03)
470_.
510 -- .4 (.02) 2.6 (.13)..
TCLP
..7.0 (0.35)......
_..... 3.0 (.15)
7.9 (.39)......-
12.3 (.62)....-..
..
..
..
..19.1 (.96)
..
..8.3 (.41)..-
..
..
..10.1 (.51)10.3 (.51)
..
..12.1 (.60)..
72

Table ^.-Concentrations of metals in soils in Washington determined by different laboratory methods Continued
Sample number
OlO2O3O4O5
PIP2P3P6(dup)P4P5
RlR2R3R4R6(dup)R5
UlU2U3U6(dup)U4U5
RS1RS(dup)
Barium
Total Total recoverable ASTM EP-TOX
__660 -- 0.8 (0.04) 18.1 (0.91)610650
--
__650670670700 -- 2.4 (.12) 3.0 (.15)680
710 - .3 (.02) 1.0 (.05)..
660580 --
670 -- .7 (.04) .8 (.04)650 _._.
780
480 -- .6 (.03) 1.0 (.05)490
TCLP
._18.3 (0.91)- --
_.. ..
14.6 (.73)..
5.9 (.29) ..~--
14.5 (.72)....--..-
15.6 (.78)-
73

Table A2. Concentrations of metals in soils in Washington determined by different laboratory methods Continued
Sample number
AlA2A3A4A5A6(dup)
ClC2C3C4C5
DlD2D3D4D5
FlF2F6(dup)F3F4F5
GlG2G3G4G5
JlJ2J3J4J5
LIL2L3L4L6(dup)L5
MlM2M3M4M5
Total
__<1
1
11
1--12--
1 11
211-~
<!
2~~12
__12
<2
22 22
11
1..
Beryllium
Total recoverable ASTM EP-TOX
0.5.4 <0.4 (<0.02) <0.4 (<0.02)7799
11
.1i
.1 <4 «.02) <4 «.02)
.3 <4 «.02) <4 «.02)
.4
.3
.6
.6
.8 <4 «.02) <.4 «.02) y
75
.0
.2
i
.4
.8
.7
.9 <.4 «.02) <4 «.02)
.7a
.3 <.4 (<.02) <.4 (<.02)
.32
.88
1.1.4 <.4 (<-02) <.4 (<.02).5 <.4 (<-02) <.4 (<.02).6
1.41.1
7.8 <0.4 (<.02) <.4 (<.02)0
TCLP
__<0.4 (<0.02).. ..~
..__.._.<4 «.02)
<4 «.02)_.....~
<4 (<.02)._---..--
.._.._ <.4 (<-02)
..<.4 (<-02)..
_.--_.<.4 (<-02)<.4 (<-02)--
..
._
._<.4 (<-02)._
74

Table A2. Concentrations of metals in soils in Washington determined by different laboratory methods Continued
Sample number
OlO2O3O4O5
PIP2P3P6(dup)P4P5
RlR2R3R4R6(dup)R5
UlU2U3U6(dup)U4U5
RS1RS(dup)
Total
222--
_22221
2 21~~
22 «2
<1<1
Beryllium
Total recoverable ASTM EP-TOX
05.6 <0.4 (<0.02) <0.4 (<0.02).0 ~"* "*"* *"* 74
g58 _7 /
.6 <.4 (<.02) <.4 (<.02)5
.3 <.4 (<.02) <.4 (<.02)4539 **-1
. J
.5 <.4 (<.02) <.4 (<.02)
.6« j
.0 ~ *~55
.1 <.4 (<.02) <.4 (<.02)1 1
TCLP
_.<0.4 (<0.02)....-
_..~..<.4 (<.02)--
<.4 (<.02).... ~
<.4 (<.02) .. ..
<.4 (<.02)-
75

Table A2.-Concentrations of metals in soils in Washington determined by different laboratory methods-Continued
Sample number
AlA2A3A4A5A6(dup)
ClC2C3C4C5
DlD2D3D4D5
FlF2F6(dup)F3F4F5
GlG2G3G4G5
JlJ2J3J4J5
LIL2L3L4L6(dup)L5
MlM2M3M4M5
Total
<2<2
<2<2
<2~
<22--
2
<2<2
<2<2<2
<2
<2~ 6
<2
_<2<2
<4
<2<2 5
<2~
<2<2..
<2
Cadmium
Total recoverable ASTM EP-TOX
<0.2*<.2* 0.05* (0.003) <0.04 (<0.002)<.2*<.2*<.2*<.2*
<.2*<.2*<.2*<.2*<.2* <.04 (<.002) <.04 (<.002)
<.2* <.04 (<.002) <.04 (<.002)<.2*<.2*<.2*<.2*
<.2* <.04 (<.002) <.04 (<.002)<.2*<.2*<.2*<.2*<.2*
<.2*< 2*< 2*<.2*<.2* <.04 (<.002) <.04 (<.002)
<2*<.2*<.2* <.04 (<.002) <.04 (<.002)<.2*<,2*
<.2*<2*<.2*<.2* .04* (.002) <.04 (<.002)<.2* <.04 (<.002) <.04 (<.002)<.2*
<.2*<.2*<.2*
<.2* .05* (.003) <.04 (<.002)<.2*
TCLP
..<0.04 (<0.002)..._._-
_. _. <.04 (<.002)
<.04 (<.002)._ __-
<.04 (<.002) -__ --
..
..
.___<.04 (<.002)
-___<.04 (<.002) --
._ ..<.04 (<.002)<.04 (<.002)~
__ _.<.04 (<.002)_.
76

Table \2.-Concentrations of metals in soils in Washington determined by different laboratory methods-Continued
Sample number
PIP2P3P6(dup)P4P5
RlR2R3R4R6(dup)R5
UlU2U3U6(dup)U4U5
RS1 RS(dup)
Cadmium
TotalTotal
recoverable ASTM EP-TOX TCLP
Ol02O3O4O5
--
<2<2<2
<0.2*<.2* <0.04 (<0.002) <0.04 (<0.002)< 2*< 4 2*<.2*
._<0.04 (<0.002) ....
<2 <2 <2 <2 <2
<2
<2 <2
<2 <2
<2
<2 <2
<.2* <.2* <.2* <.2* <.2* <.2*
<.2* <.2* <.2*
<.04
<.04
(<.002)
(<.002)
<.04
<.04
(<.002)
(<.002)
<.04
<.04
(<.002)
(<.002)
<.04 (<.002) <.04 (<.002) <.04 (<.002)
<.04 (<.002) <.04 (<.002) <.04 (<.002)
77

Table ^..-Concentrations of metals in soils in Washington determined by different laboratory methods-Continued
Sample number
AlA2A3A4A5A6(dup)
ClC2C3C4C5
DlD2D3D4D5
FlF2F6(dup)F3F4F5
GlG2G3G4G5
JlJ2J3J4J5
LIL2L3L4L6(dup)L5
MlM2M3M4M5
Total
__
100170
8379
160
120150-
140
130340
995051~~
540
81 ..
5964
4284~
49
26096
7867
61120
57
Chromium
Total recoverable ASTM EP-TOX
51.541.2 <0.1 (<0.005) <0.1 (<0.005)56.726.034.235.5
16.014.812.2+10.1+11.4+ <.l (<.005) <.l (<.005)
32.0 <.l (<.005) <.l (<.005)26.725.145.2
163
22.8 <.l (<.005) <.l (<.005)25.119.926.659.7
313
27.517.924.819.524.5 <.l (<.005) <.l (<.005)
35.910.8+17.9 <.l (<.005) <.l (<.005)18.311.4+
71.336.929.320 <.l (<.005) <.l (<005)20.6 <.l (<.005) <.l (<.005)38.4
21.537.317.115 <.l (<.005) <.l (<.005)26.1
TCLP
«
<0.1 (<0.005)......~
__......<.l (<.005)
<.l (<.005)......-
<.l (<.005)..-....--
_... ..<.l (<.005)
.. <.l «.005)..--
..
..
..<.l (<.005)<.l (<.005)
__....<.l (<.005)..
78

Table A2.-- Concentrations of metals in soils in Washington determined by different laboratory methods Continued
Sample number
Ol02O3O4O5
PIP2P3P6(dup)P4P5
RlR2R3R4R6(dup)R5
UlU2U3U6(dup)U4U5
RS1RS(dup)
Total
776861--
5356542834
55
4268~-
5650 -
69
120110
Chromium
Total recoverable ASTM EP-TOX
11.817.3 <0.1 (<0.005) <0.1 (<0.005)15.912.914.7
15.412.616.113.46.1+ <.l (<.005) <.l (<.005)7.6+
5.0+ <.l (<.005) <.l (<.005)6.6+
10.88.89.49.1
12.4 <.l (<.005) <.l (<.005)16.115.717.912.915.1
20.3 <.l (<.005) <.l (<.005)20.1
TCLP
..<0.1 (<0.005)
_...-
..
..
..
..<.l (<.005)
<.l (<.005)........--
<.l (<.005) ......--
<.l (<.005)--
79

Table ^.-Concentrations of metals in soils in Washington determined by different laboratory methods Continued
Sample number
AlA2A3A4A5A6(dup)
ClC2C3C4C5
DlD2D3D4D5
FlF2F6(dup)F3F4F5
GlG2G3G4G5
JlJ2J3J4J5
LIL2L3L4L6(dup)L5
MlM2M3M4M5
Total
29
120
2832
42
2327-
13«
2868
533031 .
29
39 ~
4927
__3031
30
5333_.
2830
2844
28
Copper
Total recoverable ASTM EP-TOX
33.922.5 <0.4 «0.02) <0.4 (<0.02)99.423.224.425.4
5.2+J.^+ - - - -
4.3+4 4+5.0+ <.4 (<02) <.4 (<.02)
7.2+ <.4 (<.02) <.4 (<.02)6.2+8.1+
18 750.9
28.9 <.4 «.02) <.4 (<.02)24.923.518.331.126.5
26.215.423.231.723.9 <.4 (<.02) <.4 (<.02)
53.020.211.6+ <.4 (<.02) <.4 (<.02)13.4+11.9+
27.308 7£rO. 1
14.8+14.7+ <.4 «.02) <.4 (<.02)16.9+ <.4 (<.02) <.4 (<.02)16.0+
21.626.925.9+20.0+ <.4 (<.02) <4 (<.02)20.7+
TCLP
__<0.4 (<0.02).. ..-
__.._._.<.4 (<.02)
<.4 (<.02).._. -
<.4 (<.02)..-- ~
__.. __<.4 (<.02)
._
..<.4 (<.02)..
_... <.4 (<.02)<.4 (<.02)
..
..
..<.4 (<.02)..
80

Table A2. Concentrations of metals in soils in Washington determined by different laboratory methods Continued
Sample number
OlO2O3CMO5
PIP2P3P6(dup)P4P5
RlR2R3R4R6(dup)R5
UlU2U3U6(dup)U4U5
RS1RS(dup)
Total
__273029--
_2827252223
85
2624-
2637 --
24
2119
Copper
Total recoverable ASTM EP-TOX
17.8+19.2+ 0.66 (0.033) <0.4 (<0.02)18.4+21.5+20.3+
21.9+16.0+18.9+16.8+11.1+ <.4 (<.02) <.4 (<.02)12.9+
9.1+ <.4 (<.02) <.4 (<.02)13.2+14.6+12.7+11.7+13.2+
14.6+ <4 (<.02) <4 (<.02)23.5+17.8+17.1+14.1+15.0+
11.0+ <.4 (<02) <.4 (<.02)11.1+
TCLP
__<0.4 (<0.02)....--
..
..
..
..<.4 (<.02)
<.4 (<.02)...... --
<.4 (<.02).... ..--
<.4 (<.02)--
81

Table A2. Concentrations of metals in soils in Washington determined by different laboratory methods Continued
Sample number
AlA2A3A4A5A6(dup)
ClC2C3C4C5
DlD2D3D4D5
FlF2F6(dup)F3F4F5
GlG2G3G4G5
JlJ2J3J4J5
LIL2L3L4L6(dup)L5
MlM2M3M4M5
Total
»
5.28.8 4.15.2
6.1«5.96.9--
3.4 3.96.0
5.23.03.0« 4.9
8.8 5.85.4
2.54.1 2.5
5.44.1 4.14.1--
7.77.4 4.6
Iron
Total recoverable ASTM EP-TOX
4.23.3 0.5 (0.03) <0.4 (<0.02)6.32.63.84.0
1.31.41.11.1.9 5.3 (.27) 1.9 (.10)
1.7 1.2 (.06) 1.5 (.08)1.41.82.35.0
2.5 1.9 (.10) <.4 (<.02)2.22.22.13.23.2
5.63.02.73.44.0 <.4 (<.02) .9 (.05)
2.81.31.6 .6 (.03) .7 (.03)1.2i.o
2.62.52.01.9 2.0 (.1) .9 (.04)2.0 <.4 (<.02) .6 (.03)2.3
5.24.32.33.3 <.4 (<.02) .6 (.03)2.7
TCLP
» ..
<0.4 (<0.02)......~
..
..
..
..1.5 (.08)
1.6 (.08)......-
1.4 (.07)..----..-
..
..
..
...9 (.05)
..
..1.1 (.06)..-
..
..
...4 (.02).6 (.03)
..
..
..2.0 (.10)..
82

Table ^.-Concentrations of metals in soils in Washington determined by different laboratory methods-Continued
Sample number
01O2 03O405
PIP2P3P6(dup) P4 P5
Rl R2R3R4R6(dup) R5
UlU2U3U6(dup) U4U5
RS1RS(dup)
Total
_3.8 3.45.7--
_4.04.04.0 2.8 2.8
9.3
3.86.0
4.6 3.8
3.3
3.23.2
Iron
Total recoverable ASTM EP-TOX
2.22.1 <0.7 (<0.04) 0.7 (0.04) 2.32.82.4
3.02.52.62.3 1.1 .6 (.03) .4 (.02) 1.3
2.1 6.3 (.3) .9 (.05) 2.41.71.61.7 2.2
2.3 1.2 (.06) .6 (.03) 2.12.12.3 2.01.9
1.3 <.4 «.02) <.4 «.02)1.4
TCLP
_0.9 (0.04)
--
_-
.8 (.04)
17.5 (.90)
__
--
5.2 (.30)
..
<.4 «.02)--
83

Table A2.-Concentrations of metals in soils in Washington determined by different laboratory methods-Continued
Mercury
Sample number
AlA2A3A4A5A6(dup)
ClC2C3C4C5
DlD2D3D4D5
FlF2F6(dup)F3F4F5
GlG2G3G4G5
JlJ2J3J4J5
LIL2L3L4L6(dup)L5
MlM2M3M4M5
Total
_0.16
.22
.20
.14
5.9 6
.20-
.06~
.10
.38
.26
.08
.10
.06
.06
.08
.06
...06.04
.04
.04
.04
.04
.06-
.08
.08
.06
Total recoverable ASTM
0.119.093 0.003 (0.0002).055.042*.061.056
.009*
.01*
.011*
.011*
.009* .003 (.0002)
.021 .002 (.0001)
.038*
.031*
.045*
.185
.065 .003 (.0002)
.03*
.03*
.039*
.047*
.058
.019*
.018*
.025*
.042*
.05* .003 (.0002)
.025*
.01*
<.004 .003 (.0001).007*.013*
.005*
.015*
.01*
.013* .004 (.0002)
.007* .001 (.0001)
.004*
.01*
.01*
.05
.01* .003 (.0001)
.05
EP-TOX TCLP
_<0.0008 (<0.00004) <0.001 (<0.0001)- --
__.... <.0008 (<.00004) <.001 (<.0001)
<.0008 (<.00004) <.001 (<.0001).. -
<.0008 (<.00004) <.001 (<.0001)..--....--
.. ....<.0008 (<.00004) <.001 (<.0001)
._
..<.0008 (<.00004) <.001 (<.0001)..
..
.. <.0008 (<.00004) <.001 (<.0001)<.0008 (<.00004) <.001 (<.0001)~
__....<.0008 (<.00004) .001 (.0001)..
84
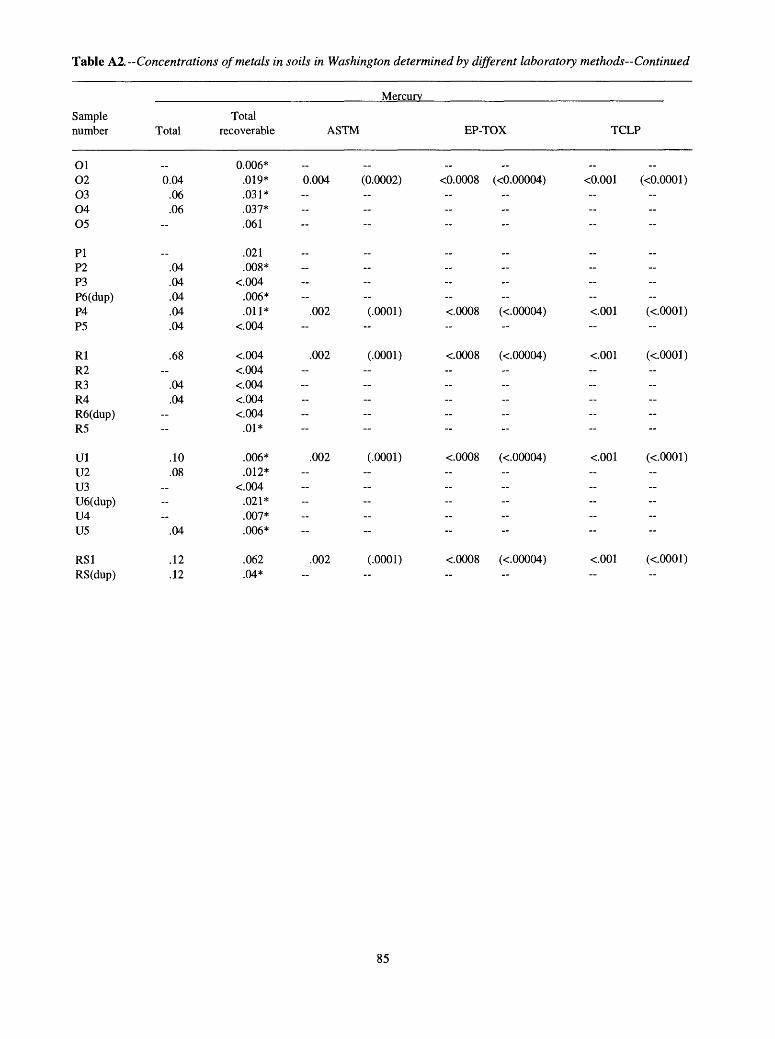
Table A2. -Concentrations of metals in soils in Washington determined by different laboratory methods Continued
Sample number
OlO203O4O5
PIP2P3P6(dup)P4P5
RlR2R3R4R6(dup)R5
UlU2U3U6(dup)U4U5
RS1RS(dup)
Total
_0.04
.06
.06--
_.04.04.04.04.04
.68
.04
.04--
.10
.08 ----
.04
.12
.12
Mercurv
Total recoverable ASTM EP-TOX
0.006*.019* 0.004 (0.0002) <0.0008 (<0.00004).031*.037*.061
.021
.008*<.004
.006*
.011* .002 (.0001) <.0008 (<.00004)<.004
<.004 .002 (.0001) <.0008 (<.00004)<.004<.004<.004<.004
.01*
.006* .002 (.0001) <.0008 (<.00004)
.012*<.004
.021*
.007*
.006*
.062 .002 (.0001) <.0008 (<.00004)
.04*
TCLP
_<0.001 (<0.0001)---
_
_---<.001 (<.0001)~
<.001 (<.0001) _--.--~
<.001 (<.0001)--------
<.001 (<.0001)--
85

Table A2. Concentrations of metals in soils in Washington determined by different laboratory methods Continued
Sample number
AlA2A3A4A5A6(dup)
ClC2C3C4C5
DlD2D3D4D5
FlF2F6(dup)F3F4F5
GlG2G3G4G5
JlJ2J3J4J5
LIL2L3L4L6(dup)L5
MlM2M3M4M5
Total
_410
1,500
680650
1,300
820800
--
550
580690
7401,4001,400
750
1,100
970620
_630780
670
910720
670680
--
7501,000
-790
-
Manganese
Total recoverable ASTM EP-TOX
537303 0.7 (0.04) 0.9 (0.04)930277633698
15914910711278 <.4 (<.02) <.4 (<.02)
229 <.4 (<.02) <.4 (<.02)197231366631
339 <.4 (<.02) <.4 (<.02)783696344757478
825478494686644 <.4 (<.02) <.4 (<.02)
571345256 <.4 (<.02) <.4 (<.02)234233
363430294340 <.4 (<.02) <.4 (<.02)359 <.4 (<.02) <.4 (<.02)372
485 - - - -680 - -453 - - - -814 <.4 (<.02) .7 (.03)486 - - -
TCLP
_3.5 (0.18)-
.... <.4 (<.02)
1.4 (.07).....-~
1.2 (.06)-----..--
___.....3.6 (.18)
.7 (.04)--
_.--_.
.6 (.03)
.6 (.03)--
.--6.5 (.33)-
86

Table A2.~ Concentrations of metals in soils in Washington determined by different laboratory methods-Continued
Sample number
01O203O405
PIP2P3P6(dup)P4P5
RlR2R3R4R6(dup)R5
UlU2U3U6(dup)U4U5
RS1RS(dup)
Total
_640600
, 860-
_690670670560550
1,600--
550940
--
560640 -
540
560570
Manganese
Total recoverable ASTM EP-TOX
389361 <0.4 (<0.02) 4.4 (0.2)465480361
652516523499252 <.4 (<-02) <.4 (<.02)279
245 <.4 «.02) <.4 «.02)378325268265377
390 <.4 «.02) <.4 «.02)428450450371344
210 <.4 «.02) <.4 «.02)260
TCLP
_3.1 (0.15)- --
__....--<.4 (<-02)--
1.3 (.06).... ----
.8 (.04).. -- ~
.6 (.03)--
87

Table A2.- Concentrations of metals in soils in Washington determined by different laboratory methods Continued
Sample number
AlA2A3A4A5A6(dup)
ClC2C3C4C5
DlD2D3D4D5
FlF2F6(dup)F3F4F5
GlG2G3G4G5
JlJ2J3J4J5
LIL2L3L4L6(dup)L5
MlM2M3M4M5
Total
_3376-
2429
62
5534--
66
73120
492321
470
27
2223
_1230
20
7036
3032
1548
20
Nickel
Total recoverable ASTM EP-TOX
26.819.6 <0.4 (<0.02) <0.4 (<0.02)63.211.914.215.6
10.310.09.08.77.6 <.4 (<.02) <.4 (<.02)
22.3 <.4 (<.02) <.4 (<.02)31.319.139.891.1
25.6 <.4 (<.02) <.4 (<.02)31.520.123.156.2
358
20.419.420.613.317.5 <.4 (<.02) <.4 (<.02)
24.67.8
12.3 <.4 (<.02) <.4 (<.02)17.09.5
34.120.816.712.2 <.4 (<.02) <.4 (<.02)14.9 <.4 (<.02) <.4 (<.02)19.4
9.729.926.611.8 <.4 (<.02) <.4 (<.02)27.6
TCLP
_<0.4 (<0.02) ._._
..
._
._ <.4 (<.02)
<.4 (<.02)-__..
<.4 (<.02)_.--~..~
._--.. <.4 (<.02)
_...<.4 (<.02)
_.-- <.4 (<.02)<.4 (<.02)~
_.--..<.4 (<.02)--
88

Table ML Concentrations of metals in soils in Washington determined by different laboratory methods Continued
Sample number
OlO2O3O4O5
PIP2P3P6(dup)P4P5
RlR2R3R4R6(dup)R5
UlU2U3U6(dup)U4U5
RS1RS(dup)
Total
282827--
1816161111
32~
1824--~
2024 --~
21
4544
Nickel
Total recoverable ASTM EP-TOX
12.816.5 <0.4 (<0.02) <0.4 (<0.02)17.018.915.7
16.510.714.011.37.7 <.4 (<.02) <.4 (<.02)7.1
6.4 <.4 (<.02) <.4 (<.02)9.2
11.29.79.9
11.7
10.3 <.4 (<.02) <.4 (<.02)14.613.914 210.5U ? .^
22.4 <.4 (<.02) <.4 (<.02)^ 7 **j* 1 * *
TCLP
__<0.4 (<0.02).. --
..
..
..
..<.4 (<.02)~
<.4 (<.02)......--
<.4 (<.02)....--
<.4 (<.02)--
89

Table A.2. Concentrations of metals in soils in Washington determined by different laboratory methods Continued
Sample number
AlA2A3A4A5A6(dup)
ClC2C3C4C5
DlD2D3D4D5
FlF2F6(dup)F3F4F5
GlG2G3G4G5
JlJ2J3J4J5
LIL2L3L4L6(dup)L5
MlM2M3M4M5
Total
__134
1011
12
1515--
11 97
1488-- 5
12
1415
__1217 10
1316~
1211--
107
12._
Lead
Total recoverable ASTM EP-TOX
129.7* <0.4 (<0.02) <0.4 (<0.02)4.0*4.0*
10 *10 *
3.2*2.3*2.1*3.1*2.3* <.4 (<-02) <.4 (<.02)
5.2* <.4 (<-02) <.4 (<-02)6.1*3.8*4.7*
12.0
10 * <.4 (<.02) <.4 (<.02)5.4*7.4*6.0*7.3*3.6*
9.9*5.0*8.6*8.7*
13 <.4 «.02) <.4 (<.02)
9.9*5.4*6.6* <.4 (<.02) <.4 (<-02)4.8*4.2*
5.0*9.5*8.8*6.4* <.4 (<.02) <.4 (<.02)3.6* <.4 (<-02) <.4 (<.02)5.9*
9.4*9.2*6.6*7.9* <.4 (<.02) <.4 (<.02)6.8*
TCLP
__<0.4 (<0.02).... -
_......<.4 «.02)
<.4 (<.02).... -
<.4 «.02)........--
__......<.4 (<-02)
_..<.4 (<-02)..-
_....<.4 (<-02)<.4 (<-02)
_. ..<.4 (<-02)
90

Table A2. Concentrations of metals in soils in Washington determined by different laboratory methods Continued
Lead
Sample number
PIP2P3P6(dup)P4P5
RlR2R3R4R6(dup)R5
UlU2U3U6(dup)U4U5
RS1 RS(dup)
TotalTotal
recoverable ASTM EP-TOX TCLP
Ol02O3O4O5
__
151114
8.2*8.7* <0.4 (<0.02) <0.4 (<0.02)8.2*
10.97 0*/ .\/
..
<0.4 (<0.02)_. __
1110111110
36
1012
2021
16
87
11.7 8.0*
10.4 9.8* 6.7* 5.8*
4.2* 8.0* 6.8* 6.0* 5.4* 5.3*
13.612.011.011.911.210.5
4.7* 5.5*
<4
<4
<.4 «.02)
<4 (<.02)
«.02)
«.02)
«.02)
91

Table XL-Concentrations of metals in soils in Washington determined by different laboratory methods-Continued
Sample number
AlA2A3A4A5A6(dup)
ClC2C3C4C5
DlD2D3D4D5
FlF2F6(dup)F3F4F5
GlG2G3G4G5
JlJ2J3J4J5
LIL2L3L4L6(dup)L5
MlM2M3M4M5
Total
._
1.31.0 1.41.2
1.3 1.41.9-
1.3 «1.73.8
1.41.21.0 1.1
1.3 ~1.51.6
.7
1.7 1.2
.61.6 1.01.1
--
0.8.8
..8
-
Antimony
Total recoverable ASTM EP-TOX
<3<3 <0.4 (<0.02) <0.4 (<0.02)<3<3<3<3
<3<3<3<3<3 <.4 (<.02) <.4 (<.02)
<3 <.4 (<.02) <.4 (<.02)<3<3<3<3
<3 <.4 (<.02) <.4 (<.02)<3<3<3<3<3
<3<3<3<3<3 <.4 (<.02) <.4 (<.02)
<3<3<3 <.4 (<.02) <.4 (<.02)<3<3
<3<3<3<3 <.4 (<.02) <.4 (<.02)<3 <.4 (<.02) <.4 (<.02)<3
<3 - - - -<3 - - - -<3 - - -<3 <.4 (<.02) <.4 (<.02)<3 - - - -
TCLP
__<0.4 (<0.02)......--
_......<.4 (<.02)
<.4 (<.02)._ ..--
<.4 (<.02)..--....-
___.._ <.4 (<.02)
..<.4 (<.02)..~
_....
.4 (.02)<.4 (<.02)--
_--<.4 (<.02)-
92

Table ^. Concentrations of metals in soils in Washington determined by different laboratory methods Continued
Sample number
01O2 030405
PIP2P3P6(dup) P4P5
RlR2R3R4R6(dup) R5
Ul U2U3U6(dup) U4U5
RS1RS(dup)
Total
_1.6 1.21.7
--
_1.21.11.2
1.0
3.8
.81.5
--
1.9 1.3
1.2
1.21.3
Antimonv
Total recoverable ASTM EP-TOX
<3<3 <0.4 (<0.02) <0.4 (<0.02)<3<3<3
<3<3<3<3
<3
<3 <.4 «.02) <.4 (<.02)<3<3<3<3 <3
<3 <.4 (<-02) <.4 (<-02)<3<3<3 <3<3
<3 <.4 «.02) <.4 «.02)<3
TCLP
__0.4 (0.02)
..~
_.....
<.4 (<.02)-
<.4 (<-02) .. ~" "~
.4 (.02)
..
-
<.4 «.02)--
93

Table XL Concentrations of metals in soils in Washington determined by different laboratory methods Continued
Sample number
AlA2A3A4A5A6(dup)
ClC2C3C4C5
DlD2D3D4D5
FlF2F6(dup)F3F4F5
GlG2G3G4G5
JlJ2J3J4J5
LIL2L3L4L6(dup)L5
MlM2M3M4M5
Selenium
Total Total recoverable ASTM EP-TOX
<0.51.2 <.5 <1 (<0.05) <1 (<0.05)1.2 <.5
<.5.2 <.5.3 <.5
3 ^ C ^.J " "~
<.54 < 5.3 <.5
<.5 <1 «.05) <1 «.05)
.2 <.5 <1 (<.05) <1 (<.05)<.5< 5
.1 <.5
.7 <.5
.4 <.5 <1 (<.05) <1 (<.05) J ^»O *"" ~ """ **"'
A ^ S " ~* *
<.5<.5
1 ^ C
.3 <.5<.5< 5
.3 <.5
.2 <.5 <1 (<.05) <1 (<.05)
< 51.0 <.5
.1 <.5 <1 (<.05) <1 (<.05)<5
<.l <5
.1 <.5
.2 <.5<.5
.1 <5 <1 (<.05) <1 (<.05)
.1 <5 <1 (<.05) <1 (<.05)<.5
.1 <.5O ^ C mff ^m _^ ^.
<.5<.l <.5 <1 (<.05) <1 (<.05)
<.5
TCLP
..<1 (<0.05)..~..-
..
<1 (<.05)
<1 (<.05)......-
<1 (<.05)........--
..
..
..
..<1 (<.05)
..
..<1 (<.05)..~
..
..
..<1 (<.05)<1 (<.05)
..
..
..<1 (<.05)
94

Table \2.-Concentrations of metals in soils in Washington determined by different laboratory methods-Continued
Selenium
Sample Total number Total recoverable ASTM EP-TOX
Ol - <0.5O2 <0.1 <.5 <1 (<0.05) <1 (<0.05)O3 .1 <.5O4 .1 <.5O5 - <.5
PI ^ 5i 1 ^ J
P2 .1 <5P3 .1 <5P6(dup) .1 <.5 P4 <.l <.5 <1 «.05) <1 «.05)P5 <.l <.5
Rl <.l <5.4 <1 (<05) <1 (<.05)R2 - <.5R3 <.l <.5R4 .1 <.5R6(dup) - <.5 R5 -- <.5
Ul <.l <.5 <1 «.05) <1 «.05)U2 1.0 <5U3 -- <5U6(dup) - <.5 U4 - <.5U5 <.l <.5
RS1 .3 <5 <1 (<.05) <1 (<.05)RS(dup) .3 <.5
TCLP
__<1 (<0.05).. --
<1 (<.05)~
<1 (<.05)......
:: :<1 «.05)....
: :-<1 «.05)-
95

Table A2. Concentrations of metals in soils in Washington determined by different laboratory methods Continued
Sample number
AlA2A3A4A5A6(dup)
ClC2C3C4C5
DlD2D3D4D5
FlF2F6(dup)F3F4F5
GlG2G3G4G5
JlJ2J3J4J5
LIL2L3L4L6(dup)L5
MlM2M3M4M5
Thallium
Total Total recoverable ASTM EP-TOX
<5<5 <0.4 (<0.02) <0.4 (<0.02)<5
""* ^J ~ ~~ "
<5<7.1
<5<5<5<5<5 <.4 (<02) <.4 (<.02)
<5 <.4 (<.02) <.4 (<.02)<5<5
~" ^J " * ~ "
<5
<5 <.4 (<.02) <.4 (<.02)<5<? <;"" ^^/ » "
<5<5>5.4*
<5<5<5<5<5 <.4 (<.02) <.4 (<.02)
>9.2*<5<5 <.4 (<02) <.4 (<.02)<5<5
>14 *>5.1*<5<5 <.4 (<.02) <.4 (<.02)<5 <.4 (<.02) <.4 (<.02)>7 *
>7.9*>6.2*>9.3*>6.3* <.4 (<.02) <.4 (<.02)>9.2*
TCLP
--<0.4 (<0.02).. ..--
_ .. <.4 (<.02)
<.4 (<.02)......-
<.4 (<.02)........--
_.......<A (<.02)
..
..<.4 (<.02)..
_- <.4 (<.02)<A (<.02)
..
..
..<.4 (<02)..
96
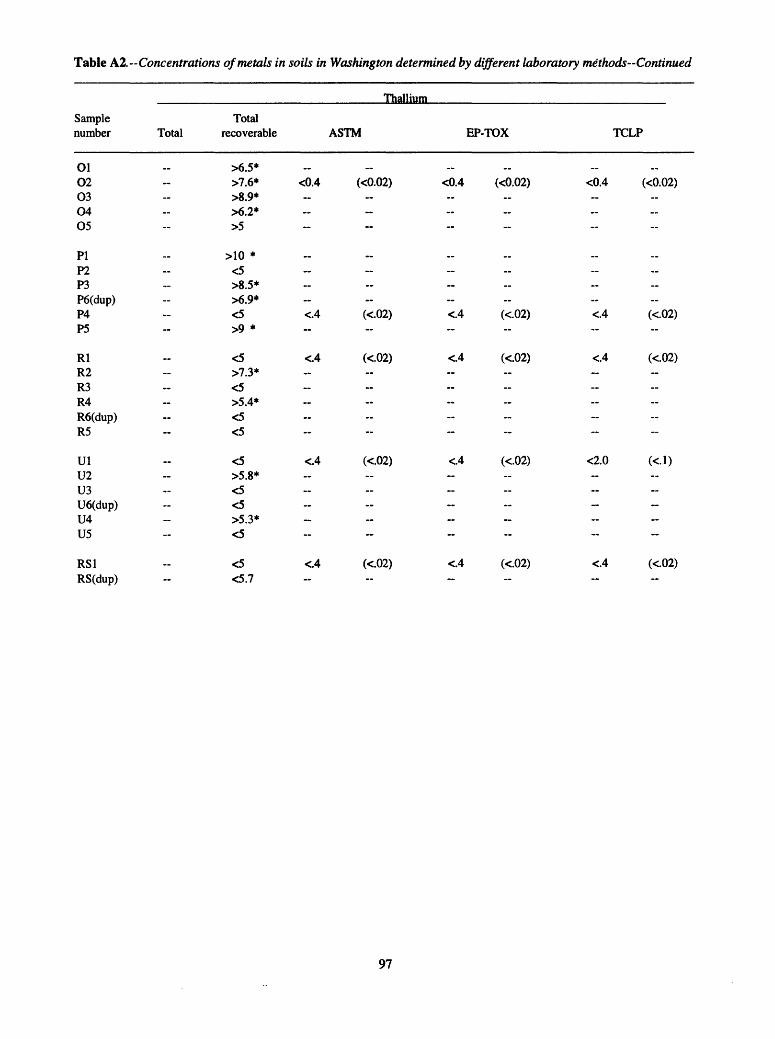
Table A2. Concentrations of metals in soils in Washington determined by different laboratory methods Continued
Sample number
Thallium
TotalTotal
recoverable ASTM EP-TOX TCLP
0102030405
PIP2P3P6(dup)P4P5
RlR2R3R4R6(dup)R5
UlU2U3U6(dup)U4U5
RS1 RS(dup)
>6.5* >7.6* >8.9* >6.2* >5
>10 * <5>8.5* >6.9* <5 >9 *
<5>7.3*<5>5.4*<5<5
<5>5.8*<5<5>5.3* <5
<5<5.7
<0.4 (<0.02) <0.4 (<0.02) <0.4 (<0.02)
<4
<A <2.0
97

Table ^.-Concentrations of metals in soils in Washington determined by different laboratory methods-Continued
Sample number
AlA2A3A4A5A6(dup)
ClC2C3C4C5
DlD2D3D4D5
FlF2F6(dup)F3F4F5
GlG2G3G4G5
JlJ2J3J4J5
LIL2L3L4L6(dup)L5
MlM2M3M4M5
Total
_80
100
9596
280
140130
--
110
89130
1207677
69
130
12094
_6793
65
160110
..8282~
97110
81
Zinc
Total recoverable ASTM EP-TOX
63.153.8 <0.4 (<0.02) 0.6 (0.03)86.044.563.068.0
24.427.521.124.624.1 <.4 (<.02) .6 (.03)
36.7 <A (<.02) 1.1 (.6)42.445.054.0
116
46.5 <.4 (<.02) .5 (.2)62.759.537.990.747.9
82.150.863.075.374.0 <.4 (<.02) .6 (.03)
77.9*39.439.6 .4 (.02) .9 (.5)31.4*+30.7+
82.3*75.4*58.3*41.0 <.4 (<.02) .4 (.02)46.9 .4 (.02) <.4 (<.02)56.4*
70.5*80.7*37.0*45.2* <.4 (<.02) 1.0 (.05)38.8*
TCLP
1.8 (0.09) --
._ 1.2 (.06)
1.3 (.07)....._--
1.2 (.06) --.._.~
.. 1.3 (.06)
__ 2.0 (.10)..--
.. 1.8 (.09)1.5 (.08)
.. 1.8 (.09)..
98

Table \2. Concentrations of metals in soils in Washington determined by different laboratory methods Continued
Sample number
OlO203O4O5
PIP2P3P6(dup)P4P5
RlR2R3R4R6(dup)R5
UlU2U3U6(dup)U4U5
RS1RS(dup)
Total
707688-
7372696361
180
6684---
9686~-
70
5354
Zinc
Total recoverable ASTM EP-TOX
41.5*40.5* 0.6 (0.03) 0.4 (0.02)40.5*47.4*42.4*
49.4*43.8*47.1*44.1*26.3* .5 (.03) .7 (.4)31.5*
37.4* <4 (<.02) .5 (.3)42.2*32.4*30.3*31.6*39.7*
49.6* .8 (.04) <.4 (<.02)46.8*48.2*51.6*44.6*42.9*
23.7* <.4 (<02) .4 (.02)25.4*
TCLP
0.7 (0.03)....--
._
..
..-1.5 (.08)
2.1 (.11).. .. --
1.9 (.10)....--....
1.2 (.06)--
99

Table A3. Particle-size distribution of soil samples in Washington
[(dup), indicates duplicate of preceding sample; all samples were sieved prior to determination of distribution to remove particles greater than 19 millimeters]
Sample number
AlA2A3A4A5A6(dup)
ClC2C3C4C5
DlD2D3D4D5
FlF2F6(dup)F3F4F5
GlG2G3G4G5
JlJ2J3J4J5
LIL2L3L4L6(dup)L5
Percent of particles finer than indicated size, in millimeters16.0
100.089.197.499.0
100.0100.0
100.0100.0100.0100.0100.0
98.597.6
100.098.498.2
84.493.191.297.7
100.0100.0
100.0100.098.2
100.0100.0
100.0100.0100.0100.0100.0
100.0100.0100.0100.0100.097.8
8.0
85.973.291.885.795.9
100.0
100.0100.0100.0100.0100.0
82.178.589.487.183.5
44.766.262.990.999.097.2
98.399.583.989.1
100.0
100.0100.095.299.094.5
100.098.795.7
100.0100.093.4
4.0
68.458.482.169.174.289.2
100.0100.0100.0100.0100.0
72.065.879.674.367.5
26.351.149.384.191.487.4
95.599.270.675.0
100.0
100.0100.091.198.690.5
100.091.989.499.7
100.086.0
2.0
57.748.580.255.759.771.8
100.0100.0100.0100.0100.0
67.559.776.268.256.9
20.743.040.980.577.380.2
93.098.060.864.187.5
100.0100.089.498.087.4
100.081.882.698.598.780.4
1.0
41.333.372.740.842.752.0
100.099.9
100.099.999.9
61.655.371.060.842.4
16.936.834.975.158.067.4
81.692.948.448.865.9
96.896.585.596.081.7
81.363.167.392.093.067.4
0.5
28.422.561.631.027.335.8
98.999.999.999.999.8
50.347.861.552.230.8
14.729.928.367.040.856.3
63.876.539.236.650.5
77.591.576.889.073.4
60.644.947.377.379.451.5
0.25
17.815.046.322.915.623.6
59.097.496.189.497.3
30.128.538.237.320.6
11.922.221.150.126.443.9
44.539.032.824.740.3
57.285.961.076.062.7
44.530.729.454.454.936.7
0.125
9.88.6
26.513.18.8
15.9
2.36.33.93.94.8
18.719.023.123.912.2
6.615.715.033.717.530.1
24.720.823.816.033.3
40.876.331.856.149.0
28.219.718.033.934.122.4
0.063
4.13.0
11.55.84.28.7
.1
.2
.4
.71.5
11.112.714.613.25.8
2.710.09.6
20.111.916.7
10.510.88.89.2
23.0
27.553.310.227.830.5
16.511.19.1
20.520.710.6
100

Table A3. Particle-size distribution of soil samples in Washington Continued
Sample number
MlM2M3M4M5
OlO2O3O4O5
PIP2P3P6(dup)P4P5
RlR2R3R4R6(dup)R5
UlU2U3U6(dup)U4U5
Percent of particles finer than indicated size, in millimeters16.0
95.696.998.997.296.3
100.0100.0100.0100.095.4
100.0100.0100.0100.0100.0100.0
100.0100.0100.0100.098.7
100.0
96.798.2
100.099.2
100.0100.0
8.0
74.381.392.783.083.7
100.0100.096.9
100.079.6
98.599.2
100.0100.0100.0100.0
100.0100.0100.095.794.7
100.0
83.973.390.388.698.593.6
4.0
58.165.685.868.267.5
100.0100.092.799.768.9
97.597.1
100.0100.0100.0100.0
100.099.9
100.094.293.1
100.0
75.448.484.581.196.785.7
2.0
48.158.382.456.359.4
99.8100.087.095.659.9
94.995.898.199.999.9
100.0
100.099.899.893.792.699.8
67.729.082.278.194.576.2
1.0
37.942.276.442.049.8
99.699.778.790.548.0
88.991.994.097.799.799.9
99.999.799.193.392.299.2
49.816.478.473.091.961.0
0.5
30.224.470.633.339.3
99.498.970.285.130.8
80.388.288.792.099.599.8
97.699.397.392.791.697.1
33.410.968.762.958.244.5
0.25
21.611.161.824.527.6
98.796.857.079.416.3
67.183.681.183.297.698.4
76.596.594.987.987.182.6
18.48.5
53.549.313.729.9
0.125
13.15.2
49.914.118.0
93.590.944.674.1
8.6
50.575.772.674.086.489.1
21.661.889.868.067.139.7
8.26.9
41.438.2
9.121.3
0.063
6.32.6
31.77.49.5
54.470.532.262.1
3.9
27.455.952.453.055.664.2
.711.070.923.322.513.8
3.55.1
28.325.7
5.612.1
RS1 100.0 100.0 100.0 100.0 94.3 81.4 55.2 31.5 15.1
101

Table A4. Miscellaneous characteristics of soil samples in Washington
[Concentrations of carbon are in percent of dry soil; concentrations of TPH (Total Petroleum Hydrocarbons) and PCB's (Polychlonnated Biphenyls) are in milligrams per kilogram of dry soil; 1:1, pH values determined using 1:1 mixture by weight of soil and deionized water; CaCl2, pH values determined after the addition of CaCl2 to me soil- water mixture; --, no data; (dup), indicates duplicate of preceding sample]
Sample number
AlA2A3A4A5A6(dup)
ClC2C3C4C5
DlD2D3D4D5
FlF2F6(dup)F3F4F5
GlG2G3G4G5
JlJ2J3J4J5
CarbonOrganic Inorganic
__ __1.9 0.024.6 .04
__.6 <.01.6 <.01
3.6 <.01__1.0 <.013.9 .03-
2.6 .03____1.4 <.013.0 .03
3.1 .0411.9 .0212.2 .01 __
.4 <.01
.9 <.01___.1.8 <.01.7 <.01
.. ..
1.6 <.01.7 <.01
__1.5 <.01
1:1
5.45.15.75.35.75.6
7.56.76.47.05.3
4.85.95.35.05.2
5.86.05.95.56.66.3
6.05.96.06.05.2
7.97.37.38.06.8
pHCaCl2
4.54.24.74.24.64.5
6.05.85.25.84.2
4.44.94.34.34.5
5.04.95.04.55.25.0
5.15.05.34.74.4
7.36.26.56.65.7
TPH PCB's
<40 <27<40 <21<40 <22*<40 <19<40 <19<40 <19
<40 <10<40 <10<40 <10<40 <10<40 <20
<40 <17<40 <17<40 <17<40 <18<40 <22
<40 <12<40 <10<40 <10<40 <10<40 <18<40 <17
<40 <17<40 <17<40 <18<40 <18<40 <18
<40 <21<43 <18<40 <16<40 <16<40 <16
102

Table A4. Miscellaneous characteristics of soil samples in Washington -Continued
Sample number
LIL2L3L4L6(dup)L5
MlM2M3M4M5
Ol02O3O4O5
PIP2P3P6(dup)P4P5
RlR2R3R4R6(dup)R5
UlU2U3U6(dup)U4U5
RS1RS(dup)
CarbonOrganic Inorganic
1.7 <.013.1 <.01
.8 <.01
.8 <.01
1.8 <0.012.2 <.01
__1.3 <.01
--
__ _.4 1.1.8 .5.5 .4
--
_2.3 <.011.4 <.011.6 <.01
_.1.7 <.01
2.9 .01__
.4 <.01
.8 .2..
.5 <.01
.6 <.01__--
.5 <.01
1.5 .021.5 .01
1:1
6.87.56.16.96.97.6
7.37.08.66.77.0
8.28.98.48.47.7
7.87.36.86.76.87.0
7.58.57.98.18.48.7
6.46.56.96.97.87.2
5.55.5
pHCaCl2
5.56.65.36.26.27.4
6.57.08.26.15.9
7.47.67.67.76.7
7.26.45.95.95.96.0
6.68.17.08.17.97.7
5.65.66.35.66.56.1
5.05.1
TPH
<40<40<40<40<40<40
<40<40<40<40<40
<40<40<40<40<40
<40<40<40<40<40<40
<40<40<40<40<40<40
<40<40<40<40<40<40
_
PCB's
<20*<22<22<19*
<22<21*
<18*<20*<16*<17*
<18
<17*<17*<17*<17<16
^ 1 0
<17<17<17^ 1 0
<17
<16^ 1 Q
<17<16<16<16
<17*<16*<17*<17*<16*<16
_
* Estimated; holding time prior to laboratory determinations exceeded.
103