background ozone and implementation of the 2015 ozone naaqs
TRANSCRIPT

Background Ozone and Implementation of the 2015 Ozone NAAQSENV-VISION Conference: May 10, 2016
Contact: [email protected]

Challenges associated with background ozoneThere are several challenges involved in a constructive discussion of background ozone (BGO3) and its implications:
o Definitions of BGO3 can vary.o BGO3 originates from a variety of sources.o Cannot be directly measured.o Instead, estimated from air quality models.o Models, while valuable, are imperfect.o Can vary widely across space and time.o Usually, highest O3 days least impacted by BGO3o However, there are exceptions to above rule.o CAA provisions address exceptions, but differ depending upon specific sources of BGO3.
2
This map shows estimates of seasonal mean U.S. background ozone concentrations at surface monitoring locations from an EPA CMAQ simulation representing conditions from 2007. Note that average USB levels are far below the 70 ppb NAAQS.

3
Ozone Design Values by Site(Official 2012-14 on left; Preliminary 2013-15 on right)
While the ozone NAAQS designations process (October 2017) will likely use 2014-2016 data, it can be useful to look at the most recent design values to establish the context for discussing BGO3 issues.
Preliminary data (subject to change)
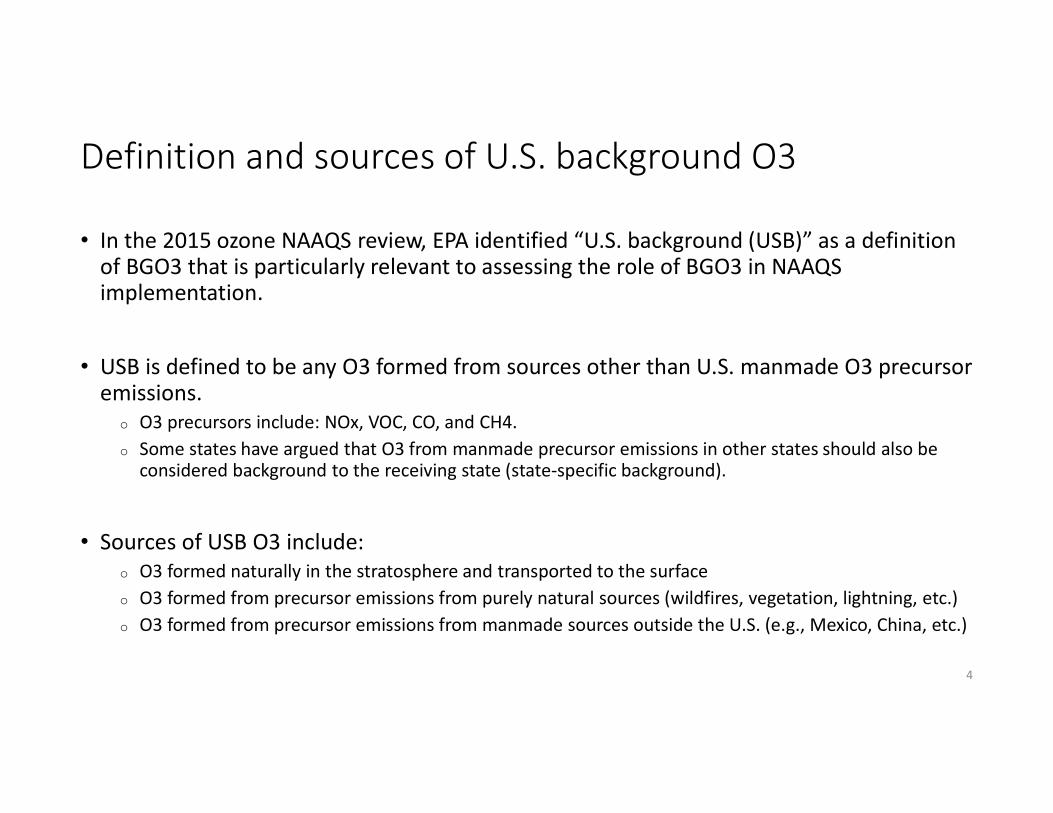
Definition and sources of U.S. background O3• In the 2015 ozone NAAQS review, EPA identified “U.S. background (USB)” as a definition of BGO3 that is particularly relevant to assessing the role of BGO3 in NAAQS implementation.• USB is defined to be any O3 formed from sources other than U.S. manmade O3 precursor emissions.
o O3 precursors include: NOx, VOC, CO, and CH4.o Some states have argued that O3 from manmade precursor emissions in other states should also be considered background to the receiving state (state-specific background).
• Sources of USB O3 include:o O3 formed naturally in the stratosphere and transported to the surfaceo O3 formed from precursor emissions from purely natural sources (wildfires, vegetation, lightning, etc.)o O3 formed from precursor emissions from manmade sources outside the U.S. (e.g., Mexico, China, etc.)
4

• Because of the limitations in quantifying (& attributing) USB contributions solely from monitoring data, photochemical grid models have been widely used as a means to estimate the contribution of background sources to observed surface O3 levels.• Two primary modeling methodologies have been used:
o Zero out / emissions perturbationo Source apportionment modeling
• EPA Integrated Science Assessment (ISA) summarized peer-reviewed literature through 2012 and concluded:o Seasonal mean background levels are highest in the inter-mountain western U.S.;o Seasonal mean background levels are highest in the spring and early summer;o Background impacts can occur on episodic and non-episodic scales (higher in discrete events); ando Models compare reasonably w.r.t. seasonal mean estimates, but daily estimates are imprecise.
5
Estimating BGO3: Methodology and Literature

6
Assessing model performance:o Seasonal/National mean bias, error, correlationo Regional/Monthly mean bias, error, correlation (upper left)o Site-specific/Hourly mean bias, error, correlation (lower left)o Diagnostic assessments of specific events / features
Model estimates of USB are influenced by the biases, errors, and uncertainties inherently associated with modeling simulations.o Estimates will vary by model application.o Simulations need to properly represent boundary conditions, vertical mixing, fire emissions, fire plume rise, fire plume chemistry, and horizontal transport to capture USB.
Estimating USB O3: Model performance

• EPA 2007 base year modeling with GEOS-Chem, CMAQ (zero out), and CAMx (source apportionment) confirmed the earlier ISA studies and also concluded that:o USB can comprise an appreciable fraction of MDA8 O3 across the U.S., with the largest relative contributions at higher-elevation, rural locations in the inter-mountain western U.S. in the spring and early summer seasons;o U.S. manmade emission sources are generally the dominant contributor to the modeled exceedances of the 2015 O3 NAAQS, nationally and within individual regions across the country (Slide 8); however analyses suggest that there can be infrequent events where MDA8 O3 concentrations approach or exceed 70 ppb largely due to the influence of USB sources like a wildfire or stratospheric intrusion.
• More recently, EPA has also looked at additional source apportionment modeling that considers USB contributions to O3 design values (slides 9-11).
7
Recent EPA estimates of BGO3

8
Distributions of the relative proportion of USB O3 to total O3, from 2007 CAMx source apportionment modeling, binned by model MDA8 O3.
Recent estimates of BGO3

9
• In order to establish the context for discussing the role of USB in NAAQS attainment, it is useful to combine current O3 design values with latest model estimates of domestic manmade emissions contributions to O3 design values.
Combining 2013-15 O3 DVs with Model Attribution (1/3)
Map of preliminary 2013-2015 O3 design values (sites with complete data except for locations dominated by winter ozone). Larger red circles represent sites > 70 ppb.

10
• Domestic manmade emissions are the dominant contributor to ozone design values at most locations in the EUS and parts of California.• Note: the thresholds in the legend are not intended to reflect regulatory significance of USB in any particular area.
Map of estimated manmade U.S. contribution to ozone design values based on CAMx source apportionment modeling. Larger circles represent sites with DVs > 70 ppb.
Combining 2013-15 O3 DVs with Model Attribution (2/3)
11
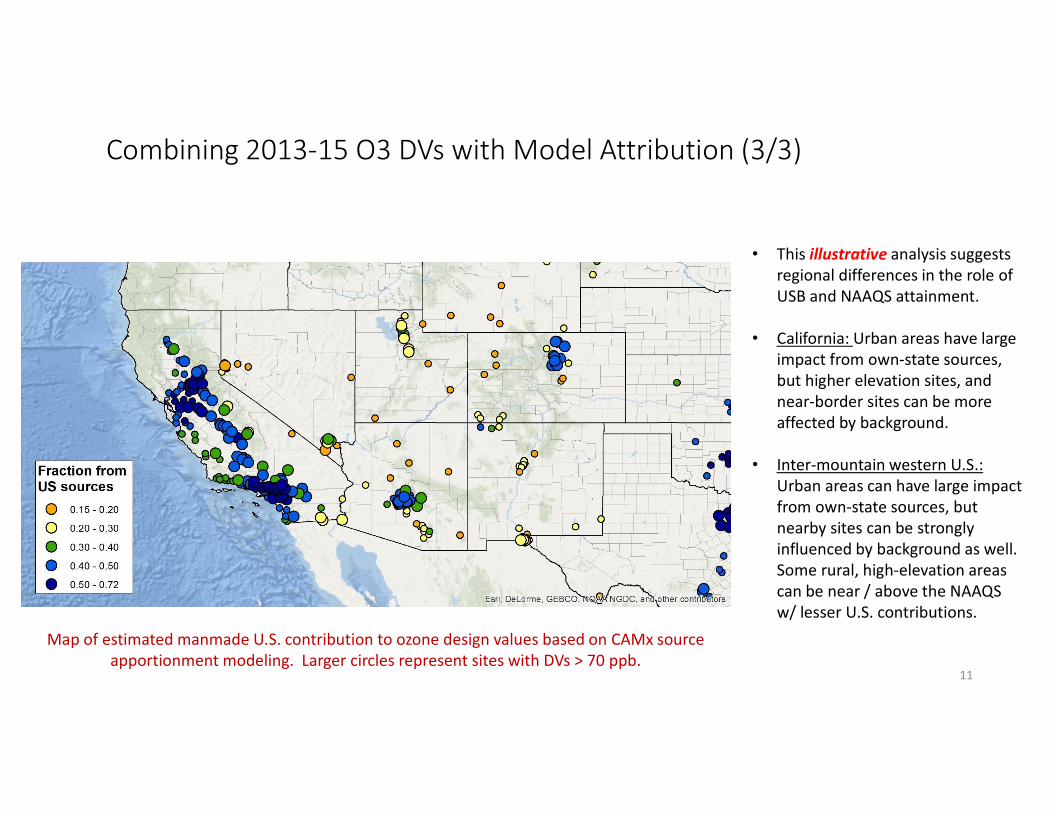
• This illustrative analysis suggests regional differences in the role of USB and NAAQS attainment.• California: Urban areas have large impact from own-state sources, but higher elevation sites, and near-border sites can be more affected by background.• Inter-mountain western U.S.: Urban areas can have large impact from own-state sources, but nearby sites can be strongly influenced by background as well. Some rural, high-elevation areas can be near / above the NAAQS w/ lesser U.S. contributions.
Map of estimated manmade U.S. contribution to ozone design values based on CAMx source apportionment modeling. Larger circles represent sites with DVs > 70 ppb.
Combining 2013-15 O3 DVs with Model Attribution (3/3)
Policy overview of BGO3: Applicable CAA provisions (1/2)• There are several potential policy tools that could be applied to areas experiencing background-influenced violations of the O3 NAAQS. The tool(s) that would apply in each affected location will depend on the specific nature of background O3 in each area. • Section 319 of the CAA allows data that would otherwise indicate an exceedance of the O3 NAAQS to be excluded in the calculations of whether a monitor is violating NAAQS.
o By excluding one or more daily exceedances, the regulatory design value (3-year average of annual 4thhighest daily maximum 8-hour average ozone) can drop below the NAAQS even though actual measured air quality is above the standard. This would allow the Administrator to designate an area as “attainment” rather than “nonattainment”.
o For such data to be excluded, states must demonstrate the data meet the CAA and EPA regulatory criteria for an “exceptional event”.o Ozone formed from wildfire emissions or transported by stratospheric intrusion are generally eligible to be considered as exceptional events. Other USB sources, including meteorological events that bring routine manmade ozone and/or ozone-producing emissions from foreign counties into the U.S., are not considered “exceptional events” under EPA’s interpretation of the CAA.
12
Policy overview of BGO3: Applicable CAA provisions (2/2)• Other provisions of the CAA may provide relief from some of the CAA-prescribed nonattainment area requirements during the designation process, but will not avoid a nonattainment designation that might be impacted by USB:
o Small nonattainment area boundaries for sites minimally impacted by nearby sources (Sec 107(d)). See EPA guidance from February 2016 (“nearby area that is contributing”).o Rural transport areas (Sec 182(h)). See EPA guidance from February 2016 which identifies a multifactor weight of evidence test for determining if the area makes a significant contribution to itself.
• A separate provision of the CAA may provide relief from some of the CAA-prescribed nonattainment area requirements during the attainment determination process, but will also not avoid a nonattainment designation that might be impacted by USB:o Section 179B allows areas to demonstrate that attainment would have been reached (either in the SIP or in the monitoring data at the attainment date) “but for” the impacts of international emissions.
13

Summary
14
• EPA recognizes that, periodically, sources other than domestic manmade emissions of ozone precursors can contribute appreciably to monitored ozone (O3) concentrations.• These “background ozone” contributions may in limited instances have implications for implementation and eventual attainment of the new O3 standard, although there is no indication that background O3 alone will prevent attainment of the new standard.• As part of outreach efforts with stakeholders regarding BGO3 issues in the NAAQS implementation process, EPA has developed a “white paper” on background ozone, held workshops to further discuss the issue with States and other interested parties, and opened a non-regulatory docket to allow additional comments on BGO3 and O3 NAAQS implementation.
o White paper: https://www.epa.gov/sites/production/files/2016-03/documents/whitepaper-bgo3-final.pdfo Workshop summaries: https://www.epa.gov/sites/production/files/2016-03/documents/bgo3-high-level-summary.pdf