baird global industrial conference
TRANSCRIPT
Visteon Baird Global Industrial Conference
November 2017
Sachin LawandePresident and CEO

Forward-looking Information
• This presentation contains "forward-looking statements" within the meaning of the Private Securities Litigation Reform Act of 1995. Forward-looking statements are not guarantees of future results and conditions but rather are subject to various factors, risks and uncertainties that could cause our actual results to differ materially from those expressed in these forward-looking statements, including, but not limited to:
• conditions within the automotive industry, including (i) the automotive vehicle production volumes and schedules of our customers, (ii) the financial condition of our customers and the effects of any restructuring or reorganization plans that may be undertaken by our customers, including work stoppages at our customers, and (iii) possible disruptions in the supply of commodities to us or our customers due to financial distress, work stoppages, natural disasters or civil unrest;
• our ability to execute on our transformational plans and cost-reduction initiatives in the amounts and on the timing contemplated;
• our ability to satisfy future capital and liquidity requirements; including our ability to access the credit and capital markets at the times and in the amounts needed and on terms acceptable to us; our ability to comply with financial and other covenants in our credit agreements; and the continuation of acceptable supplier payment terms;
• our ability to satisfy pension and other post-employment benefit obligations;
• our ability to access funds generated by foreign subsidiaries and joint ventures on a timely and cost effective basis;
• general economic conditions, including changes in interest rates and fuel prices; the timing and expenses related to internalrestructurings, employee reductions, acquisitions or dispositions and the effect of pension and other post-employment benefit obligations;
• increases in raw material and energy costs and our ability to offset or recover these costs, increases in our warranty, product liability and recall costs or the outcome of legal or regulatory proceedings to which we are or may become a party; and
• those factors identified in our filings with the SEC (including our Annual Report on Form 10-K for the fiscal year ended December 31, 2016).
• Caution should be taken not to place undue reliance on our forward-looking statements, which represent our view only as of the date of this presentation, and which we assume no obligation to update. New business wins, re-wins and backlog do not represent firm orders or firm commitments from customers, but are based on various assumptions, including the timing and duration of product launches, vehicle productions levels, customer price reductions and currency exchange rates.
2

Visteon Today and Shareholder Value Creation
3
A global leader in automotive cockpit electronics and software
(1) Peer group includes average returns of Autoliv, Continental, Delphi and Gentex.
Manufacturing locations22
10,000 Employees
18 Countries
Technical centers18
$3.1B Annual sales (Electronics)
Company headquartersVan Buren Township,
Michigan, United StatesDecember
2013May
2015
July
2016
October
2017
Visteon
160%
S&P 500
51%
Peer
Group (1)
47%
Long-Term Total Shareholder Return (12/31/13 – 10/30/17)

A Broad and Diversified Customer Base
4
Global automotive technology company with more than 25 customers worldwide

Industry-Leading Cockpit Electronics Product Portfolio
Only pure-play in automotive cockpit electronics
Source: Rankings from 2016 ABI Research and IHS Markit.
5
Instrument
clusters
Head-up
displays
Displays InfotainmentAudio ConnectivityCockpit domain
controllers
Visteon Market Position
Top 5 Connected car
Tier 1 supplier
#2Rank
Instrument cluster displays
#3Rank
Head-up displays
#2Rank
Automotive display systems
Center stack displays
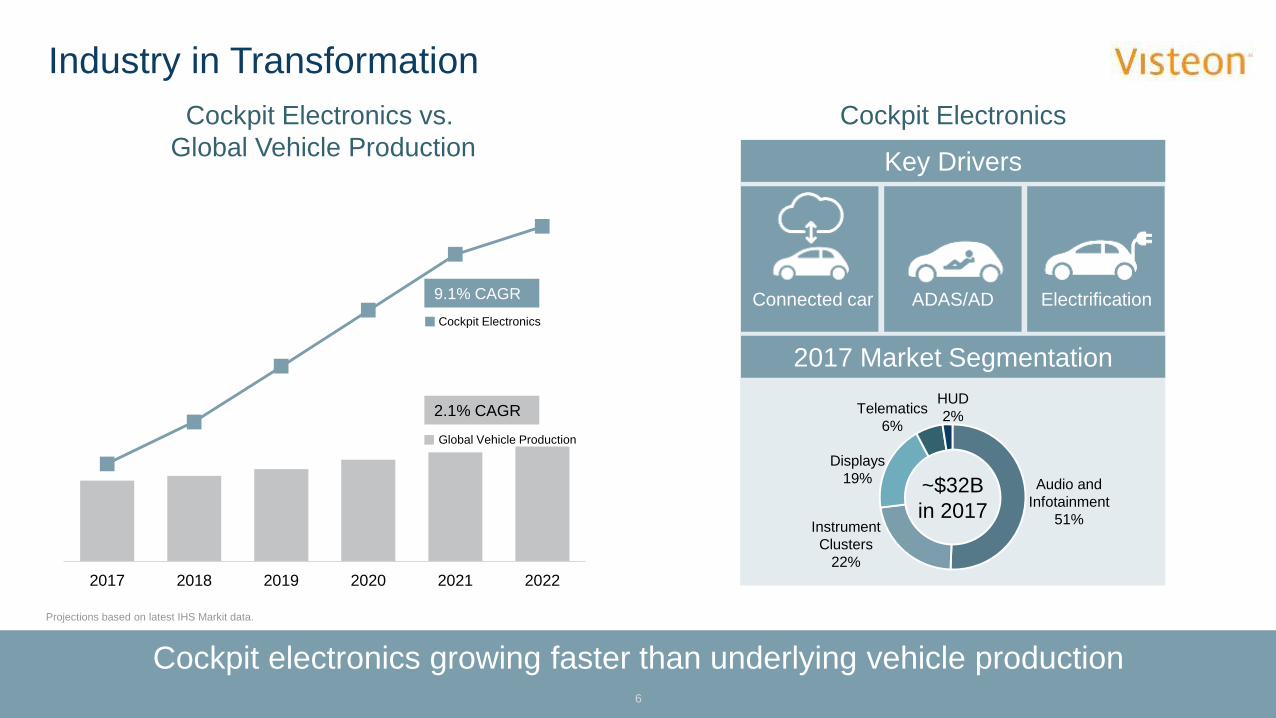
Industry in Transformation
6
Cockpit electronics growing faster than underlying vehicle production
2017 2018 2019 2020 2021 2022
Cockpit Electronics vs.
Global Vehicle Production
Cockpit Electronics
Global Vehicle Production
9.1% CAGR
2.1% CAGR
Projections based on latest IHS Markit data.
~$32B
in 2017Instrument
Clusters
22%
Audio and
Infotainment
51%
Displays
19%
HUD
2%Telematics
6%
2017 Market Segmentation
Connected car ADAS/AD Electrification
Key Drivers
Cockpit Electronics

Key Trends in Instrument Clusters
Visteon leading industry transition toward digital clusters7
40%
21%
56%
66%
4%13%
2017 2022
CAGR
20222017
27%
6%
-10%
Hybrid
Analog
All
Digital
95.1M
Units
105.7M
Units
• All-digital is fastest-growing segment of clusters
• All-digital clusters expanding from luxury to mass market vehicles
• Visteon awarded $2.6 billion in YTD new business wins
• Improved global market share to #2 position from #3 in 2015
All-Digital Cluster
Hybrid Cluster
Analog Cluster

Key Trends in Audio/Infotainment
Display Audio and Embedded Infotainment offer significant growth opportunity for Visteon8
55%
30%
15%
35%
30%35%
20222017
5%
22%
-10%
95.1M
Units
Display
Audio
Audio
Embedded
Infotainment
105.7M
Units
• Market trending toward Display Audio systems from traditional audio
• Visteon’s capabilities in Display Audio strengthened by AllGo acquisition
• Embedded infotainment transforming into “mobile app platform”
• Visteon awarded $1.5 billion in YTD new business wins; including first Phoenix™ win
Embedded
Infotainment
Display Audio
AM/FM/BT
Audio
CAGR

Visteon’s Infotainment Platform for Connected Car
Seamless upgrade path from Display Audio to Embedded Infotainment9
App developer
friendly
Highly
secure
Fully
upgradeable
Automotive Base Components
Cyber
Security
Web
Runtime
Projection
Mode
Common API and JavaScript
Navi
Engine
Complete “out-of-the-box”
solution to OEMs for Display Audio
Extend with pre-integrated third-party
software to mid/high infotainment
Offers “write once, run on many” for
infotainment apps
First purpose-built infotainment
OS and tools

ECU Consolidation in Automotive Electronics
Visteon offers industry-first cockpit domain controller; will launch AD controller
Today Tomorrow
Reduces cost, weight, and power consumption
ECUs in car
30 - 100+ Consolidation of ECUs into domain controllers
Leverages silicon and software innovations
10

Visteon’s Cockpit Domain Controller
Market introduction of first SmartCore™ system in early 2018 with European OEM
Cluster HUD Infotainment
SmartCore™
Cockpit Domain Controller
*Source: Roland Berger study, July 2015.
4 SmartCore™ business wins to date
$175 Expected per vehicle savings*
Integration of instrument cluster, infotainment, HUD
and driver monitoring
11
First cockpit domain controller in the industry
1 awar
Recognized with Innovation Award by
German Center of Automotive Management

Key Trends in Autonomous Driving
PerceptionSensors ActuationPath Planning
HD maps, real-time middleware for algorithms
Scalable high performance compute system
Vehicle Integration
CNN algorithms RL algorithms
Radar 24GHz to 76-81GHz
2-D to 3-D
Technology Landscape Autonomous Driving Controller
ProcessorsCPU to GPU
Emerging AI processors
LidarMechanical to solid state
Higher resolution at <$250
SoftwareConventional to machine learning
High safety relevance (ASIL)
Neural network
object detection
Reinforcement
learning
Camera, Radar,
Lidar, Ultrasonic
CAN, Ethernet
12
Centralized processing of sensor data
Key Requirements of Autonomous Driving Controller
Scalable and CPU agnostic hardware
High-performance middleware Advanced software tools for algorithm development
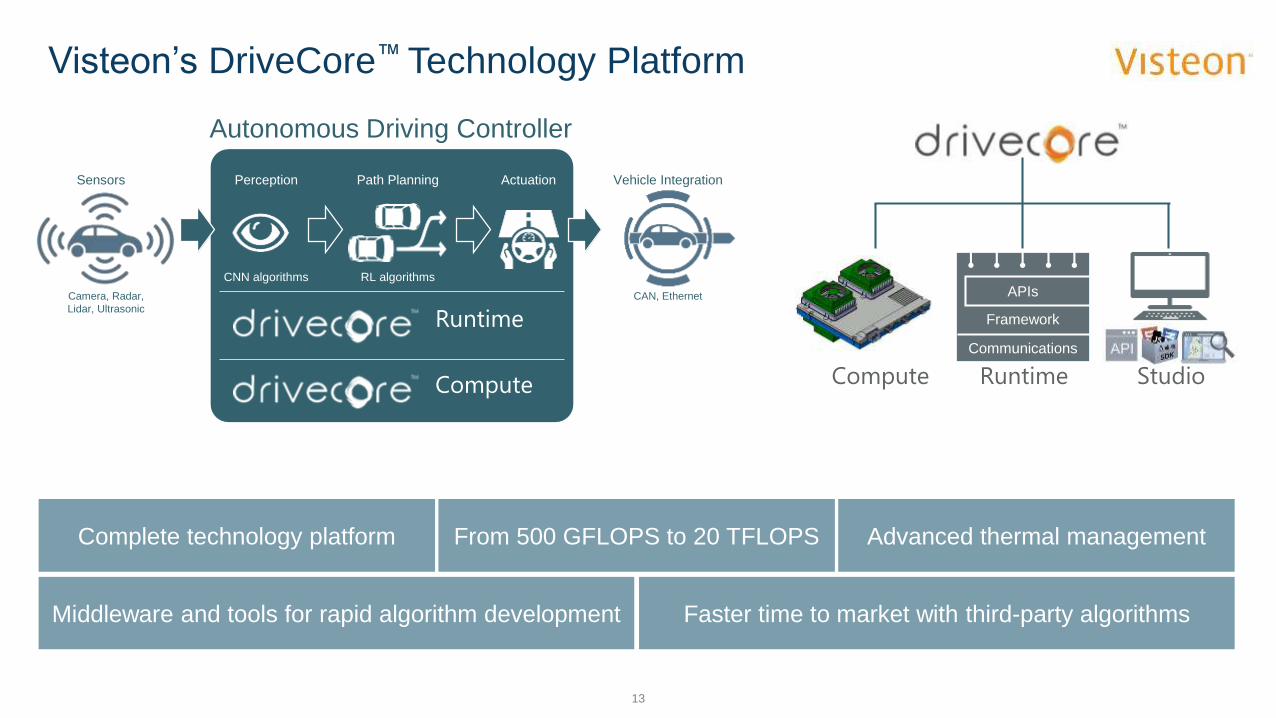
Visteon’s DriveCore™ Technology Platform
StudioRuntimeCompute
Communications
Framework
APIs
13
Complete technology platform
Middleware and tools for rapid algorithm development Faster time to market with third-party algorithms
From 500 GFLOPS to 20 TFLOPS Advanced thermal management
PerceptionSensors ActuationPath Planning Vehicle Integration
CNN algorithms RL algorithms
Autonomous Driving Controller
Camera, Radar,
Lidar, Ultrasonic
CAN, Ethernet
Runtime
Compute

Continuing Momentum Toward Best-In-Class Profitability
14
(Dollars in Millions)
$84
$60
$67
$83
$94
$79
$75
$98$101
$84 $83
Q1 Q2 Q3 Q4
2015 Actual 2016 Actual 2017 Actual
12.5%11.9%10.8% 10.4%7.7% 8.7% 10.0% 10.7% 12.2%
FY 2015Actual
FY 2016Actual
FY 2017Guidance
FY 2021Target
Adjusted EBITDA increased Y/Y every quarter
for 11 straight quarters…
…guiding to long-term margins reaching
14% while investing in new technologies.
Annual Adjusted EBITDA MarginsQuarterly Adjusted EBITDA and Margins
10.9%
9.5%
11.1% ~11.5%
14.0%
10.8%
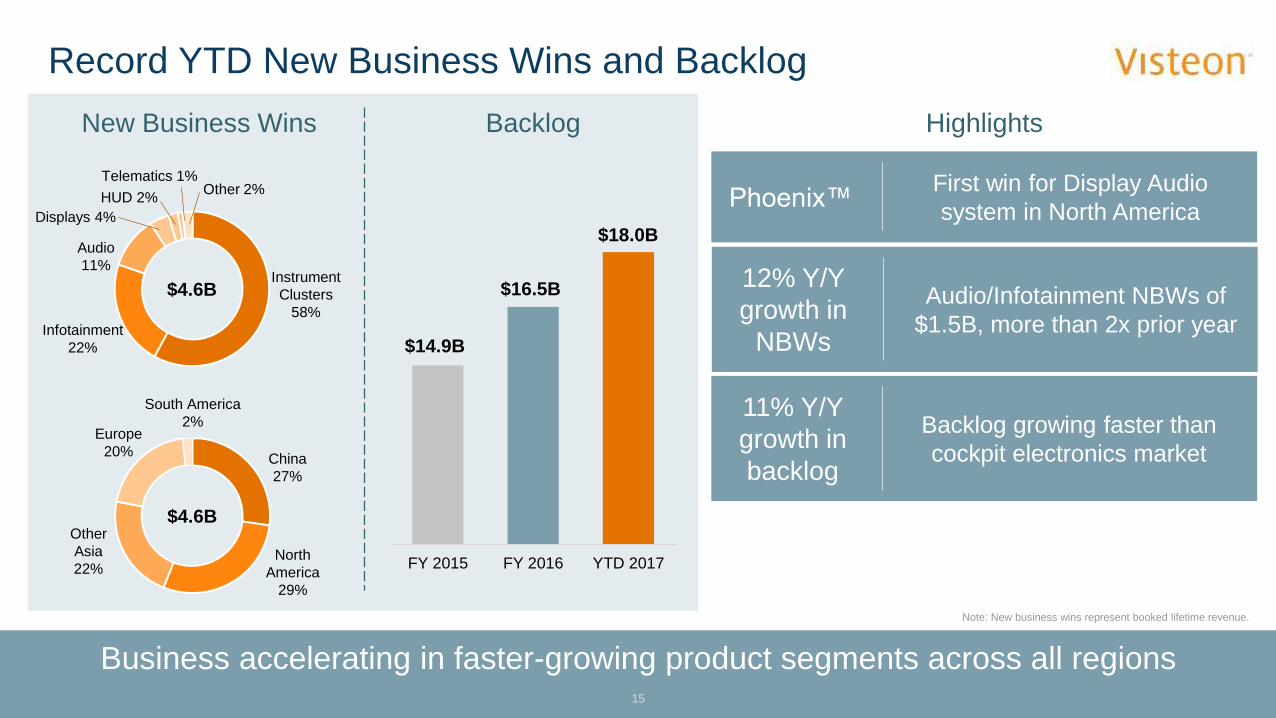
Record YTD New Business Wins and Backlog
15
Business accelerating in faster-growing product segments across all regions
$18.0B
BacklogNew Business Wins
Note: New business wins represent booked lifetime revenue.
FY 2015 FY 2016 YTD 2017
$16.5B
$14.9B
$4.6BInstrument
Clusters
58%
Infotainment
22%
Audio
11%
Displays 4%
HUD 2%
Telematics 1%Other 2%
$4.6B
Europe
20%China
27%
Other
Asia
22%North
America
29%
South America
2%
Highlights
Phoenix™First win for Display Audio
system in North America
Backlog growing faster than
cockpit electronics market
11% Y/Y
growth in
backlog
Audio/Infotainment NBWs of
$1.5B, more than 2x prior year
12% Y/Y
growth in
NBWs

2017 Strategic Imperatives
16
Strengthen Core
Business
Develop Level 3/4
Autonomous Driving Platform
Accelerate China
Business
• Deliver higher sales and improve margins to ~11.5%
• Drive new business wins to achieve combined ~$12 billion target for 2017/2018
• Continued focus on operational excellence
• Achieve double-digit China sales growth in 2017
• Introduce SmartCoreTM and PhoenixTM technologies in China
• Leverage joint venture relationships to drive adoption of new offerings
• Leverage SmartCoreTM
technology platform for sensor fusion
• Early engagement with selected customers
• Launch technology platform at CES 2018

AppendixBaird Global Industrial Conference

Use of Non-GAAP Financial Information
• Because not all companies use identical calculations, adjusted EBITDA, free cash flow and adjusted free cash flow used throughout this presentation may not be comparable to other similarly titled measures of other companies.
• In order to provide the forward-looking non-GAAP financial measures for full-year 2016 and 2017, the Company is providing reconciliations to the most directly comparable GAAP financial measures on the subsequent slides. The provision of these comparable GAAP financial measures is not intended to indicate that the Company is explicitly or implicitly providing projections on those GAAP financial measures, and actual results for such measures are likely to vary from those presented. The reconciliations include all information reasonably available to the Company at the date of this presentation and the adjustments that management can reasonably predict.
18

Full-Year 2017 Guidance
19
(Electronics Product Group)
FY 2016
Actual
Updated
FY 2017
Guidance
Sales $3.107B $3.12 - $3.16B
Adjusted EBITDA$346M
11.1%
$360 - $370M
~11.5%
Adjusted Free Cash Flow $167M $170 - $180M
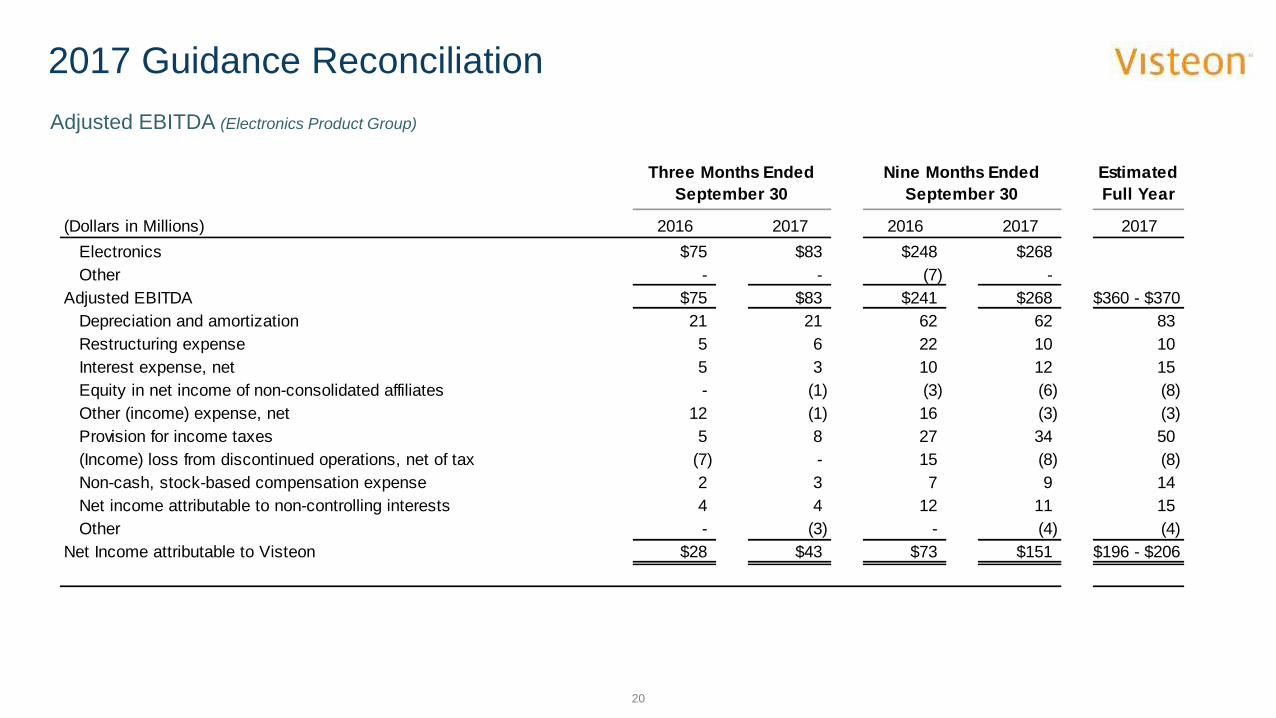
2017 Guidance Reconciliation
Adjusted EBITDA (Electronics Product Group)
20
Three Months Ended
September 30
Nine Months Ended
September 30
Estimated
Full Year
(Dollars in Millions) 2016 2017 2016 2017 2017
Electronics $75 $83 $248 $268
Other - - (7) -
Adjusted EBITDA $75 $83 $241 $268 $360 - $370
Depreciation and amortization 21 21 62 62 83
Restructuring expense 5 6 22 10 10
Interest expense, net 5 3 10 12 15
Equity in net income of non-consolidated affiliates - (1) (3) (6) (8)
Other (income) expense, net 12 (1) 16 (3) (3)
Provision for income taxes 5 8 27 34 50
(Income) loss from discontinued operations, net of tax (7) - 15 (8) (8)
Non-cash, stock-based compensation expense 2 3 7 9 14
Net income attributable to non-controlling interests 4 4 12 11 15
Other - (3) - (4) (4)
Net Income attributable to Visteon $28 $43 $73 $151 $196 - $206

2017 Guidance Reconciliation (cont’d)
Free Cash Flow and Adjusted Free Cash Flow (Electronics Product Group)
21
(1)
(1) Excludes $82 million of legacy-related cash outflows.
(1)
2016 2017 FY Guidance
(Dollars in Millions) Q1 Q2 Q3 Q4 Full Year Q1 Q2 Q3 YTD Low-end High-end
Cash from (used by) operating activities
Total Visteon ($58) $72 $24 $82 $120 ($10) $96 $45 $131
Less: Discontinued operations and other operations (45) (20) (9) (4) (78) - - - -
Cash from (used by) operating activities (Electronics) ($13) $92 $33 $86 $198 ($10) $96 $45 $131 $215 $225
Capital expenditures, incl intangibles (Electronics)
Total Visteon $25 $12 $19 $19 $75 $32 $15 $22 $69
Less: Discontinued operations and other operations 1 - 1 (1) 1 - - - -
Capital expenditures, incl intangibles (Electronics) $24 $12 $18 $20 $74 $32 $15 $22 $69 $85 $85
Free cash flow (Electronics)
Cash from (used by) operating activities (Electronics) ($13) $92 $33 $86 $198 ($10) $96 $45 $131 $215 $225
Less: Capital expenditures, incl intangibles (Electronics) 24 12 18 20 74 32 15 22 69 85 85
Free cash flow (Electronics) ($37) $80 $15 $66 $124 ($42) $81 $23 $62 $130 $140
Exclude: Restructuring / transformation-related payments (Electronics) 15 7 8 13 43 12 6 10 28 40 40
Adjusted free cash flow (Electronics) ($22) $87 $23 $79 $167 ($30) $87 $33 $90 $170 $180
2017
