baml presentation.goldberg.may2016 final
TRANSCRIPT
Gary Goldberg, President and CEO
BAML Metals & Mining Conference
May 2016

Newmont Mining Corporation I BAML Metals & Mining Conference I slide 2 May 2016
Cautionary statement
Cautionary statement regarding forward looking statements:
This presentation contains “forward-looking statements” within the meaning of Section 27A of the Securities Act of 1933, as amended, and
Section 21E of the Securities Exchange Act of 1934, as amended, and are intended to be covered by the safe harbor provided for under
such sections. Such forward-looking statements may include, without limitation: (i) estimates of future consolidated and attributable
production and sales; (ii) estimates of future costs applicable to sales and All-in sustaining costs; (iii) estimates of future consolidated and
attributable capital expenditures; (iv) our efforts to continue delivering reduced costs and efficiency; (v) expectations regarding the
development, growth and exploration potential of the Company’s operations and projects; (vi) expectations regarding the repayment of
debt; (vii) expectations regarding future dividends; (viii) expectations regarding pending transactions; and (ix) expectations regarding future
financial performance and other outlook or guidance. Estimates or expectations of future events or results are based upon certain
assumptions, which may prove to be incorrect. Such assumptions, include, but are not limited to: (i) there being no significant change to
current geotechnical, metallurgical, hydrological and other physical conditions; (ii) permitting, development, operations and expansion of
the Company’s operations and projects being consistent with current expectations and mine plans, including without limitation receipt of
export approvals; (iii) political developments in any jurisdiction in which the Company operates being consistent with its current
expectations; (iv) certain exchange rate assumptions for the Australian dollar to the U.S. dollar, as well as other the exchange rates being
approximately consistent with current levels; (v) certain price assumptions for gold, copper and oil; (vi) prices for key supplies being
approximately consistent with current levels; (vii) the accuracy of our current mineral reserve and mineralized material estimates; (viii) the
acceptable outcome of negotiation of the amendment to the Contract of Work and/or resolution of export issues in Indonesia (ix) there
being no significant acquisitions or divestitures during the outlook period and; (x) other assumptions noted herein. Where the Company
expresses an expectation or belief as to future events or results, such expectation or belief is expressed in good faith and believed to have
a reasonable basis. However, such statements are subject to risks, uncertainties and other factors, which could cause actual results to
differ materially from future results expressed, projected or implied by the “forward-looking statements”. Such risks include, but are not
limited to, gold and other metals price volatility, currency fluctuations, increased production costs and variances in ore grade or recovery
rates from those assumed in mining plans, political and operational risks, community relations, conflict resolution and outcome of projects
or oppositions and governmental regulation and judicial outcomes. For a more detailed discussion of such risks and other factors, see the
Company’s 2015 Annual Report on Form 10-K, filed on or about February 17, 2016, with the Securities and Exchange Commission (the
“SEC”), as well as the Company’s other SEC filings. The Company does not undertake any obligation to release publicly revisions to any
“forward-looking statement,” including, without limitation, outlook, to reflect events or circumstances after the date of this presentation, or to
reflect the occurrence of unanticipated events, except as may be required under applicable securities laws. Investors should not assume
that any lack of update to a previously issued “forward-looking statement” constitutes a reaffirmation of that statement. Continued reliance
on “forward-looking statements” is at investors' own risk.
Newmont Mining Corporation I BAML Metals & Mining Conference I slide 3 May 2016
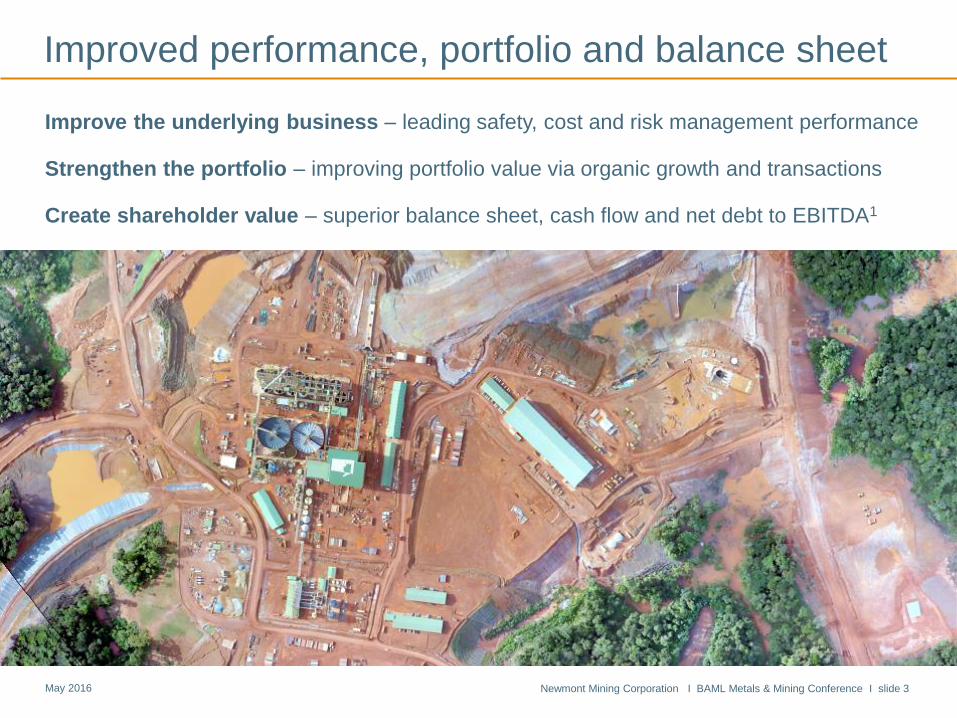
Improve the underlying business – leading safety, cost and risk management performance
Strengthen the portfolio – improving portfolio value via organic growth and transactions
Create shareholder value – superior balance sheet, cash flow and net debt to EBITDA1
Improved performance, portfolio and balance sheet
Merian
Newmont Mining Corporation I BAML Metals & Mining Conference I slide 4 May 2016
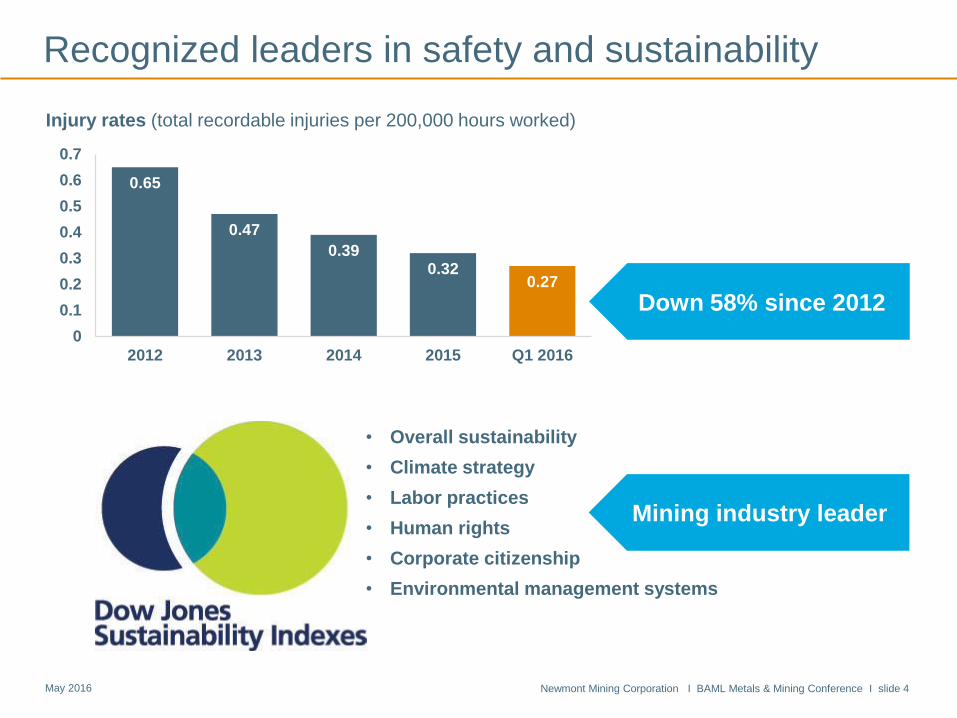
Recognized leaders in safety and sustainability
Injury rates (total recordable injuries per 200,000 hours worked)
Down 58% since 2012
0.65
0.47
0.39 0.32
0.27
0
0.1
0.2
0.3
0.4
0.5
0.6
0.7
2012 2013 2014 2015 Q1 2016
Mining industry leader
• Overall sustainability
• Climate strategy
• Labor practices
• Human rights
• Corporate citizenship
• Environmental management systems
Newmont Mining Corporation I BAML Metals & Mining Conference I slide 5 May 2016
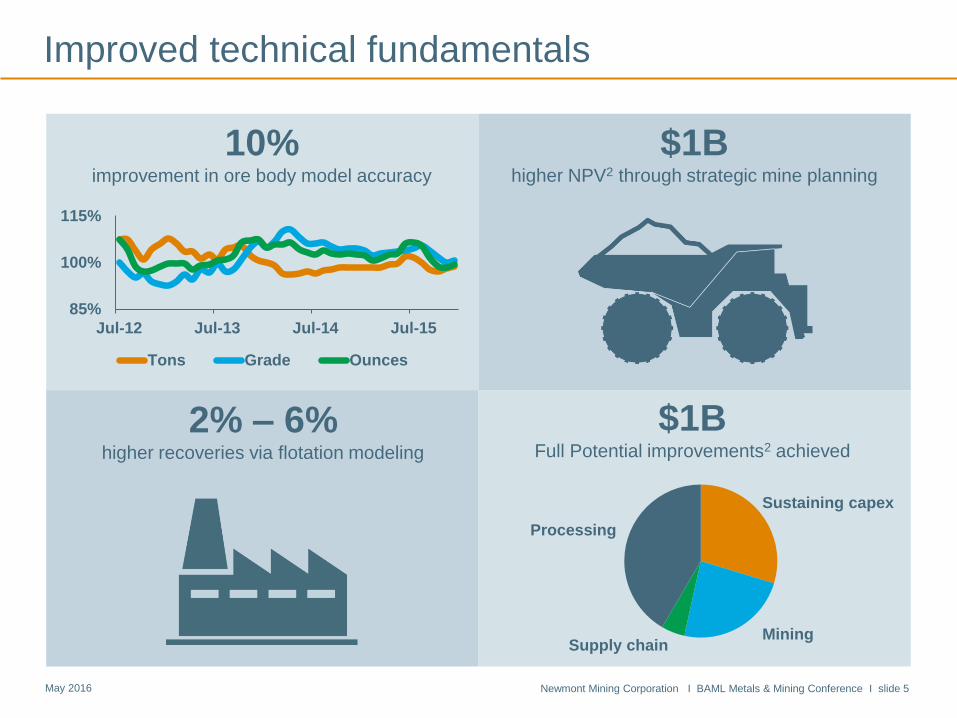
85%
100%
115%
Jul-12 Jul-13 Jul-14 Jul-15
Tons Grade Ounces
Improved technical fundamentals
$1B higher NPV2 through strategic mine planning
2% – 6% higher recoveries via flotation modeling
10% improvement in ore body model accuracy
$1B Full Potential improvements2 achieved
Sustaining capex
Mining Supply chain
Processing
Newmont Mining Corporation I BAML Metals & Mining Conference I slide 6 May 2016
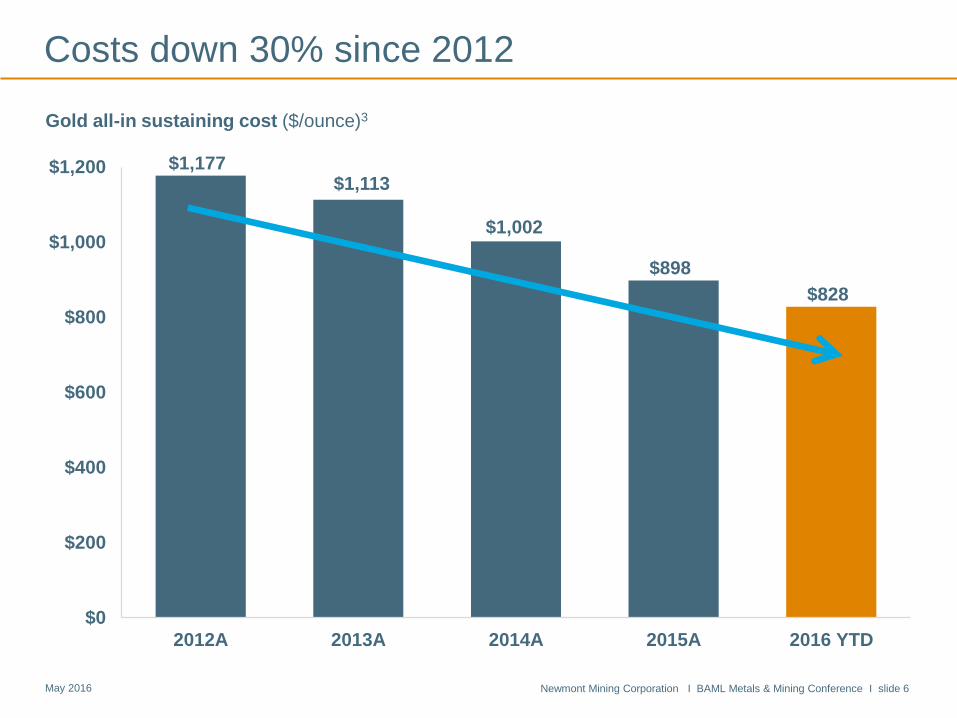
Costs down 30% since 2012
$1,177 $1,113
$1,002
$898
$828
$0
$200
$400
$600
$800
$1,000
$1,200
2012A 2013A 2014A 2015A 2016 YTD
Gold all-in sustaining cost ($/ounce)3
Down 30% since 2012
Newmont Mining Corporation I BAML Metals & Mining Conference I slide 7 May 2016
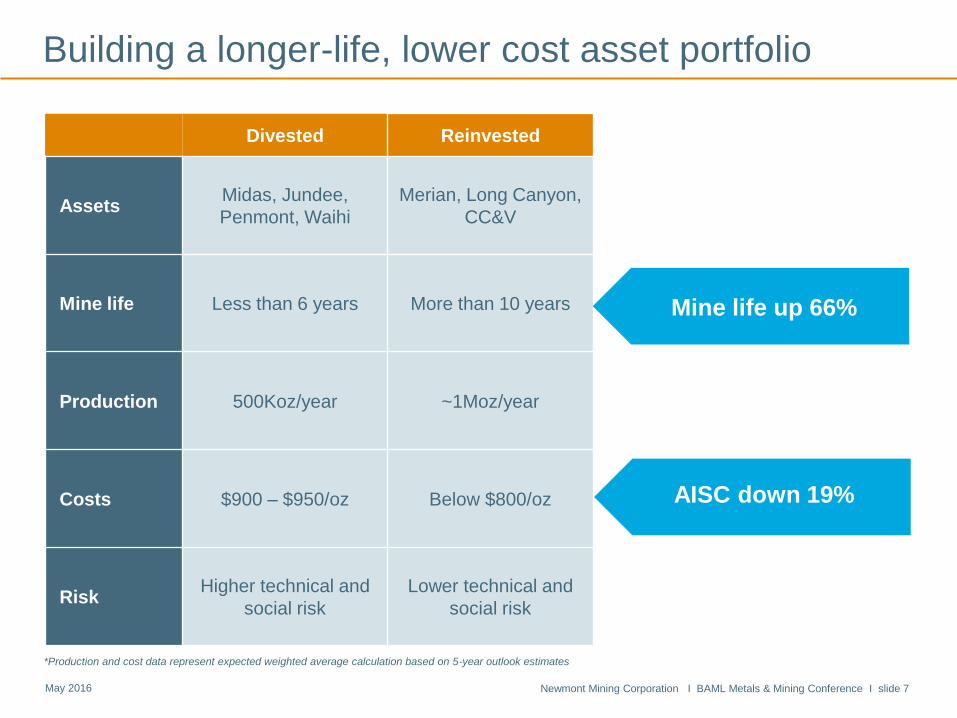
Building a longer-life, lower cost asset portfolio
Divested Reinvested
Assets Midas, Jundee,
Penmont, Waihi
Merian, Long Canyon,
CC&V
Mine life Less than 6 years More than 10 years
Production 500Koz/year ~1Moz/year
Costs $900 – $950/oz Below $800/oz
Risk Higher technical and
social risk
Lower technical and
social risk
AISC down 19%
Mine life up 66%
*Production and cost data represent expected weighted average calculation based on 5-year outlook estimates
Newmont Mining Corporation I BAML Metals & Mining Conference I slide 8 May 2016
0.5x
1.0x
1.5x
2.0x
2.5x
3.0x
Q2 Q3 Q4 Q1 Q2 Q3 Q4 Q1 Q2 Q3 Q4 Q1
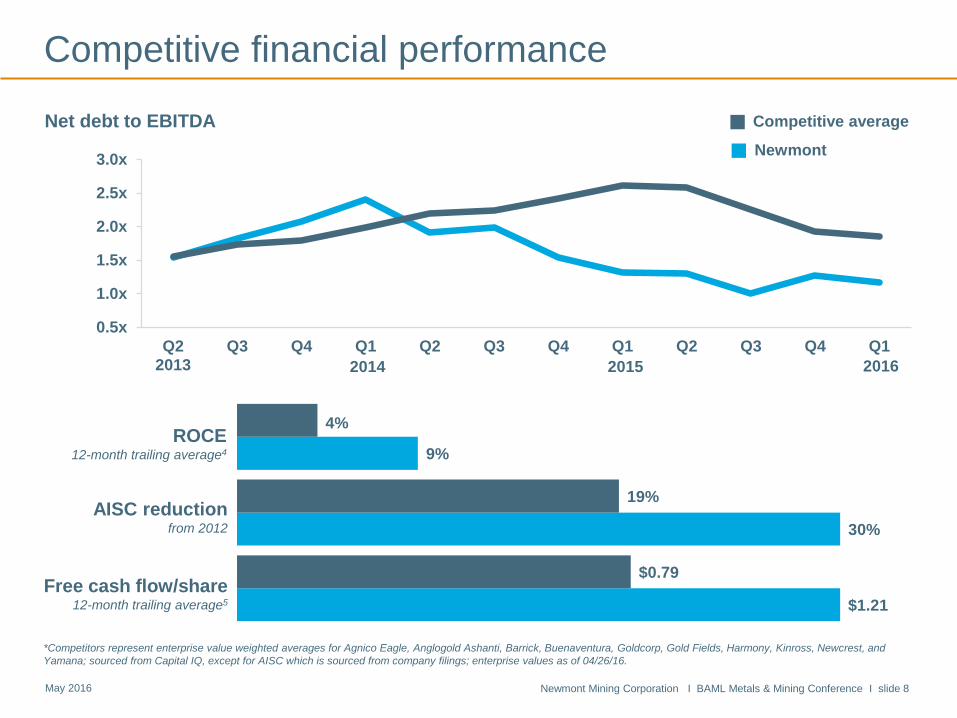
$1.21
30%
9%
$0.79
19%
4%
Competitive financial performance
*Competitors represent enterprise value weighted averages for Agnico Eagle, Anglogold Ashanti, Barrick, Buenaventura, Goldcorp, Gold Fields, Harmony, Kinross, Newcrest, and
Yamana; sourced from Capital IQ, except for AISC which is sourced from company filings; enterprise values as of 04/26/16.
AISC reduction from 2012
ROCE 12-month trailing average4
Free cash flow/share 12-month trailing average5
Competitive average
Newmont
Net debt to EBITDA
2013 2014 2015 2016
Newmont Mining Corporation I BAML Metals & Mining Conference I slide 9 May 2016
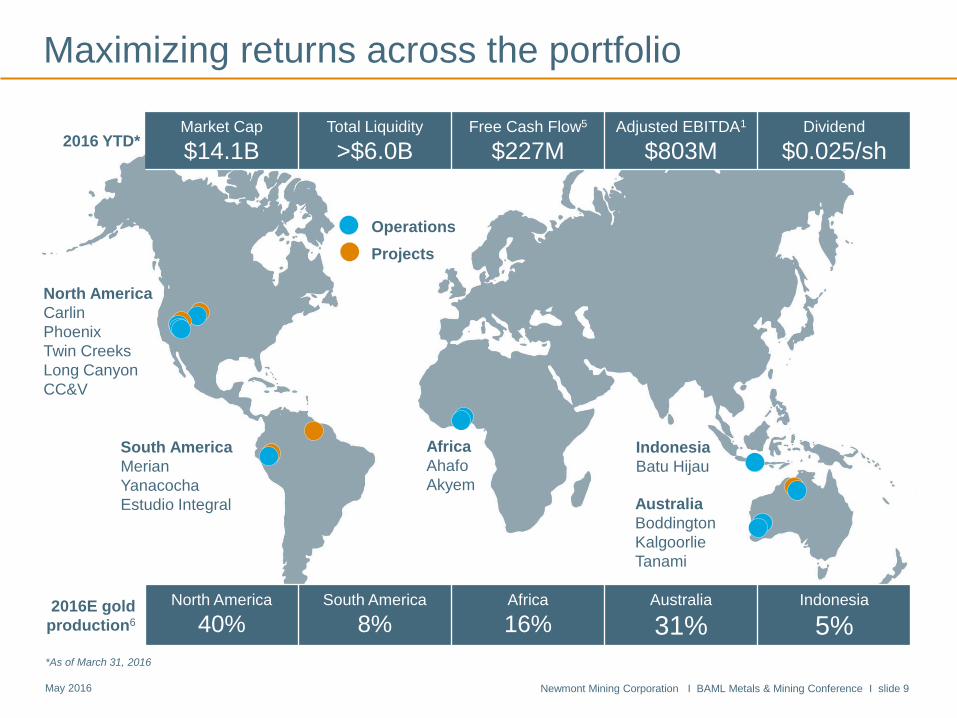
North America
Carlin
Phoenix
Twin Creeks
Long Canyon
CC&V
South America
Merian
Yanacocha
Estudio Integral
Africa
Ahafo
Akyem
Australia
Boddington
Kalgoorlie
Tanami
Operations
Projects
2016 YTD* Market Cap
$14.1B Total Liquidity
>$6.0B Free Cash Flow5
$227M Adjusted EBITDA1
$803M Dividend
$0.025/sh
*As of March 31, 2016
Maximizing returns across the portfolio
Indonesia
Batu Hijau
2016E gold
production6
North America
40% South America
8% Africa
16% Australia
31% Indonesia
5%

Newmont Mining Corporation I BAML Metals & Mining Conference I slide 10 May 2016
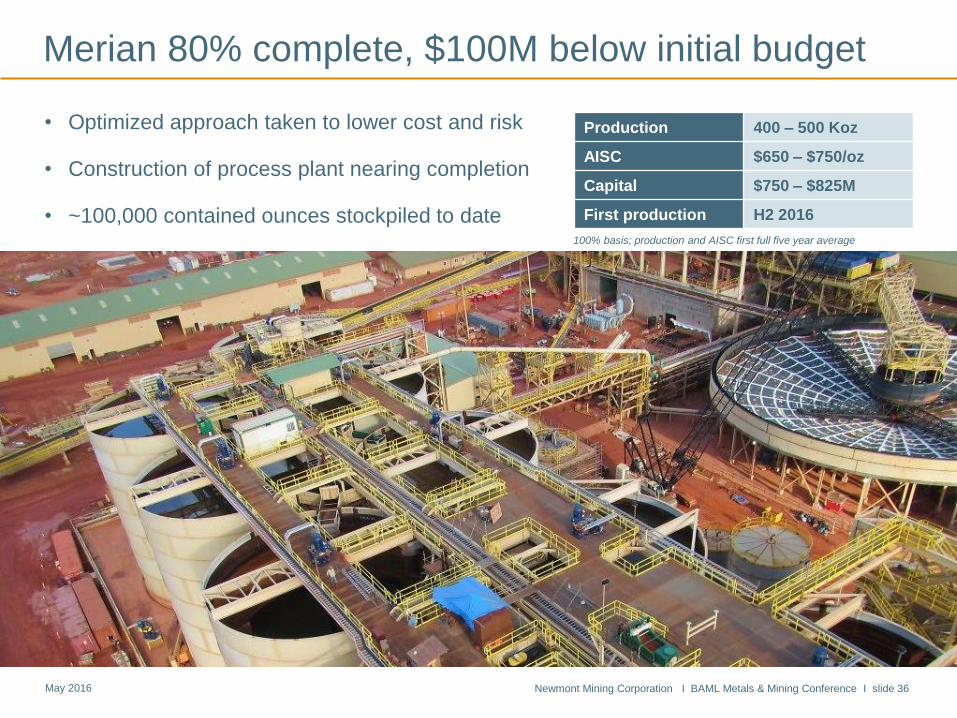
Merian 80% complete, $100M below initial budget
• Optimized approach taken to lower cost and risk
• Construction of process plant nearing completion
• ~100,000 contained ounces stockpiled to date
100% basis; production and AISC first full five year average
Production 400 – 500 Koz
AISC $650 – $750/oz
Capital $750 – $825M
First production H2 2016
Merian stockpile
Newmont Mining Corporation I BAML Metals & Mining Conference I slide 11 May 2016
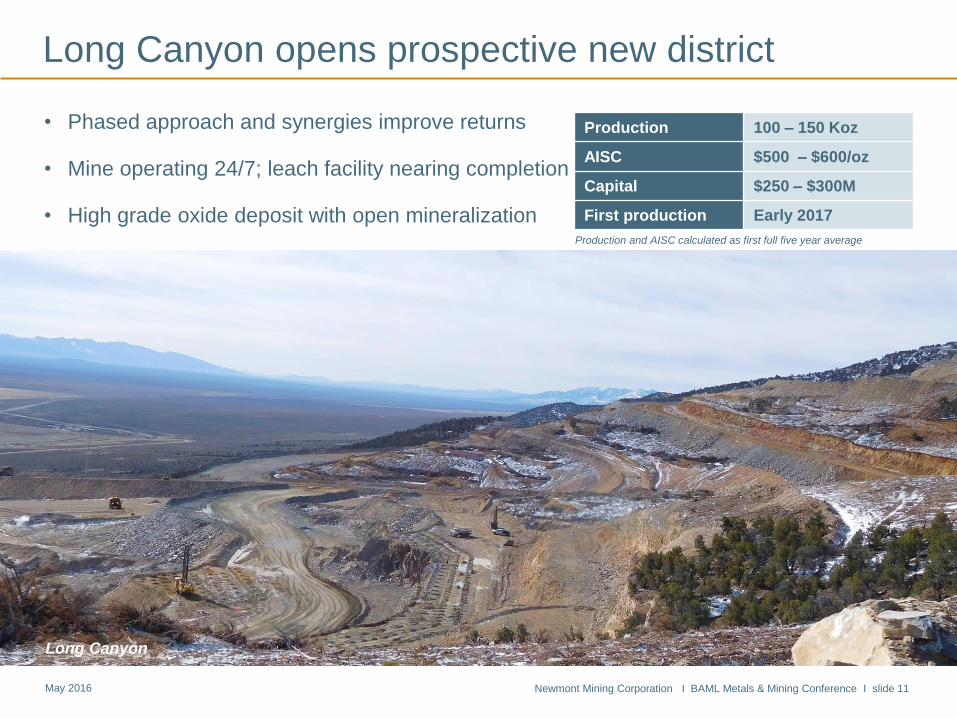
Long Canyon opens prospective new district
• Phased approach and synergies improve returns
• Mine operating 24/7; leach facility nearing completion
• High grade oxide deposit with open mineralization
Production 100 – 150 Koz
AISC $500 – $600/oz
Capital $250 – $300M
First production Early 2017
Production and AISC calculated as first full five year average
Long Canyon
Newmont Mining Corporation I BAML Metals & Mining Conference I slide 12 May 2016
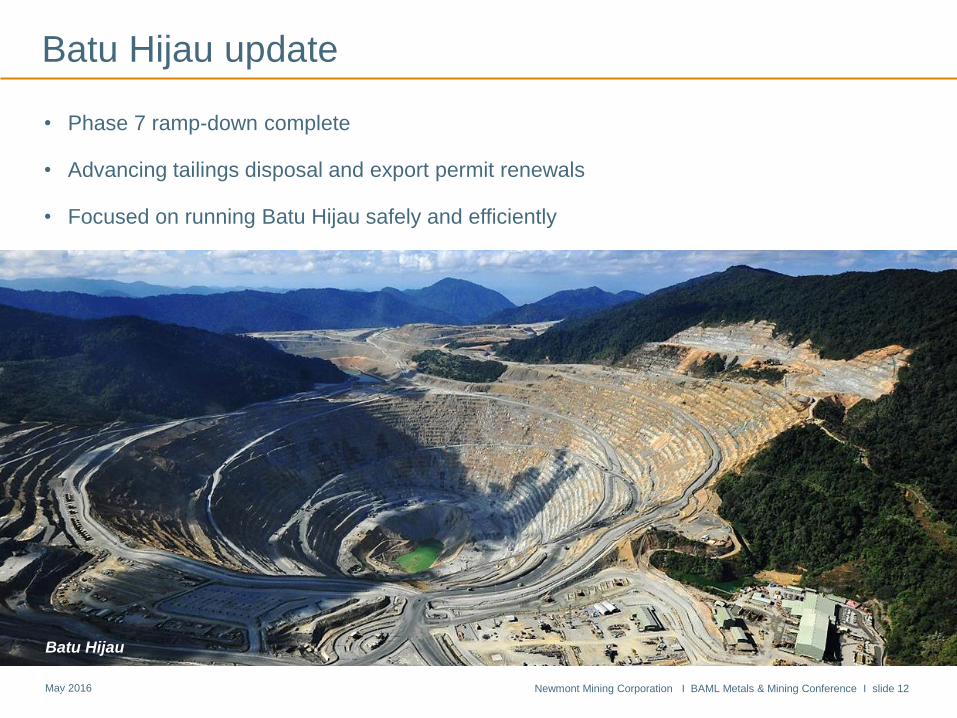
Batu Hijau update
• Phase 7 ramp-down complete
• Advancing tailings disposal and export permit renewals
• Focused on running Batu Hijau safely and efficiently
October 2015 Tab C – Slide 12
Batu Hijau

Newmont Mining Corporation I BAML Metals & Mining Conference I slide 13 May 2016
Project pipeline represents near term upside
Newmont Mining Corporation I BAML Metals & Mining Conference I slide 14 May 2016
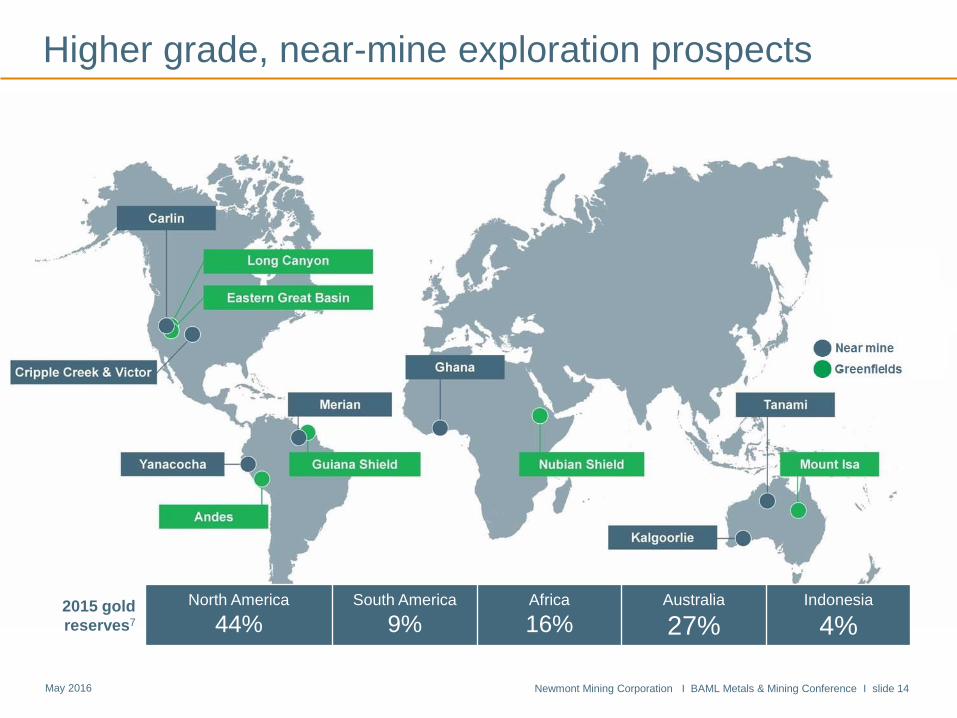
Higher grade, near-mine exploration prospects
2015 gold
reserves7
North America
44% South America
9% Africa
16% Australia
27% Indonesia
4%
Newmont Mining Corporation I BAML Metals & Mining Conference I slide 15 May 2016
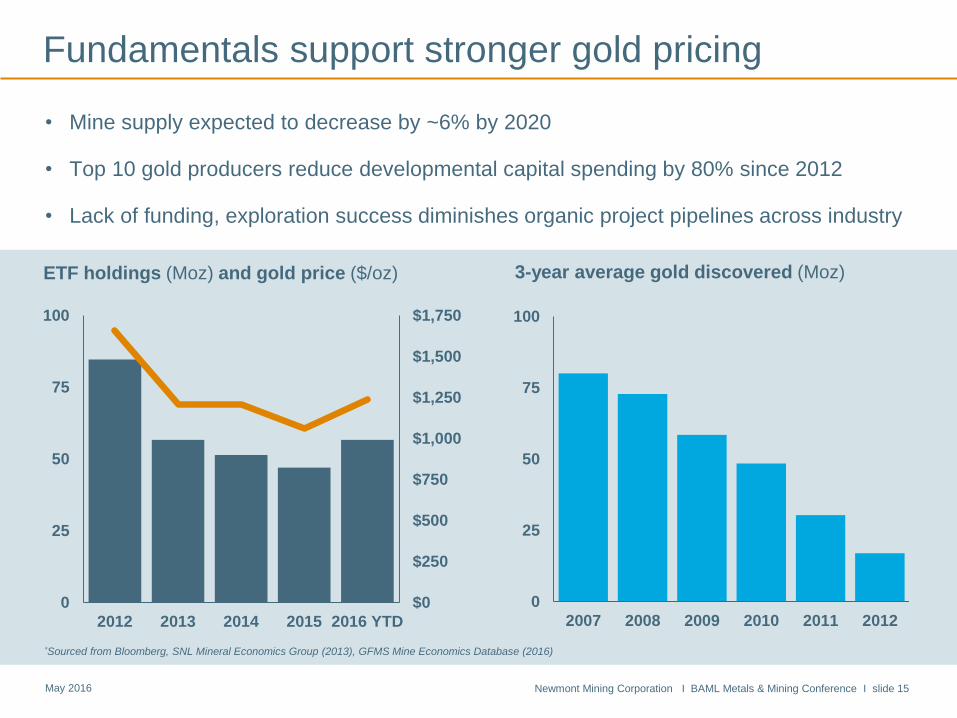
Fundamentals support stronger gold pricing
• Mine supply expected to decrease by ~6% by 2020
• Top 10 gold producers reduce developmental capital spending by 80% since 2012
• Lack of funding, exploration success diminishes organic project pipelines across industry
0
25
50
75
100
2007 2008 2009 2010 2011 2012
*Sourced from Bloomberg, SNL Mineral Economics Group (2013), GFMS Mine Economics Database (2016)
ETF holdings (Moz) and gold price ($/oz) 3-year average gold discovered (Moz)
$0
$250
$500
$750
$1,000
$1,250
$1,500
$1,750
0
25
50
75
100
2012 2013 2014 2015 2016 YTD
Newmont Mining Corporation I BAML Metals & Mining Conference I slide 16 May 2016
-
1.0
2.0
3.0
4.0
5.0
6.0
7.0
8.0
Sw
itzerla
nd
UA
E
Ho
ng
Ko
ng
Sau
di A
rab
ia
Tu
rkey
Th
aila
nd
Germ
an
y
Vie
tnam
Ch
ina
Ind
ia
Taiw
an
Eg
yp
t
US
A
Ru
ss
ia
UK
Italy
So
uth
Ko
rea
Ind
on
esia
Jap
an
Fra
nce
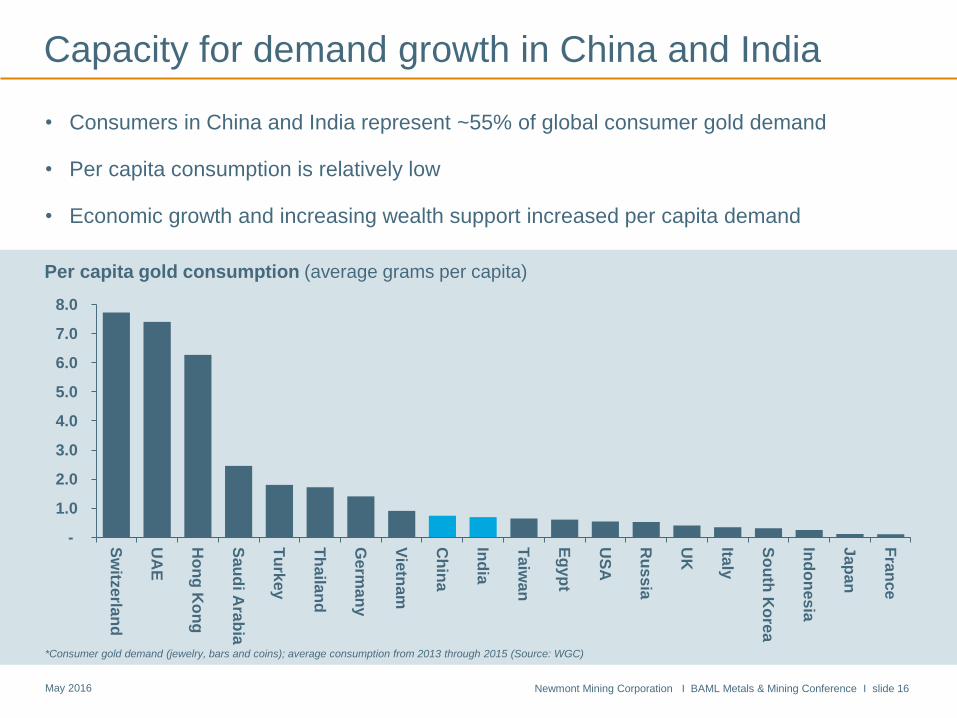
Capacity for demand growth in China and India
*Consumer gold demand (jewelry, bars and coins); average consumption from 2013 through 2015 (Source: WGC)
Per capita gold consumption (average grams per capita)
• Consumers in China and India represent ~55% of global consumer gold demand
• Per capita consumption is relatively low
• Economic growth and increasing wealth support increased per capita demand
Newmont Mining Corporation I BAML Metals & Mining Conference I slide 17 May 2016
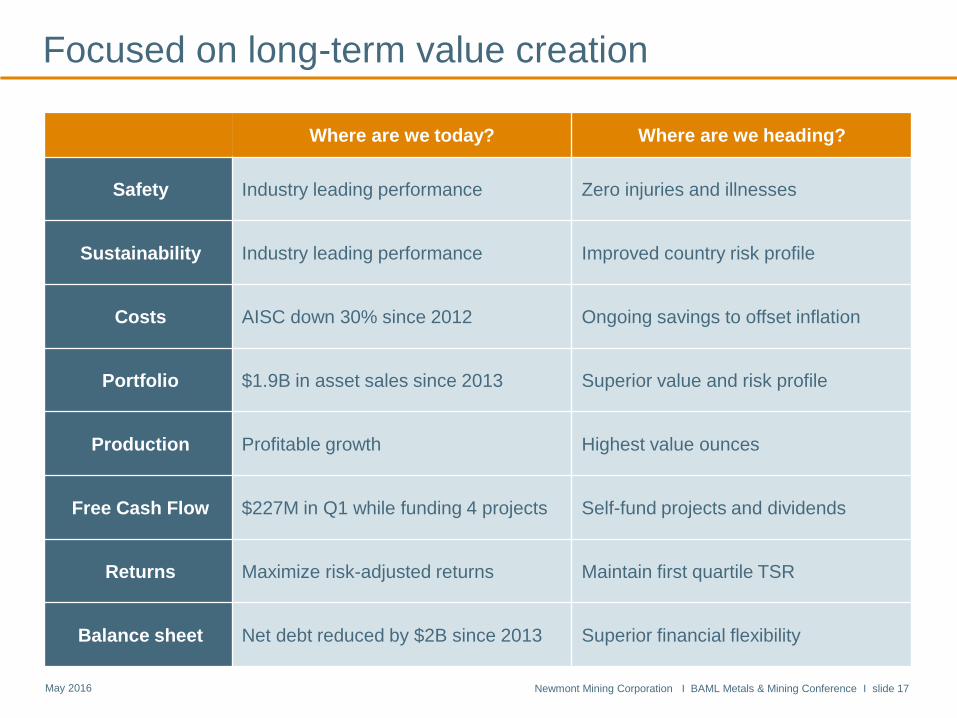
Focused on long-term value creation
Where are we today? Where are we heading?
Safety Industry leading performance Zero injuries and illnesses
Sustainability Industry leading performance Improved country risk profile
Costs AISC down 30% since 2012 Ongoing savings to offset inflation
Portfolio $1.9B in asset sales since 2013 Superior value and risk profile
Production Profitable growth Highest value ounces
Free Cash Flow $227M in Q1 while funding 4 projects Self-fund projects and dividends
Returns Maximize risk-adjusted returns Maintain first quartile TSR
Balance sheet Net debt reduced by $2B since 2013 Superior financial flexibility
Questions?

Newmont Mining Corporation I BAML Metals & Mining Conference I slide 19 May 2016
Alignment is critical to our success
201 6 Strategy Map
Purpose Our purpose is to create value and improve lives through sustainable and responsible mining
Strategy
• Secure the gold franchise – by running our existing business more efficiently and effectively
• Strengthen the portfolio – by building a longer - life, lower - cost asset portfolio
• Create shareholder value – through capabilities and systems that create competitive advantage
Elements Health & Safety Operational Excellence Growth People Sustainability &
External Relations
Strategic Objectives
• Culture of zero harm
• Industry - leading health and safety performance
• Culture of continuous improvement
• Cost improvements more than offset inflation
• Value - accretive growth
• Industry - leading return on capital employed (ROCE)
• Competitive advantage through people
• Industry - leading engagement, leadership and diversity
• Access to land, resources and approvals
• Reputation conveys competitive advantage
Drivers
• Safety leadership
• Fatality prevention
• Employee engagement
• Health and wellness
• Business Improvement
• Portfolio optimization
• Technical Foundations
• Improve portfolio value and risk profile through transactions, p rojects and e xploration
• Maintain first quartil e Total Shareholder Returns
• Employee Engagement
• Management Effectiveness
• Global Inclusion and Diversity
• Performance
• Risk management
• Reputation
2016 BP Objectives
• Eliminate fatalities by implementing Critical Controls and applying lessons learned from significant events
• Reduce health exposures by implementing Critical Controls for airborne agents
• Reduce TRIFR by 10%
• Achieve AISC per ounce of $880 to $940
• Achieve attributable gold production of 4.8 to 5.3 million ounces
• Deliver planned Full Potential cost and efficiency improvements, including BPO
• Deliver first production at Merian and CC&V expansion
• Progress Long Canyon Phase 1, Tanami Expansion and Estudio Integral on time and on budget
• Reach investment decisions on Ahafo Mill Ex pansion, Subika UG, NW Exodus and Batu Hijau Phase 7
• Achieve gold Reserves, Resource and Inventory targets
• Measurably improve global employee engagement based on 2016 survey results
• Progress inclusion and diverse representation to achieve 2016 – 2018 o bjectives
• Improve leadership and bench strength through targeted development
• Achieve 2016 public S&ER targets and develop Energy and Climate Change targets
• Implement Human Rights Rep orting and Assurance Initiative and c onduct security and human rights risk assessments at sites
• Implement Phase 1 of the Integrated Management System
• Develop and implement strategy for Artisanal Small - Scale Mining
Values Safety Integrity Sustainability Inclusion Responsibility
Newmont Mining Corporation I BAML Metals & Mining Conference I slide 20 May 2016
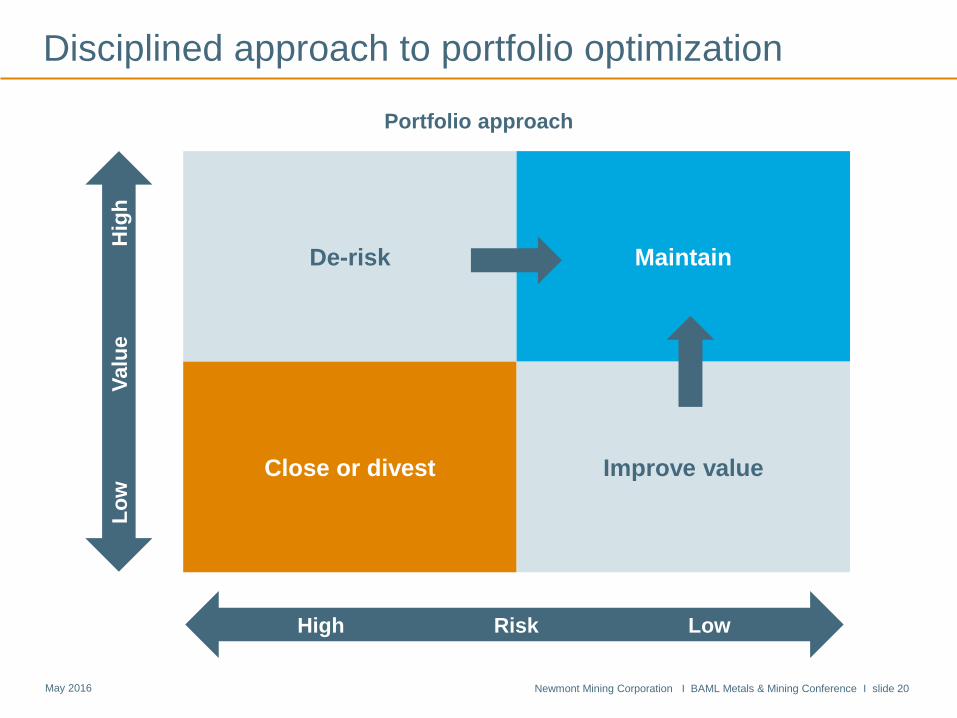
Disciplined approach to portfolio optimization
De-risk Maintain
Close or divest Improve value
Lo
w
V
alu
e
Hig
h
High Risk Low
Portfolio approach
Newmont Mining Corporation I BAML Metals & Mining Conference I slide 21 May 2016
$0
$500
$1,000
$1,500
$2,000
CanadianOil
Sands
Midas Paladin(5.4%)
Jundee Penmont(44%)
Merian(25%)
Valcambi Waihi Other Regis(19.45%)
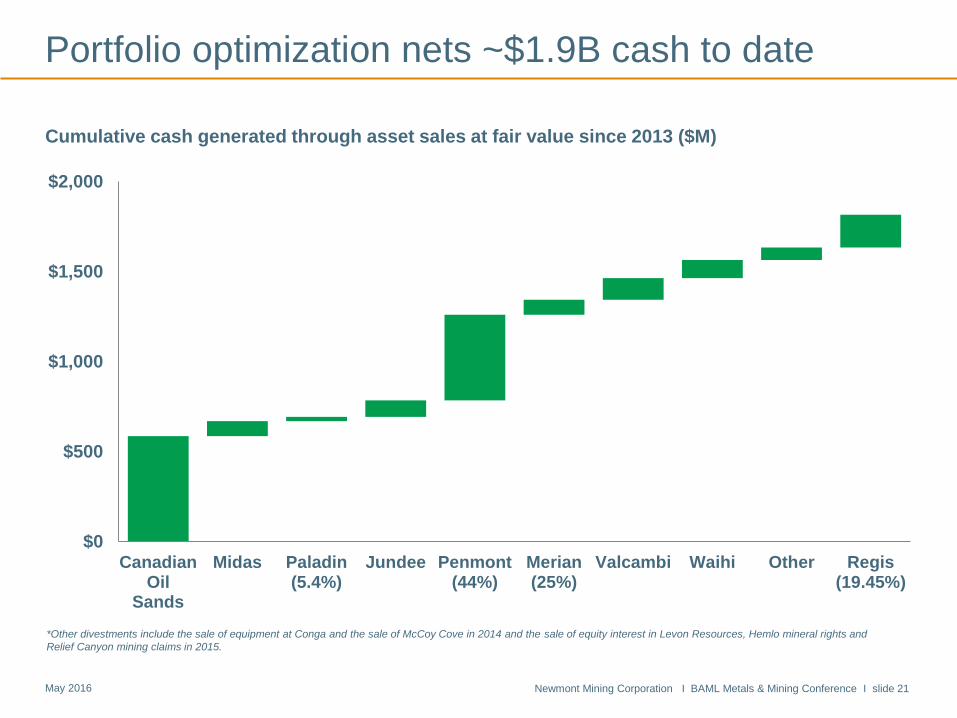
Portfolio optimization nets ~$1.9B cash to date
Cumulative cash generated through asset sales at fair value since 2013 ($M)
*Other divestments include the sale of equipment at Conga and the sale of McCoy Cove in 2014 and the sale of equity interest in Levon Resources, Hemlo mineral rights and
Relief Canyon mining claims in 2015.
Newmont Mining Corporation I BAML Metals & Mining Conference I slide 22 May 2016
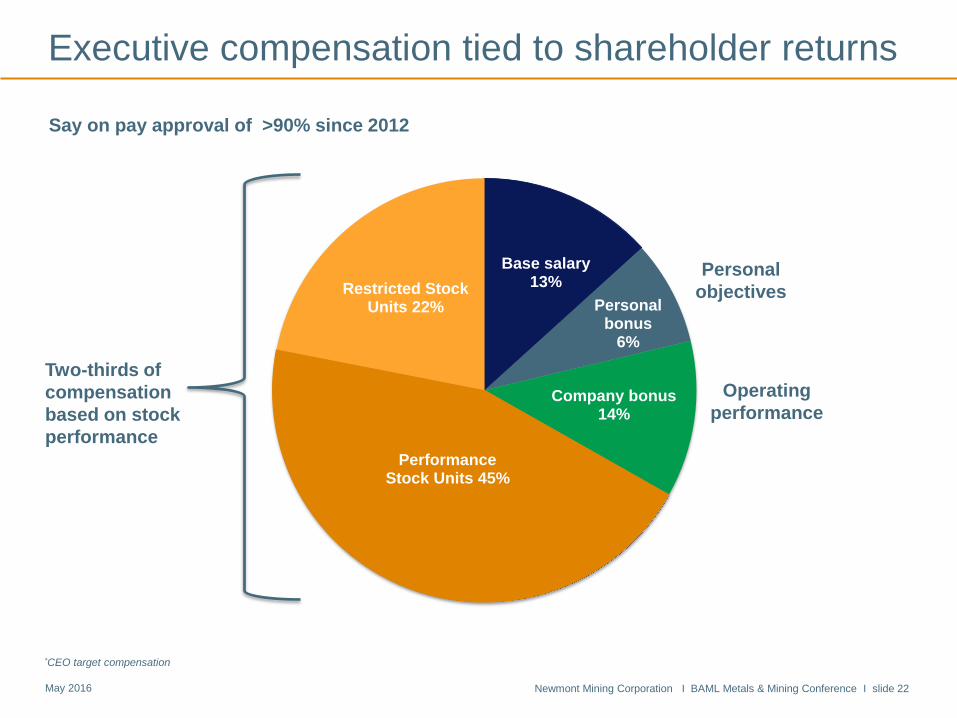
Base salary 13%
Personal bonus
6%
Company bonus 14%
Performance Stock Units 45%
Restricted Stock Units 22%
Personal
objectives
Two-thirds of
compensation
based on stock
performance
Operating
performance
Say on pay approval of >90% since 2012
Executive compensation tied to shareholder returns
*CEO target compensation
Newmont Mining Corporation I BAML Metals & Mining Conference I slide 23 May 2016
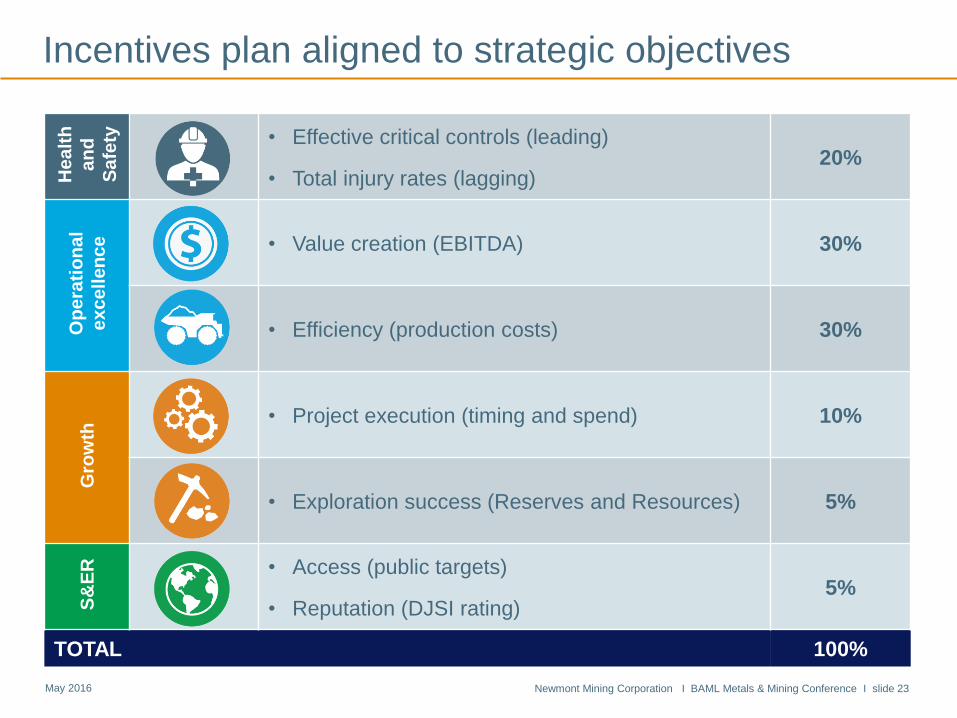
Incentives plan aligned to strategic objectives H
ea
lth
an
d
Safe
ty
• Effective critical controls (leading)
• Total injury rates (lagging) 20%
Op
era
tio
na
l
ex
ce
llen
ce
• Value creation (EBITDA) 30%
• Efficiency (production costs) 30%
Gro
wth
• Project execution (timing and spend) 10%
• Exploration success (Reserves and Resources) 5%
S&
ER
• Access (public targets)
• Reputation (DJSI rating) 5%
TOTAL 100%
Newmont Mining Corporation I BAML Metals & Mining Conference I slide 24 May 2016
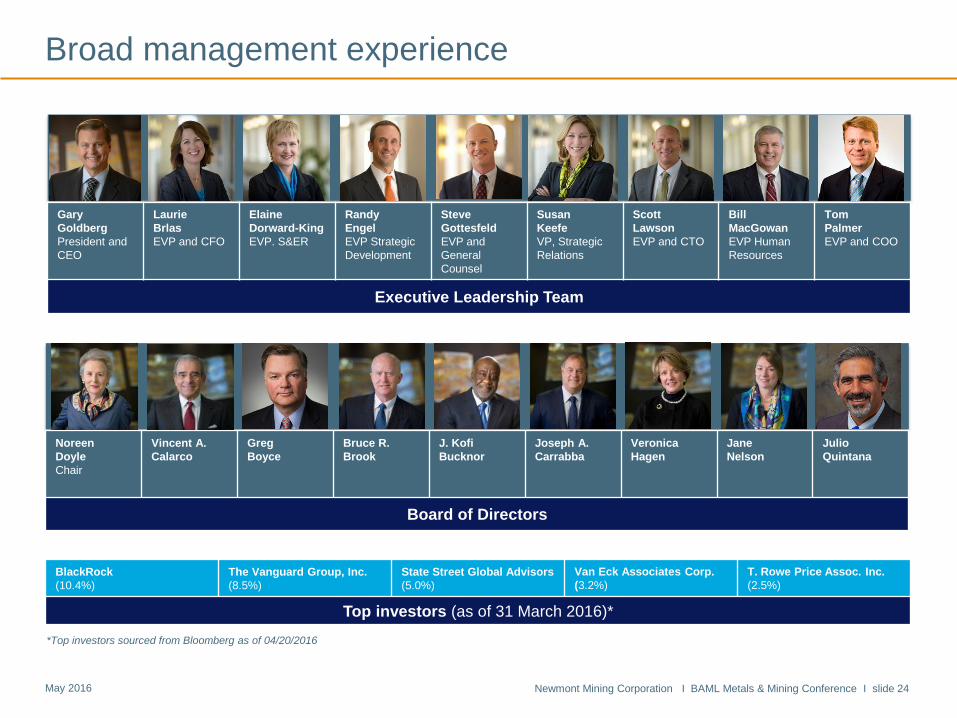
Broad management experience
Gary
Goldberg
President and
CEO
Laurie
Brlas
EVP and CFO
Elaine
Dorward-King
EVP. S&ER
Randy
Engel
EVP Strategic
Development
Steve
Gottesfeld
EVP and
General
Counsel
Susan
Keefe
VP, Strategic
Relations
Scott
Lawson
EVP and CTO
Bill
MacGowan
EVP Human
Resources
Tom
Palmer
EVP and COO
Executive Leadership Team
Noreen
Doyle
Chair
Vincent A.
Calarco
Greg
Boyce
Bruce R.
Brook
J. Kofi
Bucknor
Joseph A.
Carrabba
Veronica
Hagen
Jane
Nelson
Julio
Quintana
Board of Directors
BlackRock
(10.4%)
The Vanguard Group, Inc.
(8.5%)
State Street Global Advisors
(5.0%)
Van Eck Associates Corp.
(3.2%)
T. Rowe Price Assoc. Inc.
(2.5%)
Top investors (as of 31 March 2016)*
*Top investors sourced from Bloomberg as of 04/20/2016
Newmont Mining Corporation I BAML Metals & Mining Conference I slide 25 May 2016
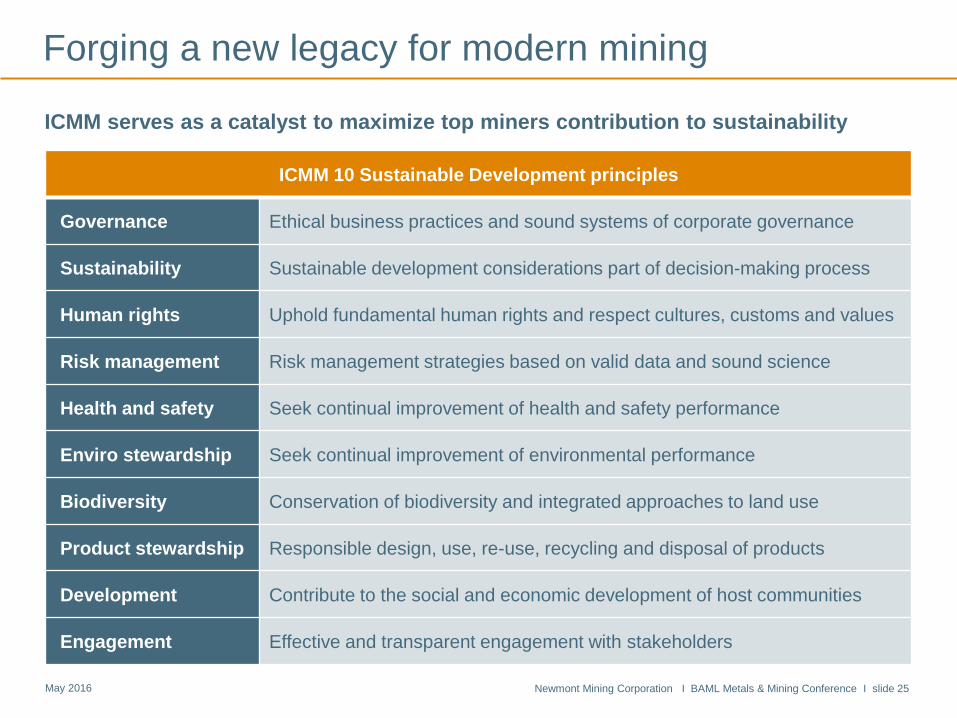
Forging a new legacy for modern mining
ICMM serves as a catalyst to maximize top miners contribution to sustainability
ICMM 10 Sustainable Development principles
Governance Ethical business practices and sound systems of corporate governance
Sustainability Sustainable development considerations part of decision-making process
Human rights Uphold fundamental human rights and respect cultures, customs and values
Risk management Risk management strategies based on valid data and sound science
Health and safety Seek continual improvement of health and safety performance
Enviro stewardship Seek continual improvement of environmental performance
Biodiversity Conservation of biodiversity and integrated approaches to land use
Product stewardship Responsible design, use, re-use, recycling and disposal of products
Development Contribute to the social and economic development of host communities
Engagement Effective and transparent engagement with stakeholders

Newmont Mining Corporation I BAML Metals & Mining Conference I slide 26 May 2016
Recognized for leading practices
Global
• Ranked mining industry leader by Dow
Jones Sustainability World Index
North America
• Excellence in Mine Reclamation Award
from the Nevada Division of Minerals
South America
• Peru 2021 Social Responsibility Award for
foundation’s local farmer program
Africa
• EU African Chamber of Commerce Social
Impact Award for Ahafo foundation
Australia
• Excellence in Diversity Programs and
Performance Award from Women in
Resources
Newmont Mining Corporation I BAML Metals & Mining Conference I slide 27 May 2016
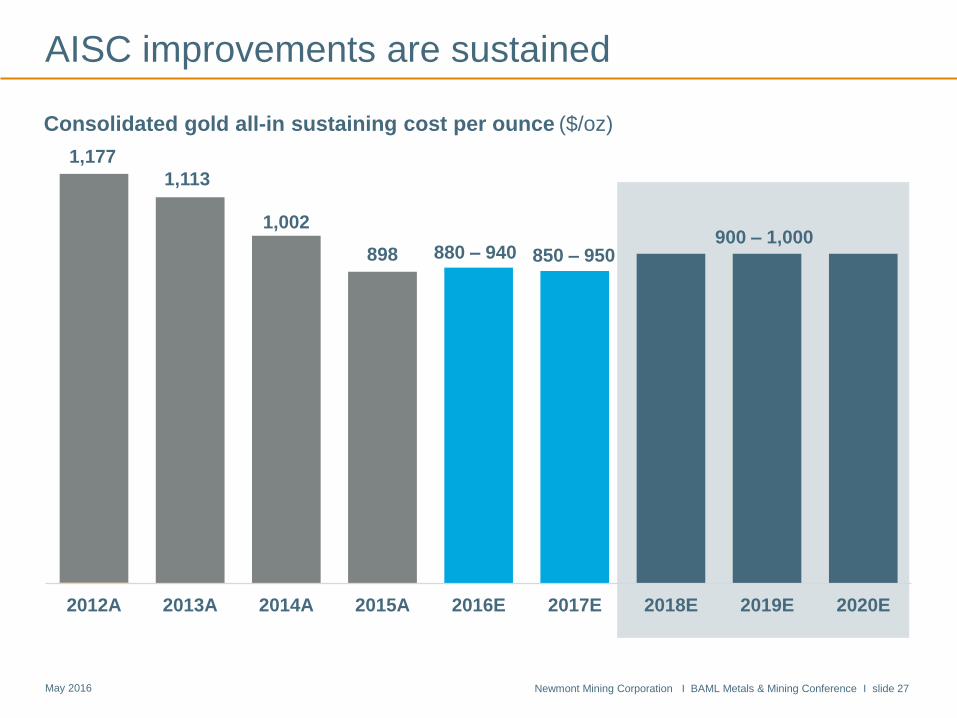
1,177
1,113
1,002
898
2012A 2013A 2014A 2015A 2016E 2017E 2018E 2019E 2020E
AISC improvements are sustained
Consolidated gold all-in sustaining cost per ounce ($/oz)
880 – 940 850 – 950 900 – 1,000
Newmont Mining Corporation I BAML Metals & Mining Conference I slide 28 May 2016
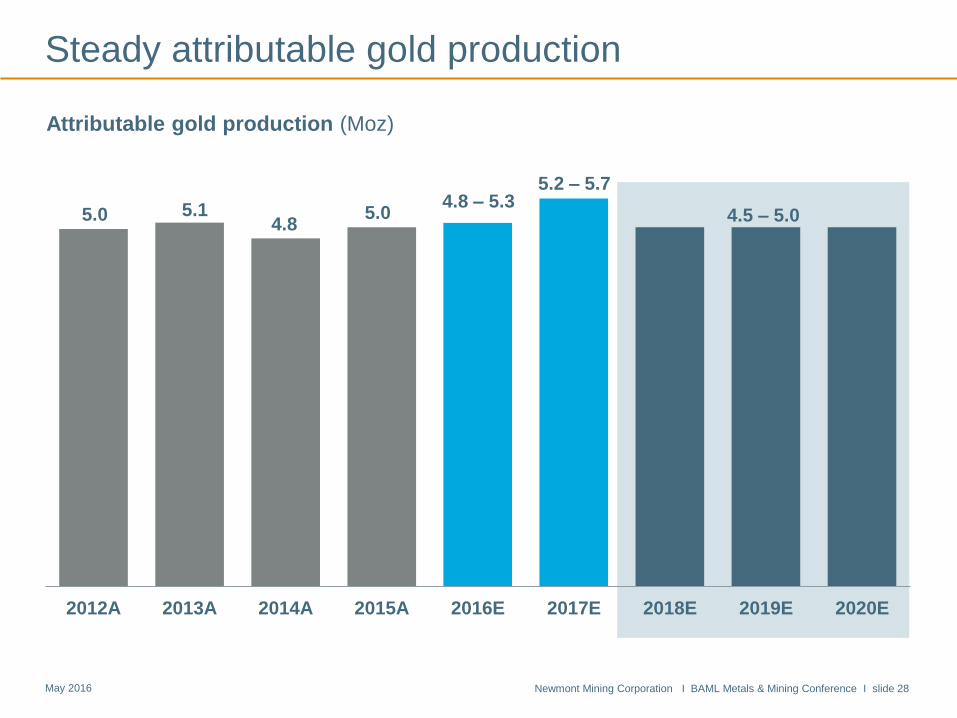
5.0 5.1 4.8
5.0 4.5 – 5.0
2012A 2013A 2014A 2015A 2016E 2017E 2018E 2019E 2020E
4.8 – 5.3
Attributable gold production (Moz)
Steady attributable gold production
5.2 – 5.7

Newmont Mining Corporation I BAML Metals & Mining Conference I slide 29 May 2016
$0
$500
$1,000
$1,500
$2,000
$2,500
$3,000
$3,500
2012A 2013A 2014A 2015A 2016E 2017E 2018E 2019E 2020E
Disciplined approach to capital expenditure
Consolidated capital expenditure ($M)
Sustaining capital Development capital
700 – 800
900 –
1,000
3,152
1,812
1,099
1,135 –
1,355 1,468
Newmont Mining Corporation I BAML Metals & Mining Conference I slide 30 May 2016
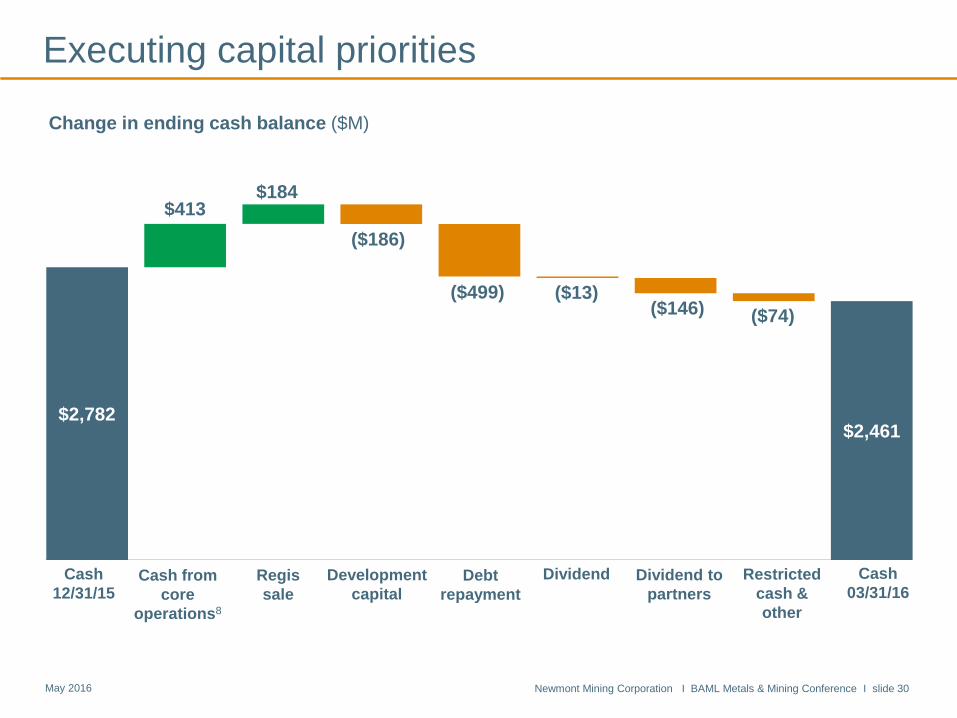
$2,782 $2,461
$413 $184
($186)
($499) ($13) ($146) ($74)
$0.00
$500.00
$1,000.00
$1,500.00
$2,000.00
$2,500.00
$3,000.00
$3,500.00
$4,000.00
Executing capital priorities
Cash
03/31/16
Change in ending cash balance ($M)
Cash
12/31/15 Cash from
core
operations8
Development
capital
Regis
sale
Debt
repayment
Dividend Dividend to
partners
Restricted
cash &
other
Newmont Mining Corporation I BAML Metals & Mining Conference I slide 31 May 2016
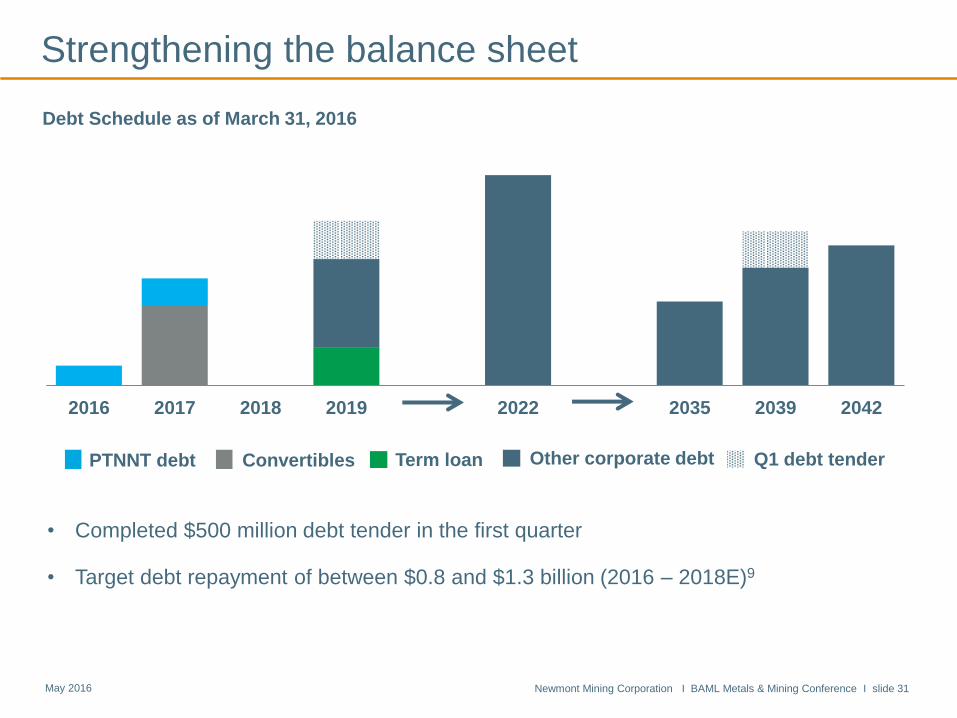
2016 2017 2018 2019 2022 2035 2039 2042
PTNNT debt Convertibles Term loan Other corporate debt
Strengthening the balance sheet
Regional debt Convertibles Term loan Other corporate debt
Debt Schedule as of March 31, 2016
Q1 debt tender
• Completed $500 million debt tender in the first quarter
• Target debt repayment of between $0.8 and $1.3 billion (2016 – 2018E)9
Newmont Mining Corporation I BAML Metals & Mining Conference I slide 32 May 2016
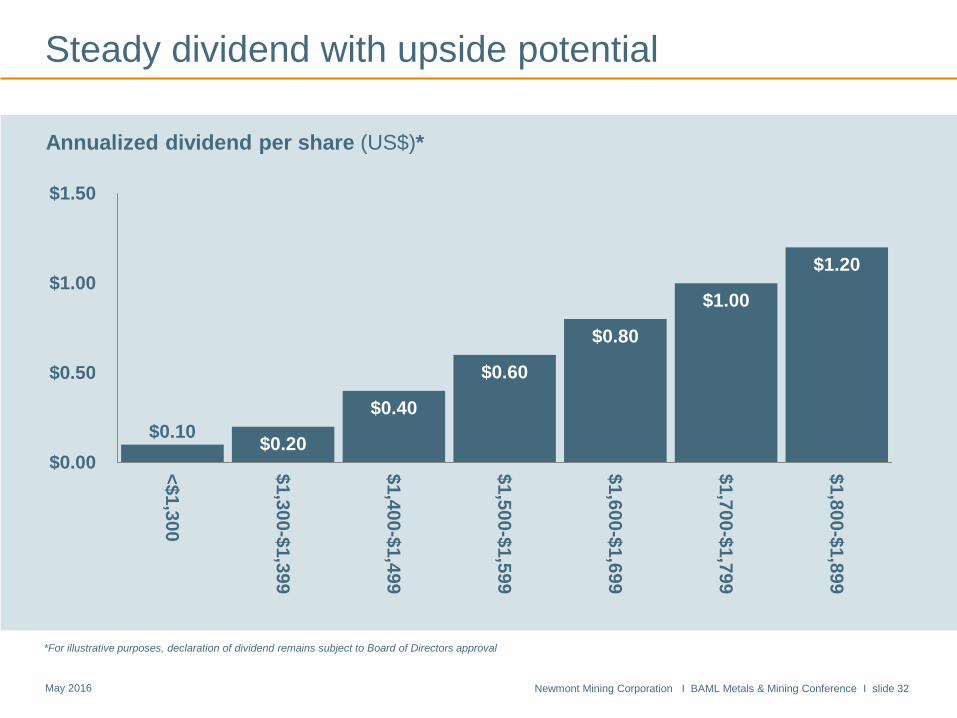
Steady dividend with upside potential
Annualized dividend per share (US$)*
*For illustrative purposes, declaration of dividend remains subject to Board of Directors approval
$0.10 $0.20
$0.40
$0.60
$0.80
$1.00
$1.20
$0.00
$0.50
$1.00
$1.50
<$1
,30
0
$1
,30
0-$
1,3
99
$1,4
00-$
1,4
99
$1
,50
0-$
1,5
99
$1
,60
0-$
1,6
99
$1
,70
0-$
1,7
99
$1
,80
0-$
1,8
99
Newmont Mining Corporation I BAML Metals & Mining Conference I slide 33 May 2016
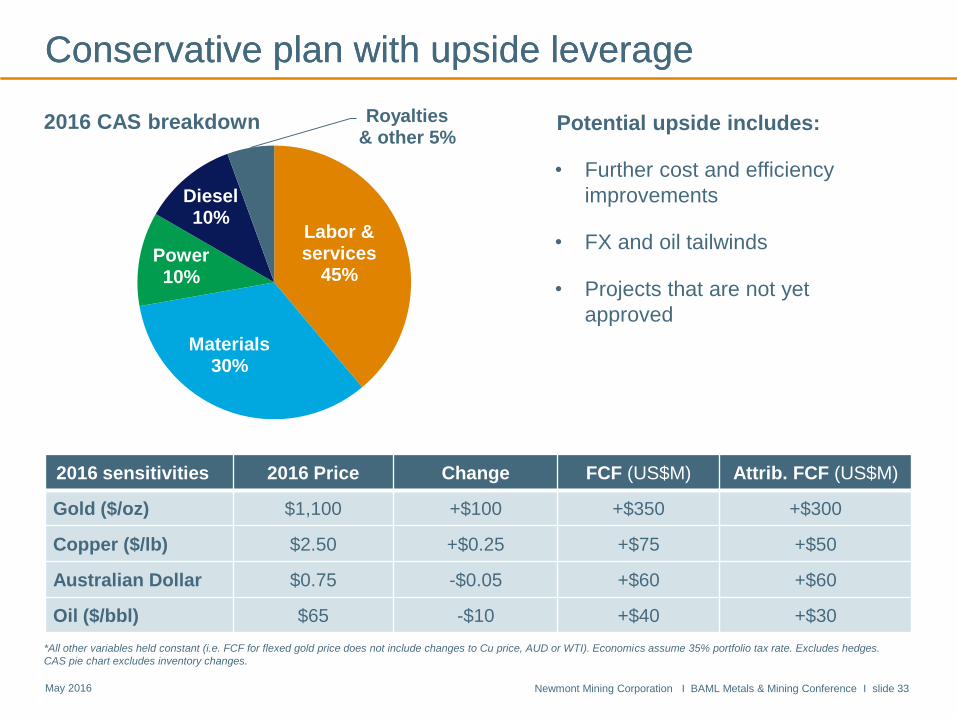
Labor & services
45%
Materials 30%
Power 10%
Diesel 10%
Royalties & other 5%
Conservative plan with upside leverage Conservative plan with upside leverage
*All other variables held constant (i.e. FCF for flexed gold price does not include changes to Cu price, AUD or WTI). Economics assume 35% portfolio tax rate. Excludes hedges.
CAS pie chart excludes inventory changes.
2016 CAS breakdown Potential upside includes:
• Further cost and efficiency
improvements
• FX and oil tailwinds
• Projects that are not yet
approved
2016 sensitivities 2016 Price Change FCF (US$M) Attrib. FCF (US$M)
Gold ($/oz) $1,100 +$100 +$350 +$300
Copper ($/lb) $2.50 +$0.25 +$75 +$50
Australian Dollar $0.75 -$0.05 +$60 +$60
Oil ($/bbl) $65 -$10 +$40 +$30

Newmont Mining Corporation I BAML Metals & Mining Conference I slide 34 May 2016
Long Canyon opens prospective new district
• Phased approach and synergies improve returns
• Mine operating 24/7; leach facility nearing completion
• High grade oxide deposit with open mineralization
Production 100 – 150 Koz
AISC $500 – $600/oz
Capital $250 – $300M
First production Early 2017
Production and AISC calculated as first full five year average
Long Canyon
Newmont Mining Corporation I BAML Metals & Mining Conference I slide 35 May 2016
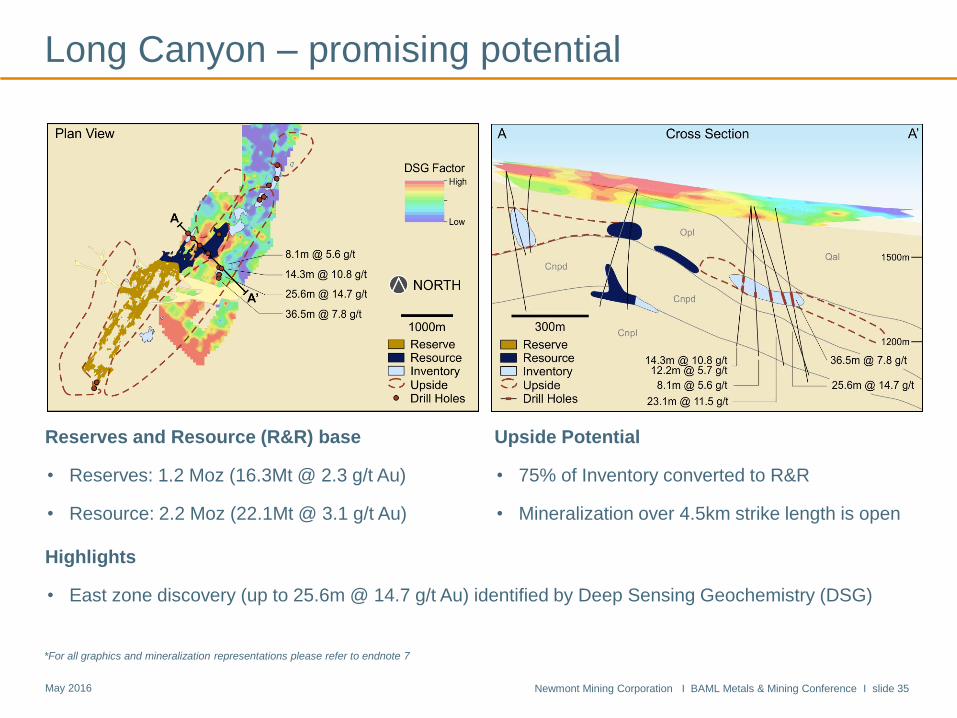
Long Canyon – promising potential
Upside Potential
• 75% of Inventory converted to R&R
• Mineralization over 4.5km strike length is open
Highlights
• East zone discovery (up to 25.6m @ 14.7 g/t Au) identified by Deep Sensing Geochemistry (DSG)
Reserves and Resource (R&R) base
• Reserves: 1.2 Moz (16.3Mt @ 2.3 g/t Au)
• Resource: 2.2 Moz (22.1Mt @ 3.1 g/t Au)
*For all graphics and mineralization representations please refer to endnote 7
Newmont Mining Corporation I BAML Metals & Mining Conference I slide 36 May 2016
Merian 80% complete, $100M below initial budget
• Optimized approach taken to lower cost and risk
• Construction of process plant nearing completion
• ~100,000 contained ounces stockpiled to date
100% basis; production and AISC first full five year average
Production 400 – 500 Koz
AISC $650 – $750/oz
Capital $750 – $825M
First production H2 2016
Merian stockpile
Newmont Mining Corporation I BAML Metals & Mining Conference I slide 37 May 2016
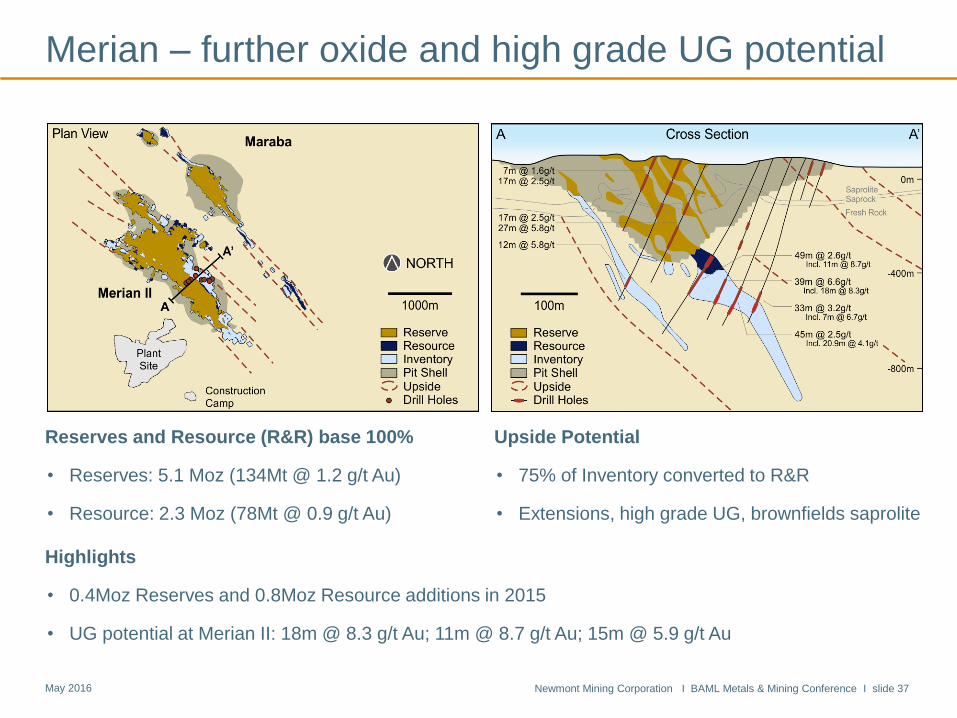
Merian – further oxide and high grade UG potential
Reserves and Resource (R&R) base 100%
• Reserves: 5.1 Moz (134Mt @ 1.2 g/t Au)
• Resource: 2.3 Moz (78Mt @ 0.9 g/t Au)
Upside Potential
• 75% of Inventory converted to R&R
• Extensions, high grade UG, brownfields saprolite
Highlights
• 0.4Moz Reserves and 0.8Moz Resource additions in 2015
• UG potential at Merian II: 18m @ 8.3 g/t Au; 11m @ 8.7 g/t Au; 15m @ 5.9 g/t Au
Newmont Mining Corporation I BAML Metals & Mining Conference I slide 38 May 2016
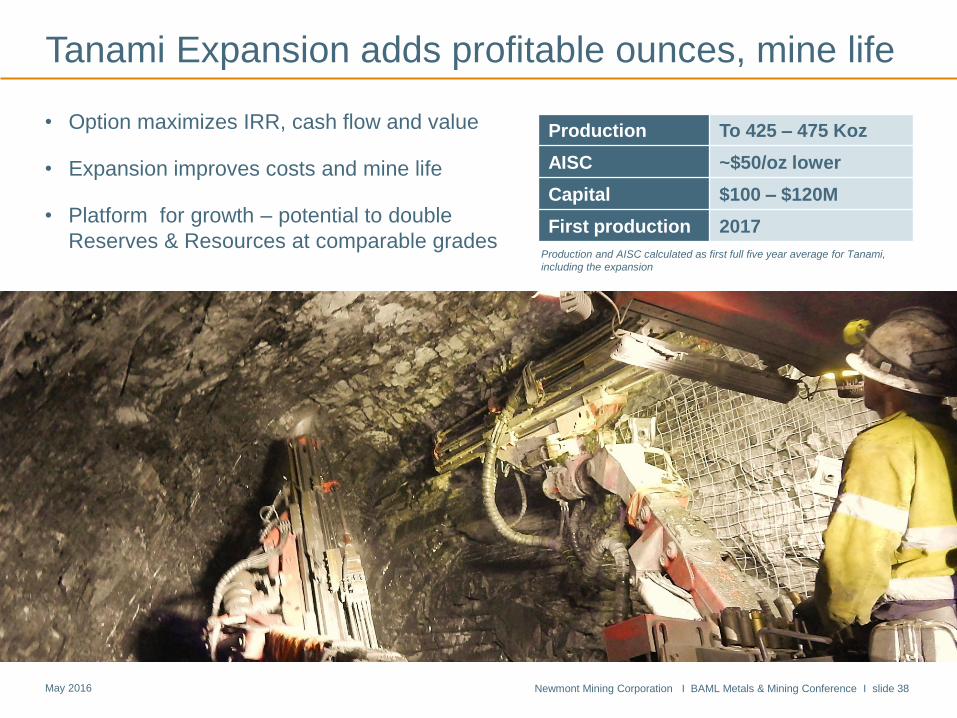
• Option maximizes IRR, cash flow and value
• Expansion improves costs and mine life
• Platform for growth – potential to double
Reserves & Resources at comparable grades
Tanami Expansion adds profitable ounces, mine life
Cripple Creek & Victor
Production To 425 – 475 Koz
AISC ~$50/oz lower
Capital $100 – $120M
First production 2017
Production and AISC calculated as first full five year average for Tanami,
including the expansion

Newmont Mining Corporation I BAML Metals & Mining Conference I slide 39 May 2016
Highlights
• 0.8Moz Reserves and 0.7Moz Resource additions in 2015
• New Liberator and Federation Discoveries (up to 16m @ 29.4 g/t Au and 6m @ 52 g/t Au)
• Auron (up to 52m @ 9.5 g/t Au); West Auron (up to 22m @ 18.8 g/t Au); Soolin (up to 20m @ 8.6 g/t Au)
Tanami UG – 10Moz growth through new discoveries
Reserves and Resource (R&R) base
• Reserves: 3.5 Moz (18.7Mt @ 5.8 g/t Au)
• Resource: 2.1 Moz (11.3Mt @ 5.9 g/t Au)
Upside Potential
• 66% of Inventory converted to R&R
• Extensions and repeating structures

Newmont Mining Corporation I BAML Metals & Mining Conference I slide 40 May 2016
CC&V adds significant cash flow and upside potential
• Expansion progressing on schedule
• First gold at new valley leach facility in Q1
• Completed mill modifications
New valley leach expansion at Cripple Creek & Victor
*Estimated development capital to complete expansion and estimated
completion date
2016E production 350 – 400 Koz
2016E AISC $650 – $700/oz
Capital* ~$200M
Completion* H2 2016
Newmont Mining Corporation I BAML Metals & Mining Conference I slide 41 May 2016
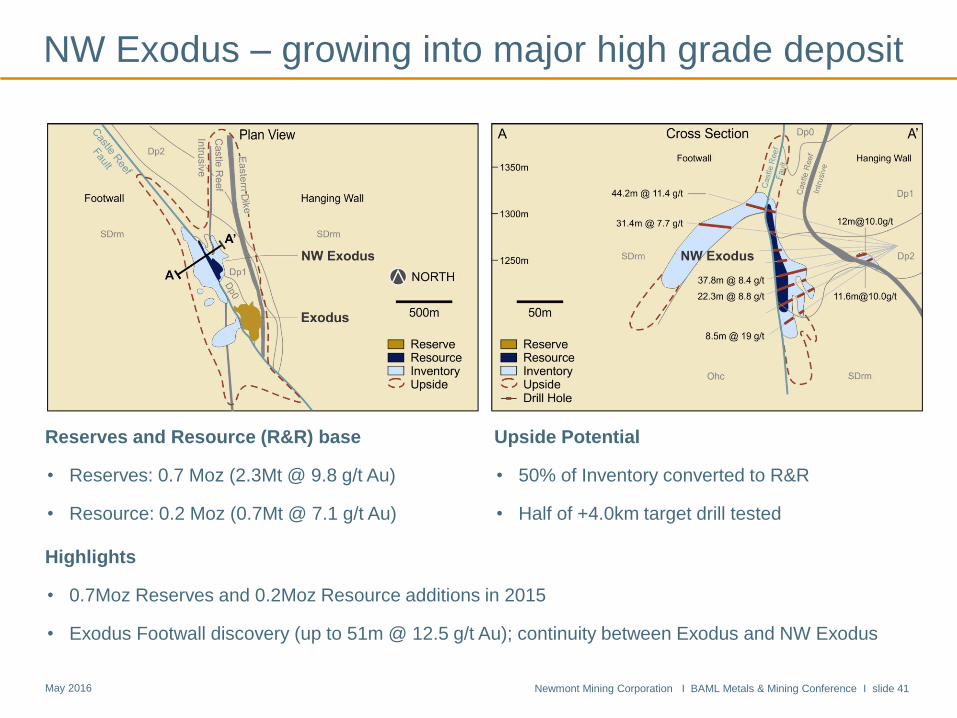
Highlights
• 0.7Moz Reserves and 0.2Moz Resource additions in 2015
• Exodus Footwall discovery (up to 51m @ 12.5 g/t Au); continuity between Exodus and NW Exodus
Reserves and Resource (R&R) base
• Reserves: 0.7 Moz (2.3Mt @ 9.8 g/t Au)
• Resource: 0.2 Moz (0.7Mt @ 7.1 g/t Au)
Upside Potential
• 50% of Inventory converted to R&R
• Half of +4.0km target drill tested
NW Exodus – growing into major high grade deposit
Newmont Mining Corporation I BAML Metals & Mining Conference I slide 42 May 2016
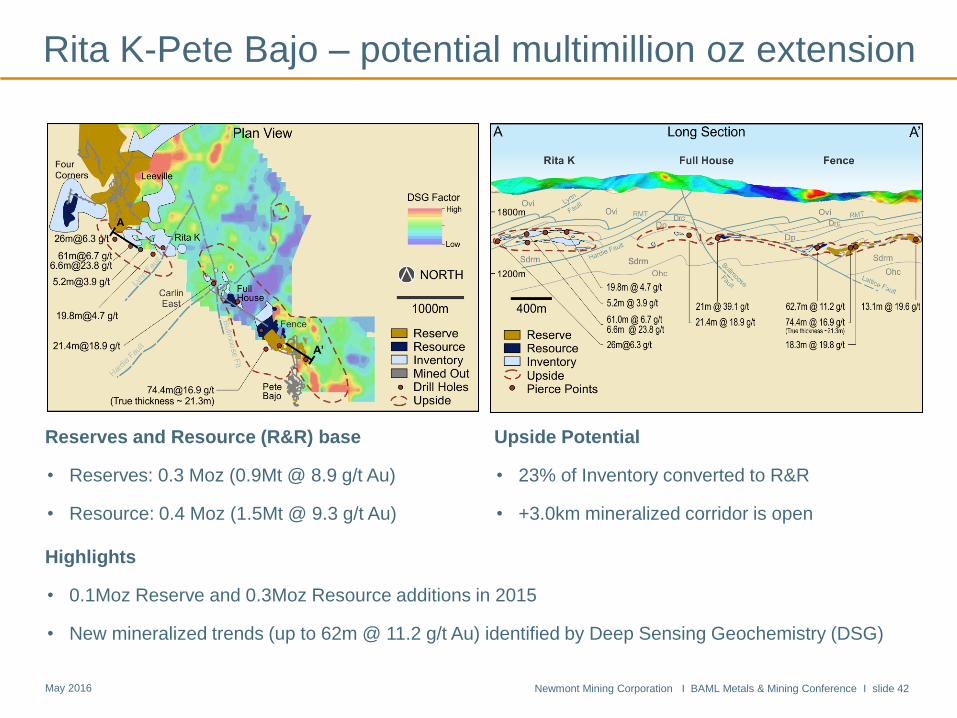
Highlights
• 0.1Moz Reserve and 0.3Moz Resource additions in 2015
• New mineralized trends (up to 62m @ 11.2 g/t Au) identified by Deep Sensing Geochemistry (DSG)
Reserves and Resource (R&R) base
• Reserves: 0.3 Moz (0.9Mt @ 8.9 g/t Au)
• Resource: 0.4 Moz (1.5Mt @ 9.3 g/t Au)
Upside Potential
• 23% of Inventory converted to R&R
• +3.0km mineralized corridor is open
Rita K-Pete Bajo – potential multimillion oz extension
Newmont Mining Corporation I BAML Metals & Mining Conference I slide 43 May 2016
0
20
40
60
80
100
2004
2005
2006
2007
2008
2009
2010
2011
2012
2013
2014
2015
2016
-20
-10
0
10
20
2000
2001
2002
2003
2004
2005
2006
2007
2008
2009
2010
2011
2012
2013
2014
2015 Y
TD
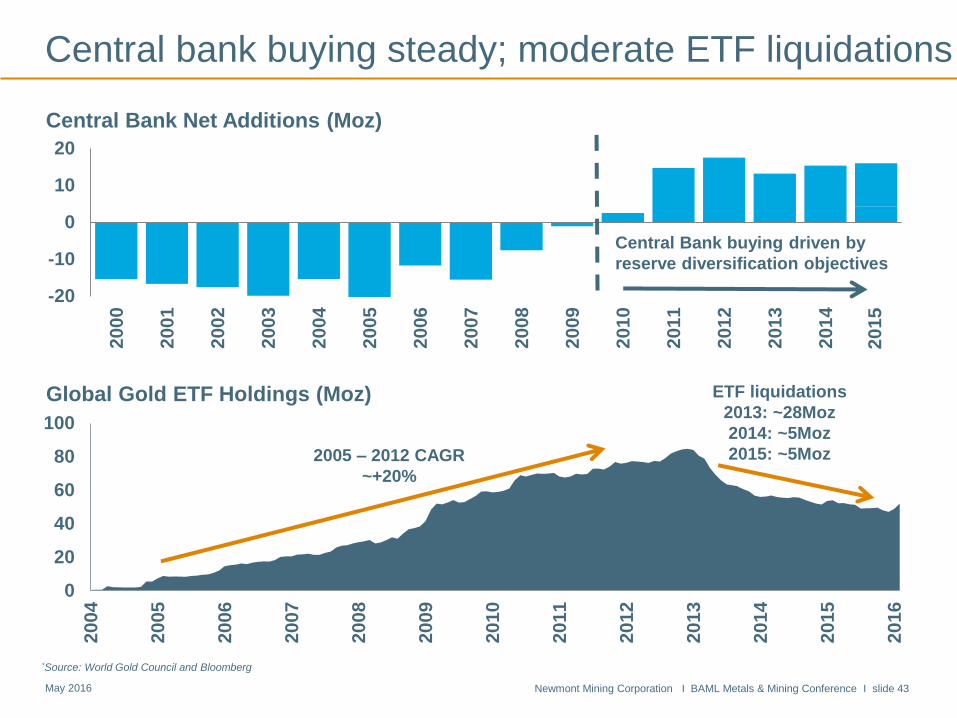
Central bank buying steady; moderate ETF liquidations
Central Bank Net Additions (Moz)
Global Gold ETF Holdings (Moz)
*Source: World Gold Council and Bloomberg
2005 – 2012 CAGR
~+20%
ETF liquidations
2013: ~28Moz
2014: ~5Moz
2015: ~5Moz
Central Bank buying driven by
reserve diversification objectives
2015
Newmont Mining Corporation I BAML Metals & Mining Conference I slide 44 May 2016
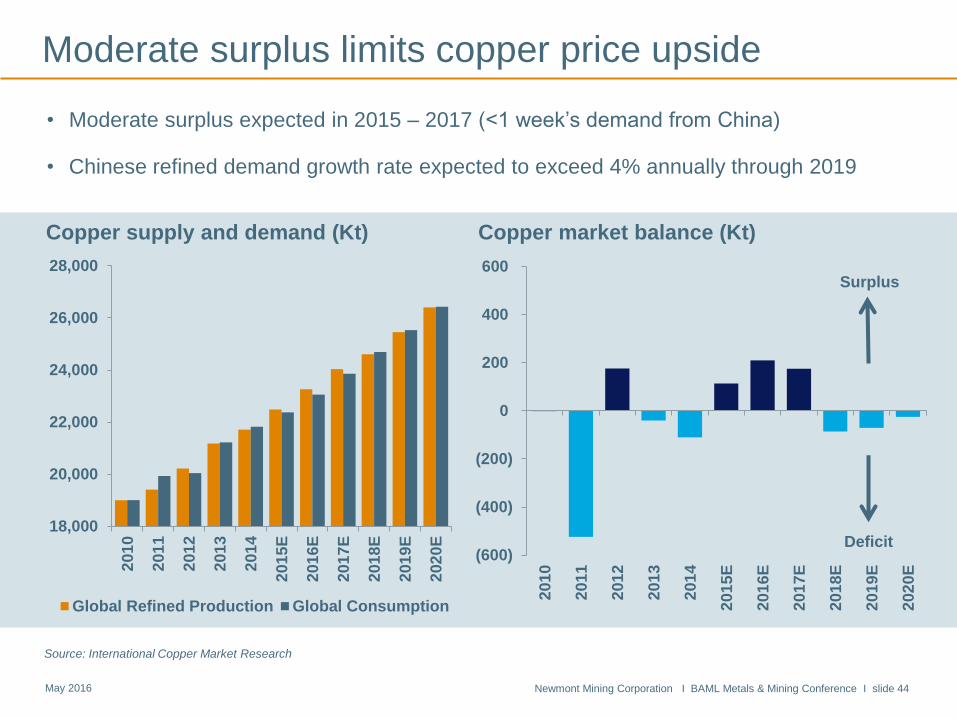
Copper supply and demand (Kt)
Copper market balance (Kt)
• Moderate surplus expected in 2015 – 2017 (<1 week’s demand from China)
• Chinese refined demand growth rate expected to exceed 4% annually through 2019
Moderate surplus limits copper price upside
18,000
20,000
22,000
24,000
26,000
28,000
201
0
201
1
201
2
201
3
201
4
201
5E
201
6E
201
7E
201
8E
201
9E
202
0E
Global Refined Production Global Consumption
(600)
(400)
(200)
0
200
400
600
201
0
201
1
201
2
201
3
201
4
201
5E
201
6E
201
7E
201
8E
201
9E
202
0E
Surplus
Deficit
Source: International Copper Market Research
Newmont Mining Corporation I BAML Metals & Mining Conference I slide 45 May 2016
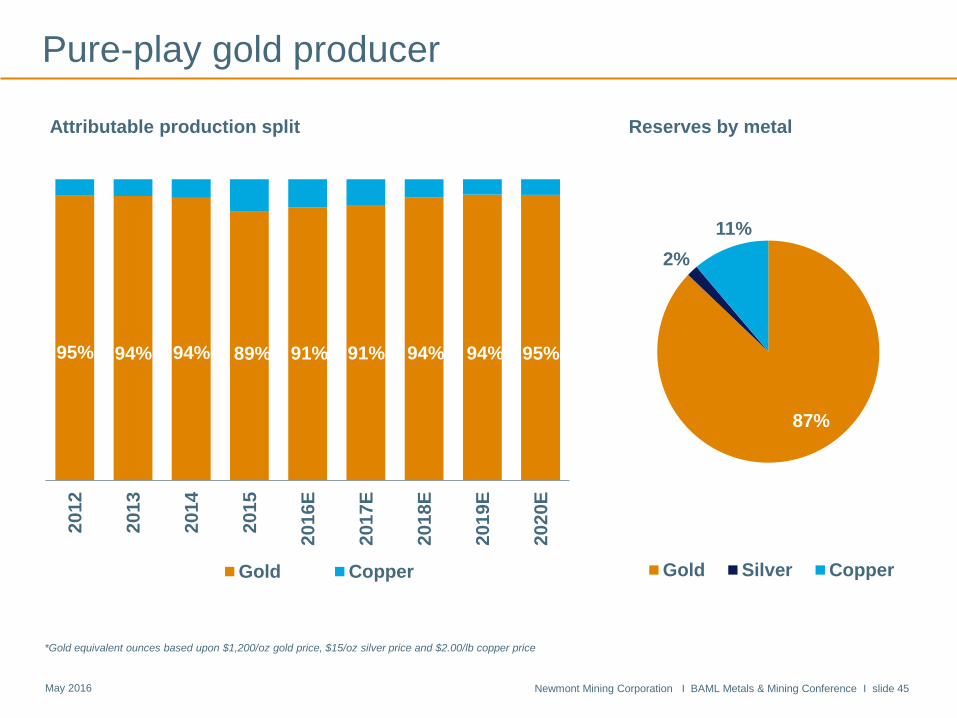
Pure-play gold producer
*Gold equivalent ounces based upon $1,200/oz gold price, $15/oz silver price and $2.00/lb copper price
87%
2%
11%
Reserves by metal
Gold Silver Copper
95% 94% 94% 89% 91% 91% 94% 94% 95%
2012
2013
2014
2015
20
16
E
20
17
E
20
18
E
20
19
E
20
20
E
Attributable production split
Gold Copper
Newmont Mining Corporation I BAML Metals & Mining Conference I slide 46 May 2016
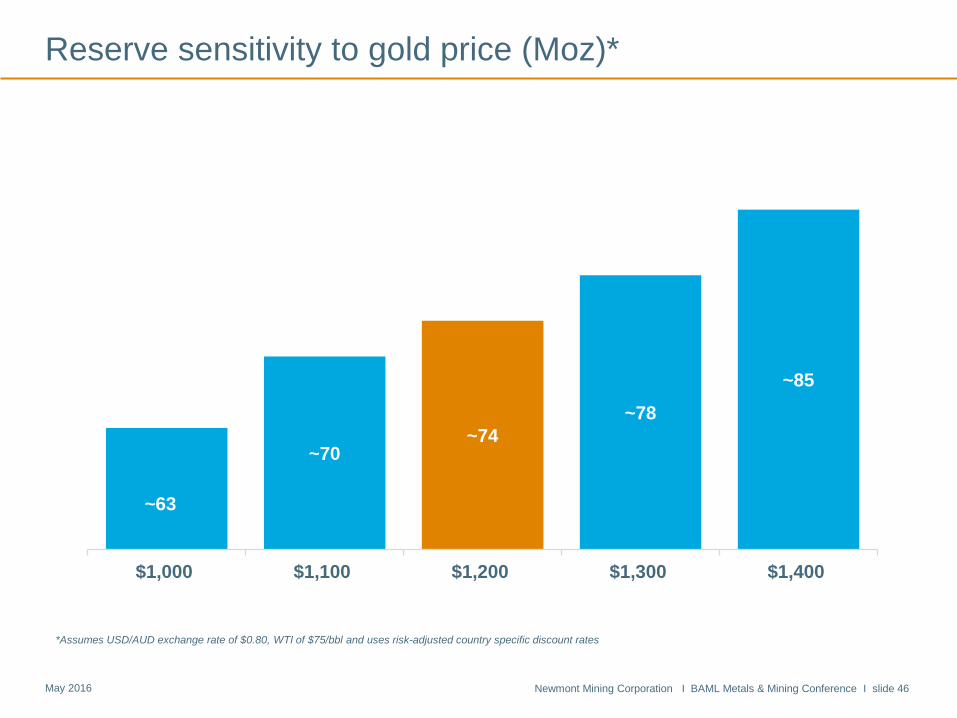
Reserve sensitivity to gold price (Moz)*
~63
~70 ~74
~78
~85
$1,000 $1,100 $1,200 $1,300 $1,400
*Assumes USD/AUD exchange rate of $0.80, WTI of $75/bbl and uses risk-adjusted country specific discount rates
Newmont Mining Corporation I BAML Metals & Mining Conference I slide 47 May 2016
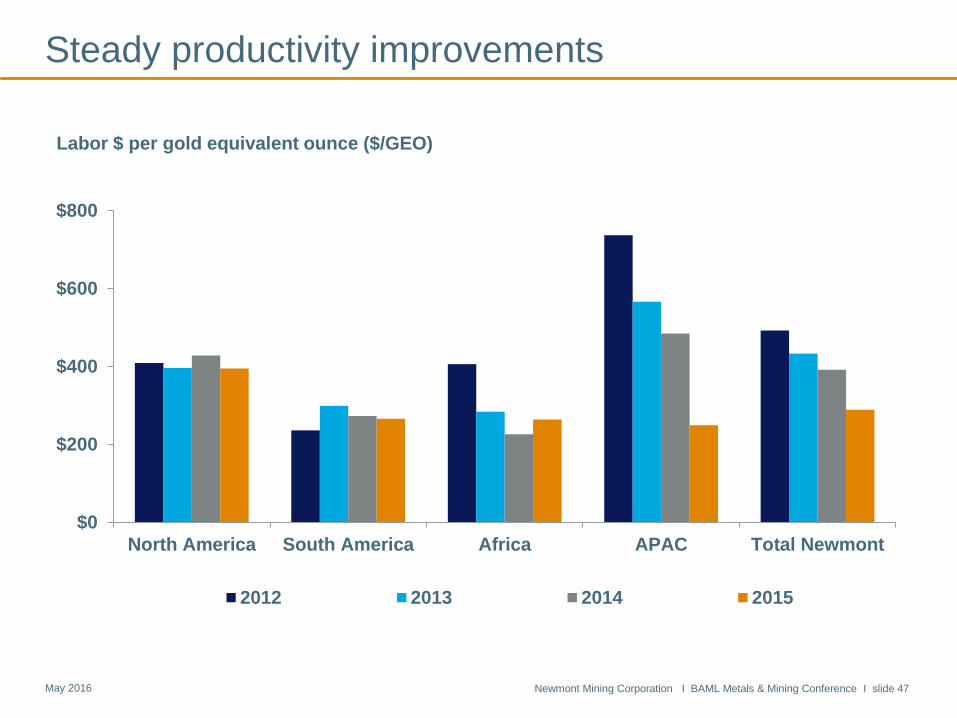
Steady productivity improvements
$0
$200
$400
$600
$800
North America South America Africa APAC Total Newmont
2012 2013 2014 2015
Labor $ per gold equivalent ounce ($/GEO)
Newmont Mining Corporation I BAML Metals & Mining Conference I slide 48 May 2016
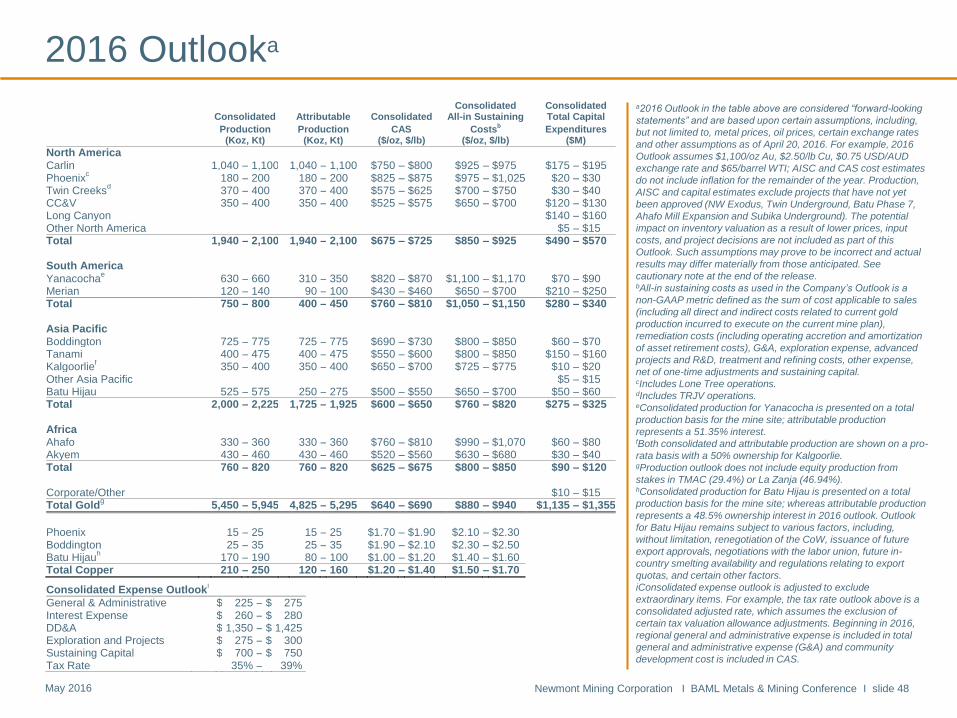
2016 Outlooka
Consolidated Attributable Consolidated
Consolidated All-in Sustaining
Consolidated Total Capital
Production Production CAS Costsb Expenditures
(Koz, Kt) (Koz, Kt) ($/oz, $/lb) ($/oz, $/lb) ($M)
North America Carlin 1,040 – 1,100 1,040 – 1,100 $750 – $800 $925 – $975 $175 – $195 Phoenix
c 180 – 200 180 – 200 $825 – $875 $975 – $1,025 $20 – $30
Twin Creeksd 370 – 400 370 – 400 $575 – $625 $700 – $750 $30 – $40
CC&V 350 – 400 350 – 400 $525 – $575 $650 – $700 $120 – $130 Long Canyon $140 – $160 Other North America $5 – $15 Total 1,940 – 2,100 1,940 – 2,100 $675 – $725 $850 – $925 $490 – $570 South America Yanacocha
e 630 – 660 310 – 350 $820 – $870 $1,100 – $1,170 $70 – $90
Merian 120 – 140 90 – 100 $430 – $460 $650 – $700 $210 – $250 Total 750 – 800 400 – 450 $760 – $810 $1,050 – $1,150 $280 – $340 Asia Pacific Boddington 725 – 775 725 – 775 $690 – $730 $800 – $850 $60 – $70 Tanami 400 – 475 400 – 475 $550 – $600 $800 – $850 $150 – $160 Kalgoorlie
f 350 – 400 350 – 400 $650 – $700 $725 – $775 $10 – $20
Other Asia Pacific $5 – $15 Batu Hijau 525 – 575 250 – 275 $500 – $550 $650 – $700 $50 – $60 Total 2,000 – 2,225 1,725 – 1,925 $600 – $650 $760 – $820 $275 – $325 Africa Ahafo 330 – 360 330 – 360 $760 – $810 $990 – $1,070 $60 – $80 Akyem 430 – 460 430 – 460 $520 – $560 $630 – $680 $30 – $40 Total 760 – 820 760 – 820 $625 – $675 $800 – $850 $90 – $120
Corporate/Other $10 – $15 Total Gold
g 5,450 – 5,945 4,825 – 5,295 $640 – $690 $880 – $940 $1,135 – $1,355
Phoenix 15 – 25 15 – 25 $1.70 – $1.90 $2.10 – $2.30 Boddington 25 – 35 25 – 35 $1.90 – $2.10 $2.30 – $2.50 Batu Hijau
h 170 – 190 80 – 100 $1.00 – $1.20 $1.40 – $1.60
Total Copper 210 – 250 120 – 160 $1.20 – $1.40 $1.50 – $1.70
Consolidated Expense Outlooki
General & Administrative $ 225 – $ 275 Interest Expense $ 260 – $ 280 DD&A $ 1,350 – $ 1,425 Exploration and Projects $ 275 – $ 300 Sustaining Capital $ 700 – $ 750 Tax Rate 35% – 39%
a2016 Outlook in the table above are considered “forward-looking
statements” and are based upon certain assumptions, including,
but not limited to, metal prices, oil prices, certain exchange rates
and other assumptions as of April 20, 2016. For example, 2016
Outlook assumes $1,100/oz Au, $2.50/lb Cu, $0.75 USD/AUD
exchange rate and $65/barrel WTI; AISC and CAS cost estimates
do not include inflation for the remainder of the year. Production,
AISC and capital estimates exclude projects that have not yet
been approved (NW Exodus, Twin Underground, Batu Phase 7,
Ahafo Mill Expansion and Subika Underground). The potential
impact on inventory valuation as a result of lower prices, input
costs, and project decisions are not included as part of this
Outlook. Such assumptions may prove to be incorrect and actual
results may differ materially from those anticipated. See
cautionary note at the end of the release. bAll-in sustaining costs as used in the Company’s Outlook is a
non-GAAP metric defined as the sum of cost applicable to sales
(including all direct and indirect costs related to current gold
production incurred to execute on the current mine plan),
remediation costs (including operating accretion and amortization
of asset retirement costs), G&A, exploration expense, advanced
projects and R&D, treatment and refining costs, other expense,
net of one-time adjustments and sustaining capital. cIncludes Lone Tree operations. dIncludes TRJV operations. eConsolidated production for Yanacocha is presented on a total
production basis for the mine site; attributable production
represents a 51.35% interest. fBoth consolidated and attributable production are shown on a pro-
rata basis with a 50% ownership for Kalgoorlie. gProduction outlook does not include equity production from
stakes in TMAC (29.4%) or La Zanja (46.94%). hConsolidated production for Batu Hijau is presented on a total
production basis for the mine site; whereas attributable production
represents a 48.5% ownership interest in 2016 outlook. Outlook
for Batu Hijau remains subject to various factors, including,
without limitation, renegotiation of the CoW, issuance of future
export approvals, negotiations with the labor union, future in-
country smelting availability and regulations relating to export
quotas, and certain other factors.
iConsolidated expense outlook is adjusted to exclude
extraordinary items. For example, the tax rate outlook above is a
consolidated adjusted rate, which assumes the exclusion of
certain tax valuation allowance adjustments. Beginning in 2016,
regional general and administrative expense is included in total
general and administrative expense (G&A) and community
development cost is included in CAS.
Newmont Mining Corporation I BAML Metals & Mining Conference I slide 49 May 2016
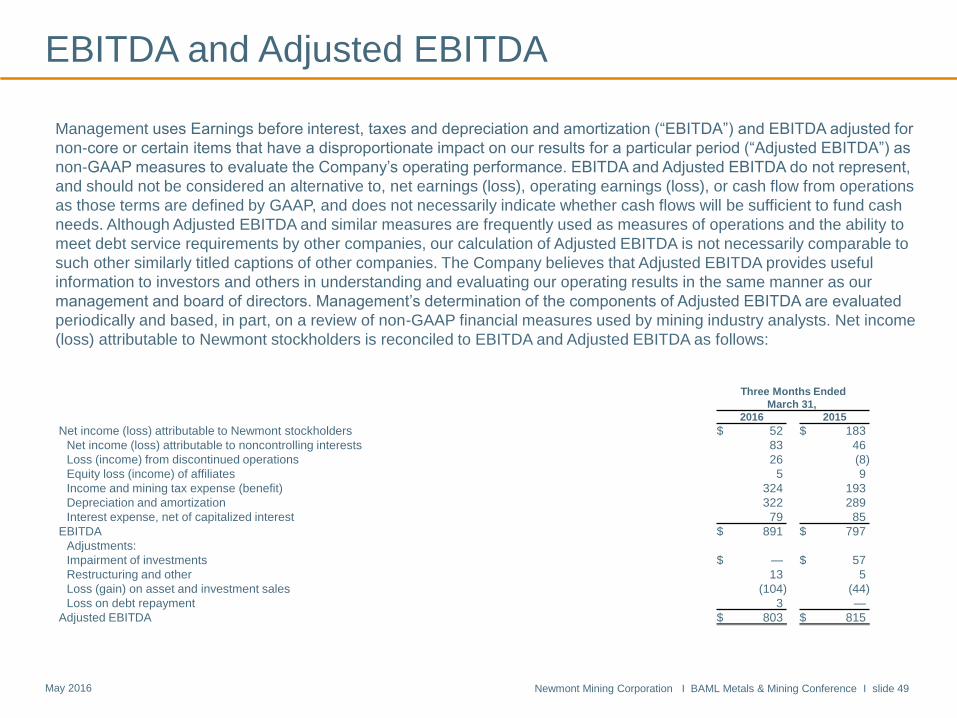
EBITDA and Adjusted EBITDA
Management uses Earnings before interest, taxes and depreciation and amortization (“EBITDA”) and EBITDA adjusted for
non-core or certain items that have a disproportionate impact on our results for a particular period (“Adjusted EBITDA”) as
non-GAAP measures to evaluate the Company’s operating performance. EBITDA and Adjusted EBITDA do not represent,
and should not be considered an alternative to, net earnings (loss), operating earnings (loss), or cash flow from operations
as those terms are defined by GAAP, and does not necessarily indicate whether cash flows will be sufficient to fund cash
needs. Although Adjusted EBITDA and similar measures are frequently used as measures of operations and the ability to
meet debt service requirements by other companies, our calculation of Adjusted EBITDA is not necessarily comparable to
such other similarly titled captions of other companies. The Company believes that Adjusted EBITDA provides useful
information to investors and others in understanding and evaluating our operating results in the same manner as our
management and board of directors. Management’s determination of the components of Adjusted EBITDA are evaluated
periodically and based, in part, on a review of non-GAAP financial measures used by mining industry analysts. Net income
(loss) attributable to Newmont stockholders is reconciled to EBITDA and Adjusted EBITDA as follows:
Three Months Ended March 31,
2016 2015
Net income (loss) attributable to Newmont stockholders $ 52 $ 183
Net income (loss) attributable to noncontrolling interests 83 46
Loss (income) from discontinued operations 26 (8)
Equity loss (income) of affiliates 5 9
Income and mining tax expense (benefit) 324 193
Depreciation and amortization 322 289
Interest expense, net of capitalized interest 79 85
EBITDA $ 891 $ 797
Adjustments:
Impairment of investments $ — $ 57
Restructuring and other 13 5
Loss (gain) on asset and investment sales (104) (44)
Loss on debt repayment 3 —
Adjusted EBITDA $ 803 $ 815
Newmont Mining Corporation I BAML Metals & Mining Conference I slide 50 May 2016
Free cash flow
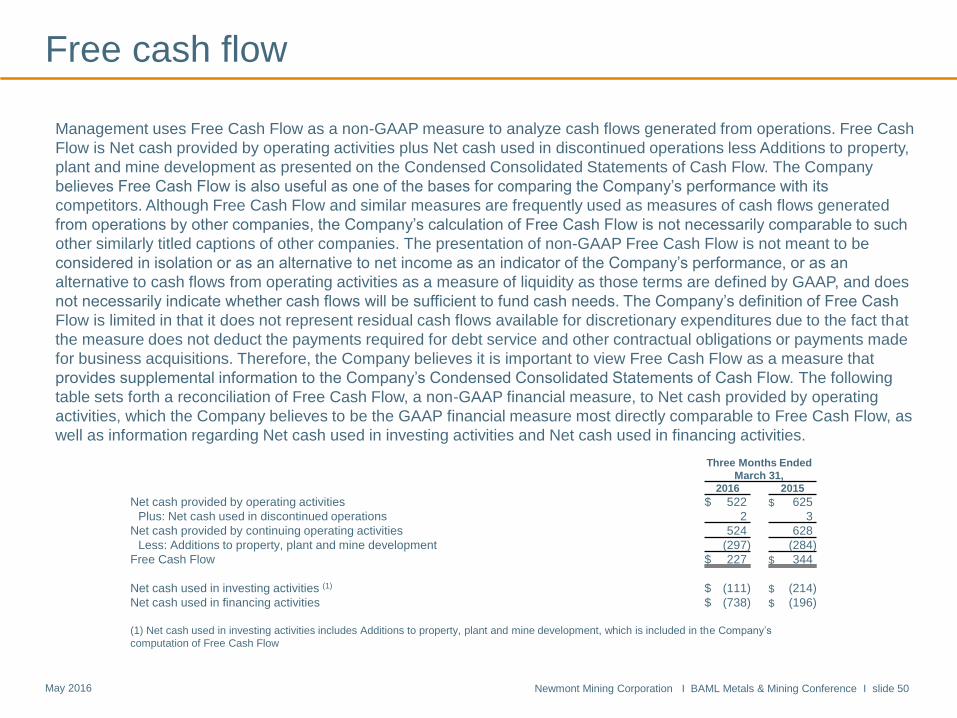
Management uses Free Cash Flow as a non-GAAP measure to analyze cash flows generated from operations. Free Cash
Flow is Net cash provided by operating activities plus Net cash used in discontinued operations less Additions to property,
plant and mine development as presented on the Condensed Consolidated Statements of Cash Flow. The Company
believes Free Cash Flow is also useful as one of the bases for comparing the Company’s performance with its
competitors. Although Free Cash Flow and similar measures are frequently used as measures of cash flows generated
from operations by other companies, the Company’s calculation of Free Cash Flow is not necessarily comparable to such
other similarly titled captions of other companies. The presentation of non-GAAP Free Cash Flow is not meant to be
considered in isolation or as an alternative to net income as an indicator of the Company’s performance, or as an
alternative to cash flows from operating activities as a measure of liquidity as those terms are defined by GAAP, and does
not necessarily indicate whether cash flows will be sufficient to fund cash needs. The Company’s definition of Free Cash
Flow is limited in that it does not represent residual cash flows available for discretionary expenditures due to the fact that
the measure does not deduct the payments required for debt service and other contractual obligations or payments made
for business acquisitions. Therefore, the Company believes it is important to view Free Cash Flow as a measure that
provides supplemental information to the Company’s Condensed Consolidated Statements of Cash Flow. The following
table sets forth a reconciliation of Free Cash Flow, a non-GAAP financial measure, to Net cash provided by operating
activities, which the Company believes to be the GAAP financial measure most directly comparable to Free Cash Flow, as
well as information regarding Net cash used in investing activities and Net cash used in financing activities.
Three Months Ended
March 31,
2016 2015
Net cash provided by operating activities $ 522 $ 625
Plus: Net cash used in discontinued operations 2 3
Net cash provided by continuing operating activities 524 628
Less: Additions to property, plant and mine development (297) (284)
Free Cash Flow $ 227 $ 344
Net cash used in investing activities (1) $ (111) $ (214)
Net cash used in financing activities $ (738) $ (196)
(1) Net cash used in investing activities includes Additions to property, plant and mine development, which is included in the Company’s
computation of Free Cash Flow
Newmont Mining Corporation I BAML Metals & Mining Conference I slide 51 May 2016
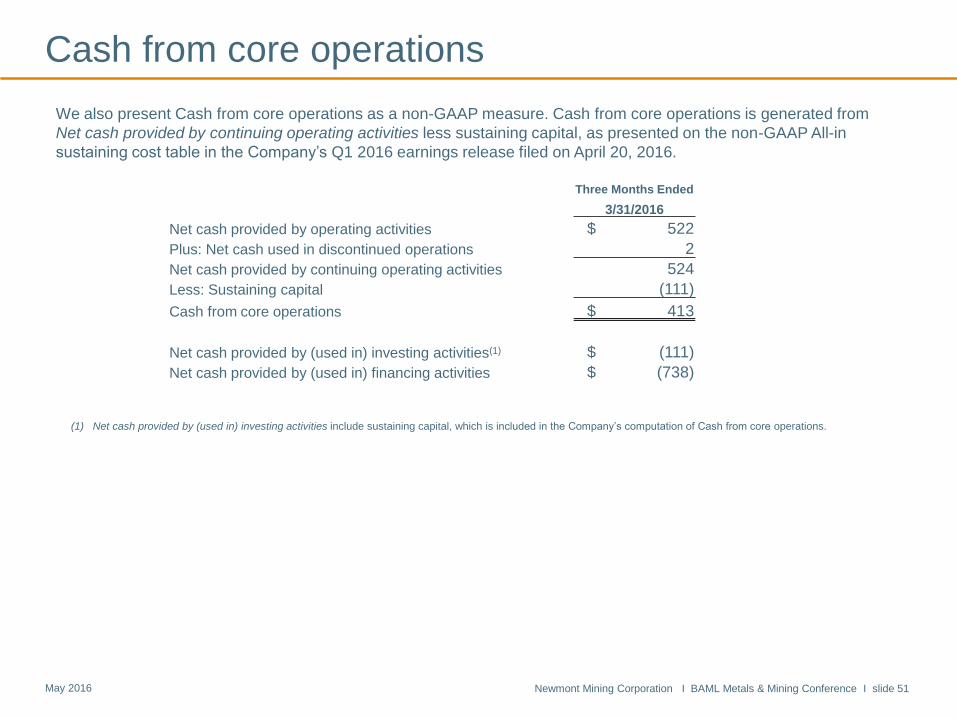
We also present Cash from core operations as a non-GAAP measure. Cash from core operations is generated from
Net cash provided by continuing operating activities less sustaining capital, as presented on the non-GAAP All-in
sustaining cost table in the Company’s Q1 2016 earnings release filed on April 20, 2016.
Cash from core operations
(1) Net cash provided by (used in) investing activities include sustaining capital, which is included in the Company’s computation of Cash from core operations.
Three Months Ended
3/31/2016
Net cash provided by operating activities $ 522
Plus: Net cash used in discontinued operations 2
Net cash provided by continuing operating activities 524
Less: Sustaining capital (111)
Cash from core operations $ 413
Net cash provided by (used in) investing activities(1) $ (111)
Net cash provided by (used in) financing activities $ (738)
Newmont Mining Corporation I BAML Metals & Mining Conference I slide 52 May 2016
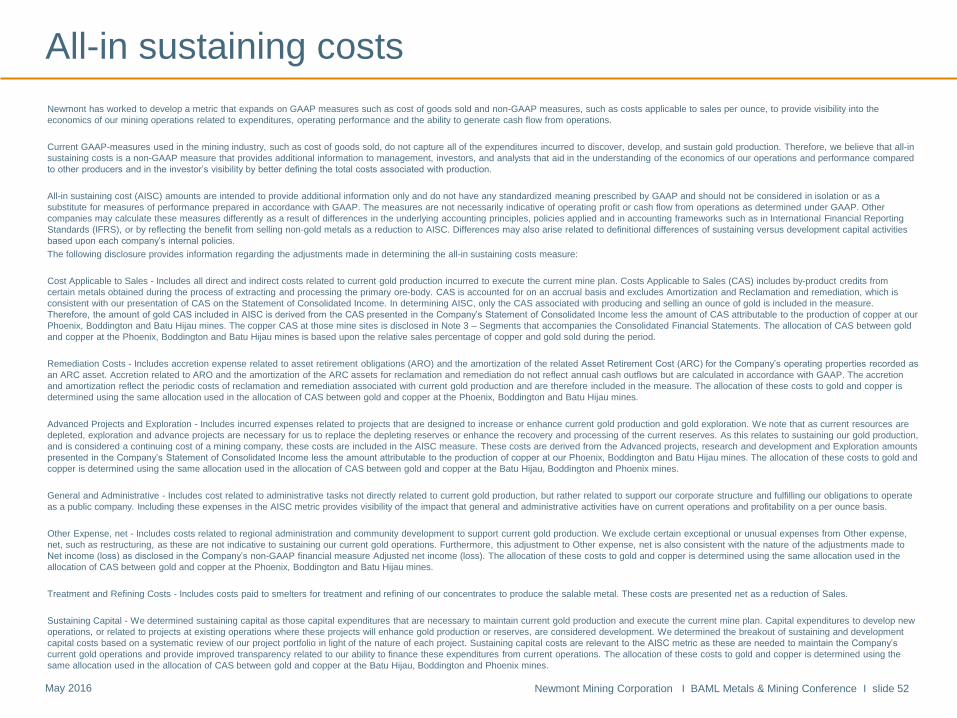
Newmont has worked to develop a metric that expands on GAAP measures such as cost of goods sold and non-GAAP measures, such as costs applicable to sales per ounce, to provide visibility into the
economics of our mining operations related to expenditures, operating performance and the ability to generate cash flow from operations.
Current GAAP-measures used in the mining industry, such as cost of goods sold, do not capture all of the expenditures incurred to discover, develop, and sustain gold production. Therefore, we believe that all-in
sustaining costs is a non-GAAP measure that provides additional information to management, investors, and analysts that aid in the understanding of the economics of our operations and performance compared
to other producers and in the investor’s visibility by better defining the total costs associated with production.
All-in sustaining cost (AISC) amounts are intended to provide additional information only and do not have any standardized meaning prescribed by GAAP and should not be considered in isolation or as a
substitute for measures of performance prepared in accordance with GAAP. The measures are not necessarily indicative of operating profit or cash flow from operations as determined under GAAP. Other
companies may calculate these measures differently as a result of differences in the underlying accounting principles, policies applied and in accounting frameworks such as in International Financial Reporting
Standards (IFRS), or by reflecting the benefit from selling non-gold metals as a reduction to AISC. Differences may also arise related to definitional differences of sustaining versus development capital activities
based upon each company’s internal policies.
The following disclosure provides information regarding the adjustments made in determining the all-in sustaining costs measure:
Cost Applicable to Sales - Includes all direct and indirect costs related to current gold production incurred to execute the current mine plan. Costs Applicable to Sales (CAS) includes by-product credits from
certain metals obtained during the process of extracting and processing the primary ore-body. CAS is accounted for on an accrual basis and excludes Amortization and Reclamation and remediation, which is
consistent with our presentation of CAS on the Statement of Consolidated Income. In determining AISC, only the CAS associated with producing and selling an ounce of gold is included in the measure.
Therefore, the amount of gold CAS included in AISC is derived from the CAS presented in the Company’s Statement of Consolidated Income less the amount of CAS attributable to the production of copper at our
Phoenix, Boddington and Batu Hijau mines. The copper CAS at those mine sites is disclosed in Note 3 – Segments that accompanies the Consolidated Financial Statements. The allocation of CAS between gold
and copper at the Phoenix, Boddington and Batu Hijau mines is based upon the relative sales percentage of copper and gold sold during the period.
Remediation Costs - Includes accretion expense related to asset retirement obligations (ARO) and the amortization of the related Asset Retirement Cost (ARC) for the Company’s operating properties recorded as
an ARC asset. Accretion related to ARO and the amortization of the ARC assets for reclamation and remediation do not reflect annual cash outflows but are calculated in accordance with GAAP. The accretion
and amortization reflect the periodic costs of reclamation and remediation associated with current gold production and are therefore included in the measure. The allocation of these costs to gold and copper is
determined using the same allocation used in the allocation of CAS between gold and copper at the Phoenix, Boddington and Batu Hijau mines.
Advanced Projects and Exploration - Includes incurred expenses related to projects that are designed to increase or enhance current gold production and gold exploration. We note that as current resources are
depleted, exploration and advance projects are necessary for us to replace the depleting reserves or enhance the recovery and processing of the current reserves. As this relates to sustaining our gold production,
and is considered a continuing cost of a mining company, these costs are included in the AISC measure. These costs are derived from the Advanced projects, research and development and Exploration amounts
presented in the Company’s Statement of Consolidated Income less the amount attributable to the production of copper at our Phoenix, Boddington and Batu Hijau mines. The allocation of these costs to gold and
copper is determined using the same allocation used in the allocation of CAS between gold and copper at the Batu Hijau, Boddington and Phoenix mines.
General and Administrative - Includes cost related to administrative tasks not directly related to current gold production, but rather related to support our corporate structure and fulfilling our obligations to operate
as a public company. Including these expenses in the AISC metric provides visibility of the impact that general and administrative activities have on current operations and profitability on a per ounce basis.
Other Expense, net - Includes costs related to regional administration and community development to support current gold production. We exclude certain exceptional or unusual expenses from Other expense,
net, such as restructuring, as these are not indicative to sustaining our current gold operations. Furthermore, this adjustment to Other expense, net is also consistent with the nature of the adjustments made to
Net income (loss) as disclosed in the Company’s non-GAAP financial measure Adjusted net income (loss). The allocation of these costs to gold and copper is determined using the same allocation used in the
allocation of CAS between gold and copper at the Phoenix, Boddington and Batu Hijau mines.
Treatment and Refining Costs - Includes costs paid to smelters for treatment and refining of our concentrates to produce the salable metal. These costs are presented net as a reduction of Sales.
Sustaining Capital - We determined sustaining capital as those capital expenditures that are necessary to maintain current gold production and execute the current mine plan. Capital expenditures to develop new
operations, or related to projects at existing operations where these projects will enhance gold production or reserves, are considered development. We determined the breakout of sustaining and development
capital costs based on a systematic review of our project portfolio in light of the nature of each project. Sustaining capital costs are relevant to the AISC metric as these are needed to maintain the Company’s
current gold operations and provide improved transparency related to our ability to finance these expenditures from current operations. The allocation of these costs to gold and copper is determined using the
same allocation used in the allocation of CAS between gold and copper at the Batu Hijau, Boddington and Phoenix mines.
All-in sustaining costs

Newmont Mining Corporation I BAML Metals & Mining Conference I slide 53 May 2016
(1) Excludes Depreciation and
amortization and Reclamation and
remediation.
(2) Includes by-product credits of $20.
(3) Includes stockpile and leach pad
inventory adjustments of $28 at
Yanacocha, $20 at Carlin, and $2 at Twin
Creeks.
(4) Remediation costs include accretion of
$23 and amortization of asset retirement
costs of $11.
(5) Other expense, net is adjusted for
restructuring costs of $13.
(6) Excludes development capital
expenditures, capitalized interest, and the
increase in accrued capital of $186. The
following are major development projects:
Merian, Long Canyon, Tanami Expansion
project and the CC&V expansion project.
(7) On August 3, 2015, the Company
acquired the CC&V gold mining business.
All-in sustaining costs
Advanced Treatment All-In Costs Projects General Other and All-In Ounces Sustaining Three Months Ended Applicable Reclamation and and Expense, Refining Sustaining Sustaining (000)/Pounds Costs per March 31, 2016 to Sales
(1)(2)(3) Costs
(4) Exploration Administrative Net
(5) Costs Capital
(6) Costs (millions) Sold oz/lb
Gold Carlin $ 189 $ 1 $ 3 $ 1 $ — $ — $ 32 $ 226 208 $ 1,087 Phoenix 49 1 — — — 3 2 55 53 1,038 Twin Creeks 60 1 2 — — — 6 69 136 507 CC&V
(7) 33 1 3 — — — — 37 55 673
Other North America — — 7 — 2 — — 9 — —
North America 331 4 15 1 2 3 40 396 452 876
Yanacocha 128 14 9 3 1 — 14 169 179 944 Merian — — 3 — — — — 3 — — Other South America — — 6 2 — — — 8 — —
South America 128 14 18 5 1 — 14 180 179 1,006
Boddington 111 1 — — — 4 9 125 163 767 Tanami 59 1 3 — — — 14 77 101 762 Kalgoorlie 65 1 1 — — 1 3 71 88 807 Batu Hijau 100 3 1 3 — 12 4 123 236 521 Other Asia Pacific — — 1 3 1 — — 5 — —
Asia Pacific 335 6 6 6 1 17 30 401 588 682
Ahafo 57 2 5 — — — 10 74 87 851 Akyem 55 2 1 — — — 7 65 115 565 Other Africa — — 1 1 — — — 2 — —
Africa 112 4 7 1 — — 17 141 202 698
Corporate and Other — — 12 43 1 — 2 58 — —
Total Gold $ 906 $ 28 $ 58 $ 56 $ 5 $ 20 $ 103 $ 1,176 1,421 $ 828
Copper Phoenix $ 22 $ 1 $ — $ — $ — $ 1 $ 1 $ 25 10 $ 2.50 Boddington 23 — — — — 3 2 28 15 1.87 Batu Hijau 130 5 — 1 — 28 5 169 142 1.19
Asia Pacific 153 5 — 1 — 31 7 197 157 1.25
Total Copper $ 175 $ 6 $ — $ 1 $ — $ 32 $ 8 $ 222 167 $ 1.33
Consolidated $ 1,081 $ 34 $ 58 $ 57 $ 5 $ 52 $ 111 $ 1,398
Newmont Mining Corporation I BAML Metals & Mining Conference I slide 54 May 2016
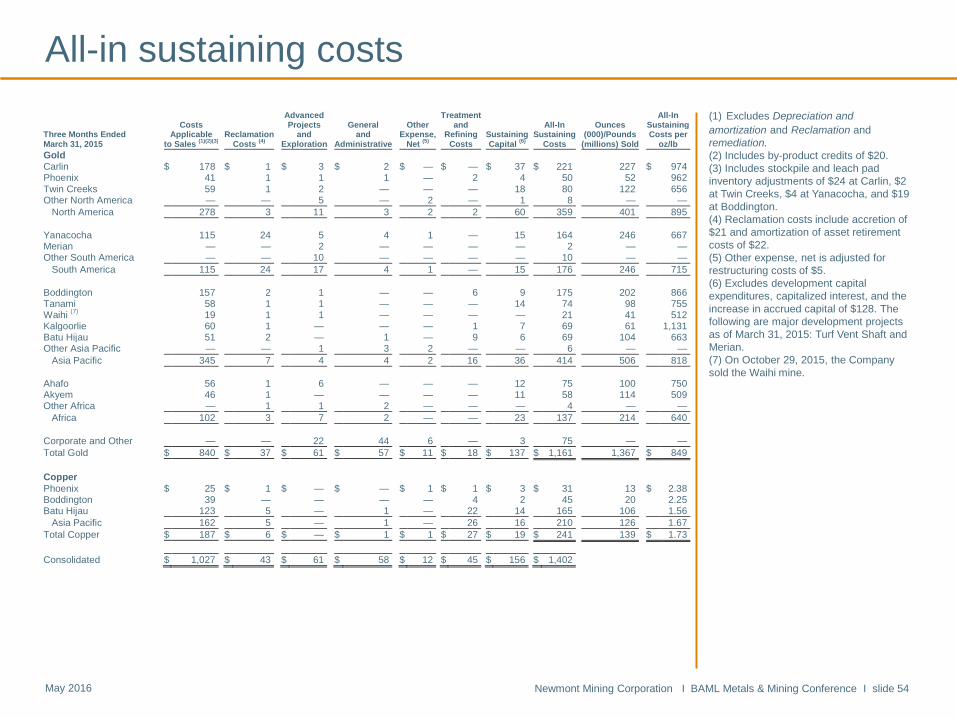
All-in sustaining costs
(1) Excludes Depreciation and
amortization and Reclamation and
remediation.
(2) Includes by-product credits of $20.
(3) Includes stockpile and leach pad
inventory adjustments of $24 at Carlin, $2
at Twin Creeks, $4 at Yanacocha, and $19
at Boddington.
(4) Reclamation costs include accretion of
$21 and amortization of asset retirement
costs of $22.
(5) Other expense, net is adjusted for
restructuring costs of $5.
(6) Excludes development capital
expenditures, capitalized interest, and the
increase in accrued capital of $128. The
following are major development projects
as of March 31, 2015: Turf Vent Shaft and
Merian.
(7) On October 29, 2015, the Company
sold the Waihi mine.
Advanced Treatment All-In Costs Projects General Other and All-In Ounces Sustaining Three Months Ended Applicable Reclamation and and Expense, Refining Sustaining Sustaining (000)/Pounds Costs per March 31, 2015 to Sales
(1)(2)(3) Costs
(4) Exploration Administrative Net
(5) Costs Capital
(6) Costs (millions) Sold oz/lb
Gold Carlin $ 178 $ 1 $ 3 $ 2 $ — $ — $ 37 $ 221 227 $ 974 Phoenix 41 1 1 1 — 2 4 50 52 962 Twin Creeks 59 1 2 — — — 18 80 122 656 Other North America — — 5 — 2 — 1 8 — —
North America 278 3 11 3 2 2 60 359 401 895
Yanacocha 115 24 5 4 1 — 15 164 246 667 Merian — — 2 — — — — 2 — — Other South America — — 10 — — — — 10 — —
South America 115 24 17 4 1 — 15 176 246 715
Boddington 157 2 1 — — 6 9 175 202 866 Tanami 58 1 1 — — — 14 74 98 755 Waihi
(7) 19 1 1 — — — — 21 41 512
Kalgoorlie 60 1 — — — 1 7 69 61 1,131 Batu Hijau 51 2 — 1 — 9 6 69 104 663 Other Asia Pacific — — 1 3 2 — — 6 — —
Asia Pacific 345 7 4 4 2 16 36 414 506 818
Ahafo 56 1 6 — — — 12 75 100 750 Akyem 46 1 — — — — 11 58 114 509 Other Africa — 1 1 2 — — — 4 — —
Africa 102 3 7 2 — — 23 137 214 640
Corporate and Other — — 22 44 6 — 3 75 — —
Total Gold $ 840 $ 37 $ 61 $ 57 $ 11 $ 18 $ 137 $ 1,161 1,367 $ 849
Copper Phoenix $ 25 $ 1 $ — $ — $ 1 $ 1 $ 3 $ 31 13 $ 2.38 Boddington 39 — — — — 4 2 45 20 2.25 Batu Hijau 123 5 — 1 — 22 14 165 106 1.56
Asia Pacific 162 5 — 1 — 26 16 210 126 1.67
Total Copper $ 187 $ 6 $ — $ 1 $ 1 $ 27 $ 19 $ 241 139 $ 1.73
Consolidated $ 1,027 $ 43 $ 61 $ 58 $ 12 $ 45 $ 156 $ 1,402

Newmont Mining Corporation I BAML Metals & Mining Conference I slide 55 May 2016
All-in sustaining costs
(1) Excludes Depreciation and
amortization and Reclamation and
remediation.
(2) Includes by-product credits of $73.
(3) Includes stockpile and leach pad
inventory adjustments of $116 at Carlin,
$14 at Twin Creeks, $77 at Yanacocha
and $19 at Boddington.
(4) Remediation costs include accretion of
$76 and amortization of asset retirement
costs of $88.
(5) Other expense, net is adjusted for
restructuring and other costs of $34, the
Ghana investment agreement payment of
$27 and acquisition costs of $19.
(6) Excludes development capital
expenditures, capitalized interest, and the
increase in accrued capital of $655. The
following are major development projects:
Merian, Turf Vent Shaft, Long Canyon and
the CC&V expansion project.
(7) The Company acquired the CC&V gold
mining business on August 3, 2015
(8) On October 29, 2015, The Company
sold the Waihi mine.
Advanced Treatment All-In
Costs Projects General Other and All-In Ounces Sustaining Year Ended Applicable Remediation and and Expense, Refining Sustaining Sustaining (000)/Pounds Costs per
December 31, 2015 to Sales (1)(2)(3)
Costs (4)
Exploration Administrative Net (5)
Costs Capital (6)
Costs (millions) Sold oz/lb GOLD Carlin $ 788 $ 4 $ 16 $ — $ 9 $ — $ 188 $ 1,005 886 $ 1,134 Phoenix 163 4 2 — 3 8 15 195 199 980 Twin Creeks 246 4 8 — 4 — 47 309 473 653 CC&V
(7) 44 2 3 — — — 7 56 82 683
Other North America — — 30 — 3 — 8 41 — — North America 1,241 14 59 — 19 8 265 1,606 1,640 979
Yanacocha 555 97 37 — 27 — 97 813 924 880 Other South America — — 46 — 6 — — 52 — —
South America 555 97 83 — 33 — 97 865 924 936 Boddington 569 9 2 — 1 24 47 652 816 799 Tanami 223 3 7 — 3 — 78 314 434 724 Waihi
(8) 54 2 3 — 1 — 3 63 116 543
Kalgoorlie 272 5 3 — 1 5 21 307 318 965 Batu Hijau 274 9 3 1 12 39 48 386 625 618 Other Asia Pacific — — 5 2 29 — 6 42 — —
Asia Pacific 1,392 28 23 3 47 68 203 1,764 2,309 764 Ahafo 204 7 24 — 4 — 57 296 332 892 Akyem 205 6 8 — 7 — 44 270 472 572 Other Africa — — 2 — 9 — — 11 — —
Africa 409 13 34 — 20 — 101 577 804 718 Corporate and Other — — 84 179 12 — 10 285 — — Total Gold $ 3,597 $ 152 $ 283 $ 182 $ 131 $ 76 $ 676 $ 5,097 5,677 $ 898
COPPER Phoenix $ 91 $ 3 $ 1 $ — $ 1 $ 3 $ 9 $ 108 47 $ 2.30 Boddington 140 2 1 — — 15 11 169 82 2.06
Batu Hijau 484 18 4 1 9 92 50 658 460 1.43 Asia Pacific 624 20 5 1 9 107 61 827 542 1.53
Total Copper $ 715 $ 23 $ 6 $ 1 $ 10 $ 110 $ 70 $ 935 589 $ 1.59
Consolidated $ 4,312 $ 175 $ 289 $ 183 $ 141 $ 186 $ 746 $ 6,032

Newmont Mining Corporation I BAML Metals & Mining Conference I slide 56 May 2016
All-in sustaining costs
(1) Excludes Depreciation and
amortization and Reclamation and
remediation.
(2) Includes by-product credits of $85.
(3) Includes stockpile and leach pad
inventory adjustments of $127 at Carlin,
$13 at Phoenix, $15 at Twin Creeks, $75
at Yanacocha, $69 at Boddington and
$191 at Batu Hijau.
(4) Remediation costs include accretion of
$76 and amortization of asset retirement
costs of $95.
(5) Other expense, net is adjusted for
restructuring costs of $40.
(6) Excludes development capital
expenditures, capitalized interest, and the
decrease in accrued capital, totaling $300.
The following are major development
projects: Turf Vent Shaft, Merian,
Correnso and Conga.
(7) On July 1, 2014, the Company sold the
Jundee mine. On October 6, 2014, the
Company sold its 44% interest in La
Herradura. On October 29, 2015, the
Company sold the Waihi mine.
Advanced Treatment All-In Costs Projects General Other and All-In Ounces Sustaining Year Ended Applicable Remediation and and Expense, Refining Sustaining Sustaining (000)/Pounds Costs per December 31, 2014 to Sales
(1)(2)(3) Costs
(4) Exploration Administrative Net
(5) Costs Capital
(6) Costs (millions) Sold oz/lb
GOLD Carlin $ 795 $ 4 $ 22 $ — $ 8 $ — $ 141 $ 970 905 $ 1,072 Phoenix 160 3 4 — 3 9 17 196 222 883 Twin Creeks 207 2 5 — 3 — 111 328 400 820 La Herradura
(7) 89 2 12 — — — 21 124 119 1,042
Other North America — — 25 — 6 — 9 40 — — North America 1,251 11 68 — 20 9 299 1,658 1,646 1,007
Yanacocha 663 101 32 — 35 — 80 911 966 943 Other South America — — 41 — 2 — — 43 — —
South America 663 101 73 — 37 — 80 954 966 988 Boddington 585 11 — — 2 4 69 671 690 972 Tanami 251 4 10 — 2 — 91 358 345 1,038 Jundee
(7) 85 5 1 — 2 — 15 108 140 771
Waihi (7)
76 3 7 — 2 — 2 90 131 687 Kalgoorlie 284 4 5 — 1 4 32 330 327 1,009 Batu Hijau 81 3 — — 4 9 8 105 72 1,458 Other Asia Pacific — — 5 3 21 — 6 35 — —
Asia Pacific 1,362 30 28 3 34 17 223 1,697 1,705 995 Ahafo 249 8 27 — 6 — 92 382 450 849 Akyem 172 3 — — 8 — 17 200 473 423 Other Africa — — 8 — 7 — — 15 — —
Africa 421 11 35 — 21 — 109 597 923 647 Corporate and Other — — 116 182 31 — 17 346 — — Total Gold $ 3,697 $ 153 $ 320 $ 185 $ 143 $ 26 $ 728 $ 5,252 5,240 $ 1,002
COPPER Phoenix $ 108 $ 1 $ 2 $ — $ 1 $ 5 $ 13 $ 130 46 $ 2.83 Boddington 158 2 — — 1 25 18 204 66 3.09 Batu Hijau 494 15 3 1 20 45 51 629 152 4.14
Asia Pacific 652 17 3 1 21 70 69 833 218 3.82 Total Copper $ 760 $ 18 $ 5 $ 1 $ 22 $ 75 $ 82 $ 963 264 $ 3.65
Consolidated $ 4,457 $ 171 $ 325 $ 186 $ 165 $ 101 $ 810 $ 6,215
Newmont Mining Corporation I BAML Metals & Mining Conference I slide 57 May 2016
Endnotes
Investors are encouraged to read the information contained in this presentation in conjunction with the following notes, the Cautionary Statement on slide 2 and the factors described under the “Risk Factors”
section of the Company’s Form 10-K, filed with the SEC on or about February 17, 2016, and disclosure in the Company’s recent SEC filings.
1. EBITDA is a non-GAAP financial measure calculated as Earnings before interest, taxes and depreciation and amortization. The EBITDA figures used in this presentation were calculated by Capital IQ. For
management’s EBITDA calculations and reconciliation to the nearest GAAP metric, please see slide 49 for more information. Adjusted EBITDA is also a non-GAAP metric. Please refer also to slide 49 for
a reconciliation of Adjusted EBITDA to the nearest GAAP metric.
2. Full potential savings used in this presentation, unless otherwise noted, represent cumulative incremental value realized as a result of Full Potential projects implemented from 2012 through 2015. Figures
compare actual baseline to actual normalized cash flows. Higher NPV as used in this presentation represent cumulative net present value improvements implemented in mine planning from 2013 through
2015.
3. Historical AISC or All-in sustaining cost is a non-GAAP metric. See slides 52 to 56 for more information and a reconciliation to the nearest GAAP metric. All-in sustaining cost (“AISC”) as used in the
Company’s Outlook is a non-GAAP metric defined as the sum of cost applicable to sales (including all direct and indirect costs related to current gold production incurred to execute on the current mine
plan), remediation costs (including operating accretion and amortization of asset retirement costs), G&A, exploration expense, advanced projects and R&D, treatment and refining costs, other expense, net
of one-time adjustments and sustaining capital. See also note 6 below.
4. ROCE is a non-GAAP metric and utilizes rolling 12 month earnings before interest and taxes (EBIT) over capital employed less cash and equivalents. Competitor average is weighted based on market
capitalization (February 23, 2016).
5. Free cash flow is a non-GAAP metric and is generated from Net cash provided from continuing operations less Additions to property, plant and mine development. See slide 50 for more information and for
a reconciliation to the nearest GAAP metric
6. Outlook projections used in this presentation are considered “forward-looking statements” and represent management’s good faith estimates or expectations of future production results as of April 20, 2016.
Outlook is based upon certain assumptions, including, but not limited to, metal prices, oil prices, certain exchange rates and other assumptions. For example, Outlook assumes $1,100/oz Au, $2.50/lb Cu,
$0.75 USD/AUD exchange rate and $65/barrel WTI. AISC and CAS cost estimates do not include inflation. Production, AISC and capital estimates exclude projects that have not yet been approved (NW
Exodus, Twin Underground, Batu Phase 7, Ahafo Mill Expansion and Subika Underground). The potential impact on inventory valuation as a result of lower prices, input costs, and project decisions are not
included as part of this Outlook. Long term ranges (2018 – 2020) for production, AISC and capital provided in this presentation represent 3-year averages. Scheduled debt prepayments exclude capital
leases. Such assumptions may prove to be incorrect and actual results may differ materially from those anticipated. Consequently, Outlook cannot be guaranteed. As such, investors are cautioned not to
place undue reliance upon Outlook and forward-looking statements as there can be no assurance that the plans, assumptions or expectations upon which they are placed will occur.
7. U.S. investors are reminded that reserves were prepared in compliance with Industry Guide 7 published by the SEC. Whereas, the term resource, measured resource, indicated resources and inferred
resources are not SEC recognized terms. Newmont has determined that such resources would be substantively the same as those prepared using the Guidelines established by the Society of Mining,
Metallurgy and Exploration and defined as Mineral Resource. Estimates of resources are subject to further exploration and development, are subject to additional risks, and no assurance can be given that
they will eventually convert to future reserves. Inferred resources, in particular, have a great amount of uncertainty as to their existence and their economic and legal feasibility. Investors are cautioned not
to assume that any part or all of the inferred resource exists, or is economically or legally mineable. Inventory and upside potential have a greater amount of uncertainty. Investors are cautioned that drill
results illustrated in certain graphics in this presentation are not necessarily indicative of future results or future production. Even if significant mineralization is discovered and converted to reserves, during
the time necessary to ultimately move such mineralization to production the economic and legal feasibility of production may change. As such, investors are cautioned against relying upon those estimates.
For more information regarding the Company’s reserves, see the Company’s Annual Report filed with the SEC on February 17, 2016 for the Proven and Probable Reserve tables prepared in compliance
with the SEC’s Industry Guide 7, which is available at www.sec.gov or on the Company’s website. Investors are further reminded that the reserve and resource estimates used in this presentation are
estimates as of December 31, 2015.
8. Cash from core operations is a non-GAAP metric and is generated from Net cash provided by continuing operating activities less sustaining capital on April 20, 2016. See slide 51 for more information and
reconciliation to the nearest GAAP metric.
9. Estimated debt payment opportunities over the period, which remain subject to change depending on certain variables and the needs of the business. See also endnote 6.