bancanalysts association of boston conference€¦ · tim sloan, president and chief executive...
TRANSCRIPT

BancAnalysts Association of Boston Conference
Tim Sloan, President and Chief Executive Officer Mary Mack, Head of Community Banking
November 3, 2016
© 2016 Wells Fargo & Company. All rights reserved.

Wells Fargo Vision
“We want to satisfy our customers’
financial needs and help them succeed
financially.”
1

Retail Banking sales practices
Summary of Actions to Take Accountability and Move Forward
� Refunded $2.6 million to customers for any fees incurred by the potentially unauthorized deposit and credit card accounts
� Removed product sales goals in the retail banking business, effective 10/1/16
� Instituted mystery shopper program with a targeted 15,000-20,000 annual branch visits
� Implemented procedures to send automated emails to customers after a checking or savings account is opened
� Transitioned a number of control functions out of the lines of business (transition of HR and Finance complete; Compliance and Operational Risk underway)
� Voluntarily expanded the scope of our customer account review and remediation to include 2009 and 2010; these account reviews are currently underway with the independent consulting firm PwC
– Original PwC analysis covered May 2011 to mid-2015; Consent orders require us to conduct the account analysis into the first part of 2011 and past mid-2015 through the effective date of the Consent Orders (September 2016)
� Wells Fargo’s Independent Directors announced the retention of law firm Shearman & Sterling to assist in the independent investigation of our retail banking sales practices and related matters
2

Frequent questions
� When will you be providing updated customer activity trends?
� Do you have an update on your calling program to impacted credit card customers?
� What did you mean by “things will get worse before they get better”?
� When will the review of the 2009-2010 data be completed?
� When will the Board’s independent investigation be completed?
3

3Q16 Results 3Q16 Results

3Q16 Results
5,796 5,558 5,644
3Q15 2Q16 3Q16 Diluted earnings per common share
Wells Fargo Net Income($ in millions, except EPS)
$1.05
$1.01 $1.03
� 3Q16 earnings of $5.6 billion and diluted earnings per common share of $1.03
� Revenue growth of 2% year-over-year (YoY)
� Solid balance sheet growth
� Continued strength in credit
� Capital levels remained strong while continuing to return capital to shareholders
5

Diversified loan portfolio and fee generation
9/30/16 Loan Portfolio Diversified Fee Generation (% of noninterest income) Other revolving credit and All Other Noninterest Income installment Lease Income
1% Net gains from Equity Investments
$961 billion
1% Net Gains on Debt Securities Automobile
Net gains from Trading Credit card
Insurance junior lien
Real estate 1-4
Commercial andmortgage Industrial
Mortgage Orig./ Brokerage Advisory,Sales, net Commissions and Other
Real estate 1-4 family first
mortgage Mortgage Servicing, net
Wire Remittance and All other Fees 1% Letters of Credit Fees CRE mortgage 1% CRE Brokerage Commissions
1% Cash Network Lease financing CRE construction Charges and Fees on Loans Investment BankingCard Fees
5% 3% 13%
23%
8%
4%10% 3%
3%
3%
13%
Trust and Investment
3% 4%
Management
Deposit Service Charges
$10.4 billion
Consumer Loans 48%
Commercial Loans 52%
Deposit Service Charges 13%
Total Trust & Investment Fees 35%
Card Fees 10%
Total Other Fees 9%
Total Mortgage Banking 16%
Insurance 3%
Net Gains from Trading 4%
Net Gains on Debt Securities 1%
Net Gains from Equity Inv. 1%
Lease Income 5%
All Other Noninterest Income 3%
6

Strong loan growth
10.4%
7.6% 7.0%
2.6% 2.0% 2.0%
JPM USB WFC BAC C PNC
895.1 950.8 957.5
3Q15 2Q16 3Q16 Total average loan yield
3Q16 vs. 3Q15 Average Loan Growth vs. Peers (Source: SNL)
Average Loans($ in billions)
4.11% 4.16% 4.17%
� Total average loans of $957.5 billion up $62.4 billion, or 7%, YoY and $6.7 billion, or 1%, linked quarter (LQ)
- Commercial loans up $51.2 billion YoY - Consumer loans up $11.2 billion YoY
� Total average loan yield of 4.17%, up 1 bp LQ
7

Deposit growth while maintaining pricing discipline
857.0 883.7 898.4
341.9 353.0 363.1
1,198.9 1,236.7 1,261.5
3Q15 2Q16 3Q16
Noninterest-bearing deposits Interest-bearing deposits Average deposit cost
Average Deposits and Rates($ in billions)
3Q16 vs. 3Q15 Average Deposit Growth vs. Peers (Source: SNL)
0.08% 0.11% 0.11%
10.0%
5.9% 5.3% 5.2%
4.6%
3.7%
� Average deposits up $62.6 billion, or 5%, YoY and $24.8 billion, or 2%, LQ
- Noninterest-bearing deposits up $21.2 billion, or 6%, YoY and $10.1 billion, or 3%, LQ
- Interest-bearing deposits up $41.4 billion, or 5%, YoY and $14.7 billion, or 2%, LQ
� Average deposit cost of 11 bps, stable LQ and up 3 bps YoY driven by commercial deposit pricing
� Consumer and small business banking deposits (1) of $739.1 billion, up 8% YoY and 2% LQ
USB BAC JPM WFC C PNC (1) Total deposits excluding mortgage escrow and wholesale deposits.
8

Revenue growth despite challenging rate environment
11,457 11,733 11,952
10,418 10,429 10,376
21,875 22,162 22,328
3Q15 2Q16 3Q16
Net Interest Income Noninterest Income
Revenue ($ in millions)
3Q16 Revenue / Average Assets vs. Peers (Source: SNL)
4.8% 4.6% 4.2% 4.0% 3.9% 3.9%
� Total revenue up 2% YoY and 1% LQ � Net interest income up $495 million, or
4%, YoY and up $219 million, or 2%, LQ reflecting earning asset growth and one additional day in the quarter which contributed ~$73 million
- Average earning assets up 3%, LQ - NIM of 2.82% down 4 bps from 2Q16
primarily driven by growth in long-term debt and deposits, partially offset by the benefit of earning asset growth
� Noninterest income down $42 million YoY as lower market-sensitive revenues were partially offset by:
- Mortgage banking up 5%
- Card fees up 5%
- Deposit service charges up 3%
USB WFC PNC JPM BAC C
9

Continued solid credit quality
0.29% 0.33% 0.39%
0.46% 0.51%
0.95%
PNC WFC BAC USB JPM C
3Q16 Net Charge-off Rate vs. Peers (Source: SNL)
Provision Expense and Net Charge-offs ($ in millions)
1,086 1,074
703 831 805
703
831 886 924
805
0.31% 0.36% 0.38% 0.39% 0.33%
3Q15 4Q15 1Q16 2Q16 3Q16 Provision Expense Net Charge-offs Net Charge-off Rate
� Net charge-offs of $805 million, down $119 million, or 13%, LQ on lower oil and gas, credit card and consumer real estate losses and continued commercial real estate recoveries
� No reserve build (1) or release in 3Q16 � Nonperforming assets declined $1.1
billion LQ - Nonaccrual loans decreased $977 million
driven by a $732 million decline in consumer nonaccruals
� Early stage delinquencies in the consumer portfolio of 1.05%, up 2 bps LQ and down 12 bps YoY
(1) Reserve build represents the amount by which the provision for credit losses exceeds net charge-offs, while reserve release represents the amount by which net charge-offs exceed the provision for credit losses.
10
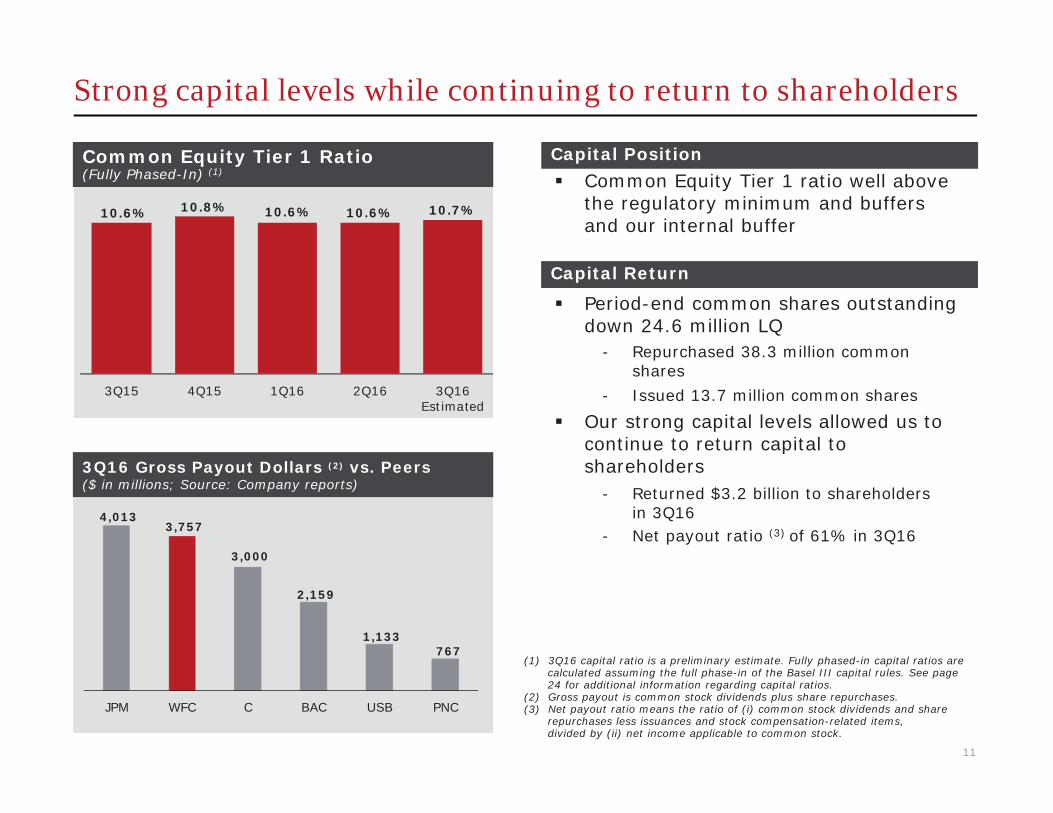
Strong capital levels while continuing to return to shareholders
Common Equity Tier 1 Ratio (Fully Phased-In) (1)
10.8% 10.6% 10.6% 10.7% 10.6%
3Q15 4Q15 1Q16 2Q16 3Q16 Estimated
3Q16 Gross Payout Dollars (2) vs. Peers ($ in millions; Source: Company reports)
4,013 3,757
3,000
2,159
1,133 767
JPM WFC C BAC USB PNC
Capital Position � Common Equity Tier 1 ratio well above
the regulatory minimum and buffers and our internal buffer
Capital Return
� Period-end common shares outstanding down 24.6 million LQ
- Repurchased 38.3 million common shares
- Issued 13.7 million common shares
� Our strong capital levels allowed us to continue to return capital to shareholders
- Returned $3.2 billion to shareholders in 3Q16
- Net payout ratio (3) of 61% in 3Q16
(1) 3Q16 capital ratio is a preliminary estimate. Fully phased-in capital ratios are calculated assuming the full phase-in of the Basel III capital rules. See page 24 for additional information regarding capital ratios.
(2) Gross payout is common stock dividends plus share repurchases. (3) Net payout ratio means the ratio of (i) common stock dividends and share
repurchases less issuances and stock compensation-related items, divided by (ii) net income applicable to common stock.
11

Performance targets remain at industry leading levels
54.9%
58.6% 59.4% 59.5%
62.3% 62.5%
USB JPM WFC C BAC PNC
13.5%
11.6% 10.2%
8.7% 7.3% 6.8%
USB WFC JPM PNC BAC C
1.36%
1.17% 1.10%
1.01% 0.90%
0.83%
USB WFC PNC JPM BAC C
Represents Wells Fargo target ranges set at 2016 Investor Day.
3Q16 ROA vs. Peers (Source: SNL)
3Q16 ROE vs. Peers (Source: Company reports)
3Q16 Efficiency Ratio (1) vs. Peers (Source: SNL)
77% 76% 69%
62%
45%
36%
JPM PNC USB WFC BAC C
2Q16 Net Payout Ratio vs. Peers(Source: Company reports)
Note: WFC 3Q16 net payout ratio was 61%.
(1) Efficiency ratio defined as noninterest expense divided by total revenue (net interest income plus noninterest income). Noninterest expense and our efficiency ratio may be affected by a variety of factors, including business and economic cyclicality, seasonality, changes in our business composition and operating environment, growth in our business and/or acquisitions, and unexpected expenses relating to, among other things, litigation and regulatory matters.
12

Near term priorities
Primary objective is to restore trust in Wells Fargo, including pride in our company and our vision.
� Continued engagement with all our stakeholders
� Addressing any weaknesses within Wells Fargo’s culture - Investigating concerns about our EthicsLine - Surveying team members to understand their views on our company’s approach to
ethics and integrity - Reviewing sales practices across the entire company, beyond the requirements of the
Consent Orders, to ensure that we are always doing what is right for our customers - Undertaking a third party culture review
� Continued transparency of business trends
� Assisting former team members who left retail banking due to sales performance and who remain eligible for rehire in identifying and applying for available positions
� Bringing together the entire company to restore trust in Wells Fargo
� Managing our balanced, diversified business model with a continued focus on our long-term success
13

Community Bank Update Community Bank Update

Frequent questions
� Why do you think you are the right person for this role?
� What do you think of the customer trends you have observed since the settlement announcement?
� What have you been focused on since you took over this role and what have you learned?
� How is the new retail banking compensation plan being structured?
� What are the near-term priorities for you and your team?
15

Professional background
� Broad mix of banking, brokerage/advisory and finance experience
� Served in a variety of roles, many of which frequently called for heavy collaboration
� Began career at the bank in 1984
� Retail banking experience from First Union, including holding the position of Regional President
� Most recent role was President and Head of Wells Fargo Advisors - Led a cultural change in that business - Helped lead the transformation to mobile and evolution of robo advisory
16

Retail Banking customer trends through September
� Customer Counts - Primary consumer checking customers in line with August - Primary consumer checking customers up 4.5% from September 2015 (YoY), but growth moderated
� Customer Traffic - Overall customer traffic to branches and call centers remained at levels typical for September
� Deposit Balance and Account Trends - Deposit balance growth was in-line with prior trends - Consumer checking account openings were down on lower referrals, marketing activity and product offerings - Customer-initiated closures of consumer checking accounts were up 1% from August, but down 2% YoY
(in millions, unless otherwise noted) Sept 2016
Aug 2016
Sept 2015
vs. Aug
2016 (1)
vs Sept 2015
Customer Counts Primary Consumer Checking Customers (2) 23.7 23.6 22.6 0% 4%
Primary Consumer Checking Customers YoY Growth (2) 4.5% 4.7% 5.7% Total Digital (Online and Mobile) Active Customers (3) 27.5 27.4 26.4 0% 4%
Customer Traffic Interactions (4)
Total Branch Interactions 53.8 56.2 55.4 -4% -3% Teller Transactions 50.5 52.4 51.6 -4% -2% Branch Banker Interactions 3.3 3.9 3.7 -14% -10%
Total Phone Banker Interactions 9.2 9.9 8.9 -7% 4% Total Digital (Online and Mobile) Secure Sessions 488.4 497.8 433.0 -2% 13%
Deposit Balance and Account Trends Consumer and Small Business Banking Deposits (Period end, $ in billions) 751.2 $ 744.7 $ 686.7 $ 1% 9% Consumer Checking Account Opens -30% -25% Consumer Checking Account Customer-Initiated Closures 1% -2%
New disclosures since 3Q16 earnings announcement on October 14, 2016. Percentage changes are calculated using whole numbers. If the % change were based on the rounded amounts presented, it would produce a different result for Branch banker interactions and Phone Banker Interactions, but all differences are attributable to rounding. (1) September 2016 had 21 business days, while August 2016 had 23 business days. (2) Customers who actively use their checking account with transactions such as debit card purchases, online bill payments, and direct deposit. (3) Primarily includes retail banking, consumer lending, small business and business banking customers. (4) A customer communication or transaction qualifies as a customer traffic interaction. It is consistent with the definition used by management for each of customer channel presented. Preparation of customer traffic interaction metrics requires the application of interpretive judgement for each communication or transaction. Management uses these metrics to monitor customer traffic trends within the company’s Retail Banking business.
17

What have you been focused on and what have you learned?
� Created and filled a new position, Change Leader for the Community Bank, to help define what great customer experience looks like and what changes are needed to reach that level
� Hired a new group risk officer
� Eliminated product sales goals in the retail banking business
� Participating in listening tours (15 cities with over 1,500 team members)
� Increased communication to the team
18

What is the new compensation plan going to look like?
2016 Actions
� Eliminated product sales goals October 1st
� For the fourth quarter, shifted the weight assigned to sales to customer experience
� In an effort to build team member trust, 4th quarter incentives will be the higher of:
1) the average of first three quarters’ results or 2) the payout calculated under the customer experience metric established
for the fourth quarter
19
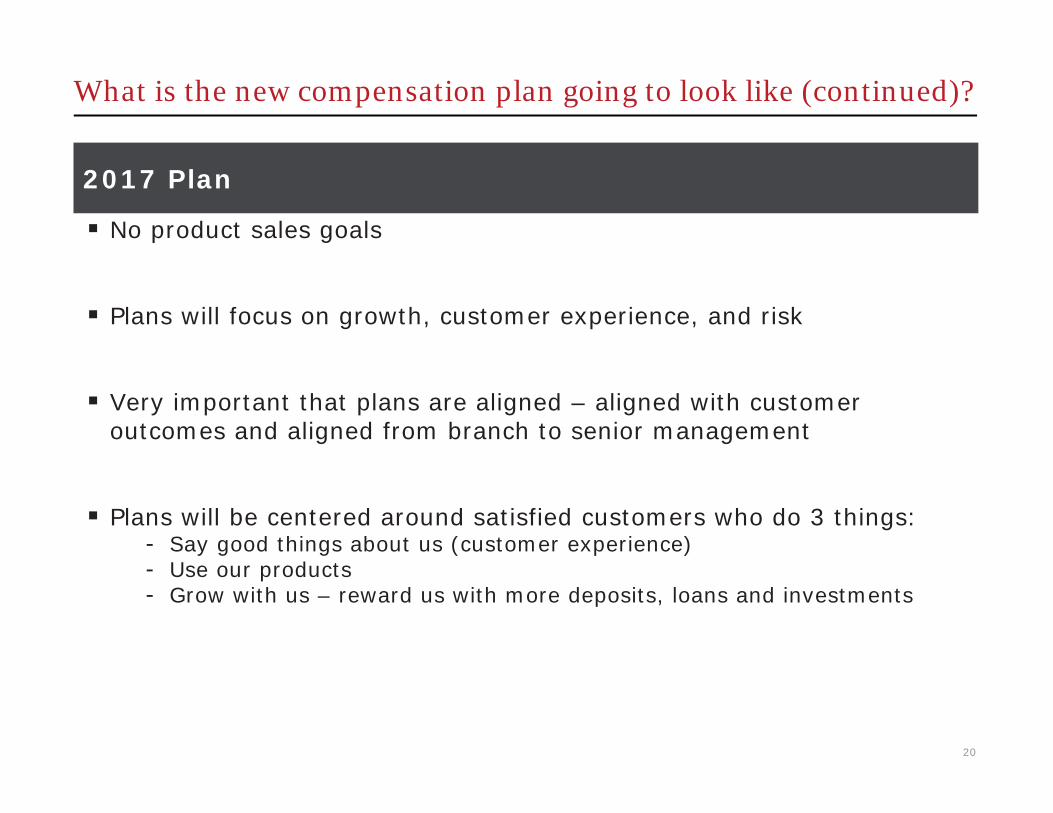
What is the new compensation plan going to look like (continued)?
2017 Plan
� No product sales goals
� Plans will focus on growth, customer experience, and risk
� Very important that plans are aligned – aligned with customer outcomes and aligned from branch to senior management
� Plans will be centered around satisfied customers who do 3 things: - Say good things about us (customer experience) - Use our products - Grow with us – reward us with more deposits, loans and investments
20

What are your near term priorities?
� Finalize compensation plans for 2017
� Determine the vision and strategy for achieving best in class customer interactions with a focus on:
- customer experience - deepening relationships - enhanced coaching for our team members
� Outbound calling effort to customers
� Accelerate delivery of new technology/mobile enhancements
� Increased communication and emphasis on escalation/raise your hand
� Continue increased monitoring, improvements to complaints and ethics line processes
� Continuing work on strategy for the future
21

22

Appendix Appendix

Common Equity Tier 1 (Fully Phased-In)
Wells Fargo & Company and Subsidiaries COMMON EQUITY TIER 1 UNDER BASEL III (FULLY PHASED-IN) (1)
Estimated Sep 30, Jun 30, Mar 31, Dec 31, Sep 30,
(in billions, except ratio) 2016 2016 2016 2015 2015 Total equity $ 204.0 202.7 198.5 193.9 194.0
Adjustments: Preferred stock (24.6) (24.8) (24.1) (22.2) (22.4) Additional paid-in capital on ESOP
preferred stock (0.1) (0.2) (0.2) (0.1) (0.1)
Unearned ESOP shares 1.6 1.9 2.3 1.3 1.5 Noncontrolling interests (1.0) (1.0) (1.0) (0.9) (0.9)
Total common stockholders' equity 179.9 178.6 175.5 172.0 172.1
Adjustments: Goodwill (26.7) (27.0) (27.0) (25.5) (25.7) Certain identifiable intangible assets (other than
(3.0) (3.4) (3.8) (3.2) (3.5) MSRs) Other assets (2) (2.2) (2.0) (2.1) (2.1) (1.7) Applicable deferred taxes (3) 1.8 1.9 2.0 2.1 2.2 Investment in certain subsidiaries and other (2.0) (2.5) (1.9) (0.9) (1.6)
Common Equity Tier 1 (Fully Phased-In) under Basel III (A) 147.8 145.6 142.7 142.4 141.8
Total risk-weighted assets (RWAs) anticipated under Basel III (4)(5) (B) $ 1,386.7 1,372.9 1,345.1 1,321.7 1,331.8
Common Equity Tier 1 to total RWAs anticipated under Basel III (Fully Phased-In) (5) (A)/(B) 10.7% 10.6 10.6 10.8 10.6
(1) Basel III capital rules, adopted by the Federal Reserve Board on July 2, 2013, revised the definition of capital, increased minimum capital ratios, and introduced a minimum Common Equity Tier 1 (CET1) ratio. These rules established a new comprehensive capital framework for U.S. banking organizations that implements the Basel III capital framework and certain provisions of the Dodd-Frank Act. The rules are being phased in through the end of 2021. Fully phased-in capital amounts, ratios and RWAs are calculated assuming the full phase-in of the Basel III capital rules. Fully phased-in regulatory capital amounts, ratios and RWAs are considered non-GAAP financial measures that are used by management, bank regulatory agencies, investors and analysts to assess and monitor the Company’s capital position.
(2) Represents goodwill and other intangibles on nonmarketable equity investments, which are included in other assets. (3) Applicable deferred taxes relate to goodwill and other intangible assets. They were determined by applying the combined federal statutory rate and composite state income
tax rates to the difference between book and tax basis of the respective goodwill and intangible assets at period end. (4) The final Basel III capital rules provide for two capital frameworks: the Standardized Approach, which replaced Basel I, and the Advanced Approach applicable to certain
institutions. Under the final rules, we are subject to the lower of our CET1 ratio calculated under the Standardized Approach and under the Advanced Approach in the assessment of our capital adequacy. Because the final determination of our CET1 ratio and which approach will produce the lower CET1 ratio as of September 30, 2016, is subject to detailed analysis of considerable data, our CET1 ratio at that date has been estimated using the Basel III definition of capital under the Basel III Standardized Approach RWAs. The capital ratio for June 30 and March 31, 2016, and December 31 and September 30, 2015, was calculated under the Basel III Standardized Approach RWAs.
(5) The Company’s September 30, 2016, RWAs and capital ratio are preliminary estimates.
24

Forward-looking statements and additional information
Forward-looking statements: This document contains “forward-looking statements” within the meaning of the Private Securities Litigation Reform Act of 1995. In addition, we may make forward-looking statements in our other documents filed or furnished with the SEC, and our management may make forward-looking statements orally to analysts, investors, representatives of the media and others. Forward-looking statements can be identified by words such as “anticipates,” “intends,” “plans,” “seeks,” “believes,” “estimates,” “expects,” “target,” “projects,” “outlook,” “forecast,” “will,” “may,” “could,” “should,” “can” and similar references to future periods. In particular, forward-looking statements include, but are not limited to, statements we make about: (i) the future operating or financial performance of the Company, including our outlook for future growth; (ii) our noninterest expense and efficiency ratio; (iii) future credit quality and performance, including our expectations regarding future loan losses and allowance levels; (iv) the appropriateness of the allowance for credit losses; (v) our expectations regarding net interest income and net interest margin; (vi) loan growth or the reduction or mitigation of risk in our loan portfolios; (vii) future capital levels or targets and our estimated Common Equity Tier 1 ratio under Basel III capital standards; (viii) the performance of our mortgage business and any related exposures; (ix) the expected outcome and impact of legal, regulatory and legislative developments, as well as our expectations regarding compliance therewith; (x) future common stock dividends, common share repurchases and other uses of capital; (xi) our targeted range for return on assets and return on equity; (xii) the outcome of contingencies, such as legal proceedings; and (xiii) the Company’s plans, objectives and strategies. Forward-looking statements are not based on historical facts but instead represent our current expectations and assumptions regarding our business, the economy and other future conditions. Investors are urged to not unduly rely on forward-looking statements as actual results could differ materially from expectations. Forward-looking statements speak only as of the date made, and we do not undertake to update them to reflect changes or events that occur after that date. For more information about factors that could cause actual results to differ materially from expectations, refer to the “Forward-Looking Statements” discussion in Wells Fargo’s press release announcing our third quarter 2016 results and in our most recent Quarterly Report on Form 10-Q, as well as to Wells Fargo’s other reports filed with the Securities and Exchange Commission, including the discussion under “Risk Factors” in our Annual Report on Form 10-K for the year ended December 31, 2015.
Purchased credit-impaired loan portfolios: Loans acquired that were considered credit impaired at acquisition were written down at that date in purchase accounting to an amount estimated to be collectible and the related allowance for loan losses was not carried over to Wells Fargo’s allowance. In addition, such purchased credit-impaired loans are not classified as nonaccrual or nonperforming, and are not included in loans that were contractually 90+ days past due and still accruing. Any losses on such loans are charged against the nonaccretable difference established in purchase accounting and are not reported as charge-offs (until such difference is fully utilized). As a result of accounting for purchased loans with evidence of credit deterioration, certain ratios of Wells Fargo are not comparable to a portfolio that does not include purchased credit-impaired loans.
In certain cases, the purchased credit-impaired loans may affect portfolio credit ratios and trends. Management believes that the presentation of information adjusted to exclude the purchased credit-impaired loans provides useful disclosure regarding the credit quality of the non-impaired loan portfolio. Accordingly, certain of the loan balances and credit ratios in this document have been adjusted to exclude the purchased credit-impaired loans. References in this document to impaired loans mean the purchased credit-impaired loans. Please see page 31 of the press release announcing our 3Q16 results for additional information regarding the purchased credit-impaired loans.
25