cia. hering - 3q16 results
TRANSCRIPT
3Q16 Results Conference Call
October 28th, 2016 – 11:00 am (BrT) 09:00 am (NY)/ 02:00 pm (London)
3Q16 Results
DISCLAIMER
This presentation contains forward-looking statements regarding the
prospects of the business, estimates for operating and financial
results, and those regarding Cia. Hering's growth prospects. These are
merely projections and, as such, are based exclusively on the
expectations of Cia. Hering management concerning the future of the
business and its continued access to capital to fund the Company’s
business Plan. Such forward-looking statements depend, substantially,
on changes in market conditions, government regulations,
competitive pressures, the performance of the Brazilian economy and
the industry, among other factors and risks disclosed in Cia. Hering’s
filed disclosure documents and are, therefore, subject to change
without prior notice.
• Financial Performance
• Outlook
• Q&A
2
FINANCIAL PERFORMANCE
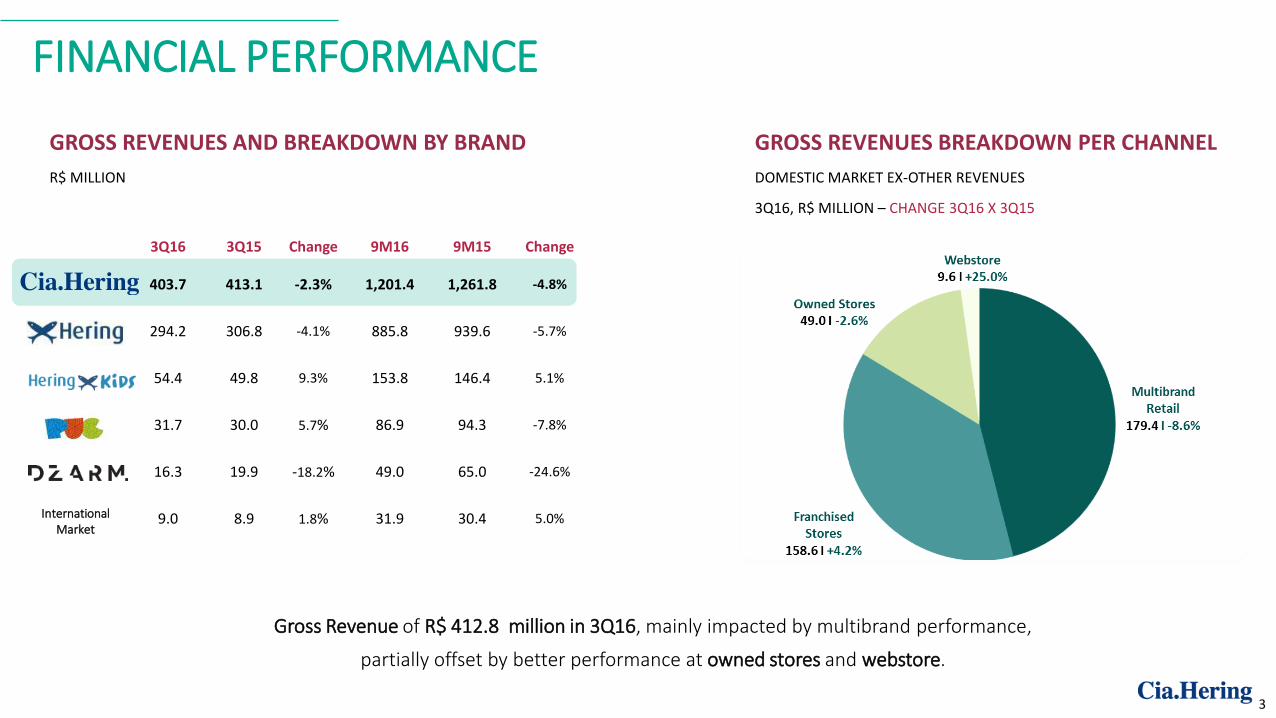
GROSS REVENUES AND BREAKDOWN BY BRAND
R$ MILLION
GROSS REVENUES BREAKDOWN PER CHANNEL
DOMESTIC MARKET EX-OTHER REVENUES
3Q16, R$ MILLION – CHANGE 3Q16 X 3Q15
Gross Revenue of R$ 412.8 million in 3Q16, mainly impacted by multibrand performance,
partially offset by better performance at owned stores and webstore.
3
3Q16 3Q15 Change 9M16 9M15 Change
403.7 413.1 -2.3% 1,201.4 1,261.8 -4.8%
294.2 306.8 -4.1% 885.8 939.6 -5.7%
54.4 49.8 9.3% 153.8 146.4 5.1%
31.7 30.0 5.7% 86.9 94.3 -7.8%
16.3 19.9 -18.2% 49.0 65.0 -24.6%
9.0 8.9 1.8% 31.9 30.4 5.0% International Market
HERING STORE NETWORK
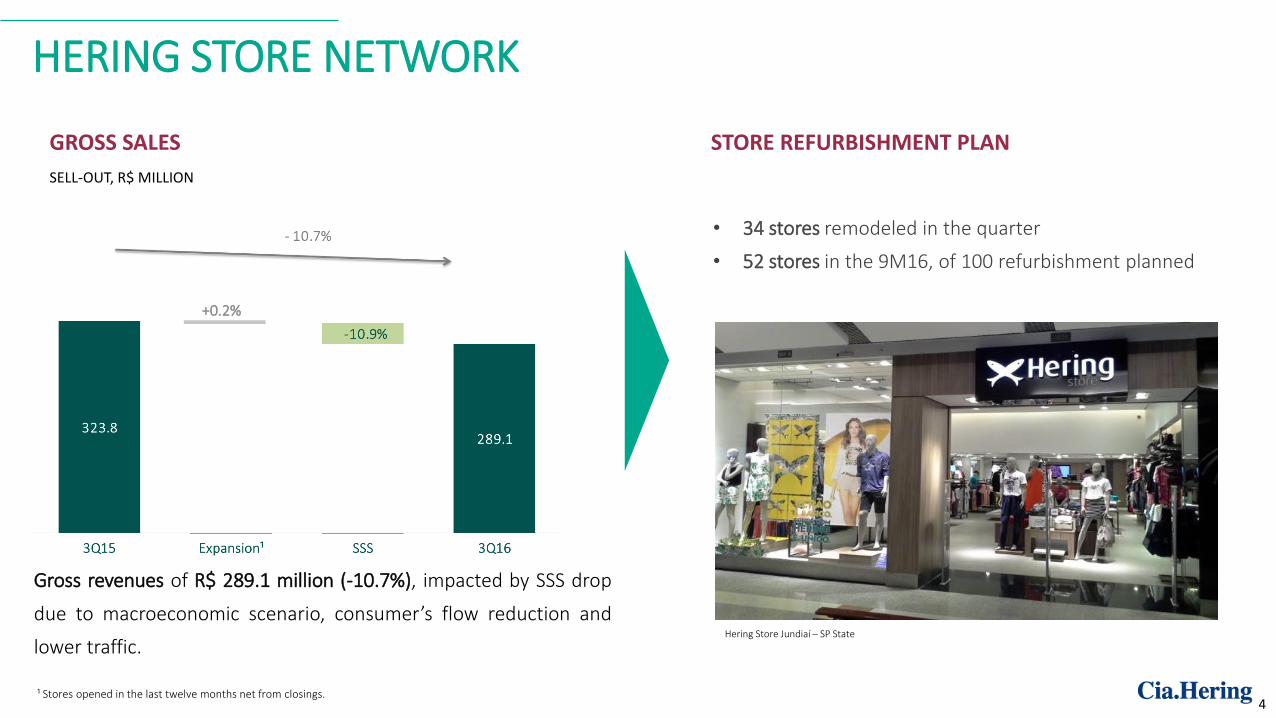
GROSS SALES
SELL-OUT, R$ MILLION
Gross revenues of R$ 289.1 million (-10.7%), impacted by SSS drop
due to macroeconomic scenario, consumer’s flow reduction and
lower traffic.
¹ Stores opened in the last twelve months net from closings.
STORE REFURBISHMENT PLAN
• 34 stores remodeled in the quarter
• 52 stores in the 9M16, of 100 refurbishment planned
Hering Store Jundiaí – SP State
4
+0.2%
FINANCIAL PERFORMANCE
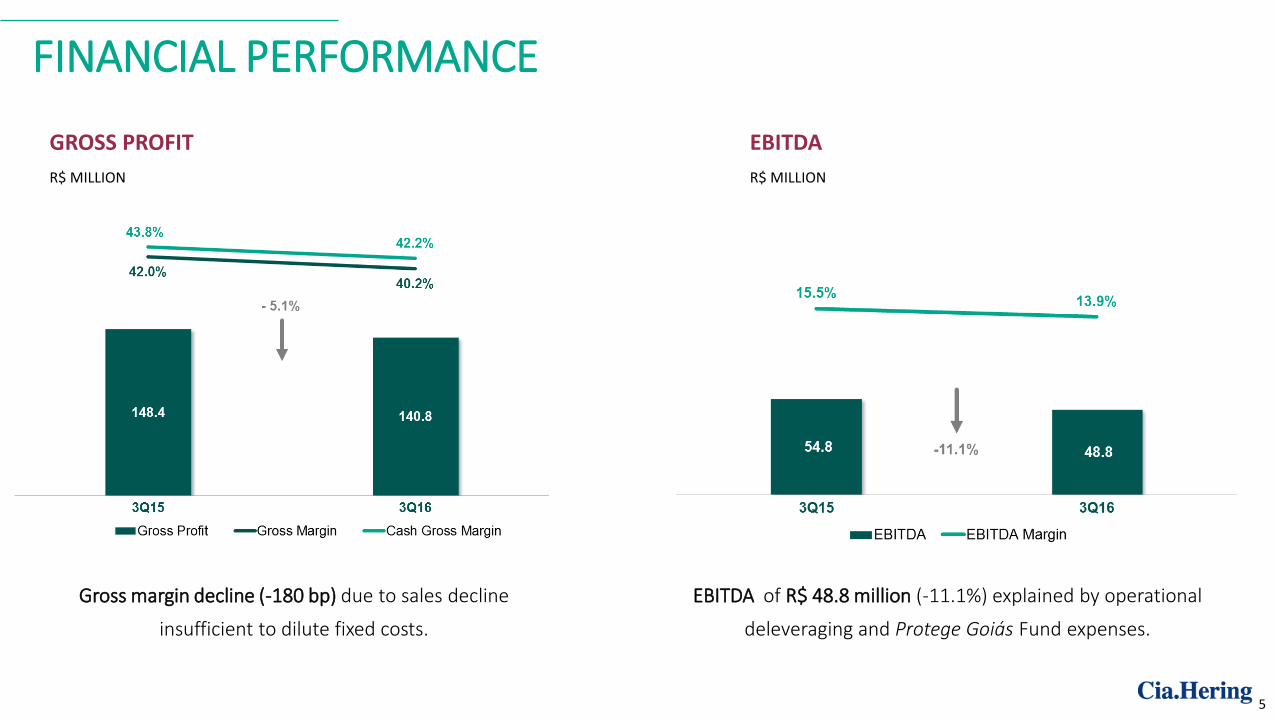
EBITDA of R$ 48.8 million (-11.1%) explained by operational
deleveraging and Protege Goiás Fund expenses.
Gross margin decline (-180 bp) due to sales decline
insufficient to dilute fixed costs.
GROSS PROFIT
R$ MILLION
EBITDA
R$ MILLION
5
FINANCIAL PERFORMANCE
NET INCOME
R$ MILLION
CAPEX
R$ MILLION
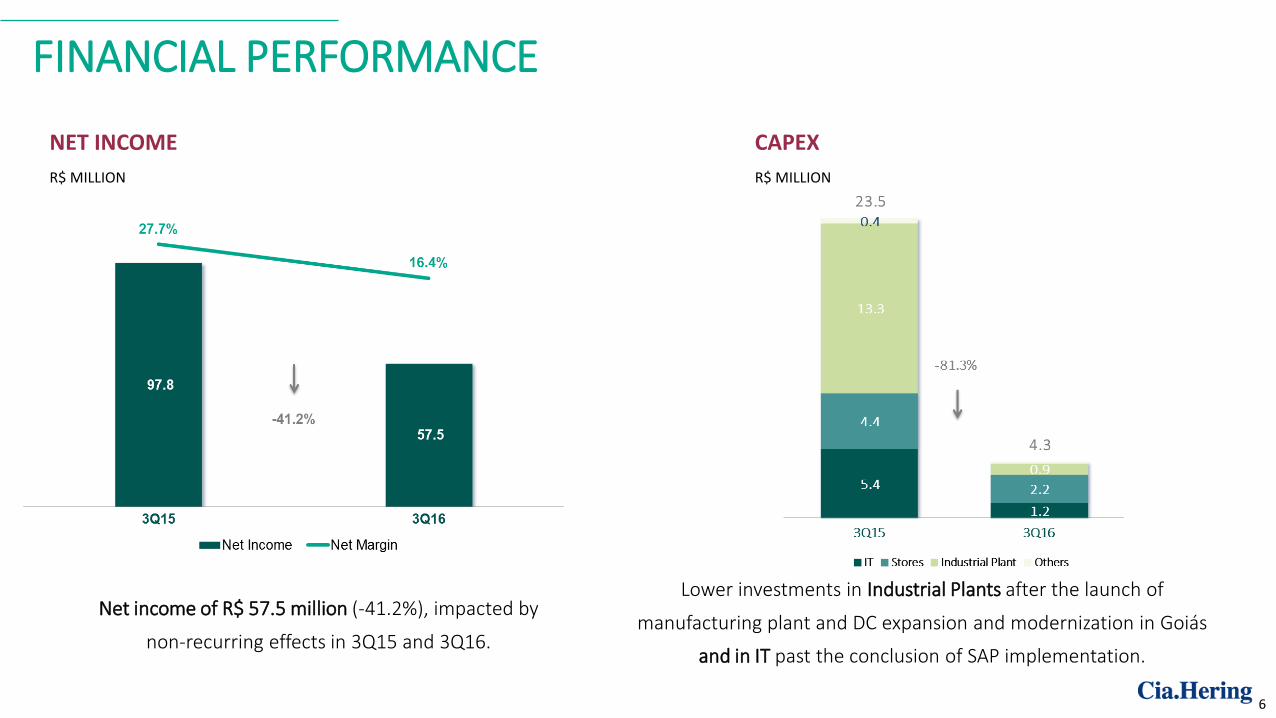
Net income of R$ 57.5 million (-41.2%), impacted by
non-recurring effects in 3Q15 and 3Q16.
Lower investments in Industrial Plants after the launch of
manufacturing plant and DC expansion and modernization in Goiás
and in IT past the conclusion of SAP implementation.
6

FINANCIAL PERFORMANCE
Cash flow of R$ 27.8 million, R$ 19.1 million higher than 3Q15, as a result of a
reduction in working capital needs, by inventories decrease, and lower investments.
CASH FLOWS
R$ MILLION
7
Cash Flow - Consolidated 3Q16 3Q15 Chg. 9M16 9M15 Chg.
EBITDA 48,751 54 ,829 (6 ,078) 146,618 168,527 (21,909)
No cash items (5,475) 4,946 (10,421) (3,409) 20,020 (23,429)
AVP (Adjustment to Present Value) - Clients and Suppliers 3,858 3,551 307 14,715 13,024 1,691
Current Income tax and Social Contribution (4,365) 12,925 (17,290) (6,010) 1,738 (7,748)
Working Capital Capex (10,636) (44,031) 33 ,395 74,142 (44,020) 118,162
(Increase) decrease in trade accounts receivable 7,102 15,846 (8,744) 99,824 109,352 (9,528)
Decrease (increase) in inventories (32,013) (71,000) 38,987 (19,443) (102,231) 82,788
Increase (decrease) in accounts payable to suppliers 25,329 18,307 7,022 12,581 (7,966) 20,547
(Decrease) in taxes payable (4,418) (3,248) (1,170) (21,043) (31,214) 10,171
Refurbishment Project 2016 - Franchisee Financing (6,117) (979) (5,138) (8,612) (979) (7,633)
Others (519) (2,957) 2,438 10,835 (10,982) 21,817
CapEx (4 ,303) (23 ,443) 19 ,140 (14,258) (66,586) 52 ,328
Free Cash Flow 27,830 8 ,777 19 ,053 211,798 92,703 119,095
OUTLOOK
• In Q4, uncertainties in consumption environment can bring sales volatility;
• Company's inventories normalization should bear benefits based on the markdown level reduction;
• Product and Store (“P&S”) fronts, remain as priorities for the year:
• Product: High Summer collection already shows improvements in the cost-benefit ratio ('value for money')
• Stores: great network adhesion to Refurbishment Program, that should be over-delivered.
• Supply and inventories management as priority in pursuit of lower shrinkage, better shopping experience
through VM and stores profitability improvement by reducing markdown.
9

Fabio Hering – CEO Frederico Oldani – CFO and IRO
Bruno Salem Brasil – IR Manager Caroline Luccarini – IR Analyst
www.ciahering.com.br/ir +55 (11) 3371 – 4867/4805
INVESTOR RELATIONS TEAM