cia. hering - marketscreener.com · 6 hering stores chain performancehering stores chain...
TRANSCRIPT

Cia. Hering
Interim Financial Information for the Quarter ended September 30, 2017 and Independent Auditor's Review Report
(Free Translation into English from the Original Previously Issued in Portuguese for the Convenience of Readers Outside Brazil)
Cia. Hering (Publicly-held company)
Quarterly financial information September 30, 2017
Table of contents Performance report 3 - 9
Independent auditor’s report on the review 10 - 11
Balance sheets 12
Statements of income 13
Statements of comprehensive income 14
Statements of changes in equity 15 - 16
Statements of cash flows 17
Statements of added value 18 Notes to the financial statements 19 - 88

3
Consolidated HighlightsConsolidated HighlightsConsolidated HighlightsConsolidated Highlights
Gross Revenue of R$ 433.7 million in 3Q17
Net Income of R$ 51.9 million
� Gross Revenue of R$ 433.7 million, 5.1% higher than 3Q16,
influenced by own stores, webstores and foreign market
performance;
� R$ 63.8 million EBITDA (+30.9%), 310 bp of margin expansion
due to sales growth and gross margin increase, partially offset
by higher operating expenses;
� Net Income of R$ 51.9 million (-9.8%), explained by a reduction
in financial income as a result of a lawsuit gain in 3Q16,
impacting comparison basis, and higher Income Tax and Social
Contribution effective rate;
� ROIC of 16.7% (+130 bp vs. 3Q16), due to a recovery in the
Company’s operating income.
ChangeChangeChangeChange ChangeChangeChangeChange
3Q17 / 3Q163Q17 / 3Q163Q17 / 3Q163Q17 / 3Q16 9M17 / 9M169M17 / 9M169M17 / 9M169M17 / 9M16
Gross RevenueGross RevenueGross RevenueGross Revenue 433,689433,689433,689433,689 412,758412,758412,758412,758 5.1%5.1%5.1%5.1% 1,304,0461,304,0461,304,0461,304,046 1 ,233,2671,233,2671,233,2671,233,267 5.7%5.7%5.7%5.7%
Domestic Market 420,917 403,743 4.3% 1,268,324 1,201,383 5.6%
Foreign Market 12,772 9,015 41.7% 35,722 31,884 12.0%
Net RevenueNet RevenueNet RevenueNet Revenue 375,103375,103375,103375,103 350,567350,567350,567350,567 7.0%7.0%7.0%7.0% 1,109,9531,109,9531,109,9531,109,953 1,043,0121,043,0121,043,0121,043,012 6.4%6.4%6.4%6.4%
Gross ProfitGross ProfitGross ProfitGross Profit 172,830172,830172,830172,830 140,845140,845140,845140,845 22.7%22.7%22.7%22.7% 490,350490,350490,350490,350 406,988406,988406,988406,988 20.5%20.5%20.5%20.5%
Gross Margin 46.1% 40.2% 590 bp 44.2% 39.0% 520 bp
Cash Gross Profit Cash Gross Profit Cash Gross Profit Cash Gross Profit ( a )( a )( a )( a )
179,900179,900179,900179,900 147,964147,964147,964147,964 21.6%21.6%21.6%21.6% 511,158511,158511,158511,158 427,885427,885427,885427,885 19.5%19.5%19.5%19.5%
Cash Gross Margin (a)
48.0% 42.2% 580 bp 46.1% 41.0% 510 bp
Net IncomeNet IncomeNet IncomeNet Income 51,91751,91751,91751,917 57,53557,53557,53557,535 -9.8%-9.8%-9.8%-9.8% 177,764177,764177,764177,764 148,468148,468148,468148,468 19.7%19.7%19.7%19.7%
Net Margin 13.8% 16.4% -260 bp 16.0% 14.2% 180 bp
EBITDA EBITDA EBITDA EBITDA (b) (b) (b) (b) 63,81763,81763,81763,817 48,75148,75148,75148,751 30.9%30.9%30.9%30.9% 179,434179,434179,434179,434 146,618146,618146,618146,618 22.4%22.4%22.4%22.4%
EBITDA Margin (b) 17.0% 13.9% 310 bp 16.2% 14.1% 210 bp
ROIC ROIC ROIC ROIC (c)(c)(c)(c) 16.7%16.7%16.7%16.7% 15.4%15.4%15.4%15.4% 130 bp130 bp130 bp130 bp 16.7%16.7%16.7%16.7% 15.4%15.4%15.4%15.4% 130 bp130 bp130 bp130 bp
(a) Gross Profit and Gross Margin without Depreciation allocated to cost
(b) Earnings before interest, taxes, depreciation, amortization and participations
(c) Last 12 months
3Q163Q163Q163Q16 9M179M179M179M17 9M169M169M169M16R$ ThousandR$ ThousandR$ ThousandR$ Thousand 3Q173Q173Q173Q17

4
SALES PERFORMANCESALES PERFORMANCESALES PERFORMANCESALES PERFORMANCE
The channel breakdown does not consider “Others”.
Company's gross sales totaled R$ 433.7 million in 3Q17, 5.1% higher than 3Q16, influenced by own stores and
webstores performance. In addition, the greater penetration of the company's products in several Latin American
markets stands out, contributing to sales growth in the foreign market (+41.7%).
The multibrand channel posted 1.2% growth in 3Q17 sales, totaling R$ 181.5 million. The increase, lower than the first
quarters of the year, is attributed mainly to higher orders concentration for the largest collections of the year (Winter
and High Summer), leading to purchases postponement for 4Q17. The channel, more exposed to the country’s
economic cycles, showed stability in the number of active customers and higher average purchase of existing
customers.
Sales to franchises reached R$ 152.4 million, 3.9% lower than 3Q16, influenced by (i) reduction of 26 stores, among
transfers and closings, in the last 12 months, (ii) higher orders’ concentration for the High Summer collection (mostly
invoiced in 4Q17) and (iii) anticipation, in 3Q16, of part of the invoiced volume of the Higher Summer collection as part
of the preparation of the network for the period of high sales, impacting comparison basis.
Stores operated by the Company registered a 35.4% increase in sales, reaching R$ 66.3 million, mainly influenced by the
net addition of 11 stores in the last 12 months and an improvement in same-store sales in all brands, also favored by
the greater concentration of points of sale in the Southeast, best regional performance in the quarter.
Webstores maintained its double-digit growth trend (+25.0%), with emphasis on the implementation of a new Hering
store layout, launch of exclusive collections for the channel, such as partnership with renowned stylists and good
performance of the online outlet (Espaço Hering).
Regarding brands’ performance, Hering and Hering Kids stood out with an increase of 3.8% and 9.1%, respectively,
supported by good product offering, store experience and communication, in line with previous quarters. DZARM.
registered a 5.4% increase, with better sales performance in flagship stores and PUC decreased 3.9%, with signs of
stabilization and sequential improvement in same-store sales.
In the 9M17, the Company's gross sales totaled R$ 1.3 billion, a 5.7% increase over the same period in 2016, influenced
by the good performance of all brands, notably Hering Kids (+17.3%). Regarding the distribution channels, the
multibrand sales growth stands out, with a 7.4% increase in the 9 month period, own stores growth (+22.6%), as a
result of better supply management and store opening, as well as the double-digit increase in the webstores (+24.1%).
ChangeChangeChangeChange ChangeChangeChangeChange
3 Q1 7 / 3 Q1 63 Q1 7 / 3 Q1 63 Q1 7 / 3 Q1 63 Q1 7 / 3 Q1 6 9 M1 7 / 9 M1 69 M1 7 / 9 M1 69 M1 7 / 9 M1 69 M1 7 / 9 M1 6
Gross RevenueGross RevenueGross RevenueGross Revenue 4 33 ,6 894 33 ,6 894 33 ,6 894 33 ,6 89 4 12 ,7 584 12 ,7 584 12 ,7 584 12 ,7 58 5 .1 %5 .1 %5 .1 %5 .1 % 1 ,3 04 ,0 461 ,3 04 ,0 461 ,3 04 ,0 461 ,3 04 ,0 46 1 ,23 3,26 71,23 3,26 71,23 3,26 71,23 3,26 7 5.7%5.7%5.7%5.7%
Domestic Market 420,917 403,743 4.3% 1,268,324 1,201,383 5.6%
Foreign Market 12,772 9,015 41.7% 35,722 31,884 12.0%
Domestic Market Gross RevenueDomestic Market Gross RevenueDomestic Market Gross RevenueDomestic Market Gross Revenue 4 20 ,9 174 20 ,9 174 20 ,9 174 20 ,9 17 4 03 ,7 434 03 ,7 434 03 ,7 434 03 ,7 43 4 .3 %4 .3 %4 .3 %4 .3 % 1 ,2 68 ,3 241 ,2 68 ,3 241 ,2 68 ,3 241 ,2 68 ,3 24 1 ,20 1,38 31,20 1,38 31,20 1,38 31,20 1,38 3 5.6%5.6%5.6%5.6%
Hering 305,224 294,183 3.8% 923,085 885,793 4.2%
Hering Kids 59,392 54,440 9.1% 180,387 153,797 17.3%
PUC 30,434 31,680 -3.9% 88,027 86,920 1.3%
DZARM. 17,161 16,279 5.4% 52,394 48,974 7.0%
Other 8,706 7,161 21.6% 24,431 25,899 -5.7%
ChangeChangeChangeChange ChangeChangeChangeChange
3 Q1 7 / 3 Q1 63 Q1 7 / 3 Q1 63 Q1 7 / 3 Q1 63 Q1 7 / 3 Q1 6 9 M1 7 / 9 M1 69 M1 7 / 9 M1 69 M1 7 / 9 M1 69 M1 7 / 9 M1 6
Multibrand 181,473 179,367 1.2% 573,469 533,984 7.4%
Franchise 152,383 158,608 -3.9% 434,905 449,737 -3.3%
Owned Stores 66,347 49,001 35.4% 202,053 164,805 22.6%
Webstore 12,008 9,606 25.0% 33,466 26,958 24.1%
TotalTotalTotalTotal 4 12 ,2 114 12 ,2 114 12 ,2 114 12 ,2 11 3 96 ,5 823 96 ,5 823 96 ,5 823 96 ,5 82 3 .9 %3 .9 %3 .9 %3 .9 % 1 ,2 43 ,8 931 ,2 43 ,8 931 ,2 43 ,8 931 ,2 43 ,8 93 1 ,17 5,48 41,17 5,48 41,17 5,48 41,17 5,48 4 5.8%5.8%5.8%5.8%
Multibrand 44.0% 45.2% -120 bp 46.1% 45.4% 70 bp
Franchise 37.0% 40.0% -300 bp 35.0% 38.3% -330 bp
Owned Stores 16.1% 12.4% 370 bp 16.2% 14.0% 220 bp
Webstore 2.9% 2.4% 50 bp 2.7% 2.3% 40 bp
TotalTotalTotalTotal 10 0 .0%10 0 .0%10 0 .0%10 0 .0% 1 0 0.0%1 0 0.0%1 0 0.0%1 0 0.0% - 1 0 0.0%1 0 0.0%1 0 0.0%1 0 0.0% 1 00 .0 %1 00 .0 %1 00 .0 %1 00 .0 % -
Domestic Market ShareDomestic Market ShareDomestic Market ShareDomestic Market Share
Gross Revenues - R$ thous.Gross Revenues - R$ thous.Gross Revenues - R$ thous.Gross Revenues - R$ thous.
3Q 173Q 173Q 173Q 17 3Q1 63Q1 63Q1 63Q1 6 9M1 79M1 79M1 79M1 7 9 M169 M169 M169 M16
3Q 173Q 173Q 173Q 17 3Q1 63Q1 63Q1 63Q1 6 9M1 79M1 79M1 79M1 7 9 M169 M169 M169 M16
5
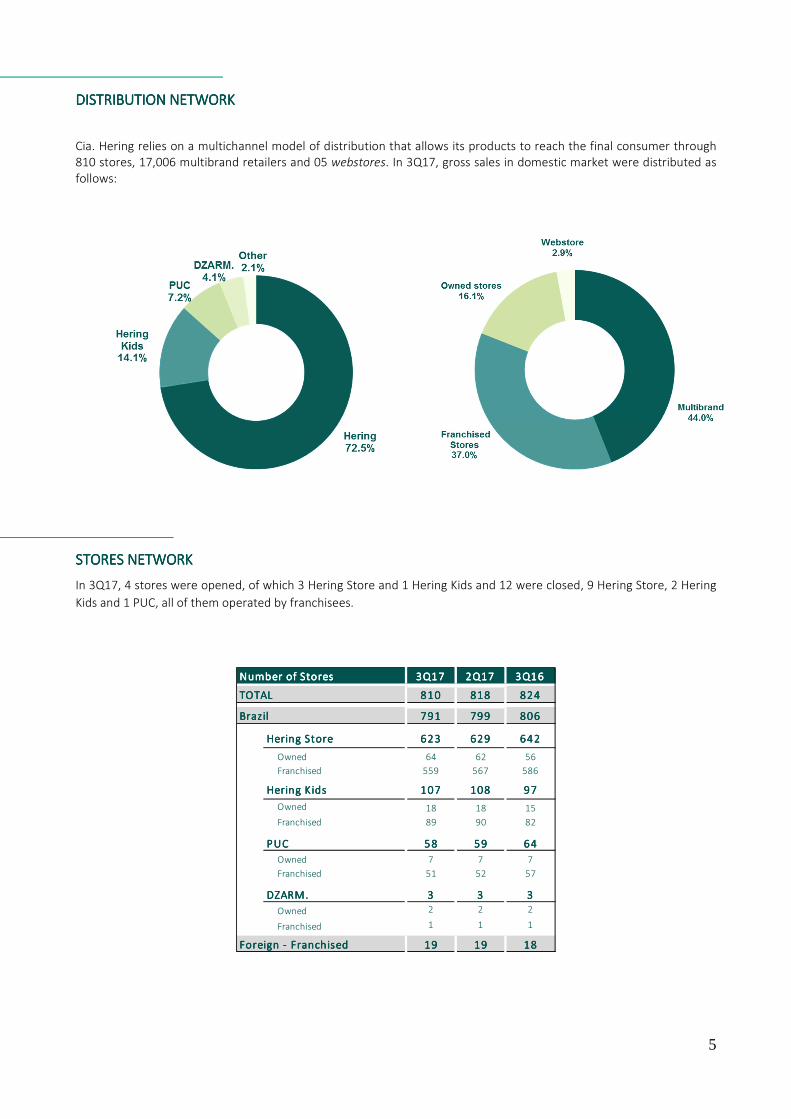
DISTRIBUTION NETWORKDISTRIBUTION NETWORKDISTRIBUTION NETWORKDISTRIBUTION NETWORK
Cia. Hering relies on a multichannel model of distribution that allows its products to reach the final consumer through
810 stores, 17,006 multibrand retailers and 05 webstores. In 3Q17, gross sales in domestic market were distributed as
follows:
STORES NETWORKSTORES NETWORKSTORES NETWORKSTORES NETWORK
In 3Q17, 4 stores were opened, of which 3 Hering Store and 1 Hering Kids and 12 were closed, 9 Hering Store, 2 Hering
Kids and 1 PUC, all of them operated by franchisees.
Number of StoresNumber of StoresNumber of StoresNumber of Stores 3Q173Q173Q173Q17 2Q172Q172Q172Q17 3Q163Q163Q163Q16
TOTALTOTALTOTALTOTAL 810810810810 818818818818 824824824824
BrazilBrazilBrazilBrazil 791791791791 799799799799 806806806806
Hering StoreHering StoreHering StoreHering Store 623623623623 629629629629 642642642642
Owned 64 62 56
Franchised 559 567 586
Hering K idsHering K idsHering K idsHering K ids 107107107107 108108108108 97979797
Owned 18 18 15
Franchised 89 90 82
PUCPUCPUCPUC 58585858 59595959 64646464
Owned 7 7 7
Franchised 51 52 57
DZARM.DZARM.DZARM.DZARM. 3333 3333 3333
Owned 2 2 2
Franchised 1 1 1
Foreign - FranchisedForeign - FranchisedForeign - FranchisedForeign - Franchised 19191919 19191919 18181818

6
HERING STORES CHAIN PERFORMANCEHERING STORES CHAIN PERFORMANCEHERING STORES CHAIN PERFORMANCEHERING STORES CHAIN PERFORMANCE
Sales of Hering Store network (owned and franchised) to final consumers (sell-out) increased by 3.6%, totaling R$ 299.4
million in the quarter, influenced by same-store sales (+3.5%), better operational execution and gradual improvement
of both consumer environment and macroeconomic indicators. Lower consumers’ flow in the stores, resulting in check-
outs decrease, was more than offset by an increase in the average ticket.
Initial performance analysis of the stores renovated last year suggests that those points of sale coupled with best
practices (inventory management, product exposure, visual merchandising, among others) has favored its performance.
The company continues to concentrate efforts to move forward in the initiatives’ adoption, by the network, that favor
inventory turnover and minimize the negative effects caused by stockout and leftovers.
Sales of own stores grew 36.4%, favored by the net addition of 8 stores in the last 12 months. This result was influenced
by an increase in the average price, which can partly be explained by better inventory management, reducing sales of
discounted items, in addition to the combination of price increase and better sale’s performance of the new basics line.
In the first nine months of 2017, net sales fell 1.0%, impacted by sales area reduction, partially offset by better
execution in own stores.
Hering Store Chain Performanc eHering Store Chain Performanc eHering Store Chain Performanc eHering Store Chain Performanc e 3Q173Q173Q173Q17 3Q163Q163Q163Q16Chg.Chg.Chg.Chg.
3Q17 / Q163Q17 / Q163Q17 / Q163Q17 / Q169M179M179M179M17 9M169M169M169M16
Chg.Chg.Chg.Chg.
9M17 / 9M169M17 / 9M169M17 / 9M169M17 / 9M16
Number of StoresNumber of StoresNumber of StoresNumber of Stores 623623623623 642642642642 -3 .0%-3 .0%-3 .0%-3 .0% 623623623623 642642642642 -3 .0%-3 .0%-3 .0%-3 .0%
Franchise 559 586 -4.6% 559 586 -4.6%
Owned 64 56 14.3% 64 56 14.3%
Sales (R$ thousand) Sales (R$ thousand) Sales (R$ thousand) Sales (R$ thousand) ( 1 )( 1 )( 1 )( 1 ) 299,444299,444299,444299,444 289 ,089289,089289,089289,089 3 .6%3.6%3.6%3.6% 920,355920,355920,355920,355 929 ,658929,658929,658929,658 -1 .0%-1 .0%-1 .0%-1 .0%
Franchise 239,094 244,830 -2.3% 737,883 782,111 -5.7%
Owned 60,350 44,259 36.4% 182,472 147,547 23.7%
Same Store Sales growthSame Store Sales growthSame Store Sales growthSame Store Sales growth ( 2 ) ( 2 ) ( 2 ) ( 2 ) 3.5% 3 .5% 3 .5% 3 .5% -10 .9% -10 .9% -10 .9% -10 .9% 1440 bp1440 bp1440 bp1440 bp -0 .5% -0 .5% -0 .5% -0 .5% -7 .9% -7 .9% -7 .9% -7 .9% 740 bp740 bp740 bp740 bp
Sales Area (m²) 87,563 90,961 -3.7% 87,563 90,961 -3.7%
Sales (R$ per m²) 3,420 3,178 7.6% 10,511 10,220 2.8%
Check-Outs 2,266,348 2,464,683 -8.0% 6,961,959 7,775,332 -10.5%
Units 4,932,711 5,200,707 -5.2% 14,615,065 15,960,675 -8.4%
Units per Check-Out 2.18 2.11 3.3% 2.10 2.05 2.4%
Average Sales Price (R$) 60.71 55.59 9.2% 62.97 58.25 8.1%
Average Sales Ticket (R$) 132.13 117.29 12.7% 132.20 119.57 10.6%
(1) The amounts referred to the sales to final costumers ('sell out')
(2) Compared to the same period of the previous year
7
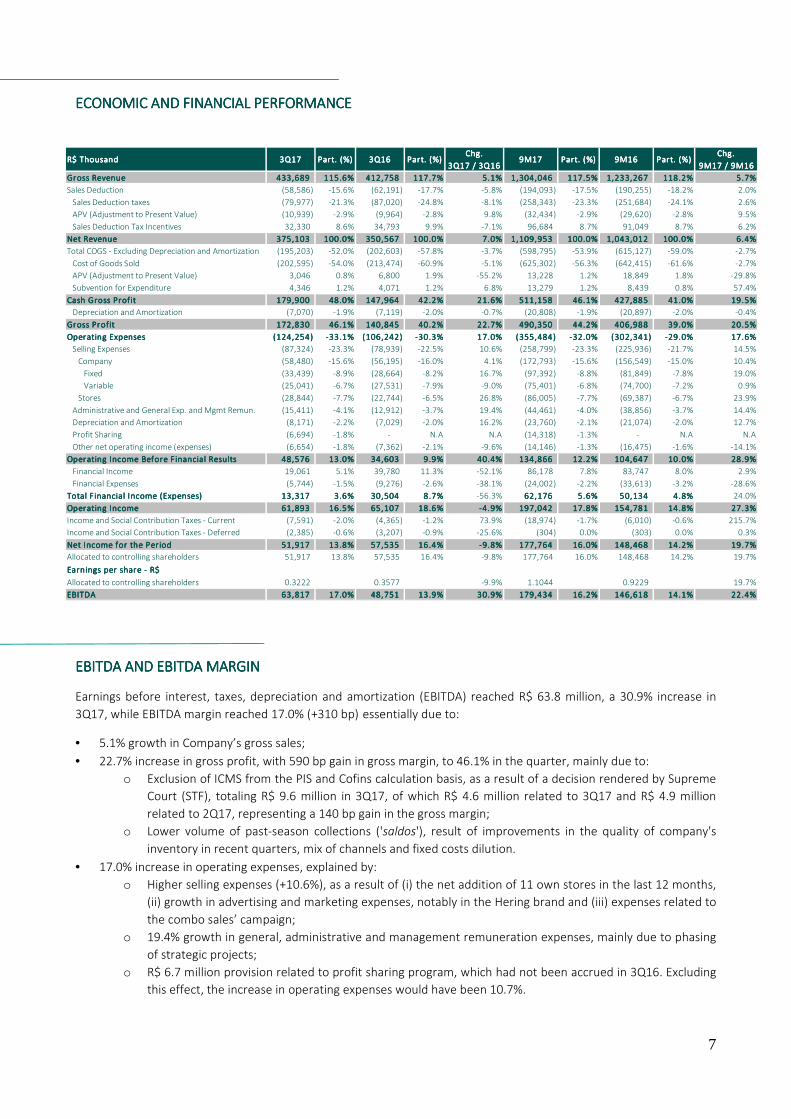
ECONOMIC AND FINANCIAL PERFORMANCEECONOMIC AND FINANCIAL PERFORMANCEECONOMIC AND FINANCIAL PERFORMANCEECONOMIC AND FINANCIAL PERFORMANCE
EBITDA AND EBITDA MARGINEBITDA AND EBITDA MARGINEBITDA AND EBITDA MARGINEBITDA AND EBITDA MARGIN
Earnings before interest, taxes, depreciation and amortization (EBITDA) reached R$ 63.8 million, a 30.9% increase in
3Q17, while EBITDA margin reached 17.0% (+310 bp) essentially due to:
• 5.1% growth in Company’s gross sales;
• 22.7% increase in gross profit, with 590 bp gain in gross margin, to 46.1% in the quarter, mainly due to:
o Exclusion of ICMS from the PIS and Cofins calculation basis, as a result of a decision rendered by Supreme
Court (STF), totaling R$ 9.6 million in 3Q17, of which R$ 4.6 million related to 3Q17 and R$ 4.9 million
related to 2Q17, representing a 140 bp gain in the gross margin;
o Lower volume of past-season collections ('saldos'), result of improvements in the quality of company's
inventory in recent quarters, mix of channels and fixed costs dilution.
• 17.0% increase in operating expenses, explained by:
o Higher selling expenses (+10.6%), as a result of (i) the net addition of 11 own stores in the last 12 months,
(ii) growth in advertising and marketing expenses, notably in the Hering brand and (iii) expenses related to
the combo sales’ campaign;
o 19.4% growth in general, administrative and management remuneration expenses, mainly due to phasing
of strategic projects;
o R$ 6.7 million provision related to profit sharing program, which had not been accrued in 3Q16. Excluding
this effect, the increase in operating expenses would have been 10.7%.
Chg.Chg.Chg.Chg. Chg.Chg.Chg.Chg.
3Q17 / 3Q163Q17 / 3Q163Q17 / 3Q163Q17 / 3Q16 9M17 / 9M169M17 / 9M169M17 / 9M169M17 / 9M16
Gross RevenueGross RevenueGross RevenueGross Revenue 433,689433,689433,689433,689 115.6%115.6%115.6%115.6% 412,758412,758412,758412,758 117.7%117.7%117.7%117.7% 5.1%5.1%5.1%5.1% 1,304,0461,304,0461,304,0461,304,046 117.5%117.5%117.5%117.5% 1,233,2671,233,2671,233,2671,233,267 118.2%118.2%118.2%118.2% 5.7%5.7%5.7%5.7%
Sales Deduction (58,586) -15.6% (62,191) -17.7% -5.8% (194,093) -17.5% (190,255) -18.2% 2.0%
Sales Deduction taxes (79,977) -21.3% (87,020) -24.8% -8.1% (258,343) -23.3% (251,684) -24.1% 2.6%
APV (Adjustment to Present Value) (10,939) -2.9% (9,964) -2.8% 9.8% (32,434) -2.9% (29,620) -2.8% 9.5%
Sales Deduction Tax Incentives 32,330 8.6% 34,793 9.9% -7.1% 96,684 8.7% 91,049 8.7% 6.2%
Net RevenueNet RevenueNet RevenueNet Revenue 375,103375,103375,103375,103 100.0%100.0%100.0%100.0% 350,567350,567350,567350,567 100.0%100.0%100.0%100.0% 7.0%7.0%7.0%7.0% 1,109,9531,109,9531,109,9531,109,953 100.0%100.0%100.0%100.0% 1,043,0121,043,0121,043,0121,043,012 100.0%100.0%100.0%100.0% 6.4%6.4%6.4%6.4%
Total COGS - Excluding Depreciation and Amortization (195,203) -52.0% (202,603) -57.8% -3.7% (598,795) -53.9% (615,127) -59.0% -2.7%
Cost of Goods Sold (202,595) -54.0% (213,474) -60.9% -5.1% (625,302) -56.3% (642,415) -61.6% -2.7%
APV (Adjustment to Present Value) 3,046 0.8% 6,800 1.9% -55.2% 13,228 1.2% 18,849 1.8% -29.8%
Subvention for Expenditure 4,346 1.2% 4,071 1.2% 6.8% 13,279 1.2% 8,439 0.8% 57.4%
Cash Gross Profit Cash Gross Profit Cash Gross Profit Cash Gross Profit 179,900179,900179,900179,900 48.0%48.0%48.0%48.0% 147,964147,964147,964147,964 42.2%42.2%42.2%42.2% 21.6%21.6%21.6%21.6% 511,158511,158511,158511,158 46.1%46.1%46.1%46.1% 427,885427,885427,885427,885 41.0%41.0%41.0%41.0% 19.5%19.5%19.5%19.5%
Depreciation and Amortization (7,070) -1.9% (7,119) -2.0% -0.7% (20,808) -1.9% (20,897) -2.0% -0.4%
Gross ProfitGross ProfitGross ProfitGross Profit 172,830172,830172,830172,830 46.1%46.1%46.1%46.1% 140,845140,845140,845140,845 40.2%40.2%40.2%40.2% 22.7%22.7%22.7%22.7% 490,350490,350490,350490,350 44.2%44.2%44.2%44.2% 406,988406,988406,988406,988 39.0%39.0%39.0%39.0% 20.5%20.5%20.5%20.5%
Operating ExpensesOperating ExpensesOperating ExpensesOperating Expenses (124,254)(124,254)(124,254)(124,254) -33.1%-33.1%-33.1%-33.1% (106,242)(106,242)(106,242)(106,242) -30.3%-30.3%-30.3%-30.3% 17.0%17.0%17.0%17.0% (355,484)(355,484)(355,484)(355,484) -32.0%-32.0%-32.0%-32.0% (302,341)(302,341)(302,341)(302,341) -29.0%-29.0%-29.0%-29.0% 17.6%17.6%17.6%17.6%
Selling Expenses (87,324) -23.3% (78,939) -22.5% 10.6% (258,799) -23.3% (225,936) -21.7% 14.5%
Company (58,480) -15.6% (56,195) -16.0% 4.1% (172,793) -15.6% (156,549) -15.0% 10.4%
Fixed (33,439) -8.9% (28,664) -8.2% 16.7% (97,392) -8.8% (81,849) -7.8% 19.0%
Variable (25,041) -6.7% (27,531) -7.9% -9.0% (75,401) -6.8% (74,700) -7.2% 0.9%
Stores (28,844) -7.7% (22,744) -6.5% 26.8% (86,005) -7.7% (69,387) -6.7% 23.9%
Administrative and General Exp. and Mgmt Remun. (15,411) -4.1% (12,912) -3.7% 19.4% (44,461) -4.0% (38,856) -3.7% 14.4%
Depreciation and Amortization (8,171) -2.2% (7,029) -2.0% 16.2% (23,760) -2.1% (21,074) -2.0% 12.7%
Profit Sharing (6,694) -1.8% - N.A N.A (14,318) -1.3% - N.A N.A
Other net operating income (expenses) (6,654) -1.8% (7,362) -2.1% -9.6% (14,146) -1.3% (16,475) -1.6% -14.1%
Operating Income Before Financial ResultsOperating Income Before Financial ResultsOperating Income Before Financial ResultsOperating Income Before Financial Results 48,57648,57648,57648,576 13.0%13.0%13.0%13.0% 34,60334,60334,60334,603 9.9%9.9%9.9%9.9% 40.4%40.4%40.4%40.4% 134,866134,866134,866134,866 12.2%12.2%12.2%12.2% 104,647104,647104,647104,647 10.0%10.0%10.0%10.0% 28.9%28.9%28.9%28.9%
Financial Income 19,061 5.1% 39,780 11.3% -52.1% 86,178 7.8% 83,747 8.0% 2.9%
Financial Expenses (5,744) -1.5% (9,276) -2.6% -38.1% (24,002) -2.2% (33,613) -3.2% -28.6%
Total Financial Income (Expenses)Total Financial Income (Expenses)Total Financial Income (Expenses)Total Financial Income (Expenses) 13,31713,31713,31713,317 3.6%3.6%3.6%3.6% 30,50430,50430,50430,504 8.7%8.7%8.7%8.7% -56.3% 62,17662,17662,17662,176 5.6%5.6%5.6%5.6% 50,13450,13450,13450,134 4.8%4.8%4.8%4.8% 24.0%
Operating IncomeOperating IncomeOperating IncomeOperating Income 61,89361,89361,89361,893 16.5%16.5%16.5%16.5% 65,10765,10765,10765,107 18.6%18.6%18.6%18.6% -4.9%-4.9%-4.9%-4.9% 197,042197,042197,042197,042 17.8%17.8%17.8%17.8% 154,781154,781154,781154,781 14.8%14.8%14.8%14.8% 27.3%27.3%27.3%27.3%
Income and Social Contribution Taxes - Current (7,591) -2.0% (4,365) -1.2% 73.9% (18,974) -1.7% (6,010) -0.6% 215.7%
Income and Social Contribution Taxes - Deferred (2,385) -0.6% (3,207) -0.9% -25.6% (304) 0.0% (303) 0.0% 0.3%
Net Income for the PeriodNet Income for the PeriodNet Income for the PeriodNet Income for the Period 51,91751,91751,91751,917 13.8%13.8%13.8%13.8% 57,53557,53557,53557,535 16.4%16.4%16.4%16.4% -9.8%-9.8%-9.8%-9.8% 177,764177,764177,764177,764 16.0%16.0%16.0%16.0% 148,468148,468148,468148,468 14.2%14.2%14.2%14.2% 19.7%19.7%19.7%19.7%
Allocated to controlling shareholders 51,917 13.8% 57,535 16.4% -9.8% 177,764 16.0% 148,468 14.2% 19.7%
Earnings per share - R$Earnings per share - R$Earnings per share - R$Earnings per share - R$
Allocated to controlling shareholders 0.3222 0.3577 -9.9% 1.1044 0.9229 19.7%
EBITDA EBITDA EBITDA EBITDA 63,81763,81763,81763,817 17.0%17.0%17.0%17.0% 48,75148,75148,75148,751 13.9%13.9%13.9%13.9% 30.9%30.9%30.9%30.9% 179,434179,434179,434179,434 16.2%16.2%16.2%16.2% 146,618146,618146,618146,618 14.1%14.1%14.1%14.1% 22.4%22.4%22.4%22.4%
Part. (%)Part. (%)Part. (%)Part. (%)R$ ThousandR$ ThousandR$ ThousandR$ Thousand 3Q173Q173Q173Q17 Part. (%)Part. (%)Part. (%)Part. (%) 3Q163Q163Q163Q16 Part. (%)Part. (%)Part. (%)Part. (%) 9M179M179M179M17 Part. (%)Part. (%)Part. (%)Part. (%) 9M169M169M169M16

8
NET INCOME AND NET MARGIN NET INCOME AND NET MARGIN NET INCOME AND NET MARGIN NET INCOME AND NET MARGIN
The company’s net income totaled R$ 51.9 million in the quarter, a 9.8% decrease compared to 3Q16. In addition to the
points discussed in the previous section, the result is also explained by:
• Net financial revenue of R$ 13.3 million, a 56.3% decrease compared to 3Q16 due to (i) the recognition of R$
16.7 million in financial income in that quarter, from a lawsuit related to Compulsory Loan to Eletrobrás in the
80’s and 90’s and (ii) lower net financial income, resulting from lower interest rate from investments, related
to a decrease in DI and Selic rates and lower average cash position.
• Higher effective income tax rate than observed in 3Q16, as a result of (i) extemporaneous credit recognized in
3Q16 and (ii) higher volume of imported items invoiced in the quarter.
CAPITAL EXPENDITURE CAPITAL EXPENDITURE CAPITAL EXPENDITURE CAPITAL EXPENDITURE
Investments totaled R$ 13.5 million in the quarter and its allocation prioritized:
• Higher amount to industrial plants, with emphasis on the new wave of implementation of the automated
boxing and distribution system (Sorter) in the Anápolis/GO Distribution Center;
• Investments in technology directed to omnichannel initiatives and sales systems’ integration.
The increase compared to 3Q16 is explained by the different phasing of investments, which in 2016 were concentrated
in the fourth quarter. For 2017, the Company expects to invest up to R$ 67.9 million, in line with the capital budget
approved at the Ordinary General Meeting.
Reconciliation of EBITDA - R$ thousandReconciliation of EBITDA - R$ thousandReconciliation of EBITDA - R$ thousandReconciliation of EBITDA - R$ thousand 3Q173Q173Q173Q17 3Q163Q163Q163Q16Chg.Chg.Chg.Chg.
3Q17 / 3Q163Q17 / 3Q163Q17 / 3Q163Q17 / 3Q169M179M179M179M17 9M169M169M169M16
Chg.Chg.Chg.Chg.
9M17 / 9M169M17 / 9M169M17 / 9M169M17 / 9M16
Net IncomeNet IncomeNet IncomeNet Income 51,91751,91751,91751,917 57,53557,53557,53557,535 -9.8%-9.8%-9.8%-9.8% 177,764177,764177,764177,764 148,468148,468148,468148,468 19.7%19.7%19.7%19.7%
(+) Income and Social Contribution Tax 9,976 7,572 N.A 19,278 6,313 N.A
(-) Net Financial Income (13,317) (30,504) -56.3% (62,176) (50,134) 24.0%
(+) Depreciation and Amortization 15,241 14,148 7.7% 44,568 41,971 6.2%
= EBITDA= EBITDA= EBITDA= EBITDA 63,81763,81763,81763,817 48,75148,75148,75148,751 30.9%30.9%30.9%30.9% 179,434179,434179,434179,434 146,618146,618146,618146,618 22.4%22.4%22.4%22.4%
EBITDA MarginEBITDA MarginEBITDA MarginEBITDA Margin 17.0%17.0%17.0%17.0% 13.9%13.9%13.9%13.9% 310 bp310 bp310 bp310 bp 16.2%16.2%16.2%16.2% 14.1%14.1%14.1%14.1% 210 bp210 bp210 bp210 bp

9
CASH CASH CASH CASH FLOWSFLOWSFLOWSFLOWS
In 3Q17, Cia. Hering generated R$ 27.9 million of free cash, similar to 3Q16. Company’s higher profitability (EBITDA)
was offset by greater need of working capital, notably in inventories, explained by manufacture anticipation of the High
Summer collection aiming at optimizing the Company’s manufacturing process.
In addition, the amount allocated to investments increased in comparison to the same period last year, as detailed in
the respective section.
There was a positive flow of R$ 3.1 million in the quarter from franchisees’ financing program who joined the Store
Refurbishment Plan in 2016.
INDEBTEDNESSINDEBTEDNESSINDEBTEDNESSINDEBTEDNESS
Cia. Hering ended 3Q17 with a net cash of R$ 176.9 million, as detailed below.
Cash Flow - Consol idated (R$ thousand)Cash Flow - Consol idated (R$ thousand)Cash Flow - Consol idated (R$ thousand)Cash Flow - Consol idated (R$ thousand) 3Q173Q173Q173Q17 3Q163Q163Q163Q16 Chg.Chg.Chg.Chg. 9M179M179M179M17 9M169M169M169M16 Chg.Chg.Chg.Chg.
EBITDAEBITDAEBITDAEBITDA 63,8 1763,8 1763,8 1763,8 17 48 ,75 148,75 148,75 148,75 1 15 ,06615 ,06615 ,06615 ,066 179,434179,434179,434179,434 146,6 18146,6 18146,6 18146,6 18 3 2 ,81 63 2,81 63 2,81 63 2,81 6
Non cash items 3,871 (5,475) 9,346 15,553 (3,409) 18,962
APV (Adjustment to Present Value) - Clients and Suppliers 6,821 3,858 2,963 17,585 14,715 2,870
Current Income tax and Social Contribution (7,591) (4,365) (3,226) (18,974) (6,010) (12,964)
Working Capital CapexWorking Capital CapexWorking Capital CapexWorking Capital Capex (25,5 87)(25,5 87)(25,5 87)(25,5 87) (10 ,63 6)(10,63 6)(10,63 6)(10,63 6) (14 ,951)(14 ,951)(14 ,951)(14 ,951) (49 ,448)(49,448)(49,448)(49,448) 74 ,1 4274,1 4274,1 4274,1 42 (12 3,59 0)(12 3,59 0)(12 3,59 0)(12 3,59 0)
(Increase) decrease in trade accounts receivable 19,989 7,102 12,887 54,829 99,824 (44,995)
(Increase) decrease in inventories (50,075) (32,013) (18,062) (108,060) (19,443) (88,617)
Increase (decrease) in accounts payable to suppliers (8,814) 25,329 (34,143) (25,810) 12,581 (38,391)
(Decrease) in taxes payable 1,672 (4,418) 6,090 (8,104) (21,043) 12,939
Refurbishment Project - Franchisee Financing 3,144 (6,117) 9,261 9,146 (8,612) 17,758
Others 8,497 (519) 9,016 28,551 10,835 17,716
CapExCapExCapExCapEx (13,3 86)(13,3 86)(13,3 86)(13,3 86) (4 ,30 3)(4 ,30 3)(4 ,30 3)(4 ,30 3) (9 ,083)(9 ,083)(9 ,083)(9 ,083) (34 ,682)(34,682)(34,682)(34,682) (14 ,2 58)(14,2 58)(14,2 58)(14,2 58) (2 0 ,42 4)(2 0,42 4)(2 0,42 4)(2 0,42 4)
Free Cash FlowFree Cash FlowFree Cash FlowFree Cash Flow 27,9 4527,9 4527,9 4527,9 45 27 ,83 027,83 027,83 027,83 0 115115115115 109,468109,468109,468109,468 211,7 98211,7 98211,7 98211,7 98 (10 2,33 0)(10 2,33 0)(10 2,33 0)(10 2,33 0)
Management and Ac counting Cash Flow Conc i l iation (R$ thousand)Management and Ac counting Cash Flow Conc i l iation (R$ thousand)Management and Ac counting Cash Flow Conc i l iation (R$ thousand)Management and Ac counting Cash Flow Conc i l iation (R$ thousand) 3Q173Q173Q173Q17 3Q163Q163Q163Q16 Chg.Chg.Chg.Chg. 9M179M179M179M17 9M169M169M169M16 Chg.Chg.Chg.Chg.
DFC - Cash prov ided by operating ac tiv ities DFC - Cash prov ided by operating ac tiv ities DFC - Cash prov ided by operating ac tiv ities DFC - Cash prov ided by operating ac tiv ities 48,0 7048,0 7048,0 7048,0 70 58 ,77 958,77 958,77 958,77 9 (10 ,709)(10 ,709)(10 ,709)(10 ,709) 189,512189,512189,512189,512 261,4 75261,4 75261,4 75261,4 75 (7 1 ,96 3)(7 1,96 3)(7 1,96 3)(7 1,96 3)
Adjustment – Financ ial i tems al loc ated to operating c ashAdjustment – Financ ial i tems al loc ated to operating c ashAdjustment – Financ ial i tems al loc ated to operating c ashAdjustment – Financ ial i tems al loc ated to operating c ash (6 ,7 39)(6 ,7 39)(6 ,7 39)(6 ,7 39) (26 ,64 6)(26,64 6)(26,64 6)(26,64 6) 19 ,90719 ,90719 ,90719 ,907 (45 ,362)(45,362)(45,362)(45,362) (35 ,4 19)(35,4 19)(35,4 19)(35,4 19) (9 ,94 3)(9 ,94 3)(9 ,94 3)(9 ,94 3)
Unrealized exchange and monetary variation (742) - (742) (2,291) - (2,291)
Financial Result (13,317) (30,504) 17,187 (62,176) (50,134) (12,042)
APV (Adjustment to Present Value) - Clients and Suppliers 6,821 3,858 2,963 17,585 14,715 2,870
Interest paid on loans 499 - 499 1,520 - 1,520
DFC - Cash f lows from investing activ itiesDFC - Cash f lows from investing activ itiesDFC - Cash f lows from investing activ itiesDFC - Cash f lows from investing activ ities (13,3 86)(13,3 86)(13,3 86)(13,3 86) (4 ,30 3)(4 ,30 3)(4 ,30 3)(4 ,30 3) (9 ,083)(9 ,083)(9 ,083)(9 ,083) (34 ,682)(34,682)(34,682)(34,682) (14 ,2 58)(14,2 58)(14,2 58)(14,2 58) (2 0 ,42 4)(2 0,42 4)(2 0,42 4)(2 0,42 4)
Free Cash Flow GenerationFree Cash Flow GenerationFree Cash Flow GenerationFree Cash Flow Generation 27,9 4527,9 4527,9 4527,9 45 27 ,83 027,83 027,83 027,83 0 115115115115 109,468109,468109,468109,468 211,7 98211,7 98211,7 98211,7 98 (10 2,33 0)(10 2,33 0)(10 2,33 0)(10 2,33 0)
* The adjusted cash flow as presented above is not a Brazilian Generally Accepted Accounting Practice and IFRS financial performance measurement. The
information on this table was calculated for the management of the Company and has not been audited by independent auditors.
** Working Capital provisions in this Cash Flow Statement were reported as Non-cash items, which explains the difference between the reported figures in the
balance sheet.
Indebtedness - R$ thousandIndebtedness - R$ thousandIndebtedness - R$ thousandIndebtedness - R$ thousand 3Q173Q173Q173Q17% of % of % of % of
total debttotal debttotal debttotal debt2Q172Q172Q172Q17
% of % of % of % of
total debttotal debttotal debttotal debt3Q163Q163Q163Q16
% of % of % of % of
total debttotal debttotal debttotal debt
Short Term (1,481) 5% (2,651) 9% - 0%
Long Term (25,612) 95% (25,612) 91% - 0%
TotalTotalTotalTotal (27,093)(27,093)(27,093)(27,093) 100%100%100%100% (28,263)(28,263)(28,263)(28,263) 100%100%100%100% ---- 0%0%0%0%
(-) Cash and Cash Equivalents 204,014 212,666 270,599
(=) Net Cash(=) Net Cash(=) Net Cash(=) Net Cash 176,921176,921176,921176,921 184,403184,403184,403184,403 270,599270,599270,599270,599

KPMG Auditores Independentes, uma sociedade simples brasileira e firma-membro da rede KPMG de firmas-membro independentes e afiliadas à KPMG International Cooperative (“KPMG International”), uma entidade suíça.
KPMG Auditores Independentes, a Brazilian entity and a member firm of the KPMG network of independent member firms affiliated with KPMG International Cooperative (“KPMG International”), a Swiss entity.
KPMG Auditores Independentes
R. São Paulo, 31 - 1º andar - Sala 11 - Bairro Bucarein
89202-200 - Joinville/SC - Brasil
Caixa Postal 2077 - CEP 89201-970 - Joinville/SC - Brasil
Telefone +55 (47) 3205-7800, Fax +55 (47) 3205-7815
www.kpmg.com.br
Quarterly Information Review Report (A free translation of the original report in Portuguese)
To the Shareholders and Board of Directors Cia Hering Blumenau - SC Introduction We have reviewed the interim financial statements, individual and consolidated, of Cia Hering (“Company”) contained within the Quarterly Information for the quarter ended September 30, 2017, which comprise the balance sheet as of September 30, 2017 and the related statements of income and comprehensive income, for the three and nine months period then ended and the changes in shareholders’ equity and cash flows for the nine months period then ended, including the notes to the financial statements. Management is responsible for the preparation of the interim financial statements in accordance with the technical pronouncement CPC 21(R1) and IAS 34 - Interim Financial Reporting, issued by the International Accounting Standards Board - IASB, as well as for the presentation of these information in accordance with the standards issued by the Brazilian Securities and Exchange Commission (CVM) applicable to the Quarterly Information. Our responsibility is to express a conclusion on the interim financial statements based on our review. Scope of the review We conducted our review in accordance with Brazilian and international standards for reviewing interim financial information (NBC TR 2410 and ISRE 2410 - Review of Interim Financial Information Performed by the Independent Auditor of the Entity, respectively). An interim review consists principally of making enquiries and having discussions with persons responsible for financial and accounting matters, and applying analytical and other review procedures. An interim review is substantially less in scope than an audit conducted in accordance with auditing standards and, consequently, does not provide assurance that we would become aware of any or all significant matters that might be identified in an audit. Accordingly, we do not express such an audit opinion.

KPMG Auditores Independentes, uma sociedade simples brasileira e firma-membro da rede KPMG de firmas-membro independentes e afiliadas à KPMG International Cooperative (“KPMG International”), uma entidade suíça.
KPMG Auditores Independentes, a Brazilian entity and a member firm of the KPMG network of independent member firms affiliated with KPMG International Cooperative (“KPMG International”), a Swiss entity.
Conclusion about the interim financial statements Based on our review, we are not aware of any fact that leads us to believe that the individual and consolidated interim financial statements included in the quarterly information referred to above have not been prepared, in all material respects, in accordance with CPC 21(R1) and IAS 34 issued by the IASB applicable to the Quarterly Information and presented in accordance with the standards issued by the Brazilian Securities and Exchange Commission.
Other issues
Statements of value added The individual and consolidated interim financial statements, in relation to the statements of value added for the nine months period ended in September 30, 2017, prepared under the responsibility of the Company’s Management and presented as supplementary information regarding IAS 34, were submitted to review procedures performed jointly with the review of the interim quarterly information of the Company. In order to form our conclusion, we assessed if the statements are reconciled with the interim accounting information and records, as applicable, and if their form and content are in accordance with the criteria defined in CPC 09 - Statements of Value Added. Based on our review, we are not aware of any fact that would lead us to believe that the statements of value added aforementioned have not been fairly stated, in all material aspects, in relation to the interim financial statements, individual and consolidated, taken as a whole. Comparative interim financial information The amounts reported in the individual and consolidated balance sheets as of December 31, 2016 were previously audited by other independent auditors who issued an unqualified report on February 13, 2017. The amounts reported in the individual and consolidated statements of income and comprehensive income for the three and nine months period ended September 30, 2016 and changes in equity and cash flows for the three and nine months period ended September 30, 2016, were previously reviewed by other independent auditors who issued an unqualified report on October 21, 2016. The individual company and consolidated statements of value added for the nine month period ended September 30, 2016 were submitted to the same review procedures by those independent auditors and based on their review, those auditors issued an opinion reporting that nothing had come to their attention that caused them to believe that the accompanying statements of value added had not been prepared, in all material respects, in accordance with the individual and consolidated interim financial information taken as a whole. Joinville October 20, 2017 KPMG Auditores Independentes CRC SC-000071/F-8 Original report in Portuguese signed by Marcelo Lima Tonini Accountant CRC PR-045569/O-4 T - SC
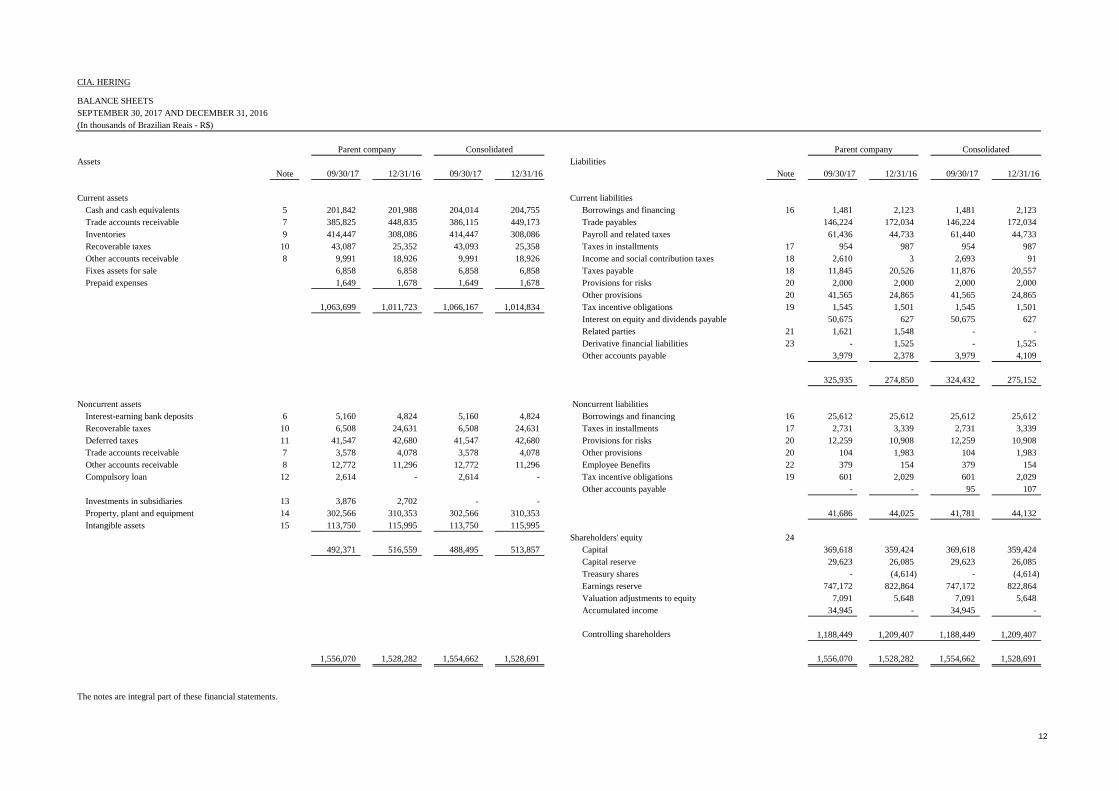
CIA. HERING
BALANCE SHEETSSEPTEMBER 30, 2017 AND DECEMBER 31, 2016(In thousands of Brazilian Reais - R$)
Assets LiabilitiesNote 09/30/17 12/31/16 09/30/17 12/31/16 Note 09/30/17 12/31/16 09/30/17 12/31/16
Current assets Current liabilitiesCash and cash equivalents 5 201,842 201,988 204,014 204,755 Borrowings and financing 16 1,481 2,123 1,481 2,123 Trade accounts receivable 7 385,825 448,835 386,115 449,173 Trade payables 146,224 172,034 146,224 172,034 Inventories 9 414,447 308,086 414,447 308,086 Payroll and related taxes 61,436 44,733 61,440 44,733 Recoverable taxes 10 43,087 25,352 43,093 25,358 Taxes in installments 17 954 987 954 987 Other accounts receivable 8 9,991 18,926 9,991 18,926 Income and social contribution taxes 18 2,610 3 2,693 91 Fixes assets for sale 6,858 6,858 6,858 6,858 Taxes payable 18 11,845 20,526 11,876 20,557 Prepaid expenses 1,649 1,678 1,649 1,678 Provisions for risks 20 2,000 2,000 2,000 2,000
Other provisions 20 41,565 24,865 41,565 24,865 1,063,699 1,011,723 1,066,167 1,014,834 Tax incentive obligations 19 1,545 1,501 1,545 1,501
Interest on equity and dividends payable 50,675 627 50,675 627 Related parties 21 1,621 1,548 - - Derivative financial liabilities 23 - 1,525 - 1,525 Other accounts payable 3,979 2,378 3,979 4,109
325,935 274,850 324,432 275,152
Noncurrent assets Noncurrent liabilitiesInterest-earning bank deposits 6 5,160 4,824 5,160 4,824 Borrowings and financing 16 25,612 25,612 25,612 25,612 Recoverable taxes 10 6,508 24,631 6,508 24,631 Taxes in installments 17 2,731 3,339 2,731 3,339 Deferred taxes 11 41,547 42,680 41,547 42,680 Provisions for risks 20 12,259 10,908 12,259 10,908 Trade accounts receivable 7 3,578 4,078 3,578 4,078 Other provisions 20 104 1,983 104 1,983 Other accounts receivable 8 12,772 11,296 12,772 11,296 Employee Benefits 22 379 154 379 154 Compulsory loan 12 2,614 - 2,614 - Tax incentive obligations 19 601 2,029 601 2,029
Other accounts payable - - 95 107 Investments in subsidiaries 13 3,876 2,702 - - Property, plant and equipment 14 302,566 310,353 302,566 310,353 41,686 44,025 41,781 44,132 Intangible assets 15 113,750 115,995 113,750 115,995
Shareholders' equity 24492,371 516,559 488,495 513,857 Capital 369,618 359,424 369,618 359,424
Capital reserve 29,623 26,085 29,623 26,085 Treasury shares - (4,614) - (4,614) Earnings reserve 747,172 822,864 747,172 822,864 Valuation adjustments to equity 7,091 5,648 7,091 5,648 Accumulated income 34,945 - 34,945 -
Controlling shareholders 1,188,449 1,209,407 1,188,449 1,209,407
1,556,070 1,528,282 1,554,662 1,528,691 1,556,070 1,528,282 1,554,662 1,528,691
The notes are integral part of these financial statements.
Parent company ConsolidatedConsolidatedParent company
12
CIA. HERING
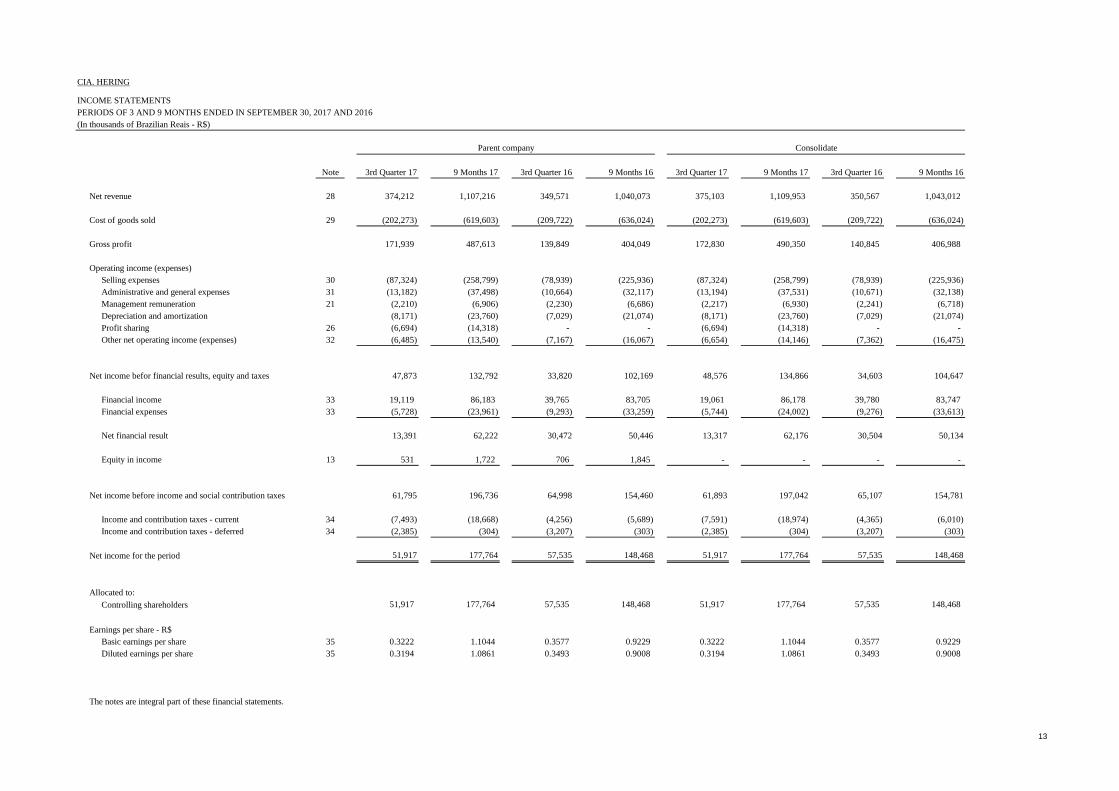
INCOME STATEMENTSPERIODS OF 3 AND 9 MONTHS ENDED IN SEPTEMBER 30, 2017 AND 2016(In thousands of Brazilian Reais - R$)
Note 3rd Quarter 17 9 Months 17 3rd Quarter 16 9 Months 16 3rd Quarter 17 9 Months 17 3rd Quarter 16 9 Months 16
Net revenue 28 374,212 1,107,216 349,571 1,040,073 375,103 1,109,953 350,567 1,043,012
3.04Cost of goods sold 29 (202,273) (619,603) (209,722) (636,024) (202,273) (619,603) (209,722) (636,024)
Gross profit 171,939 487,613 139,849 404,049 172,830 490,350 140,845 406,988
Operating income (expenses)3.06.01Selling expenses 30 (87,324) (258,799) (78,939) (225,936) (87,324) (258,799) (78,939) (225,936) 3.06.02.02Administrative and general expenses 31 (13,182) (37,498) (10,664) (32,117) (13,194) (37,531) (10,671) (32,138) 3.06.02.01Management remuneration 21 (2,210) (6,906) (2,230) (6,686) (2,217) (6,930) (2,241) (6,718) 3.06.02.03Depreciation and amortization (8,171) (23,760) (7,029) (21,074) (8,171) (23,760) (7,029) (21,074) 3.06.05.01Profit sharing 26 (6,694) (14,318) - - (6,694) (14,318) - - 3.06.05.02Other net operating income (expenses) 32 (6,485) (13,540) (7,167) (16,067) (6,654) (14,146) (7,362) (16,475)
3.06.03Net income befor financial results, equity and taxes 47,873 132,792 33,820 102,169 48,576 134,866 34,603 104,647
Financial income 33 19,119 86,183 39,765 83,705 19,061 86,178 39,780 83,747 Financial expenses 33 (5,728) (23,961) (9,293) (33,259) (5,744) (24,002) (9,276) (33,613)
3.06.03.02.023.06.06.02Net financial result 13,391 62,222 30,472 50,446 13,317 62,176 30,504 50,1343.06.06.01
Equity in income 13 531 1,722 706 1,845 - - - -
3.10Net income before income and social contribution taxes 61,795 196,736 64,998 154,460 61,893 197,042 65,107 154,7813.11
Income and contribution taxes - current 34 (7,493) (18,668) (4,256) (5,689) (7,591) (18,974) (4,365) (6,010) Income and contribution taxes - deferred 34 (2,385) (304) (3,207) (303) (2,385) (304) (3,207) (303)
Net income for the period 51,917 177,764 57,535 148,468 51,917 177,764 57,535 148,468
Allocated to:
Controlling shareholders 51,917 177,764 57,535 148,468 51,917 177,764 57,535 148,468
Earnings per share - R$Basic earnings per share 35 0.3222 1.1044 0.3577 0.9229 0.3222 1.1044 0.3577 0.9229 Diluted earnings per share 35 0.3194 1.0861 0.3493 0.9008 0.3194 1.0861 0.3493 0.9008
The notes are integral part of these financial statements.
Parent company Consolidate
13

CIA. HERING
STATEMENT OF COMPREHENSIVE INCOMEPERIODS OF 3 AND 9 MONTHS ENDED IN SEPTEMBER 30, 2017 AND 2016(In thousands of Brazilian Reais - R$)
Note 3rd Quarter 17 9 Months 17 3rd Quarter 16 9 Months 16 3rd Quarter 17 9 Months 17 3rd Quarter 16 9 Months 16
Net income 51,917 177,764 57,535 148,468 51,917 177,764 57,535 148,468
Items that can be subsequently reclassified to profit:Fair value of financial instruments of cash flow hedge - - 1,228 (8,363) - - 1,228 (8,363)
- - 1,228 (8,363) - - 1,228 (8,363)
Comprehensive income 51,917 177,764 58,763 140,105 51,917 177,764 58,763 140,1053
Profit allocated to: Controlling shareholders 51,917 177,764 58,763 140,105 51,917 177,764 58,763 140,105
4The notes are integral part of these financial statements.
Parent company Consolidated
14
CIA. HERING
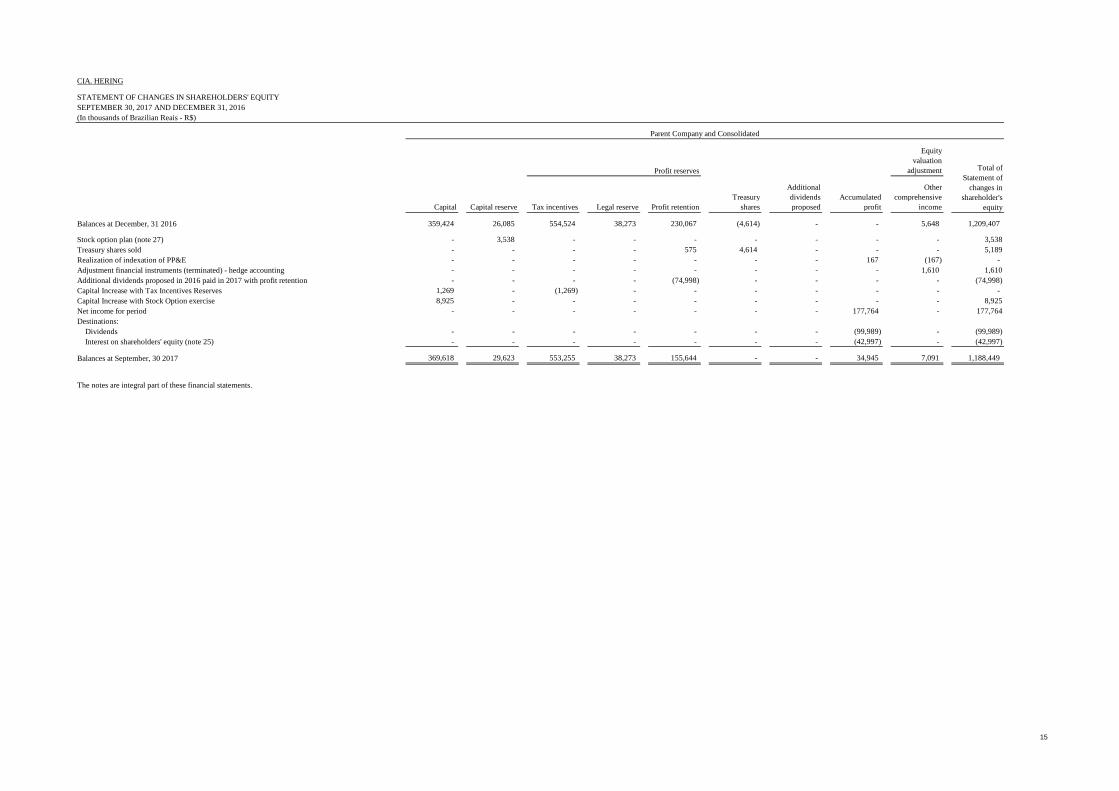
STATEMENT OF CHANGES IN SHAREHOLDERS' EQUITYSEPTEMBER 30, 2017 AND DECEMBER 31, 2016(In thousands of Brazilian Reais - R$)
Equity valuation
adjustment
Capital Capital reserve Tax incentives Legal reserve Profit retention Treasury
shares
Additional dividends proposed
Accumulated profit
Other comprehensive
income
Balances at December, 31 2016 359,424 26,085 554,524 38,273 230,067 (4,614) - - 5,648 1,209,407
Stock option plan (note 27) - 3,538 - - - - - - - 3,538Treasury shares sold - - - - 575 4,614 - - - 5,189Realization of indexation of PP&E - - - - - - - 167 (167) - Adjustment financial instruments (terminated) - hedge accounting - - - - - - - - 1,610 1,610Additional dividends proposed in 2016 paid in 2017 with profit retention - - - - (74,998) - - - - (74,998) Capital Increase with Tax Incentives Reserves 1,269 - (1,269) - - - - - - - Capital Increase with Stock Option exercise 8,925 - - - - - - - - 8,925Net income for period - - - - - - - 177,764 - 177,764Destinations:
Dividends - - - - - - - (99,989) - (99,989) Interest on shareholders' equity (note 25) - - - - - - - (42,997) - (42,997)
Balances at September, 30 2017 369,618 29,623 553,255 38,273 155,644 - - 34,945 7,091 1,188,449
The notes are integral part of these financial statements.
Parent Company and Consolidated
Profit reserves Total of Statement of
changes in shareholder's
equity
15

CIA. HERING
STATEMENT OF CHANGES IN SHAREHOLDERS' EQUITYSEPTEMBER 30, 2016 AND DECEMBER 31, 2015(In thousands of Brazilian Reais - R$)
Equity valuation
adjustment
Capital Capital reserve Tax incentives Legal reserve Profit retention Treasury
shares
Additional dividends proposed
Accumulated profit
Other comprehensive
income
Balances at December, 31 2015 346,368 20,569 424,298 28,302 344,179 (41,323) 39,994 - 11,577 1,173,964
Stock option plan (note 27) - 4,157 - - - - - - - 4,157Treasury shares cancel - - - - (36,323) 36,323 - - - - Treasury shares sold - - - - (10) 386 - - - 376Realization of indexation of PP&E - - - - - - - 170 (170) - Adjustment financial instruments (terminated) - hedge accounting - - - - - - - - (4,093) (4,093) Adjustment financial instruments (outstanding) - hedge accounting - - - - - - - - (4,270) (4,270) Additional dividends proposed in 2015 paid in 2016 - - - - - - (39,994) - - (39,994) Transfer of profit retention reserve 13,056 - - - (13,056) - - - - - Net income for period - - - - - - - 148,468 - 148,468Destinations:
Dividends and Interest on shareholders' equity (note 24.e and 25) - - - - - - - (42,086) - (42,086)
Balances at September, 30 2016 359,424 24,726 424,298 28,302 294,790 (4,614) - 106,552 3,044 1,236,522
The notes are integral part of these financial statements.
Parent Company and Consolidated
Profit reserves Total of Statement of
changes in shareholder's
equity
16

CIA. HERING
STATEMENT OF CASH FLOWS
PERIODS OF 9 MONTHS ENDED IN SEPTEMBER 30, 2017 AND 2016
(In thousands of Brazilian Reais - R$)
09/30/17 09/30/16 09/30/17 09/30/16
Cash flows from operating activities4.01.01.01
Net income of the period 177,764 148,468 177,764 148,468 Adjustments to reconcile net income to net cash generated by
4.01.01.02 operating activities:4.01.01.03 Deferred taxes 304 303 304 303 4.01.01.04 Unrealized exchange and monetary variation 2,365 (259) 2,291 - 4.01.01.05 Depreciation and amortization 44,568 41,971 44,568 41,971 4.01.01.06 Provision for doubtful accounts 8,729 6,173 8,729 6,173 4.01.01.07 Write-off of fixed assets 146 235 146 235
Stock option plan 3,538 4,157 3,538 4,157 Provision for adjustment to realizable value 1,699 5,774 1,699 5,774 Provisions for contingencies 3,830 3,070 3,830 3,070 Employee Benefits 225 1,584 225 1,584 Compulsory loan (2,614) (24,402) (2,614) (24,402) Equity in (loss) income of subsidiaries (1,722) (1,845) - -
4.01.02.01Changes in assets and liabilities4.01.02.02 Decrease in trade accounts receivable 54,781 99,467 54,829 99,824 4.01.02.03 (Increase) in inventories (108,060) (19,443) (108,060) (19,443) 4.01.02.04 Decrease in recoverable taxes 388 7,292 388 7,290 4.01.02.05 Decrease (increase) in other accounts receivable 7,488 (584) 7,488 (584) 4.01.02.06 (Decrease) increase in accounts payable to suppliers (25,810) 12,581 (25,810) 12,581 4.01.02.06 Increase (decrease) in accounts payable and provisions 31,559 (4,101) 29,821 (4,483)
Increase in IRPJ and CSLL 13,778 3,539 14,038 3,813 4.01.02.07 Income tax and social contribution paid (11,171) (3,460) (11,436) (3,722) 4.03.05 (Decrease) in taxes payable (10,706) (21,133) (10,706) (21,134)
Interest paid on loans (1,520) - (1,520) -
Cash provided by operating activities 189,559 259,387 189,512 261,475
Cash flows from investing activitiesDividends received 548 1,128 - -
4.02.01 Purchase of property, plant and equipment (22,620) (6,004) (22,620) (6,004) Purchase of intangible assets (12,062) (8,254) (12,062) (8,254)
Cash used in investing activities (34,134) (13,130) (34,682) (14,258)
4.03.01Cash flows from financing activities4.03.02Capital increase 8,925 - 8,925 - 4.03.07Interest earning bank deposits (336) (1,701) (336) (1,701) 4.03.03Interest on equity and dividends (167,936) (82,078) (167,936) (82,078)
Repayments of loans (1,413) (1,308) (1,413) (1,308) 4.03.06Disposal of treasury shares for the stock option plan 5,189 376 5,189 376
Cash used in financing activities (155,571) (84,711) (155,571) (84,711)
(Decrease) Increase in cash and cash equivalents (146) 161,546 (741) 162,506
4.05.01(Decrease) Increase in cash and cash equivalents4.05.02At the beginning of the period 201,988 104,325 204,755 108,093
At the end of the period 201,842 265,871 204,014 270,599
(146) 161,546 (741) 162,506
The notes are integral part of these financial statements.
Parent company Consolidated
17
CIA. HERING
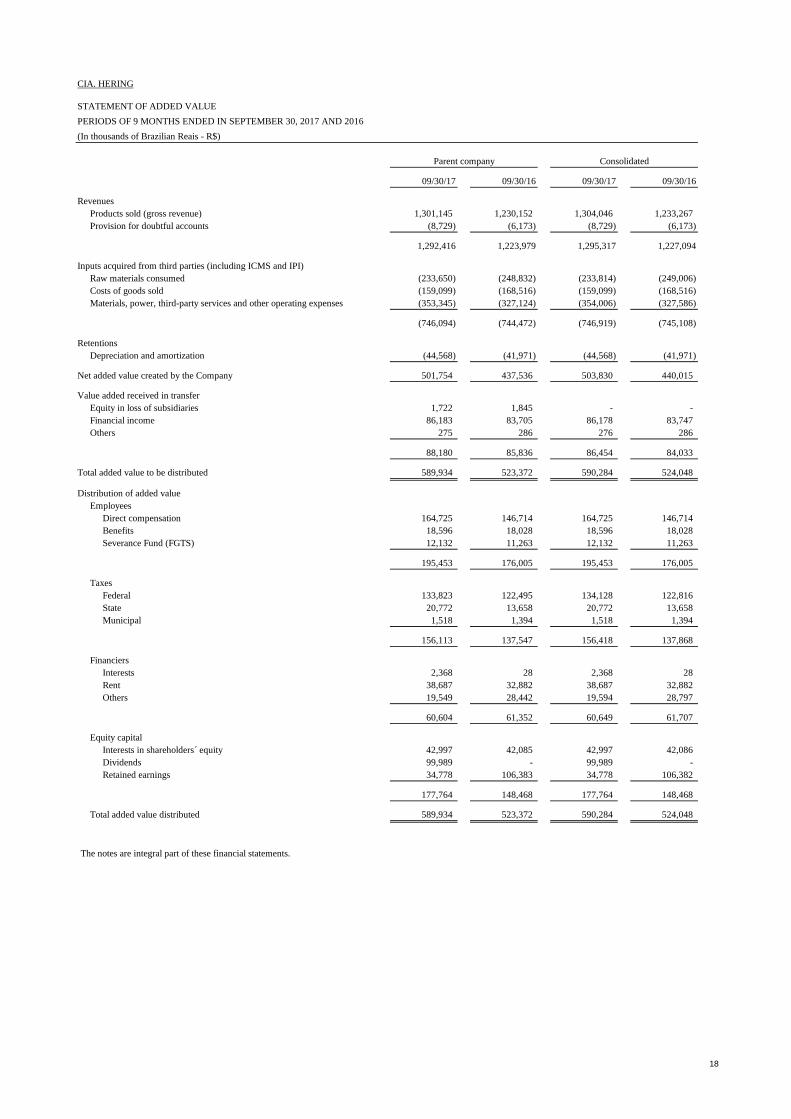
STATEMENT OF ADDED VALUE
PERIODS OF 9 MONTHS ENDED IN SEPTEMBER 30, 2017 AND 2016
(In thousands of Brazilian Reais - R$)
09/30/17 09/30/16 09/30/17 09/30/16
RevenuesProducts sold (gross revenue) 1,301,145 1,230,152 1,304,046 1,233,267 Provision for doubtful accounts (8,729) (6,173) (8,729) (6,173)
1,292,416 1,223,979 1,295,317 1,227,094
Inputs acquired from third parties (including ICMS and IPI)Raw materials consumed (233,650) (248,832) (233,814) (249,006) Costs of goods sold (159,099) (168,516) (159,099) (168,516) Materials, power, third-party services and other operating expenses (353,345) (327,124) (354,006) (327,586)
(746,094) (744,472) (746,919) (745,108)
RetentionsDepreciation and amortization (44,568) (41,971) (44,568) (41,971)
Net added value created by the Company 501,754 437,536 503,830 440,015
Value added received in transferEquity in loss of subsidiaries 1,722 1,845 - - Financial income 86,183 83,705 86,178 83,747 Others 275 286 276 286
88,180 85,836 86,454 84,033
Total added value to be distributed 589,934 523,372 590,284 524,048
Distribution of added valueEmployees
Direct compensation 164,725 146,714 164,725 146,714 Benefits 18,596 18,028 18,596 18,028 Severance Fund (FGTS) 12,132 11,263 12,132 11,263
195,453 176,005 195,453 176,005
TaxesFederal 133,823 122,495 134,128 122,816 State 20,772 13,658 20,772 13,658 Municipal 1,518 1,394 1,518 1,394
156,113 137,547 156,418 137,868
FinanciersInterests 2,368 28 2,368 28 Rent 38,687 32,882 38,687 32,882 Others 19,549 28,442 19,594 28,797
60,604 61,352 60,649 61,707
Equity capitalInterests in shareholders´ equity 42,997 42,085 42,997 42,086 Dividends 99,989 - 99,989 - Retained earnings 34,778 106,383 34,778 106,382
177,764 148,468 177,764 148,468
Total added value distributed 589,934 523,372 590,284 524,048
The notes are integral part of these financial statements.
Parent company Consolidated
18

19
CIA. HERING NOTES TO THE QUARTERLY FINANCIAL INFORMATION FOR THE PERIOD ENDED SEPTEMBER 30, 2017 AND 2016 (Amounts in thousands of Brazilian reais - R$, unless otherwise stated)
1 General information Cia. Hering, with main offices in Blumenau, Santa Catarina, and manufacturing units in the States of Santa Catarina, Goiás, and Rio Grande do Norte, was founded in 1880 and its key activity is the production and marketing of threads, fabrics, and knitwear, textiles and knitwear, and clothing in general. The Company's shares are traded on the New Market segment of São Paulo Stock Exchange (Bovespa), under the ticker symbol HGTX3.
2 Preparation basis (a) Statement of compliance with IFRS and CPCs (Accounting Pronouncements issued by the Accounting Pronouncements Committee) The company’s interim financial statements, contained in the Quarterly Financial Statements report as of September 30, 2017, comprise the individual and consolidated interim financial statements elaborated according to CPC 21 – Interim Financial Statements and IAS 34 – Interim Financial Reporting, issued by the IASB – International Accounting Standard Board and presented in accordance with the Brazilian Securities and Exchange Comission (“CVM”) laws related to Interim Financial Statements. The Company’s Administrators declare that all relevant information specific to the individual and consolidated quarterly information, and only such information, is being evidenced, and corresponds to the information used in management. The individual and consolidated interim financial information for the period ended September 30, 2017 was authorized for conclusion by Management on October 20, 2017. (b) Measurement basis The individual and consolidated quarterly financial information were prepared based on the historical cost, except for the defined benefit actuarial assets or liabilities that are recognized as the total net of plan assets, plus the unrecognized cost of prior service and unrecognized actuarial losses, net of unrecognized actuarial gains and the present value of the defined benefit obligation, the share based plan and derivative financial instruments, which are recognized at their fair values. (c) Functional currency and reporting currency This individual and consolidated quarterly financial information is presented in Brazilian Reais, which is the Company’s functional currency. All financial information presented in Brazilian Reais has been rounded to the nearest value, unless otherwise indicated.

20
(d) Use of estimates and judgments The preparation of individual and consolidated quarterly financial information according to IFRS and BR GAAP standards requires Management to make judgments, estimates and assumptions that affect the application of accounting principles and the reported amounts of assets, liabilities, income and expenses. Actual results may differ from these estimates. Estimates and assumptions are reviewed in a continuous manner. Revisions related to accounting estimates are recognized in the period when the estimates are revised and in any future period affected. Information about critical judgment referring to the accounting policies adopted which impact the amounts recognized in the individual and consolidated quarterly financial information, which may occasionally differ from realizable values, are included in the following notes: Note 11 - Realization of deferred income tax Note 20 – Provision for risk and other provisions Note 22 – Employee benefits Note 23 – Risk management and financial instruments Note 27 – Stock options plan measurement Note 36 - Classification and recording of lease agreements (e) Going Concern The quarterly financial information were prepared based on the assumption of continuity. Management has assessed the Company's ability to continue operating normally and is convinced that it has the resources to continue its business in the future. Management is not aware of any material uncertainties that could generate significant doubt as to its ability to continue operating.
3 Significant accounting policies The accounting policies summarized below have been consistently applied to all the periods presented in this individual and consolidated quarterly financial informations. (a) Consolidation base The consolidated quarterly financial information includes the quarterly financial information of Cia. Hering and its subsidiaries, as listed below:
País 09/30/17 12/31/16
Hering Internacional SAFI Uruguai 100.00 100.00
Participação (%)
HRG Comércio do Vestuário e IntermediaçãoBrasil 99.99 99.99
de Serviços Financeiros Ltda.
The quarterly financial information of the subsidiaries is included in the consolidated quarterly financial information as from the date they start to be controlled by the Company until the date such control ceases. The accounting policies of the subsidiaries are aligned with the policies adopted by the Company.

21
The quarterly financial information of subsidiaries is recognized under the equity method in the subsidiary’s individual quarterly financial information. Main procedures of consolidation: •••• Elimination of intercompany asset and liability account balances; •••• Elimination of investments in the equity of the subsidiaries; •••• Elimination of intercompany income and expense balances and unearned income arising from
intercompany transactions. Unrealized losses are eliminated in the same way as unrealized gains, but only to the extent that there is no evidence of impairment; and
•••• Identification of non-controlling interests in the consolidated quarterly financial information. (b) Foreign currency The Company’s Management has defined that its functional currency is the Real in accordance with the rules established in CPC 02 (R2) (IAS 21) - Effects of the Changes in Exchange Rates and Translation of Financial Statement, approved by CVM Resolution 640/10. Transactions in foreign currency, i.e. all transactions that are not carried out in the functional currency, are translated at the exchange rate on the dates of each transaction. Monetary assets and liabilities in foreign currency are translated into the functional currency at the exchange rate on the closing date. The gains and losses from the fluctuations in the exchange rates on monetary assets and liabilities are recognized in the statement of income. Non-monetary assets and liabilities acquired or contracted in foreign currency are translated based on the exchange rates on the dates of the transactions or on the dates of valuation at fair value when applicable. (c) Financial instruments (i) Non-derivative financial assets The Company initially recognizes the loans, receivables and deposits on the date that they are originated. All other financial assets (including assets designated at fair value through profit or loss) are initially recognized on the date of the negotiation under which the Company becomes a party to the contractual provisions of the instrument. The Company writes off a financial asset when the contractual rights to the cash flows from the financial asset expire, or when the Company transfers the contractual rights to receive the cash flows from a financial asset in a transaction that substantially transferred all the risks and rewards related to the ownership of the asset. Any interest in transferred financial assets that is created or retained by the Company is recognized as a separate asset or liability.
22
The Company has the following non-derivative assets: Investments held to maturity If the Company has the intent and capacity of holding to maturity the debt securities, these financial assets are classified as held to maturity. The investments held up to maturity are initially recognized at fair value plus any transaction costs directly assignable. After their initial recognition, investments held to maturity are measured at amortized cost using the effective interest rate method, reduced by any impairment losses. Any sale or reclassification of a significant amount of held-to-maturity investments not close to their maturity date would result in the reclassification of all held to-maturity investments as available-for-sale, preventing the Company from classifying investments as held-to-maturity for the current and the following two financial years.
Loans and receivables Loans and receivables are financial assets with fixed or determinable payments, but not quoted on any active market. Such assets are initially recognized at fair value plus any transaction costs directly assignable. After their initial recognition, loans and receivables are measured at amortized cost using the effective interest rate method, reduced by any impairment losses. Loans and receivables comprise trade accounts receivable and other credits. Cash and cash equivalents include balances of cash and interest earning bank deposits. (ii) Non-derivative financial liabilities The Company recognizes debt securities issued and subordinated liabilities on the date that they are originated. All other financial liabilities (including liabilities designated at fair value through profit or loss) are recognized initially on the negotiation date on which the Company becomes a party to the contractual provisions of the instrument. The Company writes off a financial liability when its contractual obligations are discharged, cancelled or settled. The Company has the following non-derivative financial liabilities: borrowings and financing, suppliers and other accounts payable. Such financial liabilities are initially recognized at fair value plus any transaction costs directly assignable. After their initial recognition, these financial liabilities are measured at amortized cost using the effective interest rate method. Financial assets and liabilities are offset and the net amount reported in the balance sheet only when there is a legally enforceable right to set off and there is intention to settle on a net basis, or to realize the asset and settle the liability simultaneously. (iii) Derivative financial liabilities The Company has derivative financial instruments to manage its exposure to currency risks, including forward foreign exchange contracts. Derivatives are initially recognized at fair value on contracting date and subsequently re-measured at fair value on period. Possible gains or losses are immediately recognized in income, unless derivative is assigned and effective as a hedge instrument, in this case, time of recognition in income depends on hedging relationship nature.

23
The Company assigns certain hedging instruments for risk in foreign exchange rates variation in firm commitments, as cash flow hedge. At the beginning of hedging relationship, for the adoption of the “ Hedge Accounting” the Company documents the relation between the hedge instrument and the hedged item with its objectives in risk management and its strategy to assume several hedging transactions. In addition, in the beginning of the hedge operation and continuously, the Company documents if the hedging instrument used in a hedging relationship is highly effective to offset in the hedged item's fair value or cash flow, attributable to the hedged risk. The effective portion of changes in derivatives’ fair value that is assigned and qualified as cash flow hedge is recognized in other comprehensive income. Gains or losses related to the ineffective portion are immediately recognized under “financial income”. Amounts previously recognized in other comprehensive income and accumulated in shareholders' equity are reclassified into income for the period in which the hedged item affects income, under the same statement of income caption in which such item is recognized. However, when a foreseen hedged transaction results in the recognition of a non-financial asset or liability, gains and losses previously recognized in other comprehensive income and accumulated in equity are transferred to the initial measurement of this asset or liability cost. “Hedge accounting” is interrupted when the Company cancels the hedging relationship, hedge instrument matures or is sold, rescinded or executed, or no longer qualifies as hedge accounting. Any gains or losses recognized in other comprehensive income and accumulated in equity on that date remain in equity and are recognized when foreseen transaction is finally recognized in income. When the foreseen transaction is no longer expected to occur, accumulated gains or losses that are deferred in shareholders' equity are immediately recognized in income. Derivatives that are not assigned as hedging instruments are classified as current assets or liabilities. Note 23 includes more detailed information on derivative financial instruments. (d) Cash and cash equivalents Includes cash balances, current accounts (demand bank deposits), short term investments (interest earning bank deposits) considered immediately marketable or convertible into a known sum of cash and subject to an insignificant risk of change of value. Interest earning bank deposits are presented at cost plus income calculated up to the balance sheet date and do not exceed the market value. (e) Trade accounts receivable Trade accounts receivable are recorded at the amount invoiced, adjusted to present value (note 7). The amount recorded as provision for doubtful accounts is considered sufficient by management to cover any losses on the realization of the receivables. (f) Inventories Inventories are measured at the lower value between the cost and net realizable value. The cost of inventories is based on the weighted cost of acquisition or production and includes expenditures for acquiring, production and conversing costs, as well as other costs incurred in bringing them to their existing location and condition. In the case of manufactured inventories and work in progress, cost includes an appropriate share of overheads based on normal operating capacity.

24
The net realizable value is the estimated price at which inventories can be realized in the normal course of business, deducted from the estimated completion costs and selling expenses. (g) Property, plant and equipment (PP&E) (i) Recognition and measurement PP&E items are stated at historical acquisition or construction cost, net of accumulated depreciation and impairment losses, when applicable. Purchased software that is integral to the functionality of a piece of equipment is capitalized as part of that equipment. When parts of a PP&E item have different useful lives, they are accounted for as separate items (major components) of PP&E. Gains and losses on disposal of a PP&E item are determined by comparing the proceeds from disposal with the carrying amount of PP&E and are recognized net within "Other income" in the income statement. (ii) Depreciation Depreciation is calculated over the depreciable amount, which is the cost of an asset, or other amount substituted for cost. The residual value of the assets written off is not material, and, accordingly, is not considered in the determination of the depreciable amount. Depreciation is recognized in the income statement using the straight-line method over the estimated useful life of each part of an item of property, plant and equipment, since this is the method that best reflects the consumption pattern of the future economic benefits embodied in the asset. Land is not depreciated. The estimated useful lives for the current period were calculated using the weighted average useful life of the assets of each group, are presented below:
Average useful life (years)
Buildings and improvements 31.48 Facilities and production equipament 9.44 Furniture and fixtures 6.28 Computer and peripherals 4.78 Vehicles 4.52 Leasehold improvements 7.58
Description
The depreciation methods, useful lives and residual values will be reviewed at each reporting date and potential adjustments will be recognized as a change in accounting estimates prospectively.

25
(iii) Subsequent costs The replacement cost of a component of PP&E is recognized in the carrying value of the item when it is probable that the future economic benefits embodied in the component will flow to the Company and its cost can be reliably measured. The carrying amount of the component that is replaced is written off. Costs of normal maintenance on property, plant and equipment are charged to the income statement as incurred. (h) Intangible assets (i) Recognition and measurement The Company's intangible assets are trademarks and patents, right to use properties and software. The value of patents and trademarks refers to the registration of the Company's brands at the competent national and international entities that are amortized according to the validity of the records. Right to use properties refers to the registration of commercial sites of the own stores that are amortized according to term defined in the contract. The software value refers to third parties software acquired and internally generated that are amortized over the useful life defined. All of them have defined useful lives and are measured at cost, net of accumulated amortization and impairment losses. (ii) Amortization Amortization is calculated over the cost of the asset, or other amount substituted for cost. Amortization is recognized in profit or loss on a straight-line basis over the estimated useful lives of the intangible assets from the date they are available for use, since this is the method that best reflects the consumption pattern of the future economic benefits embodied in the asset. The useful estimated lives are as follows:
Trademarks and patents 10.00 Right to use properties 4.99 Software licenses 8.64
Description
(iii) Subsequent expenditures Subsequent expenditures are capitalized only when they increase the future economic benefits embodied in the specific asset to which they relate. All other expenditures, are recognized in profit or loss as incurred.

26
(i) Impairment (i) Financial assets (including receivables) A financial asset measured at fair value through profit or loss is assessed at each reporting date for objective evidence of impairment. An asset is impaired when there is objective evidence that a loss event has occurred after the initial recognition of the asset, and that such loss event had a negative effect on the estimated future cash flows of that asset that can be reliably estimated. The objective evidence that financial assets are impaired may include default or late payment by a debtor, restructuring of the amount owed to the Company under conditions that would not be considered in other transactions or indications that a debtor or issuer will declare bankruptcy. The company considers evidence of loss of value for loans and receivables. All significant loans and receivables are assessed for impairment. A decrease in the recoverable value of a financial asset measured at amortized cost is calculated as the difference between the asset's carrying amount and the present value of estimated future cash flows discounted at the financial asset's original effective interest rate. The losses are recognized in a provision in the income statement against receivables. Interest on the impaired asset continues to be recognized through the reversion of the discount. When a subsequent event causes the amount of the impairment loss to decrease, the decrease in impairment loss is reversed through profit or loss. (ii) Non-financial assets The carrying values of non-financial assets of the Company are reviewed each period to determine whether there is sign of loss in the recovery value (impairment). If such indication exists, the asset's recoverable amount is determined. The Administration has not identified any information that showed loss of recoverable value of nonfinancial assets. (j) Leasing The Company is the lessor under store lease agreements. The Company reviewed these agreements and classified them as operating lease, since it does not substantially transfer the risks and rewards of the ownership of the leased property to the lessee. Payments are recorded in the income statement linearly over the period of the leasing.

27
(k) Employee benefits (i) Defined benefit plans A defined benefit plan is a post-employment benefit plan other than the defined contribution plan. The Company possess medical aid and private pension plan for its employees (defined benefit plans). For both cases, the actuarial calculations are performed annually by a qualified and independent actuary hired by the Company. The Company's net obligation in respect of defined benefit pension plans is calculated separately for each plan by estimating the amount of the future benefit that employees have earned in return for their service in the current and prior periods; that benefit is discounted to their present value. Any unrecognized prior service costs and the fair values of any plan assets are deducted. The discount rate is the yield of prime debt securities at the reporting date, whose maturity dates approximate the terms and conditions of the Company's obligations and are denominated in the same currency in which the benefits are expected to be settled. In the case of the pension plan, when the calculation results in a benefit for the Company, the asset to be recognized is limited to the total of any unrecognized prior service costs and the present value of the economic benefits available as future plan refunds or reduction in the future payments. In order to calculate the present value of the economic benefits, consideration is given to any minimum funding requirements that apply to any Company plan. An economic benefit is available to the Company when it is realizable over the plan life, or upon settlement of the plan's liabilities. When the benefits of a plan are increased, the portion of the increased benefit relating to past service by employees is recognized as an expense in the income statement on a straight-line basis over the average period until the benefits become vested. To the extent that the benefits vest immediately, the expense is recognized immediately in the income statement. Remeasurements, composed of gains and losses, the effect of the limit of assets (assets ceiling) and the return on plan assets, both excluding net interest, are recognized in the statement of comprehensive income, if at all, in the period in which they occur. Remeasurements are not reclassified to profit or loss in subsequent periods. The Company recognizes all actuarial gains and losses resulting from defined benefit plans in other comprehensive income. (ii) Other long-term benefits to employees The Company’s net obligation in relation to employee benefits other than pension plans and health plans is the amount of the future benefit that employees have earned in return for their service in the current and prior years. That benefit is discounted to calculate its present value, and the fair value of any related assets is deducted. The calculation is performed on the projected unit credit method. Any actuarial gains and losses are recognized in the income (loss) in the period they occur. (iii) Short-term benefits to employees Obligations for short-term employee benefits are measured on a non-discounted basis and incurred as expenses as the related service is rendered. The liability is recognized at the amount expected to be paid under the cash bonus plans or short-term profit sharing if the Company has a legal or constructive obligation to pay this amount as a result of prior service rendered by the employee, and the obligation can be reliably estimated.

28
(iv) Share-based transactions The effects of the share based plan are calculated based on the fair value and recognized in the balance sheet and statement of income at the extent the contractual conditions are met. (l) Provisions A provision is recorded when the Company has a legal or constructive obligation as a result of a past event, which can be reliably estimated, and it is probable that an outflow of funds will be required to settle the obligation. If the effect of the amount over time is significant, provisions are calculated by discounting the expected future cash flows at a pre-tax rate which reflects the current market evaluations as to the value of the cash over time and the specific risks of the liability. (m) Adjustment to present value Fixed purchase and sale transactions in installments were brought to present value on transactions date, based on deadlines and at the rate of 0.66% p.m. and 0.85% p.m., respectively. These rates represent SELIC rate for the period in purchase transactions and discount rate in early payment of sale transactions. No assumptions were made that took into account credit risk factors or other risks, because the Company uses a simplified model and because of the operations’ characteristics. The average days sales outstanding is 77 days and the average days payable outstanding is 46 days. The “Prodec III” tax incentive, subject to annual interest of 4%, was adjusted to present value at the Company’s average borrowing rate. The adjustment to present value of purchases is recorded to trade payables and charged to financial income/loss, over the duration of the term in the case of trade payables. The adjustment to present value of credit sales is charged to trade receivables and the realization thereof is recorded under financial income/loss over the duration of the term. The adjustment to present value of tax incentive obligations and non-current taxes payable and the contra entry thereof are recorded under financial income/loss. (n) Capital Common shares are classified as shareholders' equity. Additional costs directly attributable to the issue of shares and share options are recognized as a deduction from shareholders' equity, net of any tax effects. The minimum mandatory dividends, as established in the by-laws, are recognized as liabilities when approved by the General Assembly. (i) Treasury Shares The Company's own equity instruments that are repurchased (treasury shares) are recorded at cost, as a reduction of equity. No gain or loss is recognized in the statement of income on the purchase, sale, issue or cancellation of the Company's own equity instruments.

29
(o) Operating income - Sale of goods The operating revenue from sales of assets in the normal course of business is measured by the fair value of the installment received or receivable. Operating revenue is recognized when there is convincing evidence that the risks and rewards inherent to the ownership of the assets have been transferred to the purchaser, it is probable that the financial economic benefits will flow to the Company, the related costs and potential return of goods can be reliably estimated, there is no continued involvement with the goods sold, and the amount of operating revenue can be reliably measured. Operating revenue from company-owned stores is recognized after billing and delivery of merchandise to the customer. The operating revenue from retail and the franchise network on the domestic and international market is recognized after billing and exit of the goods from the Company's establishment. The Company also monitors the delivery deadline for merchandise to customers and makes adjustments to operating income when necessary. In the event it is probable that discounts will be granted and their amounts can be reliably measured, the discounts are recognized as a deduction from operating revenue as the related sales are recognized. (p) Government grants and assistance Government grants and assistance are recognized when there is reasonable assurance that the terms and conditions set forth by the granting governments have been fulfilled and are calculated and recorded in accordance with the contracts, agreements and legislation applicable to each incentive, as described in note 19. The effects on the income statement are recorded on the accrual basis, where gains are recorded on the sales deductions - taxes, in the cost of goods sold and financed amounts are recorded under current and noncurrent liabilities and restated in accordance with the respective contracts.
(q) Financial income and expenses
Financial revenues comprise income from interest on interest earning bank deposits, adjustment to present value and other sundry revenues. These interest income are recognized in profit or loss. The Company also has revenue from foreign exchange, which is also accounted for directly in profit or loss. The distributions received from investees recorded under the equity method reduce the amount of the investment. Financial expenses include interest expenses on borrowings, financial charges on taxes and adjustment to present value. These interest expenses and revenue are recognized in profit or loss. The Company also has an expense from foreign exchange, which is also accounted for directly in profit or loss. Borrowing costs which are not directly attributable to the acquisition, construction, or production of a qualifying asset are accounted for in profit or loss using the effective interest rate method. (r) Income and social contribution taxes Income and social contribution taxes, both current and deferred, are calculated based on the rates of 15%, plus a surcharge of 10% on taxable income in excess of R$ 240 for income-tax, and 9% on taxable income for social contribution on net income, and include the offsetting of tax loss carry forward and negative basis of social contribution, limited to 30% of the taxable income.
The income tax and social contribution expense comprises current and deferred taxes on income. Current and deferred income tax is recognized in profit or loss. The deferred tax that refers to the actuarial liability employee benefits is recognized in comprehensive results when it refers to liabilities related to actuarial gains or losses. Deferred tax referring to the derivative financial instrument assigned to hedge accounting is recognized in other comprehensive income, when referring to the portion assigned to and classified as hedge accounting recognized in other comprehensive income.

30
Current taxes are the taxes payable or receivable on the taxable income or loss for the year, at tax rates enacted or substantively enacted at the reporting date of the quarterly financial information, and any adjustments to taxes payable in relation to prior years.
Deferred taxes are recognized in relation to the temporary differences between the carrying amounts of assets and liabilities for accounting purposes and the related amounts used for taxation purposes. Deferred taxes are measured at the tax rates expected to be applied upon the reversal of temporary differences, based on the laws enacted or substantively enacted up to the reporting date of the quarterly financial information.
Deferred tax assets and liabilities are offset when there is a legal enforceable right to set off current tax assets against tax liabilities, and if they relate to income taxes levied by the same tax authority on the same taxable entity.
A deferred income tax and social contribution asset is recognized for unused tax losses, tax credits and deductible temporary differences, to the extent that it is probable that future taxable income will be available against which the unused tax losses and credits can be utilized. Deferred income tax and social contribution assets are reviewed at each reporting date and reduced when their realization is no longer probable.
(s) Income per share
The basic earnings per share are calculated based on the result for the period attributable to the Company's controlling and non-controlling shareholders and the weighted average of outstanding common shares in the respective period. The diluted earnings per share are calculated based on the mentioned average of outstanding shares, adjusted by instruments that can be converted into shares, with a dilution effect, in the periods presented, pursuant to CPC 41 and IAS 33.
(t) Segment information
An operating segment is a component of the Company which engages in business activities from which it may earn revenues and incur expenses, including revenues and expenses relating to transactions with other components of the Company. All operating results of the operating segments are frequently reviewed by the Executive Management for decisions regarding the resources to be allocated to the segment to be taken and to assess their performance, for which individual quarterly financial information is available.
The Company and its subsidiaries have a single operating segment: the manufacture and sale of apparel and accessories, as disclosed in note 37.
(u) Statement of Added Value
The purpose of this statement is to evidence wealth created by the Company and its distribution during a certain period, and is presented by the Company as required by the Brazilian corporate law, as part of its individual quarterly financial information and as supplementary information to consolidated quarterly financial information, since it is not a statement provided for or mandatory according to IFRS’s.
The SAV has been prepared based on information obtained from the accounting records used as a basis for the preparation of the quarterly financial information and following the dispositions in CPC 09 - Statement of Added Value. The first part of the SAV presents the wealth created by the Company, represented by revenues (gross sales revenue, including taxes on sales, other revenues and the effects of the allowance for doubtful accounts), inputs purchased from third parties (cost of sales and purchases of materials, electric power, outside services, including taxes on purchases, effects of impairment and recovery of assets, and depreciation and amortization) and the value added received from third parties (profit sharing from associates, subsidiaries and joint ventures, financial income and other income). The second part of the SAV presents the distribution of wealth among personnel and payroll charges, taxes and contributions, lenders and shareholders.
31
(v) Adoption of new and reviewed IFRS’s New standards and interpretations not effective yet
Several new standards or amendments to standards and interpretations will become effective for the years started after January 1, 2018. The Company has not adopted such changes in the preparation of these quarterly financial informations and does not plan to adopt these standards in advance.
- IFRS 15 Income from Contracts with Clients - IFRS 15 introduces a comprehensive framework for determining whether and when income is recognized, and how income is measured. IFRS 15 replaces current income recognition standards, including CPC 30 (IAS 18) Income, CPC 17 (IAS 11) Construction Contracts, and CPC 30 Interpretation A (IFRIC 13) Client Loyalty Programs. IFRS 15 becomes effective for annual periods starting on or after January 1, 2018.
- IFRS 9 Financial Instruments - IFRS 9 replaces guidelines of IAS 39 (CPC 38) Financial Instruments: Recognition and measurement. IFRS 9 includes new models for the classification and measurement of financial instruments and measurement of expected credit losses for financial and contractual assets, and new requirements on hedge accounting. The new standard maintains the IAS 39 guidelines about acknowledging and disacknowledging financial instruments. IFRS 9 becomes effective for annual periods starting on or after January 1, 2018.
- IFRS 16 Leases – IFRS 16 introduces a single model for recognizing leases on the balance sheet for lessees. A lessee recognizes a right of use asset, which represents its right to use the leased asset, and a lease liability, which represents its obligation to make lease payments. Optional exemptions are available for short-term leases and low-value items. The lessor’s accounting remains similar to the current standard, i.e., the lessors continue to classify the leases as financial or operating leases.
- IFRS 16 replaces existing lease standards, including CPC 06 (IAS 17) Leasing Operations, and ICPC 03 (IFRIC 4, SIC 15 and SIC 27) Complementary Aspects of Lease Operations. The standard will become effective in years starting on or after January 1, 2019.
• Changes to CPC 10 (IFRS 2) Share-Based Payment, in relation to the classification and measurement of certain share-based payment transactions. The standard will become effective in years starting on or after January 1,2018. The Accounting Pronouncements Committee has not yet issued any accounting pronouncement or amendments in current pronouncements corresponding to all new IFRS. Therefore, the early adoption of these IFRS is not permitted for entities that disclose their financial statements according to accounting practices adopted in Brazil. The Company is conducting an evaluation of the impacts resulting from the application of the aforementioned standards and expects to disclose additional information prior to its effective adoption.

32
4 Determination of the fair value A number of the Company's accounting policies and disclosures require the determination of fair value, for both financial and non-financial assets and liabilities. Fair values have been determined for measurement and/or disclosure purposes based on the following methods. When applicable, further information about the assumptions made in determining fair values is disclosed in the notes specific to that asset or liability.
(i) Trade accounts receivable and other credits The fair value of accounts receivable and other receivables is estimated as the present value of future cash flows, discounted at the market interest rate on presentation date.
(ii) Non-derivative financial assets and liabilities
The fair value that is determined for disclosure purposes is calculated based on the present value of principal and future cash flows, discounted at market interest rate on quarterly financial information date.
(iii) Derivative financial assets and liabilities Future exchange contracts are measured based on foreign exchange rates and yield curves obtained based on quotations and with the same maturities of contracts. (iv) Share-based plan
The fair value of employee's share options and the rights on the valuation of shares are measured using the Black-Scholes method for the 1st to 5th program and Binomial for the 6th to 10th program.
Measurement variations occur for share prices on measurement date, instrument exercise price, estimated volatility (based on historic volatility weighted average adjusted for expected changes based on publicly-available information), life of instruments weighted average (based on historic experience and general behavior of the option owner), expected dividends and interest rate free of risk (based on public securities). Out-of-market service and performance conditions inherent to transactions are not taken into consideration on fair value determination. The effects of the share based plan are calculated based on the fair value and recognized in the balance sheet and statement of income at the extent the contractual conditions are met (note 27).

33
5 Cash and cash equivalents
Current assets 09/30/17 12/31/16 09/30/17 12/31/16
Cash and banks 12,305 17,468 14,477 18,389 Cash and banks/foreign currency 118 1,376 118 3,222 Financial investments:
Fixed Income – Bank Deposit Certificate CDB
From 98.0% to 101.0% CDI 117,200 70,570 117,200 70,570
Fixed Income – Repurchase operations
From 100.0% to 100.5% CDI 72,219 112,574 72,219 112,574
201,842 201,988 204,014 204,755
Consolidated
Interest in 2017
Parent company
Short-term investments are readily convertible into a known amount of cash and subject to an insignificant risk of a change in value, and have therefore been considered as cash equivalents in the cash flow statements.
6 Interest-earning bank deposits – Securities Held to maturity The Company holds R$ 5,160 (R$ 4,824 on December 31, 2016) of investments in Bank Deposit Certificates (CDB), earning interests from 95.0% to 100.5% of CDI, which will be held until maturity. Of the total amount of these investments, R$ 655 (R$ 614 on December 31, 2016) are related to tax incentive transactions (decrease by reinvestment - IRPJ) made by the Company that, once the investments are proven to be made in the industrial unit that received the incentive (Parnamirim – RN), the amounts will be released to the Company, and R$ 4,505 (R$ 4,210 on December 31, 2016) are related to the Hering-Prev Benefit Plan, to tackle the resulting deficit existing in the plan, under the terms of article 21, of Complementary Law No. 109, of May 29, 2001, and Resolution No. 26, of September 29, 2008, establishing the end of the costing plan in the year 2026, the due date to fulfill this obligation.

34
7 Trade accounts receivable
Current 09/30/17 12/31/16 09/30/17 12/31/16
Domestic market 389,470 452,131 389,760 452,469 Foreign market 17,547 16,500 17,547 16,500
407,017 468,631 407,307 468,969
Adjustments to present value (5,656) (6,267) (5,656) (6,267) Provision for doubtful accounts (15,536) (13,529) (15,536) (13,529)
(21,192) (19,796) (21,192) (19,796)
385,825 448,835 386,115 449,173
Non Current
Domestic market 3,578 4,078 3,578 4,078
3,578 4,078 3,578 4,078
389,403 452,913 389,693 453,251
Parent company Consolidated
Changes in the adjustment to present value during the year was as follows:
09/30/17 12/31/16
At the beginning of the period (6,267) (8,473) Additions (32,434) (42,323) Write-offs 33,045 44,529
At the end of the period (5,656) (6,267)
Parent company and consolidated
The adjustment to present value will be realized according to the maturity date, which is 77 days on average. The company's exposure to credit and currency risks related to accounts receivable is disclosed in note 23.

35
8 Other accounts receivable
Current 09/30/17 12/31/16
Advance to domestic suppliers 438 245 Advance to employees 2,906 3,979 Trade accounts receivable refurbishment plan Franchisee 6,427 14,589 Other 220 113
9,991 18,926
Parent company and Consolidated
Noncurrent 09/30/17 12/31/16
Fomentar 838 838 Judicial deposits - INSS - 1,965 Judicial deposits - Other 2,779 725 Judicial deposits - Labor and Civil 8,329 6,918 Other 826 850
12,772 11,296
Parent company and Consolidated
9 Inventories
09/30/17 12/31/16
Finished goods 178,323 128,308 Resale goods 98,731 70,873 Work in process 65,436 45,331 Inventories held by third parties 14,060 18,962 Raw materials and warehouse materials 66,426 50,277 Imports in transit 10,168 11,715 Advance to suppliers 741 359 Provision for adjustment to realizable value (19,438) (17,739)
414,447 308,086
Parent company and Consolidated

36
Certain items considered obsolete, or slow moving, as well as surplus collections, were subject to the formation of provisions for adjustment to the realizable value. During the period, the provision for adjustment of inventories to the net realizable value showed the following movement:
09/30/17 12/31/16
At the beginning of the period/year (17,739) (11,502) Constitution of provision (11,093) (19,224) Reversal of provision by sale 9,394 12,987
At the end of the period/year (19,438) (17,739)
Parent company and consolidated
No inventories have been pledged as collateral.
10 Recoverable taxes The Company and its subsidiaries have tax credits that are recorded in current and in non-current assets according to the expected realization period, as shown below:
Current 09/30/17 12/31/16 09/30/17 12/31/16
IPI 338 385 338 385 ICMS to recover (State VAT) 29,566 1,497 29,566 1,497 ICMS to recover (PP&E) 1,915 1,763 1,915 1,763 IRPJ and CSLL to offset (a) 68 11,960 68 11,960 INSS to recover (b) 2,140 - 2,140 - Withholding Income Tax (IRRF) to offset 4,133 3,268 4,133 3,268 PIS and COFINS to recover (c) 3,598 5,779 3,598 5,779 Other 1,329 700 1,335 706
43,087 25,352 43,093 25,358
Parent Company Consolidate
Noncurrent 09/30/17 12/31/16
IPTU (d) 2,314 2,234 ICMS to recover (State VAT) - 16,680 ICMS to recover (PP&E) 2,911 4,434 Other 1,283 1,283
6,508 24,631
Parent Company and Consolidate

37
(a) IRPJ and CSLL to offset – The Company paid IRPJ and CSLL based on suspension and reduction trial balance during 2016. However, the Company recorded income tax and negative social contribution tax base accumulated in the current year. In turn, the amounts collected in the period were reversed to this heading for the purpose of offsetting short-term with income and social contribution taxes payable in future periods. (b) INSS to recover - in 2000, the Company filed a lawsuit seeking recognition of the non-enforceability of the 15% social security contribution on services rendered by labor cooperatives, the final and unappealable decision of which was issued on March 23, 2015. The amounts were identified and updated in 2017, the balance of which on September 30, 2017 is R$ 2,140, which will be offset against INSS due in subsequent periods. (c) PIS and COFINS recoverable - based on recent decisions from the Tax Appeal Administrative Board (CARF) in favor of taxpayers, the Company proceeded to calculate the PIS and COFINS credits on goods and services classified as inputs (from August 2014 to December 2015, totaling R$ 2,688) and on property, plant and equipment related to the production process and buildings/improvements (September 2014 to December 2015, totaling R$ 898), in the amount of R$ 3,586. Offsets were made with the same taxes in the quarter, resulting in an adjusted balance on September 30, 2017 of R$ 1,265, which will be offset against PIS and COFINS for subsequent periods. The amount of R$ 2,333 refers to extemporaneous credit of freight on sales and PP&E. (d) Property tax (IPTU) - In 2006, the Company recorded a credit in connection with IPTU tax after having been awarded a common lawsuit in connection with the unconstitutional requirement of a progressive IPTU tax for the period from 1999 to 2003, definitely judged on October 9, 2006. In June 2011, the Company made the record of monetary credit at a rate of 1% per month, since the date of recognition of credit in the amount of R$ 739, whose balance adjusted for inflation until September 30, 2017 amounted to R$ 2,314, a sum that awaits in the line of court payment sentences at the town hall in favor of the Company.

38
11 Deferred taxes (a) Breakdown The Company has tax credits deriving from tax losses and social contribution negative calculation bases for current year, with no prescription period, and also deriving from temporary additions and exclusions, as follows:
Ativo 30/09/17 31/12/16
Prejuízos fiscais e base negativa 12,029 20,289 AVP - clientes e fornecedores 1,345 794 Provisão para contingências fiscais 934 907 Provisão para créditos de liquidação duvidosa 5,282 4,600 Provisão para despesas administrativas 1,559 1,675 Provisão para PPR 4,868 - Provisão para despesas comerciais 1,573 1,222 Provisão para despesas variáveis de vendas 5,888 5,322 Provisão para perda estoques obsoletos 6,609 6,031 Provisão para riscos cíveis e trabalhistas 3,914 3,482 Passivo atuarial benefícios a empregados 129 52 Tributos com exigibilidade suspensa - 639 Variação cambial ativa e passiva (líquido) 781 389 Outras diferenças temporárias 301 203
Total do ativo 45,212 45,605
Passivo
Tributos sobre correção monetária imobilizado (3,653) (3,739)Tributos sobre hedge accounting - 829 Outras diferenças temporárias (12) (15)
Total do passivo (3,665) (2,925)
Total líquido 41,547 42,680
Controladora e Consolidado
The tax on the actuarial liability employee benefits is being carried held for the payment of contributions. Management believes the deferred assets arising from temporary differences will be realized upon the final resolution of the risks and events to which they refer, when they will be offset with taxable profits.
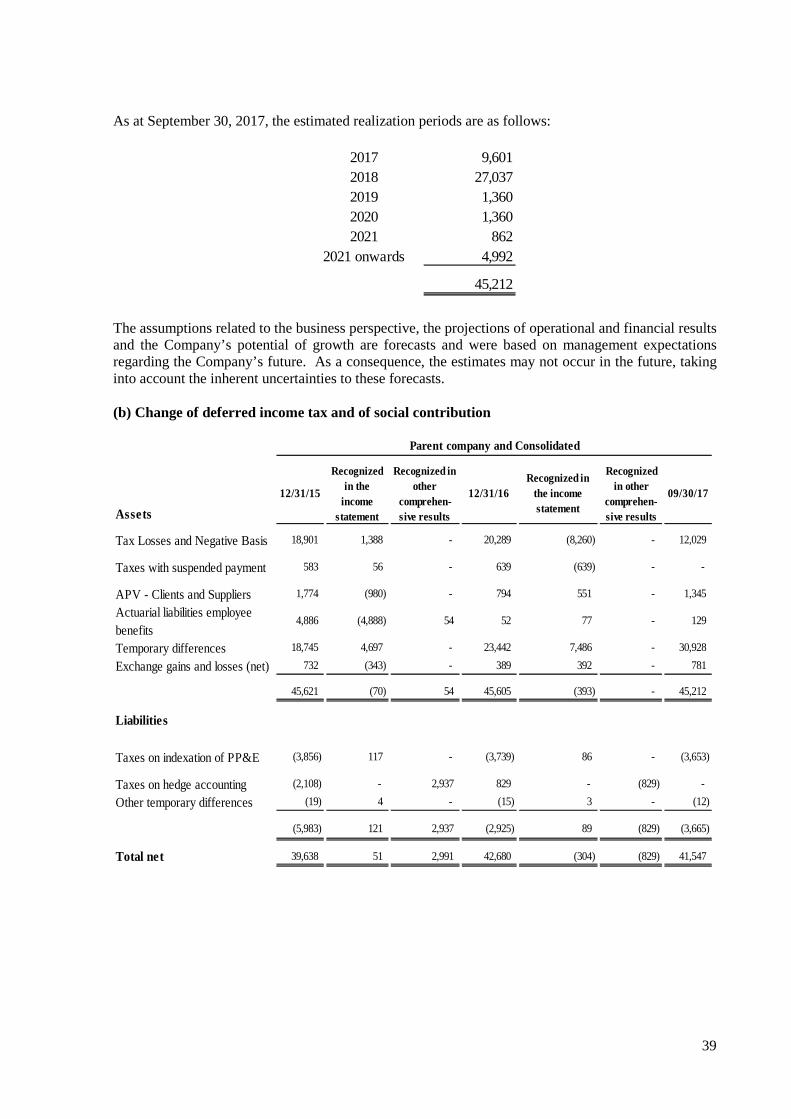
39
As at September 30, 2017, the estimated realization periods are as follows:
2017 9,601 2018 27,037 2019 1,360 2020 1,360 2021 862
2021 onwards 4,992
45,212
The assumptions related to the business perspective, the projections of operational and financial results and the Company’s potential of growth are forecasts and were based on management expectations regarding the Company’s future. As a consequence, the estimates may not occur in the future, taking into account the inherent uncertainties to these forecasts. (b) Change of deferred income tax and of social contribution
Assets
12/31/15
Recognized in the
income statement
Recognized in other
comprehen-sive results
12/31/16Recognized in
the income statement
Recognized in other
comprehen-sive results
09/30/17
Tax Losses and Negative Basis 18,901 1,388 - 20,289 (8,260) - 12,029
Taxes with suspended payment 583 56 - 639 (639) - -
APV - Clients and Suppliers 1,774 (980) - 794 551 - 1,345
Actuarial liabilities employee benefits
4,886 (4,888) 54 52 77 - 129
Temporary differences 18,745 4,697 - 23,442 7,486 - 30,928
Exchange gains and losses (net) 732 (343) - 389 392 - 781
45,621 (70) 54 45,605 (393) - 45,212
Liabilities
Taxes on indexation of PP&E (3,856) 117 - (3,739) 86 - (3,653)
Taxes on hedge accounting (2,108) - 2,937 829 - (829) -
Other temporary differences (19) 4 - (15) 3 - (12)
(5,983) 121 2,937 (2,925) 89 (829) (3,665)
Total net 39,638 51 2,991 42,680 (304) (829) 41,547
Parent company and Consolidated

40
12 Compulsory loan
As a result of a final and unappealable legal action, in 2000, the Company related to the period from 1987 to 1994 and in 2001, for the period 1977 to 1986, constituted credits arising from interest payment differences and monetary restatement on the Compulsory Loan Effected in favor of Eletrobrás. The Company's estimated amounts to be received as a result of the lawsuit were partially realized in April 2007, January 2010 and December 2011. On June, 30, 2016, the Company recorded the amount of R$ 9,486 (R$ 7,654, net of taxes and fees), referring to the remaining amount of the discussion and on September 30, 2016 recorded the amount of R$ 20,754 (R$ 16,748, net of taxes and fees) due to the non-challenge of Eletrobrás Monetary correction of said credits and request for delay of time to the judicial authorities for payment, which occurred in the third quarter. In the opinion of the attorneys-in-fact of the case, due to the evolution of the execution of the proceeding, it was then virtually successful, awaiting only the deadline requested by Eletrobrás to effect payment.
In the last quarter of 2016, following an order of the Judge again determining that Eletrobrás proceeded to pay, the latter filed a motion requesting an injunction, alleging inconsistency in the calculations determined by the Contadoria, an injunction that was granted by TRF4, suspending the continuation of execution of the sentence, and consequently, of the receival. This event caused the Administration together with its lawyers to determine the reversal of the credit recorded, still in 2016.
The referred motion was sentenced on March 29, 2017, where the 1st Class of TRF4 unanimously did not hear of the appeal filed by Eletrobrás and also sentenced it to pay a fine for bad faith litigation. After the publication and the return of the process to origin, the Judge again ordered Eletrobrás to effect the payment. In June 2017, the Company recorded the amount of R$ 36,082, of which R$ 30,335 net of taxes and fees (R$ 8,091 of principal and R$ 22,244 of monetary restatement). The payment by Eletrobrás occurred in June 2017 in the amount of R$ 33,897, remaining a balance of R$ 2,185 to be received. The Company requested the Judgment and the records were sent to the Accounting office to make the recalculation. On September 2017 the Company recorded the amount of R$ 2,614.
13 Investments in subsidiaries
Below is a summary of the invested companies information and equity in subsidiaries recorded during the period.
HRG Com. Vest.
Interm. de Serviços
Finan. Ltda.
Hering Internac.
S.A – SAFI
09/30/17 12/31/16
Current assets and noncurrent assets 2,468 1,621 4,089 4,658 Current liabilities and noncurrent liabilities 212 - 212 1,956 Shareholders' equity 2,256 1,621 3,877 2,702 Net income for the period 2,736 - 2,736 4,121 Result for the period 1,766 3 1,769 2,970 Interest in capital (%) 99.99% 100.00% - - Balance at the beginning of the period 1,038 1,664 2,702 3,585 Dividends (548) - (548) (3,527)Equity in subsidiaries 1,766 (43) 1,722 2,644
Equity method investment 2,256 1,621 3,876 2,702
During the period, dividends in the amount of R$ 548 were received from the invested company HRG.

41
14 Property, plant and equipment (a) Changes in cost and in depreciation
12/31/15 Additions TransferWrite-off
(*)12/31/16 Additions Transfer Write-off 09/30/17
Cost:
Buildings and improvements 124,405 5 22,338 (14,882) 131,866 - 1,851 - 133,717
Facilities and prod. equipament 212,863 12,401 - - 225,264 3,652 (4,722) (1,630) 222,564
Furniture and fixtures 35,816 4,190 421 (142) 40,285 787 (119) (53) 40,900
Computer and peripherals 38,418 3,257 179 (832) 41,022 2,465 25 (3) 43,509
Vehicles 2,384 34 - (72) 2,346 207 - - 2,553
Leasehold improvements 52,484 49 2,053 (1) 54,585 - 9,600 (803) 63,382
Lands 29,114 - - (975) 28,139 - - - 28,139
Construction in progress 26,622 12,028 (24,991) - 13,659 15,509 (6,635) - 22,533
522,106 31,964 - (16,904) 537,166 22,620 - (2,489) 557,297
Depreciation:
Buildings and improvements (28,526) (3,874) - - (32,400) (2,852) - - (35,252)
Facilities and prod. equipament (110,461) (16,820) - 8,578 (118,703) (12,211) - 1,501 (129,413)
Furniture and fixtures (17,033) (4,461) - 126 (21,368) (3,744) - 41 (25,071)
Computer and peripherals (22,643) (6,223) - 837 (28,029) (4,055) - 3 (32,081)
Vehicles (1,700) (228) - 67 (1,861) (153) - - (2,014)
Leasehold improvements (16,458) (7,994) - - (24,452) (7,246) - 798 (30,900)
(196,821) (39,600) - 9,608 (226,813) (30,261) - 2,343 (254,731)
Net:
Buildings and improvements 95,879 (3,869) 22,338 (14,882) 99,466 (2,852) 1,851 - 98,465
Facilities and prod. equipament 102,402 (4,419) - 8,578 106,561 (8,559) (4,722) (129) 93,151
Furniture and fixtures 18,783 (271) 421 (16) 18,917 (2,957) (119) (12) 15,829
Computer and peripherals 15,775 (2,966) 179 5 12,993 (1,590) 25 - 11,428
Vehicles 684 (194) - (5) 485 54 - - 539
Leasehold improvements 36,026 (7,945) 2,053 (1) 30,133 (7,246) 9,600 (5) 32,482
Lands 29,114 - - (975) 28,139 - - - 28,139
Construction in progress 26,622 12,028 (24,991) - 13,659 15,509 (6,635) - 22,533
325,285 (7,636) - (7,296) 310,353 (7,641) - (146) 302,566
Parent Company and Consolidated
(*) In 2016, the amount of R$ 6,858 was reclassified to the heading of fixed assets for sale. The Company maintains assets that it intends to sell within the next 12 months as required by CPC 31 - Non-current assets held for sale and discontinued operation, since the sale is highly probable and the assets are available for immediate sale in its current condition. After classified as intended for sale, the assets are not depreciated or amortized.

42
(b) Useful life review Useful lives of property, plant and equipment items was reviewed in 2016, and for PP&E goods acquired from 2017 onwards, it was reviewed at the beginning of the respective year. Because of the wide range of depreciation rates, we calculated the weighted average useful life of each group of items of fixed assets:
Average useful life (years) - 2017
Average useful life (years) - 2016
Buildings and improvements 31.48 31.62 Facilities and production equipament 9.44 9.34 Furniture and fixtures 6.28 6.30 Computer and peripherals 4.78 4.81 Vehicles 4.52 4.48 Leasehold improvements 7.58 8.04
Description
It was not possible to estimate the effect of change in useful life occurred in 2016 and 2017 for subsequent periods, bearing in mind that every year the useful life of fixed asset items will be assessed, and that in subsequent periods there are acquisitions and disposals of fixed assets. (c) Assets pledged as collateral and pledge As of September 30, 2017, the Company had property, plant and equipment items pledged as collateral for tax incentives, as shown in note 19. (d) Impairment of assets Property, plant and equipment are tested for impairment at least on an annual basis. For the period ended September 30, 2017, recording a provision for impairment loss on property, plant and equipment was not deemed necessary by Management.

43
15 Intangible assets (a) Changes in cost and in amortization
12/31/15 Additions TransferWrite-
off12/31/16 Additions Transfer
Write-off
09/30/17
Cost:
Trademarks and patents 2,952 - - - 2,952 - - - 2,952 Right to use properties 51,505 9,136 - (180) 60,461 4,150 - (251) 64,360 Software 42,897 1,693 81,467 - 126,057 1,971 2,174 (910) 129,292 Intangible assets in progress software (i)
78,756 8,521 (81,467) - 5,810 5,941 (2,174) - 9,577
176,110 19,350 - (180) 195,280 12,062 - (1,161) 206,181
Depreciation:
Trademarks and patents (2,329) (111) - - (2,440) (77) - - (2,517) Right to use properties (32,549) (5,344) - 180 (37,713) (5,060) - 251 (42,522) Software (27,540) (11,592) - - (39,132) (9,170) - 910 (47,392)
(62,418) (17,047) - 180 (79,285) (14,307) - 1,161 (92,431)
Net:
Trademarks and patents 623 (111) - - 512 (77) - - 435 Right to use properties 18,956 3,792 - - 22,748 (910) - - 21,838 Software 15,357 (9,899) 81,467 - 86,925 (7,199) 2,174 - 81,900 Intangible assets in progress software
78,756 8,521 (81,467) - 5,810 5,941 (2,174) - 9,577
113,692 2,303 - - 115,995 (2,245) - - 113,750
Parent Company and Consolidated
(i) Refers mainly to the implementation project of the SAP system, which go live occurred on January 1, 2016. The outstanding balance on September 30, 2017, refers mainly to the development of the product life cycle management software, underway throughout the year of 2016 and 2017. (b) Useful life review Useful lives of intangible assets was reviewed in 2016, and for intangible goods acquired or developed from 2017 onward, it was reviewed at the beginning of the respective year. The weighted average useful life of each group of items of intangible assets are presented below:
Average useful life (years) - 2017
Average useful life (years) - 2016
Trademarks and patents 10.00 10.00 Right to use properties 4.99 4.98 Software licenses 8.64 8.65
Description
It was not possible to estimate the effect of change in useful life occurred in 2016 and 2017 for subsequent periods, bearing in mind that every year the useful life of intangible asset items will be assessed, and that in subsequent periods there are acquisitions and disposals of intangible assets.

44
(c) Impairment of intangible assets Intangible assets are tested for impairment at least on an annual basis. For the period ended September 30, 2017, recording a provision for impairment loss on intangible assets was not deemed necessary by Management.
16 Borrowings and financing The amounts, terms and deadlines for each loan are shown below:
Description Annual charges Maturity Currency 09/30/17 12/31/16
Working capital Interest of 14.73% 2017 R$ - 424 Working capital Interest of 9.5% 2017 R$ - 989 Working capital TJLP + 3.5% 2018 R$ 18,482 18,356 Working capital SELIC + 3.5% 2018 R$ 8,611 7,966
27,093 27,735
Current liabilities 1,481 2,123
Noncurrent liabilities 25,612 25,612
Parent company and Consolidated
The borrowings obtained in 2016 and 2017 did not bear transaction costs. The BNDES "Exim Pre-shipment" financing agreement entered into by the Company in 2016 contains restrictive clauses (convenants) regarding the existence of a final sentence due to practices of acts by the Company that cause child labor, slave labor, crime against the environment, application of the resource for a purpose other than that provided for in the contract and in the case of diplomacy as a Federal Deputy or Senator of a person who performs paid activity in the Company. The commitments established in the loan and financing agreements are being complied with by the Company. The Company does not hold any guarantees for the borrowings and financing.

45
17 Taxes in installments
09/30/17 12/31/16 09/30/17 12/31/16
REFIS IV - INSS (a) 149 150 1,335 1,380 REFIS IV - PIS/COFINS/IOF (a) 805 837 1,396 1,959
954 987 2,731 3,339
Parent company and Consolidated
Current Noncurrent
(a) REFIS IV - In November 2009 the Company formally requested to join the installment method introduced by Law 11,941/09 (REFIS IV), benefiting itself from the reduction of the fines and interest on the debt in installments in the modalities until that date. Also included in the REFIS IV, tax and social security debts, which were under administrative and judicial discussions. The remaining balance will be restated according to the SELIC base interest rate. In the period ended September 30, 2017 the amount of R$ 258 (R$ 959 in 2016) was paid, related to taxes in installments REFIS. As at September 30, 2017, non-current liabilities have the following maturity:
2018 258 2019 1,032 2020 450 2021 153 2022 153
2022 onwards 685
2,731
The Company's continued adherence to the abovementioned installment programs depends on the fulfillment of certain conditions, particularly the payment of debt installments, as prescribed by the law, as well as the payment of current taxes, conditions which are being met by the Company.

46
18 Taxes payable and income and social contribution taxes payable
Current 09/30/17 12/31/16 09/30/17 12/31/16
ICMS on sales (VAT) 3,563 8,949 3,563 8,949 PIS and COFINS 4,116 6,289 4,128 6,302 Income and social contribution taxes 2,610 3 2,693 91 Withholding Income Tax (IRRF) 1,836 2,339 1,836 2,339 Goiás Protégé Fund 1,944 2,173 1,944 2,173 Other 386 776 405 794
14,455 20,529 14,569 20,648
ConsolidatedParent company
19 Tax incentives obligations
09/30/17 12/31/16 09/30/17 12/31/16
PRODEC III - SC (a) 1,536 1,494 111 1,539 PROADI - RN (b) 9 7 - - Others - - 490 490
1,545 1,501 601 2,029
Parent company and Consolidated
Current Noncurrent
The liabilities for tax incentives are presented adjusted at present value, when applicable. (a) Programa de Desenvolvimento da Empresa Catarinense (PRODEC III) - This program was introduced to fund the expansion of the Company’s business. The contracted amount as of February 2009 was R$ 270,157, the incentive is valid for 200 months, and the first installment was released in November 2009. The amount of R$ 15,514 was used until September 30, 2017. The grace period for each released installment is 48 months, after which the full settlement occurs. The financing is charged annual interest of 4%. The Company’s main obligation under this incentive consists of making investments, which are being fulfilled and proven at the State Finance Department.
(b) Programa de Apoio ao Desenvolvimento Industrial do Rio Grande do Norte (PROADI) - To comprise the current assets of the unit located in the city of Parnamirim. Under the contract the incentive has a term of 240 months, commencing in October 2001 and ending in September 2021. This incentive has no limit. The value of the installment released represents 75% (seventy-five percent) of the ICMS due in the month, and 1% of this cleared amount is settled in full with a grace period of 60 days. The amount of R$ 2,428 was used in 2017 (R$ 2,993 in the same period in 2016), which is recorded under Sales Deductions in the income statement. The financing charges consist of annual interest of 3% p.a. and monetary restatement according to the variance of the referential rate (TR) in the month.
The Company’s main obligation under the benefit was paying all of its labor, social security and tax obligations on time, which are being fulfilled by the Company.

47
Programa de Desenvolvimento Industrial de Goiás (PRODUZIR) - a program established to reinforce working capital to implement the plant in the city of Anápolis. The Company’s main obligations under this incentive consist of investing in its industrial plant and paying its labor, social security and tax obligations, which are being fulfilled by the Company. The installment pending release is used through a deduction to the payment of the ICMS due in the month, where 27% of the tax due is paid and 73% is exempt under the benefit. A deposit of 10% of each released installment is made into a current account administrated by the Produzir Program. The debt is amortized annually, when the benefit is traded for the amount deposited in the course of the year. As an obligation for the fulfillment of the benefit, the Company offered fixed assets as mortgage guarantees with an accounting value on September 30, 2017of R$ 4,898, comprised of lots, buildings and improvements.
The cost subsidies under the PROADI, “Crédito Outorgado” (“Lei do Vestuário – GO”), “TTD” and “Crédito Presumido de ICMS” in Santa Catarina on internet sales programs are recognized monthly on accrual basis and entered directly into the income statement for the period under Sales Deductions (R$ 96,684 on September 30, 2017 and R$ 91,049 on September 30, 2016) and Cost of goods sold (R$ 13,279 on September 30, 2017 and R$ 8,439 on September 30, 2016). The PRODEC and PRODEC III incentives are recognized the month after the accrual month when the installment is released; they are recognized in the non-current liabilities and the current ICMS debit in the current liabilities is reduced as a contra entry. In August 2014, the Company signed Special Taxation Agreement Statement (“TARE”) no. 001-155/2014-GSF with the Secretariat of Finance of Goiás, proceeding to change the already-signed TARE no. 078/2011-GSF, relating to the incentive known as the Clothing Act (Lei do Vestuário) (credit granted), with the aim of ensuring the maintenance and funding of the aforementioned benefit and henceforth the consequential benefits of associated Income Tax and Social Contribution, offered as a stimulus to the establishment or expansion of economic enterprises in the state of Goiás, until fiscal year 2040, for the purposes of investment subsidies, through the establishment of consideration related to investments made and generation of economic activity in the state of Goiás, namely:
• timely payment regarding state tax obligations; • investments to expand its activities in the state of Goiás, which results in increased production capacity of manufacturing establishments by 5% (five percent) by the year 2020, compared to production in 2013;
• promoting training and qualification of manpower (prioritized local sourcing of manpower) to be utilized in manufacturing establishments;
• maintenance of 1,400 (one thousand, four hundred) direct jobs, considering all of the company’s establishments in the state, starting January 01, 2014.
The Goiás incentives enjoyed in 2017 were thus characterized as a subsidy for investments and therefore excluded from the calculation basis for income tax and social contribution, resulting in a reduction of R$ 32,283 (R$ 29,422 on September 30, 2016). The PROADI state incentive (enjoyed in Rio Grande do Norte) is also a subsidy for investments and in the same period generated a reduction of R$ 826 (R$ 1,018 on September 30, 2016). The total reduction in Income Tax and Social Contribution on September 30, 2017, resulting from investment subsidies, was R$ 33,109 (R$ 30,440 on September 30, 2016), as shown in Note 34. If the Company needs to make investments in PP&E to meet obligations of the tax benefit, this amount will be recognition in income by virtue of the depreciation or amortization of the related assets.
The Company stated in its books the sums received as a subsidy for investment in fiscal incentives (Proadi and Lei do Vestuário) qualified as investment grants in the amount of R$ 130,226 in 2016 (R$ 106,421 in 2015) under "Reserve for tax incentives", pursuant to article 195- of Brazilian Corporate Law (note 24). This reserve can only be used to offset losses or increase capital.

48
20 Provisions for risks and other provisions The Company has several labor, civil and tax lawsuits in progress, arising from the normal course of its business. Provisions for contingencies were recorded for risks considered a probable loss by the legal advisors of the Company. The Company believes that the provisions formed, as presented below, are sufficient to cover loss with the lawsuits and court fees.
Provision for risks: 09/30/17 12/31/16 09/30/17 12/31/16
Labor (a) 2,000 2,000 5,173 4,152 Tax (b) - - 2,746 2,667 Civil (c) - - 4,340 4,089
2,000 2,000 12,259 10,908
Other provisions:
Selling expenses (d) 21,945 19,247 - - Administrative expenses (e) 5,302 5,618 104 1,983
41,565 24,865 104 1,983
Total 43,565 26,865 12,363 12,891
Parent company and Consolidated
Current Noncurrent
Accrued profit sharing - PPR(note 26) 14,318 - - -
(a) Labor - consist mainly of requests from representatives and employees that recognize a possible employment relationship with the Company and occupational accident compensation. There are also lawsuits claiming hazard pay to which some employees from the production units are allegedly entitled and occupational accident compensation and subsidiary with the Company. There are judicial deposits on these proceedings in the amount of R$ 5,682 (R$ 4,329 on December 31, 2016). (b) Tax lawsuits - refers to legal disputes relating to INSS maternity leave and garbage collection fee for which there are judicial deposits in the same amount and IRPJ and CSLL tax assessment notices. (c) Civil - the main lawsuits are related to indemnity actions in connection to the normal operations of the Company. For these cases there are judicial deposits in the amount of R$ 2,647 (R$ 2,589 on December 31, 2016). (d) Provision for commercial expenses - refers to provision for the payment of commissions to representatives, freight on sales and provisions referring to sales campaign. (e) Provision for administrative expenses - Consists mainly of an allowance for payments of lawyers´ fees and provision for the payment of INSS, Law 12,546.
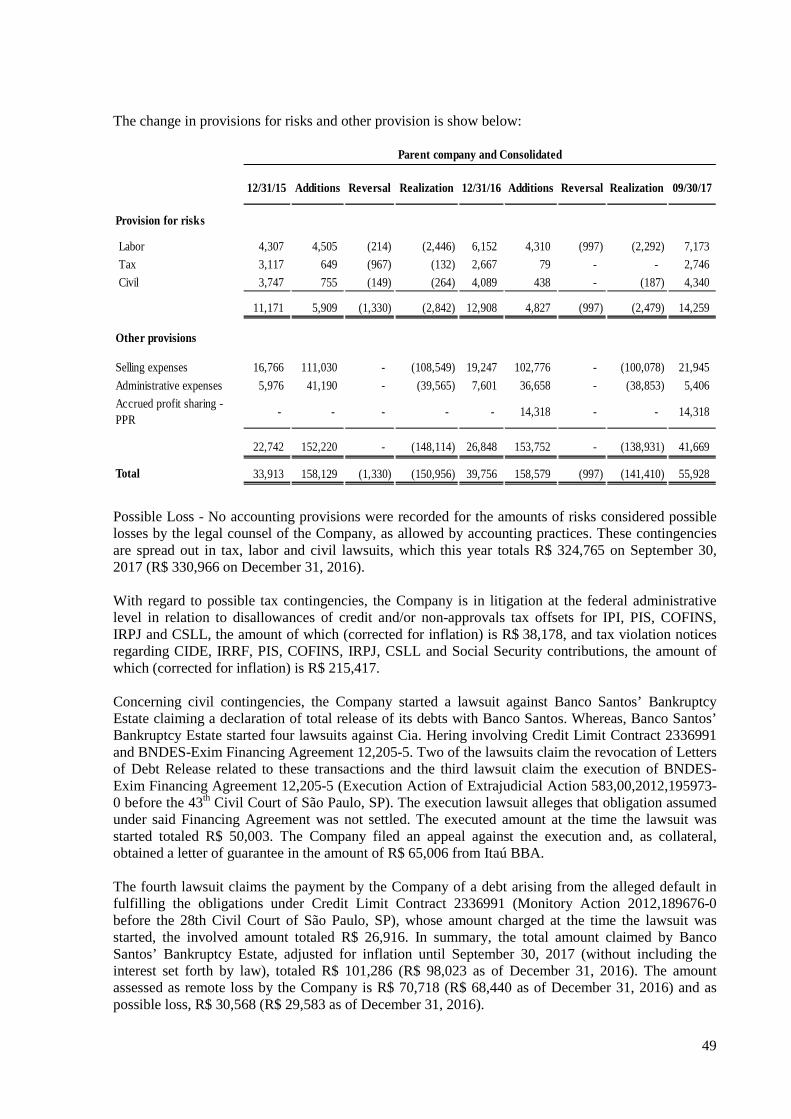
49
The change in provisions for risks and other provision is show below:
12/31/15 Additions Reversal Realization 12/31/16 Additions Reversal Realization 09/30/17
Provision for risks
Labor 4,307 4,505 (214) (2,446) 6,152 4,310 (997) (2,292) 7,173
Tax 3,117 649 (967) (132) 2,667 79 - - 2,746
Civil 3,747 755 (149) (264) 4,089 438 - (187) 4,340
11,171 5,909 (1,330) (2,842) 12,908 4,827 (997) (2,479) 14,259
Other provisions
Selling expenses 16,766 111,030 - (108,549) 19,247 102,776 - (100,078) 21,945
Administrative expenses 5,976 41,190 - (39,565) 7,601 36,658 - (38,853) 5,406
Accrued profit sharing - PPR
- - - - - 14,318 - - 14,318
22,742 152,220 - (148,114) 26,848 153,752 - (138,931) 41,669
Total 33,913 158,129 (1,330) (150,956) 39,756 158,579 (997) (141,410) 55,928
Parent company and Consolidated
Possible Loss - No accounting provisions were recorded for the amounts of risks considered possible losses by the legal counsel of the Company, as allowed by accounting practices. These contingencies are spread out in tax, labor and civil lawsuits, which this year totals R$ 324,765 on September 30, 2017 (R$ 330,966 on December 31, 2016). With regard to possible tax contingencies, the Company is in litigation at the federal administrative level in relation to disallowances of credit and/or non-approvals tax offsets for IPI, PIS, COFINS, IRPJ and CSLL, the amount of which (corrected for inflation) is R$ 38,178, and tax violation notices regarding CIDE, IRRF, PIS, COFINS, IRPJ, CSLL and Social Security contributions, the amount of which (corrected for inflation) is R$ 215,417. Concerning civil contingencies, the Company started a lawsuit against Banco Santos’ Bankruptcy Estate claiming a declaration of total release of its debts with Banco Santos. Whereas, Banco Santos’ Bankruptcy Estate started four lawsuits against Cia. Hering involving Credit Limit Contract 2336991 and BNDES-Exim Financing Agreement 12,205-5. Two of the lawsuits claim the revocation of Letters of Debt Release related to these transactions and the third lawsuit claim the execution of BNDES-Exim Financing Agreement 12,205-5 (Execution Action of Extrajudicial Action 583,00,2012,195973-0 before the 43th Civil Court of São Paulo, SP). The execution lawsuit alleges that obligation assumed under said Financing Agreement was not settled. The executed amount at the time the lawsuit was started totaled R$ 50,003. The Company filed an appeal against the execution and, as collateral, obtained a letter of guarantee in the amount of R$ 65,006 from Itaú BBA. The fourth lawsuit claims the payment by the Company of a debt arising from the alleged default in fulfilling the obligations under Credit Limit Contract 2336991 (Monitory Action 2012,189676-0 before the 28th Civil Court of São Paulo, SP), whose amount charged at the time the lawsuit was started, the involved amount totaled R$ 26,916. In summary, the total amount claimed by Banco Santos’ Bankruptcy Estate, adjusted for inflation until September 30, 2017 (without including the interest set forth by law), totaled R$ 101,286 (R$ 98,023 as of December 31, 2016). The amount assessed as remote loss by the Company is R$ 70,718 (R$ 68,440 as of December 31, 2016) and as possible loss, R$ 30,568 (R$ 29,583 as of December 31, 2016).

50
21 Related parties Transactions involving intercompany loans and management compensation are as follows: (a) Key Personnel from management The Company provides their directors with health care, health care benefits, life insurance, retirement planning, and food aid, as shown in the short-term benefits line item, below. The benefits are partially funded by their managers and are recorded as expenses when incurred. Directors also participate in the Company's stock option plan, as defined in note 27. Amounts referring to remuneration and benefits of management key personnel, represented by the Board of Directors and statutory officers, are as follows:
09/30/17 09/30/16 09/30/17 09/30/16
Management remuneration 6,906 6,686 6,930 6,718 Variable remuneration 2,100 - 2,100 - Short-term benefits 999 739 999 739 Others (INSS) 1,380 1,338 1,380 1,338 Stock options payments 2,437 3,929 2,437 3,929
13,822 12,692 13,846 12,724
ConsolidatedParent Company
The Company is managed by a Board of directors and Executive Board, both of which have been elected for two years, subject to reelection. (b) Other related-party transactions The transactions refer to the loan agreements with the subsidiary Hering International SAFI, whose balance as of September 30, 2017 was R$ 1,621 (R$ 1,548 as of December 31, 2016). The term of validity of these contracts is indeterminate. On May 25, 2011 Cia. Hering began operating with a representation office in the city of Nanjing in China. This office has as its object the quality inspection of products imported, as well as the prospection of new suppliers. As of September 30, 2017, the amount spent with this operation was of R$ 1,947 (R$ 2,293 on December 31, 2016), recognized in the income statement in the group costs. In October and December 2016 there were some loan operations to refurbish the franchises for the franchise company related to some of the Company's directors. The total amount of the loan and grant amounted to R$ 546 (R$ 431 of financing and R$ 115 of subsidy), and the amount of R$ 321 was received in the period ended September 30, 2017. The Company understood that the terms of the agreement were consistent with the standards of Business. As at September 30, 2017, no guarantees were provided by the Company to related parties.
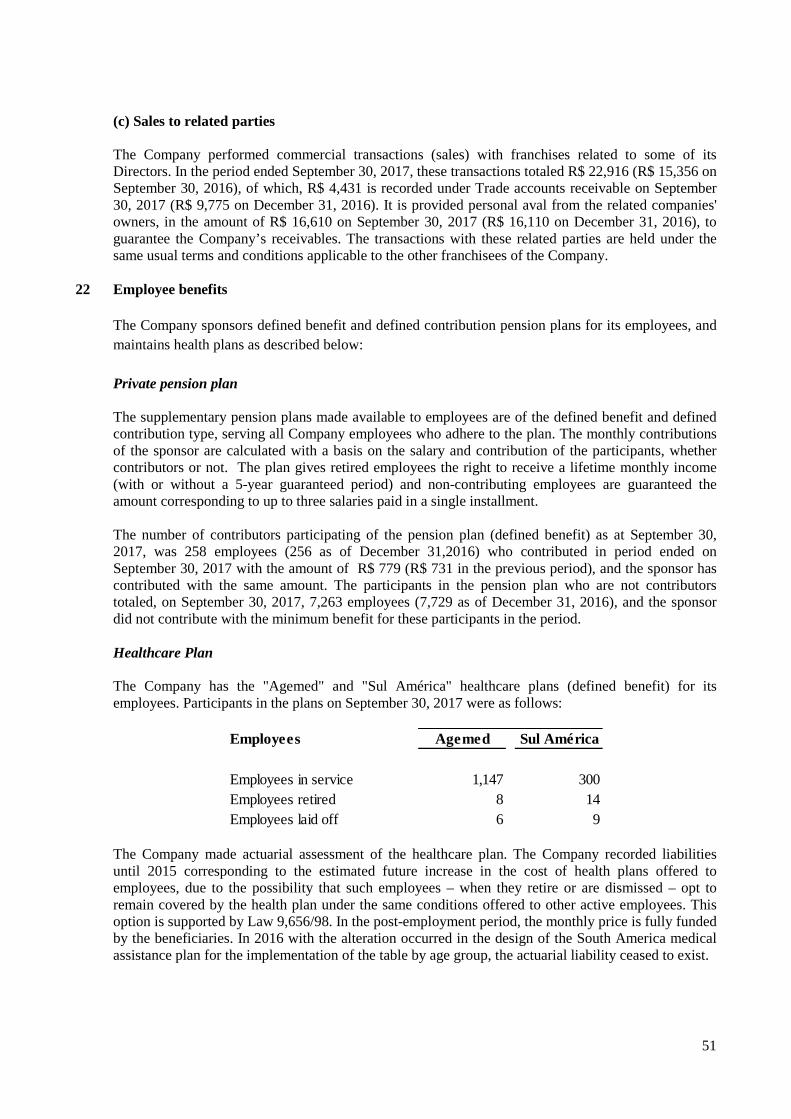
51
(c) Sales to related parties The Company performed commercial transactions (sales) with franchises related to some of its Directors. In the period ended September 30, 2017, these transactions totaled R$ 22,916 (R$ 15,356 on September 30, 2016), of which, R$ 4,431 is recorded under Trade accounts receivable on September 30, 2017 (R$ 9,775 on December 31, 2016). It is provided personal aval from the related companies' owners, in the amount of R$ 16,610 on September 30, 2017 (R$ 16,110 on December 31, 2016), to guarantee the Company’s receivables. The transactions with these related parties are held under the same usual terms and conditions applicable to the other franchisees of the Company.
22 Employee benefits The Company sponsors defined benefit and defined contribution pension plans for its employees, and maintains health plans as described below: Private pension plan The supplementary pension plans made available to employees are of the defined benefit and defined contribution type, serving all Company employees who adhere to the plan. The monthly contributions of the sponsor are calculated with a basis on the salary and contribution of the participants, whether contributors or not. The plan gives retired employees the right to receive a lifetime monthly income (with or without a 5-year guaranteed period) and non-contributing employees are guaranteed the amount corresponding to up to three salaries paid in a single installment. The number of contributors participating of the pension plan (defined benefit) as at September 30, 2017, was 258 employees (256 as of December 31,2016) who contributed in period ended on September 30, 2017 with the amount of R$ 779 (R$ 731 in the previous period), and the sponsor has contributed with the same amount. The participants in the pension plan who are not contributors totaled, on September 30, 2017, 7,263 employees (7,729 as of December 31, 2016), and the sponsor did not contribute with the minimum benefit for these participants in the period. Healthcare Plan The Company has the "Agemed" and "Sul América" healthcare plans (defined benefit) for its employees. Participants in the plans on September 30, 2017 were as follows:
Employees Agemed Sul América
Employees in service 1,147 300Employees retired 8 14Employees laid off 6 9
The Company made actuarial assessment of the healthcare plan. The Company recorded liabilities until 2015 corresponding to the estimated future increase in the cost of health plans offered to employees, due to the possibility that such employees – when they retire or are dismissed – opt to remain covered by the health plan under the same conditions offered to other active employees. This option is supported by Law 9,656/98. In the post-employment period, the monthly price is fully funded by the beneficiaries. In 2016 with the alteration occurred in the design of the South America medical assistance plan for the implementation of the table by age group, the actuarial liability ceased to exist.

52
The Company had its last actuarial valuation calculated on December 31, 2016, whose effects are shown below: (a) Balances of the pension plan – Defined Benefit
09/30/17 12/31/16
Present value of actuarial obligations with coverage (33,931) (33,706) Fair value of the plan assets 33,552 33,552
(Deficit) surplus for covered plans (379) (154)
Parent company and Consolidated
Pension Plan
Changes in the defined benefit plan for the period ended September 30, 2017 were the recognition of R$ 225 in the income statement as a contra-entry to the employee benefits liability (b) Changes in the present value of the defined benefit obligations
12/31/16
Defined benefit obligations as of January 1 27,117 Current service costs and interest 112 Interest on actuarial obligation 3,355 Actuarial (gains) losses recognized in other comprehensive income 5,733 Benefits paid in the year (2,611)
Defined benefit obligations as of December 31 33,706
Parent company and Consolidated
Pension Plan

53
(c) Change in the present value of the plan’s assets
Parent company and Consolidated
Pension Plan
12/31/16
Fair value of plan assets as of January 1 27,927 Expected return on plan assets 3,490 Actuarial (losses) gains on the plan's assets 4,321 Contributions from sponsor 425 Benefits paid by the plan (2,611)
Fair value of plan assets as of December 31 33,552
The plan's assets are represented by quotas of participation in funds. On December 31, 2016, the sum of equity Instruments was R$ 33,552, whose expected return for the following fiscal year is R$ 3,715. The assessment of expected return performed by the Management is based on historical trends and market analyst projections for the asset during the life of the respective obligation. (d) Expense / (Income) recognized in profit or loss In the period ended on September 30, 2017, the amount of R$ 225 related to the pension plans (R$ 63 and R$ 1,584 as of September 30, 2016 related to the pension plans and medical care respectively) was recognized in expenses. (e) Actuarial gains and losses recognized in other comprehensive income
Parent company and Consolidated
Pension Plan
12/31/16
Amount accrued as of January 1 (15)Actuarial (gain) losses recognised 70
Amount accrued as of December 31 55
The amounts above are immediately incorporated to the accumulated income account, as permitted by CPC 33(R1) and IAS19.

54
(f) Components of the projected expenses / (income) of the plan
Parent company and Consolidated
Pension Plan
12/31/17
Gross current service cost (with interest) 112 Interest on actuarial obligation 3,706 Expected yield of the assets (3,715)Interest on effect of upper limit of onerous asset/liability recognition 197
300
(g) History of experience adjustments
Pension Plan 12/31/16 12/31/15 12/31/14 12/31/13 12/31/12
Present value of actuarial obligations (33,706) (27,117) (22,182) (21,492) (23,041)
Fair value of the plan assets 33,552 27,927 23,079 21,733 21,746
Effect of asset ceiling - (810) (897) (241) -
(Deficit) surplus for the covered plans (154) - - - (1,295)
Adjustment for experience in plan liabilities
(5,733) (4,337) 313 (1,933) 2,017
(5,733) (4,337) 313 (1,933) 2,017
Healthcare Plan
Present value of actuarial obligations - (14,372) (10,616) (9,507) (17,826)
(Deficit) surplus for the covered plans - (14,372) (10,616) (9,507) (17,826)
Adjustment for experience in plan liabilities
197 2,440 (208) (4,288) 2,505
Parent company and Consolidated
The Company expects to contribute approximately R$ 454 with defined benefit plans during 2017.

55
(h) Actuarial assumptions The liability was determined by means of actuarial calculations made by an independent actuary following the premises identified below:
Pension Plan
Healthcare Plan
(i) Weighted average of the hypotheses used to determine the actuarial obligation and the expense/(income) to be recognized
12/31/16 12/31/16
Nominal discount rate 11.63% 11.49%
Nominal salary adjustment rate 6.92% N/A
Estimated inflation rate 5.50% 5.50%
Nominal discount rate 13.20% 12.89%
Post-retirement mortality table AT-2000 AT-2000
Health Care Cost Trend Rate N/A 3.00%
0 to 24 years: 0.05%
25 to 54 years: 2.0%
55 to 79 years: 4.5%
80 onwards: 3.0%
Retiring today (member age 65) 19.60 19.60
Retiring in 25 years (member age 40 today) 19.60 19.60
Parent company and consolidated
N/A
(ii) Assumed life expectations on retirement at age 65
Aging Factor
Assumptions on future mortality are based on published statistics and mortality tables. The mortality tables used were: (i) Mortality table AT-200 Male; (ii) Disability Entrance Table RRB-1944(EI); (iii) Disability Mortality Table RRB-1944(MI). Age at retirement date is considered as 55 years, and that 100% of the employees retire upon first eligibility to early retirement.

56
(i) Sensitivity analysis Below is a sensitivity analysis showing the effect as at December 31, 2016 of an increase or a decrease of half percentage point in the assumed rates of changes in pension plan cost:
Baseline0.5%
increase0.5%
decrease
Impacts on pensions plan obligations
Discount rate 33,706 32,354 35,167 Inflation rate 33,706 33,706 33,706 Mortality table (+1 -1) 33,706 34,361 33,035
Weighted average of the defined benefit obligation (in years) 8.34 8.19 8.49
Pension Plan
Project Scenarios
23 Risk management and financial instruments (a) Risk management The Company carries out operations with financial instruments. The management of these instruments is done through operating strategies and internal controls aimed at assuring liquidity, profitability and security. The use of financial instruments for hedging purposes is done through a periodic analysis of the risk exposure that management intends to mitigate (exchange, interest rate, etc.). The control policy consists of permanent monitoring of the contracted conditions versus the existing conditions on the market. The Company does not invest in derivatives or any other risky assets on a speculative basis. Operations with derivative financial instruments are approved by the Board of Directors of the Company. The values of the asset and liability financial instruments contained in the quarterly financial informations for the period ended September 30, 2017 were determined in accordance with the criteria and the accounting practices divulged in specific notes. The Company presents exposure to the following risks related to the usage of financial instruments: • Credit risk This arises from the possibility of the Company suffering losses due to the default of their customers or of financial institutions where they have funds or financial investments. To mitigate these risks, the Company has a policy of analyzing the financial position of their customers, for which it manages the credit risk by means of a credit qualification and concession policy. The Company also has a provision for doubtful accounts, in the amount of R$ 15,536 (R$ 13,529 on December 31, 2016), which represents 3.63% of the balance of the accounts receivable (2.86% on December 31, 2016), to counter credit risk.

57
As required by CPC 40, the Company discloses the maximum risk exposure of accounts receivable without considering guarantees received or other instruments that could improve credit recovery level, analysis of accounts receivable per maturity and guarantees. (i) Credit risk exposure The carrying amounts of financial assets classified as loans and receivables represent the maximum credit exposure. The maximum credit risk exposure on the quarterly information period was:
09/30/17 12/31/16
Cash and cash equivalents 204,014 204,755 Interest-earning bank deposits 5,160 4,824 Trade accounts receivable 410,885 473,047 Other receivables 22,763 30,222
Consolidated
(ii) Impairment losses The maturities of the accounts receivable on the quarterly information period was:
Accounts receivable 09/30/17 12/31/16
Current 367,797 439,967
Past-due: 0 to 30 days 13,522 7,367 31 to 90 days 9,374 6,749 91 to 180 days 4,386 7,403 181 to 360 days 8,787 7,969 Over 360 days 7,019 3,592
410,885 473,047
Consolidated
Changes in the provision for loss due to impairment in relation to the loans and receivables during the year was as follows:
09/30/17 12/31/16
At the beginning of the period (13,529) (10,317) Additions (8,729) (11,922) Write-offs 6,722 8,710
At the end of the period (15,536) (13,529)
Consolidated
The Company assesses the need for provision for doubtful accounts through an individual analysis of overdue credits, conjugated with the rate of loss.

58
The Company also evaluates the need for a provision for outstanding receivables, considering projected future billing growth and new clients. The expense on the recognition of the provision for doubtful accounts was recorded in 'Selling expenses' in the statement of income. When there is no expectation of recovery amount, the amounts credited to line account 'Provision for doubtful accounts' are in general reversed against the definite write-off of the receivable against income or loss for the year. (iii) Guarantees The Company does not keep any guarantees for past due notes. • Interest rate risk This arises from the possibility of the Company sustaining gains or losses arising from fluctuations in interest rates on its financial assets and liabilities. In order to mitigate this type of risk, the Company seeks to diversify the raising of funds and, in certain circumstances contract protection operations reduce the financial costs.
09/30/17 12/31/16
Financial instruments - Fixed rate (Financial liabilities) - (1,413) Financial instruments - Variable rate (Financial liabilities) (27,093) (26,322)
(27,093) (27,735)
Consolidated
• Market risk This arises from the possibility of fluctuations in the market of the inputs used in the production process, mainly regarding the cotton thread. These fluctuations in prices can cause substantial changes in the costs of the Company and it is not possible for the Company to assure the ability to pass on - in part or in whole - these costs in the selling price of its products. To mitigate these risks, the Company manages inventories by forming regulating inventories of this raw material. • Liquidity risk It arises from the likelihood of reduction in funds intended for debt payments. Management monitors the continuous forecasts of liquidity requirements to ensure the Company has sufficient cash to meet its operational needs. In addition, the Company maintains short-term investment balances which may be redeemed at any time to cover possible mismatches between maturity dates of its contract obligations and its cash generation.
The Company invests excess cash in financial assets subject to interest (note 5) by choosing instruments with appropriate maturity or sufficient liquidity to provide a safety margin as determined by the provisions above mentioned.
As of September 30, 2017 the Company's cash equivalents have immediate liquidity and are considered to manage liquidity risk.

59
The following table shows the expected maturity for the financial assets and liabilities contracted by the Company, and the values shown include the estimated principal and interest levied on the operations, calculated utilizing rates prevailing on September 30, 2017:
Average interest
rateUntil 1 month
1 to 3 months
4 to 12 months
1 to 2 years
2 to 3 years Total
- 204,014 - - - - 204,014
0.85% 142,562 194,365 64,835 3,123 455 405,340
Borrowing and financing 0.88% - (895) (2,138) (27,391) - (30,424)
0.33% (5) (5) (1,573) (161) - (1,744)
0.66% (86,030) (48,137) (17,739) (96) - (152,002)
260,541 145,328 43,385 (24,525) 455 425,184
Consolidated
Cash and cash equivalents
Trade accounts receivable and others
Tax incentives
Suppliers and other payables
The Company has an agreement for mutual collaboration with the financial institution in transactions for acquisition of “Payor Risk” credit, which consists in suppliers advancing outstanding trade notes, the Bank advances that amount to the supplier on request date and then receives amount owed by the Company on maturity date. This transaction cost is charged from the supplier by the bank, the Company does not incur interest or other costs. The credit limit for this operation is approved at a Meeting of the Board of Directors, and does not use the Company's remaining credit limit with the bank. On these amounts, as well as for the amounts of other vendors, the adjustment to present value is registered, considering the rate and terms described in note 3 (m). The terms of the operations under debtor risk do not differ significantly from the normal operations of supply, as for example in relation to the usual payment deadlines. The decision to carry out this operation is solely and exclusively of the supplier, which bears the financial costs of the operation. Management evaluates that there are no risks to the Company in this transaction and maintains the amount recorded in suppliers caption, considering that this presentation better reflects the basics of the operation performed. At September 30, 2017, the amount of this operation was R$ 40,685 (R$ 58,010 at December 31, 2016).
• Exchange rate risk This arises from the possibility of fluctuations in the exchange rates of the foreign currencies, mainly the U.S. dollar, used by the Company for the purchase of imports, the sale of products and the contracting of financial instruments, as well as the amounts payable and receivable in foreign currency. Transactions are denominated mainly in the following currencies: USD . The Company understands that its net exposure is maintained at an acceptable level, and permanently assesses the utilization of hedge transactions to mitigate these risks.

60
The foreign exchange rate exposure of the Company is represented as follows:
09/30/17 12/31/16
118 3,222 17,547 16,500 (22,085) (23,071)
- 32,917
(4,420) 29,568
Consolidated
Cash in foreign currency (note 5)Trade accounts receivable (note 7)Accounts payable to suppliersDerivative financial instruments (notional value)
The derivative financial instruments referring to future contracts of purchase or sale of US dollars are used mainly to hedge financial outflows resulting for the import of raw materials, finished products, and fabrics against foreign exchange fluctuations. As of September 30, 2017, the Company held USD 27,342 thousand (USD 22,961 on December 31, 2016) in letters of credit related the imports contracted with suppliers.
• Operating risk
Operating risk is the risk of direct or indirect losses arising from different causes related to the Company's processes, personnel, technology and infrastructure and external factors, except credit, market and liquidity risks, as those arising from legal and regulatory requirements and from generally accepted corporate behavior standards. Operating risks are associated to all operations of the Company.
The Company's objective is to manage operating risk and avoid financial losses and damages to the Company's reputation, as well as seeking cost effectiveness. Top management is responsible for developing and implementing controls to address operating risks. This responsibility is supported by the development of general standards regarding operating risk management. (b) Financial instruments – fair value The table below presents the main financial instruments operations contracted, as well as the respective fair values calculated by Company’s management.
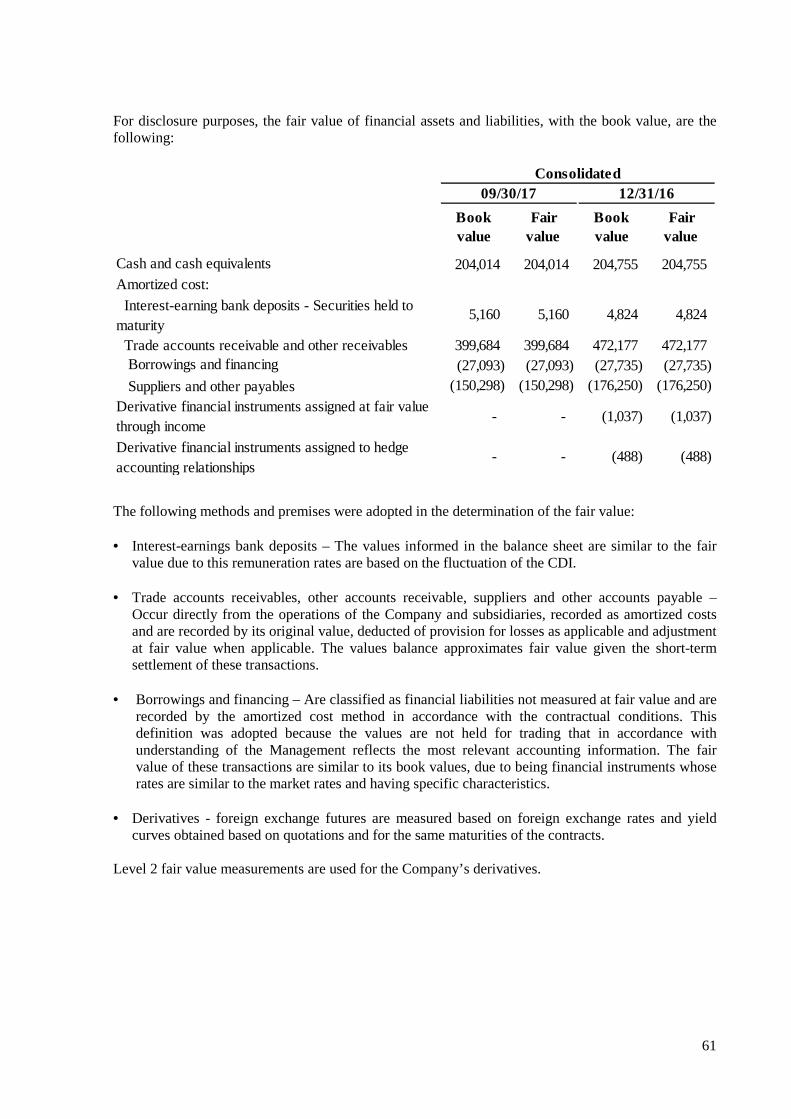
61
For disclosure purposes, the fair value of financial assets and liabilities, with the book value, are the following:
Book value
Fair value
Book value
Fair value
204,014 204,014 204,755 204,755
5,160 5,160 4,824 4,824
399,684 399,684 472,177 472,177 (27,093) (27,093) (27,735) (27,735)
Suppliers and other payables (150,298) (150,298) (176,250) (176,250)
- - (1,037) (1,037)
- - (488) (488)
Consolidated09/30/17 12/31/16
Cash and cash equivalents
Interest-earning bank deposits - Securities held to maturity
Amortized cost:
Trade accounts receivable and other receivables Borrowings and financing
Derivative financial instruments assigned at fair value through incomeDerivative financial instruments assigned to hedge accounting relationships
The following methods and premises were adopted in the determination of the fair value: • Interest-earnings bank deposits – The values informed in the balance sheet are similar to the fair
value due to this remuneration rates are based on the fluctuation of the CDI. • Trade accounts receivables, other accounts receivable, suppliers and other accounts payable –
Occur directly from the operations of the Company and subsidiaries, recorded as amortized costs and are recorded by its original value, deducted of provision for losses as applicable and adjustment at fair value when applicable. The values balance approximates fair value given the short-term settlement of these transactions.
• Borrowings and financing – Are classified as financial liabilities not measured at fair value and are recorded by the amortized cost method in accordance with the contractual conditions. This definition was adopted because the values are not held for trading that in accordance with understanding of the Management reflects the most relevant accounting information. The fair value of these transactions are similar to its book values, due to being financial instruments whose rates are similar to the market rates and having specific characteristics.
• Derivatives - foreign exchange futures are measured based on foreign exchange rates and yield
curves obtained based on quotations and for the same maturities of the contracts. Level 2 fair value measurements are used for the Company’s derivatives.
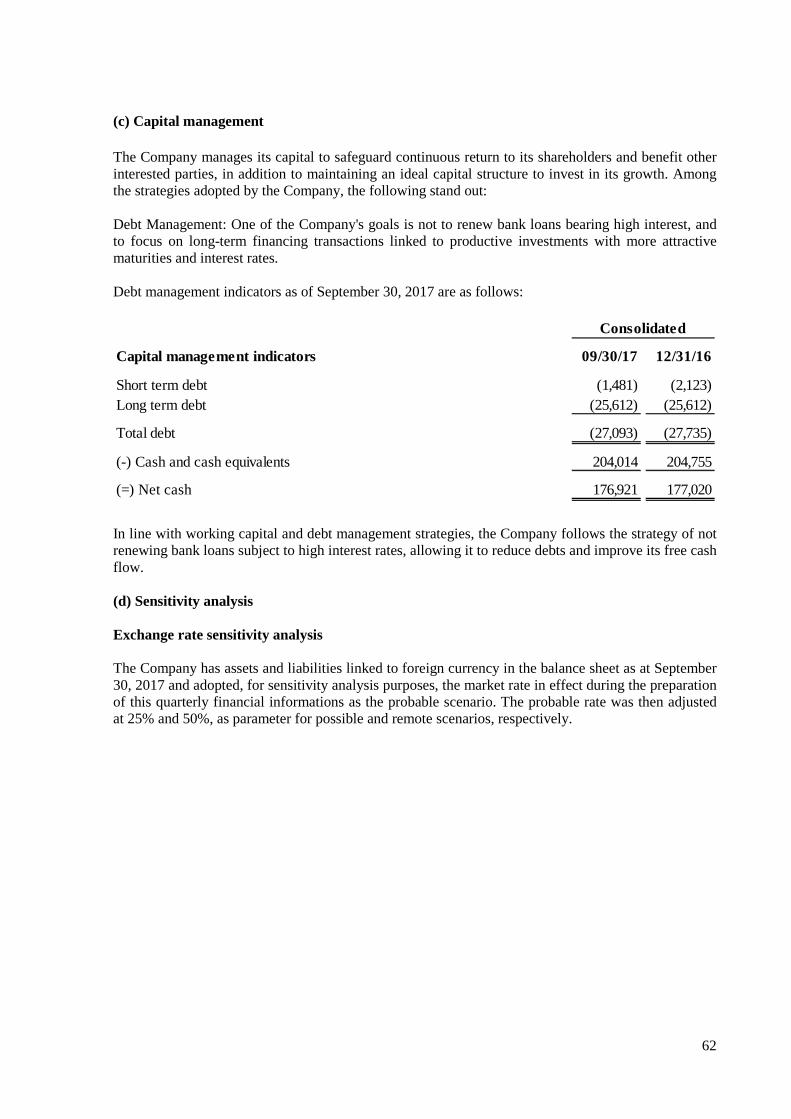
62
(c) Capital management The Company manages its capital to safeguard continuous return to its shareholders and benefit other interested parties, in addition to maintaining an ideal capital structure to invest in its growth. Among the strategies adopted by the Company, the following stand out: Debt Management: One of the Company's goals is not to renew bank loans bearing high interest, and to focus on long-term financing transactions linked to productive investments with more attractive maturities and interest rates. Debt management indicators as of September 30, 2017 are as follows:
Capital management indicators 09/30/17 12/31/16
Short term debt (1,481) (2,123)Long term debt (25,612) (25,612)
Total debt (27,093) (27,735)
(-) Cash and cash equivalents 204,014 204,755
(=) Net cash 176,921 177,020
Consolidated
In line with working capital and debt management strategies, the Company follows the strategy of not renewing bank loans subject to high interest rates, allowing it to reduce debts and improve its free cash flow. (d) Sensitivity analysis Exchange rate sensitivity analysis The Company has assets and liabilities linked to foreign currency in the balance sheet as at September 30, 2017 and adopted, for sensitivity analysis purposes, the market rate in effect during the preparation of this quarterly financial informations as the probable scenario. The probable rate was then adjusted at 25% and 50%, as parameter for possible and remote scenarios, respectively.
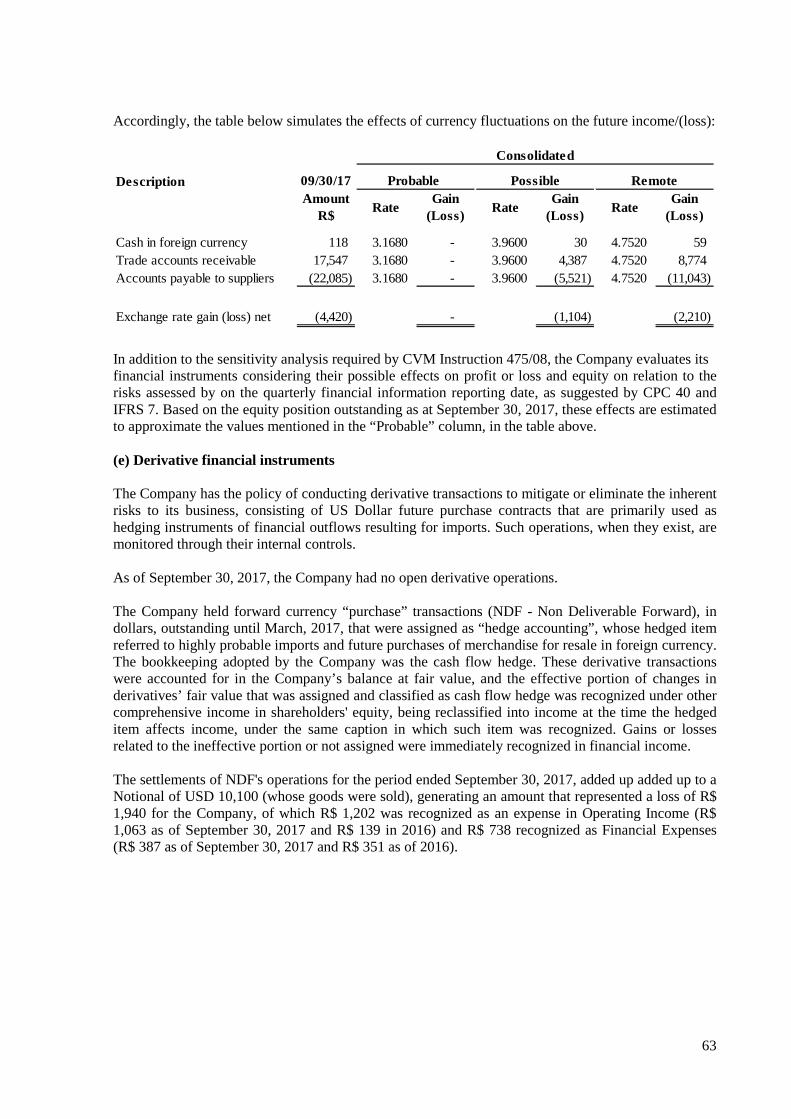
63
Accordingly, the table below simulates the effects of currency fluctuations on the future income/(loss):
Description 09/30/17
118 3.1680 - 3.9600 30 4.7520 59 17,547 3.1680 - 3.9600 4,387 4.7520 8,774
(22,085) 3.1680 - 3.9600 (5,521) 4.7520 (11,043)
(4,420) - (1,104) (2,210)
Consolidated
Cash in foreign currency
Possible Remote
RateGain
(Loss)Rate
Gain (Loss)
RateGain
(Loss)Amount
R$
Exchange rate gain (loss) net
Probable
Trade accounts receivableAccounts payable to suppliers
In addition to the sensitivity analysis required by CVM Instruction 475/08, the Company evaluates its financial instruments considering their possible effects on profit or loss and equity on relation to the risks assessed by on the quarterly financial information reporting date, as suggested by CPC 40 and IFRS 7. Based on the equity position outstanding as at September 30, 2017, these effects are estimated to approximate the values mentioned in the “Probable” column, in the table above. (e) Derivative financial instruments The Company has the policy of conducting derivative transactions to mitigate or eliminate the inherent risks to its business, consisting of US Dollar future purchase contracts that are primarily used as hedging instruments of financial outflows resulting for imports. Such operations, when they exist, are monitored through their internal controls. As of September 30, 2017, the Company had no open derivative operations. The Company held forward currency “purchase” transactions (NDF - Non Deliverable Forward), in dollars, outstanding until March, 2017, that were assigned as “hedge accounting”, whose hedged item referred to highly probable imports and future purchases of merchandise for resale in foreign currency. The bookkeeping adopted by the Company was the cash flow hedge. These derivative transactions were accounted for in the Company’s balance at fair value, and the effective portion of changes in derivatives’ fair value that was assigned and classified as cash flow hedge was recognized under other comprehensive income in shareholders' equity, being reclassified into income at the time the hedged item affects income, under the same caption in which such item was recognized. Gains or losses related to the ineffective portion or not assigned were immediately recognized in financial income. The settlements of NDF's operations for the period ended September 30, 2017, added up added up to a Notional of USD 10,100 (whose goods were sold), generating an amount that represented a loss of R$ 1,940 for the Company, of which R$ 1,202 was recognized as an expense in Operating Income (R$ 1,063 as of September 30, 2017 and R$ 139 in 2016) and R$ 738 recognized as Financial Expenses (R$ 387 as of September 30, 2017 and R$ 351 as of 2016).

64
On December 31, 2016, the derivate operations held by the Company were contracted with banks Santander and HSBC, in the following amounts under the following terms and conditions:
(*) The amount recognized in Other Comprehensive Income withheld, was realized against the Operating Income account, at the time hedged item affected income. On December 31, 2016, the Company had a notional value of derivatives of USD 10,100 (USD 5,900 for outstanding transactions and USD 4,200 for settled transactions, whose goods have not been sold) and, these operations amounted to a debit balance relating to the variation between the reference values of contracted derivatives and the respective calculations of fair value of R$ 1,525 recorded under derivative financial liabilities in Current liabilities. As counterpart, the following, the following amounts were recorded in the following accounts: R$ 1,037 as a Equity Valuation Adjustments - Other Comprehensive Income (R$ 685 net of deferred Income Tax and Social Contribution) R$ 139 recognized as an expense in Operating Income and R$ 349 as a Financial Expense. Additionally, the sum of R$ 1,602 was settled and produced R$ 1,402 loss (R$ 925 net of deferred income tax and social contribution) withheld in Other Comprehensive Income, R$ 242 as an expense in Operating Income and R$ 42 as Financial Expense. The settlements of NDF operations for the period ended December 31, 2016 amounted to a notional value of USD 35,400 thousand, in which these goods have been sold, generating an amount that represented a loss of R$ 4,642 for the Company, of which R$ 11 recognized as revenue in operating Income (R$ 737 as expense in 2016, and and R$ 748 as income as income in 2015), and R$ 4,653 recognized in Financial Expense (R$ 4,544 in 2016 and R$ 109 in 2015).
OtherHedged Average Open Liquidated Other comprehensive
target Fair Fair comprehensive income Operating Financialquotation Value Value income (withheld)(*) Income income
05/17/2016 01/02/2017 2,000 3.2591 (965) - (835) - (139) 910/28/2016 01/02/2017 1,200 3.2591 10 - 164 - - (154)11/29/2016 02/01/2017 2,700 3.2782 (570) - (366) - - (204)04/15/2016 11/01/2016 1,200 3.1789 - (673) - (562) (111) -05/17/2016 12/01/2016 300 3.3967 - (94) - (136) - 4205/17/2016 12/01/2016 2,700 3.4004 - (835) - (704) (131) -
10,100 (1,525) (1,602) (1,037) (1,402) (381) (307)
Contract date
Maturity date
amountUS$’000
Recognized in

65
24 Shareholders’ equity and reserves (a) Capital The authorized share capital comprises 350,000,000 common shares, with no par value, and the subscribed and paid-in capital as of September 30, 2017 consisted of 161,843,634 common shares held by the following shareholders (interests over 5%):
Gávea Investimentos Ltda. 23,431,622 14.5% 25,259,342 15.7%8,052,473 5.0% 24,370,992 15.1%
11,964,724 7.4% 11,964,724 7.4%11,768,370 7.3% 11,768,370 7.3%7,576,100 4.7% 9,983,500 6.2%
99,050,345 61.1% 77,881,559 48.3%
161,843,634 100% 161,228,487 100%
09/30/17 12/31/16
Coronation Fund Managers Ltd. (*)
Investimento e Participação INPASA Ivo Hering
(*) Manager headquartered in South Africa
Cambuhy Investimentos Ltda.Others
On May 26, 2017, 51,528 shares were issued, and on August 18, 2017, 563,619 shares were issued to comply with the Company's Stock Option Plan. (b) Shares in Treasury On July 24, 2014, the Company’s Board of Directors approved a Program for the Repurchase of the Company’s Common Shares to be held in treasury and subsequent disposal and/or cancellation and/or to meet the “Plan of Option to Purchase Company Shares”. Limited to five million (5,000,000) common shares. This program was valid until July 25th, 2015, and 3,732,700 shares were repurchased, of which 323,000 (three hundred twenty-three thousand) were held in treasury, until the period ended on March 31,2017. On July 29, 2015, the Company’s Board of Directors approved the creation of a New Program for the Repurchase of the Company’s Common Shares to be held in treasury and subsequent disposal and/or cancellation and/or to meet the “Plan of Option to Purchase Company Shares”. Limited to eight million (8,000,000) common shares. On July 27, 2016, the Board of Directors approved this program’s renewal, the expiration date of which was extended to July 27, 2017.

66
On September 30, 2017 there were no shares in the treasury and the period's movimentation is shown below:
Shares in Treasury
(thousands)Average cost
R$ (*)Total cost
R$ thousand
Balances at December 31, 2016 323 14.28 4,614
Disposal of shares in treasury, by exercise of call option on May 26, 2017 (323) 14.28 (4,614)
Balances at September 30, 2017 - -
(*) Includes brokerage fees and the BM&FBovespa and CBLC taxes. In the second quarter of 2017, 323,000 shares of the 3rd, 9th and 10th Stock Option Programs were exercised, at an average cost of R$ 16.06, totaling R$ 5,189. In order to face this exercise of stock options, the Company used the balance of treasury shares at an average cost of R$ 14.28, totaling R$ 4,614. In addition, 51,528 shares were issued, at an average cost of R$ 14.85, totaling R$ 765, to cover the exercise of the 10th Stock Option Program. (c) Capital reserve Stock options granted as described in Note 27 are recorded as capital reserves. (d) Earnings reserves � Legal reserve Recognized at a rate of 5% of net income, according to the provisions of Article 193 of Law 6,404/76, up to the limit of 20% of the Shareholder's Equity. � Profit retention Refers to the remaining amount of net income for the year, after the recognition of legal reserve, tax incentive reserve, proposal for dividend distribution and interest on shareholders’ equity, created for the realization of investments, expansion and reinforcement of working capital.

67
� Other profit reserves Tax incentives Refers to amounts of investment grants received, represented by the tax incentives granted (note 19) and reduction incentives of IRPJ, are as follows:
09/30/17 12/31/16
Lei do Vestuário - GO 313,369 313,369 Pró-Emprego - SC 87,084 87,084 Proadi - RN 84,705 84,705 Fomentar - GO 31,750 31,750 Produzir - GO 6,562 6,562 Tax (IRPJ) Operating Profit 29,449 29,449 Reinvestment income tax reduction 336 1,605
553,255 554,524
At the Extraordinary General Meeting held in April 2017, a capital increase of R$ 1,269 was approved, using part of the balance of the tax incentive reserve for the reinvestment of Income Tax. (e) Remuneration to shareholders The corporate by-laws determine the distribution of a minimum dividend of 25% of the net profit for the year, adjusted in accordance with article 202 of Law 6,404/76. On May 31, 2017, dividends were paid, with the profit retention reserve, in the amount of R$ 74,998, approved at the Ordinary and Extraordinary General Meeting general meeting held on April 26, 2017. On August 1, 2017, the dividend anticipation referring to the current period's result in the amount of R$ 49,996 was approved, which were paid in August 17, 2017. On August 30, 2017, the dividend anticipation referring to the current period's result in the amount of R$ 49,993 was approved, which will be paid in October 25, 2017.

68
(f) Other comprehensive income The balance comprises the effect of recording of employee benefits of HeringPrevi Private Pension Plan, Health Plan (Note 22) and derivative financial instruments assigned to Hedge Accounting (Note 23).
25 Interest on shareholders’ equity As prescribed by Law 9,249/95, the Company interest on capital for the period ended September 30, 2017 amounted to R$ 37,268 (net of IRRF, in the amount of R$ 5,729) corresponding to 2017, as approved at the Board of Directors’ meeting held on May 31, 2017.
26 Profit sharing The Company grants its employees shares in income, related to the profit sharing plans, which are associated with meeting specific goals, based on achievement of personal and corporative goals, set and agreed on at the beginning of each year. On September 30, 2017, there was a provision of R$ 14,318 (on September 30, 2016, there was no provision due to lower-than-expected results).
27 Stock option plan
As at September 30, 2017 the Company has opened the 4th, 5th, 6th, 7th, 8th, 9th and 10th stock option plan (stock options) created under Stock Option Purchase Plan approved at the Ordinary and Extraordinary General Meeting held on April 10, 2008. The approval by the Board of Directors, the number of shares granted by program and the exercise price per share is disclosed below:
The share granted in the first, second, and third programs for stock options were fully exercised by the beneficiaries The programs provide that the options granted to beneficiaries can only be exercised according to the following terms and conditions: (a) up to 25% (twenty five per cent) of total amount of shares of the option from the end of the first year counted from the date of signature of the respective Adhesion Agreement between the Company and each beneficiary; (b) up to 50% (fifty per cent) of total amount of shares of the option, minus those already exercised, from the end of the second year counted from the date of signature of the respective Adhesion Agreement between the Company and each beneficiary; (c) up to 75% (seventy five per cent) of total amount of shares of the option, minus those already exercised, from the end of the third year counted from the date of signature of the respective Adhesion Agreement between the Company and each beneficiary; and (d) up to 100% (one hundred per cent) of total amount of shares of the option, minus those already exercised, from the end of the fourth year counted from the date of signature of the respective Adhesion Agreement between the Company and each beneficiary.
4th 5th 6th 7th 8th 9th 10th
05/04/11 05/08/12 05/21/13 07/25/13 05/21/14 07/29/15 05/24/16
Number of shares granted 265,000 246,000 264,000 72,872 953,850 1,335,112 1,226,445
31.84 45.83 38.61 34.24 25.05 12.64 14.25
Approval date
Exercise price / R$ share
Program

69
The programs also provide the right to exercise, in case of the death, retirement or permanent disability of the participant. After an option becomes exercisable, the beneficiary may exercise it at any time, up to the end of the period of seven years from the date of the granting of such option. Each option refers to the right of subscribe one share of the Company. The exercise of the option provides the beneficiaries the same rights granted to other shareholders of the Company. The plan is administered by a committee appointed by the Board of Directors. For comparative purposes, we are considering the share split for the 1st, 2nd and 3rd programs for stock options granted, exercised and canceled since the early option programs. From a total 7,423,423 (1st, 2nd and 3rd programs after split and the 4th, 5th, 6th, 7th, 8th, 9th and 10th program) share options granted in the programs, 306,000 share options were exercised and converted into shares in 2009, 633,036 in 2010, 708,035 in 2011, 793,785 in 2012, 387,288 in 2013, 27,000 in 2016 and 938,147 in 2017 and 174,000 were cancelled in 2009, 47,600 in 2013, 365,297 in 2015, 38,197 in 2016 and 303,028 in 2017. If all the options available were exercised on September 30, 2017, the current shareholders’ capital would be diluted by 1.67% (2.45% on December 31, 2016). As established by the CPC Technical Pronouncement 10 – Share-based payment, the Company booked the fair value of options. The amount was calculated by a third party with the expertise in this type of methodology that calculated using the Black & Scholes method to the 1st, 2nd, 3rd, 4th and 5th programs, and the Binomial model for the 6th, 7th, 8th, 9th and 10th program (this method was used because it adequately allows the inclusion of premises such as anticipated exercise, expiration due to loss of bond and other characteristics). The fair value of options on the granting date is shown on the line Total amount below. In period ended on September 30, 2017, the Company recognized in the income statement the amount of R$ 3,538 (R$ 5,516 December 31, 2016).

70
The fair value of the stock options was determined according to the Black & Scholes method for the 1st to 5th programs and the Binomial model for the 6th to 10th program and the following assumptions:
1st 2nd 3rd 4th 5th 6th 7th 8th 9th 10th
Granting date 05/29/08 05/28/09 05/27/10 05/04/11 05/08/1201/01/04 05/21/13 07/25/13 05/21/1401/01/04 07/29/1501/01/04 05/24/16
Number of shares 532,000 304,048 184,000 265,000 246,000264,000 72,872 953,850 1,335,112 1,226,445
Exercise price 9.61 7.18 36.67 31.84 45.83 38.61 34.24 25.05 12.64 14.25 R$/share
Closing price 10.42 11.04 41.5 33.5 45.91 43.5 30.56 21.79 11.64 13.08 R$/share
Volatility (daily) 2.67% 4.27% 3.07% 2.13% 2.34% 1.83% 2.36% 2.19% 2.75% 2.49%
Volatility (annualy) 42.46% 67.84% 48.73% 33.76% 37.21% 29.01% 37.46% 34.63% 43.71% 39.50%
Dividend yeld 2.00% 2.47% 1.88% 2.76% 4.00% 4.00% 4.00% 5.10% 5.50% 5.50% p.a
Termination fee (*) - - - - - 1.01% 1.01% 1.10% 5.00% 14.29% p.a
Termination fee (*) - - - - - - - - 15.00% 13.64% p.a
Market to Strike Ratio - - - - - 2.33 2.33 2.25 2.25 2.24
IPCA coupon (**) 7.34% 6.57% 6.77% 6.35% 3.65% 3.83% 4.89%6.16% 6.65% 6.13% p.a
Total term 7 7 7 7 7 7 7 7 7 7 years
Price per share 5.76 8.29 24.78 14.89 17.00 11.87 8.80 5.38 3.30 2.90 R$/share
Total amount 3,065 2,520 4,559 3,946 4,183 3,134 641 5,128 4,404 3,561 R$ 000
Number of shares after stock split (***) 1,596,000 912,144 552,000 265,000 246,000 264,000 72,872 953,850 1,335,112 1,226,445
Program
(*) The company's termination fee, from the 9th program onwards, is presented segregated between Executive Officers and Other. (**) Risk free interest rate (***) At an Extraordinary General Meeting held on October 29, 2010, the shareholders approved the stock split of the shares issued by the Company, at a ratio of two new shares for each common share owned, and each common share started to be represented by three new shares after the stock split. The split is reflected in the number of shares granted in the 1st, 2nd and 3rd programs.

71
The closing rate of the price per share of the Company Hering, with code HGTX3 and the volatility rate before reported for the 1st, 2nd, 3rd, 5th, 6th, 7th, 8th, 9th and 10th programs was taken directly from the Bloomberg, and for the 4th option, it was obtained from Economatica. The IPCA curve coupon was obtained from the site of the Futures and Commodities Exchange (BM&F) in the Historical Data field, Search by trading floor, file “Derivatives Market - Swap Market Rates”. The contract coupon IPCA is traded under the symbol DAP. For rate volatility, it was taken a series of closing prices of Company stock under the code HGTX3, and it was calculated on the daily historical volatility, which was later annual for use in calculating the fair value of stock options. The periods analyzed were:
1st 2nd 3rd 4th 5th 6th 7th 8th 9th 10th
Starting date 05/30/0701/01/04 05/29/0801/01/04 05/28/0901/01/04 05/31/1001/01/04 05/09/1101/01/04 09/30/1001/01/04 08/31/1001/01/04 11/23/1101/01/04 07/29/0801/01/04 05/26/09
End date 05/29/0801/01/04 05/28/0901/01/04 05/27/1001/01/04 05/04/1101/01/04 05/08/1201/01/04 05/21/1301/01/04 07/25/1301/01/04 05/21/1401/01/04 07/29/1501/01/04 05/24/16
Program
Presented according to the change in the options, the average exercise price for the stock options is as follows:
Number of options
Weighted average exercise
priceNumber of
options
Weighted average exercise
price
3,943,185 24.22 2,781,937 26.62
- - 1,226,445 14.25
(938,147) 15.04 (27,000) 13.90
(303,028) 19.87 (38,197) 20.63
2,702,010 28.06 3,943,185 24.22
1,149,372 43.58 1,379,740 36.36
09/30/17 12/31/16
Avaliable options at the beginning of the period
Granted options
Exercised options
Cancelled options
Avaliable options at the end of the period
Exercisable options at the end of the period

72
28 Revenue The Company's net revenue is broken down as follows:
09/30/17 09/30/16 09/30/17 09/30/16
Domestic market 1,071,977 1,038,345 1,074,878 1,041,460 221,381 181,269 221,381 181,269 35,722 31,884 35,722 31,884 12,262 12,340 12,262 12,340
(40,197) (33,686) (40,197) (33,686)
1,301,145 1,230,152 1,304,046 1,233,267
(32,434) (29,620) (32,434) (29,620)
(2,842) (4,763) (2,842) (4,763)
Sales tax (158,653) (155,696) (158,817) (155,872)
Deductions (193,929) (190,079) (194,093) (190,255)
Net revenue 1,107,216 1,040,073 1,109,953 1,043,012
Parent company Consolidated
Returns
Own stores
Foreing market
Royalties
Rebates IBCC (Instituto Brasileiro de Controle do Câncer)
Adjustments to present value - Revenue
Gross revenue

73
29 Costs of goods or services sold
09/30/17 09/30/16
Raw material and Resale goods 328,385 348,882 Salaries, charges and benefits 129,323 123,363 Depreciation 20,808 20,896 Outsource labor 109,750 109,322 Energy 7,848 8,567 Other Costs 23,489 24,994
619,603 636,024
Parent company and Consolidated
30 Selling expenses
09/30/17 09/30/16
Sales commissions expenses 41,632 42,168 Sales freight expenses 28,251 29,085 Personnel expenses 66,236 57,994 Advertising and promotions expense 38,512 28,787 Property rental expenses 32,876 26,836 Provision for doubtful accounts 8,729 6,173 Expenses with samples and product development 11,270 10,756 Traveling expenses 6,006 5,333 Expenses for third-party services 12,502 11,876 Others expenses 12,785 6,928
258,799 225,936
Parent company and consolidated

74
31 Administrative and general expenses
09/30/17 09/30/16 09/30/17 09/30/16
Personnel expenses 19,661 17,958 19,682 17,958 Expenses for third-party services 9,227 6,465 9,227 6,465 Institutional advertising expense 915 1,026 915 1,026 Expenses with donations - - - - Expenses for information technology service 2,805 2,099 2,805 2,099 Traveling expenses 1,066 833 1,066 833 Property rental expenses 1,569 1,529 1,569 1,529 Others expenses 2,255 2,207 2,267 2,228
37,498 32,117 37,531 32,138
Parent Company Consolidate
32 Other net operating (expenses) and income
Other operating income 09/30/17 09/30/16 09/30/17 09/30/16
Tax credit (a) 3,036 6,767 3,036 6,767 Claims received 873 544 873 544
- 1,655 - 1,655 Compulsory Loan (b) 8,091 7,654 8,091 7,654 Others 3,799 1,470 3,799 1,470
15,799 18,090 15,799 18,090
Other operating expenses
(4,493) (3,821) (4,493) (3,821)Stock option plan (3,538) (4,157) (3,538) (4,157)
(225) (1,584) (225) (1,584)FUNEFTE - Goiás (c) - (1,096) - (1,096)Labor indemnities (d) (1,702) (9,948) (1,702) (9,948)Goiás Protege Fund (e) (14,027) (9,993) (14,027) (9,993)
(2,595) - (2,595) - Others (2,759) (3,558) (3,365) (3,966)
(29,339) (34,157) (29,945) (34,565)
Other net operaing (expenses) and income (13,540) (16,067) (14,146) (16,475)
Parent Company Consolidate
Revenue from sale of PP&E and intangible assets
Representatives indemnities
Actuarial evaluation of health care and pension
Formation and reversals of labor and civil provisions

75
(a) Refers to the RAT (Environmental Labor Risk) and INSS Cooperatives credits.
(b) Refers to the remaining credit for judicial discussion as described in note 12.
(c) Refers to the Fiscal Balance Fund of the Goiás State Treasury, which corresponds to 10% on the tax incentive amount used by the taxpayer. It was revoked on March 31, 2016 by Decree No. 8,620, of March 31, 2016, art. 1.
(d) Labor indemnity regarding reorganization of the industrial structure.
(e) Refers to the Goiás Protégé Fund, which corresponds to 15% on the tax incentive amount used by the taxpayer, according to Law No. 14,469 of July 16, 2003.
33 Net financial result
09/30/17 09/30/16 09/30/17 09/30/16
Financial income
17,832 19,817 17,832 19,817 2,112 6,500 2,112 6,500
33,045 32,436 33,045 32,436 10,063 8,204 10,104 8,246 22,674 16,748 22,674 16,748
457 - 411 -
86,183 83,705 86,178 83,747
(2,367) (28) (2,367) (28)
(392) (1,140) (392) (1,140)
(15,518) (17,872) (15,518) (17,872) (388) (4,555) (388) (4,555)
(5,296) (5,888) (5,337) (5,907) - (3,776) - (4,111)
(23,961) (33,259) (24,002) (33,613)
62,222 50,446 62,176 50,134
Parent Company Consolidated
Adjustment to present value
Other income
Interest on financial operations
Adjustment to present value
Interest on financial operations
Financial charges on taxes
Net exchange rate variation income
Financial expenses
Compulsory loans (a)
Interest on taxes recovered
Net financial result
Derivative expenses Other expensesNet exchange rate variation expense
(a) Refers to the remaining credit related to judicial discussion as described in note 12.

76
34 Income and social contribution taxes
(a) Breakdown of income tax and of social contribution
09/30/17 09/30/16 09/30/17 09/30/16
Current taxes:
Social contribution (5,100) (1,484) (5,184) (1,574) Income tax (13,568) (4,205) (13,790) (4,436)
(18,668) (5,689) (18,974) (6,010)
Deferred taxes:
Social contribution (80) (80) (80) (80) Income tax (224) (223) (224) (223)
(304) (303) (304) (303)
Parent company Consolidated
(b) Reconciliation at the effective rate
09/30/17 09/30/16 09/30/17 09/30/16
196,736 154,460 197,042 154,781
34% 34% 34% 34%
(66,890) (52,516) (66,994) (52,626)
585 628 - -
33,109 30,440 33,109 30,440
14,619 14,309 14,619 14,309
567 147 567 26
(962) 1,000 (579) 1,538
(18,972) (5,992) (19,278) (6,313)
(18,668) (5,689) (18,974) (6,010)
(304) (303) (304) (303)
10% 4% 10% 4%
Consolidated
Current rate:
Other permanents additions (exclusions)
Income and social contribution taxes
Income and social contribution taxes - current
Investment subsidy (i)
Interest on shareholder's capital
Equity in controlled companies / subsidiaries
Effective rate
PAT, Rouanet Law and FIA Incentives
Income and social contribution taxes - deferred
Parent company
Profit before income and social contribution taxes
Tax impact on permanent additions and exclusions :
Estimated expense according to the current rate
(i) Refers to the tax benefits mentioned in note 19.

77
(c) Breakdown of deferred taxes in the income of statements
09/30/17 09/30/16
Constitution on temporary additions 7,478 2,050 Reversal on temporary exclusions 392 822 Constitution on tax losses and negative bases (8,260) (3,263) Realization of indexation of the PP&E in the period 86 88
(304) (303)
Parent company and Consolidated
35 Earnings per share (a) Basic earnings per share Earnings per share are calculated by dividing income from the Company's shareholders by the weighted average value of common shares issued in the year, minus shares bought by the Company and held as treasury shares.
09/30/17 09/30/16
177,764 148,468
161,173 162,667 (209) (1,789)
160,964 160,878
1.1044 0.9229
Parent Company
Profit attributable to the Company's shareholders
Weighted average number of common shares - thousandsWeighted average number of common treasury shares - thousands
Basic earnings per share - R$
(b) Diluted earnings per share Diluted earnings per share are calculated by adjusting the weighted average number of outstanding common shares to presume the conversion of all potential diluted common shares. The Company has a class of potential diluted common shares that refers to the stock option.
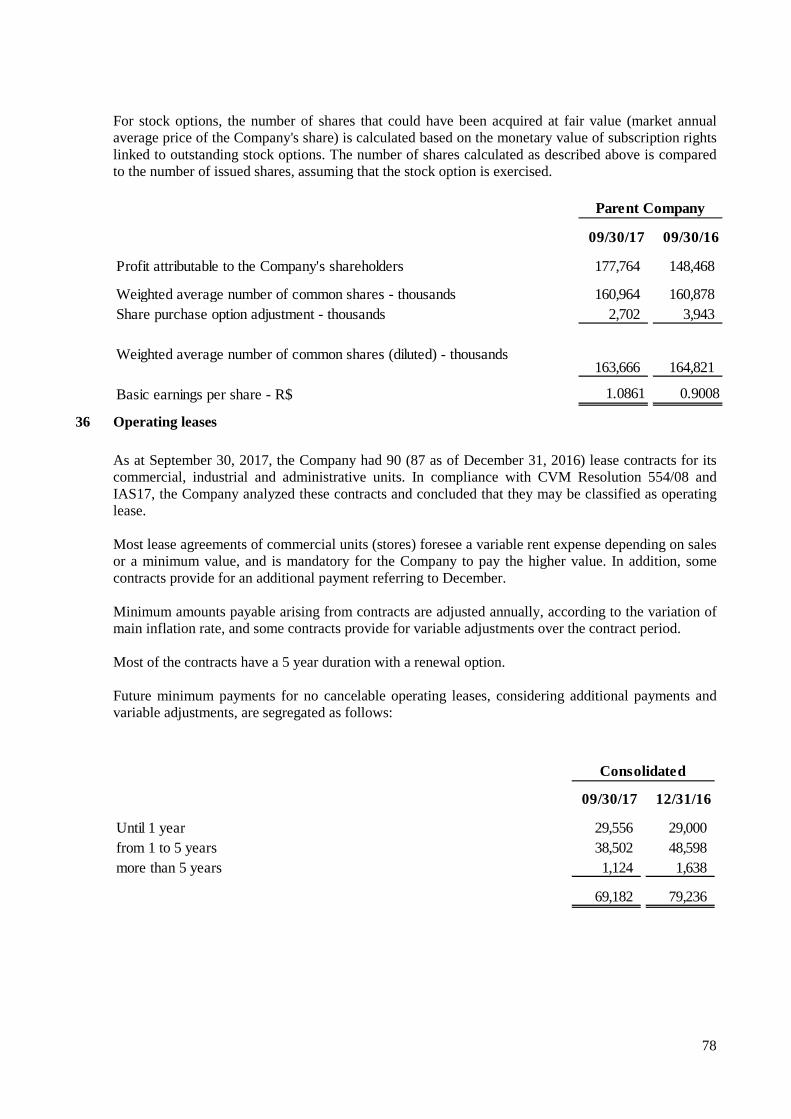
78
For stock options, the number of shares that could have been acquired at fair value (market annual average price of the Company's share) is calculated based on the monetary value of subscription rights linked to outstanding stock options. The number of shares calculated as described above is compared to the number of issued shares, assuming that the stock option is exercised.
09/30/17 09/30/16
177,764 148,468
160,964 160,878 2,702 3,943
163,666 164,821
1.0861 0.9008
Weighted average number of common shares (diluted) - thousands
Basic earnings per share - R$
Parent Company
Profit attributable to the Company's shareholders
Weighted average number of common shares - thousandsShare purchase option adjustment - thousands
36 Operating leases
As at September 30, 2017, the Company had 90 (87 as of December 31, 2016) lease contracts for its commercial, industrial and administrative units. In compliance with CVM Resolution 554/08 and IAS17, the Company analyzed these contracts and concluded that they may be classified as operating lease. Most lease agreements of commercial units (stores) foresee a variable rent expense depending on sales or a minimum value, and is mandatory for the Company to pay the higher value. In addition, some contracts provide for an additional payment referring to December. Minimum amounts payable arising from contracts are adjusted annually, according to the variation of main inflation rate, and some contracts provide for variable adjustments over the contract period. Most of the contracts have a 5 year duration with a renewal option. Future minimum payments for no cancelable operating leases, considering additional payments and variable adjustments, are segregated as follows:
09/30/17 12/31/16
Until 1 year 29,556 29,000 from 1 to 5 years 38,502 48,598 more than 5 years 1,124 1,638
69,182 79,236
Consolidated

79
The Company recognized the following expenses amounts with operational leasing transactions in selling, administrative and general expenses, and costs:
09/30/17 09/30/16
Expenses with operational lease 38,320 32,272
37 Operating segments
The Company has a single operating segment defined as textile, which embodies the production and apparel and accessories.The Company is organized, and has its performance assessed, as a single business unit for operating, commercial, managerial and administrative purposes. This view is supported by the following factors: � there are no divisions in its structure for managing different product lines, markets or sales
channels; � its plants operate for all the product lines, markets and sales channels; � the Company's strategic decisions are supported by studies that show market opportunities, and not
only by the performance by product, trademark or channel. The Company's products are distributed into different trademarks and channels (Trademarks: Hering, Hering Kids, PUC and DZARM.; Channels: Retail, Franchise and Own Stores). However, these units are controlled and managed as a single segment, and results are monitored and evaluated in a centralized manner.

80
Management makes a follow-up of gross revenues, on the domestic market, by trademark and distribution channel, as shown below:
Trademarks 09/30/17 09/30/16
Hering 923,085 885,793 Hering Kids 180,387 153,797 PUC 88,027 86,920 DZARM. 52,394 48,974 Others 24,431 25,899
Gross revenue domestic market 1,268,324 1,201,383
Gross revenue foreign market 35,722 31,884
Total gross revenue 1,304,046 1,233,267
Consolidated
Channel 09/30/17 09/30/16
Retail 573,469 533,984 Franchise 434,905 449,737 Webstore 33,466 26,958 Own stores 202,053 164,805 Others 24,431 25,899
Gross revenue domestic market 1,268,324 1,201,383
Gross revenue foreign market 35,722 31,884
Total gross revenue 1,304,046 1,233,267
Consolidated
The net revenues from the domestic and foreign markets are as follows:
09/30/17 09/30/16
Gross revenue domestic market 1,268,324 1,201,383 Gross revenue foreign market 35,722 31,884
Gross revenue 1,304,046 1,233,267
Deductions (194,093) (190,255)
Net revenue 1,109,953 1,043,012
Consolidated
Foreign revenue is not recorded separately by geographical area, as it represents only 3.22% of total net revenue as of September 30, 2017 (3.06% on September 30, 2016) (Company and consolidated balances).
There is no client that is individually responsible for more than 10% of domestic and foreign sales.

81
38 Insurance The Company adopts the policy of contracting insurance coverage for assets subject to risks for amounts considered to be sufficient to cover eventual casualties, considering the nature of its activity. The risk assumptions, due to their nature, are out of the scope of the review of the quarterly financial information, and therefore were not examined by our independent auditors. As at September 30, 2017, operating risk insurance coverage was comprised of R$ 142,188 for material damage, R$ 213,179 for loss of profit and R$ 27,000 for civil liability.
82
DECLARATION OF DIRECTORS In accordance with CVM Instruction 480/09, the Board states that reviewed, discussed and agreed with the view expressed in the independent auditors' report and the quarterly financial statement for the period ended September 30, 2017. EXECUTIVE BOARD Fábio Hering - Chief Executive Officer Cristina Caresia Marques - Director of Personnel Management and Organization Edgar de Oliveira Filho – Director of Industry Edson Amaro – Director of Brand Rafael Bossolani – Chief Financial Officer and Investor Relations Officer Marciel Eder Costa - Director of Administration Moacyr José Matheussi – Director of Supplies Ronaldo Loos – Director of Commerce Felipe Correa Pivatelli - Director of Retail BOARD OF DIRECTORS Ivo Hering – President Fábio Hering – Advisor Fábio Colletti Barbosa - Advisor Marcelo Pereira Lopes de Medeiros – Advisor Marcio Guedes Pereira Junior – Advisor Marcos Barbosa Pinto - Advisor Patrick Charles Morin Junior – Advisor

83
OTHER RELEVANT COMPANY INFORMATION In compliance with the Rules of Corporate Governance Practices, we present below some additional information about the company. 1 - Considering the Rules of Corporate Governance Practices (Novo Mercado), we present below, the shareholding on September 30, 2017: 1.1 - Cia Hering
Shareholder
Gávea Investimentos Ltda. 23,431,622 14.5% 25,259,342 15.7%Coronation Fund Managers Ltd. (*) 8,052,473 5.0% 24,370,992 15.1%Investimento e Participação INPASA S/A 11,964,724 7.4% 11,964,724 7.4%Ivo Hering 11,768,370 7.3% 11,768,370 7.3%Cambuhy Investimentos Ltda. 7,576,100 4.7% 9,983,500 6.2%Others 99,050,345 61.1% 77,881,559 48.3%
Total 161,843,634 100% 161,228,487 100.0%
(*) Manager headquartered in South Africa
09/30/17 12/31/16
Capital stock of legal entity (Companies Shareholders), up to the individual level 1.2 - Investimentos e Participações Inpasa S.A.
Common Shares Total
Ivo Hering 211,855 26.4% 211,855 26.4%Amaral Invest. e Partic. Ltda 95,181 11.9% 95,181 11.9%Dorca Adm. De Bens e Part. Ltda 66,370 8.3% 66,370 8.3%Clamaro Adm. Part. de Bens Ltda 59,618 7.4% 59,618 7.4%IPE Inv. e Part. Empr. Ltda 58,422 7.3% 58,422 7.3%Adm. Coml. Ind. Blumenauense Ltda 49,045 6.1% 49,045 6.1%Dimare Participações Societárias Ltda 45,871 5.7% 45,871 5.7%Others 216,405 26.9% 216,405 26.9%
Total 802,767 100% 802,767 100%

84
1.2.1 - Adm. Coml. Ind. Blumenauense Ltda.
Shareholder Shares %
MHL Participações Ltda 363,275,545 80.9%Espólio de Ricardo Hering 85,868,716 19.1%Bárbara Lebrecht 1 0.0%
Total 449,144,262 100%
1.2.2 - MHL Participações Ltda.
Shareholder Shares %
André Mueller Hering 233,024 50.0%Patricia Mueller Hering Dorow 233,024 50.0%Barbara Lebrecht 2 0.0%
Total 466,050 100%
1.2.3 - Dorca Adm. De Bens e Part. Ltda.
Shareholder Shares %
Hans Prayon 2,145,106 89.7%Others 247,234 10.3%
Total 2,392,340 100%
1.2.4 - Amaral Investimentos e Participações Ltda.
Shareholder Shares %
Isolde Hering Dandrea 6,500 50.0%Carlos Tavares D'Amaral 3,250 25.0%Marcio Tavares D'Amaral 3,250 25.0%
Total 13,000 100%

85
1.2.5 - Clamaro Administração e Participação de Bens Ltda.
Shareholder Shares %
Cláudio Hering Meyer 2,560,228 30.6%Marcos Hering Meyer 2,560,228 30.6%Roberto Hering Meyer 2,560,228 30.6%Uta Hedy Hering Meyer 682,002 8.2%
Total 8,362,686 100%
1.2.6 - IPE Investimentos e Participação de Bens Ltda.
Shareholder Shares %
Ivo Hering 6,329,015 22.0%Andrea Hildegard Hering Vila Boas 7,426,166 26.0%Karin Hering de Miranda 7,426,166 26.0%Cristiane Hering de Toni 7,426,166 26.0%Rotraud Katharina Hering 4,364 0.0%
Total 28,611,877 100%
1.2.7 - Dimare Participações Societárias Ltda.
Shareholder Shares %
Rene Werner Linnenkamp 8,354,773 100.0%Marlene Karin Werner 1,000 0.0%
Total 8,355,773 100%

86
2 - Shareholding of controlling parties, management and outstanding shares Shareholding on 09/30/2017
ShareholderCommon Shares % Total %
Controlling Shareholder 35,269,011 21.8% 35,269,011 21.8%Management - Board of Directors 114,503 0.1% 114,503 0.1% - Executive Board 237,071 0.1% 237,071 0.1%Fiscal Board - 0.0% - 0Treasury Shares - 0.0% - 0.0%Others Shareholders 126,223,049 78.0% 126,223,049 78.0%
TOTAL 161,843,634 100% 161,843,634 100%
Outstanding Shares 126,223,049 78.0% 126,223,049 78.0%
Shareholding on 06/30/2017
ShareholderCommon Shares % Total %
Controlling Shareholder 35,376,092 21.9% 35,376,092 21.9%Management - Board of Directors 114,503 0.1% 114,503 0.1% - Executive Board 269,865 0.2% 269,865 0.2%Fiscal Board - 0.0% - 0Treasury Shares - 0.0% - 0.0%Others Shareholders 125,519,555 77.8% 125,519,555 77.8%
TOTAL 161,280,015 100% 161,280,015 100%
Outstanding Shares 125,519,555 77.8% 125,519,555 77.8%

87
Shareholding on 03/31/2017
ShareholderCommon Shares % Total %
Controlling Shareholder 35,323,914 21.9% 35,323,914 21.9%Management - Board of Directors 114,506 0.1% 114,506 0.1% - Executive Board 239,665 0.1% 239,665 0.1%Fiscal Board - 0.0% - 0Treasury Shares 323,000 0.2% 323,000 0.2%Others Shareholders 125,227,402 77.7% 125,227,402 77.7%
TOTAL 161,228,487 100% 161,228,487 100%
Outstanding Shares 125,227,402 77.7% 125,227,402 77.7%
Shareholding on 12/31/2016
Shareholder Common Shares
% Total %
Controlling Shareholder 35,333,914 21.9% 35,333,914 21.9%Management - Board of Directors 114,506 0.1% 114,506 0.1% - Executive Board 239,665 0.1% 239,665 0.1%Fiscal Board - 0.0% - 0Treasury Shares 323,000 0.2% 323,000 0.2%Others Shareholders 125,217,402 77.7% 125,217,402 77.7%
TOTAL 161,228,487 100% 161,228,487 100%
Outstanding Shares 125,217,402 77.7% 125,217,402 77.7%

88
3 - Arbitration clause. The Company, its shareholders, managers and the Fiscal Board (when stablished) members undertake to resolve by arbitration, every and all dispute or controversy which may arise among them, especially related to or derived from enforcement, validity, effectiveness, construal, violation and its effects of provisions contained in the Brazilian Corporation Law number 6,404/76, in the Company’s Bylaws, in the rules issued by the Brazilian Monetary Committee (CMN), by the Brazilian Central Bank and by the Brazilian Securities and Exchange Commission (CVM), as well as other rules related to the capital markets operation in general besides those included in the “Novo Mercado” Listing Regulation, in the “Novo Mercado” Listing Agreement and in the Arbitration Regulation of the Market Arbitration Panel. 4 - Independent Auditors Cia. Hering policy with its independent auditors is referred to the provision of services not related to external auditing based on principles that preserve the independence of the auditors. These principles are based on the fact that the auditor should not assess his/her own work, nor carry out managerial functions or even advocate for its customer. During the period ended on September 30, 2017, the Company’s independent auditors were not contracted for other services beyond the examination of the quarterly financial statements of the period.