cia. hering - 4q16 results
TRANSCRIPT
4Q16 ResultsConference Call
February 24th, 2017 – 11:00 am (BrT)09:00 am (NY)/ 02:00 pm (London)
4Q16 Results
DISCLAIMER
This presentation contains forward-looking statements regarding the
prospects of the business, estimates for operating and financial
results, and those regarding Cia. Hering's growth prospects. These are
merely projections and, as such, are based exclusively on the
expectations of Cia. Hering management concerning the future of the
business and its continued access to capital to fund the Company’s
business Plan. Such forward-looking statements depend, substantially,
on changes in market conditions, government regulations,
competitive pressures, the performance of the Brazilian economy and
the industry, among other factors and risks disclosed in Cia. Hering’s
filed disclosure documents and are, therefore, subject to change
without prior notice.
• Financial Performance
• Outlook
• Q&A
2
FINANCIAL PERFORMANCE
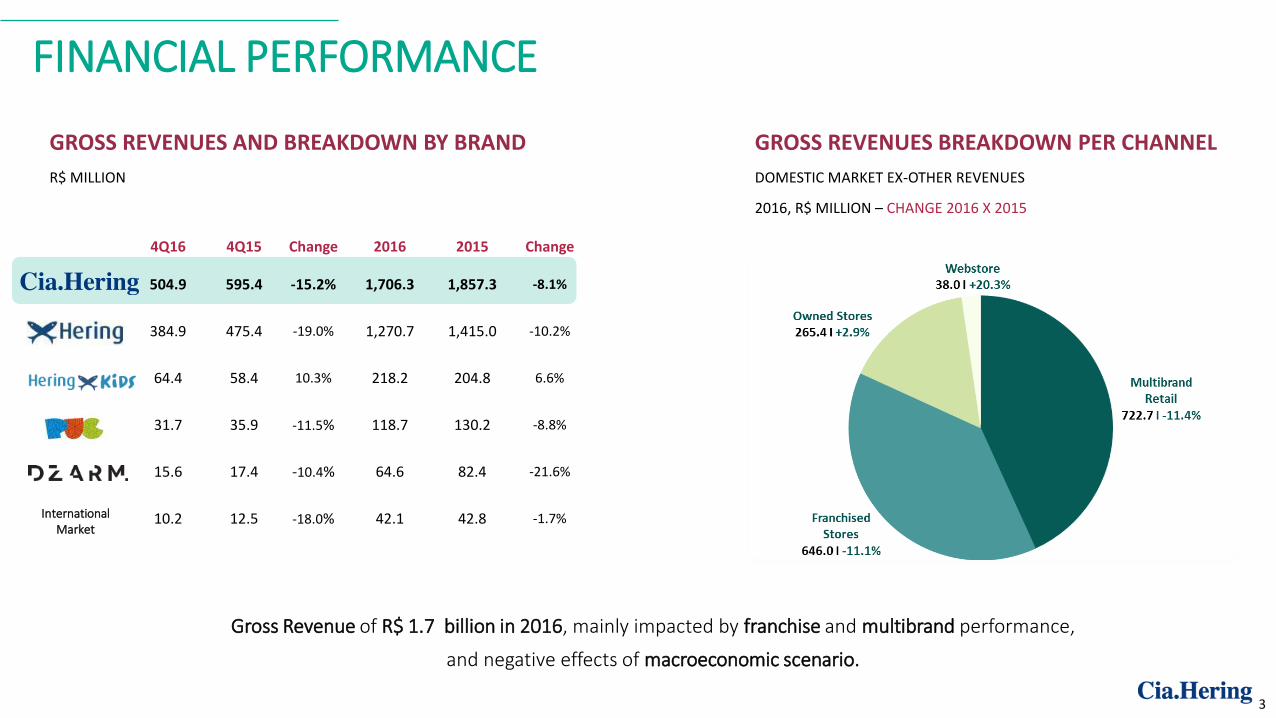
GROSS REVENUES AND BREAKDOWN BY BRAND
R$ MILLION
GROSS REVENUES BREAKDOWN PER CHANNEL
DOMESTIC MARKET EX-OTHER REVENUES
2016, R$ MILLION – CHANGE 2016 X 2015
Gross Revenue of R$ 1.7 billion in 2016, mainly impacted by franchise and multibrand performance,
and negative effects of macroeconomic scenario.
3
4Q16 4Q15 Change 2016 2015 Change
504.9 595.4 -15.2% 1,706.3 1,857.3 -8.1%
384.9 475.4 -19.0% 1,270.7 1,415.0 -10.2%
64.4 58.4 10.3% 218.2 204.8 6.6%
31.7 35.9 -11.5% 118.7 130.2 -8.8%
15.6 17.4 -10.4% 64.6 82.4 -21.6%
10.2 12.5 -18.0% 42.1 42.8 -1.7%InternationalMarket
HERING STORE NETWORK
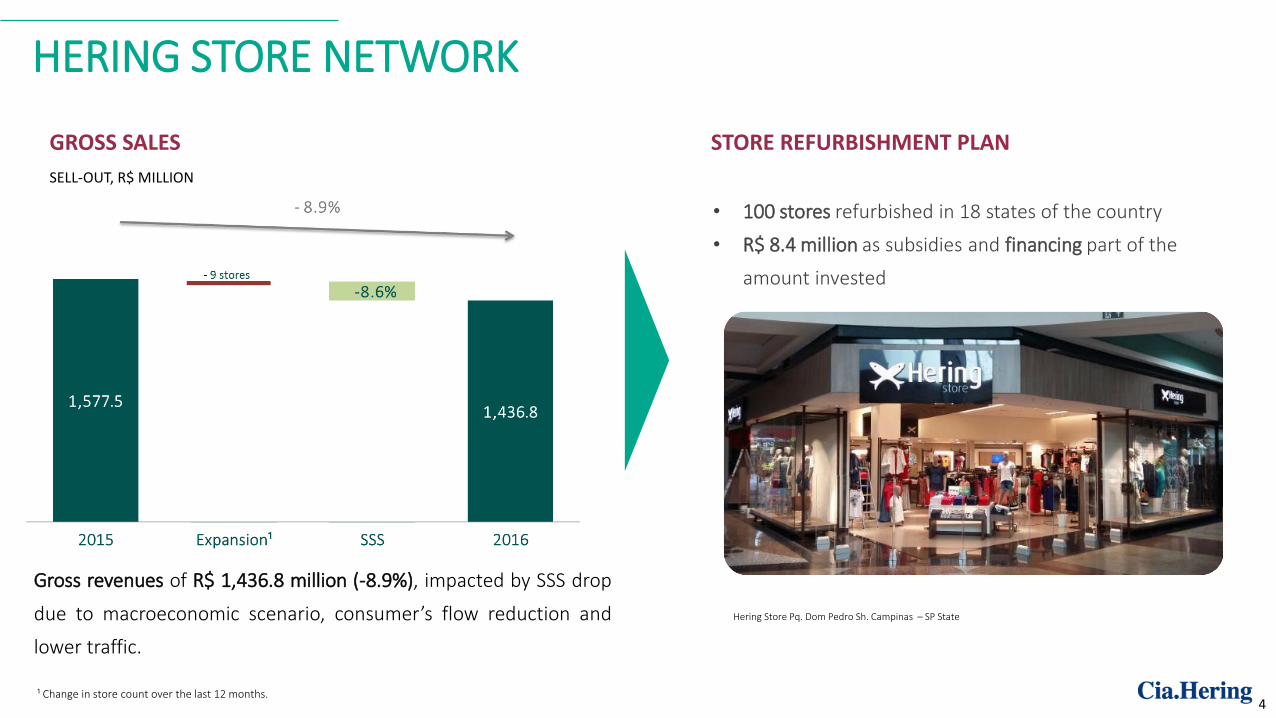
GROSS SALES
SELL-OUT, R$ MILLION
Gross revenues of R$ 1,436.8 million (-8.9%), impacted by SSS drop
due to macroeconomic scenario, consumer’s flow reduction and
lower traffic.
¹ Change in store count over the last 12 months.
STORE REFURBISHMENT PLAN
• 100 stores refurbished in 18 states of the country
• R$ 8.4 million as subsidies and financing part of the
amount invested
Hering Store Pq. Dom Pedro Sh. Campinas – SP State
4
FINANCIAL PERFORMANCE
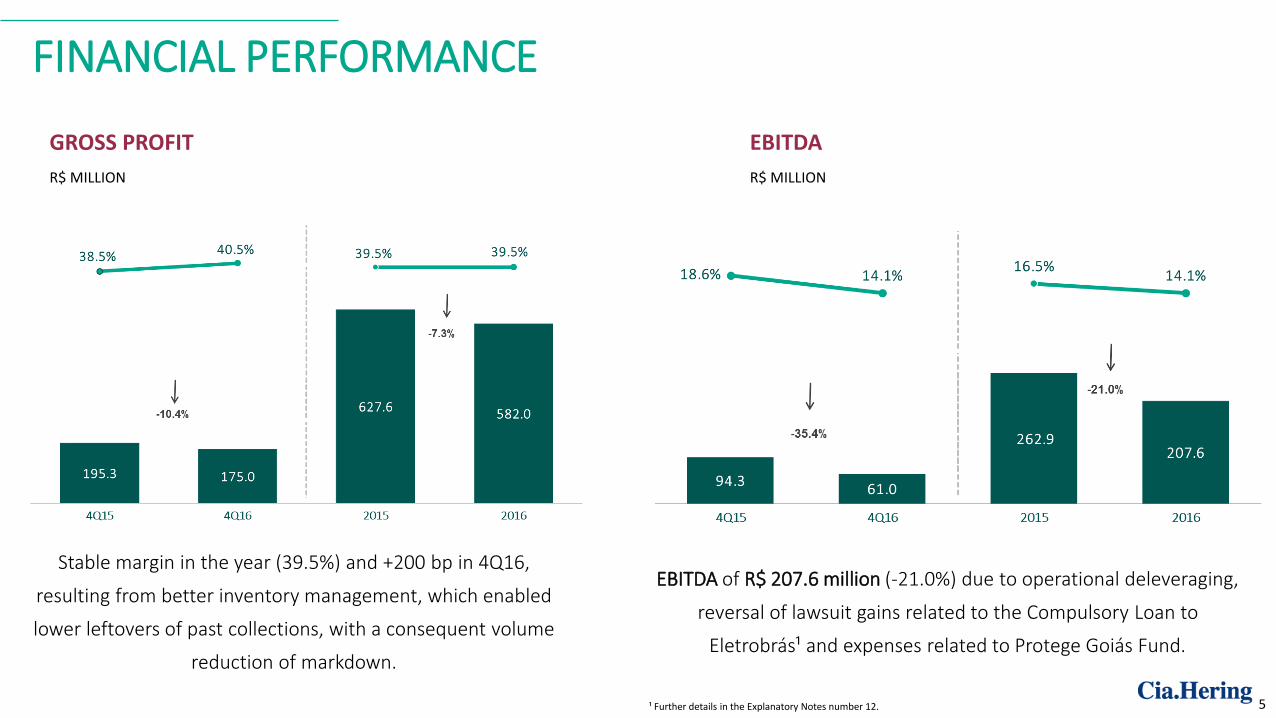
EBITDA of R$ 207.6 million (-21.0%) due to operational deleveraging,
reversal of lawsuit gains related to the Compulsory Loan to
Eletrobrás¹ and expenses related to Protege Goiás Fund.
Stable margin in the year (39.5%) and +200 bp in 4Q16,
resulting from better inventory management, which enabled
lower leftovers of past collections, with a consequent volume
reduction of markdown.
GROSS PROFIT
R$ MILLION
EBITDA
R$ MILLION
5¹ Further details in the Explanatory Notes number 12.
FINANCIAL PERFORMANCE
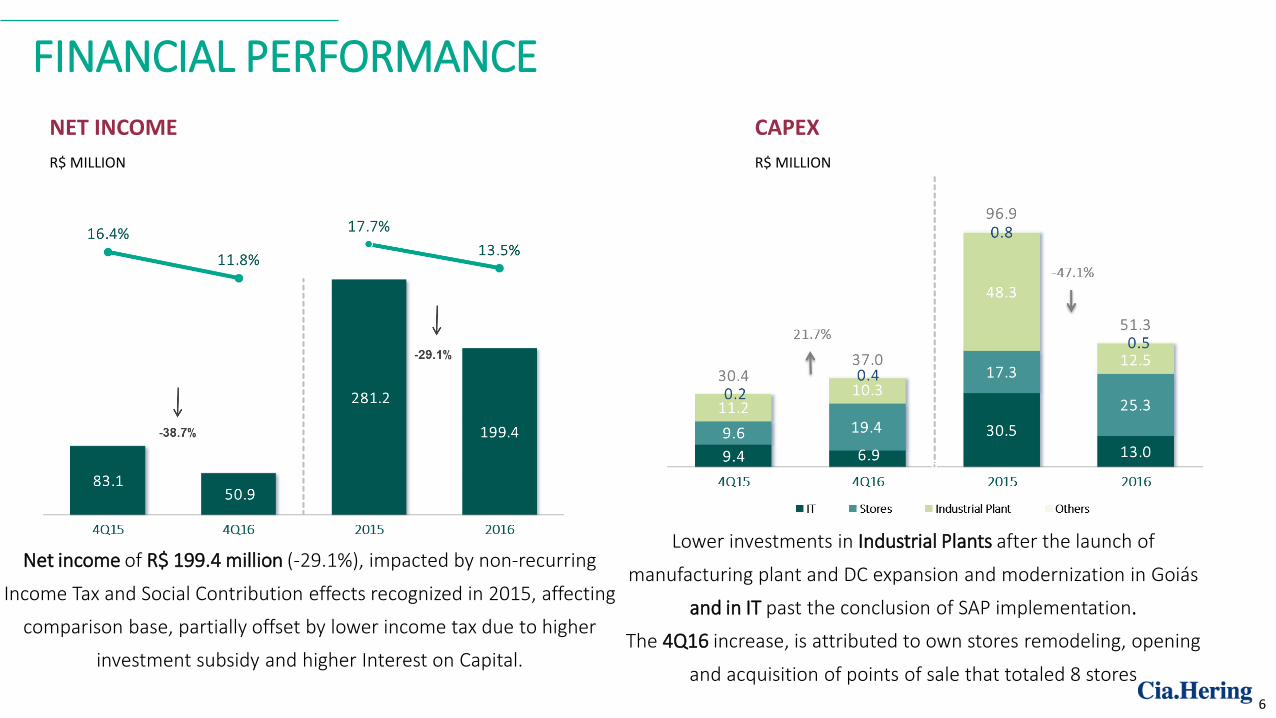
NET INCOME
R$ MILLION
CAPEX
R$ MILLION
Net income of R$ 199.4 million (-29.1%), impacted by non-recurring
Income Tax and Social Contribution effects recognized in 2015, affecting
comparison base, partially offset by lower income tax due to higher
investment subsidy and higher Interest on Capital.
Lower investments in Industrial Plants after the launch of
manufacturing plant and DC expansion and modernization in Goiás
and in IT past the conclusion of SAP implementation.
The 4Q16 increase, is attributed to own stores remodeling, opening
and acquisition of points of sale that totaled 8 stores
6

FINANCIAL PERFORMANCE
Cash flow of R$ 209.4 million, R$ 94.7 million higher than 2015, mainly due to a reduce in working capital needs
and lower investments, that more than offset EBITDA decline in the period.
As part of the Store Refurbishment plan, a portion of the amount invested by franchisees was financed by the company, and
R$ 14.7 million remained as receivable on December 31, recorded under 'other accounts receivable’.
CASH FLOWS
R$ MILLION
7
Cash Flow - Consolidated (R$ thousand) 2016 2015 Chg.
EBITDA 207,569 262,876 (55,307)
No cash items 21,176 25,693 (4,517)
AVP (Adjustment to Present Value) - Clients and Suppliers 20,326 18,219 2,107
Current Income tax and Social Contribution 1,766 1,631 135
Working Capital Capex 9,847 (96 ,812) 106,659
Decrease in trade accounts receivable 29,688 9,931 19,757
(Increase) decrease in inventories 4,020 (28,908) 32,928
Increase (decrease) in accounts payable to suppliers 21,081 (20,420) 41,501
(Decrease) in taxes payable (14,707) (24,745) 10,038
Refurbishment Project - Franchisee Financing (14,665) (734) (13,931)
Others (15,570) (31,936) 16,366
CapEx (51,314) (96,915) 45 ,601
Free Cash Flow 209,370 114,692 94,678
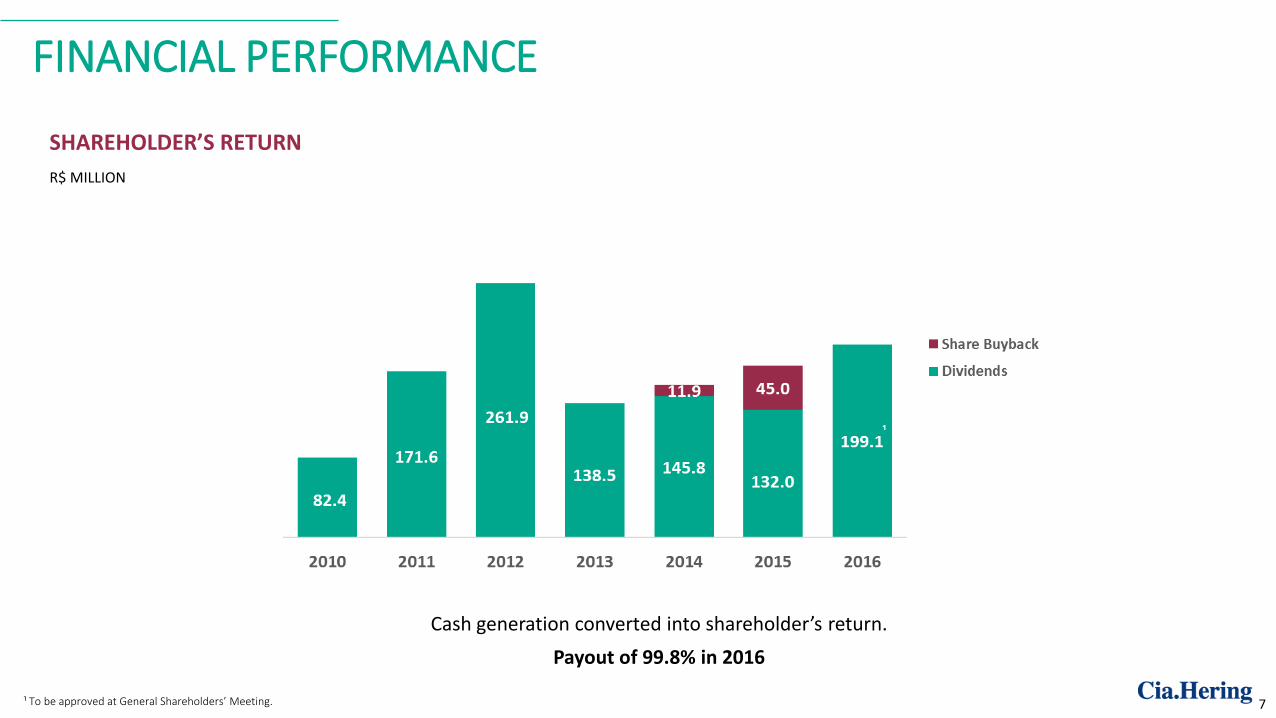
FINANCIAL PERFORMANCE
Cash generation converted into shareholder’s return.
Payout of 99.8% in 2016
SHAREHOLDER’S RETURN
R$ MILLION
7¹ To be approved at General Shareholders’ Meeting.
OUTLOOK
9
• Expectations on economy’s gradual recovery along the year, however not yet materialized in the
beginning of the year;
• Strategy based on Product and Store (P&S) continues:
• Improvements in Product rises and are translated into growth in orders received in the latest showrooms;
• Stores: refurbishments progresses, but at slower pace, and we will keep improving buying experience and VM;
• E-commerce: investments in traffic increase and conversion, in the channel that should present the
highest growth over the next years;
• Multibrand: implementation of client segmentation as priority.

INVESTOR RELATIONS TEAM
Fabio Hering – CEOFrederico Oldani – CFO and IROBruno Salem Brasil – IR ManagerCaroline Luccarini – IR Analyst
www.ciahering.com.br/ir+55 (11) 3371 – 4867/[email protected]