banco popular 1q13 eng
TRANSCRIPT
8/12/2019 Banco Popular 1Q13 ENG
http://slidepdf.com/reader/full/banco-popular-1q13-eng 1/16
Quarterly report Mar
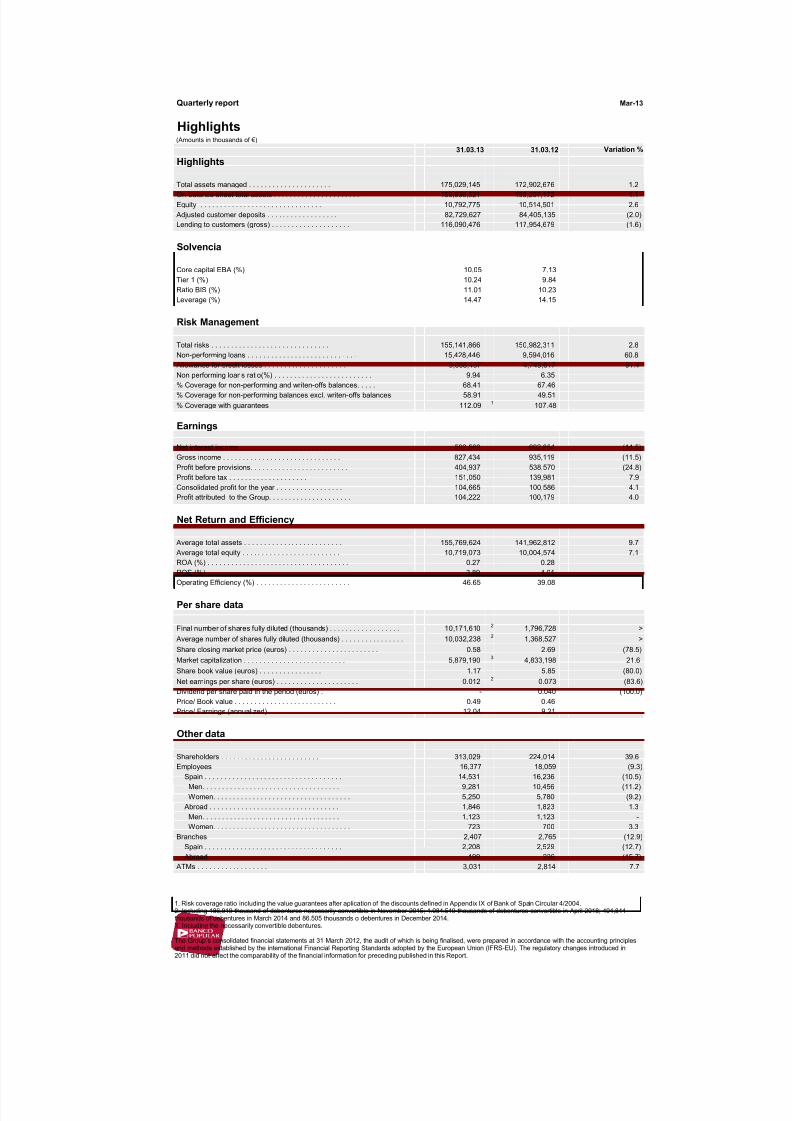
Highlights
(Amounts in thousands of €)
31.03.13 31.03.12 Variation
Highlights
Total assets managed . . . . . . . . . . . . . . . . . . . . . 175,029,145 172,902,676 1
On-balance sheet total assets . . . . . . . . . . . . . . . . . . . . . . 159,936,521 158,207,172 1
Equity . . . . . . . . . . . . . . . . . . . . . . . . . . . . . . . 10,792,775 10,514,501 2
Adjusted customer deposits . . . . . . . . . . . . . . . . . . 82,729,627 84,405,135 (2
Lending to customers (gross) . . . . . . . . . . . . . . . . . . . . 116,090,476 117,954,679 (1
Solvencia
Core capital EBA (%) 10.05 7.13Tier 1 (%) 10.24 9.84
Ratio BIS (%) 11.01 10.23
Leverage (%) 14.47 14.15
Risk Management
Total risks . . . . . . . . . . . . . . . . . . . . . . . . . . . . . . 155,141,866 150,982,311 2
Non-performing loans . . . . . . . . . . . . . . . . . . . . . . . . . . . . 15,428,446 9,594,016 60
Allowance for credit losses . . . . . . . . . . . . . . . . . . . . . 9,088,437 4,749,617 91
Non performing loans ratio(%) . . . . . . . . . . . . . . . . . . . . . . . . . 9.94 6.35
% Coverage for non-performing and writen-offs balances. . . . . 68.41 67.46
% Coverage for non-performing balances excl. writen-offs balances 58.91 49.51
% Coverage with guarantees 112.09 1 107.48
Earnings
Net interest income . . . . . . . . . . . . . . . . . . . . . . . 592,569 692,864 (14
Gross income . . . . . . . . . . . . . . . . . . . . . . . . . . . . . . 827,434 935,119 (11
Profit before provisions. . . . . . . . . . . . . . . . . . . . . . . . . 404,937 538,570 (24
Profit before tax . . . . . . . . . . . . . . . . . . . . 151,050 139,981 7
Consolidated profit for the year . . . . . . . . . . . . . . . . . 104,665 100,586 4
Profit attributed to the Group. . . . . . . . . . . . . . . . . . . . . 104,222 100,179 4
Net Return and Efficiency
Average total assets . . . . . . . . . . . . . . . . . . . . . . . . . 155,769,624 141,962,812 9
Average total equity . . . . . . . . . . . . . . . . . . . . . . . . . 10,719,073 10,004,574 7
ROA (%) . . . . . . . . . . . . . . . . . . . . . . . . . . . . . . . . . . . . 0.27 0.28
ROE (%) . . . . . . . . . . . . . . . . . . . . . . . . . . . . . . . . . . . . . . 3.89 4.01
Operating Efficiency (%) . . . . . . . . . . . . . . . . . . . . . . . . 46.65 39.08
Per share data
Final number of shares fully diluted (thousands) . . . . . . . . . . . . . . . . . . 10,171,6102
1,796,728
Average number of shares fully diluted (thousands) . . . . . . . . . . . . . . . . 10,032,2382
1,368,527
Share closing market price (euros) . . . . . . . . . . . . . . . . . . . . . . . 0.58 2.69 (78
Market capitalization . . . . . . . . . . . . . . . . . . . . . . . . . . 5,879,1903
4,833,198 21
Share book value (euros) . . . . . . . . . . . . . . . . 1.17 5.85 (80Net earnings per share (euros) . . . . . . . . . . . . . . . . . . . . . 0.012
20.073 (83
Dividend per share paid in the period (euros) . - 0.040 (100
8/12/2019 Banco Popular 1Q13 ENG
http://slidepdf.com/reader/full/banco-popular-1q13-eng 2/16
Quarterly report
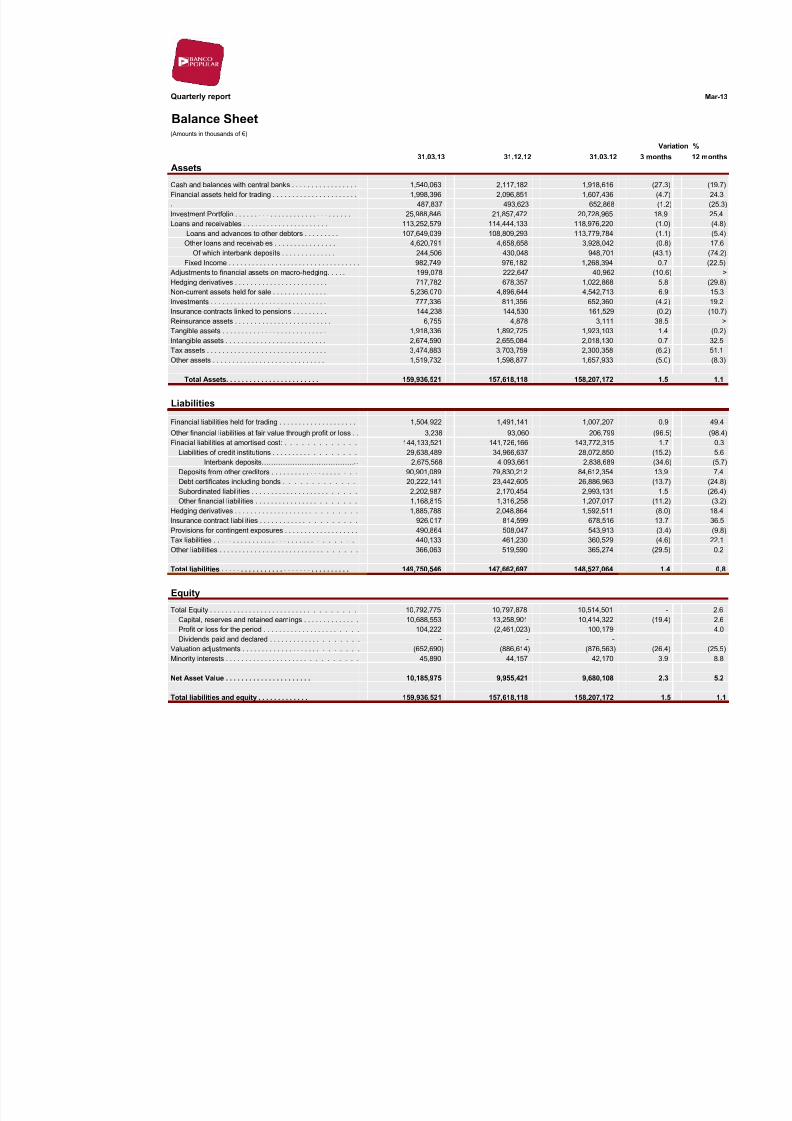
Balance Sheet
(Amounts in thousands of €)
31.03.13 31.12.12 31.03.12
Assets
Cash and balances with central banks . . . . . . . . . . . . . . . . . 1,540,063 2,117,182 1,918,616
Financial assets held for trading . . . . . . . . . . . . . . . . . . . . . . 1,998,396 2,096,851 1,607,436
. 487,837 493,623 652,868
Investment Portfolio . . . . . . . . . . . . . . . . . . . . . . . . . . . . . . 25,988,846 21,857,472 20,728,965
Loans and receivables . . . . . . . . . . . . . . . . . . . . . . 113,252,579 114,444,133 118,976,220
Loans and advances to other debtors . . . . . . . . . 107,649,039 108,809,293 113,779,784
Other loans and receivables . . . . . . . . . . . . . . . . 4,620,791 4,658,658 3,928,042
Of which interbank deposits . . . . . . . . . . . . . . 244,506 430,048 948,701
Fixed Income . . . . . . . . . . . . . . . . . . . . . . . . . . . . . . . . . . 982,749 976,182 1,268,394
Adjustments to financial assets on macro-hedging. . . . . 199,078 222,647 40,962
Hedging derivatives . . . . . . . . . . . . . . . . . . . . . . . . 717,782 678,357 1,022,868
Non-current assets held for sale . . . . . . . . . . . . . . 5,236,070 4,896,644 4,542,713
Investments . . . . . . . . . . . . . . . . . . . . . . . . . . . . . . 777,336 811,356 652,360
Insurance contracts linked to pensions . . . . . . . . . 144,238 144,530 161,529
Reinsurance assets . . . . . . . . . . . . . . . . . . . . . . . . . 6,755 4,878 3,111
Tangible assets . . . . . . . . . . . . . . . . . . . . . . . . . . . 1,918,336 1,892,725 1,923,103
Intangible assets . . . . . . . . . . . . . . . . . . . . . . . . . . 2,674,590 2,655,084 2,018,130
Tax assets . . . . . . . . . . . . . . . . . . . . . . . . . . . . . . . 3,474,883 3,703,759 2,300,358
Other assets . . . . . . . . . . . . . . . . . . . . . . . . . . . . . 1,519,732 1,598,877 1,657,933
Total Assets. . . . . . . . . . . . . . . . . . . . . . . . 159,936,521 157,618,118 158,207,172
Liabilities
Financial liabilities held for trading . . . . . . . . . . . . . . . . . . . . 1,504,922 1,491,141 1,007,207
Other financial liabilities at fair value through profit or loss . . 3,238 93,060 206,799
Finacial liabilities at amortised cost: . . . . . . . . . . . . . 144,133,521 141,726,166 143,772,315
Liabilities of credit institutions . . . . . . . . . . . . . . . . . . 29,638,489 34,966,637 28,072,850
Interbank deposits………………………………… 2,675,568 4,093,661 2,838,689
Deposits from other creditors . . . . . . . . . . . . . . . . . . . . . 90,901,089 79,830,212 84,612,354
Debt certificates including bonds . . . . . . . . . . . . . 20,222,141 23,442,605 26,886,963
Subordinated liabilities . . . . . . . . . . . . . . . . . . . . . . . . . 2,202,987 2,170,454 2,993,131
Other financial liabilities . . . . . . . . . . . . . . . . . . . . . . . 1,168,815 1,316,258 1,207,017
Hedging derivatives . . . . . . . . . . . . . . . . . . . . . . . . . . . . 1,885,788 2,048,864 1,592,511
Insurance contract liabilities . . . . . . . . . . . . . . . . . . . . . 926,017 814,599 678,516
Provisions for contingent exposures . . . . . . . . . . . . . . . . . . . 490,864 508,047 543,913
Tax liabilities . . . . . . . . . . . . . . . . . . . . . . . . . . . . . . . . . 440,133 461,230 360,529
Other liabilities . . . . . . . . . . . . . . . . . . . . . . . . . . . . . . . . . 366,063 519,590 365,274
Total liabilities . . . . . . . . . . . . . . . . . . . . . . . . . . . . . . . . . 149,750,546 147,662,697 148,527,064
Equity
Total Equity . . . . . . . . . . . . . . . . . . . . . . . . . . . . . . . . . . 10,792,775 10,797,878 10,514,501
Capital, reserves and retained earnings . . . . . . . . . . . . . . 10,688,553 13,258,901 10,414,322
Profit or loss for the period . . . . . . . . . . . . . . . . . . . . . . . 104,222 (2,461,023) 100,179
Dividends paid and declared . . . . . . . . . . . . . . . . . . . . - - -
Valuation adjustments . . . . . . . . . . . . . . . . . . . . . . . . . . . (652,690) (886,614) (876,563)
Minority interests . . . . . . . . . . . . . . . . . . . . . . . . . . . . . . 45,890 44,157 42,170
Net Asset Value . . . . . . . . . . . . . . . . . . . . . . 10,185,975 9,955,421 9,680,108
Total liabilities and equity 159 936 521 157 618 118 158 207 172
8/12/2019 Banco Popular 1Q13 ENG
http://slidepdf.com/reader/full/banco-popular-1q13-eng 3/16
Quarterly report Mar-13
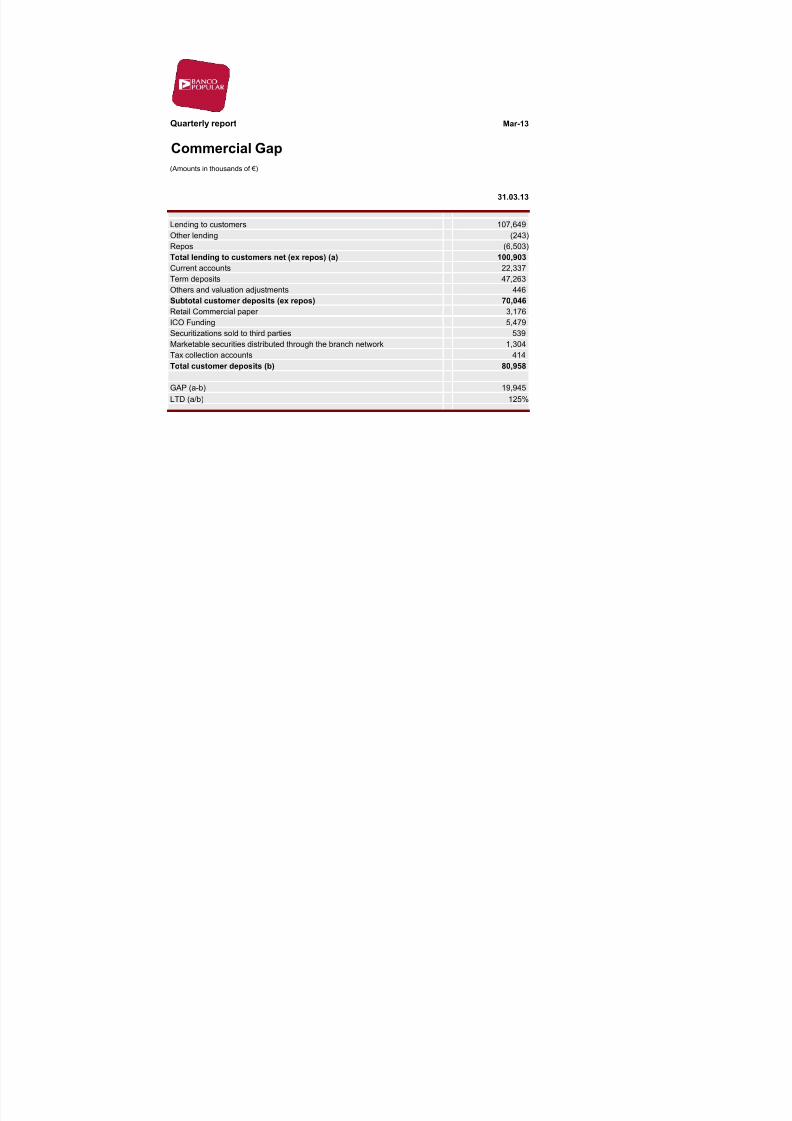
Commercial Gap
(Amounts in thousands of €)
31.03.13
Lending to customers 107,649
Other lending (243)
Repos (6,503)
Total lending to customers net (ex repos) (a) 100,903
Current accounts 22,337Term deposits 47,263
Others and valuation adjustments 446
Subtotal customer deposits (ex repos) 70,046
Retail Commercial paper 3,176
ICO Funding 5,479
Securitizations sold to third parties 539
Marketable securities distributed through the branch network 1,304
Tax collection accounts 414
Total customer deposits (b) 80,958
GAP (a-b) 19,945
LTD (a/b) 125%
8/12/2019 Banco Popular 1Q13 ENG
http://slidepdf.com/reader/full/banco-popular-1q13-eng 4/16
Quarterly report
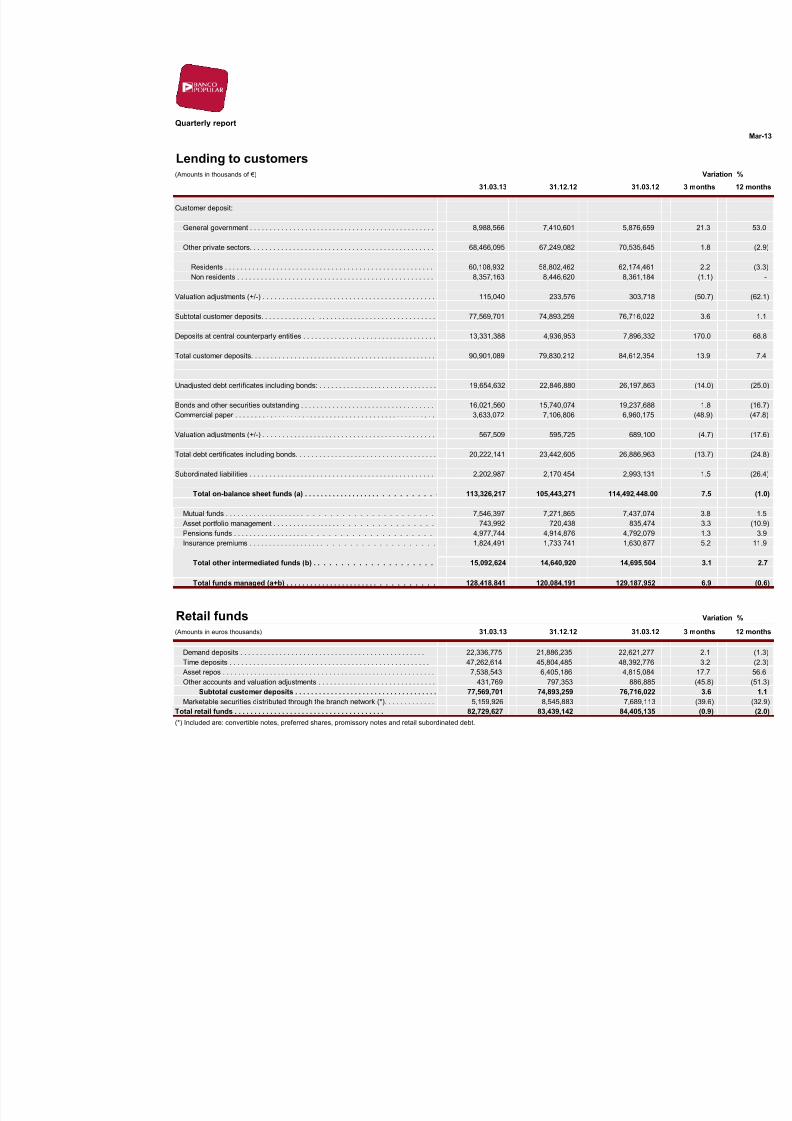
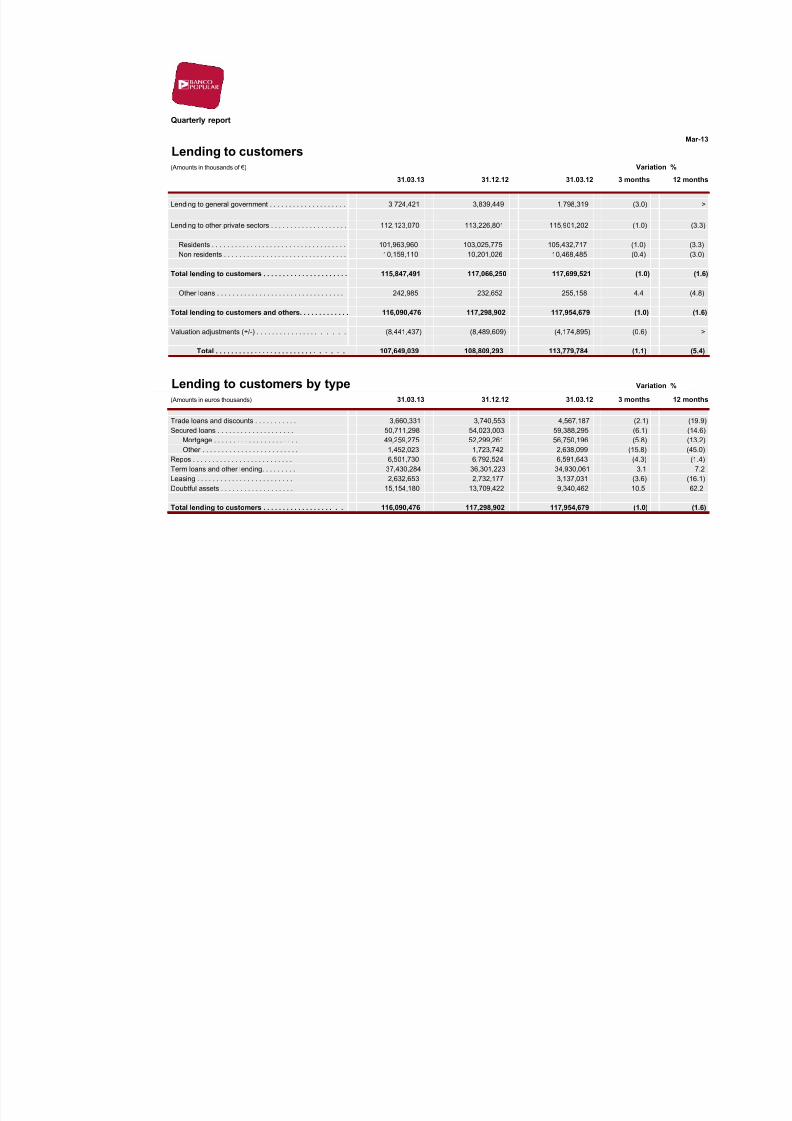
Lending to customers
(Amounts in thousands of €)
31.03.13 31.12.12
Customer deposit:
General government . . . . . . . . . . . . . . . . . . . . . . . . . . . . . . . . . . . . . . . . . . . . . . . 8,988,566 7,410,601 5,
Other private sectors. . . . . . . . . . . . . . . . . . . . . . . . . . . . . . . . . . . . . . . . . . . . . . . 68,466,095 67,249,082 70,
Residents . . . . . . . . . . . . . . . . . . . . . . . . . . . . . . . . . . . . . . . . . . . . . . . . . . . . . 60,108,932 58,802,462 62, Non residents . . . . . . . . . . . . . . . . . . . . . . . . . . . . . . . . . . . . . . . . . . . . . . . . . . 8,357,163 8,446,620 8,
Valuation adjustments (+/-) . . . . . . . . . . . . . . . . . . . . . . . . . . . . . . . . . . . . . . . . . . . . 115,040 233,576
Subtotal customer deposits. . . . . . . . . . . . . . . . . . . . . . . . . . . . . . . . . . . . . . . . . . . . 77,569,701 74,893,259 76,
Deposits at central counterparty entities . . . . . . . . . . . . . . . . . . . . . . . . . . . . . . . . . . 13,331,388 4,936,953 7,
Total customer deposits. . . . . . . . . . . . . . . . . . . . . . . . . . . . . . . . . . . . . . . . . . . . . . . 90,901,089 79,830,212 84,
Unadjusted debt certificates including bonds: . . . . . . . . . . . . . . . . . . . . . . . . . . . . . . 19,654,632 22,846,880 26,
Bonds and other securities outstanding . . . . . . . . . . . . . . . . . . . . . . . . . . . . . . . . . . 16,021,560 15,740,074 19,
Commercial paper . . . . . . . . . . . . . . . . . . . . . . . . . . . . . . . . . . . . . . . . . . . . . . . . . . . 3,633,072 7,106,806 6,
Valuation adjustments (+/-) . . . . . . . . . . . . . . . . . . . . . . . . . . . . . . . . . . . . . . . . . . . . 567,509 595,725
Total debt certificates including bonds. . . . . . . . . . . . . . . . . . . . . . . . . . . . . . . . . . . . 20,222,141 23,442,605 26,
Subordinated liabilities . . . . . . . . . . . . . . . . . . . . . . . . . . . . . . . . . . . . . . . . . . . . . . . 2,202,987 2,170,454 2,
Total on-balance sheet funds (a) . . . . . . . . . . . . . . . . . . . . . . . . . . . . 113,326,217 105,443,271 114,49
Mutual funds . . . . . . . . . . . . . . . . . . . . . . . . . . . . . . . . . . . . . . . . . . 7,546,397 7,271,865 7,4
Asset portfolio management . . . . . . . . . . . . . . . . . . . . . . . . . . . . . . . . . 743,992 720,438
Pensions funds . . . . . . . . . . . . . . . . . . . . . . . . . . . . . . . . . . . . . . . . 4,977,744 4,914,876 4,
Insurance premiums . . . . . . . . . . . . . . . . . . . . . . . . . . . . . . . . . . . . . . 1,824,491 1,733,741 1,
Total other intermediated funds (b) . . . . . . . . . . . . . . . . . . . . . 15,092,624 14,640,920 14,
Total funds managed (a+b) . . . . . . . . . . . . . . . . . . . . . . . . . . . . . . . . . 128,418,841 120,084,191 129,
Retail funds
(Amounts in euros thousands) 31.03.13 31.12.12
Demand deposits . . . . . . . . . . . . . . . . . . . . . . . . . . . . . . . . . . . . . . . . . . . . . . . 22,336,775 21,886,235 22,
Time deposits . . . . . . . . . . . . . . . . . . . . . . . . . . . . . . . . . . . . . . . . . . . . . . . . . . . 47,262,614 45,804,485 48,
Asset repos . . . . . . . . . . . . . . . . . . . . . . . . . . . . . . . . . . . . . . . . . . . . . . . . . . . . . . 7,538,543 6,405,186 4, Other accounts and valuation adjustments . . . . . . . . . . . . . . . . . . . . . . . . . . . . . . 431,769 797,353
Subtotal customer deposits . . . . . . . . . . . . . . . . . . . . . . . . . . . . . . . . . . . . 77,569,701 74,893,259 76,
8/12/2019 Banco Popular 1Q13 ENG
http://slidepdf.com/reader/full/banco-popular-1q13-eng 5/16
Quarterly report
Lending to customers
(Amounts in thousands of €)
31.03.13 31.12.12 31.03.12 3 mo
Lending to general government . . . . . . . . . . . . . . . . . . . . 3,724,421 3,839,449 1,798,319
Lending to other private sectors . . . . . . . . . . . . . . . . . . . . 112,123,070 113,226,801 115,901,202
Residents . . . . . . . . . . . . . . . . . . . . . . . . . . . . . . . . . . . 101,963,960 103,025,775 105,432,717
Non residents . . . . . . . . . . . . . . . . . . . . . . . . . . . . . . . . 10,159,110 10,201,026 10,468,485
Total lending to customers . . . . . . . . . . . . . . . . . . . . . . 115,847,491 117,066,250 117,699,521
Other loans . . . . . . . . . . . . . . . . . . . . . . . . . . . . . . . . . 242,985 232,652 255,158
Total lending to customers and others. . . . . . . . . . . . . 116,090,476 117,298,902 117,954,679
Valuation adjustments (+/-) . . . . . . . . . . . . . . . . . . . . . (8,441,437) (8,489,609) (4,174,895)
Total . . . . . . . . . . . . . . . . . . . . . . . . . . . . . . . 107,649,039 108,809,293 113,779,784
Lending to customers by type
(Amounts in euros thousands)31.03.13 31.12.12 31.03.12 3 mo
Trade loans and discounts . . . . . . . . . . . 3,660,331 3,740,553 4,567,187
Secured loans . . . . . . . . . . . . . . . . . . . . 50,711,298 54,023,003 59,388,295
Mortgage . . . . . . . . . . . . . . . . . . . . . . 49,259,275 52,299,261 56,750,196
Other . . . . . . . . . . . . . . . . . . . . . . . . . 1,452,023 1,723,742 2,638,099
Repos . . . . . . . . . . . . . . . . . . . . . . . . . . 6,501,730 6,792,524 6,591,643
Term loans and other lending. . . . . . . . . 37,430,284 36,301,223 34,930,061
Leasing . . . . . . . . . . . . . . . . . . . . . . . . . 2,632,653 2,732,177 3,137,031
Doubtful assets . . . . . . . . . . . . . . . . . . . 15,154,180 13,709,422 9,340,462
Total lending to customers . . . . . . . . . . . . . . . . . . . . 116,090,476 117,298,902 117,954,679
8/12/2019 Banco Popular 1Q13 ENG
http://slidepdf.com/reader/full/banco-popular-1q13-eng 6/16
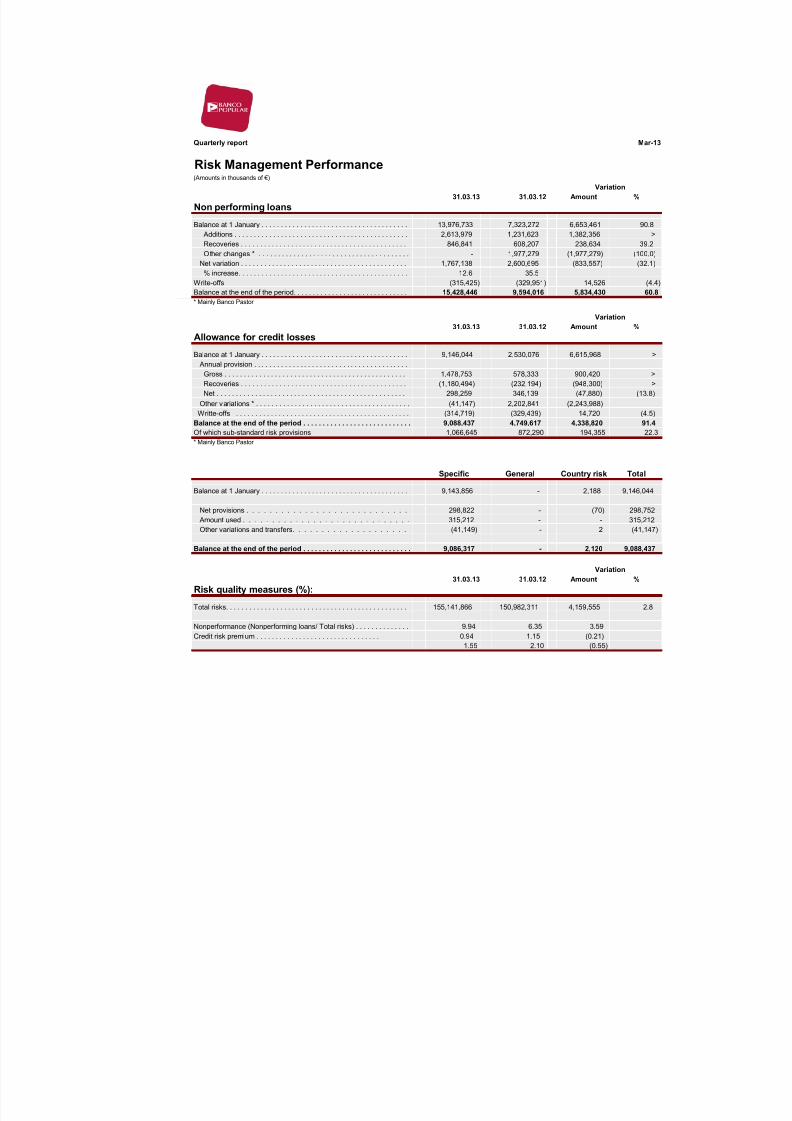
Quarterly report
Risk Management Performance(Amounts in thousands of €)
31.03.13 31.03.12 Amount
Non performing loans
Balance at 1 January . . . . . . . . . . . . . . . . . . . . . . . . . . . . . . . . . . . . . . 13,976,733 7,323,272 6,653,461
Additions . . . . . . . . . . . . . . . . . . . . . . . . . . . . . . . . . . . . . . . . . . . . . 2,613,979 1,231,623 1,382,356
Recoveries . . . . . . . . . . . . . . . . . . . . . . . . . . . . . . . . . . . . . . . . . . . 846,841 608,207 238,634
Other changes * . . . . . . . . . . . . . . . . . . . . . . . . . . . . . . . . . . . . . . . - 1,977,279 (1,977,279)
Net variation . . . . . . . . . . . . . . . . . . . . . . . . . . . . . . . . . . . . . . . . . . . 1,767,138 2,600,695 (833,557)
% increase. . . . . . . . . . . . . . . . . . . . . . . . . . . . . . . . . . . . . . . . . . . . 12.6 35.5
Write-offs (315,425) (329,951) 14,526
Balance at the end of the period. . . . . . . . . . . . . . . . . . . . . . . . . . . . . . 15,428,446 9,594,016 5,834,430
* Mainly Banco Pastor
31.03.13 31.03.12 Amount
Allowance for credit losses
Balance at 1 January . . . . . . . . . . . . . . . . . . . . . . . . . . . . . . . . . . . . . . 9,146,044 2,530,076 6,615,968
Annual provision . . . . . . . . . . . . . . . . . . . . . . . . . . . . . . . . . . . . . . . .
Gross . . . . . . . . . . . . . . . . . . . . . . . . . . . . . . . . . . . . . . . . . . . . . . . 1,478,753 578,333 900,420
Recoveries . . . . . . . . . . . . . . . . . . . . . . . . . . . . . . . . . . . . . . . . . . . (1,180,494) (232,194) (948,300)
Net . . . . . . . . . . . . . . . . . . . . . . . . . . . . . . . . . . . . . . . . . . . . . . . . . 298,259 346,139 (47,880)
Other variations * . . . . . . . . . . . . . . . . . . . . . . . . . . . . . . . . . . . . . . . . (41,147) 2,202,841 (2,243,988) Writte-offs . . . . . . . . . . . . . . . . . . . . . . . . . . . . . . . . . . . . . . . . . . . . . (314,719) (329,439) 14,720
Balance at the end of the period . . . . . . . . . . . . . . . . . . . . . . . . . . . . 9,088,437 4,749,617 4,338,820
Of which sub-standard risk provisions 1,066,645 872,290 194,355
* Mainly Banco Pastor
Specific General Country risk T
Balance at 1 January . . . . . . . . . . . . . . . . . . . . . . . . . . . . . . . . . . . . . . 9,143,856 - 2,188 9,
Net provisions . . . . . . . . . . . . . . . . . . . . . . . . . . . . 298,822 - (70)
Amount used . . . . . . . . . . . . . . . . . . . . . . . . . . . . . 315,212 - -
Other variations and transfers. . . . . . . . . . . . . . . . . . . . (41,149) - 2
Balance at the end of the period . . . . . . . . . . . . . . . . . . . . . . . . . . . . 9,086,317 - 2,120 9,
31.03.13 31.03.12 Amount
Risk quality measures (%):
Total risks. . . . . . . . . . . . . . . . . . . . . . . . . . . . . . . . . . . . . . . . . . . . . . . 155,141,866 150,982,311 4,159,555
Nonperformance (Nonperforming loans/ Total risks) . . . . . . . . . . . . . . 9.94 6.35 3.59
Credit risk premium . . . . . . . . . . . . . . . . . . . . . . . . . . . . . . . . 0.94 1.15 (0.21)
1.55 2.10 (0.55)
Variation
Variation
Variation
8/12/2019 Banco Popular 1Q13 ENG
http://slidepdf.com/reader/full/banco-popular-1q13-eng 7/16
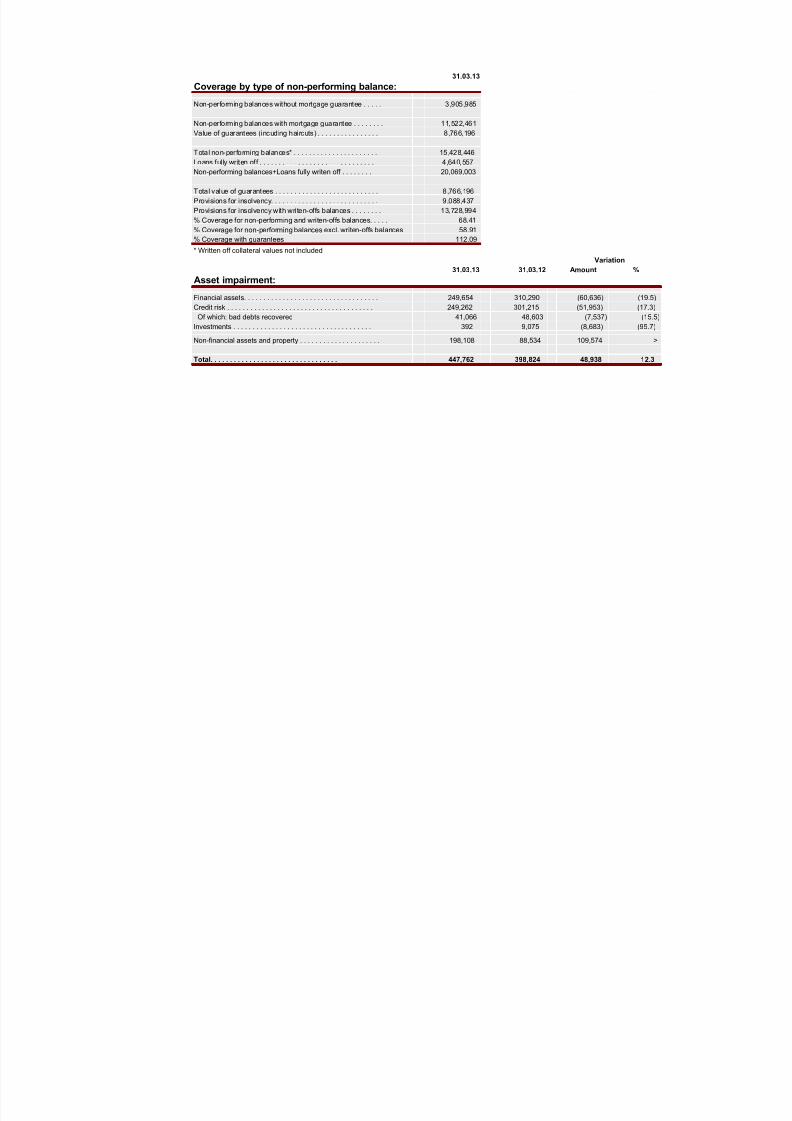
31.03.13
Coverage by type of non-performing balance:
Non-performing balances without mortgage guarantee . . . . . 3,905,985
Non-performing balances with mortgage guarantee . . . . . . . . 11,522,461
Value of guarantees (incuding haircuts) . . . . . . . . . . . . . . . . 8,766,196
Total non-performing balances* . . . . . . . . . . . . . . . . . . . . . . 15,428,446
Loans fully writen off . . . . . . . . . . . . . . . . . . . . . . . . . . . . . . 4,640,557
Non-performing balances+Loans fully writen off . . . . . . . . 20,069,003
Total value of guarantees . . . . . . . . . . . . . . . . . . . . . . . . . . . 8,766,196
Provisions for insolvency. . . . . . . . . . . . . . . . . . . . . . . . . . . . 9,088,437
Provisions for insolvency with writen-offs balances . . . . . . . . 13,728,994
% Coverage for non-performing and writen-offs balances. . . . . 68.41
% Coverage for non-performing balances excl. writen-offs balances 58.91
% Coverage with guarantees 112.09
* Written off collateral values not included
31.03.13 31.03.12 Amount
Asset impairment:
Financial assets. . . . . . . . . . . . . . . . . . . . . . . . . . . . . . . . . . . 249,654 310,290 (60,636)
Credit risk . . . . . . . . . . . . . . . . . . . . . . . . . . . . . . . . . . . . . . 249,262 301,215 (51,953)
Of which: bad debts recovered 41,066 48,603 (7,537)
Investments . . . . . . . . . . . . . . . . . . . . . . . . . . . . . . . . . . . . 392 9,075 (8,683)
Non-financial assets and property . . . . . . . . . . . . . . . . . . . . . 198,108 88,534 109,574
Total. . . . . . . . . . . . . . . . . . . . . . . . . . . . . . . . . 447,762 398,824 48,938
Variation
8/12/2019 Banco Popular 1Q13 ENG
http://slidepdf.com/reader/full/banco-popular-1q13-eng 8/16
Quarterly report Mar-13
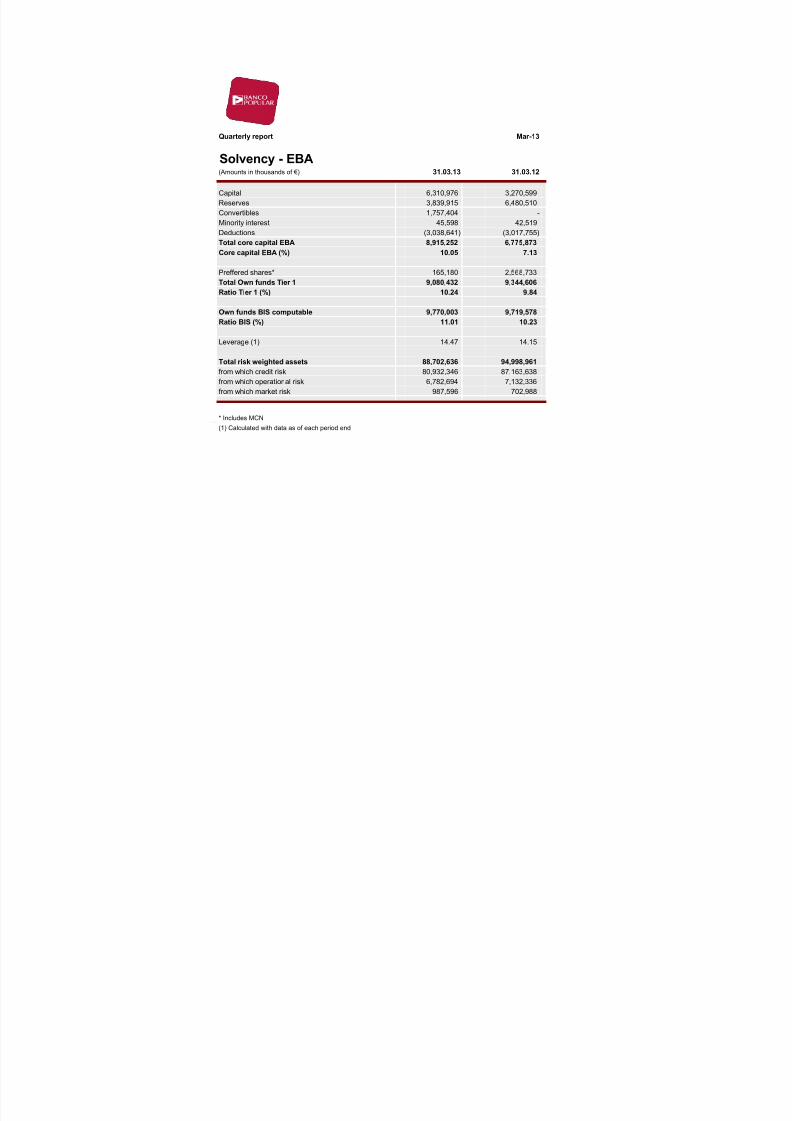
Solvency - EBA
(Amounts in thousands of €) 31.03.13 31.03.12
Capital 6,310,976 3,270,599
Reserves 3,839,915 6,480,510
Convertibles 1,757,404 -
Minority interest 45,598 42,519
Deductions (3,038,641) (3,017,755)
Total core capital EBA 8,915,252 6,775,873
Core capital EBA (%) 10.05 7.13
Preffered shares* 165,180 2,568,733
Total Own funds Tier 1 9,080,432 9,344,606
Ratio Tier 1 (%) 10.24 9.84
Own funds BIS computable 9,770,003 9,719,578
Ratio BIS (%) 11.01 10.23
Leverage (1) 14.47 14.15
Total risk weighted assets 88,702,636 94,998,961
from which credit risk 80,932,346 87,163,638
from which operational risk 6,782,694 7,132,336
from which market risk 987,596 702,988
* Includes MCN
(1) Calculated with data as of each period end
8/12/2019 Banco Popular 1Q13 ENG
http://slidepdf.com/reader/full/banco-popular-1q13-eng 9/16
Quarterly report Mar-13
Equity
(Amounts in thousands of €)
Capital &
reserves
Valuation
adjustments
Minority
interests
Net Asset
Value
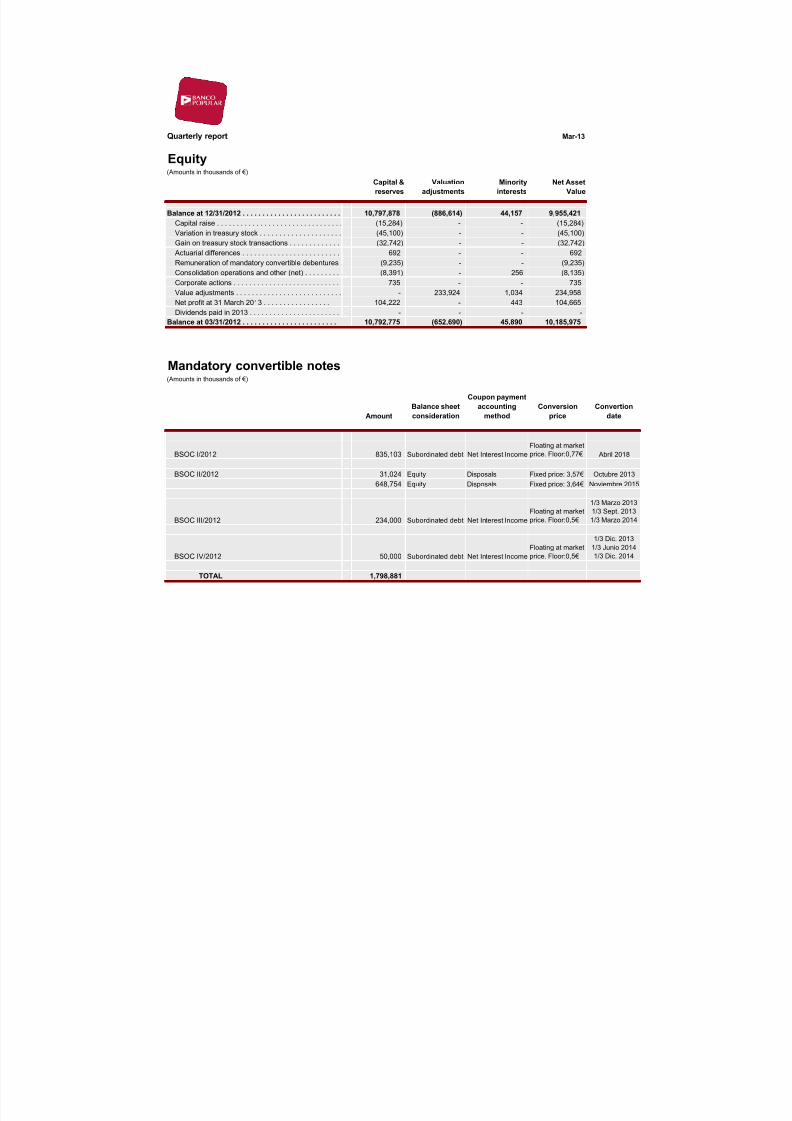
Balance at 12/31/2012 . . . . . . . . . . . . . . . . . . . . . . . . . 10,797,878 (886,614) 44,157 9,955,421
Capital raise . . . . . . . . . . . . . . . . . . . . . . . . . . . . . . . . (15,284) - - (15,284)
Variation in treasury stock . . . . . . . . . . . . . . . . . . . . . (45,100) - - (45,100)
Gain on treasury stock transactions . . . . . . . . . . . . . (32,742) - - (32,742)
Actuarial differences . . . . . . . . . . . . . . . . . . . . . . . . . 692 - - 692
Remuneration of mandatory convertible debentures . (9,235) - - (9,235)
Consolidation operations and other (net) . . . . . . . . . . (8,391) - 256 (8,135)
Corporate actions . . . . . . . . . . . . . . . . . . . . . . . . . . . 735 - - 735
Value adjustments . . . . . . . . . . . . . . . . . . . . . . . . . . . - 233,924 1,034 234,958
Net profit at 31 March 2013 . . . . . . . . . . . . . . . . . 104,222 - 443 104,665
Dividends paid in 2013 . . . . . . . . . . . . . . . . . . . . . . . - - - -
Balance at 03/31/2012 . . . . . . . . . . . . . . . . . . . . . . . . 10,792,775 (652,690) 45,890 10,185,975
Mandatory convertible notes(Amounts in thousands of €)
Amount
Balance sheet
consideration
Coupon payment
accounting
method
Conversion
price
Convertion
date
BSOC I/2012 835,103 Subordinated debt Net Interest Income
Floating at market
price. Floor:0,77€ Abril 2018
BSOC II/2012 31,024 Equity Disposals Fixed price: 3,57€ Octubre 2013
648,754 Equity Disposals Fixed price: 3,64€ Noviembre 20
BSOC III/2012 234,000 Subordinated debt Net Interest Income
Floating at market
price. Floor:0,5€
1/3 Marzo 201
1/3 Sept. 201
1/3 Marzo 201
BSOC IV/2012 50,000 Subordinated debt Net Interest Income
Floating at market
price. Floor:0,5€
1/3 Dic. 20131/3 Junio 201
1/3 Dic. 2014
TOTAL 1,798,881
8/12/2019 Banco Popular 1Q13 ENG
http://slidepdf.com/reader/full/banco-popular-1q13-eng 10/16
Quarterly report
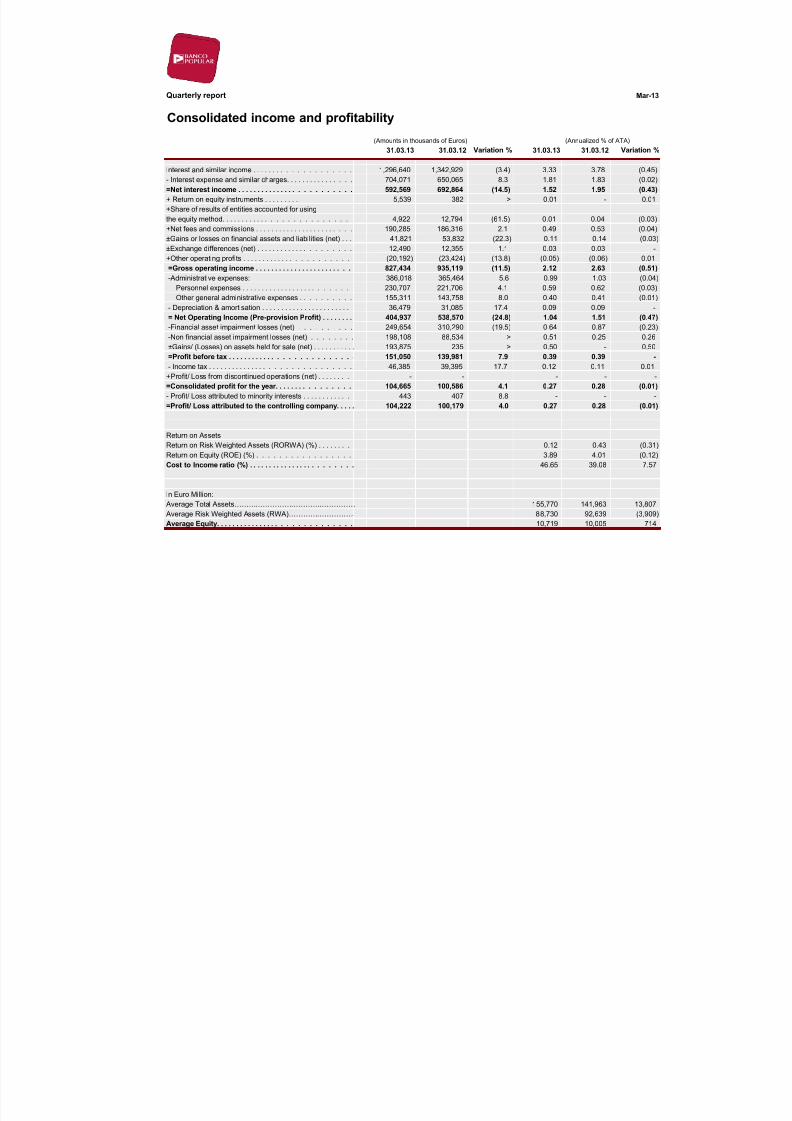
Consolidated income and profitability
31.03.13 31.03.12 Variation % 31.03.13 31.03.12 Var
Interest and similar income . . . . . . . . . . . . . . . . . . . . 1,296,640 1,342,929 (3.4) 3.33 3.78
- Interest expense and similar charges. . . . . . . . . . . . . . . . 704,071 650,065 8.3 1.81 1.83
=Net interest income . . . . . . . . . . . . . . . . . . . . . . . . . 592,569 692,864 (14.5) 1.52 1.95
+ Return on equity instruments . . . . . . . . . 5,539 382 > 0.01 -
+Share of results of entities accounted for using
the equity method. . . . . . . . . . . . . . . . . . . . . . . . . . 4,922 12,794 (61.5) 0.01 0.04
+Net fees and commissions . . . . . . . . . . . . . . . . . . . . . . . . 190,285 186,316 2.1 0.49 0.53
±Gains or losses on financial assets and liabilities (net) . . . 41,821 53,832 (22.3) 0.11 0.14
±Exchange differences (net) . . . . . . . . . . . . . . . . . . . . . 12,490 12,355 1.1 0.03 0.03
+Other operating profits . . . . . . . . . . . . . . . . . . . . . . . (20,192) (23,424) (13.8) (0.05) (0.06)
=Gross operating income . . . . . . . . . . . . . . . . . . . . . . . . 827,434 935,119 (11.5) 2.12 2.63 -Administrative expenses: 386,018 365,464 5.6 0.99 1.03
Personnel expenses . . . . . . . . . . . . . . . . . . . . . . . . . 230,707 221,706 4.1 0.59 0.62
Other general administrative expenses . . . . . . . . . . 155,311 143,758 8.0 0.40 0.41
- Depreciation & amortisation . . . . . . . . . . . . . . . . . . . . . . . 36,479 31,085 17.4 0.09 0.09
= Net Operating Income (Pre-provision Profit) . . . . . . . . 404,937 538,570 (24.8) 1.04 1.51
-Financial asset impairment losses (net) . . . . . . . . . . 249,654 310,290 (19.5) 0.64 0.87
-Non financial asset impairment losses (net) . . . . . . . . 198,108 88,534 > 0.51 0.25
±Gains/ (Losses) on assets held for sale (net) . . . . . . . . . . . 193,875 235 > 0.50 -
=Profit before tax . . . . . . . . . . . . . . . . . . . . . . . . . 151,050 139,981 7.9 0.39 0.39
- Income tax . . . . . . . . . . . . . . . . . . . . . . . . . . . . . . 46,385 39,395 17.7 0.12 0.11
+Profit/ Loss from discontinued operations (net) . . . . . . . . - - - -
=Consolidated profit for the year. . . . . . . . . . . . . . . . 104,665 100,586 4.1 0.27 0.28
- Profit/ Loss attributed to minority interests . . . . . . . . . . . . 443 407 8.8 - -
=Profit/ Loss attributed to the controlling company. . . . . 104,222 100,179 4.0 0.27 0.28
Return on Assets
Return on Risk Weighted Assets (RORWA) (%) . . . . . . . . 0.12 0.43
Return on Equity (ROE) (%) . . . . . . . . . . . . . . . . . 3.89 4.01
Cost to Income ratio (%) . . . . . . . . . . . . . . . . . . . . . . . . 46.65 39.08
In Euro Million:
Average Total Assets…………………………………………… 155,770 141,963
Average Risk Weighted Assets (RWA)……………………… 88,730 92,639
Average Equity. . . . . . . . . . . . . . . . . . . . . . . . . . . . . 10,719 10,005
(Amounts in thousands of Euros) (Annualized % of ATA)
8/12/2019 Banco Popular 1Q13 ENG
http://slidepdf.com/reader/full/banco-popular-1q13-eng 11/16
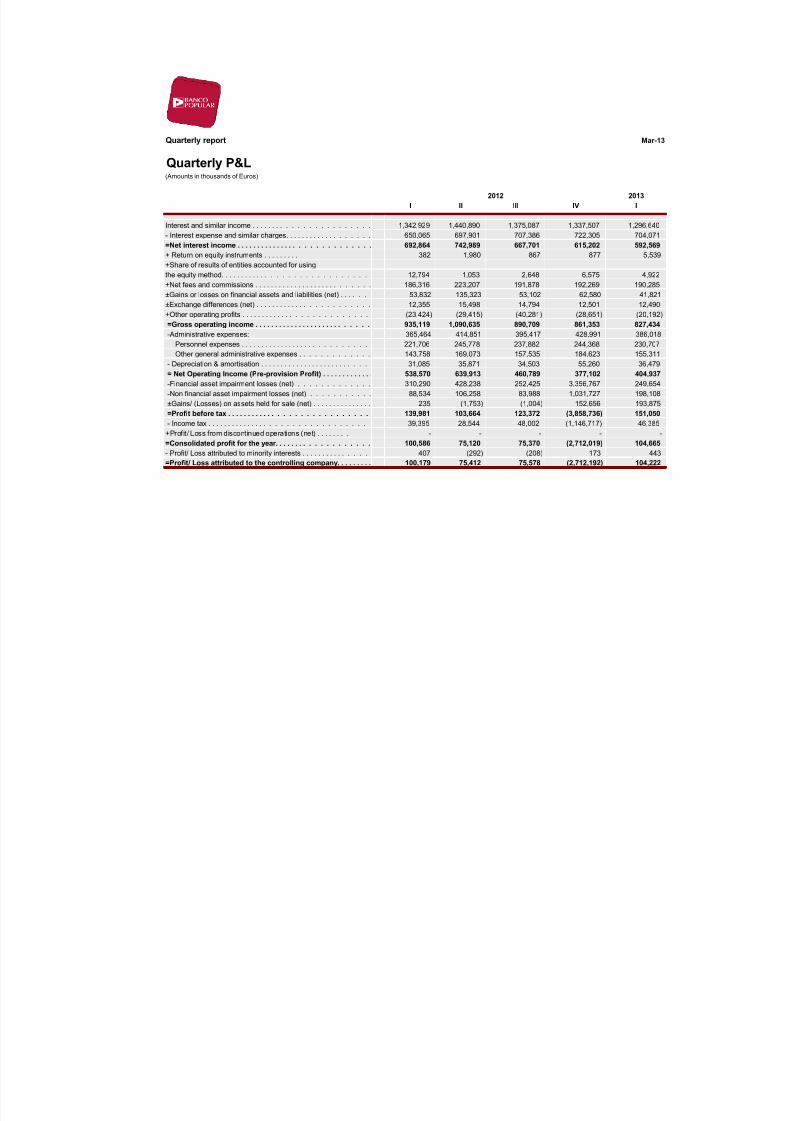
Quarterly report
Quarterly P&L(Amounts in thousands of Euros)
2
I II III IV
Interest and similar income . . . . . . . . . . . . . . . . . . . . . . . 1,342,929 1,440,890 1,375,087 1,337,507 1
- Interest expense and similar charges. . . . . . . . . . . . . . . . . . . 650,065 697,901 707,386 722,305
=Net interest income . . . . . . . . . . . . . . . . . . . . . . . . . . . . 692,864 742,989 667,701 615,202
+ Return on equity instruments . . . . . . . . . 382 1,980 867 877
+Share of results of entities accounted for usingthe equity method. . . . . . . . . . . . . . . . . . . . . . . . . . . . . 12,794 1,053 2,648 6,575
+Net fees and commissions . . . . . . . . . . . . . . . . . . . . . . . . . . . 186,316 223,207 191,878 192,269
±Gains or losses on financial assets and liabilities (net) . . . . . . . 53,832 135,323 53,102 62,580
±Exchange differences (net) . . . . . . . . . . . . . . . . . . . . . . . . 12,355 15,498 14,794 12,501
+Other operating profits . . . . . . . . . . . . . . . . . . . . . . . . . . (23,424) (29,415) (40,281) (28,651)
=Gross operating income . . . . . . . . . . . . . . . . . . . . . . . . . . . 935,119 1,090,635 890,709 861,353
-Administrative expenses: 365,464 414,851 395,417 428,991
Personnel expenses . . . . . . . . . . . . . . . . . . . . . . . . . . . . 221,706 245,778 237,882 244,368
Other general administrative expenses . . . . . . . . . . . . . 143,758 169,073 157,535 184,623
- Depreciation & amortisation . . . . . . . . . . . . . . . . . . . . . . . . . . 31,085 35,871 34,503 55,260
= Net Operating Income (Pre-provision Profit) . . . . . . . . . . . . . 538,570 639,913 460,789 377,102
-Financial asset impairment losses (net) . . . . . . . . . . . . . 310,290 428,238 252,425 3,356,767
-Non financial asset impairment losses (net) . . . . . . . . . . . 88,534 106,258 83,988 1,031,727
±Gains/ (Losses) on assets held for sale (net) . . . . . . . . . . . . . . . 235 (1,753) (1,004) 152,656 =Profit before tax . . . . . . . . . . . . . . . . . . . . . . . . . . . . 139,981 103,664 123,372 (3,858,736)
- Income tax . . . . . . . . . . . . . . . . . . . . . . . . . . . . . . . . 39,395 28,544 48,002 (1,146,717)
+Profit/ Loss from discontinued operations (net) . . . . . . . . - - - -
=Consolidated profit for the year. . . . . . . . . . . . . . . . . . . 100,586 75,120 75,370 (2,712,019)
- Profit/ Loss attributed to minority interests . . . . . . . . . . . . . . . 407 (292) (208) 173
=Profit/ Loss attributed to the controlling company. . . . . . . . . 100,179 75,412 75,578 (2,712,192)
2012
8/12/2019 Banco Popular 1Q13 ENG
http://slidepdf.com/reader/full/banco-popular-1q13-eng 12/16
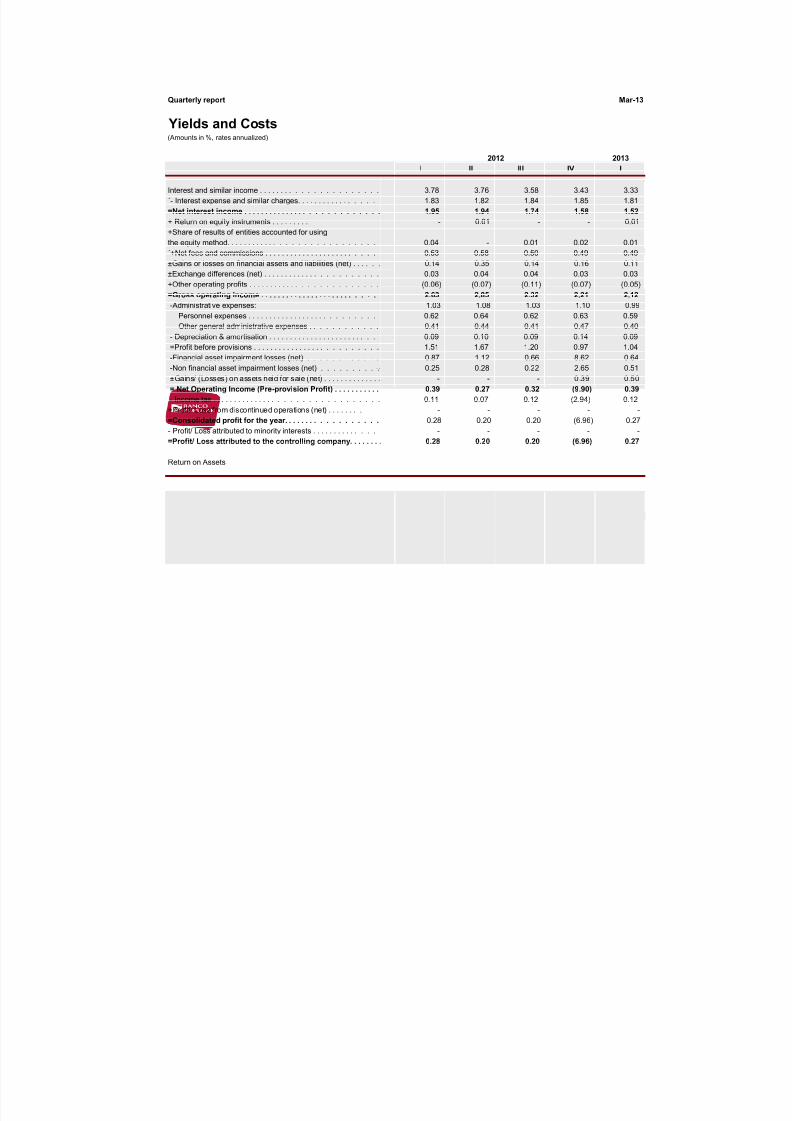
Quarterly report Mar
Yields and Costs(Amounts in %, rates annualized)
2013
I II III IV I
Interest and similar income . . . . . . . . . . . . . . . . . . . . . . 3.78 3.76 3.58 3.43 3.
´- Interest expense and similar charges. . . . . . . . . . . . . . . . . 1.83 1.82 1.84 1.85 1.
=Net interest income . . . . . . . . . . . . . . . . . . . . . . . . . . . 1.95 1.94 1.74 1.58 1.
+ Return on equity instruments . . . . . . . . . - 0.01 - - 0.
+Share of results of entities accounted for using
the equity method. . . . . . . . . . . . . . . . . . . . . . . . . . . . 0.04 - 0.01 0.02 0.
´+Net fees and commissions . . . . . . . . . . . . . . . . . . . . . . . . . 0.53 0.58 0.50 0.49 0.
±Gains or losses on financial assets and liabilities (net) . . . . . . 0.14 0.35 0.14 0.16 0.
±Exchange differences (net) . . . . . . . . . . . . . . . . . . . . . . . 0.03 0.04 0.04 0.03 0.
+Other operating profits . . . . . . . . . . . . . . . . . . . . . . . . . (0.06) (0.07) (0.11) (0.07) (0.
=Gross operating income . . . . . . . . . . . . . . . . . . . . . . . . . . 2.63 2.85 2.32 2.21 2.
-Administrative expenses: 1.03 1.08 1.03 1.10 0.
Personnel expenses . . . . . . . . . . . . . . . . . . . . . . . . . . . 0.62 0.64 0.62 0.63 0.
Other general administrative expenses . . . . . . . . . . . . 0.41 0.44 0.41 0.47 0.
- Depreciation & amortisation . . . . . . . . . . . . . . . . . . . . . . . . . 0.09 0.10 0.09 0.14 0.
=Profit before provisions . . . . . . . . . . . . . . . . . . . . . . . . . . 1.51 1.67 1.20 0.97 1.
-Financial asset impairment losses (net) . . . . . . . . . . . . 0.87 1.12 0.66 8.62 0.
-Non financial asset impairment losses (net) . . . . . . . . . . 0.25 0.28 0.22 2.65 0.
±Gains/ (Losses) on assets held for sale (net) . . . . . . . . . . . . . . - - - 0.39 0
= Net Operating Income (Pre-provision Profit) . . . . . . . . . . . 0.39 0.27 0.32 (9.90) 0.
- Income tax . . . . . . . . . . . . . . . . . . . . . . . . . . . . . . . . 0.11 0.07 0.12 (2.94) 0.+Profit/ Loss from discontinued operations (net) . . . . . . . . - - - -
=Consolidated profit for the year. . . . . . . . . . . . . . . . . . 0.28 0.20 0.20 (6.96) 0.
- Profit/ Loss attributed to minority interests . . . . . . . . . . . . . . - - - -
=Profit/ Loss attributed to the controlling company. . . . . . . . 0.28 0.20 0.20 (6.96) 0.
Return on Assets
Return on Risk Weighted Assets (RORWA) (%) . . . . . . . . . . 0.43 0.73 0.31 (11.38) 0.
Return on Equity (ROE) (%) . . . . . . . . . . . . . . . . . . . 4.01 2.89 2.83 (96.89) 3.
Cost to Income ratio (%) . . . . . . . . . . . . . . . . . . . . . . . . . . 39.08 38.04 44.39 49.80 46.
In Euro Million:
Average Total Assets……………………………………………… 141,963 153,281 153,487 155,875 155,7 Average Risk Weighted Assets (RWA). . . . . . . . . . . . . . 92,639 96,088 96,007 95,296 88,7
Average Equity. . . . . . . . . . . . . . . . . . . . . . . . . . . . . . . 10,005 10,420 10,685 11,197 10,7
2012
8/12/2019 Banco Popular 1Q13 ENG
http://slidepdf.com/reader/full/banco-popular-1q13-eng 13/16
Quarterly report
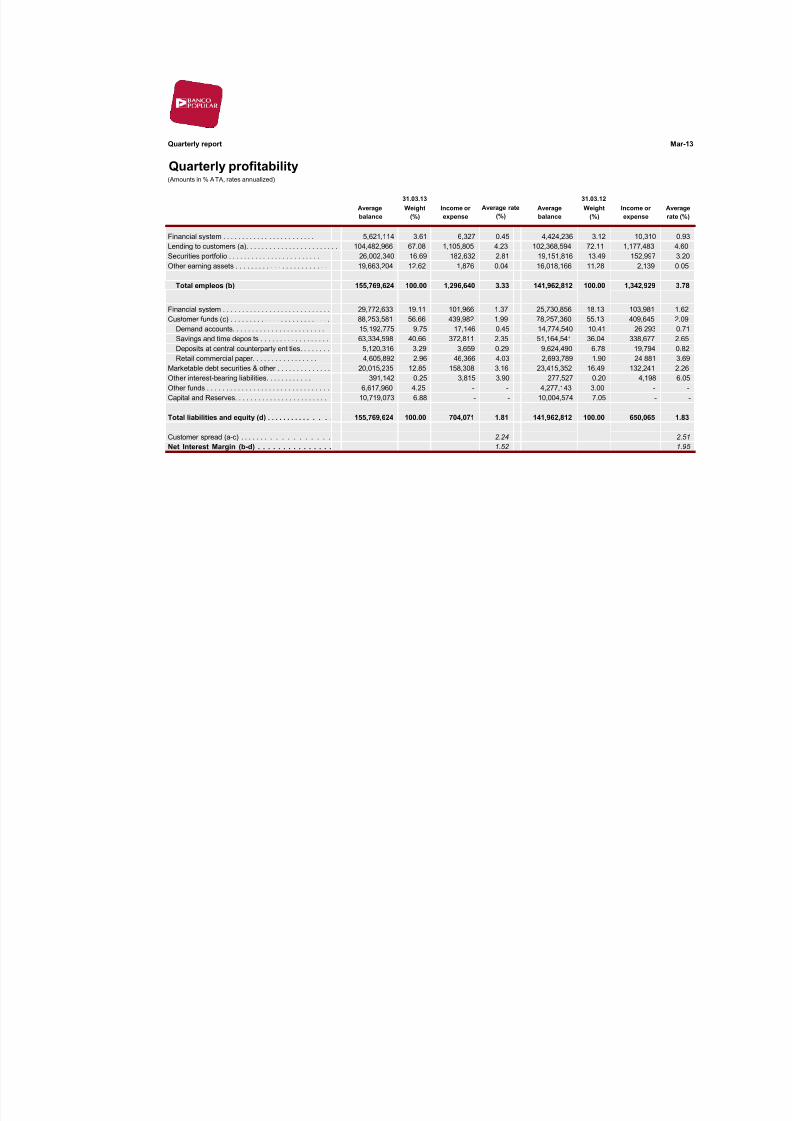
Quarterly profitability(Amounts in % ATA, rates annualized)
31.03.13 31.03.12
Average
balance
Weight
(%)
Income or
expense
Average
balance
Weight
(%)
Inco
exp
Financial system . . . . . . . . . . . . . . . . . . . . . . . . 5,621,114 3.61 6,327 0.45 4,424,236 3.12
Lending to customers (a). . . . . . . . . . . . . . . . . . . . . . . . 104,482,966 67.08 1,105,805 4.23 102,368,594 72.11 1,
Securities portfolio . . . . . . . . . . . . . . . . . . . . . . . . 26,002,340 16.69 182,632 2.81 19,151,816 13.49
Other earning assets . . . . . . . . . . . . . . . . . . . . . . . . 19,663,204 12.62 1,876 0.04 16,018,166 11.28
Total empleos (b) 155,769,624 100.00 1,296,640 3.33 141,962,812 100.00 1,
Financial system . . . . . . . . . . . . . . . . . . . . . . . . . . . . 29,772,633 19.11 101,966 1.37 25,730,856 18.13
Customer funds (c) . . . . . . . . . . . . . . . . . . . . . . . . . . 88,253,581 56.66 439,982 1.99 78,257,360 55.13
Demand accounts. . . . . . . . . . . . . . . . . . . . . . . . 15,192,775 9.75 17,146 0.45 14,774,540 10.41
Savings and time deposits . . . . . . . . . . . . . . . . . . . 63,334,598 40.66 372,811 2.35 51,164,541 36.04
Deposits at central counterparty entities. . . . . . . . 5,120,316 3.29 3,659 0.29 9,624,490 6.78
Retail commercial paper. . . . . . . . . . . . . . . . . 4,605,892 2.96 46,366 4.03 2,693,789 1.90
Marketable debt securities & other . . . . . . . . . . . . . . 20,015,235 12.85 158,308 3.16 23,415,352 16.49
Other interest-bearing liabilities. . . . . . . . . . . . 391,142 0.25 3,815 3.90 277,527 0.20
Other funds . . . . . . . . . . . . . . . . . . . . . . . . . . . . . . . . 6,617,960 4.25 - - 4,277,143 3.00
Capital and Reserves. . . . . . . . . . . . . . . . . . . . . . . . 10,719,073 6.88 - - 10,004,574 7.05
Total liabilities and equity (d) . . . . . . . . . . . . . . . 155,769,624 100.00 704,071 1.81 141,962,812 100.00
Customer spread (a-c) . . . . . . . . . . . . . . . . . . 2.24
Net Interest Margin (b-d) . . . . . . . . . . . . . . . 1.52
Average rate
(%)
8/12/2019 Banco Popular 1Q13 ENG
http://slidepdf.com/reader/full/banco-popular-1q13-eng 14/16
Quarterly report Mar
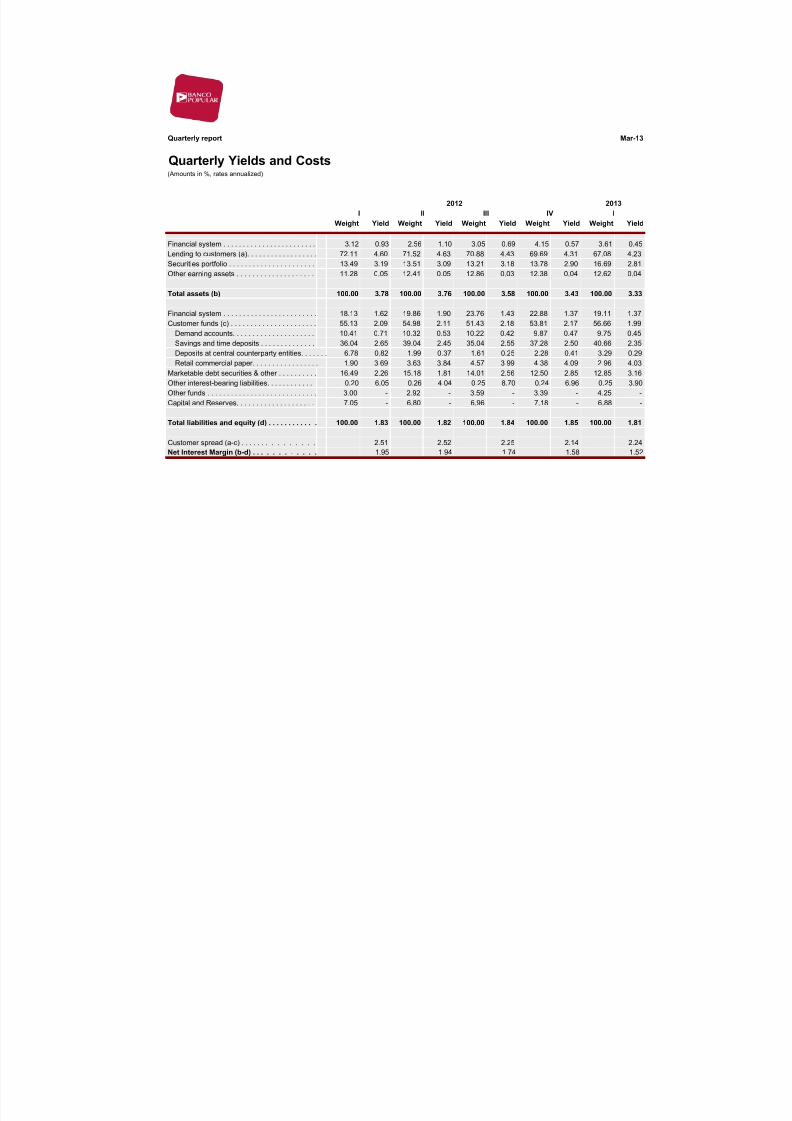
Quarterly Yields and Costs
Weight Yield Weight Yield Weight Yield Weight Yield Weight Y
Financial system . . . . . . . . . . . . . . . . . . . . . . . . 3.12 0.93 2.56 1.10 3.05 0.69 4.15 0.57 3.61 0
Lending to customers (a). . . . . . . . . . . . . . . . . . 72.11 4.60 71.52 4.63 70.88 4.43 69.69 4.31 67.08 4
Securities portfolio . . . . . . . . . . . . . . . . . . . . . . 13.49 3.19 13.51 3.09 13.21 3.18 13.78 2.90 16.69 2
Other earning assets . . . . . . . . . . . . . . . . . . . . 11.28 0.05 12.41 0.05 12.86 0.03 12.38 0.04 12.62 0
Total assets (b) 100.00 3.78 100.00 3.76 100.00 3.58 100.00 3.43 100.00 3
Financial system . . . . . . . . . . . . . . . . . . . . . . . . 18.13 1.62 19.86 1.90 23.76 1.43 22.88 1.37 19.11 1
Customer funds (c) . . . . . . . . . . . . . . . . . . . . . . 55.13 2.09 54.98 2.11 51.43 2.18 53.81 2.17 56.66 1
Demand accounts. . . . . . . . . . . . . . . . . . . . . 10.41 0.71 10.32 0.53 10.22 0.42 9.87 0.47 9.75 0
Savings and time deposits . . . . . . . . . . . . . . 36.04 2.65 39.04 2.45 35.04 2.55 37.28 2.50 40.66 2
Deposits at central counterparty entities. . . . . . . 6.78 0.82 1.99 0.37 1.61 0.25 2.28 0.41 3.29 0
Retail commercial paper. . . . . . . . . . . . . . . . . 1.90 3.69 3.63 3.84 4.57 3.99 4.38 4.09 2.96 4
Marketable debt securities & other . . . . . . . . . . 16.49 2.26 15.18 1.81 14.01 2.56 12.50 2.85 12.85 3
Other interest-bearing liabilities. . . . . . . . . . . . 0.20 6.05 0.26 4.04 0.25 8.70 0.24 6.96 0.25 3
Other funds . . . . . . . . . . . . . . . . . . . . . . . . . . . . 3.00 - 2.92 - 3.59 - 3.39 - 4.25
Capital and Reserves. . . . . . . . . . . . . . . . . . . . 7.05 - 6.80 - 6.96 - 7.18 - 6.88
Total liabilities and equity (d) . . . . . . . . . . . . 100.00 1.83 100.00 1.82 100.00 1.84 100.00 1.85 100.00 1
Customer spread (a-c) . . . . . . . . . . . . . . . 2.51 2.52 2.25 2.14 2
Net Interest Margin (b-d) . . . . . . . . . . . . 1.95 1.94 1.74 1.58 1
(Amounts in %, rates annualized)
2012 2013
I II III IV I
8/12/2019 Banco Popular 1Q13 ENG
http://slidepdf.com/reader/full/banco-popular-1q13-eng 15/16
Quarterly report Mar-
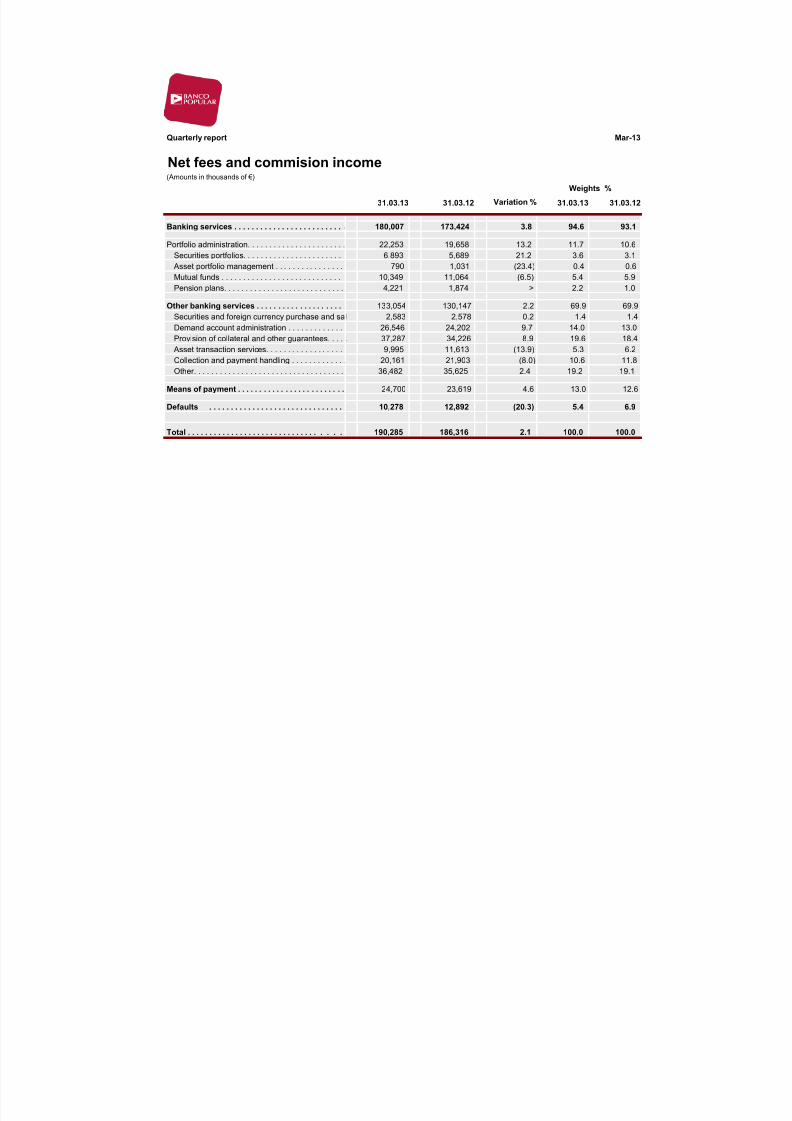
Net fees and commision income(Amounts in thousands of €)
31.03.13 31.03.12 Variation % 31.03.13 31.03.
Banking services . . . . . . . . . . . . . . . . . . . . . . . . . 180,007 173,424 3.8 94.6 93
Portfolio administration. . . . . . . . . . . . . . . . . . . . . . . 22,253 19,658 13.2 11.7 10
Securities portfolios. . . . . . . . . . . . . . . . . . . . . . . 6,893 5,689 21.2 3.6 3
Asset portfolio management . . . . . . . . . . . . . . . . 790 1,031 (23.4) 0.4 0Mutual funds . . . . . . . . . . . . . . . . . . . . . . . . . . . . 10,349 11,064 (6.5) 5.4 5
Pension plans. . . . . . . . . . . . . . . . . . . . . . . . . . . . 4,221 1,874 > 2.2 1
Other banking services . . . . . . . . . . . . . . . . . . . . 133,054 130,147 2.2 69.9 69
Securities and foreign currency purchase and sal 2,583 2,578 0.2 1.4 1
Demand account administration . . . . . . . . . . . . . 26,546 24,202 9.7 14.0 13
Provision of collateral and other guarantees. . . . . 37,287 34,226 8.9 19.6 18
Asset transaction services. . . . . . . . . . . . . . . . . . 9,995 11,613 (13.9) 5.3 6
Collection and payment handling . . . . . . . . . . . . . 20,161 21,903 (8.0) 10.6 11
Other. . . . . . . . . . . . . . . . . . . . . . . . . . . . . . . . . . . 36,482 35,625 2.4 19.2 19
Means of payment . . . . . . . . . . . . . . . . . . . . . . . . . 24,700 23,619 4.6 13.0 12
Defaults . . . . . . . . . . . . . . . . . . . . . . . . . . . . . . . 10,278 12,892 (20.3) 5.4 6
Total . . . . . . . . . . . . . . . . . . . . . . . . . . . . . . . . . . 190,285 186,316 2.1 100.0 100
Weights %
8/12/2019 Banco Popular 1Q13 ENG
http://slidepdf.com/reader/full/banco-popular-1q13-eng 16/16
Quarterly report Mar-13
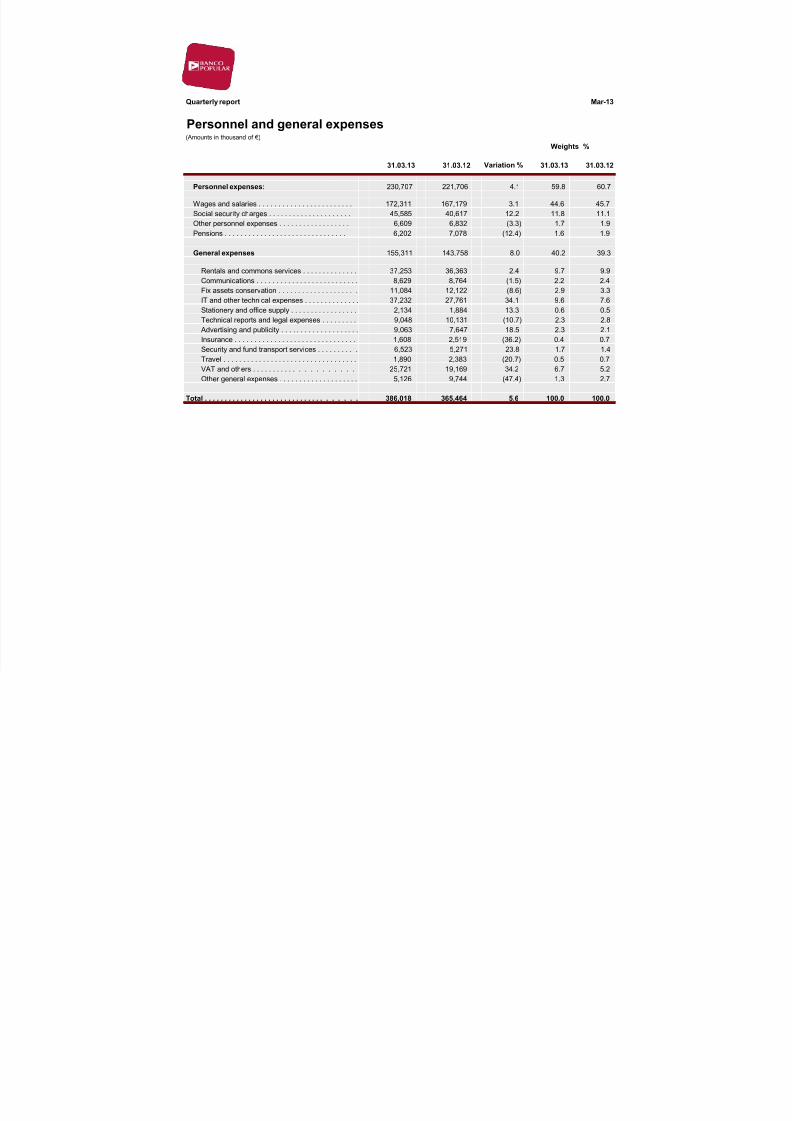
Personnel and general expenses(Amounts in thousand of €)
31.03.13 31.03.12 Variation % 31.03.13 31.03.12
Personnel expenses: 230,707 221,706 4.1 59.8 60.7
Wages and salaries . . . . . . . . . . . . . . . . . . . . . . . . 172,311 167,179 3.1 44.6 45.7
Social security charges . . . . . . . . . . . . . . . . . . . . . 45,585 40,617 12.2 11.8 11.1
Other personnel expenses . . . . . . . . . . . . . . . . . . 6,609 6,832 (3.3) 1.7 1.9
Pensions . . . . . . . . . . . . . . . . . . . . . . . . . . . . . . . 6,202 7,078 (12.4) 1.6 1.9
General expenses 155,311 143,758 8.0 40.2 39.3
Rentals and commons services . . . . . . . . . . . . . . 37,253 36,363 2.4 9.7 9.9
Communications . . . . . . . . . . . . . . . . . . . . . . . . . . 8,629 8,764 (1.5) 2.2 2.4
Fix assets conservation . . . . . . . . . . . . . . . . . . . . 11,084 12,122 (8.6) 2.9 3.3
IT and other technical expenses . . . . . . . . . . . . . . 37,232 27,761 34.1 9.6 7.6
Stationery and office supply . . . . . . . . . . . . . . . . . 2,134 1,884 13.3 0.6 0.5
Technical reports and legal expenses . . . . . . . . . 9,048 10,131 (10.7) 2.3 2.8
Advertising and publicity . . . . . . . . . . . . . . . . . . . . 9,063 7,647 18.5 2.3 2.1
Insurance . . . . . . . . . . . . . . . . . . . . . . . . . . . . . . . 1,608 2,519 (36.2) 0.4 0.7
Security and fund transport services . . . . . . . . . . 6,523 5,271 23.8 1.7 1.4
Travel . . . . . . . . . . . . . . . . . . . . . . . . . . . . . . . . . . 1,890 2,383 (20.7) 0.5 0.7
VAT and others . . . . . . . . . . . . . . . . . . . . . 25,721 19,169 34.2 6.7 5.2
Other general expenses . . . . . . . . . . . . . . . . . . . . 5,126 9,744 (47.4) 1.3 2.7
Total . . . . . . . . . . . . . . . . . . . . . . . . . . . . . . . . . . . . 386,018 365,464 5.6 100.0 100.0
Weights %