bank muscat - investor presentation december 2013 corporate governance solid capital position strong...
TRANSCRIPT

Bank Muscat - Investor Presentation December 2013

Agenda
I. Bank Muscat Introduction 4
II. Operating Environment 7
III. Bank Muscat Business Overview 12
IV. Financial Performance 23
V. Annexure 27
Note: All the financial data is as of 31st Dec 2013 ,unless stated otherwise.

I. Bank Muscat Introduction

Bank Muscat at a GlanceOverview Ownership
Bank Muscat Growth – Footsteps of a Leader Throughout Decades
#1 Bank in Oman with a significant customer base in excess of 1.47 million
clients and a workforce of 3,360 employees as of 31st December 2013
Established in 1982, headquartered in Muscat with 142 branches across
Oman, 2 branches overseas, and 2 representative offices
Fully diversified commercial bank offering corporate and retail banking
services
Primarily domestic dominated operations with over 95% of operating
income generated in Oman
Meethaq – pioneer of Islamic Banking services in Oman, officially
launched in January 2013 with full fledged product and services offering
Long term Bank Rating : Moody’s A1 , Fitch A- , S&P A-
Listed on the Muscat Securities Market, London Stock Exchange & Bahrain
Stock Exchange.
Market cap of US$3.56 billion as of 31th Dec 2013, the largest in Oman
1982
Meethaq launched
20131993
Merger between Bank of Muscat & Bank Al Ahli Al Omani
2002
Acquisition of the Bahraini operations of ABN AMRO
2004
Acquisition of 49% stake in BMI Bank
2007
Acquisition of strategic stake in Mangal Keshav Holdings
1st Branch in Saudi Arabia
2010
1st Branch in Kuwait
2011
Muscat Capital LLC launched
20121996
Dubai Rep Office
2003 20062005 2008 2009
Singapore Rep Office
20012000
Merger with Commercial Bank of Oman
Establishment of Bank of Muscat
4
Royal Court Affairs
24%
Ministry of Defence
Pension Fund 6%
Dubai Financial
Group LLC13%
GDR5%
IFC5%
Others47%
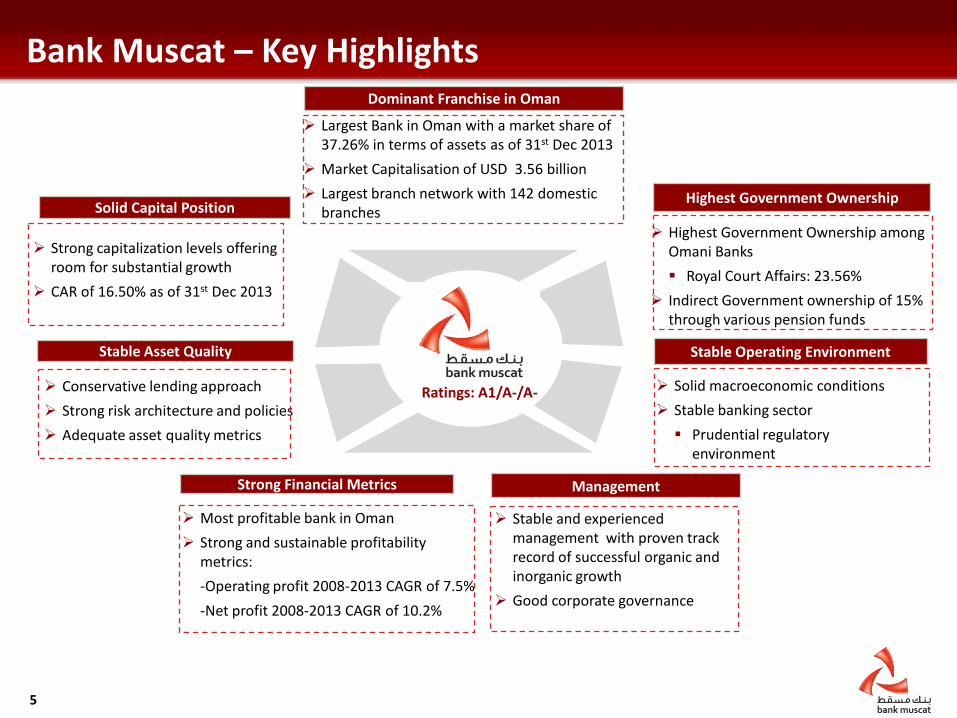
Bank Muscat – Key Highlights
Management
Largest Bank in Oman with a market share of 37.26% in terms of assets as of 31st Dec 2013
Market Capitalisation of USD 3.56 billion
Largest branch network with 142 domestic branches
Strong Financial Metrics
Stable Operating EnvironmentStable Asset Quality
Highest Government Ownership
Dominant Franchise in Oman
Highest Government Ownership among Omani Banks
Royal Court Affairs: 23.56%
Indirect Government ownership of 15% through various pension funds
Conservative lending approach
Strong risk architecture and policies
Adequate asset quality metrics
Most profitable bank in Oman
Strong and sustainable profitability metrics:
-Operating profit 2008-2013 CAGR of 7.5%
-Net profit 2008-2013 CAGR of 10.2%
Solid macroeconomic conditions
Stable banking sector
Prudential regulatory environment
Stable and experienced management with proven track record of successful organic and inorganic growth
Good corporate governance
Solid Capital Position
Strong capitalization levels offering room for substantial growth
CAR of 16.50% as of 31st Dec 2013
Ratings: A1/A-/A-
5

II. Operating Environment
Petro activities47%
Trade, tourism & real estate
11%
Others18%
Mfg,mining & construction
16%
Transport & Communication
4%
FI's4% Petro
activities 19%
Trade, tourism& real estate 26%
Others 22%
Mfg,mining & construction 17%
Transport & Communication
8%
FI's 8%
Oman
SaudiArabia
Yemen
North Sudan
EgyptPakistan
India
Libya
Chad
Afghanistan
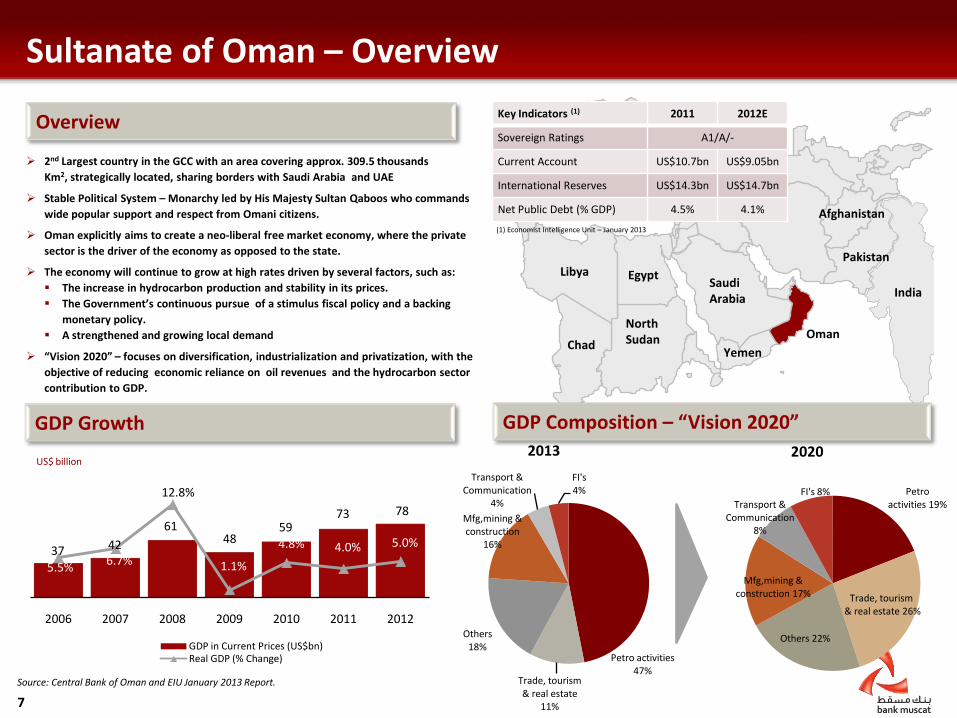
Sultanate of Oman – Overview
Overview
Source: Central Bank of Oman and EIU January 2013 Report.
GDP Growth GDP Composition – “Vision 2020”
US$ billion
Key Indicators (1) 2011 2012E
Sovereign Ratings A1/A/-
Current Account US$10.7bn US$9.05bn
International Reserves US$14.3bn US$14.7bn
Net Public Debt (% GDP) 4.5% 4.1%
(1) Economist Intelligence Unit – January 2013
2020
7
37 4261
4859
73 78
5.5% 6.7%
12.8%
1.1%
4.8% 4.0% 5.0%
2006 2007 2008 2009 2010 2011 2012
GDP in Current Prices (US$bn)Real GDP (% Change)
2nd Largest country in the GCC with an area covering approx. 309.5 thousands Km2, strategically located, sharing borders with Saudi Arabia and UAE
Stable Political System – Monarchy led by His Majesty Sultan Qaboos who commands wide popular support and respect from Omani citizens.
Oman explicitly aims to create a neo-liberal free market economy, where the private sector is the driver of the economy as opposed to the state.
The economy will continue to grow at high rates driven by several factors, such as: The increase in hydrocarbon production and stability in its prices. The Government’s continuous pursue of a stimulus fiscal policy and a backing
monetary policy. A strengthened and growing local demand
“Vision 2020” – focuses on diversification, industrialization and privatization, with the objective of reducing economic reliance on oil revenues and the hydrocarbon sector contribution to GDP.
2013

Oman Banking Sector – Overview
Overview
The Omani banking sector comprises of 9 local banks, 2 specialized banks, and 9 foreign commercial banks
The top 3 banks contribute to around 62% of total sector assets and Bank Muscat represents 37.26% of total sector
Conservative and Prudent Regulator
A number of regulations and caps in place to support the growth, stability and sustainability of the Omani banking sector
Royal Decree introducing Islamic banking activities in Oman
Two new Islamic banks “Al Izz” and “Nizwa”
License to existing banks for Islamic Operation ( incl. Bank Muscat’s Meethaq)
Adequate asset quality with relatively low impaired assets and sound capitalization
Loans and Deposit Growth
The Omani Banking Sector carries a Banking Industry Country Risk Assessment (BICRA) score of 4 and is well positioned on a GCC, emerging market and global basis
Gross Loan: +17.1%Deposits: +16.9%
US$ billion
Source: GCC Central Bank websites and S&P BICRA Report February 2013.Notes: (1) Moody’s as of February 2013 and Central Bank websites based on the latest available figures for the GCC banking sectors. US$/ AED: 3.67, US$/ SAR: 3.749, US$/ QAR: 3.64, KD/ US$: 0.284, and OMR/ US$: 0.385
Oman in the GCC banking sector context(1)
Country BICRAEconomic
RiskIndustry
riskCanada ► 2 2 2Saudi Arabia ► 2 3 2UK ► 3 4 3USA ► 3 3 4Brazil ► 4 5 3Kuwait ► 4 4 5Oman ► 4 4 4Qatar ► 4 4 5UAE ► 5 5 5Bahrain ► 6 6 6Spain ► 6 7 5Ireland ► 7 7 7
BICRA Positioning – Group 4 US$ billion
8
521
412 243 183 185
58
7.9%
1.9%
2.6%
5.5%7.1%
3.9%
-3.0%
2.0%
7.0%
12.0%
UAE Saudi Arabia Qatar Kuwait Bahrain OmanTotal Assets NPL/ GLs
16.9
24.025.5 27.9
32.537.2
39.4
16.922.5 23.8
27.332.7
36.840.5
2007 2008 2009 2010 2011 2012 2013
Gross loan Deposits
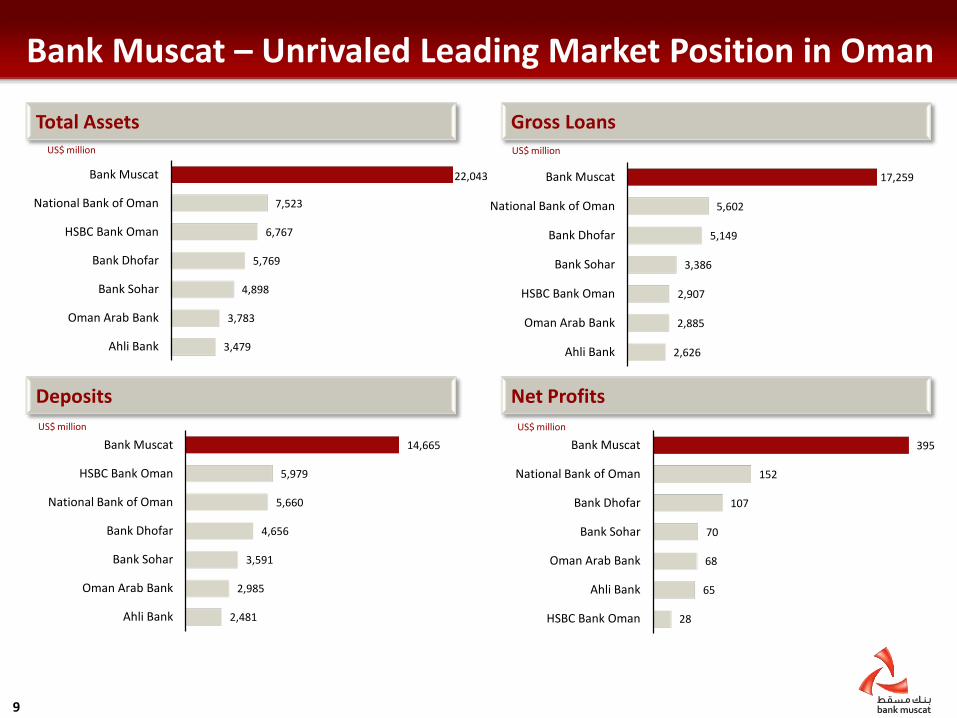
Bank Muscat – Unrivaled Leading Market Position in Oman
Total Assets Gross Loans
Deposits Net Profits
US$ million US$ million
US$ millionUS$ million
9
2,481
2,985
3,591
4,656
5,660
5,979
14,665
Ahli Bank
Oman Arab Bank
Bank Sohar
Bank Dhofar
National Bank of Oman
HSBC Bank Oman
Bank Muscat
3,479
3,783
4,898
5,769
6,767
7,523
22,043
Ahli Bank
Oman Arab Bank
Bank Sohar
Bank Dhofar
HSBC Bank Oman
National Bank of Oman
Bank Muscat
28
65
68
70
107
152
395
HSBC Bank Oman
Ahli Bank
Oman Arab Bank
Bank Sohar
Bank Dhofar
National Bank of Oman
Bank Muscat
2,626
2,885
2,907
3,386
5,149
5,602
17,259
Ahli Bank
Oman Arab Bank
HSBC Bank Oman
Bank Sohar
Bank Dhofar
National Bank of Oman
Bank Muscat

12.9%
13.9% 12.4%16.4% 16.5% 17.2%
13.8%
15.0%1.4%
1.8% 3.8%
0.6%1.0%
2.7%6.8%
0.0%
BBK CBQ BM NBK NCB NBAD ENBD QNBTier 1 Tier 2
Bank Muscat – Dominant Domestic Franchise in the Region
Sector Contribution – Assets (1)
Sector Contribution – Deposits (1)
Asset Quality (1)
Adequate Capitalization (1)
Source: (1) Information for all the banks is based on latest published reports.GCC Central Banks. Banks’ financial Statements.US$/ AED: 3.67, US$/ SAR: 3.749, US$/ QAR: 3.64, KD/ US$: 0.284, BHD/US$:0.377 and OMR/ US$: 0.385
14.3% 15.7% 16.2% 17.0% 17.5% 19.9% 20.6% 15.0%
Assets as % of Total Sector Assets Deposits as % of Total Sector Deposits
10
4.6%12.4% 17.0% 17.9%
24.4%36.1% 38.0%
48.7%
BBK CBQ NBAD ENBD NCB NBK BM QNB
4.7%12.3%
20.8% 18.4%10.6%
27.9%35.9%
65.0%
BBK CBQ ENBD NBAD NCB NBK BM QNB
3.6%1.6% 1.6% 2.9% 3.5%
2.0%
9.1%
13.3%
63.0%
123.2%
165.9%
126.9%104.5%
199.8%
75.1%
58.7%
0.0%
50.0%
100.0%
150.0%
200.0%
250.0%
CBQ QNB NCB BM NBAD NBK BBK ENBDNPL/GL LLR/NPL
III. Bank Muscat Business Overview

Bank Muscat Strategy – Key Pillars
Consolidate Leading Position in Oman
Capitalize on growth opportunities in Oman
Infrastructure development projects and Government focus on economic diversification and developing tourism
Omanis entering the workforce; over 49% of the population less than 25 years old Leverage large network of branches and other delivery channels
Platform to focus on the growth potential
Cross sell opportunities Focus on fee based income
Scale up fee driven businesses both in the retail (credit card, asset management, private banking) and corporate (investment banking) segments
Leverage on existing platform and investments
Pioneering investments in technology supporting growth plans
Increase efficiency
Continuous customer service and support improvements
Regional Expansion Strengthen regional presence through focused and controlled expansion in GCC
Leverage existing regional presence to scale up business growth
Focus on Islamic Banking Developments in Oman
Meethaq – Islamic banking platform
Full fledged product and service offerings, standard of excellence, customer centric approach and transparency
12

Bank Muscat – Business Lines
Corporate Banking
Retail Banking
Wholesale Banking
International Operations
Meethaq
Key Highlights Asset Contribution
Leading Corporate Bank Franchise offering the
full array of corporate banking services
c. 4,000 corporate customers in Oman
Strong expertise in project finance
US$ 9.34bn
42% of total asset
Profit/ (Loss)
US$117.5 mn
29.7% of total profit
Leading Retail Bank platform in Oman
Over 1.47 million retail customers in Oman
Largest distribution network
US$ 6.10bn
27% of total asset
US$172.10 mn
43.50 % of total profit
Comprise of treasury, brokerage, corporate
finance, asset management and private banking
services
Financial Institutions
US$ 4.10bn
19% of total asset
US$ 95.10mn
24.10% of total profit
Presence in GCC, India and Singapore through
overseas branches, rep offices and subsidiaries
US$ 1.79bn
8% of total asset
US$ Loss (5.4 mn)
-1.4% of total profit
Fully fledged Islamic product and services offering
capabilities
OMR 150mn (c.US$388mn) capital assigned to this
business
Officially launched in January 2013 with a plan to
expand the network to 7 branches
US$ 775mn
4% of total asset
US$ 16 mn
4.1% of total profit
13

5,556 5,696 6,0387,107
8,752 9,346
2008 2009 2010 2011 2012 2013Total Assets
162 177206 213 226 229
2008 2009 2010 2011 2012 2013Operating Income
Corporate Banking
Overview Opportunities Strategy
Large number of infrastructure/ Industrial projects in the pipeline
Privatisation and diversification drive by Government
Increasing business flows between Oman and regional countries
Leverage on leading position and expertise
Reinforce presence in Oman across all segments in the value chain
Benefit from large infrastructure and industrial projects in Oman
Focus on less capital intensive and fee income generating business
Explore contractor financing opportunities
Utilize presence in regional markets
Grow GCC trade flows share
Leading Corporate Banking Franchise
Extensive and expanding range of products and services
Strong project finance capabilities
Large corporate client portfolio with c.4,000 customers and lead bank for top tier Omani corporate entities
High level of sophistication differentiated through technology led investments
Commitment to maintain strong control over asset quality
Corporate Loans – Peer Comparison
Asset Growth Operating Income
US$ million US$ millionUS$ million
14
10.06
2.89 2.822.18 1.79 1.77 1.68
Bank
Mus
cat
Bank
Dho
far
NBO
Bank
Soh
ar
HSB
C O
man
Om
an A
rab
Bank
Ahl
i Ban
k

Retail Banking
Overview Opportunities Strategy
Government spending resulting in job creation
Increase in salaries through various government initiatives
Favorable demographics
Over 49% of the population less than 25 years old
Housing finance
Leveraging on leading presence in the retail segment
Increase penetration and cross sell
Technology-led product development and service offerings
Enhance process efficiency
Focus on development and utilization of e-delivery channels
Leading Retail Banking Franchise in Oman
Over 1.47 million customers
Front-runner across retail banking segments including cards, bancassuranceand remittances
Largest delivery channel network in Oman (138 branches, 430 ATMs, 164 CDMs and the best online platform in Oman)
Substantial low cost retail deposit base
Merchant acquiring market share of over 65% by volume in 2012 and leading ecommerce business in Oman
Retail Loans – Peer Comparison Asset Growth Operating Income
US$ million US$ million
15
6.46
2.742.26
1.22 1.14 1.12 1.11
Bank
Mus
cat
NBO
Bank
Dho
far
Ahl
i Ban
k
HSB
C O
man
Bank
Soh
ar
Om
an A
rab
Bank
4,862 4,954 5,1886,097 6,005 6,056
2008 2009 2010 2011 2012 2013
Total Assets
303 300 298357
425 424
2008 2009 2010 2011 2012 2013
Operating Income

137111
171 172 160 153
2008 2009 2010 2011 2012 2013Operating Income
4,198 3,773 3,327
4,6313,869 4,080
2008 2009 2010 2011 2012 2013Total Assets
Wholesale Banking
Overview Opportunities Strategy
Significant cross-sell opportunities to other wholesale banking clients
Leverage transaction experience in attracting new corporate finance mandates
Leverage regional expansion to introduce new products
Strong growth potential in the high net worth market segment
Strengthen Bank Muscat’s leading position in specialised areas
Utilize the presence in regional markets to expand business
Leverage specialised product expertise in other markets
Focus on fee income
Inorganic growth
Treasury: funding, asset and liability management requirements, offer structured solutions to corporate clients
Corporate Finance: Leader in corporate advisory : series of successful transactions and track record outside Oman
Financial Institutions: trade, DCM and correspondent banking services
Brokerage: Leadership position on Muscat Securities. Strong client base
Asset Management: Largest Omani mutual fund manager with potential for growth and expanding outside Oman. Investment solutions for high net worth individuals
Securities portfolio(1)
Asset Growth Operating Income US$ million US$ million
(1)Securities portfolio represents Bonds & T-Bills .(2) Others include Baa1 to Baa3 securities and unrated Banks.
16Aaa to Aa3
94%
A1 to A38%
Others (1)
5%

Islamic Banking – Meethaq
Overview Opportunities Strategy
Exponential growth in the first year of launch indicating potential in the market
Shari’a governance structure ensures transparent banking
Large network at disposal to leverage business
Awareness drives on Shari’a compliant banking to increase customer base
Full fledged product and service offerings
Increase Meethaq exclusive branch network
Customer Centric approach and transparency
Technology driven customer service delivery within the Shari’a compliance ambit
Plan to have 15 branches by the end of 2nd
year and expand thereafter
Establishment of Meethaq as a brand in its own right
Most successful Islamic banking operation in Oman during 2013
6 dedicated branches become operative throughout the Sultanate
Innovation in product offering and services to create niche
Established Sharia Board comprising of well experienced and reputable Sharia scholars
Meethaq – Product and Portfolio Development US$ million
Financing Portfolio
17
Consumer
Corporate
Investment & Treasury
Asset Management
2013 2014
Home, auto finance, saving and
current a/c, E-banking, debit and
Ujra card
Child saving accounts, employee
saving funds, Ijara products
Murabaha (goods LC), vehicle and
equipment financing, sukuk
underwriting
Government checking accounts
with profit distribution
Wakala and interbank Mudaraba Sukuk issue and advisory, FX
hedging products
Real estate and
Equity Funds5 74
167260
403
739
2008 2009 2010 2011 2012 2013

1312
14
22
30
44.0
2008 2009 2010 2011 2012 2013
Operating Income
1,042774 644
939
1,929 1,786
2008 2009 2010 2011 2012 2013
Total Assets
International Operations
Overview Opportunities Strategy
Assets Operating Profit US$ millionsUS$ millions
(1)
18(1) Excluding one off adjustment of US$157mn gain in relation to the sale of sale of the bank’s investment in HDFC Bank, India.
Presence in GCC, India and Singapore
Branches in Kuwait and Saudi Arabia
Rep offices in UAE and Singapore
97% stake in Muscat capital LLC – Saudi based, CMA licensed entity
49% stake in BMI Bank Bahrain
Large banking markets in Saudi Arabia and Kuwait
Pan GCC network offering opportunities for business and trade synergies
Increasing trade/business opportunities between GCC and Asia
Efficiency: rationalization of back-office costs – sharing of operational costs
Focus on existing GCC operations
Solidify position and increase profitability
Drive synergies within the group
Scale up business volumes to attain desired return
Capture trade / business flows between GCC and Asia

International Operations cont’d
Country Entity Overview Strategy
KSA
Bank Muscat Riyadh Branch
Launched in 2007.
As of December 31, 2013, total Net Loans & Advances
were US$ 591 mn, outstanding LCs/LGs were US$ 273
mn and customer deposits stood at US$ 938 mn.
For the 12 months of 2013, branch posted net profit
after provisions of US$ 6.8 mn.
Enhance scale through continued focus on corporate and
treasury businesses
Currently, selective approach to asset growth – medium-size
ticket, contract-backed funded & unfunded business.
Focus on bulk deposits from large corporate and HNI clientele
Cost containment and increase shared resources with HO
Muscat Capital
97% owned subsidiary launched in 2009, focus on
brokerage, asset / wealth management and corporate
finance advisory services .
For the 12 months of 2013, Muscat Capital reported
revenues of US$ 4.6 mn and a net loss after zakat
(taxes) of US$ 0.8 mn.
Scale up business volume and leverage Bank Muscat presence
in other markets
Leverage institutional relationships in brokerage in Oman as
well as focus on selected HNW customers in KSA
Leverage expertise built in Oman in Corporate
Finance/Advisory
Kuwait Bank Muscat Kuwait Branch
Launched in 2010, focus on corporate, trade and
treasury businesses.
As of December 31, 2013, total Net Loans & Advances
were US$ 99 mn, outstanding LCs/LGs were US$ 315
mn and customer deposits stood at US$ 296 mn.
For the 12 months of 2013, branch posted net profit
after provisions of US$ 1.5 mn.
Strategy/Business Focus - Primarily on corporate customers for
corporate, trade and treasury products, as well as contract
financing for Govt. and related entities. Cautious approach to
credit growth.
Scale up business volumes with a focus on quality lending
Leverage off low operating cost base
19

International Operations cont’d
Country Entity Overview Strategy
Bahrain BMI Bank
49% owned retail commercial bank in Bahrain
Network of 10 local branches, 26 ATMs, 1
overseas branch in Qatar Financial Centre,
21.33% stake in Gulf African Bank, Kenya and
50% stake in BMI Offshore Bank, Seychelles.
As on December 31, 2013, total assets of US$
1.9 bn, shareholder funds of US$ 223 mn and
Capital adequacy of 16.4 %.
For the 12 months of 2013, BMI Bank posted
net profit after provisions of US$ 7.6 mn, BM’s
share of which was US$ 3.7 mn.
Combination with Al Salam Bank in progress.
Bank Muscat will own 14.7% of the combined entity (which will be
Islamic) as a result of the combination, and will be the largest
shareholder.
Investment to be continued to be held as an associate.
Combined bank to benefit from increased scale and larger capital
base, as well as increased revenue streams from the additionl of new
business lines (investment banking)
India Mangal Keshav
45.7% ownership as on 31 Dec 2013.
Small entity; marginally profit-making. Entity has
been unable to scale up. Core share brokerage
business has continued to decline in the last 2-3
years on account of market conditions.
Depreciation of the Indian Rupee has also led to
diminution in the value of the investment.
BM is therefore exiting the investment.
Exit is through buy-back of shares by the company.
The first tranche of buy back was completed in Feb 2014, wherein
48% of the bank’s shares have been brought back and BM’s
shareholding is now reduced to 30.4%.
Exit is expected to be substantially completed in 2014
20

Diverse Income & Asset Base across Segments
Assets
Deposits
Loans & Advances
Net Profit
21
Corporate 29.7%
Retail 43.5%
Wholesale 24.1%
Islamic Banking 4.1%
Intl -1.4%
Ministries & Other Gov
Orginisations 41%
Private Commercial
23%
Financial Institutions 1%
Individual & Others 36%
Wholesale 19%
Corporate 42%
Retail 27%
Intl. 8%
Islamic Banking 4%
Services 10%Mining &
quarrying 6%
Manufacture 7%
Real estate 4%
Wholesale & Retail trade 3%
Import & Export Trade 5%
FIs 5%
Utilities & Transport 16%
Personal 32%
Housing 7%Construction 4% Others 2%

IV. Financial Performance

Bank Muscat – Financial Highlights Dec 2013
ROAA & ROAE
Impairment & Recoveries for Credit LossesNet Loans & Advances (Incl. Islamic)
Net Interest Income & Income from Islamic financing
Net Profit
Customer Deposits (Incl. Islamic)
YTD Dec 13: USD 395 millionYTD Dec 12: USD 362 millionIncrease of 9.32%
YTD Dec 13: USD 611 millionYTD Dec 12: USD 599 millionIncrease: by 2.13%
Impairment:YTD Dec 13 : USD 131 million YTD Dec 12 : USD 150 million
Recoveries: YTD Dec 13 : USD 84 millionYTD Dec 12 : USD 87 million
As at 30 Dec 13: USD 15,955 mioAs at 30 Dec 12: USD 14,548 mioGrowth : 9.67%
As at 30 Dec 13 : USD 14,787 mioAs at 30 Dec 12: USD 13,968 mioGrowth : 5.86%
Return on average assetsAs at 31 Dec 13: 1.86%As at 31 Dec 12: 1.84%
Return on average equityAs at 31 Dec 13: 14.49%As at 31 Dec 12: 15.69%
23

Operating Performance and Profitability
Comments
Operating Income Composition
Operating Income & Cost to Income(2)
Profitability (2)
Resilient operating performance throughout the financial turmoil Solid top line income growth – 5 year CAGR of 13%
Increase in operating expenses Manpower Cost Business expansion
Strong core revenue generation with net interest income and commission and fees contributing to over 90% of total operating income Increasing focus on top line commission and fee income
generation Solid Profitability
US$ Millions
US$ Millions
(1) Other income: Profit on sale of non-trading investments, Dividend income and other income.
US$ Millions
24
449 615 756690 764 841
884
40.7%
35.6%
28.2%38.8%
41.1%41.6%
42.2%
0.0
10.
20.
30.
40.
50.
60.
70.
80.
90.
2007 2008 2009 2010 2011 2012 2013Operating Income Cost/ Income
72% 68%60%
71% 72% 71% 65%
22% 23%17%
20% 21% 22%24%
4%
2% 5%
20%
2% 4% 3% 3%3%
2007 2008 2009 2010 2011 2012 2013
Net Interest Income Net Commission & fees Net Income Islamic Other Income (1) FX Income
219 243 191 264
305 362 395
25.8%
14.8%10.9%
14.6%15.4%
15.4%14.5%
2.35% 1.83% 1.24% 1.74% 1.80% 1.84% 1.86%-
6
2
2
2007 2008 2009 2010 2011 2012 2013Net Profit RoAE RoAA

Asset Quality
Comments Loan Growth
Gross Loans – Sector Breakup Impaired Assets and Provisioning
US$ Millions
US$ Millions
Stable loan book growth Conservative lending approach Focus on high quality assets with access to top tier
borrowers Strong project finance capabilities
Diversified loan portfolio across sectors
Adequate provisioning of impaired asset Conservative approach – provisioning in line with the
higher of either IFRS or CBO requirements Non specific loan loss provisions of 2% on retail
portfolio and 1% on corporate portfolio
25
7,26110,009 10,525 10,894
12,97615,096
17,259
3.37%2.80%
4.98%4.19% 2.98%
2.99% 2.53%
0.00%
1.00%
2.00%
3.00%
4.00%
5.00%
2007 2008 2009 2010 2011 2012 2013
Gross Loans NPL/ GLs
282 326
555484 458
548 565
245 280
547 457
387
451437
115.4% 116.6% 101.5%
105.9%118.4%
121.4% 129.2%
0.0%
20.0%
40.0%
60.0%
80.0%
100.0%
120.0%
140.0%
2007 2008 2009 2010 2011 2012 2013LLR NPL LLR/NPL
Services 10%Mining &
quarrying 6%
Manufacture 7%
Real estate 4%
Wholesale & Retail trade 3%
Import & Export Trade 5%
FIs 5%
Utilities & Transport 16%
Personal 32%
Housing 7%Construction 4% Others 2%

55% 54% 55% 63% 67% 68% 67%
22% 28% 28% 18% 16% 14% 14%15% 12% 12% 13% 12% 13% 14%7% 6% 5% 6% 5% 5% 5%
2007 2008 2009 2010 2011 2012 2013Others Equity Borrowings Deposits
Funding and Liquidity
Comments Funding Mix
Liquid Assets Capital Adequacy Ratio
20,555
Stable funding structure with a diversified funding base
Largest deposit base in Oman with significant granularity
Retail deposits comprise 34.84% of total deposits
Top 10 depositors represent 12.45% of total deposits and comprise of top tier Omani institutions
Adequate liquidity
Strong capitalization levels
Highest CAR among Omani peers and one of strongest among GCC peers
US$ Millions
US$ Millions
18,77415,19715,19815,65810,955
16.32%15.93%14.78%14.72%12.63%15.14%
22,162
16.50%
26
1,2671,176 1,579 1,886 2,145 1,723 1,512
1,5272,799 2,638
1,429 2,2571,886 2,252
- 367 60 78 174 727 521
25.50% 27.73% 28.15% 22.33% 24.38% 21.09% 19.44%
2007 2008 2009 2010 2011 2012 2013Cash & equivalent Placements with banks T Bills Liquid Assets
12.58%10.36% 11.14% 11.85% 11.30% 12.64% 13.20%
2.56%
2.27%3.58% 2.93% 4.63%
3.68% 3.30%
2007 2008 2009 2010 2011 2012 2013Tier 1 Ratio Tier 2 Ratio

V. Annexure

Bank Muscat – Organisation Structure 2013
Chief Internal Auditor, GM
HR, DGM
Group General ManagerRetail, Investment and Global
Markets
Compliance, AGM
Retail, GM
CFO, AGM
Investment Bkg & FI, DGM
IT, Ops and Infrastructure,
GM
Board Secretary, DGM
Chief Risk Officer, GM
Treasury, AGM *
Credit, GM
Branches, DGM
Cards and E-Banking, AGM
Corporate Banking
AGM
SME, AGM
Project Finance,
DGM
Investment Bkg, AGM
Operations, DGM
Support Services, DGM
Head, HR
Fin. Control, Planning
&Strategy, AGM
Chief Operating Officer
Direct/Inst.
Sales, AGM
Credit and Recovery,
AGM
International Ops, AGM
Group General ManagerCorporate and
Intl. Operations
CEO Saudi Br, AGM
Ahmed F Al Balushi
COO Saudi Br, AGM
Ahmed Al Ojaily
CEO Muscat Capital, AGM
Abdulwahed Al Murshidi
Group General Manager
Islamic Banking
Group General Manager Corporate Services
Overseas Ops.
IT, DGM
PMO, Planning & Control DGM
Corp. Comm. and CSR,
AGM
Chief Executive
Chairman’s Office, AGM Board
28
Priority Banking, DGM
* also reports in to Group GM Retail for Retail Enterprises business

Balance SheetAmounts in US$ Millions
29
31-Dec-13 31-Dec-12 31-Dec-11 31-Dec-10 31-Dec-09 31-Dec-08Cash and bank (incl. placements) 3,764 3,609 4,403 3,315 4,218 3,975Loans and Advances 15,230 14,548 12,518 10,410 9,969 9,682Islamic financing receivables 725 0Non trading investments 1,460 1572 891 694 375 983Tangible fixed assets 173 180 186 194 68 57Other assets (incl. invt in associates) 690 646 777 584 566 960Total assets 22,043 20,555 18,774 15,198 15,197 15,658
Bank deposits/FRNs 2,303 2,092 1,914 2,014 3,665 3,959Customer deposits (incl. Bonds and CDs) 14,545 13,968 12,741 9,705 8,474 8,544Islamic Customer's Deposit 241 - - - - -Other liabilities 1,042 1034 989 934 720 1,003Subordinated debt 641 675 869 477 490 295Convertible bonds 121 42 84 84 84 –Total liabilities 18,894 17,811 16,513 13,129 13,349 13,801
Share capital and premium 1,733 1,538 1,185 1,133 1,063 1,063Total reserves 846 722 591 493 373 313Cumulative changes in fair value 43 21 3 24 13 180Retained profits 527 464 397 335 315 301Shareholders' equity 3,148 2,745 2,261 2,069 1,848 1,856Total liabilities + shareholders' equity 22,042 20,556 18,774 15,198 15,197 15,658
Key ratiosLoans and advances/customer deposits 104.15% 103.10% 98.20% 107.30% 117.60% 113.30%Shareholders' equity/total assets 14.28% 13.35% 12.00% 13.60% 12.20% 11.90%Subordinated debt/(debt + equity) 16.92% 19.74% 27.80% 18.70% 20.90% 13.70%BIS total capital ratio 16.50% 15.10% 15.93% 14.78% 15.20% 13.02%

Profit and LossAmounts in US$ Millions
30
31-Dec-13 31-Dec-12 31-Dec-11 31-Dec-10 31-Dec-09 31-Dec-08
Net interest income 578 599 551 486 453 421 Net income from Islamic financing 33 -
Other operating income 272 242 213 203 303 194
Operating income 884 841 764 690 756 615
Operating costs (373) (350) (314) (267) (213) (219)
510 491 450 422 543 396
Recoveries from impairments 84 87 67 45 29 34
Credit loss impairments (131) (150) (146) (121) (255) (64)
Other impairments (12) (12) (9) (7) (60) (77)
Gain/(loss) from associates 3 (9) (9) (33) (27) (8)
Profit before Tax 455 407 354 306 229 282
Taxation (59) (46) (49) (42) (37) (38)
Net Profit 395 362 305 264 192 244
Key ratios
Cost/income ratio 42.24% 41.60% 41.10% 38.80% 28.20% 35.60%
Return on average assets 1.86% 1.84% 1.80% 1.74% 1.24% 1.83%
Return on average equity 14.49% 15.42% 15.37% 14.64% 10.90% 14.80%
Basic EPS (US$) 0.187 0.187 0.197 0.171 0.178 0.226
Share price (US$) 1.52 1.46 1.99 2.514 2.14 2.07

Disclaimer Statement The information and opinions contained in this document have been compiled or arrived at by bank muscat from sources believed to be reliable and in good faith, but no representation or warranty, expressed or implied, is made as to their accuracy, completeness or correctness. The information contained in this document is published for the assistance of recipients, but is not to be relied upon as authoritative or taken in substitution for the exercise of judgement by any recipient. The bank does not accept any liability whatsoever for any direct or consequential loss arising from any use of this document or its contents. This document is strictly confidential and may not be reproduced, distributed or published for any purpose.
Thank You
“WECAN DOMORE.”
You may reach us on : [email protected]