bank negara malaysia | central bank of malaysia - credit risk · 2018-09-27 · source: bank negara...
TRANSCRIPT

7Financial Stability Review - First Half 2018
OVERVIEW
Domestic financial stability was sustained amid heightened uncertainties driven by both domestic and external factors in the first half of 2018. Global financial market volatility remained elevated, as trade-related tensions persisted while emerging markets experienced capital outflows following rising interest rates in the US, and a stronger US dollar. This follows a period of increased capital inflows to emerging market economies amid low yields in the advanced economies. On the domestic front, policy uncertainties following the outcome of the 14th Malaysian general election (GE14) also contributed to increased market volatility. Domestic financial markets have remained resilient against reversals of non-resident portfolio flows, supported by domestic institutional investors including financial institutions. Financial institutions continue to maintain strong fundamentals underpinned by high levels of capitalisation, healthy funding and liquidity profiles and sound asset quality – lending firm support to credit intermediation.
The Financial Stability Committee (FSC) of the Bank assessed the overall level of risks to domestic financial stability to be broadly unchanged (Diagram 1). While indicators of financial market stress have trended upwards, prudent risk management and hedging strategies by banks have contained market risk exposures. Liquidity and funding conditions also remain conducive to support financial intermediation despite increased market volatility. Credit risks are assessed to be low with banks continuing to observe sound underwriting and risk management practices. The overall debt servicing capacity of borrowers continues to be supported by sustained income growth of households and healthy financial positions of businesses. Pockets of risks however remain. Impaired loans have grown a little faster among households that are more exposed to income variability and facing higher cost pressures. However, impairment levels remain low. Overall household debt accumulation has also been on a more sustainable path in line with income growth. In the non-residential property segment, excess supply of office space and shopping complexes is expected to persist with vacancy rates deteriorating further in the first quarter of 2018. Conditions also remain challenging for firms in the oil and gas (O&G) sector amid a slow pick-up in capital spending by major
oil producers. Bank exposures to these segments remain low with current capital levels providing strong buffers against potential losses even under severe stress scenarios. Financial institutions have also increased their vigilance of emerging risks in their overseas operations amid tightening global financial conditions.
For the remainder of 2018, risks to financial stability are expected to be contained despite continued uncertainties from both the domestic and external fronts. Globally, economic growth is expected to moderate in the second half of 2018 and into 2019. Uncertainties surrounding the on-going trade disputes between major economies and a faster-than-expected pace of monetary policy normalisation amid increasing inflationary pressures in a few major economies remain key risks to business performance and financial market conditions in emerging economies. Domestic financial markets are nevertheless expected to remain resilient and orderly. This will continue to be supported by the strong fundamentals of the Malaysian economy and the larger presence of stable, long-term investors that increase market resilience to sudden significant withdrawals of capital. Credit intermediation will continue to be underpinned by the healthy funding profile of banks and sustained surplus liquidity in the banking system. The FSC remains vigilant to signs of increasing financial stress in segments of the household and business sectors. Current policy measures and risk management practices of financial institutions will continue to play a critical role in containing attendant risks to domestic financial stability.
CREDIT RISK
Household Debt Growth Increased Driven by Secured Loans
As at end-June 2018, the annual growth of household debt1 increased to 5.2% (2017: 4.9%) (Chart 1). Loans for the purchase of residential properties continued to be the key driver of growth (8.4%; 2017: 8.6%; contribution to growth as at end-June 2018: 4.3 percentage points, ppt; 2017: 4.3 ppt) underpinned mainly by sustained demand for houses priced between RM250,000 and RM500,000. Total household debt growth was
1 Extended by banks, development financial institutions and major non-bank financial institutions (NBFIs).
Financial Stability Rebiew 2018.indd 7 25/09/2018 6:51 PM

8 Financial Stability Review - First Half 2018
Risks to financial stability from household sector exposures continue to be largely mitigated by sound underwriting standards, risk management practices and loan affordability assessments. New household borrowings remained of high quality. About three-quarters of new loans approved were to borrowers with debt service ratios (DSR) of less than 60%. The bulk of household debt (64.5%) continued to be secured by properties and principal-guaranteed investments, thereby substantially reducing net exposures on household debt.
also driven by loans for the purchase of securities2 which grew by 8.4% (2017: 1.8%) and contributed 0.5 ppt (2017: 0.1 ppt) to the overall expansion in household borrowings. This partly reflected a rebalancing of exposures towards more secured lending by some banks. The ratio of household debt-to-GDP has sustained its downward trend since 2015 (Chart 2).
Diagram 1
Direction of Risks that Impact Domestic Financial Stability
Direction of risks (1H 2018 vs 2017)
Credit risk
Household
• Debt servicing capacity of households remained broadly intact• Households maintained aggregate fi nancial assets at more than two times of debt• Banks are resilient to shocks from households, with potential losses from the lower
income segment accounting for less than one-fi fth of excess capital buff ers
Property market
• Continued mismatch in the demand and supply for aff ordable houses• Oversupply situation persists in the offi ce space and shopping complex segments
with banks exposures to these segments accounting for 5% of total loans • Banks are resilient against potential shocks arising from the property market and
related sector developments
Non-fi nancial corporations
• Overall asset quality remained intact, despite weaker debt servicing capacity of borrowers in oil & gas and real estate sectors
• Banks’ exposures to oil & gas related sectors accounted for 6% of total business exposures
• Majority of large borrower groups able to support debt repayments even under stressed scenarios
• Risks to fi nancial stability arising from external debt are largely mitigated given 30% are intercompany loans, with the remainder largely hedged with foreign currency revenue and/or fi nancial derivatives
Market risk • Domestic fi nancial markets remained orderly despite increased market stress• Market risk exposures of fi nancial institutions are stable
Liquidity and funding risk
• Ample liquidity in the banking system to meet liquidity needs• Funding structure of banks remained healthy; predominantly funded by deposits• Banks maintained liquidity coverage ratios well in excess of the regulatory
minimum, mitigating short-term liquidity risk
Contagion risk
Interlinkages with NBFIs
• No material change in the nature and magnitude of risk transmission from non-bank fi nancial institutions (NBFIs)
• Slight reduction of NBFIs’ interlinkages with the fi nancial system following merger of an NBFI with a licensed bank
External exposures
• Widening of net external liability position as banks reinforce foreign currency (FCY) liquidity buff ers
• More than two-thirds (68%) of external FCY interbank borrowings are from related counterparties, which are less likely to be subjected to sudden withdrawal shocks
• Banks continued to be predominantly funded by ringgit-denominated domestic funding sources with little sign of undue reliance on external and cross-currency funding
• Banks remained prudent in managing maturity and currency mismatches; banks hold substantial liquid FCY assets that could be drawn upon to meet their external obligations
Banks’ overseas operations
• Risks arising from overseas operations are assessed to be low as these operations are supported by strong capital and liquidity buff ers as well as sound asset quality
Stable Decreased Increased
2 85% was for the purchase of unit trust funds including Amanah Saham Bumiputera.
Financial Stability Rebiew 2018.indd 8 25/09/2018 6:51 PM

9Financial Stability Review - First Half 2018
The debt servicing capacity of households remained intact, supported by sustained income and stable employment growth. The annual growth of household financial assets moderated to 5.1% (2017: 8.6%) driven mainly by valuation changes in unit trust funds and equity holdings, in line with the weaker equity market performance in the second quarter (Chart 3). At the aggregate level, financial buffers remained ample as both financial assets and liquid financial assets stood at 2.1 and 1.4 times of debt, respectively. Including housing wealth, the total household assets-to-debt ratio also remained high at four times (2017: 4.1 times).
The ratio of impaired loans to total outstanding household debt for both banks and non-banks were sustained at 1.6% while delinquencies (loans-in-arrears of between one and three months) improved to 1.2% of total loans (2017: 1.4%). However, total impaired loans grew annually by 2% as at end-June 2018 (2017: 1.9%). In particular, impaired personal loans, loans for the purchase of residential and non-residential properties in the banking system recorded an annual growth of 7.5%, 4.4% and 20.4%, respectively. The uptick in impaired residential and non-residential property loans was mainly for properties valued at above RM500,000,
Source: Bank Negara Malaysia, Bloomberg, Department of Statistics, Malaysia and Securities Commission Malaysia
% of GDP
Debt-to-GDP ratios declined further
Chart 2: Household Sector – Key Ratios
182.1 183.1 181.5 179.1 176.8
71.5 73.5 72.7 69.3 69.1
0
50
100
150
200
Debt-to-GDP: Total Financial assets-to-GDP
Debt-to-GDP: Banking system
2016 2017 1H 2018
2014 2015
86.8 89.0 88.3 84.2 83.8
% daripada KDNK
Nisbah hutang kepada KDNK terus menurun
Rajah 2: Sektor Isi Rumah – Nisbah Utama
182.1 183.1 181.5 179.1 176.8
71.5 73.5 72.7 69.3 69.1
0
50
100
150
200
Hutang kepada KDNK: Jumlah Aset kewangan kepada KDNK
Hutang kepada KDNK: Sistem perbankan
2016 2017 ST1 2018
2014 2015
86.8 89.0 88.3 84.2 83.8
Annual change (%)
Household debt driven by sustained demand for affordable housing
Chart 1: Household Sector – Annual Growth of Debt
5.4
5.2
9.4
7.3
4.9
12.4 11.0
9.1 8.6 8.4
0
3
6
9
12
15
2014 2015 2016 2017 1H 2018
Total debt
Residential properties
Perubahan tahunan (%)
Hutang isi rumah dipacu oleh permintaan rumah mampu milik yang mampan
Rajah 1: Sektor Isi Rumah – Pertumbuhan Hutang Tahunan
5.4
5.2
9.4
7.3
4.9
12.4 11.0
9.1 8.6 8.4
0
3
6
9
12
15
2014 2015 2016 2017 ST1 2018
Jumlah hutang
Harta kediaman
24.3 22.8 21.9 19.9 19.6
22.3 21.9 21.5 20.8 20.6
22.6 24.1 25.1 26.3 26.8
30.8 31.2 31.5 33.0 33.0
0
20
40
60
80
100
2014 2015 2016 2017 1H 2018
<RM3,000 RM3,000-5,000 RM5,000-10,000
>RM10,000
% of household debt
Chart 4: Household Sector – Debt by Monthly Income Group
Share of borrowings by low-income borrowers declined further
24.3 22.8 21.9 19.9 19.6
22.3 21.9 21.5 20.8 20.6
22.6 24.1 25.1 26.3 26.8
30.8 31.2 31.5 33.0 33.0
0
20
40
60
80
100
2014 2015 2016 2017 1H 2018
<RM3,000 RM3,000-5,000 RM5,000-10,000
>RM10,000
% daripada hutang isi rumah
Rajah 4: Sektor Isi Rumah – Hutang Mengikut KumpulanPendapatan Bulanan
Bahagian peminjaman bagi peminjam berpendapatanrendah semakin menurun
Annual change (%)
Households maintained aggregate financial assets at more than two times of debt
Chart 3: Household Sector – Debt and Financial Assets
2.1 2.1 2.1 2.1 2.1 1.5 1.4 1.4 1.5 1.4
9.4
7.3
5.4 4.9
5.2 5.8
5.2 5.3
8.6
5.1
0
2
4
6
8
0
2
4
6
8
10
2014 2015 2016 2017 1H 2018
Financial asset-to-debt (RHS)
Liquid financial asset-to-debt (RHS) Total debt
Financial assets
Times
Perubahan tahunan (%)
Isi rumah mengekalkan aset kewangan agregat melebihi dua kali hutang
Rajah 3: Sektor Isi Rumah – Hutang dan Aset Kewangan
2.1 2.1 2.1 2.1 2.1 1.5 1.4 1.4 1.5 1.4
9.4
7.3
5.4 4.9
5.2 5.8
5.2 5.3
8.6
5.1
0
2
4
6
8
0
2
4
6
8
10
2014 2015 2016 2017 ST1 2018
Aset kewangan kepada hutang (skala kanan)
Aset kewangan mudah tunai kepada hutang (skala kanan)
Jumlah hutang
Aset kewangan
KaliFinancial Stability Rebiew 2018.indd 9 25/09/2018 6:51 PM

10 Financial Stability Review - First Half 2018
with higher incidents of impairments observed among self-employed borrowers who are more exposed to income variability. Higher impairments in personal loans were meanwhile largely observed among borrowers (i) with monthly salary of less than RM5,000; and (ii) living in major employment centres, which generally have higher cost of living.
While the amount of debt acquired by individuals earning less than RM3,0003 per month increased by RM1.6 billion to RM228.5 billion as at end-June 2018, the share of borrowings to total household debt declined further (1H 2018: 19.6%; 2017: 19.9%), reflecting sustained improvements in affordability assessments (Chart 4). Half of the borrowings in this segment are in the form of fixed-rate financing, thereby reducing their susceptibility to changes in borrowing costs. Nevertheless, aggregate outstanding debt to annual gross income ratio for this segment has continued to edge higher to 8.4 times (2017: 8.3 times), driven largely by residential property loans. Thus, ensuring that further debt accumulation by this segment is undertaken prudently will be important to avert excessive debt burdens and financial hardship.
Existing macroprudential measures remain relevant
Overall, household debt accumulation has been on a more sustainable trend, as a result of the series of cross-cutting measures that have been implemented since 2010. Given the elevated level of household indebtedness, coupled with pockets
of financial stress observed in certain segments, the Bank judges that existing macroprudential measures remain relevant.
Even under stressed scenarios, banks are able to withstand potential losses from household sector
The banking system continues to be resilient to shocks from household lending. In an unlikely event of simultaneous default incidents under simulated stress shocks, potential losses to the banking system would remain comfortably within the excess capital buffers (above the regulatory minimum of 8%) of RM138.5 billion held by banks as at end-June 2018 (Table 1). Potential losses attributable to households in the lower income segments (earning less than RM5,000 per month) account for 40% of total potential losses.
Imbalances in the Property Market Persisted, with No Imminent Risks to Financial Stability
As at end-June 2018, total exposures of Malaysian financial institutions to the domestic property market grew by 6.8% (2017: 7.2%) to RM878.9 billion (Chart 5), accounting for a higher share of total assets (28%; 2017: 27.4%). Banks remained the largest lender to the domestic property market, representing approximately 97% (RM852.2 billion) of total financial institutions’ exposures to the property market. Of this, about 90% were end-financing for the purchase of residential and non-residential properties.
3 These borrowers are more vulnerable to shocks.
Household Sector: Potential Losses in the Banking System Based on Severe Assumptions on Probability of Default (PD) and Loss Given Default (LGD)
Residential properties
Motor vehicles
Personal fi nancing Credit cards Total1
Stressed PD (%)(Baseline PD2, %)
6.7(1.7)
7.2(1.8)
14.5(3.6)
14.5(3.6)
Stressed LGD (%)(Baseline LGD2, %)
40.0(16.7)
75.0(45.5)
95.0(70.5)
95.0(70.5)
Potential losses(RM billion)
All borrowers‐ Borrowers earning ≤ RM3,000 per month‐ Borrowers earning ≤ RM5,000 per month
13.8 1.7 4.1
7.9 2.4 4.5
13.1 4.3 7.2
5.0 0.7 1.9
65.1 14.5 26.53
1 Includes other household loans such as fi nancing for the purchase of non-residential properties and consumer durables 2 Based on PD and LGD of banks adopting the Internal Ratings-Based (IRB) approach 3 19.1% of excess capital buff ers held by banks
Source: Bank Negara Malaysia
Sektor Isi Rumah: Potensi Kerugian Kepada Sistem Perbankan Berdasarkan Andaian Teruk Terhadap Kebarangkalian Mun-gkir dan Kerugian Akibat Mungkir
Harta kediaman
Kenderaan bermotor
Pembiayaan peribadi Kad kredit Jumlah1
Kebarangkalian mungkir tertekan (%) (Kebarangkalian mungkir dasar2, %)
6.7(1.7)
7.2(1.8)
14.5(3.6)
14.5(3.6)
Kerugian akibat mungkir tertekan (%) (Kerugian akibat mungkir dasar2, %)
40.0(16.7)
75.0(45.5)
95.0(70.5)
95.0(70.5)
Potensi kerugian (RM bilion)
Semua peminjam‐ Peminjam berpendapatan ≤ RM3,000 sebulan‐ Peminjam berpendapatan ≤ RM5,000 sebulan
13.8 1.7 4.1
7.9 2.4 4.5
13.1 4.3 7.2
5.0 0.7 1.9
65.1 14.5 26.53
1 Termasuk pinjaman isi rumah lain seperti pembiayaan untuk pembelian harta bukan kediaman dan barangan pengguna tahan lama 2
Berdasarkan kebarangkalian mungkir dan kerugian akibat mungkir bank dengan pendekatan Berdasarkan Penarafan Dalaman 3 19.1% daripada lebihan penampan modal bank
Sumber: Bank Negara Malaysia
Table 1
Jadual 1
Financial Stability Rebiew 2018.indd 10 25/09/2018 6:51 PM

11Financial Stability Review - First Half 2018
Exposures to Residential Property MarketThe mismatch between housing demand and supply, particularly in the affordable segment, continued to exert upward pressure on house prices. Only 25% of newly launched houses between 2016 and 1Q 2018 were priced below RM250,000 (average 2007-2009: 70%), against 35% of households who can only afford houses within this price range. The number of unsold4 housing units, of which more than 80% were priced above RM250,000, correspondingly increased to 146,196 units as at end of first quarter of 2018.
Risks from a significant correction in house prices are assessed to remain low on account of several factors. Demand for housing remains
firm. Outstanding bank financing for the purchase of residential properties expanded by 8.3% as at end-June 2018, (2017: 8.7%; 2010-2016 average: 12.5%), with outstanding financing extended to first-time buyers of houses priced below RM500,000 accounting for about 71% of total residential property loan borrowers (below RM250,000: 54%). The approval rate5 for residential property loan applications remained above 70%, thus supporting continued access to house financing for eligible borrowers. Speculative activities have also remained in check. As at end-June 2018, the number of borrowers with three and more outstanding residential property loan accounts, a proxy for speculative purchases, grew slower at 0.8% (2017: 0.9%; 2010: 15.8%). This segment accounted for less than 3% of total residential property loan borrowers. The share of residential property loans settled within three years, another gauge of speculative purchases, also continued to decline to 8% of total residential property loans settled (2017: 9.7%).
Eligible borrowers continued to have access to house financing. First-time home buyers accounted for more than 70% of total house financing borrowers
The overall quality of banks’ residential property loan portfolio remained sound, in line with responsible lending and strengthened valuation and underwriting practices (Chart 6). The aggregate delinquent and impaired residential property loan ratios in the banking system remained low, both at 1.1% (2017: 1.3% and 1%, respectively). Total impaired residential property loans grew by 6.2% driven mainly by impairments for the purchase of houses priced above RM250,000. However, the impairment ratio for this segment remained low at 0.9% (2017: 0.9%).
4 Includes both unsold properties that have been completed (overhang) and unsold properties currently under construction. These properties encompass all residential properties as well as serviced apartments and small office home offices (SOHO). (Source: National Property Information Centre).
Financial institutions’ exposures are mostly related toend-financing for the purchase of residential and non-residential properties
Chart 5: Property Market – Financial Institutions' Exposures to the Property Market
64% 75%
26% 0
20
40
60
80
100
Banks Development financialinstitutions
Insurers andtakaful operators
% RM852.2 billion RM15.3 billion RM11.4 billion
Source: Bank Negara Malaysia
End-financing for residential property
Working capital for construction and development of properties
Corporate bonds/sukuk issued by property developers, held by financial institutions
End-financing for non-residential property (NRP)
Bridging financing for construction and development of properties
Investment in properties
Kebanyakan dedahan institusi kewangan berkaitandengan pembiayaan akhir untuk membeli hartakediaman dan bukan kediaman
Rajah 5: Pasaran Harta Tanah – Dedahan Institusi Kewangan kepada Pasaran Harta Tanah
64% 75%
26% 0
20 40 60 80
100
Bank
% RM852.2 bilion RM15.3 bilion RM11.4 bilion
Sumber: Bank Negara Malaysia
Pembiayaan akhir untuk harta kediaman
Modal kerja untuk pembinaan dan pembangunan harta tanah
Bon korporat/sukuk dikeluarkan oleh pemaju harta tanah,dipegang oleh institusi kewangan
Pembiayaan akhir untuk harta bukan kediaman
Pembiayaan penyambung untuk pembinaan dan pembangunan harta tanah
Pelaburan dalam harta tanah
Institusi kewanganpembangunan
Penanggung insuransdan pengendali takaful
5 The approval rate is the ratio of the number of residential property loan applications approved by all banks in Malaysia to the number of residential property loan applications received by the banks during the same period. This ratio is derived based on monthly data submissions from banks to Bank Negara Malaysia.
Financial Stability Rebiew 2018.indd 11 25/09/2018 6:51 PM

12 Financial Stability Review - First Half 2018
Exposures to Non-residential Property6 MarketMarket conditions in the non-residential segment remained subdued given the excess supply in certain segments, particularly for office space and shopping complexes which is expected to persist. The number of commercial properties (shops, office space and shopping complexes) transacted during the first quarter of 2018 declined by about 9% (4Q 2017: 8%), although values transacted saw an increase of 15.6% (4Q 2017: 32%). This reflected the higher average value of commercial properties being transacted, especially for those priced above RM1 million.
For office space, the incoming supply in the Klang Valley in the next four years remains sizeable at 37.9 million square feet as at 2Q 2018 (4Q 2017: 38.1 million square feet). In the retail segment, while some property developers have either deferred or downsized their projects to help secure higher occupancy amid softer market conditions, the addition of new shopping complexes in the Klang Valley, Penang and Johor has continued to exert downward pressure on occupancy and rental rates. As at the end of the first quarter of 2018, vacancy rates for both office space and shopping complexes deteriorated further (1Q 2018: 17.2% and 19.8%, respectively; 2017: 16.7% and 18.7%, respectively). While overall rental rates remained broadly
unchanged, some office space owners continued to offer rental holidays to attract tenants.
Banks’ end-financing for the purchase of non-residential properties grew by 2.6% to RM216.5 billion as at end-June 2018 (2017: 2.3% at RM213.4 billion). This accounted for about 26% of banks’ exposures to the property market or 13.3% of banks’ total outstanding loans. End-financing for the purchase of shops accounted for the largest share (40%), followed by office space and shopping complexes (23%).
Oversupply in the office space and shopping complex segments persists in key employment centres
Banks have remained cautious when lending to the office space and shopping complex segments where excess supply has been more pronounced (for detailed information on the oversupply situation, refer to 3Q 2017 BNM Quarterly Bulletin, Box Article 2 on ‘Imbalances in the Property Market’). Following the issuance of the finalised Credit Risk policy document by the Bank in January 2018, banks are expected to strengthen their assessment of financing proposals for new property development or construction projects. This includes more robust assessments of the viability of projects, the financial strength of the property developer and location-specific factors such as effects of the development to properties in the surrounding area. Loan approval rates for the construction and purchase of office space and shopping complexes were correspondingly lower at 63.5% and 69.5%, respectively, during the first six months of 2018 (2017: 72.5% and 75.8%, respectively). Banks’ exposures to these segments in the form of loans (including end-financing to purchase office space and shopping complexes, and financing for construction and development of non-residential properties) and holding of corporate bonds and sukuk have remained broadly stable at RM89 billion. These exposures accounted for just 5% and 6.7% of banks’ total outstanding loans and holding of corporate bonds and sukuk, respectively. Asset quality in these segments has also remained sound with the impaired loan ratio little changed at 1.6% as at end-June 2018 (2017: 1.5%). Going forward, excess supply will continue to weigh on conditions in the office space and shopping complex segments in the medium term. As such, banks should remain prudent in lending to these segments.
6 Include purpose-built office segments, shopping complexes, shops, industrial buildings and factories, and other non-residential properties.
2018
Vintage default rates of housing loans originated since 2007 have shown improvements
Chart 6: Property Market – Vintage Analysis for Housing Loans in the Banking System
2007
2008 2009
2010 2011
2012 2013 2014 2015 2016 2017
0
1
2
3
4
1 12 24 36 48 60 72 84 96 108 120 132
24 36 48 60 72 84 96 108 120 132
Default rate (%)
Months on book
Note: Data include impaired loans written off by banks
Source: Bank Negara Malaysia
Kadar mungkir vintaj bagi pinjaman perumahan yang diluluskan sejak 2007 adalah lebih baik
Rajah 6: Pasaran Harta Tanah - Analisis Vintaj bagi Pinjaman Perumahan dalam Sistem Perbankan
2007
2008 2009
2010 2011
2012 2013 2014 2015 2016 2017 2018 0
1
2
3
4
1 12
Kadar mungkir (%)
Bulan dalam buku
Nota: Data termasuk pinjaman terjejas yang dihapus kira oleh bank
Sumber: Bank Negara Malaysia
Financial Stability Rebiew 2018.indd 12 25/09/2018 6:51 PM

13Financial Stability Review - First Half 2018
Banks are resilient to withstand severe shocks from property market and related sectors developments
Overall, the impaired loan ratio for the non-residential property segment remained low at 1.4% as at end-June 2018 (2017: 1.2%). Vintage default rates for loans to purchase non-residential properties continued to show improvement (Chart 7). Banks also continue to have sufficient capital buffers to absorb any potential losses arising from a severe property price correction and the potential spillovers to other industries that are highly dependent on the performance of the property sector (for detailed information on the sensitivity analysis, refer to BNM Financial Stability and Payment Systems Report 2017, Chapter 1, Info Box on ‘Can Banks Absorb Potential Shocks from the Property Sector? A Sensitivity Analysis’).
Vintage default rates of non-residential property loansoriginated since 2007 continued to improve
Chart 7: Property Market – Vintage Analysis for Non-Residential Property Loans in the Banking System
2007 2008
2009 2010
2011 2012 2013 2014 2015 2016 2017 2018 0
1
2
3
1
Default rate (%)
Months on book
Note: Data include impaired loans written off by banks
Source: Bank Negara Malaysia
Kadar mungkir vintaj bagi pinjaman harta bukan kediaman yang diluluskan sejak 2007 bertambah baik
Rajah 7: Pasaran Harta Tanah – Analisis Vintaj bagi Pinjaman Harta Bukan Kediaman dalam Sistem Perbankan
2007 2008
2009 2010
2011 2012 2013 2014 2015 2016 2017 2018 0
1
2
3
1
Kadar mungkir (%)
Bulan dalam buku
Nota: Data termasuk pinjaman terjejas yang dihapus kira oleh bank
Sumber: Bank Negara Malaysia
24 36 48 60 72 84 96 108 120 132 12
24 36 48 60 72 84 96 108 120 132 12
73.6% of total NFC debt. Outstanding bonds and sukuk7 expanded by 14.1%, accounting for 30% of total NFC debt. Loans from banks and DFIs also grew higher by 2.2% (December 2017: 1.3%), mainly from the expansion in loans to SMEs, by 4.6%.
Notwithstanding heightened uncertainty in business conditions, particularly in the second quarter, there were no signs of broad-based credit tightening among banks. Overall business loan rejection rates remained stable at 16.3% (5-year average: 16%), although in some sectors with a weaker credit risk outlook, such as construction, real estate and mining & quarrying, marginally higher rejection rates were observed.
Total outstanding corporate external debt increased by 8.7% as at end-June 2018 (December 2017: -4.4%), driven mainly by new borrowings in the manufacturing sector, bulk of which was for a specific petrochemical project with a natural hedge of foreign currency export proceeds. Total corporate external debt accounted for 26.4% of total business debt or 27.8% of GDP (December 2017: 25.3% and 26.1%, respectively). 69% of external debt is denominated in USD, posing additional risks given the strengthening of USD in the recent period. Nonetheless, a firm-level analysis suggests that these corporates are able to withstand severe ringgit depreciation, with the median interest coverage ratio (ICR) estimated to decline to 6.2 times (pre-shock: 6.9 times).
7 Corporate bonds and sukuk excluding issuances by Cagamas, financial institutions and non-residents.
Source: Bank Negara Malaysia
% of GDP
Higher debt driven by new bond and sukuk issuances
Chart 8: Business Sector – Non-financial Corporate Debt-to-GDP Ratio
0 20 40 60 80
100 120 140
1998 2017 1H 2018
Domestic loans/financing
Domestic corporate bonds/sukuk
External debt
131.7%
102.8% 105.3%
Sumber: Bank Negara Malaysia
% daripada KDNK
Hutang lebih tinggi didorong oleh terbitan bon dan sukuk baharu
Rajah 8: Sektor Perniagaan – Nisbah Hutang Syarikat Korporat Bukan Kewangan kepada KDNK
0 20 40 60 80
100 120 140
1998 2017 ST1 2018
Pinjaman/pembiayaan domestik
Bon/sukuk korporat domestik
Hutang luar negeri
131.7% 102.8% 105.3%
Financing to Business Sector Remains Supportive of Investment Growth, Amid Weaker Debt Servicing Capacity
As at end-June 2018, aggregate non-financial corporate (NFC) debt grew at an annual rate of 7.2% to RM1,465 billion or 105.3% of GDP (Chart 8), reflecting higher growth in financing to the construction, manufacturing and real estate sectors. This was largely contributed by the growth in domestic borrowings of 6.7%, which represented
Financial Stability Rebiew 2018.indd 13 25/09/2018 6:51 PM

14 Financial Stability Review - First Half 2018
Risks to broader financial stability emanating from corporate external debt, however, remained largely mitigated. About two-thirds of corporate external debt is medium- to longer-term debt, limiting rollover risk. Intercompany loans also constitute the largest share (30.4%) of corporate external debt, posing lower risk due to more flexible and concessionary terms. Regulatory measures in place8 have additionally served to rein in external borrowings that have no productive purposes or which expose businesses to excessive risk.
Healthy overall financial performance, although vulnerabilities may persist in certain sectors
Overall, the financial position of Malaysian firms9 remained reasonably healthy during the first half of the year amidst uncertainties leading up to the GE14. As at June 2018, aggregate leverage10 of Malaysian NFCs increased to 50.4% (2017: 47%), driven mainly by the manufacturing sector. While debt servicing capacity11 declined to 8.2 times (2017: 9.1 times) given relatively weak earnings performance across most business sectors, it remained well above the prudent threshold level of two times. The liquidity position of firms, as measured by the median cash-to-short-term debt ratio (CASTD), was stable at 1.5 times, above the one time prudent threshold. The ratio of impaired and delinquent loans were little changed at 2.6% and 0.3%, respectively (Chart 9).
Firms in the O&G-related and real estate sectors continued to face headwinds. Although oil prices have been on an upward trend, capital expenditure spending by major oil producers have yet to pick up in pace, with contract awards to O&G service providers remaining slow. Structural weaknesses in the drilling, shipping and fabrication segments are also expected to persist in the near term. The median ICR for the sector worsened in the first half of 2018 to 1.5 times (2017: 2.5
times), driven mainly by weaker earnings performance of players involved in the fabrication and floating production, storage and offloading segments (Chart 10). The liquidity position of firms in the sector also remained weak with the median CASTD at 0.5 times (2017: 0.5 times). Nonetheless, most O&G players, particularly those in the upstream segment have rationalised their debt levels. This was reflected in the lower median leverage ratio of 46.5% (2017: 56.7%). Exposures of financial institutions to O&G-related sectors remained small. Banks’ exposures (including both on- and off-balance sheet, and those via domestic banks’ overseas operations and the Labuan International Business and Financial Centre) to firms in O&G-related sectors accounted for about 6% and 19% of total business exposures and total capital, respectively, with potential credit losses already largely provided for by banks.
Source: Bank Negara Malaysia
Ratio (%)Overall quality of lending remains sound
0
1
2
3
4
M J S D M J S D M J S D M J 2015 2016 2017 2018
Business: Gross impaired loans SME: Gross impaired loans Business: Gross delinquent loans SME: Gross delinquent loans
Sumber: Bank Negara Malaysia
Nisbah (%)Kualiti keseluruhan pinjaman kekal tinggi
Rajah 9: Sektor Perniagaan – Pinjaman Terjejas Kasar dan Pinjaman Delinkuen Kasar
Chart 9: Business Sector – Gross Impaired Loans and Gross Delinquent Loans
0
1
2
3
4
M J S D M J S D M J S D M J 2015 2016 2017 2018
Perniagaan: Pinjaman terjejas kasar
PKS: Pinjaman terjejas kasar
Perniagaan: Pinjaman delinkuen kasar
PKS: Pinjaman delinkuen kasar
Sectors with weaker credit risk outlook exhibitedworsening financial performance
0
4
8
0
1
2 6.6 6.5
6.6 6.5
0.70.51.5
0.70.51.5
0.90.5
2.5
0.90.5
2.5
2017 1H 2018*
CASTD: Oil & gas CASTD: Property ICR: Oil & gas (RHS) ICR: Property (RHS)
Times Times
* Twelve months ending June 2018Note: Prudent thresholds for ICR and CASTD are two times and one time, respectively
Source: Bloomberg and Bank Negara Malaysia estimates
Chart 10: Business Sector – Liquidity and Debt Servicing Capacity Indicators for Selected Sectors
Sektor yang mempunyai prospek risiko kredit lebih lemah menunjukkan prestasi kewangan yang merosot
0
4
8
0
1
2
2017 ST1 2018*
Nisbah tunai kepada hutang jangka pendek: Minyak & gas Nisbah tunai kepada hutang jangka pendek: Harta tanah Nisbah perlindungan faedah: Minyak & gas (skala kanan)Nisbah perlindungan faedah: Harta tanah (skala kanan)
Kali Kali
* Dua belas bulan berakhir Jun 2018Nota: Ambang kehematan bagi nisbah perlindungan faedah dan nisbah tunai kepada
hutang jangka pendek masing-masing adalah dua kali dan satu kali
Sumber: Bloomberg dan anggaran Bank Negara Malaysia
Rajah 10: Sektor Perniagaan – Penunjuk Mudah Tunai dan Keupayaan Membayar Balik Hutang bagi Sektor Terpilih
8 Firms must obtain the Bank’s approval for foreign currency-denominated (FCY) borrowings in aggregate amounts exceeding the equivalent of RM100 million from non-resident financial institutions, special purpose vehicles and other unrelated entities. Firms must be able to demonstrate adequate debt servicing capacity from FCY revenue streams or through the use of financial derivatives to hedge against currency risks. Such borrowings must also be for productive purposes.
9 Based on financial data of 120 companies that are listed on Bursa Malaysia, covering major economic sectors and about 85% of market capitalisation (excluding financial institutions).
10 Measured by the median debt-to-equity ratio.11 Measured by the ICR, using data for the twelve months ending June 2018.
Financial Stability Rebiew 2018.indd 14 25/09/2018 6:51 PM

15Financial Stability Review - First Half 2018
12 Large NFC borrower groups represent corporations with aggregate credit exposures (includes direct financing and holdings of corporate bonds and sukuk) exceeding RM1 billion with Malaysian financial institutions.
In the real estate sector, the sluggish sales performance within the primary market continued to weigh on earnings of businesses. The debt servicing capacity of property developers remained stable with the median ICR at 6.5 times in the first half of 2018 (2017: 6.6 times). The liquidity position of property developers also slightly moderated to 0.7 times (2017: 0.9 times). Nonetheless, firm demand in the affordable housing segment should lend support to business performance going forward as developers step up efforts to clear existing inventories and review strategies for new developments. The review of mega infrastructure projects by the new government has also impacted some construction and property development businesses. However, financial institutions’ exposures to affected businesses remain small, at 3.5% of total business lending and holding of corporate debt instruments.
Financial institutions’ exposures to large borrower groups12 declined to 41.1% (December 2017: 42.2%) of exposures to the business sector as at end-June 2018. While the CASTD of large borrowers fell to 0.9 times (2017: 1 time), they remain well-placed to service their debt with the median ICR above prudent threshold at 6.5 times (2017: 7.2 times). Credit exposures of financial institutions to weaker large borrower groups with an ICR below two times, declined to 5.0% (December 2017: 5.2%) of total business exposures of banks and DFIs, and 0.8% (December 2017: 1.1%) of business exposures of insurers and takaful operators. These exposures are largely to borrowers in the O&G sector.
The majority of large borrower groups is expected to be able to support debt repayments in the event of a substantial decline in profitability, significant weakening of the ringgit and higher borrowing costs. Under a scenario of simulated severe shocks (that is, up to 30% depreciation in the ringgit, a 50% decline in operating profit and 50 and 200 basis points increase in borrowing costs for RM and FCY borrowings, respectively), cumulative potential credit losses from exposures to large borrower groups would remain comfortably within banks’ excess capital buffers. These buffers currently stand at about three times the estimated potential credit losses.
For the second half of 2018, the implementation of the Sales and Services Tax (SST) in September could have a transitory impact on the sales performance of the services and manufacturing sectors, as consumers adjust their spending patterns. Nonetheless, SMEs could benefit from more favourable cash flows under the new tax regime. The business performance of firms in the agriculture and O&G sectors could also be affected by supply disruptions, which are expected to persist until end 2018. Nonetheless, business earnings for most other sectors would be supported by continued positive consumer and business sentiments, higher retail spending during the tax-free period, as well as favourable demand and stable labour market conditions.
MARKET RISK
Domestic Financial Markets Remained Orderly Despite Increased Market Stress
Orderly conditions in the financial markets continued to be preserved amid heightened volatility in the first half of 2018. Indicators of financial market stress as reflected by the Financial Market Stress Index (FMSI) trended upwards (June 2018: 11.7%; December 2017: 8.3%) (Chart 11). In early 2018, investors’ sentiment around the region, including in Malaysia, was affected by external developments including uncertainties surrounding the pace of monetary policy normalisation in the US, escalating trade tensions between the major economies and rising geopolitical risks. Domestically, policy uncertainty following the outcome of the GE14 also contributed to increased market volatility.
In the first half of 2018, total portfolio investments registered a net outflow of RM40.9 billion (Chart 12). Non-residents recorded net portfolio investment outflows of RM29.3 billion. Meanwhile, portfolio investments abroad by resident investors contributed to net outflows of RM11.6 billion (2H 2017: net outflow of RM4.6 billion).
Financial Stability Rebiew 2018.indd 15 25/09/2018 6:51 PM

16 Financial Stability Review - First Half 2018
Malaysian Government Securities (MGS) yields rose between 17 and 32 basis points across the three- to ten-year tenures in the first half of 2018, in line with the rising US treasury yields (Chart 13). Sizeable outflows by non-residents from the Malaysian government bond market saw a decline in non-resident holdings of outstanding government bonds to 23.7% (December 2017: 27.7%) as at end-June 2018. Notwithstanding this, market liquidity in the MGS market remained intact, with stable average bid-ask spreads at 0.1% of the mid-price (2H 2017: 0.1%). The strong presence of domestic institutional investors, including financial institutions, has continued to provide support and liquidity to the domestic financial markets, thus preserving orderly market conditions. During the period, domestic investors increased their government bond holdings by RM53.4 billion. A higher proportion of stable and long-term non-resident investors in the government bond market has also contributed to greater market stability (Chart 14).
In the equity market, the FBM KLCI rallied to an all-time high of 1,895.2 points in April ahead of GE14 before a reversal to 1,691.5 points by end-June amid a confluence of external factors which also affected regional markets as a whole (1H 2018: -5.9%) (Chart 15). Net outflows by non-residents from the Malaysian equity market amounted to RM6.8 billion. For the first half of 2018, the impact of foreign attrition from the equity market was offset by increased participation by domestic institutional investors amounting to RM6.3 billion, on the back of more attractive valuations. Liquidity in the equity market remained intact with stable average bid-ask spreads at 0.4% of the mid-price (2H 2017: 0.4%). The price-to-earnings ratio of FBM KLCI stood at 17.4 times (2000-2017 average: 16.8 times).
In contrast to most regional currencies, the ringgit strengthened against the US dollar by 5.3% in March from end-2017 before ending the first half of 2018 at RM4.0385 against the US dollar (YTD
appreciation of 0.6% for the first half of 2018) (Chart 16). The market recorded a healthy daily average FX transaction volume of USD11.7 billion (2H 2017 average: USD10.1 billion), as the measures introduced in late 2016 continued to deliver their intended effect of rebalancing ringgit demand and supply in line with economic activity. Daily average USD/RM bid-ask spreads widened slightly to 38 pips (2H 2017: 32 pips). Going forward, regional currencies including the ringgit will continue to be influenced by external developments, in particular broad US dollar strength.
Financial institutions continued to actively manage market risk exposures
Active risk management and hedging by banks continued to contain market risk exposures at manageable levels, well within prudent value-at-risk and loss limits set by individual banks. Banks’ FX net open position accounted for only 5.2% of total capital (December 2017: 6.1%; average 2014-2017: 6.2% of total capital). Interest rate risk in the trading book and equity risk also remained low at 1.2% and 0.7% (December 2017: 1% and 1.9%) of total capital, respectively. Interest rate risk in the banking book rose to 4.2% (December 2017: 3.7%) of total capital, as banks increased holdings of longer maturity goverment bonds.
Insurers and takaful operators also continued to actively manage their market risk exposures while maintaining prudent risk-taking behaviour. Equity holdings remained stable ahead of GE14 at 12.9% of total assets (December 2017: 13%) before being pared down to 11.7% amidst the weaker equity market performance post-election. Capital allocated for equity risk correspondingly decreased to 8.1% (December 2017: 9.1%) of total capital available, contributing to lower market risk capital charges of 14.1% of total capital available (December 2017: 15.4%). Similarly, interest rate risk declined to 2.5% of total capital available (December 2017: 3%) as market yields increased.
Financial Stability Rebiew 2018.indd 16 25/09/2018 6:51 PM

17Financial Stability Review - First Half 2018
Source: Bank Negara Malaysia, Bloomberg, Reuters and Department of Statistics, Malaysia
Tekanan pasaran keseluruhan meningkat pada separuh tahun 2018
Bon Ekuiti
WangPertukaran asing
Institusi kewangan Tekanan sistemik
Rajah 11: Pasaran Kewangan – Indeks Tekanan Pasaran Kewangan (FMSI)
FMSI
Sumber: Bank Negara Malaysia
-5
0
5
10
15
20
25
2016 2017 2018
Tahap tekanan, % (Berlapis; Minimum=0, Maksimum=100)
2018
Overall market stress increased in first half of 2018
Chart 11: Financial Market – Financial Market Stress Index (FMSI)
Money Foreign exchange (FX)
Systemic stress
Bonds Equity
Financial institutions (FI) FMSI
-5 0 5 10 15 20 25
2016 2017
Stress level, % (Stacked; Minimum=0, Maximum=100)
Aliran portfolio bersih MGS, 3 tahun (skala kanan) MGS, 10 tahun (skala kanan)
Rajah 13: Pasaran Kewangan – Kadar Hasil MGS, Kadar Hasil Bon Korporat dan Aliran Portfolio Bersih Suku Tahunan
AAA, 3 tahun (skala kanan) AAA, 10 tahun (skala kanan)
Sumber: Bank Negara Malaysia
Kadar hasil MGS semakin meningkat sebahagiannyadidorong kadar hasil perbendaharaan AS yang lebih tinggi
2.0
2.5
3.0
3.5
4.0
4.5
5.0
-40
-30
-20
-10
10
20
30
M J S D M J S D M J
2016 2017 2018
0
RM bilion %
Net portfolio flows MGS, 3-year (RHS) MGS, 10-year (RHS)
Chart 13: Financial Market – MGS Yields, Corporate Bond Yields and Quarterly Net Portfolio Flows
AAA, 3-year (RHS) AAA, 10-year (RHS)
Rising MGS yields partially driven by higher US treasury yields
2.0 2.5 3.0 3.5 4.0 4.5 5.0
-40 -30 -20 -10
10 20 30
M J S D M J S D M J 2016 2017 2018
0
RM billion %
Jun 2018 Dec 2016 Dec 2017
Higher proportion of long-term non-resident investors contributed to greater stability in the market
Chart 14: Financial Market – Distribution of Non-resident (NR) Holdings of Government Bonds
Short-term NR investors
0
10
20
30
40
50
60
Long-term NR investors
Medium-term NR investors
%
Dis 2016 Dis 2017 Jun 2018
Peratusan pelabur bukan pemastautin jangka panjang yang lebih tinggi menyumbang kepada kestabilan pasaran
Rajah 14: Pasaran Kewangan – Pengagihan Pemegangan Bon Kerajaan oleh Bukan Pemastautin
Sumber: Bank Negara Malaysia
0
10
20
30
40
50
60
Pelabur bukan pemastautin pangka
panjang
Pelabur bukan pemastautin jangka
sederhana
Pelabur bukan pemastautin jangka
pendek
%
1H 2018 2H 2017
FBM KLCI experienced large sell-off, with performance in line with regional markets
Chart 15: Financial Market – Performance of Regional Equity Markets
-20 -15 -10 -5 0 5 10 15
Malaysia
Philippines
Indonesia
Singapore
Thailand
%
ST1 2018 ST2 2017
FBM KLCI mengalami penjualan yang ketara, dengan prestasi seiring dengan pasaran serantau
Rajah 15: Pasaran Kewangan – Prestasi Pasaran Ekuiti Serantau
Sumber: Bloomberg
-20 -15 -10 -5 0 5 10 15
Malaysia
Filipina
Indonesia
Singapura
Thailand
%
ST1 2018 ST2 2017
Kebanyakan mata wang serantau menyusut nilai berbanding dolar AS, kecuali ringgit
Rajah 16: Pasaran Kewangan – Prestasi Mata Wang Serantau berbanding Dolar AS
Sumber: Bank Negara Malaysia danBloomberg
1H 2018 2H 2017
Most regional currencies depreciated against the US dollar, except ringgit
Chart 16: Financial Market – Performance of Regional Currencies against US dollar
-8 -6 -4 -2 0 2 4 6 8
Malaysia
Philippines
Indonesia
Singapore
Thailand
DXY (USD strength)
%
-8 -6 -4 -2 0 2 4 6 8
Malaysia
Filipina
Indonesia
Singapura
Thailand
DXY (kekuatan dolar AS)
%
English
!17%
!13.3%
Banking sector
Chart 12: Financial Market – Net and Gross Portfolio Flows and Ringgit Exchange Rate Movement
Resident flows Non-resident flows Net portfolio flows USD/RM (RHS)
2.50
3.00
3.50
4.00
4.50
5.00
-40 -30 -20 -10
0 10 20 30
M J S D M J S D M J 2016 2017 2018
USD/RM RM billion
Reversal of portfolio inflows mainly in the second quarter of 2018
Aliran pemastautin Aliran bukan pemastautin Aliran portfolio bersih
Rajah 12: Pasaran Kewangan – Aliran Portfolio Bersih dan Kasar serta Pergerakan Kadar Pertukaran Ringgit
USD/RM (skala kanan)
Sumber: Bank Negara Malaysia dan Jabatan Perangkaan Malaysia
2.50
3.00
3.50
4.00
4.50
5.00
-40
-30
-20
-10
0
10
20
30
M J S D M J S D M J
2016 2017 2018
USD/RM RM bilion
Aliran masuk portfolio bertukar arah terutamanya pada suku kedua 2018
Financial Stability Rebiew 2018.indd 17 25/09/2018 6:51 PM

18 Financial Stability Review - First Half 2018
LIQUIDITY AND FUNDING RISK
Banking System Maintained Sufficient Liquidity to Meet Exigent Needs
Liquidity and funding conditions remained conducive to support financial intermediation throughout the first half of 2018 despite heightened market volatility observed in 2Q 2018. Banking system liquidity comprising placements, reverse repos and statutory reserves with the Bank remained ample (June 2018: RM156.2 billion; December 2017: RM176.2 billion) to meet liquidity needs of banks. The funding structure of the banking system remained unchanged, with deposits constituting the bulk of total bank equity and liabilities (69%) (Chart 17).
The growth of bank deposits continued to trend upwards (June 2018: 5.1%; December 2017: 4.1%). This was partly driven by deposits from individuals which grew at a higher rate of 5.4% (December 2017: 3.9%). Recent growth trends in individuals’ deposits remained lower than that seen earlier in the decade partly due to some preferring to invest in higher-yielding assets such as unit trust funds and equities, and higher costs of living. Deposits from non-residents remained relatively stable, even during recent periods of sizeable outflows and increased market volatility post-GE14, accounting for about 4.7% of banking system deposits (end-2017: 4.9%).
Banks continued to diversify their funding base to better manage maturity and currency mismatches. Issuances of banks’ equity and debt instruments expanded by 3.4%, outpacing the growth of assets of 3% as at end-June 2018. Given this continued trend, the banking system’s loan-to-fund (LTF) and loan-to-fund-and-equity ratios (LTFE), which capture the broader funding base of banks, stood at 83.9% and 73.2%, respectively (end-2017: 83.9% and 73.5%, respectively) (Chart 18). The industry-level Basel III Liquidity Coverage Ratio (LCR) stood at 139.3%, providing comfortable liquidity buffers to withstand any funding shock over a 30-day period. All banks continued to record LCR levels above the transitional regulatory minimum requirement of 90% in 2018.
Banks’ funding costs increased in February 2018 following the 25 basis points (bps) hike in the overnight policy rate (OPR) in January 2018 but has since stabilised. The average cost of deposits was at 2.60% (end-February 2018: 2.53%; end-2017: 2.51%) while the 3-month Kuala Lumpur Interbank Offered Rate (KLIBOR) remained stable at 3.69%
0
20
40
60
80
100
2013 2014 2015 2016 2017 Jun-18
Individual Business enterprise
Banking institutions Government
Non-bank financial institutions Others
%
Deposits from households and businesses account for 73% of total bank deposits
Chart 17: Banking System – Composition of Deposits by Holder
Source: Bank Negara Malaysia
0
20
40
60
80
100
2013 2014 2015 2016 2017 Jun-18
Individu Perusahaan perniagaan
Institusi perbankan Kerajaan
Institusi kewangan bukan bank Lain-lain
%
Deposit isi rumah dan perniagaan mencakupi 73% daripada jumlah deposit bank
Rajah 17: Sistem Perbankan – Komposisi Deposit mengikut Penyimpan
Sumber: Bank Negara Malaysia
Banking system liquidity sufficient to support financial intermediation activities
Chart 18: Banking System – Basel III Liquidity Coverage Ratio, Loan-to-Fund Ratio and Loan-to-Fund-and-Equity Ratio
Source: Bank Negara Malaysia
100
120
140
160
40
60
80
100
J F M A M J J A S O N D J F M A M J 2017 2018
Loan-to-fund ratio Loan-to-fund-and-equity ratio Liquidity coverage ratio (RHS)
% %
Mudah tunai sistem perbankan mencukupi untuk menyokong aktiviti pengantaraan kewangan
Rajah 18: Sistem Perbankan – Nisbah Perlindungan Mudah Tunai Basel III, Nisbah Pinjaman kepada Dana dan Nisbah Pinjaman kepada Dana dan Ekuiti
Sumber: Bank Negara Malaysia
100
120
140
160
40
60
80
100
J F M A M J J O S O N D J F M A M J 2017 2018
Nisbah pinjaman kepada dana Nisbah pinjaman kepada dana dan ekuiti Nisbah perlindungan mudah tunai (skala kanan)
% %
Financial Stability Rebiew 2018.indd 18 25/09/2018 6:51 PM
19Financial Stability Review - First Half 2018
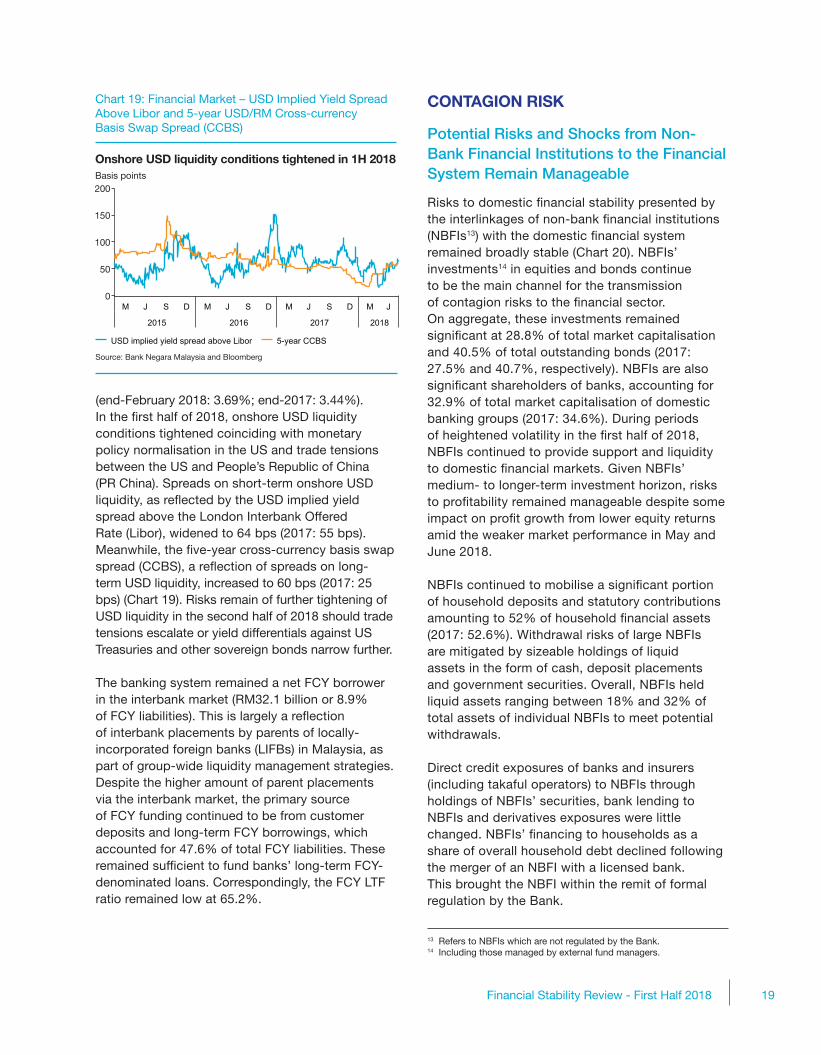
(end-February 2018: 3.69%; end-2017: 3.44%).In the first half of 2018, onshore USD liquidity conditions tightened coinciding with monetary policy normalisation in the US and trade tensions between the US and People’s Republic of China (PR China). Spreads on short-term onshore USD liquidity, as reflected by the USD implied yield spread above the London Interbank Offered Rate (Libor), widened to 64 bps (2017: 55 bps). Meanwhile, the five-year cross-currency basis swap spread (CCBS), a reflection of spreads on long-term USD liquidity, increased to 60 bps (2017: 25 bps) (Chart 19). Risks remain of further tightening of USD liquidity in the second half of 2018 should trade tensions escalate or yield differentials against US Treasuries and other sovereign bonds narrow further.
The banking system remained a net FCY borrower in the interbank market (RM32.1 billion or 8.9% of FCY liabilities). This is largely a reflection of interbank placements by parents of locally-incorporated foreign banks (LIFBs) in Malaysia, as part of group-wide liquidity management strategies. Despite the higher amount of parent placements via the interbank market, the primary source of FCY funding continued to be from customer deposits and long-term FCY borrowings, which accounted for 47.6% of total FCY liabilities. These remained sufficient to fund banks’ long-term FCY-denominated loans. Correspondingly, the FCY LTF ratio remained low at 65.2%.
Source: Bank Negara Malaysia and Bloomberg
Onshore USD liquidity conditions tightened in 1H 2018
Chart 19: Financial Market – USD Implied Yield Spread Above Libor and 5-year USD/RM Cross-currency Basis Swap Spread (CCBS)
Basis points
0
50
100
150
200
M J S D M J S D M J S D M J
2015 2016 2017 2018
USD implied yield spread above Libor 5-year CCBS
Sumber: Bank Negara Malaysia dan Bloomberg
Keadaan mudah tunai dolar AS dalam negeri menjadi ketat pada ST1 2018
Rajah 19: Pasaran Kewangan – Spread Kadar Hasil Tersirat Dolar AS Melebihi Libor dan Spread Swap Asas Mata Wang Bersilang (CCBS) USD/RM 5 tahun
Mata asas
0
50
100
150
200
M J S D M J S D M J S D M J
2015 2016 2017 2018
Spread kadar hasil tersirat dolar AS melebihi Libor CCBS 5 tahun
CONTAGION RISK
Potential Risks and Shocks from Non-Bank Financial Institutions to the Financial System Remain Manageable
Risks to domestic financial stability presented by the interlinkages of non-bank financial institutions (NBFIs13) with the domestic financial system remained broadly stable (Chart 20). NBFIs’ investments14 in equities and bonds continue to be the main channel for the transmission of contagion risks to the financial sector. On aggregate, these investments remained significant at 28.8% of total market capitalisation and 40.5% of total outstanding bonds (2017: 27.5% and 40.7%, respectively). NBFIs are also significant shareholders of banks, accounting for 32.9% of total market capitalisation of domestic banking groups (2017: 34.6%). During periods of heightened volatility in the first half of 2018, NBFIs continued to provide support and liquidity to domestic financial markets. Given NBFIs’ medium- to longer-term investment horizon, risks to profitability remained manageable despite some impact on profit growth from lower equity returns amid the weaker market performance in May and June 2018.
NBFIs continued to mobilise a significant portion of household deposits and statutory contributions amounting to 52% of household financial assets (2017: 52.6%). Withdrawal risks of large NBFIs are mitigated by sizeable holdings of liquid assets in the form of cash, deposit placements and government securities. Overall, NBFIs held liquid assets ranging between 18% and 32% of total assets of individual NBFIs to meet potential withdrawals.
Direct credit exposures of banks and insurers (including takaful operators) to NBFIs through holdings of NBFIs’ securities, bank lending to NBFIs and derivatives exposures were little changed. NBFIs’ financing to households as a share of overall household debt declined following the merger of an NBFI with a licensed bank. This brought the NBFI within the remit of formal regulation by the Bank.
13 Refers to NBFIs which are not regulated by the Bank.14 Including those managed by external fund managers.
Financial Stability Rebiew 2018.indd 19 25/09/2018 6:51 PM

20 Financial Stability Review - First Half 2018
Contagion Risk from External Exposures of Banks and Insurers Remains Manageable
As at end-June 2018, the net external liabilities of Malaysian banks widened to RM195.6 billion. Excluding banks operating in Labuan International Business and Financial Centre (LIBFC), external liabilities of onshore banks15 increased by 8% to RM331.9 billion (December 2017: RM307.2 billion). This reflected precautionary efforts taken by several domestic banking groups (DBGs) to reinforce FCY liquidity buffers via interbank borrowings. The increase in interbank borrowings was also driven partly by higher foreign bank placements with their Malaysian banking subsidiaries. These were channelled mainly towards FCY lending in the domestic interbank market and short-term investments. External liabilities of LIBFC banks also increased by 17.7% to RM156.3 billion (December 2017: RM132.8 billion), reflecting predominantly placements by related entities to fund FCY intermediation activities. Liquidity and funding risks are limited for LIBFC banks given that a significant proportion of these borrowings is from related parties and ‘back-to-back’16 in nature. Correspondingly, banks’ external debt17 grew to RM353.2 billion (December 2017: RM312.1 billion),
representing 72% of total external liabilities, while external assets increased to RM292.6 billion (December 2017: RM257 billion).
There is little sign of undue reliance on external and cross-currency funding among onshore banks. The domestic operations of Malaysian banks continued to be funded predominantly by ringgit-denominated domestic funding sources. Onshore banks’ external debt comprised less than 8% of total banking system liabilities, and non-residents accounted for only 4.7% of total banking system deposits. To support their FCY lending activities, onshore banks relied primarily on stable FCY funding sources such as customer deposits and medium- to long-term borrowings, roughly half of which were locally sourced. Consequently, the FCY LTF ratio rose to 65.2% (2017: 61.7%).
Expansion of Banks’ External Exposures Reflects Proactive Funding and Liquidity Management Practices
Structurally, the profile and activities of Malaysian banks’ external exposures remain relatively unchanged and continue to support manageable funding, liquidity and market risks (Charts 21, 22 and 23). Capital funds maintained in Malaysia by LIFBs represent 11.7% of overall external liabilities. 42.2% of external debt is in the form of interbank borrowings from related counterparties (i.e. intra-group placements), which are less likely to be subjected to sudden
15 Refers to domestic banking groups and locally-incorporated foreign banks (LIFBs).
16 Funding received from the related office typically matches financing extended in terms of amount, currency and tenure.
17 External debt refers to all external liabilities that require payment of principal and/or interest. In addition to external debt, external liabilities comprise (i) custodial securities held on behalf of non-resident (NR) clients, (ii) capital funds maintained by NR in resident banks, primarily for LIFBs and (iii) financial derivative balances.
Chart 20: Interlinkages of NBFIs with the Financial System
No material change to channels and magnitude of NBFIs’ interlinkages with the financial system
0 10 20 30 40 50 60 %
0 10 20 30 40 50 60 %
Financing to households(% of household debt)
Derivatives transactions with banks(% of banking system capital)
Deposits with banks(% of banking system deposit base)
Borrowings from banks(% of banking system capital)
NBFI debt securities held by banks and insurers(% of banking system and insurance sector capital)
Investment in equities(% of equity market capitalisation)
Shareholding in banks(% of equity of listed banks)
Investment in debt securities(% of debt securities outstanding)
Deposits and contributions from households(% of household financial assets)
2017 1H 2018
Source: Bank Negara Malaysia, Securities Commission Malaysia, Malaysia Co-operative Societies Commission, published financial statements and internal estimates
Tiada perubahan material kepada saluran dan magnitud kesalinghubungan IKBB dengan sistem kewangan
Rajah 20: Kesalinghubungan IKBB dengan Sistem Kewangan
2017 ST1 2018
Sumber: Bank Negara Malaysia, Suruhanjaya Sekuriti Malaysia, Suruhanjaya Koperasi Malaysia, penyata kewangan yang diterbitkan dan anggaran dalaman
Pembiayaan kepada isi rumah(% daripada hutang isi rumah)
Transaksi derivatif dengan bank(% daripada modal sistem perbankan)
Deposit dengan bank(% daripada asas deposit sistem perbankan)
Peminjaman daripada bank(% daripada modal sistem perbankan)
Sekuriti hutang IKBB yang dipegang bank dan penanggung insurans(% daripada modal sistem perbankan dan sektor insurans)
Pelaburan dalam ekuiti(% daripada permodalan pasaran ekuiti)
Pegangan saham dalam bank(% daripada ekuiti bank yang tersenarai)
Pelaburan dalam sekuriti hutang(% daripada sekuriti hutang terkumpul)
Deposit dan sumbangan daripada isi rumah(% daripada aset kewangan isi rumah)
Financial Stability Rebiew 2018.indd 20 25/09/2018 6:51 PM

21Financial Stability Review - First Half 2018
Note: External exposures comprise on- and off -balance sheet exposures
Source: Bank Negara Malaysia
Chart 21: Banking System – External Assets and Liabilities
Rajah 21: Sistem Perbankan – Aset dan Liabiliti Luaran
Interbank Deposits & nostro Capital funds Loans Securities under custody Debt securities Equity securities Others
Antara bank Deposit & nostro Dana modal Pinjaman Sekuriti dipegang bagi pihak pelanggan
Sekuriti hutang Sekuriti ekuiti Lain-lain
Note: Banking system includes entities operating in LIBFC
Nota: Sistem perbankan termasuk entiti yang beroperasi di LIBFC
Jun '18: RM292.6 bilion Jun '18: RM488.1 bilion2017:RM257 bilion
2017:RM440 bilion
Liabiliti LuaranAset Luaran20%
6%
16% 39%
11% 6%
18%
7%
14%
41%
9%
9%
39%
21%
14%
13%
8%
46%
17%
14%
12%
7%
Jun '18: RM292.6 billion Jun '18: RM488.1 billion2017:RM257 billion
2017:RM440 billion
External LiabilitiesExternal Assets 20%
6%
16% 39%
11% 6%
18%
7%
14%
41%
9%
9%
39%
21%
14%
13%
8%
46%
17%
14%
12%
7%
External exposures of banking system reflect centralised liquidity management and strong presence of foreign banks in Malaysia
Dedahan luar sistem perbankan mencerminkan pengurusan mudah tunai berpusat dan kehadiran bank asing yang kukuh di Malaysia
Rajah 22: Sistem Perbankan – Aset dan Liabiliti Luaran DBG
Jun '18: RM133.4 bilion Jun '18: RM149.7 bilion
Aset Luaran2017:
RM123.2 bilion
22%
8%
33%
12%
15%
8% 19%
10%
30%
10%
14%
15%
Liabiliti Luaran2017:
RM135.2 bilion
27%
37%
4%
24%
5%
37%
30%
5%
22%
4%
Antara bank Deposit & nostro Dana modal Pinjaman Sekuriti dipegang bagi pihak pelanggan
Sekuriti hutang Sekuriti ekuiti Lain-lain
Chart 22: Banking System – External Assets and Liabilities of DBGs
Jun '18: RM133.4 billion Jun '18: RM149.7 billion
External Assets2017:
RM123.2 billion
22%
8%
33%
12%
15%
8% 19%
10%
30%
10%
14%
15%
External Liabilities 2017:
RM135.2 billion
27%
37%
4%
24%
5%
37%
30%
5%
22%
4%
Interbank Deposits & nostro Capital funds Loans Securities under custody Debt securities Equity securities Others
Capital funds and placements with overseas operations formed bulk of DBGs' external assets
Dana modal dan penempatan antara bank dengan pejabat yang berkaitan di luar negeri membentuk sebahagian besar aset luaran DBG Jun '18: RM44.9 billion
External Assets External Liabilities
2017:RM43.3 billion
7% 8%
63%
4%
10%
4% 7%
4%
11% 11%
66%
5%
Jun '18: RM182.2 billion
Stable capital funds and securities under custody formed the bulk of LIFBs' external liabilities
Chart 23: Banking System – External Assets and Liabilities of LIFBs
Interbank Deposits & nostro Capital funds Loans Securities under custody Debt securities Others
Dana modal dan sekuriti dipegang bagi pihak pelanggan membentuk sebahagian besar liabiliti luaran LIFB
Rajah 23: Sistem Perbankan – Aset dan Liabiliti Luaran LIFB
Antara bank Deposit & nostro Dana modal Pinjaman Sekuriti dipegang bagi pihak pelanggan
Sekuriti hutang Lain-lain
2017:RM172.0 billion
12%
20%
30%
34%
1% 16%
17%
30%
31%
1%
2% 2%
3%
1%
Jun '18: RM44.9 bilion
Aset Luaran Liabiliti Luaran
2017:RM43.3 bilion
7% 8%
63%
4%
10%
4% 7%
4%
11% 11%
66%
5%
Jun '18: RM182.2 bilion 2017:RM172.0 bilion
12%
20%
30%
34%
1% 16%
17%
30%
31%
1%
2% 2%
3%
1%
Financial Stability Rebiew 2018.indd 21 25/09/2018 6:51 PM

22 Financial Stability Review - First Half 2018
withdrawal shocks. This sizeable share of intra-group placements reflects largely the pooling and redistribution of excess liquidity among related entities within regionally-active DBGs and LIFBs which are part of global banking groups. Local liquidity regulations applied by financial authorities to entities within each group further mitigate liquidity risks. Medium- to long-term debt securities issued by DBGs to meet capital and liquidity requirements account for 10.1% of external debt. 16.2% of banks’ external debt was denominated in ringgit, largely in the form of non-resident deposits, and thus impervious to valuation changes from ringgit exchange rate fluctuations (Chart 24).
Malaysian banks remained prudent in managing maturity and currency mismatches. Banks hold substantial liquid FCY assets that could be drawn upon to meet their external obligations without creating a claim on Bank Negara Malaysia’s international reserves. Total banks’ liquid FCY assets comprising cash and cash equivalents, short-term interbank placements and debt securities held amounted to RM90.2 billion, bolstering their capacity to mitigate the impact of potential short-term FCY liquidity shocks. In the wholesale funding market, taking into account banks’ cross-currency swap positions, banks have also maintained a net long FCY position amounting to RM29.9 billion with FCY interbank borrowings observed to be broadly matched with FCY assets in terms of amount, currency and tenure.
As part of effective liquidity management practices, banks are also required to monitor and report liquidity needs in significant currencies, including USD and SGD, on an on-going basis with contingency plans in place to meet FCY obligations. This is further supported by (i) regular stress testing across various currencies and maturity profiles; and (ii) prudent internal limits observed for interbank borrowings, FCY funding and liquidity positions as well as FCY market risk exposures. At the system level, the FX net open position of banks remained low and stable at 5.2% of total capital. Of this, USD and SGD net open positions stood at 3.7% and 0.7% of total capital, respectively. Macro stress tests conducted by the Bank continue to affirm the banking system’s resilience to external funding and currency shocks, including that associated with a withdrawal of funding from non-resident counterparties (for more details, refer to ‘Multi-year Solvency Stress Test for Banks and Insurers’).
External claims by insurers (including takaful operators) remained predominantly in the form of general reinsurance exposures. During the first half of 2018, risks ceded by Malaysian general insurers to (re)insurers overseas amounted to RM1.6 billion, or 15.7% of total business underwritten. Reinsurance arrangements continued to be driven by the large and specialised risk segments such as aviation, offshore oil-related, marine hull and engineering (Chart 25), with risks mainly ceded to (re)insurers with strong credit standings in Germany, Switzerland, and
Malaysian ringgit US dollar Singapore dollar Others
Source: Bank Negara Malaysia Note: Figures in parentheses indicate amount of external debt
Sumber: Bank Negara Malaysia Nota: Angka dalam kurungan menunjukkan jumlah hutang luar negeri
Chart 24: Banking System – External Assets and Liabilities by Currency
29.6 29.6
127.1 156.6
26.7 30.8
73.6 75.6
0
50
100
150
200
250
300
350
2017 Jun ’18
External Assets RM billion
172.1 177.9
204.9 242.1 8.8 (7.7)
(192.9)
(59.2)
(228.8)
(57.2)
8.7 (7.8) 54.3 (52.3)59.5 (59.3)
0
100
200
300
400
500
600
2017 Jun ‘18
External Liabilities RM billion
Sizeable share of external liabilities is denominated in Malaysian Ringgit
Ringgit Malaysia Dolar AS Dolar Singapura Lain-lain
Rajah 24: Sistem Perbankan – Aset dan Liabiliti Luaran Mengikut Mata Wang
29.6 29.6
127.1 156.6
26.7 30.8
73.6 75.6
0
50
100
150
200
250
300
350
2017 Jun ‘18
Aset LuaranRM bilion
0
100
200
300
400
500
600
2017 Jun ‘18
Liabiliti LuaranRM bilion
Sebahagian besar liabiliti luaran adalah dalam denominasi Ringgit Malaysia
172.1 177.9
204.9 242.1 8.8 (7.7)
(192.9)
(59.2)
(228.8)
(57.2)
8.7 (7.8) 54.3 (52.3)59.5 (59.3)
Financial Stability Rebiew 2018.indd 22 25/09/2018 6:51 PM

23Financial Stability Review - First Half 2018
the US (Chart 26). These exposures therefore pose limited counterparty risks. Meanwhile, risks ceded by life insurers remained small at less than 5% of total business underwritten. Investments abroad by Malaysian insurers and takaful operators also remained limited at 4.1% of total assets, comprising primarily equity holdings in Asia (Chart 27).
Risks from Domestic Banking Groups’ Overseas Operations to the Malaysian Banking System Remain Contained
Total assets of overseas subsidiaries and branches of DBGs (overseas assets) increased marginally by 2.1% to RM562.7 billion as at end-June 2018 (December 2017: RM551 billion). The slower pace of growth was largely due to the ringgit’s strong performance vis-à-vis regional currencies in the first quarter of 201818. At the institutional level, overseas assets represented between 6.8% and 33.7% of total assets of individual DBGs. The bulk of these exposures continued to be concentrated in Singapore (49.9%) and Indonesia (21.7%), where the DBGs have a significant presence. The primary business of overseas operations of DBGs remained in lending and investment activities and are funded predominantly by local currency deposits, with loans and holdings of investment-grade securities comprising 62.3% and 9% of overseas assets, respectively. Loans extended by the overseas operations of DBGs were largely to individual and SME borrowers, cumulatively accounting for 60.9% of total overseas operations’ loan exposures (Chart 28).
18 Excluding FX translation effects, overseas assets of DBGs expanded by 5.4%.
Licensed (re)insurers Offshore (re)insurers Foreign (re)insurers
Chart 25: General Insurance and Takaful Sector – Reinsurance Ceded Ratio
Source: Bank Negara Malaysia
0% 20% 40% 60% 80% 100%
Contractors' all risksand engineering
Marine hull
Aviation
Offshore oil-related
Motor
Penanggung insurans/insurans semula berlesen Penanggung insurans/insurans semula luar pesisir Penanggung insurans/insurans semula asing
Rajah 25: Sektor Insurans dan Takaful Am – Nisbah Insurans Semula Tersid
Sumber: Bank Negara Malaysia
0% 20% 40% 60% 80% 100%
Semua risiko kontraktor dan kejuruteraan
Kapal marin
Penerbangan
Berkaitan minyak luar pesisir
Motor
Main risks ceded out are from aviation, offshore oil-related, marine hull and engineering segments
Risiko utama yang tersid (ceded) adalah daripada segmen penerbangan, berkaitan minyak luar pesisir, kapal marin dan kejuruteraan
Equity Debt securitiesOther assets (including investment managed by private equity funds)
Chart 27: Insurance and Takaful Sector – External Investment Exposures by Region
Source: Bank Negara Malaysia
0.0 1.0 2.0 3.0 4.0
Asia
Europe
United States
Australia
RM billion
Ekuiti Sekuriti hutang Aset-aset lain (termasuk pelaburan yang diuruskan oleh dana ekuiti swasta)
Rajah 27: Sektor Insurans dan Takaful – Dedahan Pelaburan Luar Negeri Mengikut Rantau
Sumber: Bank Negara Malaysia
0.0 1.0 2.0 3.0 4.0
Asia
Eropah
Amerika Syarikat
Australia
RM bilion
External investments are mainly in liquid equitymarkets in Asia
Dedahan pelaburan kebanyakannya dalam pasaranekuiti Asia yang mudah ditunaikan
Source: Bank Negara Malaysia
Chart 26: General Insurance and Takaful Sector – Foreign-Based Reinsurance Exposures by Major Countries
RM billion
0.0 0.2 0.4 0.6 0.8 1.0 1.2
Ger
man
y
US
Switz
erla
nd
Sing
apor
e
Fran
ce
UK
Japa
n
Berm
uda
Indi
a
Aust
ralia
Sumber: Bank Negara Malaysia
Rajah 26: Sektor Insurans dan Takaful Am – Dedahan Insurans Semula Asing mengikut Negara Utama
RM bilion
0.0 0.2 0.4 0.6 0.8 1.0 1.2
Jerm
an AS
Switz
erla
nd
Sing
apur
a
Pera
ncis
UK
Jepu
n
Berm
uda
Indi
a
Aust
ralia
Reinsurance exposures are mainly to Europe and US
Dedahan insurans semula kebanyakannya padaEropah dan AS
Financial Stability Rebiew 2018.indd 23 25/09/2018 6:51 PM

24 Financial Stability Review - First Half 2018
On aggregate, DBGs’ overseas operations recorded improved earnings in the first half of 2018, on the back of improving asset quality and sustained economic growth. Earnings were further bolstered by continued efforts to enhance operational efficiency. Consequently, the profit contribution from non-Malaysian operations rose to between 0.8% and 28.2% of total group profits (December 2017: between 1.2% and 23.5%) of individual DBGs.
Risks to the domestic banking system arising from overseas operations of DBGs are closely monitored under the Bank’s consolidated supervision framework. These risks are assessed to be low, supported by strong capital and liquidity buffers as well as sound asset quality of overseas operations (Chart 29). Total capital ratios of the major overseas subsidiaries of DBGs remained high, ranging between 11% and 20.4% (December 2017: between 9.9% and 17.6%). Risks associated with cross-border funding and currency mismatches continued to be limited as local currency deposits remain the predominant source of funding for these overseas operations. The limited reliance on wholesale funding sources further insulates Malaysian parent banks against potential short-term liquidity shocks affecting their overseas operations. The major overseas subsidiaries of DBGs also maintained Basel III LCR well above 100%.
Overall asset quality of overseas operations remained sound in the first half of 2018, with the median gross impaired loans ratio of the major overseas operations19 improving to 2.3%. Banks remained vigilant and continued to take proactive measures to manage the quality of their overseas credit exposures. Of note, banks have continued to strengthen underwriting standards and provisioning practices, and intensified the monitoring of accounts which exhibit signs of potential distress amid financial market developments in the more recent period. This has been further reinforced by heightened oversight of the loan approval process and asset quality monitoring at the head office.
BANKING SECTOR
Banking Sector Maintained Sound Financial Position
The banking sector20 maintained strong capitalisation throughout the first half of 2018, with excess total capital buffers of RM105.9 billion above the regulatory minimum21 (Chart 30). A substantial portion of capital (74.9%) is in the form of highest quality loss-absorbing instruments such as paid-up capital, retained earnings
19 Refers to top 15 overseas operations of DBGs by asset size, representing 93% of total overseas assets.
20 Comprising conventional, Islamic and investment banks.21 The regulatory minimum in this context takes into account the 2018
capital conservation buffer requirement and bank-specific higher minimum requirements.
0
20
40
60
80
100
Sebahagian besar pinjaman luar negeri diberi kepadaindividu dan PKS
0
20
40
%
60
80
100
Note: Data as at end-2Q 2018
Source: Bank Negara Malaysia
Bulk of overseas loans was extended to individuals and SMEs
Chart 28: Banking System – Loan Composition of Selected Overseas Operations
Overall Singapore Indonesia Hong KongSAR
Thailand
Others Credit card Personal financing Car financing
House financing
SME Corporate
Nota: Data pada akhir S2 2018
Sumber: Bank Negara Malaysia
Rajah 28: Sistem Perbankan – Komposisi Pinjaman Operasi Luar Negeri Terpilih
Keseluruhan Singapura Indonesia Hong KongSAR
Thailand
Lain-lain Kad kredit Pembiayaan peribadi
Pembiayaan kenderaan
Pembiayaan perumahan
PKS Korporat
%
Note: Refers to median key financial soundness indicators of selected overseas operations
Source: Bank Negara Malaysia
Chart 29: Banking System – Key Financial Soundness Indicators of Selected Overseas Operations
17.6 18.4
8.1
10.9
2.4 2.3
0
5
10
15
20
4Q 2017 2Q 2018
Total capital ratio Return on equity Gross impaired loans ratio
Financial performance of overseas operations remained sound
Nota: Merujuk kepada median julat penunjuk kekukuhan kewangan utama operasi luar negeri terpilih
Sumber: Bank Negara Malaysia
Rajah 29: Sistem Perbankan – Penunjuk Kekukuhan Kewangan Utama Operasi Luar Negeri Terpilih
17.6 18.4
8.1
10.9
2.4 2.3
0
5
10
15
20
S4 2017 S2 2018
Nisbah jumlah modal
Pulangan atas ekuiti
Nisbah pinjaman terjejas kasar
Prestasi kewangan operasi luar negeri terus kukuh
Financial Stability Rebiew 2018.indd 24 25/09/2018 6:51 PM

25Financial Stability Review - First Half 2018
and reserves. Banking system capitalisation was further bolstered by new equity issuances (1H 2018: RM9.1 billion or 6.9% growth since December 2017), which helped offset the impact of the phasing out of Basel II capital instruments under the Bank’s Basel III transitional arrangements and higher provisions made under Malaysian Financial Reporting Standards 9: Financial Instruments (MFRS 9).
Strong capitalisation and sustained profitability of banks
The banking system recorded sound profitability as margins improved due to continued efficiency gains and improved asset quality. In the first half of 2018, pre-tax profits grew by 12% compared to the same period last year to RM19.3 billion (1H 2017: RM17.2 billion). Annual returns on assets and equity were mostly unchanged at 1.5% and 13.3%, respectively (2017: 1.5% and 13%, respectively) (Chart 31).Banks’ earnings performance was largely driven by sustained growth in income from financing activities (5.1%), which remains the largest component of banks’ gross income (66% of banks’ gross income). Meanwhile, total operating costs grew at a slower pace (4.6%), supported by stable administrative, marketing and general expenses (0.4%) relative to the first half of the preceding year. This resulted in a lower cost-to-income ratio (1H 2018: 43.9%; 1H 2017: 45.5%). Consequently, banks’ interest/
financing margins (net of impairment provisions and operating costs) edged marginally higher to 0.72 percentage points (2017: 0.71 percentage points). Banks’ earnings performance is expected to be sustained amid continued efforts to enhance operational efficiency.
Banks’ credit portfolio also remained sound. In the first half of 2018, newly-impaired loans declined by 5% compared to the same period last year to RM10.9 billion (1H 2017: RM11.6 billion). Accordingly, total impaired loans (net of individual impairment provisions) contracted by 10% to RM16 billion or 1% of total net loans (2017: RM17.8 billion or 1.1%). Total loan loss provisions nonetheless increased to RM24.4 billion or 1.5% of total loans as at end-June 2018 (2017: RM20.1 billion or 1.3% of total loans) following the implementation of MFRS 9. Under MFRS 9, banks are required to adopt a more forward-looking approach to provisioning, by estimating expected credit losses for credit facilities over a set time horizon and utilising a wider range of information. Consequently, banks’ loan loss coverage ratio improved to 94% of total impaired loans (December 2017: 82.2%). While higher provisioning under MFRS 9 was expected to reduce banks’ earnings, the magnitude of the impact has remained manageable, as the increase in provisions was partly absorbed by regulatory reserves already maintained by banks.
% of risk-weighted assets Banks maintained strong capitalisation
Chart 30: Banking Sector Capital Ratios
6.375 7.875
9.875
0
5
10
15
20
Common equity tier 1capital ratio
Tier 1 capital ratio Total capital ratio
Regulatory minimum Jun '17 Dec '17 Jun '18
% aset berwajaran risikoBank-bank mengekalkan tahap permodalan yang kukuh
Rajah 30: Nisbah Modal Sektor Perbankan
6.375 7.875
9.875
0
5
10
15
20
Nisbah modal ekuiti biasa kumpulan 1
Nisbah modal kumpulan 1
Nisbah jumlah modal
Tahap minimum pengawalseliaan Jun '17 Dis '17 Jun '18
Note: The minimum regulatory requirements include the capital conservation buffer for 2018 amounting to 1.875% of risk-weighted assets
Source: Bank Negara Malaysia
Nota: Keperluan minimum pengawalseliaan termasuk modal pemeliharaan penampan bagi tahun 2018 berjumlah 1.875% daripada aset berwajaran risiko
Sumber: Bank Negara Malaysia
Source: Bank Negara Malaysia
Banking profitability continued to improve
Chart 31: Banking Sector Profitability
Jun '17 Dec '17 Jun '18
Marginfaedahkasar
Marginfaedahbersih
Pulanganatas aset
Pulanganatas ekuiti
Gross interest margin
Net interest margin
0.0
0.5
1.0
1.5
2.0
2.5
ppt
0.0
0.5
1.0
1.5
2.0
Return on assets
%
0
5
10
15
Return on equity
%
Sumber: Bank Negara Malaysia
Keberuntungan perbankan semakin meningkat
Chart 31: Keberuntungan Sektor Perbankan
Jun '17 Dis '17 Jun '18
0.0
0.5
1.0
1.5
2.0
2.5
mata peratusan
0.0
0.5
1.0
1.5
2.0 %
0
5
10
15 %
Financial Stability Rebiew 2018.indd 25 25/09/2018 6:51 PM

26 Financial Stability Review - First Half 2018
INSURANCE AND TAKAFUL SECTOR
Insurance and Takaful Sector Remained Resilient with Strong Capital Position and Sound Profitability
The insurance and takaful sector remained resilient with the aggregate capital adequacy ratio (CAR) standing at 239.3% (December 2017: 233%), well above the regulatory minimum of 130% (Chart 32). Capital in excess of the minimum regulatory amount remained strong at RM30 billion. Capital held against insurance and takaful risk, which measures the risk of underestimation of insurance and takaful liabilities, adverse claims experience, expense22 and lapse23, continued to form the largest component of total capital required (47% of total capital required). This is followed by capital held against market and credit risks which stood at 34% and 9.3% of total capital required, respectively.
The insurance and takaful risk charges remained largely unchanged, reflecting the stable business mix and stable level of reserves held. Market risk exposures, which mainly comprise equity risk, trended lower in line with lower valuations observed post-GE14 and some equity disposals by insurers and takaful operators to manage their market risk exposures. Blue chip stocks24 continued to account for a significant portion of total equities held at 49%. Credit risk exposures in the forms of corporate bonds held and reinsurance claims remained stable with counterparties largely maintaining strong credit ratings and a stable outlook. 91% of corporate bonds held continued to be in the form of at least AA-rated and government-guaranteed securities.
Insurance and takaful sector remained profitable albeit weaker investment performanceOverall, the insurance and takaful sector recorded lower profitability of RM4.2 billion in the first half of 2018 compared to the same period last year (1H 2017: RM11.8 billion). Excess income over outgo of the life insurance and family takaful sector was significantly lower at RM2.9 billion (1H 2017: RM10.5 billion), driven by large net unrealised
losses in the investment portfolio amounting to RM5 billion (1H 2017: net unrealised gains of RM3.6 billion) (Chart 33). The losses were mainly attributed to equity holdings amid a weaker market performance towards the end of June 2018. Similarly, lower valuations in the bond market also contributed to overall capital losses albeit to a lesser extent. Correspondingly, the 12-month
22 Refers to expenses assumed throughout the policy contract.23 Refers to policy termination and lapse by policyholders.24 Blue chip stocks refer to stocks of the largest 30 companies by
market capitalisation on Bursa Malaysia’s main board.
Aggregate capital adequacy ratio (CAR) remain well above the regulatory minimum of 130%
Nisbah kecukupan modal (capital adequacy ratio, CAR) agregat kekal baik melebihi tahap pengawalseliaan minimum pada 130%
Chart 32: Insurance & Takaful Sector – Capital Adequacy Ratio
0
50
100
150
200
250
300
0
20
40
60
80
100
2014 2015 2016 2017 Jun 2018
%RM billion
Total capital available Total capital required Overall CAR (RHS)Insurance sector CAR (RHS)Takaful sector CAR (RHS)
Source: Bank Negara Malaysia
Rajah 32: Sektor Insurans dan Takaful – Nisbah Kecukupan Modal
0
50
100
150
200
250
300
0
20
40
60
80
100
2014 2015 2016 2017 Jun 2018
%RM bilion
Jumlah modal tersedia Jumlah modal diperlukanNisbah kecukupan modal keseluruhan (skala kanan)Nisbah kecukupan modal sektor insurans (skala kanan)Nisbah kecukupan modal sektor takaful (skala kanan)
Sumber: Bank Negara Malaysia
Balance of transactionNet investment incomeNet capital gain/(losses)Net profit/(loss) from disposal of assetsNet other income/(losses)Excess income over outgo
Chart 33: Life Insurance and Family Takaful Sector – Composition of Excess Income over Outgo
Source: Bank Negara Malaysia
-10
-5
0
5
10
15
20
1H2016 2H2016 1H2017 2H2017 1H2018
RM billion
Lower excess income over outgo driven by unrealised losses
Lebihan pendapatan berbanding perbelanjaan yangrendah hasil dorongan keuntungan tidak direalisasi
Baki transaksiPendapatan pelaburan bersihPerolehan/(Kerugian) modal bersihKeuntungan/(Kerugian) bersih daripada pelupusan asetPendapatan/(Kerugian) lain bersihLebihan pendapatan berbanding perbelanjaan
Rajah 33: Sektor Insurans Hayat dan Takaful Keluarga – Komposisi Lebihan Pendapatan Berbanding Perbelanjaan
Sumber: Bank Negara Malaysia
-10
-5
0
5
10
15
20
ST1 2016 ST2 2016 ST1 2017 ST2 2017 ST1 2018
RM bilion
Financial Stability Rebiew 2018.indd 26 25/09/2018 6:51 PM

27Financial Stability Review - First Half 2018
25 Direct distribution channels refer to distribution of products through the head office and branch premises, or an online platform. The Bank plans to issue specifications for direct offerings of critical illness, and medical and health products in 2H 2018, which will come into effect beginning 2019.
26 The tariff liberalisation of the two motor policies, which include coverage for third-party bodily injury and death commenced on 1 July 2017 as part of Phase II of the overall pricing reform. Phase 1, which took effect on 1 July 2016, allows for premiums of new motor and fire products outside the scope of the tariff to reflect market rates. Further liberalisation will be subject to a review in 2019 on the readiness of the market to support subsequent phases of liberalisation.
investment yield which consists of dividends, coupons received, realised and unrealised net gains declined to 3.1% (June 2017: 7%) of total investments. Income, however, continued to be supported by growth in total net premiums from new and existing policies, in particular investment-linked insurance policies. Net premiums from these policies maintained double-digit growth, albeit lower at 15.7% (1H 2017: 18.2%) due to a moderation in the volume of new products sold by insurers. Net premiums of investment-linked policies accounted for RM9.4 billion or 45.3% of total net premiums. Total net policy benefits paid out remained relatively stable at RM13.1 billion (1H 2017: RM12.7 billion).
New business of life insurers and family takaful operators recorded a higher growth rate of 7.7% (1H 2017: 6%), largely supported by Mortgage Reducing Term Assurance and Takaful (MRTA/MRTT) insurance policies, which grew at 18.6% (1H 2017: 13.1%). This trend is consistent with the sustained growth in housing loans during the same period. In line with the requirement for life insurers and family takaful operators to offer pure protection term products through direct channels to consumers beginning 1 July 2017, the distribution of new products through such channels25 posted stronger growth of 12.3% (1H 2017: 9.8%).
Operating profit of general insurance and takaful sector remained unchanged at RM1.3 billion. While underwriting profits increased to RM0.7 billion (1H 2017: RM0.6 billion), this was largely offset by losses from equity investments (Chart 34). The overall claims ratio decreased slightly to 58% (1H 2017: 59%). In the motor segment, some realignment between premiums and risks were observed as general insurers and takaful operators began to adopt more differentiated pricing in line with risks following the liberalisation26 of the motor ‘Comprehensive’ and ‘Third Party, Fire and Theft’ tariffs. The claims ratio of the compulsory motor
third-party bodily injury and death cover (motor ‘Act’) improved to 98.6% (1H 2017: 155.8%) while that for other motor covers increased to 63.8% (1H 2017: 60.6%). Overall, the claims ratio for the motor segment improved marginally to 70.9% (1H 2017: 72.1%).
Gross direct premiums of the general insurance and takaful sector were sustained at RM10.5 billion (1H 2017: RM10.3 billion). The motor segment continued to form the largest line of business at 48.1% of total gross direct premiums (1H 2017: 48.1%). The medical and health segment recorded higher gross direct premiums growth of 9% (1H 2017: 6.4%), due to higher demand for group medical policies and the continued increase in medical costs. The offshore oil-related business on the other hand, continued to contract by 10.9% (1H 2017: -24.7%) amidst the slow recovery in the oil and gas sector. However, the contraction has had a limited impact on overall performance of the general sector as it only accounted for less than 5% of total gross direct premiums.
Underwriting profitNet investment incomeNet capital gain/(losses)Net profit/(loss) from disposal of assetsNet other income/(losses)Operating profit/(losses)
Chart 34: General Insurance and Takaful Sector – Composition of Operating Profits
Source: Bank Negara Malaysia
Keutungan pengunderaitanPendapatan pelaburan bersihPerolehan/(Kerugian) modal bersihKeuntungan/(Kerugian) bersih daripada pelupusan asetPendapatan/(Kerugian) lain bersihKeuntungan/(Kerugian) operasi
Rajah 34: Sektor Insurans dan Takaful Am – Komposisi Keuntungan Operasi
Sumber: Bank Negara Malaysia
-1
0
1
2
1H 2016 2H 2016 1H 2017 2H 2017 1H 2018
RM billion
-1
0
1
2
ST1 2016 ST2 2016 ST1 2017 ST2 2017 ST1 2018
RM bilion
Sustained operating profits
Keuntungan operasi yang mapan
Financial Stability Rebiew 2018.indd 27 25/09/2018 6:51 PM
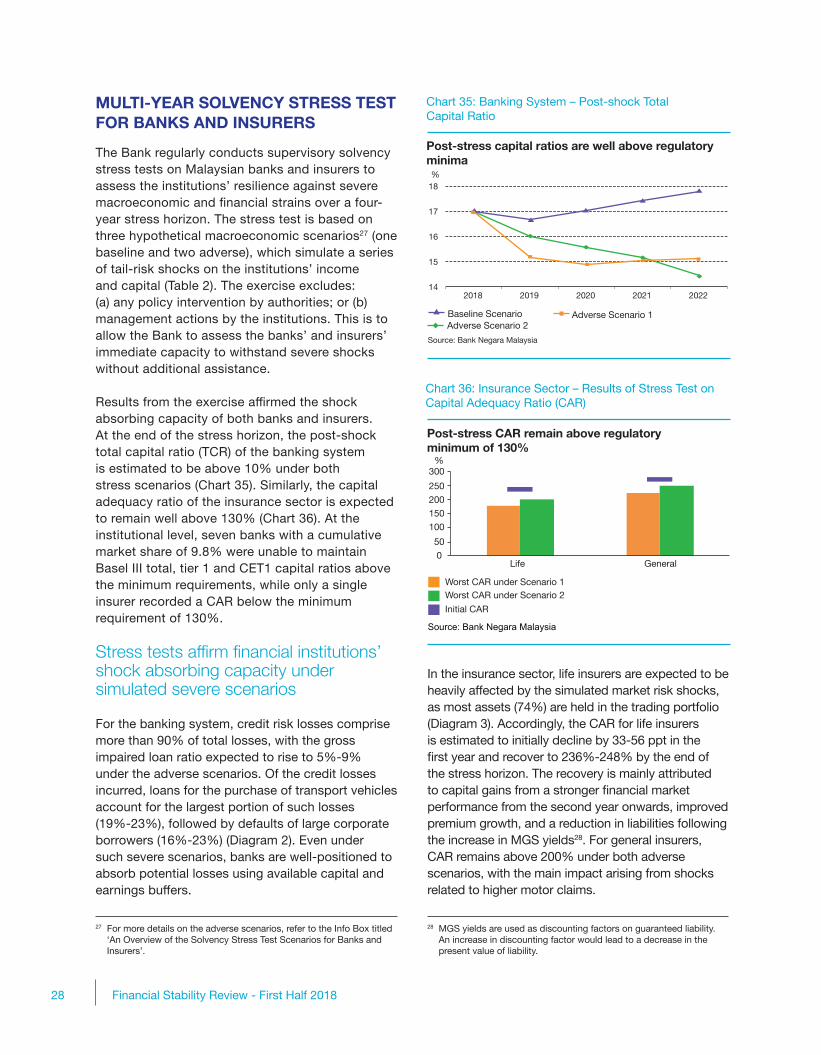
28 Financial Stability Review - First Half 2018
28 MGS yields are used as discounting factors on guaranteed liability. An increase in discounting factor would lead to a decrease in the present value of liability.
MULTI-YEAR SOLVENCY STRESS TEST FOR BANKS AND INSURERS
The Bank regularly conducts supervisory solvency stress tests on Malaysian banks and insurers to assess the institutions’ resilience against severe macroeconomic and financial strains over a four-year stress horizon. The stress test is based on three hypothetical macroeconomic scenarios27 (one baseline and two adverse), which simulate a series of tail-risk shocks on the institutions’ income and capital (Table 2). The exercise excludes: (a) any policy intervention by authorities; or (b) management actions by the institutions. This is to allow the Bank to assess the banks’ and insurers’ immediate capacity to withstand severe shocks without additional assistance.
Results from the exercise affirmed the shock absorbing capacity of both banks and insurers. At the end of the stress horizon, the post-shock total capital ratio (TCR) of the banking system is estimated to be above 10% under both stress scenarios (Chart 35). Similarly, the capital adequacy ratio of the insurance sector is expected to remain well above 130% (Chart 36). At the institutional level, seven banks with a cumulative market share of 9.8% were unable to maintain Basel III total, tier 1 and CET1 capital ratios above the minimum requirements, while only a single insurer recorded a CAR below the minimum requirement of 130%.
Stress tests affirm financial institutions’ shock absorbing capacity under simulated severe scenarios
For the banking system, credit risk losses comprise more than 90% of total losses, with the gross impaired loan ratio expected to rise to 5%-9% under the adverse scenarios. Of the credit losses incurred, loans for the purchase of transport vehicles account for the largest portion of such losses (19%-23%), followed by defaults of large corporate borrowers (16%-23%) (Diagram 2). Even under such severe scenarios, banks are well-positioned to absorb potential losses using available capital and earnings buffers.
In the insurance sector, life insurers are expected to be heavily affected by the simulated market risk shocks, as most assets (74%) are held in the trading portfolio (Diagram 3). Accordingly, the CAR for life insurers is estimated to initially decline by 33-56 ppt in the first year and recover to 236%-248% by the end of the stress horizon. The recovery is mainly attributed to capital gains from a stronger financial market performance from the second year onwards, improved premium growth, and a reduction in liabilities following the increase in MGS yields28. For general insurers, CAR remains above 200% under both adverse scenarios, with the main impact arising from shocks related to higher motor claims.
27 For more details on the adverse scenarios, refer to the Info Box titled ‘An Overview of the Solvency Stress Test Scenarios for Banks and Insurers’.
Post-stress CAR remain above regulatory minimum of 130%
Chart 36: Insurance Sector – Results of Stress Test on Capital Adequacy Ratio (CAR)
Life General0
Worst CAR under Scenario 1Worst CAR under Scenario 2Initial CAR
Source: Bank Negara Malaysia
50100150200250300
%
CAR selepas ujian tekanan kekal melebihi tahap minimum pengawalseliaan pada 130%
Rajah 36: Sektor Insurans – Keputusan Ujian Tekanan terhadap Nisbah Kecukupan Modal (CAR)
Hayat Am0
CAR terburuk di bawah Senario 1CAR terburuk di bawah Senario 2CAR Permulaan
Sumber: Bank Negara Malaysia
50
100150200250
300%
Post-stress capital ratios are well above regulatoryminima
Chart 35: Banking System – Post-shock TotalCapital Ratio
Baseline Scenario Adverse Scenario 1 Adverse Scenario 2
Source: Bank Negara Malaysia
Nisbah modal selepas kejutan jauh melebihi keperluan minimum
Rajah 35: Sistem Perbankan – Nisbah Jumlah ModalSelepas Kejutan
Senario Dasar Senario Buruk 1Senario Buruk 2
Sumber: Bank Negara Malaysia
14
15
16
17
18
2018 2019 2020 2021 2022
%
14
15
16
17
18
2018 2019 2020 2021 2022
%
Financial Stability Rebiew 2018.indd 28 25/09/2018 6:51 PM

29Financial Stability Review - First Half 2018
An Overview of the Solvency Stress Test Scenarios for Banks and Insurers
The multi-year solvency-based stress test exercise models a series of tail-risk events based on three hypothetical domestic GDP growth paths (one baseline and two adverse scenarios) and the corresponding macroeconomic and financial conditions over a four-year horizon from 2019 to 2022. The adverse scenarios are designed to be sufficiently severe for stress test purposes and, based on counterfactual analysis, are unlikely to occur.
The first adverse scenario (AS1) is a V-shaped growth path with an initial sharp recession in 2019, followed by a strong rebound before normalising to the baseline growth trajectory. The magnitude of the recession is equivalent to a 2.5 standard deviation of the long-term GDP growth rate from the baseline. This scenario assumes: (i) heightened trade tensions that escalate into a multilateral trade war among major economies; (ii) a sharp slowdown in the People’s Republic of China (PR China) from tightened credit conditions; and (iii) increased financial market volatility as the ongoing monetary policy normalisation in advanced economies triggers rapid capital outflows and causes sovereign debt crises in vulnerable emerging market economies. The global economy is assumed to improve from 2020 onwards, as policymakers react swiftly with counter-cyclical stimuli.
The second adverse scenario (AS2) simulates an L-shaped growth path with an initial mild decline, followed by prolonged weakness in GDP growth. This protracted sluggish period is equivalent to a cumulative decline (over four years) of seven standard deviations from the baseline. This is triggered by: (i) a synchronised slowdown in the US and PR China, with escalating trade tensions weighing on global growth and trade; (ii) prolonged political uncertainties in the UK and EU regarding Brexit negotiations; and (iii) depressed commodity prices, which reduces Malaysia’s fiscal space for stimulus, leading to rising unemployment and worsened sentiments.
12 3
Diagram 2: Banking System – Key Loss Drivers under Adverse Scenarios
As % of total losses:
59%–62% from credit exposures to businesses
16%–23% due to default of large borrowers
36%–39% from credit exposures to households
19%–23% from hire purchase loans
Minimal impact from market risk shocks
0.3%–0.6% from IRRBB
16%–23% disebabkan oleh kemungkiran peminjam besar
19%–23% daripada pinjaman sewa beli
0.3%–0.6% daripada IRRBB
Gambar Rajah 2: Sistem Perbankan – Punca Utama Kerugian di bawah Senario Buruk
% daripada jumlah kerugian:
Nota: IRRBB = Risiko Kadar Faedah dalam Akaun Perbankan
59%–62% daripada dedahan kredit kepada perniagaan
36%–39% daripada dedahan kredit kepada isi rumah
Kesan terhad daripada kejutan risiko pasaran
12 3
Note: IRRBB = Interest Rate Risk in the Banking Book
Diagram 3: Insurance Sector – Key Loss Drivers under Adverse Scenarios
General Insurers
Gambar Rajah 3: Sektor Insurans – Punca Utama Kerugian di bawah Senario Buruk
Life Insurers
39%-47% from market risk shocks
− 28%-35% from equities held
22%-24% from corporate bond downgrade and default
28%-29% from market risk shocks
− 19%-20% from equities held
28%-35% from corporate bond downgrade and default
37%-44% from higher claims and provision for motor segment
Penanggung Insurans Hayat
Penanggung Insurans Am
39%-47% daripada kejutan risiko pasaran
− 28%-35% daripada ekuiti yang dipegang
22%-24% daripada bon korporat mungkir dan diturunkan gred
28%-29% daripada kejutan risiko pasaran
− 19%-20% daripada ekuiti yang dipegang
28%-35% daripada bon korporat mungkir dan diturunkan gred
37%-44% daripada tuntutan dan peruntukan segmen motor yang lebih tinggi
Financial Stability Rebiew 2018.indd 29 25/09/2018 6:51 PM

30 Financial Stability Review - First Half 2018
Table 2
Jadual 2
Solvency Stress Test: Key Assumptions and Shock Parameters Applied under Assumed Adverse Scenarios
Key assumptions AS1 – V-shaped recession AS2 – L-shaped, protracted recession
Balance sheet and income projections• Decline in loan growth (compound annual growth rate)• Annual decline in banks’ income growth, diff erentiated across
segments (interest income, fee-based and other income)• Annual decline in insurers’ premium income
• -1.5%• Up to 19%
• Up to 25%
• -3%• Up to 15%
• Up to 24%
Credit risk shocks• Probability of default (PD) shocks
• Business loans• Household loans
• Loss given default (LGD) shocks• Business loans• Household loans
• 5% to 12%• 2% to 12%
• 46% to 62%• 20% to 77%
• 5% to 15%• 1% to 13%
• 45% to 67%• 19% to 83%
• Default of corporate borrowers with large exposures to the banking system
• Corporations that have weak fi nancial standings (below prudent thresholds) under simulated shocks
Market risk shocks• Annual increase in MGS yields• Annual increase in corporate bond yields• Annual decline in FBM KLCI• Annual depreciation against major currencies
• Up to 38 bps • Up to 69 bps • Up to 34%• 17% to 30%
• Up to 29 bps • Up to 65 bps • Up to 23%• 9% to 15%
External funding risk shocks• Reversal of claims by non-residents • Up to 30% of interbank
borrowing and deposits• Up to 15% of interbank
borrowing and deposits
General insurance risk shocks• Increase in claims ratio• Increase in premium liabilities (motor classes)
• Up to 30%• Up to 1.5 times additional
provision for adverse deviation
• Up to 16%• Up to one time additional
provision for adverse deviation
Ujian Tekanan Kesolvenan: Andaian dan Parameter Kejutan Utama untuk Senario Buruk
Andaian Utama Senario buruk pertama (SB1) Senario buruk kedua (SB2)
Unjuran lembaran imbangan dan pendapatan • Penurunan pinjaman (kadar pertumbuhan tahunan kumulatif)• Penurunan tahunan pertumbuhan pendapatan bank, dibezakan
mengikut segmen (pendapatan faedah, pendapatan berasaskan fi dan pendapatan lain)
• Penurunan tahunan pendapatan premium penanggung insurans tahunan
• -1.5%• Sehingga 19%
• Sehingga 25%
• -3%• Sehingga 15%
• Sehingga 24%
Kejutan risiko kredit • Kejutan kebarangkalian mungkir (Probability of default, PD)
• Pinjaman perniagaan • Pinjaman isi rumah
• Kejutan kerugian akibat mungkir (Loss given default, LGD)• Pinjaman perniagaan • Pinjaman isi rumah
• 5% hingga 12%• 2% hingga 12%
• 46% hingga 62%• 20% hingga 77%
• 5% hingga 15%• 1% hingga 13%
• 45% hingga 67%• 19% hingga 83%
• Kemungkiran peminjam syarikat dengan dedahan besar kepada sistem perbankan
• Syarikat yang mempunyai kedudukan kewangan yang lemah (di bawah ambang kehematan) dalam simulasi kejadian tertekan
Kejutan risiko pasaran • Peningkatan tahunan kadar hasil Sekuriti Kerajaan Malaysia (MGS) • Peningkatan tahunan kadar hasil PDS • Penurunan tahunan FBM KLCI • Penyusutan tahunan nilai ringgit berbanding dengan mata wang utama
• Sehingga 38 mata asas • Sehingga 69 mata asas • Sehingga 34%• 17% hingga 30%
•Sehingga 29 mata asas • Sehingga 65 mata asas • Sehingga 23%• 9% hingga 15%
Kejutan risiko pendanaan luar • Kebalikan (reversal) tuntutan oleh bukan pemastautin • Sehingga 30% daripada
peminjaman dan deposit antara bank
• Sehingga 15% daripada peminjaman dan deposit antara bank
Kejutan risiko insurans am• Peningkatan dalam nisbah tuntutan • Peningkatan dalam liabiliti premium (kelas motor)
• Sehingga 30%• Sehingga 1.5 kali peruntukan
tambahan bagi sisihan yang ketara
• Sehingga 16%• Sehingga 1 kali peruntukan
tambahan bagi sisihan yang ketara
Financial Stability Rebiew 2018.indd 30 25/09/2018 6:51 PM