bank of finland bulletin 4/2007 - myy...
TRANSCRIPT

4 bull 2007
Monetary policy and economic outlook
From plastic to bits ndash payment habits are changing
Euro area balance of payments and the financial markets
B
AN
KO
FFINLA
ND
BU
LLETIN
4 bull2
00
7
Contents
Monetary policy andeconomic outlook 1
Harry Leinonen
From plastic to bits ndash payment habits are changing 19
Jarkko Kivistouml and
Tapio Korhonen
Euro area balance of payments and the financial markets 29
Charts C1
Bank of Finland Bulletin 4 bull 2007Vol 81The Bank of Finland Bulletin is a quarterly publication
Editor-in-ChiefErkki Liikanen
Editorial BoardJouko Marttila ChairmanHeikki KoskenkylaumlPentti PikkarainenAntti SuvantoJouko VilmunenPetri Uusitalo Secretary
Editedby the Bank of Finland Publication and Language Services
SubscriptionsEmail BoFpublicationsmultiprintfiAddress Multiprint Oy PO Box 237 FI-00121 HELSINKI
Printed by Edita Prima Oy Helsinki 2007
The contents of the Bulletin may be freely quoted but due acknowledgement is requested
ISSN 0784-6509 (print) ISSN 1456-5870 (online)
Bank of FinlandPO Box 160FI-00101 HELSINKIPhone National 010 8311 International +358 10 8311Fax +358 9 174 872wwwboffi
The cover portrays the work of Viktor Jansson Leikkivauml poika 1935ndash1945Leikkivauml poika 1935ndash1945Leikkivauml poika 1935ndash1945
Bank of Finland Bulletin 2007 bull 4 1
T
According to statistical data the
world economy grew strongly
during the third quarter of 2007 In
the present circumstances however
figures that describe past develop-
ments are less helpful than normal
in assessing future trends Growing
risk premia losses incurred by banks
and other financial institutions and
the tightening of lending conditions
have all increased the downside
risks to growth Rising raw material
prices and capacity shortages have
nevertheless sustained the upside
inflation risks to price stability
The world economy continued to
grow strongly through the third
quarter of 2007 with the emerging
economies of Asia still serving as the
motor of growth Statistical data
indicate that growth was also
relatively buoyant in the major
industrial economies with GDP 26ndash
28 higher than the same period of
2006 in the United States the euro
area and Japan Demand has been so
strong that companies in many sectors
have been suffering from capacity and
labour shortages The sustained high
level of oil and other commodity
prices is another sign that demand
growth is outstripping available
supply The growth of US exports and
the emergence of new jobs in the
United States despite the serious
problems in the US housing and
housing loan markets are a further
indication of the world economyrsquos
strong growth dynamic (Chart 1)
Monetary policy andeconomic outlook7 December 2007
In the present situation however
statistical data on past economic
trends are of less than normal help in
assessing future trends as the
uncertainty on the financial markets
that began in August has not yet had
time to significantly affect published
economic data The persistent
uncertainty makes it important to
stress caution and the significance of
future-oriented indicators when
assessing the likely future direction of
the economy All in all the downside
risks to economic growth have
become much stronger during the
second half of 2007
Globally higher risk premia the
losses incurred by banks and other
financial institutions and the tightening
of lending conditions will cause friction
for the channelling of finance into
investment activities1 In addition to
the negative developments on the
1 For more detail on the financial market uncertainty see the Bank of Finland publication lsquoFinancial stabilityrsquo published on 10 December 2007 See also Bank of Finland Bulletin 32007 Box 2
Chart 1
GDP growth
change on previous year15
10
5
0
ndash5
Sources BEA ESRI Eurostat and Bloomberg
2002 2003 2004 2005 2006 2007
1 Euro area 2 United States 3 Japan 4 China
1
2
3
4
2 Bank of Finland Bulletin 4 bull 2007
labour caused by globalisation which
has boosted flexibility in the world
economy and output potential in many
industries Besides strong growth in the
emerging economies the favourable
outlook is also based on the stable
income expectations for households in
the industrial economies which have
gained from both a lower unemploy-
ment rate and an increase in new jobs
This trend has so far obscured the
impact of the rise in fuel prices
although the financial market
uncertainty has also caused a reduction
in consumer confidence during the
course of the autumn (Chart 2)
Investment in emerging economies
driving growth
Investment activity in the emerging
economies has been very brisk and
this has sustained export growth in the
industrial economies as well As an
example Russian import growth has
further accelerated this year and there
can be no expectation of any
slowdown in the coming months
Import growth will also continue at a
rapid pace in other oil-producing
countries on the back of high oil
prices In China as in Russia
consumption has grown more quickly
than expected Annual rate GDP
growth in China during the third
quarter was 115 and growth
forecasts for the years ahead have had
to be adjusted upwards The financial
market turbulence does not so far
appear to have hampered growth
prospects in the emerging economies
financial markets a similar conclusion
is suggested by surveys conducted
among banks and businesses in
general There is also a risk of changes
in the currently high level of asset
prices that could have a negative
wealth effect on private consumption
Despite the increased risks to
growth major international fore casters
have lowered their expectations for
world growth only slightly since their
previous forecasts This optimism is
based on the deepening division of Chart 2
Chart 3
Consumer confidence
Balance Index20
10
0
ndash10
ndash20
ndash30
Sources Conference Board and European Commission
2000 2002 2004 2006
1 Euro area (left-hand scale) 2 United States (right-hand scale)
12
160
140
120
100
80
60
Value of corporate acquisitions worldwide
USD bn600
500
400
300
200
100
0
Source Bloomberg
2003 2004 2005 2006 2007
2-month moving averages
Bank of Finland Bulletin 2007 bull 4 3
In the industrial economies the
pace of corporate investment growth
during the current year is slower than
last year This suggests that the
continued growth of demand in the
world economy has outstripped
companiesrsquo expectations as also the
expectations of many forecasters since
the first half of the present decade the
corporate sector in the industrial
economies has been running a financial
surplus and indicator data would
seem to indicate this trend has continued
through 2007 This means investment
has not been hampered by earnings
development Rather instead of
expanding capacity companies have
been buying each other or their own
shares and there was actually a peak
in corporate acquisitions in the spring
The subsequent uncertainty on the
financial markets has led to a clear
dropping off in corporate acquisitions
during the course of the autumn with
associated securitisation of debt
having almost completely come to a
halt (Chart 3)
World growth has this year
increasingly come up against supply-
side restrictions which has been
reflected in for example high capacity
utilisation rates in the industrial econ-
omies On the other hand labour costs
have not so far reacted significantly to
labour demand although in China
wages have already begun to rise and
in Europe and Japan companies have
reported more serious shortages of
labour In the production of capital
goods there has been a shortage of
components and these have had to be
acquired from very distant sources
This has stimulated growth in transport
demand which has in turn led to a
dramatic rise in dry freight prices
(Chart 4) Order books for capital
goods are still fairly full and deliveries
have been postponed until well into
next year (Chart 5) The shortage of
components has also forced the post-
ponement of some investment projects
Chart 4
Chart 5
Cost of dry freight
Index 1985 = 100012000
10000
8000
6000
4000
2000
0
Source Bloomberg
2005 2006 2007
Baltic dry freight index
Manufacturing order books
Index Jan 1999 = 100160
140
120
100
80
Sources Eurostat US Census Bureau and Economic and Social Research Institute
1999 2001 2003 2005 2007
1 Euro area 2 United States 3 Japan
1
2
3
4 Bank of Finland Bulletin 4 bull 2007
Viewed industry by industry the
economic picture in the industrial
economies is no longer as homogeneous
as it was in the early part of the year
While there is still a shortage of
capacity in some industries the slump
in housing construction is already
having a negative impact this year on
GDP growth in OECD countries2
Higher interest rates and housing prices
have predictably impacted on demand
for new housing not just in the United
States In most industrial economies
housing prices are expected to rise
more slowly this year than in 2006
The more conservative pricing of credit
risk and weaker demand for securitised
housing loans will also be reflected in
housing output but to a more
significant degree not until next year
Housing market trends have been
very similar across the industrial
economies A few years ago the impact
of lower interest rates on housing
2 OECD Economic Outlook 6 December 2007
loans was reinforced by reduced risk
premia in many countries partly due
to financial innovations This meant a
brisk decline in loan-servicing
expenses relative to disposable income
which in turn helped to push up
housing prices The current cooling of
the housing market is also happening
almost simultaneously in all industrial
economies although with clear
differences of degree Rising interest
rates and construction costs combined
with household income restrictions
had already triggered a downturn in
the housing market even before the
turbulence on the financial markets
The cooling of the housing market is
expected to be reflected in reduced
housing investment in some European
countries as well (Chart 6)
Commodity shortages will
increase price pressures
Several years of rapid growth in the
world economy has meant a sharp
increase in demand for commodities
and industrial raw materials The IT
boom at the turn of the millennium
encouraged belief in a lsquoweightlessrsquo
economy and this led to a shortfall of
investment in mining oil prospecting
and manufacturing of basic metals In
the present economic climate
commodity prices could remain high
for a sustained period and only begin
to decline as demand eases and
production capacity expands
Oil supply has been unable to
keep pace with the strong demand
from the world economy Almost all
Chart 6
Housing investment of GDP
14
12
10
8
6
4
2
0
Data for 2007 and 2008 are forecastsSource OECD Economic Outlook
1991 1996 2001 2006
1 Germany 2 Ireland 3 Sweden 4 United States 5 Finland
1
2
3
4 5
Housing market
trends have been
very similar across
the industrial
economies
Bank of Finland Bulletin 2007 bull 4 5
OPEC countries are producing at the
upper limits of their capacity with only
Saudi Arabia having even some scope
for increasing output Due to the
scarcity of free capacity the price of oil
has reacted very strongly to even small
disturbances in supply The dollar price
of oil has risen close to USD 100 a
barrel or in real terms close to the peak
level of the early 1980s In contrast to
previous years OPEC countries are
however no longer worried about
growth in supply from competing
sources with demand in China and
other emerging economies continuing
to grow rapidly On the oil markets the
expectation is that the high prices have
come to stay (Chart 7)
The high commodity prices and
lack of capacity are increasing infla-
tionary pressures and the pace of
inflation has certainly been accelerat-
ing in different economies during the
course of the autumn Prices and
wages have begun to rise at an acceler-
ating pace in China too (Chart 8) The
price-dampening effect of globalisa-
tion has weakened and there are
growing upward pressures on the
prices of goods imports for instance in
the United States On the other hand
tighter access to finance in the
industrial economies could subdue
demand and hence ease inflationary
pressures Wage development in the
industrial economies in particular will
be crucial All in all the upside risks to
price stability have increased and this
is reflected in inflation expectations
on the financial markets (Chart 9)
Chart 7
Chart 8
Chart 9
Price of crude oil and trend suggested by oil futures
Price per barrel100
80
60
40
20
0
Source Bloomberg
1998 2000 2002 2004 2006 2008
1 EURbarrel 2 USDbarrel 3 Futures 26ndash30112007
1
2
3
Chinese inflation and price of Chinese goods imports to United States
8
6
4
2
0
ndash2
Source Bloomberg
2005 2006 20071 Consumer price inflation in China2 Inflation in Chinese goods imports to United States
1
2
Inflation expectations in United States and euro area
32
30
28
26
24
22
20
Expected inflation after five years derived from inflation swapsSource Bloomberg
2005 2006 2007
1 Euro area 2 United States
1
2
6 Bank of Finland Bulletin 4 bull 2007
have built up over a number of years
The banks have targets for the amount
of capital in these buffers relative to
their assets held primarily in their loans
granted to households and companies
The minimum level for this capital ratio
is the minimum capital requirement set
by the authorities As the capital is
eroded by losses the buffers contract
relative to the banksrsquo outstanding loan
assets which exerts pressures on their
credit ratings In a situation of major
losses capital ratios can be maintained
at their target level only by a consider-
able reduction in lending The real
impacts of the financial market
turbulence outside the banking sector
will considerably increase if banksrsquo
ability to lend is undermined
The financial market uncertainty
and the downside risks to growth have
led to a considerable reduction in risk-
free interest rates particularly in the
United States The rates on govern -
ment bonds have fallen steeply as
assets are moved into investment
instruments that are felt to be safe
simple and liquid Expectations of a
rise in policy rates have generally
receded or disappeared altogether The
US policy rate has already been signifi-
cantly reduced while the Bank of
England also reduced its key rate at its
meeting in December In contrast
Australia and Sweden for example
have continued to raise interest rates
in response to the continuing risks to
price stability (Chart 10)
Of the major currencies the US
dollar has depreciated 10 during the
Chart 10
Considerable uncertainty on the
financial markets
The uncertainty on the financial
markets during the course of the
autumn has been widespread and to
some extent unprecedented The
problems in the US housing loans
market have led to significant credit
and investment losses which have
been a blow to the banking and
financial sector both in the United
States and elsewhere The uncertainty
has weakened demand for credit-risk-
bearing securities and hence inhibited
financial mediation based on securiti-
sation Banksrsquo earnings development
has been undermined at the same time
as their financing costs have risen due
to higher risk premia It is still unclear
to what extent the deterioration of
banksrsquo balance sheets will restrict their
ability to extend credit
The large losses write-downs and
provisions declared by the banks are
matched in their balance sheets by the
counteritem of the capital buffers they
Banksrsquo earnings
development has
been undermined at
the same time as
their financing costs
have risen due to
higher risk premia
Central bank policy rates
7
6
5
4
3
2
1
0
Source Bloomberg
2000 2002 2004 2006
1
2
3
4
1 Euro area 2 United States 3 Australia 4 United Kingdom 5 Sweden
5
Bank of Finland Bulletin 2007 bull 4 7
course of 2007 as measured by the
nominal effective exchange rate index
as a consequence of the weakened
economic outlook and lower interest
rates (Chart 11) In contrast the euro
has appreciated 4 against the
currencies of the euro arearsquos most
important trading partners The
nominal effective exchange rates of the
Japanese yen and the Chinese yuan are
the same as a year ago
With the exception of banking
shares the stock markets had begun to
recover from the critical phase of
financial market uncertainty back in
August but a second wave of
turbulence that began in November
now appears to have taken a tighter
grip on the markets (Chart 12) During
the course of 2007 banking shares
have lost 28 of their value in the
United States and 9 in the euro area
as a result of negative and uncertain
earnings development All-share indices
have been more robust and are at a
slightly higher level than a year ago in
both the United States and the euro
area In China share prices have risen
over 88 during the course of the year
although they have fallen back almost
17 from the peak levels of mid-
October Despite the countryrsquos relatively
weak currency five Chinese companies
are among the worldrsquos top 10 in terms
of their stock exchange value
Slower growth in
the United States
In the United States the downside
risks to growth have grown considera-
bly and US growth forecasts have con-
sequently been clearly lowered during
the course of the autumn The weak
housing market the serious problems
in the housing loans market rising fuel
prices and stock market uncertainty
will all serve to weaken domestic
demand in coming quarters
The Federal Reserve has made a
determined response to the downside
risks to growth and lowered its policy
rate in two stages by a total of 75
Chart 12
Chart 11
Nominal effective exchange rate indices
Index 1999Q1 = 100130
120
110
100
90
80
70
Sources ECB and IMF
1999 2001 2003 2005 2007
1
2
3
4
1 Euro area 2 United States 3 Japan 4 China
Stock markets in the United States
Index50
40
30
20
10
0
Source Bloomberg
1995 1997 1999 2001 2003 2005 2007
1 2
1 VIX index depicting stock market uncertainty (left-hand scale)2 US SampP500 share index (right-hand scale)
1750
1400
1050
700
350
0
8 Bank of Finland Bulletin 4 bull 2007
basis points in September and October
Interest rates were cut despite risks of
higher inflation as one of the Fedrsquos
key objectives is to support growth
and employment the downside risks
to which have clearly grown After the
interest rate cut at the end of October
the Federal Reserve took the view that
the upside risks to inflation and the
downside risks to growth were in
balance The market nevertheless
expects further relaxation of US
monetary policy in the near future
From a monetary policy
perspective the economic situation in
the United States presents a challenge
The high price of oil and rising
import prices are fuelling inflation
and the relatively tight labour market
could mean that wages will continue
their brisk upward trajectory After
all unit labour costs to take one
example have been accelerating since
2004 In its most recent forecast the
Federal Reserve nevertheless estimates
that inflation as measured by the
private consumption deflator will
ease back from around 3 this year
to 19 in 2008
Activity in the US housing market
has ebbed further The declining
number of building permits issued and
the record low confidence amongst
builders suggest housing investment
will remain weak for longer than
previously expected The higher
number of housing units for sale has
led to a fall in housing prices which
could lead to pressures for a reduction
in household consumption The higher
level of defaults on subprime loans has
begun to be reflected in foreclosures
but the final level of loan losses by the
banks is still hard to estimate It is
however worth remembering that the
collateral on these loans has at least
historically held its value well
The US economyrsquos external
imbalance relative to GDP has not
grown recently and there is now an
improved chance of a controlled
reduction in the current account deficit
The trade deficit has stopped growing
and has in fact begun to contract with
the weaker dollar boosting exports and
weakening imports since the first half
of the current year (Chart 13) The fall
in housing prices weaker financing
conditions and higher fuel prices are
subduing domestic demand which
could lead next year to a rise in the
household saving ratio This could have
positive effects as it would help to
correct the accumulated imbalances in
the economy
As elsewhere US companies too
are at present highly solvent which
Chart 13
From a monetary
policy perspective
the economic
situation in the
United States
presents a challenge
US trade balance
USD bn20
0
ndash20
ndash40
ndash60
ndash80
Source Bloomberg
2000 2002 2004 2006
Bank of Finland Bulletin 2007 bull 4 9
gives reason for optimism Surveys
conducted with the banks reveal that
credit criteria have been tightened
more for housing loans than for
business loans Investment activity
could be affected more by companiesrsquo
weakened expectations over the
future direction of the economy than
by restrictions on the supply of
finance particularly as the deep
financial markets in the United States
will presumably find channels for
financing corporate investment
without the risk premia currently
attaching to financial institutions
Japanese exporters looking ahead
with confidence
Economic growth in Japan has varied
at around 2 per annum for the past
four years The Tankan survey of
business confidence indicates that
large corporations continue to be
confident over future trends (Chart
14) Japanese companies nowadays
are highly solvent with a total
financial surplus of around 5 of
GDP for approximately the past 10
years With a high capacity utilisation
rate and strong exports to its near
neighbours there should not be any
external obstacles to investment On
the other hand for companies
operating in the domestic market
Japan has not yet properly escaped the
problems of a deflationary economy
which can contribute to a climate of
uncertainty despite the low level of
interest rates Japanese monetary
policy is also marked by caution
The economic position of
Japanese households has remained
unchanged throughout 2007 The
unemployment rate has remained low
and there are still plenty of jobs on
offer The moderate trend in wages
partly due to acceleration in the
retirement figures does not however
encourage expectations of higher
incomes and private consumption has
therefore stagnated There are never-
theless some small signs of an end to
deflation For example land prices are
showing signs of upward movement
Pace of growth in Asiarsquos emerging
economies unchanged
In Asia growth has continued at a
very brisk pace and the contraction
in US imports is not reflected in the
growth figures for eg China and
Japan The small countries of East
Asia have seen their exports grow on
the back of investment and
consumption growth in China Asian
Chart 14
It is hard to assess
the potential effects
of slower US
imports on the
economies of Asia
Japanrsquos Tankan survey of business confidence
Balance30
20
10
0
ndash10
ndash20
ndash30
Source Bloomberg
2002 2003 2004 2005 2006 2007
1
2
1 Business cycle indicator2 Financial position of major industrial corporations
10 Bank of Finland Bulletin 4 bull 2007
economies are solvent and their
current accounts in balance which
means the effects of the credit crisis
are likely to be reflected primarily in
more sluggish exports to the United
States It is hard to assess the potential
effects of slower US imports on the
economies of Asia Although for
example half of Japanese exports go
to other countries in Asia and partic-
ularly China a significant proportion
of exports eventually end up in the
United States At least so far however
the internal dynamics within Asia has
reduced the regionrsquos dependence on US
growth and key forecasts assume this
pattern will continue
In China the pace of consumption
growth appears to have picked up
during the course of the autumn and
there is nothing to suggest any slowing
of domestic demand The intense pace
of growth has already begun to be
reflected in wages and particularly in
the prices of foodstuffs in addition to
the impact of supply-side restrictions
In contrast elsewhere in Asia the rise in
consumer prices has remained
moderate Despite the rapid pace of
investment and consumption growth
Chinarsquos trade surplus continues to
grow The Chinese are expected to
further tighten their economic policy in
the future by raising interest rates and
the capital adequacy requirements for
banks A balanced approach to growth
would include the controlled
channelling of resources away from
exports towards meeting domestic
demand particularly consumption
but such a change has been made more
difficult by the linkage of the yuan to
the weakened US dollar
High commodity prices support
growth in many emerging
economies
The rise in the price of oil and other
commodities is having a considerable
impact on global trade flows and
division of income The share of
import volumes going to Russia and
the OPEC countries will continue to
grow next year as well In Russia
there has also been a pick-up in
investment demand and this has been
reflected in exports from the euro
area Russia has admittedly not
invested much in oil production with
the result that output is only growing
at around 2 per annum Import
volumes have also been growing
rapidly in the OPEC countries
although some of the increased oil
revenues in the Middle East will
continue to augment the regionrsquos
foreign exchange reserves and find
their way back to the industrial
economies in the form of capital flows
The economies in Latin America
have so far coped well with rising oil
prices and the credit crisis due to
their increased flexibility and
balanced current accounts Growth
continues in Brazil and Argentina if
more slowly and the smaller
countries in the region are also not
experiencing any major problems
Africa too has also benefited from
the pull of globalisation as the pace
Chinarsquos trade
surplus continues
to grow
Bank of Finland Bulletin 2007 bull 4 11
of growth in many African countries
has actually picked up this year
Average growth for Sub-Saharan
Africa as a whole has been around
5ndash6 for several years already and
expectations for next year foresee a
quickening pace In most African
countries the current account is
either in balance or slightly in deficit
Euro area growth stable
The euro area economy returned to
faster than trend growth in the third
quarter as was expected following
weak second quarter growth The
positive trend in the economy has been
broadly based over the year as a
whole and this has also meant a
continuous drop in the unemployment
rate in different countries Housing
construction has admittedly been
slowing down in many countries but
this is not yet reflected in the figures
for GDP The German economy which
has for quite some time been driven by
exports would appear to be finally
benefiting from increased household
consumption as well
The strength of demand within
the euro area and among new EU
member states has sustained
production for export in euro area
countries and compensated for
weakening demand in the United
States For example a sizeable
portion of German export growth has
come from exports to other euro area
countries and new EU member states
(Chart 15) Export order books are
still fairly full and euro area
countriesrsquo production for export can
be expected to continue growing in
the immediate months ahead
Shortages of labour and
production capacity have probably
been the most significant restraint on
output thus far The financial market
uncertainty has weakened confidence
among exporters and it is possible
that companies could postpone their
own investment projects Euro area
countries are however very solid
financially as a result of positive
earnings development and the present
low level of investment activity
Moreover the rise in unit labour costs
has been moderate
Confidence has however clearly
taken a knock in the euro area as
well Many euro area countries would
welcome a relaxation in the labour
market and an easing of labour
shortages as this would reduce the
risk of overheating and create a
positive climate for continued price
Chart 15
German exports
EUR bn change from previous year5
4
3
2
1
0
ndash1
ndash2
3-month moving averagesSource EcoWin
2000 2002 2004 2006
1
2
3
4
1 Euro area 2 Other EU countries 3 United States4 Asia 5 OPEC countries and Russia
5
12 Bank of Finland Bulletin 4 bull 2007
stability Rising prices for oil and
food are eroding household
purchasing power but the still
relatively stable employment situation
is sustaining income expectations We
can therefore expect moderate
quarterly growth in private
consumption in the immediate future
Inflation in euro area countries
has varied greatly in recent years
primarily due to the major fluctua-
tions in energy prices Both last year
and in 2005 the rise in energy prices
was moderated by the declining price
trends in other product groups such
as industrial goods
Euro area HICP inflation has
however gathered pace in recent
months In November consumer prices
in the euro area rose at an annual rate
of 30 primarily due to the price of
energy (Chart 16) The jump in the
annual change in energy prices was
because the figures were being
compared with autumn 2006 when
there had been a steep fall in oil and
fuel prices This base effect should
weaken in the coming months Rising
prices for cereals and other agricultural
products have also begun to be
reflected in consumer prices and prices
of processed foods have been rising at
an accelerating pace in recent months
(see Box) Even without energy
products and unprocessed foods the
HICP index rose 21 in October
ECB holds key rate unchanged
Since the interest rate rise in June the
Governing Council of the European
Central Bank has held its key policy
rate at 4 During the second half of
the year the financial climate has
become tighter with the financial
market uncertainty that began in the
US housing loan market now also
affecting the euro area Higher risk
premia and tighter lending criteria
have caused friction in financial
intermediation (Chart 17)
The latest information has
confirmed the existence of strong short-
term upward pressure on inflation and
also upside risks to price stability over
the medium term Against this
background and with money and
credit growth remaining very vigorous
in the euro area the Governing Council
stands ready to counter upside risks to
price stability The economic funda-
mentals of the euro area remain sound
However the reappraisal of risk in
financial markets is still evolving and is
accompanied by continued uncertainty
about the potential impact on the real
Chart 16
Euro area inflation and effect of main categories
35
30
25
20
15
10
05
0
ndash05
Source ECB
2003 2004 2005 2006 2007
1
2
34
1 Services 2 Non-energy industrial goods3 Processed foods 4 Unprocessed foods5 Energy 6 Total
6
5
Prices of processed
foods have been
rising at an acceler-
ating pace in recent
months
Bank of Finland Bulletin 2007 bull 4 13
economy The Governing council has
indicated that it will monitor very
closely all developments and ensure
that second-round effects and risks to
price stability over the medium term do
not materialise
At its December meeting the
Governing Council published an
assessment of future economic trends
by Eurosystem experts GDP growth is
expected to be around 24ndash28 this
year and 15ndash25 in 2008 HICP
inflation is estimated at 20ndash22 this
year and 20ndash30 in 2008 thereafter
slowing in 2009 to 12ndash24 The
Governing Council considers the
growth estimate to be subject to
downside risks relating primarily to
the possibility of a greater-than-
expected negative impact of the
prevailing financial market uncertainty
on confidence and financial
conditions In relation to the inflation
forecast the Governing Council
considers the risks to be on the upside
The European Commissionrsquos
autumn 2007 economic forecast
generally confirms the picture of
improving budget balances in the euro
area this year However progress with
structural fiscal consolidation in
countries with remaining budget
imbalances is generally disappointing
This lack of ambition will unnecessarily
prolong the correction of remaining
fiscal deficits and could lead to negative
surprises should the macroeconomic
environment turn less favourable In
this context the Governing Council
considers member states should meet
the commitment they made in the
Eurogrouprsquos Berlin agreement of April
2007 namely that most euro area
members would achieve their medium-
term objectives in 2008 or 2009 and
all should aim for 2010 at the latest
Finlandrsquos short-term outlook
remains favourable
The Finnish economy has continued to
grow relatively strongly3 Third-quarter
GDP was 38 up on the same period
in 2006 Output growth was based par-
ticularly on consumption demand and
exports Household incomes have
grown as a result of the improved
employment situation and wage rises
have boosted income expectations The
impact of higher oil prices on household
incomes is softened by the fact that oil
is priced in dollars and the dollar has
3 The Bank of Finlandrsquos autumn forecast was published in October (see Bank of Finland Bulletin 32007)
Consumer
confidence in the
general direction of
the economy has
weakened recently
Chart 17
Development of lending criteria according to ECB survey
Net proportion ( points) of banks reporting tighter lending criteria in the past 3 months
60
40
20
0
ndash20
Source European Central Bank
2003 2004 2005 2006 2007
1
2
3
4
1 Corporate loans large corporations 2 Corporate loans small and medium-sized enterprises3 Housing loans4 Consumer credit and other loans
14 Bank of Finland Bulletin 4 bull 2007
weakened against the euro House-
holdersrsquo confidence in their own
finances has remained strong which
has sustained private consumption and
retail trade Consumer confidence in
the general direction of the economy
has however weakened recently
The labour market is still
suffering from a shortage of skilled
labour and in many industries
capacity is at full stretch The trend
unemployment ratersquos sticking at
around 70 at the same time as the
number of open job vacancies
continues to grow indicates the tight
conditions prevailing on the labour
market are continuing The construc-
tion sector has been experiencing a
shortage of materials as well as a
shortage of labour and construction
costs have risen considerably despite
the slowdown in housing construc-
tion that began back in the spring
(Chart 18) Commercial construction
continues to be very lively although
the financial market uncertainty
means the outlook is deteriorating
A clear slowdown in the pace of
construction over the next few
months will up to a certain point be
good for the overheated sector As
several new build and renovation
projects have had to be postponed
due to a lack of tenders there is no
immediate prospect of a genuine
slump in the construction industry As
is the case in many other countries
the Finnish housing market has
cooled and housing prices have risen
more slowly than last year Higher
interest rates have slowed the rate of
new debt while the high price of
housing has raised the threshold for
buyers to enter the market
In manufacturing the cyclical
picture is in some respects uneven as
the chemical forest industry (pulp and
paper) for example is still suffering
from the low level of export prices and
the situation has not been made any
easier by a rise in intermediate goods
costs and the current uncertainty over
the sourcing of roundwood The forest
industry is in difficulties throughout the
Nordic region and in Finland the diffi-
culties are strongly reflected in the
cyclical outlook for the east and
southeast of the country according to
the regional business barometer
Manufacture of machinery and
equipment has in contrast continued
to develop favourably As a whole
volume growth in manufacturing
output has clearly slowed during the
second half of 2007
Chart 18
The housing market
has cooled and
housing prices have
risen more slowly
than last year
New building construction in Finland
Volume index Jan 2000 = 100160
140
120
100
80
60
Seasonally adjusted figuresSource Statistics Finland
1
2
1 All buildings 2 Housing3 Industrial buildings
1999 2001 2003 2005 2007
3
Bank of Finland Bulletin 2007 bull 4 15
The business tendency survey
conducted by the Confederation of
Finnish Industries in October never-
theless paints a relatively positive
picture of the outlook for manufac-
turing as it indicates that a growing
number of manufacturing companies
had insufficient capacity during the
third quarter The technology sector
which among other things manufac-
tures capital goods has very full
order books and there is no sign of
any change in this respect in the
immediate months ahead In practice
this means that the positive cyclical
phase in manufacturing will continue
well into next spring The survey also
indicates a stable cyclical situation for
services reflecting the similarly stable
outlook for exporters and
households It is in fact clear that
economic growth in Finland in the
immediate months ahead will be
restricted primarily by a lack of
capacity and only to a small degree
by export demand
According to a financial survey
by the Bank of Finland the Confeder-
ation of Finnish Industries and the
Ministry of Trade and Industry
medium-sized and large companies in
Finland are having no trouble
accessing finance Finnish companies
are in any case financially very
sound and the financial market
uncertainty is unlikely to affect their
decisions to any significant degree In
contrast small companies are have
found that their financing problems
have got worse and the margins on
new loans have in some cases become
even bigger This could make them
less likely to invest Households are
facing higher interest payments from
the raising of Euribor rates due to the
crisis of confidence between the
banks although the impact on new
loans has been less due to adoption of
different reference rates
Wages growth accelerating
This year has seen pay agreements
with increases well above the norm
for recent years This highlights the
need for productivity development
There are sound reasons for the
inclusion of productivity clauses in
these agreements The agreements in
the public sector mean in practice that
pay-related expenditure in local
government will grow at a brisk pace
in the years ahead There is also a risk
that the larger pay deals struck in the
Chart 19
Consumer price inflation in Finland
change on previous year 4
3
2
1
0
ndash1
Statistics Finlandrsquos consumer barometerSources Statistics Finland and Bank of Finland
2001 2003 2005 2007
1
2
3
1 Harmonised index (HICP)2 National index (CPI)3 Consumer expectations for next 12 months
16 Bank of Finland Bulletin 4 bull 2007
Box
Metal and agricultural raw materials and inflation
Before the turn of the millennium the real prices of commodities and raw materials other than those used in producing energy tended to decline over time This trend-like decline in real prices was based on rapid productivity growth in for example agriculture and production of metallic raw materials
However the decline in real prices came to an end around the turn of the millennium The nominal prices of metallic raw materials began to rise steeply as demand grew and inventories declined In recent years the price rises have shifted to foodstuffs Rising real prices for raw materials has been a feature of cyclical upswings in the past too but this time it has been much stronger and in part more
broadly based and it has also spread into agricultural raw materials (Chart 20)
The prices of many metals began to rise rapidly during
2003ndash2004 The main reason was the vigorous growth in demand in the emerging economies particularly China According to an assessment by
Chart 20
Commodities and raw materials trend in real prices
Index 1995 = 100400
300
200
100
0
Nominal ($) price index divided by US consumer price indexAnnual data 2007 data from August 2007Source IMF
1980 1985 1990 1995 2000 2005
1 Foodstuffs2 Agricultural raw materials (incl forest products)3 Metals4 Oil products
1
2
34
public sector will begin to increase
wage drift in private service companies
if the labour market continues to be as
tight as it has been to date
Consumer price inflation has
already crept up close to 3 if house
price and interest rate rises are taken
into account HICP inflation is under
2 The reduction in car tax at the
beginning of 2008 will have a decel-
erating effect on inflation On the
other hand rising world market
prices for fuels and some foodstuffs
will tend to push up the pace of
inflation If wage rises are also taken
into account it is no surprise that
householdsrsquo inflation expectations
have risen to their highest level since
1995 (Chart 19)
Keywords inflation monetary policy
economic situation
Bank of Finland Bulletin 2007 bull 4 17
the IMF growing demand in China explained at least half the growth in consumption of many metals in the years 2002ndash2005 Besides development of the countryrsquos own infrastructure the strength of Chinese demand for metal raw materials also reflected the ongoing process of industrial-isation and the transfer of production to China
Demand growth alone could not however have caused price rises as large as those that have occurred part of the reason has been the slow response on the supply side During the second half of the 1990s and the early years post-2000 investment in metal production was lower than before which left companies in the industry insufficiently equipped to respond to the growth in demand The slow response by producers has in turn led to the depletion of
metal raw material inventories which has then caused an increase in the risk premia incorporated in prices
As with metals the decline in the average real prices of unprocessed foods and other agricultural raw materials (eg cotton) came to a halt around the turn of the millennium However these prices began to climb later than metal prices and mainly just during the past couple of years Moreover the increases have affected only a few foodstuffs such as maize dairy products food oils soya and wheat (Chart 21)
Behind the recent rapid rise in food prices on the world market we can identify three main factors changing dietary practices in the emerging economies growing use of biofuels and poor crops In contrast cyclical factors do not
appear to have played any major role in the recent price trends This has also been the case in the past ndash demand for foodstuffs and other agricultural raw materials follows the cyclical trends in the economy much less in general than does demand for metals for example
Rising incomes levels in many emerging economies par-ticularly China and India have led people in these countries to begin to change their eating habits The proportion of animal protein in their diet has grown and this has been reflected in increased demand for a variety of meat and dairy products This in turn has boosted demand for plants used in animal feed
Another factor pushing up prices in recent years has been the growth in demand and production of biofuels Apart from the strong upward trend in crude oil prices this development has also been motivated by the drive to reduce net carbon dioxide emissions in the energy industry and hence slow down climate change The EU is seeking to expand the use of biofuels to 10 all fuels by the year 2020 and the United States is also seeking to increase output of ethanol and other biofuels Increased output of biofuels has pushed up the prices of maize and soya in particular
As well as demand supply factors have also played a
Chart 21
Food raw materials trend in dollar prices
Index Jan 2000 = 100350
300
250
200
150
100
50
Source EcoWin
2000 2002 2004 2006
1 Wheat 2 Maize 3 Soya oil 4 Palm oil
1
2
3
4
18 Bank of Finland Bulletin 4 bull 2007
significant role in the upward trend in food prices The excep-tionally dry weather in Australia has caused a dramatic fall in the production and export of wheat It has also reduced exports of dairy products In addition animal diseases have cut the supply of pork in China while simultaneously contributing to the accelerating pace of inflation in the country World wheat stockpiles have halved since the turn of the millennium and are currently equal to only around 50 daysrsquo consumption At the same time intervention stockpiles of butter in the EU are now empty for the first time in over 40 years
Despite continued growth in demand the real prices of food raw materials are in general not expected to continue to rise For example the OECD and the Food and Agriculture Organiza-tion of the United Nations (FAO) predict the dollar-denominated prices of the main agricultural products will remain stable or decline slightly over the longer term This is based on the expectation of continued brisk productivity growth particularly in low-income countries Despite their forecast decline real prices are not however expected to return to their earlier levels
The rising world market prices for crude oil and many
other commodities and raw materials is reflected in consumer price trends in the industrial economies On the other hand globalisation has led to lower prices for industrial goods The overall impact of globalisation on consumer price inflation in the euro area has actually been estimated to be fairly negligible Different studies suggest it has subdued inflation by at most a few tenths of a percent annually during the past 5ndash10 years
As with their world market prices the producer prices of foodstuffs in the euro area have also risen in recent months This has been particularly true of dairy products cereal derivatives and animal feed It is not entirely clear to what extent the rise in producer prices is a consequence of develop-ments on the world market and what extent it is due to internal factors within the EU since the Common Agricultural Policy partly obscures the relationship between euro area price trends and the events on the world market In any case the price rises appear to be focused largely on the same product groups which suggests a strong link
The rise in producer prices in the euro area has in turn been reflected in corresponding consumer prices particularly for breads and dairy products The
pace of inflation in processed food did indeed jump almost 2 percentage points in total in AugustndashOctober Unprocessed food inflation also began to clearly gather pace in October Altogether food price rises already account for a quarter of overall inflation in the euro area There have recently been consid-erable differences in food price trends between different countries in the euro area This could be due to factors such as the different competitive situation in retailing in the different countries
Recent inflation trends in the euro area are in line with what different calculations tell us about the impact of rising world market and producer prices for foodstuffs on euro area consumer prices The spread of potential impacts produced by these calculations is fairly substantial it is possible to speak of a full frac12 percentage point impact on euro area inflation We have previous experience of a similar sort of effect in 2001 when price rises in meat products caused mainly by animal diseases caused an acceleration in annual euro area inflation of around frac12 percentage point
Bank of Finland Bulletin 2007 bull 4 19
P
Payment habits are changing
rapidly The creation of a Single
Euro Payments Area (SEPA) will
improve the efficiency of payments
in Europe But are we also facing a
bigger change with the development
of electronic payments
Payments are part of our everyday
life Every time we make an economic
decision it is followed by some form
of payment Statistics show that
nearly 300 different types of account-
based payment are effected in Finland
per capita every year This includes
company-to-company payments
which pushes up the average value of
account-based payments as high as
EUR 2200 On a rough estimate the
volume of payments in cash is at least
as high although as a proportion of
total payments cash payments are on
the decline
Finns withdraw from ATMs an
average of EUR 84 per withdrawal
and the average number of
withdrawals is 37 per annum Finnish
households consume an average of
EUR 60 in cash per week as nearly
all the cash consumed is withdrawn
from ATMs Correspondingly 170
purchases are paid by card annually
and the average value of a purchase is
EUR 35 The value of purchases paid
by card per week is approximately
EUR 115 ie nearly double the value
of cash purchases
Finns consume an average of
EUR 310 per week per capita which
means cash payments account for
From plastic to bits ndash payment habits are changing26 November 2007
approximately 20 and card
payments approximately 37 of
total consumption The remaining
43 is divided mainly between credit
transfers and direct debits The
proportion of direct debits is much
smaller than that of credit transfers
Changing payment habits
Payment is a necessity It must be
simple and practical Consumersrsquo
payment habits are usually quite
fixed and rarely change
This is clearly shown in an
examination of previous major
changes in payment habits (Chart 1)
Payment habits have historically
changed1 in 10-year cycles and the
process has followed the S-shaped
curve typical of behavioural change
In the initial period of slow progress
1 The Bank of Finland has studied changes in payment habits in a special project the final report of which is currently being finalised For more information on the project see the Bank of Finland website (wwwboffiscpayhabits2010)
Chart 1
Harry Leinonen Advisor to the Board Financial Markets and Statistics
Major changes in Finnish payment habits in recent decades
1980 1985 1990 1995 2000 2005 2010
Stragglers
Late majority
Innovators
Early majority
Source Bank of Finland
Cardsand
ATMs
Merchant and corporate customer terminals
Account statements as bookentries
E-banking services for
private customers
Electronicinvoices
20 Bank of Finland Bulletin 4 bull 2007
will significantly change the way
companies and private citizens pay
invoices in the years ahead Similar
trends have also been experienced in
other European countries but usually
at a later stage than in Finland and the
other Nordic countries which are the
clear forerunners
Changing trends in Finland
and Europe
Statistics reveal that there are at
present six significant payment trends
ndash The use of account-based
payments is growing robustly and
they are replacing cash
ndash Electronic account-based
payments are replacing account-
based payments in paper form
ndash Self-service payments are
increasing at the expense of
services provided at a bank branch
ndash The use of ATMs is decreasing
and is being replaced by card
payments at point of sale
ndash Growth in the use of debit cards
exceeds growth in the use of credit
cards
ndash The market share of direct debits
is declining relative to the other
account-based payment instruments
The number of card payments has
increased the most (12 per annum)
in the EU15 (Chart 2) The increase
in card payments has also been strong
in Finland (on average 10 per
annum) compared with other
payment methods In Finland the
number of card payments is well
innovators begin using the service
This is followed by a period of strong
progress when the majority adopts it
At the end of the changeover period
there is another period of slow
progress where those slowest to
change begin using the new service
Finnish payment habits
underwent major changes as private
customers began using cards and
ATMs in the 1980s and online
banking services around the turn of
the millennium Companies and
retailers began using banking
terminals in the 1980s and automated
their accounting processes by
introducing the use of account
statements as book entries
The next major change was the
arrival of the electronic invoice This Chart 2
Use of account-based payment instruments in EU15 and Finland
Average number of transactions per capita
180
160
140
120
100
80
60
40
20
0 1994 1995 1996 1997 1998 1999 2000 2001 2002 2003 2004 2005 2006
Number
1a Payments by cheque (EU15) 3a Credit transfers (EU15)
1b Payments by cheque (Finland) 3b Credit transfers (Finland)
2a Card payments (EU15) 4a Direct debits (EU15)
2b Card payments (Finland) 4b Direct debits (Finland)
Source ECB
3a
3b
1a
1b
2a
2b
4a
4b
Bank of Finland Bulletin 2007 bull 4 21
above than the EU15 average
(difference 92 transactions per capita
in 2006) The number of credit
transfers has grown steadily by
approximately 4 annually and the
number of credit transfers is much
higher in Finland than in the other
countries (difference 74 credit
transfers per capita in 2006) Direct
debits have become somewhat more
popular in Europe in the present
decade Finns use direct debits less
than EU15 inhabitants on average
(difference 32 transactions per capita
in 2006) In Finland the slow growth
in the use of direct debits came to a
halt in 2004 The cheque is a rarely
used payment instrument in Finland
but in some European countries (eg
France the United Kingdom Ireland
and Portugal) it is still widely used
Payment by cheque is also clearly
declining Even so the number of
cheques written per EU15 inhabitant
was still approximately 17 in 2006
Finland is the clear leader in the
number of electronic payments per
capita (Chart 3) with over 250 trans-
actions per annum Finland and the
Netherlands have the highest level of
automation over 96 of all payments
being transferred from customer to
bank in electronic form The situation
varies from country to country but
the trend is nevertheless clear
The turning point in consumersrsquo
payment habits is around 60ndash70
payment card transactions per
annum after which the use of ATMs
begins to decline (Chart 4) The more
Chart 3
Chart 4
Electronic transactions and degree of automation in European countries 2002ndash2006
300
250
200
150
100
50
0 0 10 20 30 40 50 60 70 80 90 100
Number of electronic payments per capita
Sources ECB and Bank of Finland
Degree of automation
BE DKDE
IEIT
NL
AT
PT
FI
SE
UK
GR
ES
LU
ATM withdrawals and card payments per capita in EU15 2002ndash2006
50
40
30
20
10
0 0 10 20 30 40 50 60 70 80 90 100 110 120 130 140 150 160 170
Number of ATM withdrawals per capita
Source ECB
Number of card payments per capita
BE
DK
DE
IE
IT
NL
AT
PT
FI
SE
UK
GRES
LU
FR
22 Bank of Finland Bulletin 4 bull 2007
customers use cards in paying for
purchases the less cash they need to
withdraw from ATMs The majority
of EU15 countries are however only
at the stage where customers are
replacing cash withdrawals at bank
branches with ATM withdrawals
Finland has been the leading country
in the use of cash ATMs but their use
has begun to decline significantly
Finland is also the leading EU
country in the use of payment cards
followed by the other Nordic
countries
In almost every EU15 country
credit card payments have declined as
a proportion of total card payments
(Chart 5) combined with a corre-
sponding increase in debit card
payments This is the case in Finland
too where the overwhelming
majority of card payments are with
debit cards The only exception to the
trend is Greece where the marketing
of payment cards focuses almost
exclusively on credit cards
The market share of direct debits
varies considerably across countries
(Chart 6) In terms of value the
proportion of direct debits is
relatively small but in some countries
ndash particularly Germany and Spain ndash
their proportion of the total volume
of transactions is relatively high The
market share of direct debits has
decreased in several countries but
there are some countries in which it
has increased Finland is firmly in the
camp of those countries with a very
low use of direct debits
Chart 5
Chart 6
Credit card use as a proportion of card payments in EU15
100
80
60
40
20
0
20
40
60
80
100 BE DK DE GR ES FR IE IT LU NL AT PT FI SE UK
of total value of transactions
Data unavailableSource ECB
100
80
60
40
20
0
20
40
60
80
100
1996 1998 2000 2002 2004 2006
of total volume of transactions
Market share of direct debits according to total value and volume of transactions relative to other account-based payments in EU15
40
20
0
20
40
60
80 BE DK DE GR ES FR IE IT LU NL AT PT FI SE UK
of total value of transactions
Source ECB
40
20
0
20
40
60
80
1996 1998 2000 2002 2004 2006
of total volume of transactions
Bank of Finland Bulletin 2007 bull 4 23
Increasing pressure for change
Payment systems are currently being
affected by several significant external
factors (Chart 7) For this reason we
can reasonably expect major changes
ahead in the development of payment
habits
A Single Euro Payments Area
(SEPA) is currently being established
in Europe The aim is to make
payments in the euro area as simple
and at least as efficient as in the most
sophisticated current national systems
Increased competition will foster
more efficient operations while
common standards will generate
economies of scale The payment
processing rules of banks will be
harmonised and new efficient
payment standards will be drafted
With the introduction of the Payment
Services Directive payment legislation
will also be harmonised The directive
will enter into force in November
Chart 7
2009 and contains provisions on eg
booking payments at full value the
prohibition of value dating a
maximum one-day execution time
(apart from a few exceptions) and
banksrsquo and customersrsquo general
responsibilities for payments
Regulation (EC) No 25602001 on
cross-border payments in euro
already stipulates that the charges
levied for cross-border payments in
euro must be the same as those for
domestic payments in the euro area
Creating a single payments area
will however be a longer process As
Finnish payment services are already
fairly sophisticated the benefits of a
single payments area will initially be
minor in Finland and they will be
fully gained only after some time
compared with countries that have
less sophisticated payment systems
Competition authorities have
paid attention to the need to enhance
Growing pressure for change in payment services
Payment services directive and
regulation
Growing data security
requirements
Technological developmentsndash online services available everywherendash local interfacesndash mobile phone services
Sharply declining IT costs
New electronic competitors
Increased transparency in
pricing
Competition authorities
transparency requirements
General electronification
and digitalisation
New open payment standards
SEPA rules and regulations
Growing pressure for change in
payment services
Source Bank of Finland
24 Bank of Finland Bulletin 4 bull 2007
seems to be only a matter of time
before payment cards are digitalised
and incorporated into mobile phones
just as calendars e-mail cameras
radios and the Internet already have
been
Card payments could then be
made by pressing the keys on the
mobile phone and the necessary
payment information would be auto-
matically transferred between the
phone and the shoprsquos payment
terminal via a local connection As
mobile phones develop it will
become even simpler to purchase
various types of tickets than it
currently is to purchase Helsinki City
Transport tram tickets via SMS text
messages
ICT costs continue to decline by
approximately 20ndash25 per annum
Modern Internet services are a clear
proof that data communication
processing and storage capacity no
longer hinder the processing of data ndash
particularly in the case of payments
as these contain only a very small
amount of data
Cost trends and increased
competition are likely to result in a
decline in payment fees in the coming
years The full digitalisation of
payments may cut costs to levels close
to those of other extensive network
services such as e-mail and SMS text
messages
Network-based payment
requires solid data security solutions
The more money is transferred in
open networks the higher the
competition in payment services2
New open standards and increased
transparency in pricing will
contribute to achieving this goal
Customers find it hard to choose
efficient payment instruments and
advantageous service providers when
there is widespread use of hidden
pricing based for example on value
dating or the use of interest income
from deposits and loans to subsidise
payment costs and the inclusion of
payment costs in product prices
If withdrawing cash from an
ATM appears to be cost-free this
boosts the use of cash By paying for
purchases by payment cards we could
prevent or cut the costs of
maintaining an extensive network of
ATMs the transportation of cash
and cashing up
Data connections favour
new services
New international electronic payment
solutions enabling fast and
inexpensive online and mobile
payments are also being launched on
the payments market which will
boost competition significantly
Electronification and digitalisa-
tion are progressing rapidly
Broadband connections and personal
computers will soon be found in
almost every household Nearly every
Finn already has a mobile phone and
the properties of mobile phones are
continuously being developed It
2 See eg the European Commissionrsquos lsquoReport on the retail banking sector inquiryrsquo January 2007
It is probably only
a matter of time
before payment
cards are digitalised
and integrated into
mobile phones
Bank of Finland Bulletin 2007 bull 4 25
number of abusers and criminals it
will attract It is vital to invest in
improving network security and
customers will have to learn how to
identify the various forms of network
crime Network-based payments
require solid customer identification
methods and the encryption of the
connections and transactions
Customers will need safe equipment
that ensures the reliable storage and use
of identification and encryption keys
Customers looking for change
and integration
Payment always entails the transfer of
funds from payer to payee In a
modern economy this usually takes
place in the form of electronic credit
transfers In a bank-centred economy
this is also true when payments are
made using cash as consumers
withdraw money from their bank
account via ATMs and retailers
deposit daily receipts on their bank
accounts at the end of the business
day Money takes this physical form
only temporarily
The payment process is being
digitalised into electronic account
entries made only in the payment
system network Network users will
be interested particularly in the
development of the following charac-
teristics service costs and fees speed
of entering payments payment
security simple interfaces and
efficient integration
The costs of processing and
booking payments in service
providersrsquo systems will decline signifi-
cantly as a result of full digitalisation
The changeover to network-based
services together with complete digi-
talisation will also enable the booking
of payments in real time or close to
real time In the network world cost
savings are achieved by immediate
processing less-complicated
processes the immediate resolution of
possible error situations and the
simpler management of functions For
example delaying the processing of
e-mail or SMS text messages by one
day would only create additional
costs and no benefits
New payment methods must be
secure in order to gain popularity
Customers find it important that the
required security measures are clear
and easy They need a general and
multi-purpose identification solution
for online services The growth of
e-commerce and e-business is hampered
by the current requirement for
service-specific identification
Banks are offering their own
security solutions to the other
providers of network services This is
however insufficient as an EU-wide
service provider for example would
have to have a contract with and link
to each of the approximately 5000
European banks We need a uniform
and secure electronic identification
service
Internet and SEPA standards
provide basic interfaces and channels
for electronic payments A private
customer can make a payment by
Growth of
e-commerce and
e-business is
hampered by the
current requirement
for service-specific
identification
26 Bank of Finland Bulletin 4 bull 2007
clicking on screen menus The largest
gains can be achieved however by
integrating customersrsquo systems with
the banksrsquo payment systems Both
private and corporate customers are
most interested in the opportunities
provided by electronic invoicing
Currently invoicing is highly manual
and paper-based
A changeover to electronic
invoicing would generate significant
benefits It is already being
introduced in the Nordic countries
A number of studies in various
countries show that introducing e-
invoicing into business-to-business
invoicing would reduce processing
costs by as much as EUR 10 to 30 per
invoice The European Commission is
therefore very justifiably launching a
project to promote e-invoicing
throughout the EU3
Private customersrsquo interest in the
e-invoice and particularly in the
e-archiving of payments and invoices
was clearly demonstrated in the
results of a recent consumer survey
conducted by the Bank of Finland4
(Chart 8) Private customers are even
more interested in the e-archive than
the e-invoice as a form of service
Customers are used to keeping
e-mails pieces of music videos and
photographs in an electronic archive
that can be browsed and they clearly
hope that payments and invoices
could also be stored in these types of
archives Compared to an e-archive
for photographs and e-mails an
e-archive for invoices would require
much less memory The advantages
are obvious when searching for an
old invoice or payment The intro-
duction of e-invoices provides
opportunities for creating e-archives
for payments
Other possible areas for
integration are various travel tickets
as well as tickets for sports and
cultural events These are increasingly
purchased on the web and can be
stored either directly in the robustly
expanding mobile phone memory
3 European Electronic Invoicing (EEI) Final Report of the European Commission Informal Task Force on e-Invoicing4 Dahlberg and Oumloumlrni (2006) Finnish consumersrsquo expectations on developments and changes in payment habits Bank of Finland Discussion Papers 322006
Chart 8
Private customers interest in e-invoicing and e-archiving
1 2 3 4 5 6 7
Source Survey by the Bank of Finland in 2005
30
25
20
15
10
5
0
Minor importance Very important
I am interested in using the new payment method if I cana) give up using separate printed invoicesb) keep payment information in an e-archive that I can browse
a) e-invoice b) e-archive
Bank of Finland Bulletin 2007 bull 4 27
andor on the Internet to be accessed
by mobile phone The management of
tickets will become simpler for both
service providers and users For
example ticket checking can be
automated and speeded up The
development and integration of ticket
practices is a good example of
potential benefits but also of the
need for extensive cooperation in the
development of new integration
solutions
Electronification calls for
increasingly extensive coordinated
efforts The efficient transfer of travel
tickets to mobile phones requires eg
the development of mobile phone
software secure storage and e-identi-
fication methods the construction of
links between payment terminals and
mobile phones the development of
banksrsquo payment systems the
conversion of service providersrsquo ticket
applications to self-service online
applications and the improvement of
data communications providersrsquo
applications This must be a
coordinated effort The task becomes
more difficult as the introduction of
new integrated solutions affects a
continuously growing number of par-
ticipants
Steady development or a quantum
leap in payment habits
Payment services seem to be on the
verge of a major change Traditional
payment instruments such as cash
credit transfers and payment cards
will probably still be used for a long
time to come and their use is likely to
develop in line with the trends
discussed above Several factors
suggest however that the traditional
payment instruments could in future
be accompanied by a network-based
payment instrument that is fully
digitalised real time most likely
international and utilising Internet
and mobile phone technology
Payments and invoices will be
confirmed by the click of a mouse
and all the information will be
available only on screen More
detailed information will be available
in e-archives when needed and the
current paper receipts will be replaced
by electronic receipts The adoption
of new payment habits is spreading
gradually in the shape of an S curve
and traditional payment habits are
gradually being replaced Similar
developments have already taken
place in the use of e-mail and SMS
text messages How did we manage
before the Internet and the mobile
phone In some 10 years we will
probably wonder how we could have
ever managed without the e-invoice
and m-payments
Keywords payment habits
payment systems electronic payments
Alongside traditional
payment methods
we could see the
emergence of a fully
digitalised real time
international
network-based
payment instrument
Bank of Finland Bulletin 2007 bull 4 29
T
The euro area current account has
remained balanced throughout
the entire period of European
Monetary Union (EMU)
Country-specific differences have
however been extremely large
Spainrsquos current account deficit has
in recent times been as much as
10 of the countryrsquos GDP
Monetarily it is the second largest
current account deficit in the
world after the United States
amounting to substantially more
than USD 100 billion in
annualised terms In contrast
Germany has a current account
surplus that is slightly higher still
in dollar terms It is in fact nearly
as large as Japanrsquos The euro area
balance is thus explained by the
steep opposition between the
Spanish and German current
accounts combined with other
euro area countriesrsquo small ndash if in
some small countries relatively
large at national level ndash deficits or
surpluses in dollar terms
The role of balance of payments
This article concentrates on capital
flows in the euro area as a whole and
their impact on the euro area
financial markets Euro area capital
flows which can as such be very
different in nature have not exhibited
any major imbalances while their
direct impacts on investment and
economic growth have also not been
particularly significant The most
Euro area balance of payments and the financial markets28 November 2007
significant feature is perhaps the
almost constant capital outflow in
direct investment and inflow in
portfolio investment For the financial
markets themselves however interna-
tional capital flows have been
significant At times they have had a
major impact on monetary (M3)
growth in the euro area at times even
greater than bank lending
A particularly striking liquidity
surge from the balance of payments
was first seen in 2001ndash2003 In this
connection the European Central
Bank (ECB) has spoken in terms of
portfolio shifts due to exceptional
uncertainty but this can be taken as
just a partial explanation A strong
and even faster liquidity surge
occurred at the end of 2006 and
beginning of 2007 The primary
source of liquidity in both cases
seems to have been the inflow of
capital into euro area securities in the
first case primarily into equities and
in the second into debt securities
The balance of payments depicts
the external balance of the
economy
Balance of payments statistics
describe the external balance of the
real and monetary economies The
current account is a summary of real
economic transactions between an
economy and the rest of the world It
describes the impact of foreign
economic activities on national
income and the balance between
savings and investment in the
Jarkko KivistoumlEconomistMonetary Policy and Research
Tapio KorhonenEconomistMonetary Policy and Research
30 Bank of Finland Bulletin 4 bull 2007
used to finance foreign transactions
when the exchange rate needs to be
held steady1
As the balance of payments is a
flow statistics a related concept is net
external assets which describes the
stocks of external assets and liabilities
A current account deficit increases the
(net) external liabilities of an economy
while a surplus adds to the (net) assets
In addition stock statistics take
account of changes in exchange rates
and other valuation items that may
often have a major impact on asset
levels even though they are not shown
in the flow statistics
Developments in the euro area
current account
The euro area current account has
fluctuated monthly from a deficit of
around EUR 12 billion at its highest
to an equally large surplus In
cumulative 12-month terms the euro
area current account was in deficit in
the early stages of the euro era rising
to surplus in 2002 (Chart 1) At the
end of 2005 cumulative data shows
that the current account went once
again into deficit mainly due to the
higher price of oil Euro area current
account deficits and surpluses have
however been very small accounting
1 The terminology used in the balance of payments varies in the statistics produced by different institutions The financial account in particular is defined in different ways It may or may not include change in currency reserves (and an error item) For example the IMF publication International Financial Statistics (IFS) does not include the change in currency reserves in the financial account unlike the monthly publications of the European Central Bank (ECB) and the Bank of Finland
economy The capital account
includes gratuitous capital transfers
and purchases and sales of patents
trademarks and other intangible
assets The financial account shows
changes in external assets and
liabilities It describes the financing of
the current account deficit or the
investment abroad of the current
account surplus
By definition the sum of the
component accounts ndash ie net income
and expenses in the balance of
payments ndash is zero Sometimes
however reference is made to a
balance of payments surplus or deficit
What is actually meant is a surplus or
deficit on the current account or one
of the other component accounts
within the balance of payments
Within the balance of payments we
can also distinguish an overall
account which is the sum of all the
component accounts excluding the
change in foreign reserves Foreign
reserves is the item that is ultimately Chart 1
Euro area current account and trade account12-month cumulated transactions
EUR bn150
100
50
0
ndash50
ndash100
Source European Central Bank
1999 2001 2003 2005 2007
1 Current account 2 Trade account
1
2
Bank of Finland Bulletin 2007 bull 4 31
Taken as a whole the balance of payments account is always in balance In principle all transac-tions are entered in accordance with double-entry bookkeeping For example exports of goods are entered as a positive figure in the current account while the associated financing is entered as a negative figure in the financial account in terms of an increase in external assets Because data on real flows and monetary flows come from different sources they do not totally match in the balance of payments statistics at least not in the short term This is why the balance of payments contains an item that covers errors and missing transactions
An error term may result from for example entry of the same transaction at different times in different accounts or from insufficient data Errors arising from timing differences offset each other in due course Cumulatively errors and omissions should be close to zero The cumulation of an error may be an indication of a systematic fault in the compilation of statistics In the balance of payments for the euro area errors and omissions have
Box
Compilation of balance of payments statistics
been negative cumulatively since 2003 which indicates either a shortfall in the statistics for increase in assets or an excessive increase in liabilities The error may also originate from the real economy ie current account statistics For example there could be problems with the statistical compilation of trade in services It is possible that part of the increase in the error term is due to internal euro area asymmetries ie different statistical treatment of the same economic transactions between euro area countries
Globally the balance of payments statistics are also in imbalance even though the sum of real and financial flows should be zero The world current account shows an aggregate deficit While the trade account is in surplus the income account in especially strongly in deficit The lsquosurplusrsquo in the trade account probably stems from the fairly comprehensive entry of exports in source country statistics while importers may have a reason to avoid official registering of imports The income account lsquodeficitrsquo for its part suggests that payment of income is entered but
recipients may seek to avoid paying tax on their income In addition not all offshore financial centres such as the Cayman Islands or Bermuda report their balance of payments statistics to the IMF As regards services deficiencies in reporting may arise from the flagging out of vessels to countries that do not report the transportation income received
Responsibility for the compilation of euro area balance of payments is divided between the ECB and Eurostat The ECB is responsible for preparation of the financial account and of the investment income account within the current account Computation of euro area balance of payments statistics is based on relevant data submitted by euro area countries on their transactions with non-euro area countries By aggregating these statistics we obtain the balance of payments for the euro area For some items such as the debit side of portfolio investment the information available is not sufficient In such cases data on economic transactions between euro area countries is used to help gain a fuller picture
32 Bank of Finland Bulletin 4 bull 2007
at their highest for only about 1 of
the arearsquos GDP
Recent months have seen the
deficit shrink close to balance driven
by robust euro area exports Part of
this growth in exports originates from
sales to oil-producing countries that
have channelled part of their higher
income from oil into import growth
The current account is dominated
by the trade account Goods exports
account for an average of 60 of
current account income with the
import-to-expenses ratio being
somewhat smaller The trade balance
has been systematically in surplus
Euro area exports are dominated by
the United Kingdom the United States
and Switzerland but other non-euro
area EU countries together constitute
another major export market Euro
area imports originate mainly from the
United Kingdom the United States
and China
The key items in the services
account are transportation and travel
The euro area services account has
been in surplus for many years
The income account includes
labour compensation costs and
investment income of which the
latter ndash comprising income from
direct investment portfolio
investment and other investment ndash is
more important Net investment
income has been in deficit since the
introduction of the euro This is
mainly due to interest and dividend
expenses related to portfolio
investment
In contrast current transfers
have been systematically in deficit
This is because EU institutions
(excluding the ECB) are considered
non-euro area parties Thus all
economic transactions between euro
area countries and EU institutions are
registered in the balance of payments
Current transfers include for
example member statesrsquo EU
membership fees2
Data on euro area balance of
payments broken down by country
is available from 2003 onwards3 The
euro area has had a systematic
current account deficit only with
Japan and EU institutions
The euro area as investment
target and as investor
Structure of investment
The main items of the financial
account are direct investment
portfolio investment other
investment financial derivatives and
reserve assets Portfolio investment is
divided into investment in equities
bonds and notes and money market
instruments The portfolio investment
account differs from the other
2 Income transfers with EU institutions show a deficit of EUR 40 billion to the euro area ie that is the net sum paid by the euro area to EU institu-tions In contrast the capital account is EUR 19 billion in surplus This sum includes items such as transfers from EU support funds3 Country-specific data has been available for the following countries Sweden Denmark the United Kingdom other EU countries EU institutions Canada Japan the United States Sweden offshore financial centres international organisations and others This list has recently been extended to include China Brazil India and Russia
The euro area
services account
has been in surplus
for many years
Bank of Finland Bulletin 2007 bull 4 33
investment account in containing
marketable instruments
The other investment account
includes financial claims that are
based on bilateral agreements and do
not have a secondary market Such
items comprise loans deposits and
trade credits The predominant item
is loans and deposits by financial
institutions on both the credit and the
debit side International payments
cleared through financial institutions
are mainly reflected in this item
Flow data in respect of
derivatives includes premia on
derivative contracts interim and net
value disbursements and actual net
payments between parties Although
the value of underlying assets in
derivatives contracts may be
extremely high derivatives do not
play a major role in euro area balance
of payments The derivatives item is
only available in net terms4
Reserve assets include assets
denominated in foreign currency and
owned or managed by the Eurosystem
These include monetary gold special
drawing rights and foreign exchange
The largest items in the Eurosystem
reserve assets are gold and foreign-
currency-denominated securities assets
Because the euro is a floating currency
the Eurosystem does not normally
carry out currency interventions This is
why changes in reserve assets are minor
and are primarily based on changes in
4 This applies to flows whereas the figures for stocks denote the market value of current contracts Contracts in the black are claims while those in the red are liabilities
the external value of the euro Reserve
assets are therefore not discussed
separately below
Direct investment
Direct investment describes interna-
tional mergers and acquisitions and
financial flows between units of
multinational conglomerates It is
necessary to underline that statistics
only describe the financing of direct
investment from and into the euro
area and not actual productive inter-
national investment Direct
investment is divided into equity
financing reinvested earnings and
other capital Reinvested earnings are
also entered under investment income
in the current account and the
financial account has a counteritem
as part of direct investment
In multinational conglomerates
financing is often arranged via special
financing centres many of which are
located in Luxembourg the
Netherlands or Ireland for tax
reasons Direct investment statistics
only tell the direct target country of
the financial flow which is not
necessarily the country where the
actual investment will eventually be
made However if the investment is
channelled via a finance company
located in the euro area it does not
necessarily skew euro area statistics
as much as it might skew the statistics
of individual euro area countries
provided that either the investor or
the ultimate investment target are
also in the euro area
Statistics only depict
the financing of
direct investment
from and into the
euro area not actual
productive interna-
tional investment
34 Bank of Finland Bulletin 4 bull 2007
the joint venture These types of
arrangements are reflected in
financial flows in different directions
but not in net flows
Direct investment from the euro
area has been higher than inward
investment from abroad (Chart 2)
Net flows in direct investment have
been clearly outward from the euro
area especially since 2004
Direct investment peaked at the
turn of the millennium when
investment in US-based ICT-sector
companies in particular was very
pronounced6 At the end of 2006 the
stocks of euro area direct investment
in the United States and US direct
investment in the euro area were
close to balance Based on the stock
of investment the most important
investment target at the moment is
the United Kingdom At the end of
2006 euro area investment in the
United Kingdom stood at EUR 800
billion compared with approximately
EUR 600 billion in the United States
Another major investment target are
offshore financial centres where euro
area direct investment totalled slightly
less than EUR 330 billion at the end
of 2006 All in all the stock of
outward direct investment at this
time stood at EUR 3076 billion
Inward direct investment in the
euro area in 2006 was similarly
dominated by the United Kingdom at
slightly over EUR 1020 billion with
direct investment from the United
6 Anderton et al 2004
The volume of direct investment
varies a great deal from month to
month From time to time large
acquisitions and related financial
arrangements can be seen in the
statistics such as the ownership
arrangements for Shell in July 2005
Often large acquisitions ndash particularly
mergers ndash are associated with mutual
financing arrangements which means
that the transaction is entered as
direct investment abroad and in the
euro area or the direct investment is
matched by a corresponding portfolio
investment5 The merging company
may become a partner in the joint
venture to be established and pay its
share by handing over its business to
5 In February 2000 for example the British company Vodafone bought Mannesmann from Germany for EUR 145 billion The transaction was paid for with Vodafone shares so a direct investment in the euro area was entered in the balance of payments along with an increase in portfolio claims and a decrease in portfolio debt (because the majority of Mannesmann shares were already held by foreign investors)
Chart 2
Euro area direct investment12-month cumulated transactions
EUR bn600
400
200
0
ndash200
ndash400
ndash600
Source European Central Bank
1999 2001 2003 2005 2007
Capital inflow (+) Capital outflow (ndash)
1 Direct investment assets 12-month cumulated transactions2 Direct investment liabilities 12-month cumulated transactions3 Direct investment net monthly data
1
2
3
From time to time
large acquisitions
and related financial
arrangements can be
seen in the statistics
Bank of Finland Bulletin 2007 bull 4 35
States standing at approximately EUR
630 billion Altogether the stock of
inward direct investment at the end of
2006 stood at EUR 2660 billion
Growth in investment from new
EU member states has been particularly
rapid since 2004 Investment has
grown more than sevenfold compared
with the situation at the end of 2003
However at EUR 23 billion the stock
of investment is still rather modest The
stock of euro area investment in new
member states shows a smoother
development path although in
2004ndash2005 this also grew at an annual
pace of approximately 30 Overall
the stock of euro area investment in new
member states amounts to EUR 190
billion with privatisation arrangements
initiated in the 1990s liberalisation of
economies and expectations regarding
EU membership being the main con-
tributors to the accelerated investment
flow into the new members7
At USD 1300 billion global
direct investment was close to its
historical peak in 20068 with
approximately a quarter of this
investment being into the euro area
This record figure also includes
bilateral investment between euro
area countries which is not included
in the euro area balance of payments
With this investment excluded
capital flows into the euro area in the
form of direct investment totalled
7 Lane and Milesi-Ferretti (2006a) provide a more thorough analysis of capital flows in eastern Europe8 UNCTAD (2007)
some EUR 177 billion ie slightly
more than USD 220 billion Global
direct investment has grown at an
annual pace of nearly 30 for
several years in a row The majority
(USD 857 billion) of this investment
was channelled into the industrial
economies but investment in
emerging economies has also reached
record levels Investment in Asia
increased by 15 In 2006 China
was among the three largest recipients
of direct investment with the
investment flow into China an
estimated USD 70 billion9
Low interest rates have
contributed to an increase in
corporate acquisitions by private
equity funds10 These acquisitions can
be largely financed though debt
securities or by means of a leveraged
buy-out Corporate acquisitions by
funds nearly doubled from 2004 to
2005 In 2006 equity investment in
the euro area was 50 higher than in
2005 (at approximately EUR 170
billion)11 In contrast there has been
little increase in comparable outward
investment from the euro area
In economics the scale of direct
investment has traditionally been
explained by bilateral trade flows and
9 The quality of these statistics is however not yet fully reliable statistical compilation practices are not fully compatible with international standards and statistics are prepared by two different methods at two separate institutions10 UNCTAD (2006)11 Admittedly the 2006 first quarter balance of payments for the Netherlands included an excep-tionally large acquisition that resulted in euro area direct investment swelling to more than EUR 80 billion in both directions
Low interest rates
have contributed to
an increase in cor-
porate acquisitions
by private equity
funds
36 Bank of Finland Bulletin 4 bull 2007
by a gravity model adopted from
physics whereby the economic size
(mass) of a country and the distance
between countries affect direct
investment flows On the corporate
level the motive for direct investment
may be to gain a competitive edge in
the market through cheaper factors of
production or improved products
production processes marketing and
distribution networks In addition
direct investment may be a way to
circumvent administrative restrictions
such as customs and quotas Direct
investment has been considered an
important factor in transferring
technology from one country to
another On the other hand closer
links between economies via direct
investment also mean cyclical changes
are carried over more easily from one
area to another12
12 Jansen and Stokman (2007)
Portfolio investment
Contrary to direct investment
portfolio investment shows a net
inflow into the euro area Throughout
almost the entire existence of the
euro portfolio investment into the
area has in fact exceeded outward
portfolio investment This applies to
both equity investment and (partic-
ularly) investment in debt instruments
At the turn of the millennium
outward net investment in equities
from the euro area was strong partic-
ularly to the United States Since 2001
the direction of equity investment has
been predominantly into the euro area
(Chart 3) The equity investment
inflow has been particularly strong
since the middle of 2005 indicating
that investors have considered euro
area growth potential to be higher
than that of other key market areas
Indeed euro area share prices have
been rising faster than those of US
shares since 2004 The performance of
the euro has further supported this
investment trend insofar as on top of
the return on capital invested foreign
investors have also benefited from
exchange rate gains
Outward equity investment from
the euro area has been predominantly
to the United States and the United
Kingdom with the stock of investment
at the end of 2006 amounting to
approximately EUR 670 billion and
EUR 390 billion respectively The
total stock of outward investment
stood at EUR 2012 billion Besides
flows this also includes various
Chart 3
Euro area portfolio investment12-month cumulated transactions
EUR bn800
600
400
200
0
ndash200
ndash400
ndash600
Source European Central Bank
1999 2001 2003 2005 2007
1 Equities assets 3 Bonds and notes assets2 Equities liabilities 4 Bonds and notes liabilities
1
2
3
4
Bank of Finland Bulletin 2007 bull 4 37
valuation factors such as changes in
prices and exchange rates Hence the
stock of equity investment increases as
share prices rise
In 2006 outward equity
investment from the euro area rose to
slightly more than EUR 150 billion in
terms of the 12-month moving total
but this had fallen to EUR 100 billion
by the beginning of 2007 the same
level as prior to 2006
Particularly noteworthy in equity
investment is the recent rise of bonds
In cumulative 12-month terms invest-
ment in euro area bonds doubled in the
second half of 2006 from EUR 250
billion to EUR 500 billion In 2005
foreign investment in euro area shares
grew even more in relative terms In
June 2007 portfolio investment in euro
area shares amounted to some EUR
330 billion in cumulative terms
Investment in bonds is partly a
reflection of the securitisation of
mortgages which has been partic-
ularly significant in Spain Indeed
Spain has been a major contributor to
the increase in bond debt Germany
has been the biggest issuer of bonds
in the euro area over the long term
Euro area investment in foreign
bonds is dominated by the United
States and the United Kingdom A
country-specific breakdown of data is
not available for portfolio investment
liabilities Some picture of inward
investment in the euro area can be
derived from the balance of payments
data for investor countries provided
country-specific data is available The
Coordinated Portfolio Investment
Survey (CPIS) by the IMF also offers
additional information albeit not the
most recent data Key countries with
the highest investment in euro area
bonds at the end of 2005 were Japan
(25 of all investment) the United
Kingdom (18) and the United
States (10)13
Globally portfolio investment has
increased According to the CPIS
survey between 2001 and 2005 the
stock of foreign investment doubled to
more than USD 10 trillion Euro area
countries together account for 32 of
this investment stock14 Comparable
developments have been witnessed in
the bond markets the stock of inter-
national holdings at the end of 2005
totalled USD 15 trillion of which euro
area investment accounts for 40
Approximately half of inward
investment in the euro area originates
from the United States followed by
the United Kingdom (18) and
Switzerland (11)
In theory as markets expand
international investment flows
increase as a result of the diversifica-
tion of risk1516 Investors aim to
13 Globally Japan has favoured portfolio investment in bonds whereas the United States and the United Kingdom along with other industrial countries emphasise investment in equities (Lane and Milesi-Ferretti (2006b))14 The euro area is not included as an aggregate in the CPIS survey and this figure therefore includes investment within the euro area that is netted off from euro area balance of payments aggregates15 De Santis (2006)16 According to the International Capital Asset Pricing Model theory international investors should build their portfolios in such a way that they contain investments in different countries in proportion to the relative size of each market
Globally portfolio
investment has
increased
38 Bank of Finland Bulletin 4 bull 2007
kind of impact to be even stronger
than the impact of yields especially in
developing markets20 A closer
analysis shows the above-mentioned
feedback explanation is more
applicable to European countries
As with direct investment
gravity models have also been
relatively accurate in explaining
investment flows in equities It has
been observed that gross flows in
equity investment depend on the size
and distance of markets and on the
costs and technology of trading The
distance of markets as a variable is
probably a very good indicator of
informational asymmetries In inter-
national investment geography has
not been observed to have a major
impact on government bonds which
is probably due to the availability of
adequate information21
Investment yields and influencing
factors
Debate about the large current
account deficit in the United States has
highlighted the contradiction that the
US investment income balance has for
long been in surplus at the same time
as the country has been running a
large net external debt In 2005 US
net external debt amounted to as
much as USD 2500 billion In the
investment income balance yields on
direct investment in particular show a
surplus One explanation proposed for
this is tax planning by multinational
20 Lin and Swanson (2007)21 Portes and Rey (2005)
diversify their portfolios geographi-
cally too in proportion to the size of
different markets17 On the other
hand financial market globalisation
means that when risks do materialise
impacts will not be restricted to a
single area but will be borne by all
investors18 However the actual
impacts depend on the characteristics
of the investment portfolio (shares
bonds currency maturity liquidity)
Movements in portfolio
investment can generally be explained
by differences in growth prospects for
different economic areas and by
differences in interest rates
Investment is channelled into areas
where the expected growth or real
interest rate is higher The natural and
empirically tested explanation for
flows in equity investment is the
actual earnings per share obtained in
the market19 In other words realised
profits entice new investment (the
feedback explanation) On the other
hand investment flows can
themselves boost share prices This
may be due to expected developments
in economic fundamentals or to
short-term price pressures caused by
the flow of capital into the stock
markets Recent research shows this
17 In practice investment has not been spread in accordance with the theory as portfolios contain a home bias meaning that considerably more investment is made in the home market than would be optimal according to the theory One explanation put forward for this is asymmetric information (non-resident investors have less information about the status of foreign companies) The home bias has decreased significantly within the euro area since the launch of EMU (De Santis (2006))18 Lane and Milesi-Ferretti (2005a)19 Froot (2001)
Investment is
channelled into
areas where the
expected growth or
real interest rate is
higher
Bank of Finland Bulletin 2007 bull 4 39
corporations The long-term nature of
US investment also seems to be an
important contributor However a
comprehensive and entirely credible
explanation for this statistical contra-
diction has yet to be found22
In euro area statistics direct
investment income received and paid
out are very similar in size In
contrast there are differences in the
statistics for individual countries The
situation in France is similar to that
of the United States whereas in
Ireland outgoing income is much
higher than the income received on
direct investment abroad by Irish
residents Undeniably this is a
reflection of tax planning by US
companies In France the corporate
tax rate is 33 while in Ireland it is
12523
In 2006 euro area direct
investment income received was
approximately EUR 170 billion
while direct investment income paid
out amounted to nearly EUR 110
billion Relative to the stock of
investment the euro area received a
yield of 55 and paid out 42 A
longer-term examination shows that
the income received and yields paid
by the euro area on direct investment
have been more or less equal
In 2006 yields paid by the euro
area on portfolio investment
amounted to EUR 190 billion while
income from portfolio investment
22 A good overview of this issue can be found in Heath (2007)23 KPMG (2007)
outside the euro area totalled EUR
140 billion Relative to the stock of
investment income from euro area
investment abroad and yields paid by
the euro area on investment made by
non-residents totalled some 32
International investment position
At the end of the second quarter of
2007 the euro area international
investment position showed a net debt
of EUR 1174 billion corresponding
to 136 of euro area GDP The
negative net investment position is due
to portfolio investment showing a
negative EUR 1702 billion In direct
investment euro area net assets
amounted to EUR 495 billion
The investment position is affected
not only by the transactions entered in
balance of payments statistics but also
by changes in exchange rates and other
valuation items In 2001 the euro area
net international investment position
was a negative 56 of GDP The
subsequent growth of this debt to more
than 13 of GDP is largely due to the
appreciation of the euro24 The positive
development of share prices in the euro
area has been another contributory
factor
At the end of 2006 the US net
international investment position was
negative in the amount of approxi-
mately 20 of GDP At the same
time Japanrsquos international investment
position showed net assets of some
40 relative to GDP
24 ECB (2007)
40 Bank of Finland Bulletin 4 bull 2007
Balance of payments and
money supply
The view of the ECB regarding the
monetary policy significance of the
balance of payments is reflected in
the fact that since 2003 the statistical
section of the ECBrsquos Monthly Bulletin
has provided a monetary presentation
of the balance of payments The
external transactions of sectors other
than the MFI sector are shown in the
balance of payments as changes in
external assets and liabilities insofar
as the transactions are cleared
through banks Items in the current
and capital accounts and errors and
omissions cannot be divided between
MFIs and other sectors It is however
reasonable to assume that the
resulting distortion is not significant
The monetary presentation of the
balance of payments thus shows the
transactions that affect changes in
MFI sector net external assets The net
external assets of MFIs are shown in
the MFI balance sheet as counterparts
to the M3 monetary aggregate namely
minus loans to euro area residents
minus euro area MFIs net external
assets
minus minus MFIsrsquo long-term liabilities
minus plus other MFI counterparts
The causes of money supply develop-
ments can be assessed by examining
developments in these counterparts
(Chart 4) For example when an MFI
grants a loan the counterpart is
generally a deposit with another MFI
which means that loans and deposits
grow in parallel A balance of
payments transaction that reduces the
money supply is generally one where
a domestic economic unit that
purchases goods or monetary assets
from abroad pays the purchase with
its deposits This money is then
transferred abroad with the result
that the net external assets of the MFI
decrease (when the MFI credits the
account of the foreign exporter) Cor-
respondingly exports of goods or
imports of capital (increase in the
exporterimporterrsquos external liabilities
or decrease in its external assets)
means an increase in the domestic
money supply and also in the net
external assets of the MFI
In the early phase of the euro
era in 1999ndash2000 lending by MFIs
was very strong but M3 growth was
retarded by the impact of other
supply factors particularly the balance
Chart 4
1 M3 money supply 2 Credit to other euro area residents3 Credit to general government 4 MFI net external assets5 MFI longer-term financial liabilities (increase ndash)
Euro area monetary growth and its counterparts12-month cumulated transactions
EUR bn1500
1000
500
0
ndash500
ndash1000
Source European Central Bank
1999 2001 2003 2005 2007
1
2
34
5
Bank of Finland Bulletin 2007 bull 4 41
of payments ie capital outflow First
and foremost capital outflow was due
to the scale of euro area equity
investment abroad (Chart 3) In 2001
the flow of equity investment turned
sharply towards the euro area
through both an increase in
investment by non-residents and a
decrease in equity investment abroad
by euro area residents When shares
were sold to non-residents the sellersrsquo
deposit accounts gained from
incoming payments
The ECBrsquos explanation for the
simultaneous growth in monetary
aggregates cited the portfolio shifts
associated with the exceptional
uncertainty prevailing at this time
This referred to investors changing
the composition of their portfolios by
replacing long-term investments with
more liquid and less risky
instruments This was partly reflected
in the balance of payments when
shares were sold to non-residents A
similar phenomenon could be seen in
the strong growth of investment in
money market funds which are a
component of M325
It is however likely that other
quite normal market factors provide
a more plausible explanation for the
shift in investment than the
lsquoexceptional uncertaintyrsquo referred to
above Although the reversal in the
direction of equity investment at the
time was strong it was largely due to
the normalisation of the preceding
25 ECB (2004)
exceptional investment flows In fact
part of the change can probably be
explained simply by developments in
interest rates The US policy rate fell
rapidly in 2001 to well below the
ECBrsquos policy rate (Chart 5)
Since the introduction of the
euro changes in the net external
assets of MFIs have stemmed partly
from the current account Chart 6
presents developments in the current
Chart 6
Chart 5
1 Eurosystem minimum bid rate for main refinancing operations 2 US fed funds target rate
Central bank interest rates
7
6
5
4
3
2
1
0
Source Bloomberg
1999 2001 2003 2005 2007
1
2
1 MFI net external assets 2 Current account
Euro area current account and MFI net external assets12-month cumulated transactions
EUR bn400
200
0
ndash200
ndash400
Source European Central Bank
1999 2001 2003 2005 2007
1
2
42 Bank of Finland Bulletin 4 bull 2007
account and changes in banksrsquo net
external assets in cumulative 12-
month terms The difference between
the series describes the volume of
other capital flows The current
account and capital flows have
generally moved in parallel and
hence they have both contributed to
fluctuations in the money supply
However the growth in the money
supply at the turn of 2006ndash2007 was
entirely due to capital inflow
In 2007 growth in M3 has been
strong even hitting record levels Of
M3 counterparts particularly striking
was an increase in MFIsrsquo net external
assets at the end of 2006 and during
the first few months of 2007 For
example in November 2006 growth
in foreign counterparts (EUR 69
billion) was particularly due to
investment by non-residents in euro
area bonds (EUR 80 billion)
Investment in bonds has remained
strong (Chart 7) although the share
contributed by MFI lending has
increased The analysis is partly
complicated by large errors and
omissions in the balance of payments
Within the euro area the most
noticeable growth in net external
assets in the MFI sector has taken
place in Germany
Chart 8 compares non-residentsrsquo
investment in euro area bonds with
MFI net external assets and both of
these with developments in M3 After
2001 developments in MFIsrsquo net
external assets have closely followed
investment in bonds This connection
is particularly noticeable in recent
monthsrsquo strong growth and the
connection between this and M3
growth Although still originating in
the balance of payments the
explanation for M3 growth this time
can be found in different instruments
than in 2001ndash2002
One key explanation for growth
in debt securities may be carry trades
Chart 8
Chart 7
1 Bonds and notes assets 12-month cumulated transactions2 Bonds and notes liabilities 12-month cumulated transactions3 Bonds and notes monthly data net
Euro area bonds and notes capital inflow and outflowEUR bn
800
600
400
200
0
ndash200
ndash400
ndash600
ndash800
Source European Central Bank
1999 2001 2003 2005 2007
1
2
Capital inflow (+) capital outflow (ndash)
3
1 M3 money supply2 Bonds and notes net3 MFI net external assets
Bonds and MFI net external assets as counterparts of monetary supply12-month cumulated transactions
EUR bn1000
800
600
400
200
0
ndash200
ndash400
Source European Central Bank
1999 2001 2003 2005 2007
1
2
3
Bank of Finland Bulletin 2007 bull 4 43
which have recently been under the
spotlight In carry trading funds are
borrowed in markets with low
interest rates and reinvested in
markets with a higher yield at the
same time becoming subject to a
degree of exchange-rate risk
(admittedly part of the trade can be
hedged for example with options
but in this event part of the interest
rate difference will also be lost)26 The
appreciation of the euro and develop-
ments in euro area short-term interest
rates make the euro area attractive
for carry trading At the same time
some of the increase in supply of debt
securities based on housing mortgages
has probably been channelled abroad
As well as investment in debt
securities non-residents have also
invested to some extent in euro area
equities
Nevertheless the main reason
for growth in non-residentsrsquo
investment in the euro area is
probably the relative strengthening of
economic performance in the euro
area From the point of view of
interest rate policy these develop-
ments have led to a classical conflict
situation Rising market rates have
dampened inflationary pressures in
26 In practice carry trading is rather hard to separate from other investment activity For example the OECD (2007) states lsquoThe exact extent of the carry trade is difficult to deduce from statistics on cross-border flows which generally do not point to a recent upturn of outflows from Japan Most carry trades are probably undertaken through over-the-counter derivatives markets on which statistical evidence is rather meagre It seems nonetheless that derivatives markets played a role in both the upturn and subsequent unwinding of the yen carry trade at the beginning of the yearrsquo
the euro area but the increased
capital inflow has boosted euro area
liquidity supply thereby adding to
inflationary pressures On the other
hand the continued capital inflow
feeds the appreciation of the euro
which in turn serves to alleviate
inflationary pressures
Concluding remarks
The euro area current account has
remained close to balance although
major differences between individual
countries can be identified The euro
area has been characterised by capital
outflow in direct investment and
inflow in portfolio investment
Capital flows have had a major
impact on money supply Recently
non-resident investment in euro area
bonds has particularly contributed to
an increase in MFIsrsquo net external
assets
Financial market globalisation
increases the interdependency of
economies and the spillover of distur-
bances from one economy to another
Balance of payments statistics and
statistics on the international
investment position offer one way to
examine these impacts Although the
euro area as a whole is a more closed
economy than its individual member
states it is nonetheless more open
than the United States or Japan
Keywords balance of payments
financial markets capital flows
The euro area has
been characterised
by capital outflow in
direct investment
and inflow in port-
folio investment
44 Bank of Finland Bulletin 4 bull 2007
Anderton R di Mauro F and Moneta F (2004) Understanding the Impact of the External Dimension of the Euro Area Trade Capital Flows and Other International Macroeconomic Linkages ECB Occasional Paper No 12
De Santis R A and Luumlhrmann M (2006) On the Determinants of External Imbalances and Net Inter-national Portfolio Flows ECB Working Paper No 651
ECB (2004) ECB Monthly Bulletin October 2004
ECB (2005) lsquoEuro Area Balance of Payments and International Investment Position vis-agrave-vis Main Counterpartsrsquo ECB Monthly Bulletin February 2005
ECB (2007) lsquoEuro Area Balance of Payments and International Investment Position vis-agrave-vis Main Counterpartsrsquo ECB Monthly Bulletin February 2007
Froot K A OrsquoConnell P G J and Seasholes M S (2001) lsquoThe portfolio flows of international investorsrsquo Journal of Financial Economics 59 p 151ndash193
Heath A (2007) What explains the US net income balance BIS Working Paper No 223
IMF (2007) Coordinated Portfolio Investment Survey httpwwwimforgexternalnpstapicpishtm
KPMG (2007) KPMGrsquos Corporate and Indirect Tax Rate Survey 2007 KPMG International
Jansen W J and Stokman C J (2007) lsquoGlobal linkages through foreign direct investmentrsquo In di Mauro F and Anderton R (eds) The external dimension of the euro area ndash assessing the linkages Cambridge University Press 2007
Lane P R and Milesi-Ferretti G M (2005a) Financial Globalization and Exchange Rates IMF Working Paper No 053
Lane P R and Milesi-Ferretti G M (2005b) A Global Perspective on External Positions IMF Working Paper No 05161
Lane P R and Milesi-Ferretti G M (2006a) Capital Flows to Central and Eastern Europe IMF Working Paper No 06188
Lane P R and Milesi-Ferretti G M (2006b) The External Wealth of Nations Mark II Revised and Extended Estimates of External assets and Liabilities 1970-2004 IMF Working Paper No 0669
Lin A Y and Swanson P E (2007) lsquoUS investors and global equity marketsrsquo International Review of Financial Analysis (publication pending)
OECD (2007) Economic Outlook Vol 20071 No 81 June
Portesa R and Rey H (2005) lsquoThe determinants of cross-border equity flowsrsquo Journal of International Economics 65 p 269ndash296
UNCTAD (2006) World Investment Report 2006 FDI from Developing and Transition Economies Implications for Development Overview United Nations
UNCTAD (2007) World Investment Report 2007 United Nations Conference on Trade and Development
References
Bank of Finland Bulletin 2007 bull 4 C1
Charts
1 Finland key economic indicators
2 Price stability in the euro area and Finland
3 Official interest rates
4 International long-term interest rates
5 Bank reference rates in Finland and 12-month Euribor
6 Average lending and deposit rates
7 Stock of bank lending by interest rate linkage
8 MFI loans to private sector
9 Competitiveness indicators for Finland
10 Selected stock price indices in the euro area
11 Listed shares in Finland total market capitalisation and
non-residentsrsquo holdings
12 Bonds issued in Finland
13 Public sector balances in Finland
14 Central government debt
15 Finland goods account and current account
16 Finland services account and income account
17 Regional distribution of Finnish exports
18 Finnish exports by industry
19 Finlandrsquos foreign trade export prices import prices and terms of trade
20 Finlandrsquos net international investment position
21 Finland GDP and industrial production
22 Unemployment rate in the euro area and Finland
23 Hourly labour costs in the euro area and Finland
24 Selected asset prices in Finland
C2 Bank of Finland Bulletin 4 bull 2007
1 Finland key economic indicators
GDP volume change from
previous year
General government fiscal
position of GDP
Consumer prices
change from previous year
Unemployment rate
Current account of GDP
Sources Statistics Finland and
Bank of Finland
ndash10
ndash5
0
5
10
1
0
5
10
15
20
2
0
5
10
15
20 3
ndash10
ndash5
0
5
10 4
ndash10
ndash5
0
5
10 5
60 65 70 75 80 85 90 95 00 05
Bank of Finland Bulletin 2007 bull 4 C3
Harmonised index of consumer
prices 12-month change
1 Euro area
2 Finland
Sources Eurostat and
Sta tis tics Finland
2 Price stability in the euro area and Finland
3 Official interest rates
4 International long-term interest rates
Yields on ten-year government
bonds
1 Finland
2 United Kingdom
3 Japan
4 United States
Source Reuters
1 USA fed funds target rate
2 Japan overnight call rate
3 United Kingdom repo rate
4 Eurosystem minimum bid rate
Source Bloomberg
ndash1
0
1
2
3
4
1
2
2001 2002 2003 2004 2005 2006 2007
0
2
4
6
8
3
4
1
2
2001 2002 2003 2004 2005 2006 2007
0
2
4
6
8
1
2
3
4
2001 2002 2003 2004 2005 2006 2007
C4 Bank of Finland Bulletin 4 bull 2007
1 Nordea prime at the end of
the month
2 Sampo prime at the end of
the month
3 OKOBANK group prime at
the end of the month
4 12-month Euribor
Sources Banks and ECB
5 Bank reference rates in Finland and 12-month Euribor
6 Average lending and deposit rates
7 Stock of bank lending by interest rate linkage
1 Banksrsquo stock of loans
2 MFIsrsquo stock of loans
3 Banksrsquo new loans
4 MFIsrsquo new loans
5 Banksrsquo stock of deposits
6 MFIsrsquo stock of deposits
Source Bank of Finland
Data collection changed as of 1 January 2003 Under the new system MFIs include both deposit banks and other credit institutions
1 Linked to base rate2 Linked to other rates
(as of 2003 includes loans linked to base rate and fixed-rate loans)
3 Fixed-rate4 Linked to reference rates of
individual banks (prime rates etc)
5 Linked to Euribor Source Bank of Finland
Data collection changed as of 1 January 2003
6
5
4
3
2
1
0
1
2
3
4
2001 2002 2003 2004 2005 2006 2007
0
2
4
6
8
1
2
34
5
6
2001 2002 2003 2004 2005 2006 2007
0
20
40
60
80
100
1 2
4
5
3
2001 2002 2003 2004 2005 2006 2007
Bank of Finland Bulletin 2007 bull 4 C5
8 MFI loans to private sector
9 Competitiveness indicators for Finland
10 Selected stock price indices in the euro area
January 2001 = 100
1 Total euro area
Dow Jones Euro Stoxx index
2 Germany DAX index
3 Finland OMX Helsinki
All-Share Index
Sources Bloomberg and
Helsinki Stock Exchange
1999 Q1 = 100
Based on trade-weighted
exchange rates
An upward movement of
the index represents a weakening
in Finnish competitiveness
1 Narrow competitiveness indicator
including euro area countries
2 Narrow competitiveness indicator
Source Bank of Finland
12-month change
1 Loans by euro area MFIs to
euro area residents
2 Loans by Finnish MFIs to
euro area residents
Sources European Central Bank and
Bank of Finland0
4
8
12
16
1
2
2001 2002 2003 2004 2005 2006 2007
80
90
100
110
120Index
12
2001 2002 2003 2004 2005 2006 2007
20
40
60
80
100
120
140Index
1
2
3
2001 2002 2003 2004 2005 2006 2007
C6 Bank of Finland Bulletin 4 bull 2007
1 Market capitalisation of all listed shares (left-hand scale)
2 Market capitalisation ofnon-residentsrsquo holdings(left-hand scale)
3 Market capitalisation ofnon-residentsrsquo holdings as a percentage of total market capitalisation (right-hand scale)
Sources Helsinki Stock Exchangeand Finnish Central SecuritiesDepository (APK)
11 Listed shares in Finland total market capitalisation and non-residentsrsquo holdings
12 Bonds issued in Finland
13 Public sector balances in Finland
of GDP
1 General government fiscal
position
2 Central government revenue
surplus 12-month moving total
Sources State Treasury Statistics
Finland and Bank of Finland
End-month stock
1 Central government
2 Financial institutions
3 Companies
Source Statistics Finland
400
300
200
100
0 0
20
40
60
80EUR billion
1
2
2001 2002 2003 2004 2005
3
2006 2007
EUR billion
1
2 3
2001 2002 2003 2004 2005 2006 2007
80
60
40
20
0
ndash2
0
2
4
6
2
1
2001 2002 2003 2004 2005 2006 2007
Bank of Finland Bulletin 2007 bull 4 C7
of GDP
1 General government debt
2 Central government debt
Sources State Treasury Statistics
Finland and Bank of Finland
14 Central government debt
15 Finland goods account and current account
16 Finland services account and income account
12-month moving totals
of GDP
1 Services account
(trade in goods fob)
2 Income account
Source Bank of Finland
12-month moving totals of GDP
1 Goods account fob
2 Current account
Source Bank of Finland
0
20
40
60
2
1
2001 2002 2003 2004 2005 2006 2007
0
2
4
6
8
10
12
1
2
2001 2002 2003 2004 2005 2006 2007
1
2
2001 2002 2003 2004 2005 2006 2007
3
2
1
0
ndash1
ndash2
C8 Bank of Finland Bulletin 4 bull 2007
12-month moving totals
percentage of total exports
1 Euro area
2 Other EU member states
3 Rest of world
Sources National Board of
Customs and Statistics Finland
17 Regional distribution of Finnish exports
18 Finnish exports by industry
19 Finlandrsquos foreign trade export prices import prices and terms of trade
2000 = 100
1 Export prices
2 Import prices
3 Terms of trade
Source Statistics Finland
12-month moving totals
percentage of total exports
1 Forest industries
2 Metal and engineering
industries (incl electronics)
3 Other industry
Source National Board of
Customs
0
10
20
30
40
50
60
1
2
3
2001 2002 2003 2004 2005 2006 2007
1
2
3
2001 2002 2003 2004 2005 2006 2007
80
60
40
20
0
Index
2
1
3
2001 2002 2003 2004 2005 2006 2007
120
110
100
90
80
70
Bank of Finland Bulletin 2007 bull 4 C9
of GDP
1 Net international investment
position excluding equity items
2 Net outward direct investment
Sources Bank of Finland and
Statistics Finland
20 Finlandrsquos net international investment position
21 Finland GDP and industrial production
22 Unemployment rate in the euro area and Finland
1 Euro area
2 Finland
Sources Eurostat
Statistics Finland and
Bank of Finland
Data seasonally adjusted
Percentage change from
previous year
1 Industrial production
2 Gross domestic product
Source Statistics Finland
ndash20
ndash10
0
10
20
30
1
2
2001 2002 2003 2004 2005 2006 2007
1
2
2001 2002 2003 2004 2005 2006 2007
20
15
10
5
0
ndash5
ndash10
ndash15
10
8
6
4
2
0
1
2
2001 2002 2003 2004 2005 2006 2007
C10 Bank of Finland Bulletin 4 bull 2007
Whole economy excl agriculture
public administration education
health and unclassified services
Percentage change from
previous year
1 Euro area
2 Finland
Sources Eurostat and
Statistics Finland
23 Hourly labour costs in the euro area and Finland
24 Selected asset prices in Finland
1987 Q1 = 100
1 Consumer prices
2 Housing prices
3 Two-room apartments
(secondary market debt-free
price per m2)
Source Statistics Finland
1
2
2001 2002 2003 2004 2005 2006
8
6
4
2
02007
50
100
150
200
250
300
1987 1992 1997 2002
Index
1
23
2007
PA R L I A M E N TA RY S U P E RV I S O RY C O U N C I L
Seppo Kaumlaumlriaumlinen Chairman Antti Kalliomaumlki Vice Chairman Pekka Ravi Liisa Jaakonsaari Martti Korhonen Mika Lintilauml
Tanja Saarela Marja Tiura and Ben Zyskowicz
Anton Maumlkelauml Secretary to the Parliamentary Supervisory Council
Arno Lindgren Secretary to the Board
Erkki LiikanenGovernor
Sinikka SaloMember of the Board
Pentti HakkarainenMember of the Board
Matti LouekoskiDeputy Governor
Overall responsibility for ESCB affairs
Financial Markets and Statistics
Heikki Koskenkylauml
bull Financial Stability
bull Oversight of Market Infrastructure
Statistics
bull Balance of Payments
bull Financial Statistics
bull Information Management
Monetary Policy and Research
Antti Suvanto
bull Forecasting
bull Library and Information Services
bull Monitoring
Institute for Economies in Transition
(BOFIT)
Research
Banking OperationsPentti Pikkarainen
bull Back Office
bull Investments
bull Market Operations
bull Risk Management
bull TARGET Division
General SecretariatKjell Peter Soumlderlund
Communications
European and International Affairs
Legal Affairs
Senior Secretarial Staff
Strategy and Organisation
Internal AuditErkki Kurikka
Currency DepartmentMauri Lehtinen
bull Regional OfficesKuopio Oulu
Tampere Turku Vantaa
AdministrationEsa Ojanen
bull Accounting
bull Administrative Services
bull Language Services
Information Technology
Personnel
Security
The Financial Supervision Authority headed by Anneli Tuominen operates in association with the Bank of Finland
Organisation of the Bank of Finland4 May 2007
Publications
A complete list of publications is available on the Bank of Finlandrsquos website (wwwboffi)
The Bank of Finlandrsquos publication operations are becoming largely electronic in terms of both publication and distribution The Bank of Finland has introduced a free electronic subscription service on its website through which it is possible to order the Bankrsquos publications in electronic form The subscriber is sent an email alert whenever the publication(s) subscribed to are newly released
Publications can be subscribed at wwwboffi gt Publications gt Order and subscribe to electrionic publications and reports If you have any problems with registering please contact publicationsboffi
Back copies of older printed publications still in stock can be ordered from the Bank of Finland (wwwboffi)
B
AN
KO
FFINLA
ND
BU
LLETIN
4 bull2
00
7
Suomen PankkiBank of FinlandPO Box 160FI-00101 HELSINKIFINLAND
- Contents
- Monetary policy andeconomic outlook
-
- Investment in emerging economies driving growth
- Commodity shortages willincrease price pressures
- Considerable uncertainty on the financial markets
- Slower growth inthe United States
- Japanese exporters looking ahead with confidence
- Pace of growth in Asiarsquos emerging economies unchanged
- High commodity prices support growth in many emerging economies
- Euro area growth stable
- ECB holds key rate unchanged
- Finlandrsquos short-term outlook remains favourable
- Wages growth accelerating
-
- Box Metal and agricultural raw materials and inflation
-
- From plastic to bits ndashpayment habits are changing
-
- Changing payment habits
- Changing trends in Finlandand Europe
- Increasing pressure for change
- Data connections favournew services
- Customers looking for change and integration
- Steady development or a quantum leap in payment habits
-
- Euro area balance of paymentsand the financial markets
-
- The role of balance of payments
- The balance of payments depicts the external balance of the economy
- Developments in the euro area current account
-
- Box Compilation of balance of payments statistics
-
- The euro area as investmenttarget and as investor
- Balance of payments andmoney supply
- Concluding remarks
-
- References
- Charts
-
- 1 Finland key economic indicators
- 2 Price stability in the euro area and Finland
- 3 Official interest rates
- 4 International long-term interest rates
- 5 Bank reference rates in Finland and 12-month Euribor
- 6 Average lending and deposit rates
- 7 Stock of bank lending by interest rate linkage
- 8 MFI loans to private sector
- 9 Competitiveness indicators for Finland
- 10 Selected stock price indices in the euro area
- 11 Listed shares in Finland total market capitalisation and non-residentsrsquo holdings
- 12 Bonds issued in Finland
- 13 Public sector balances in Finland
- 14 Central government debt
- 15 Finland goods account and current account
- 16 Finland services account and income account
- 17 Regional distribution of Finnish exports
- 18 Finnish exports by industry
- 19 Finlandrsquos foreign trade export prices import prices and terms of trade
- 20 Finlandrsquos net international investment position
- 21 Finland GDP and industrial production
- 22 Unemployment rate in the euro area and Finland
- 23 Hourly labour costs in the euro area and Finland
- 24 Selected asset prices in Finland
-
- Organisation of the Bank of Finland
- Publications
-
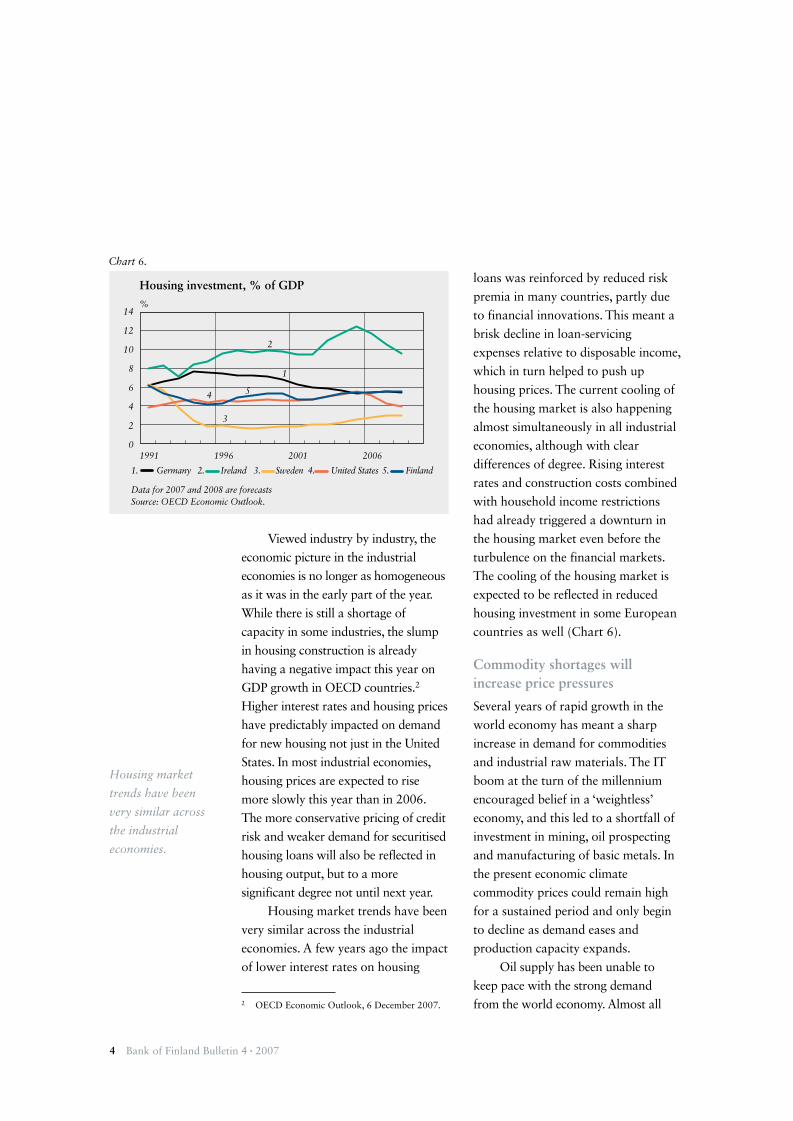
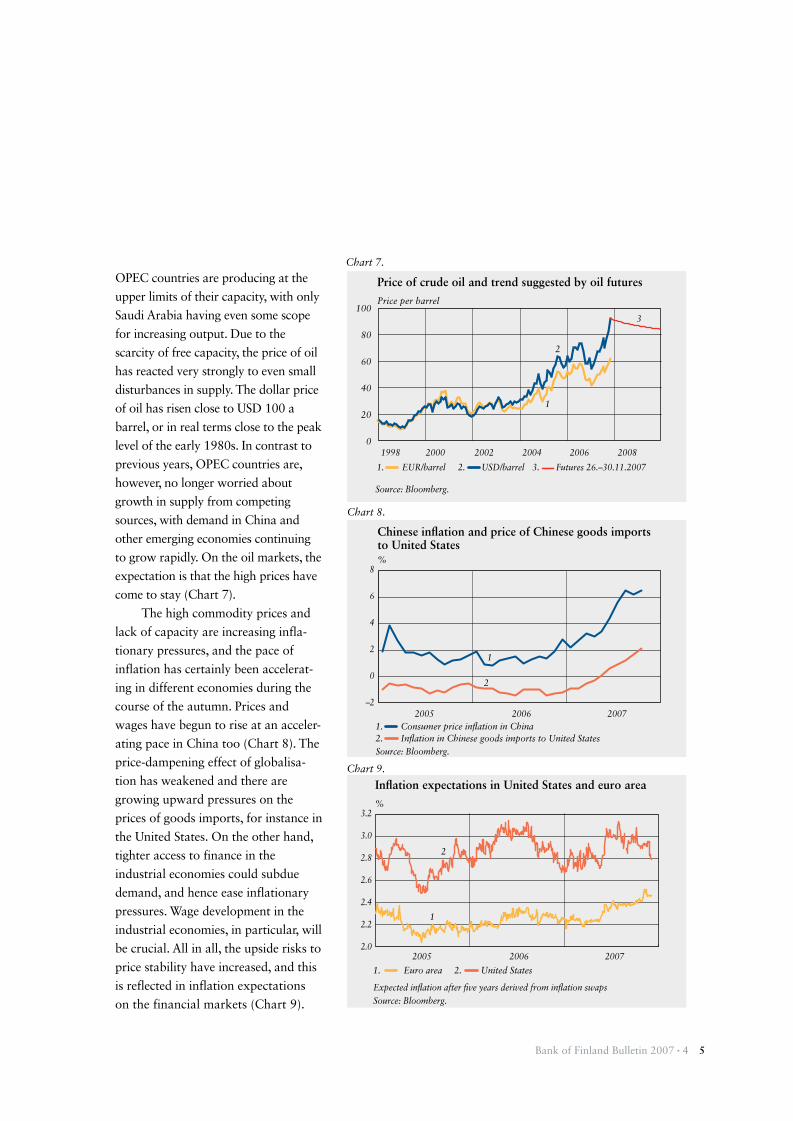
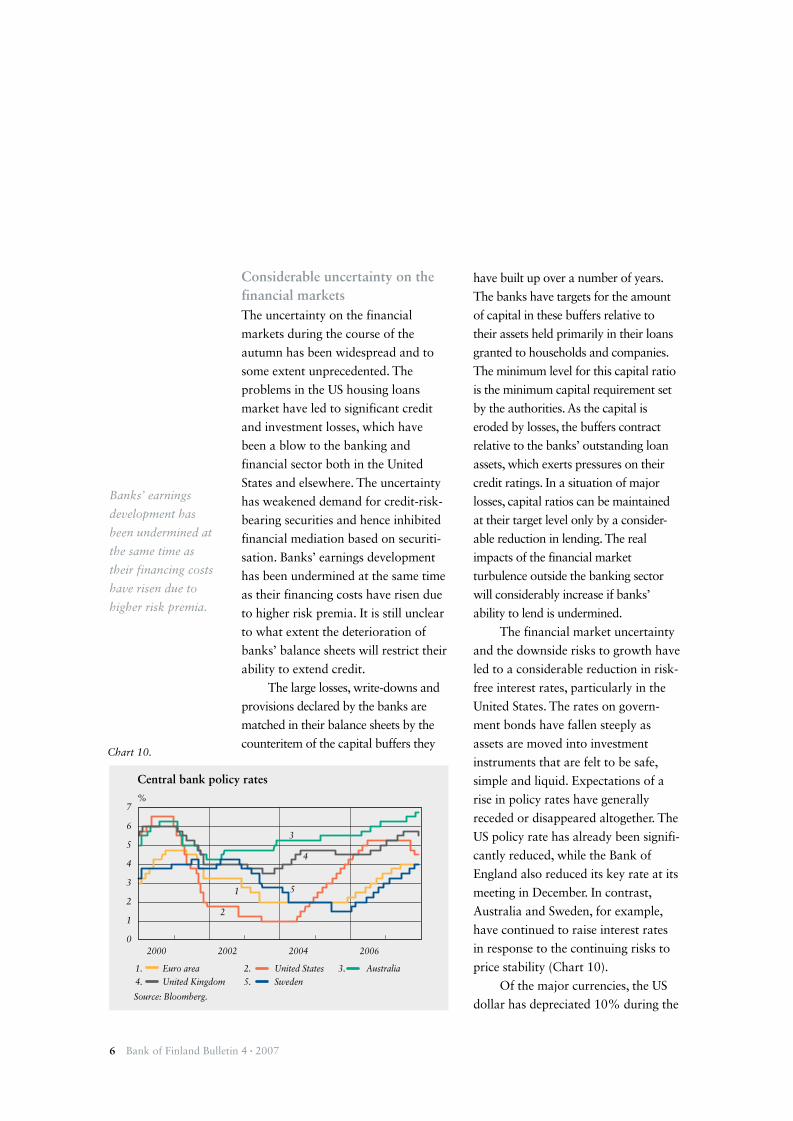
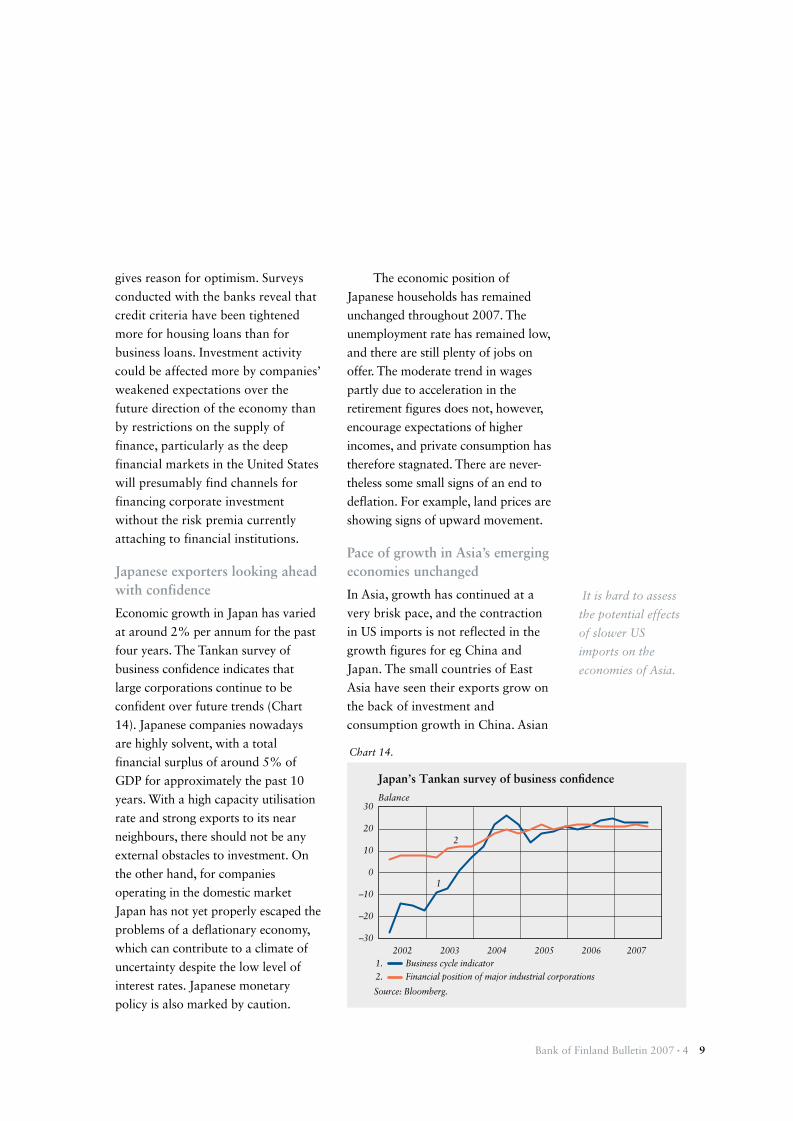
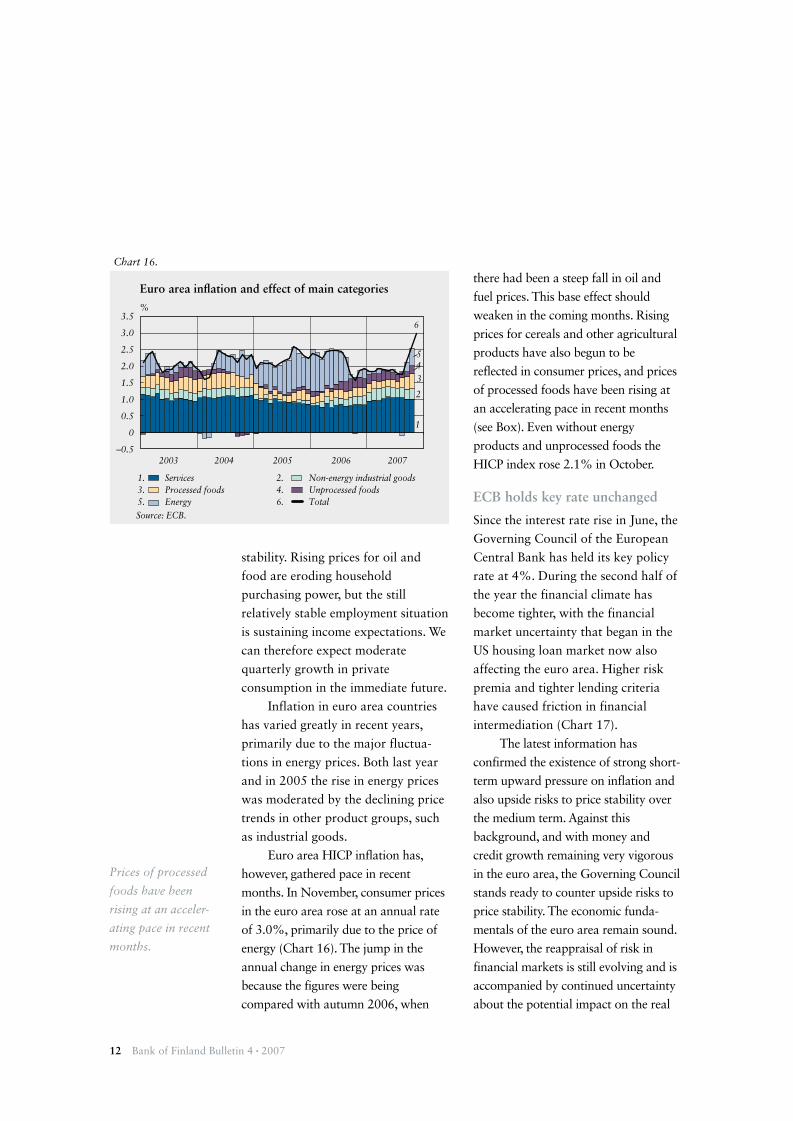
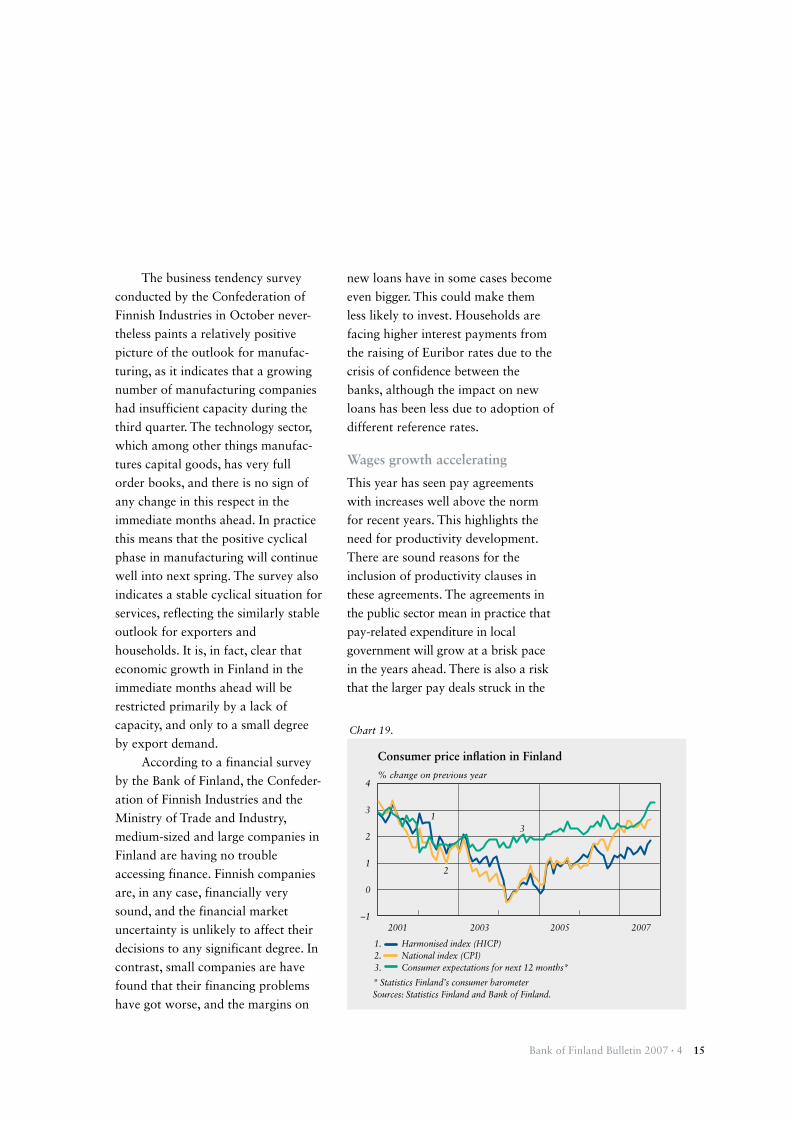
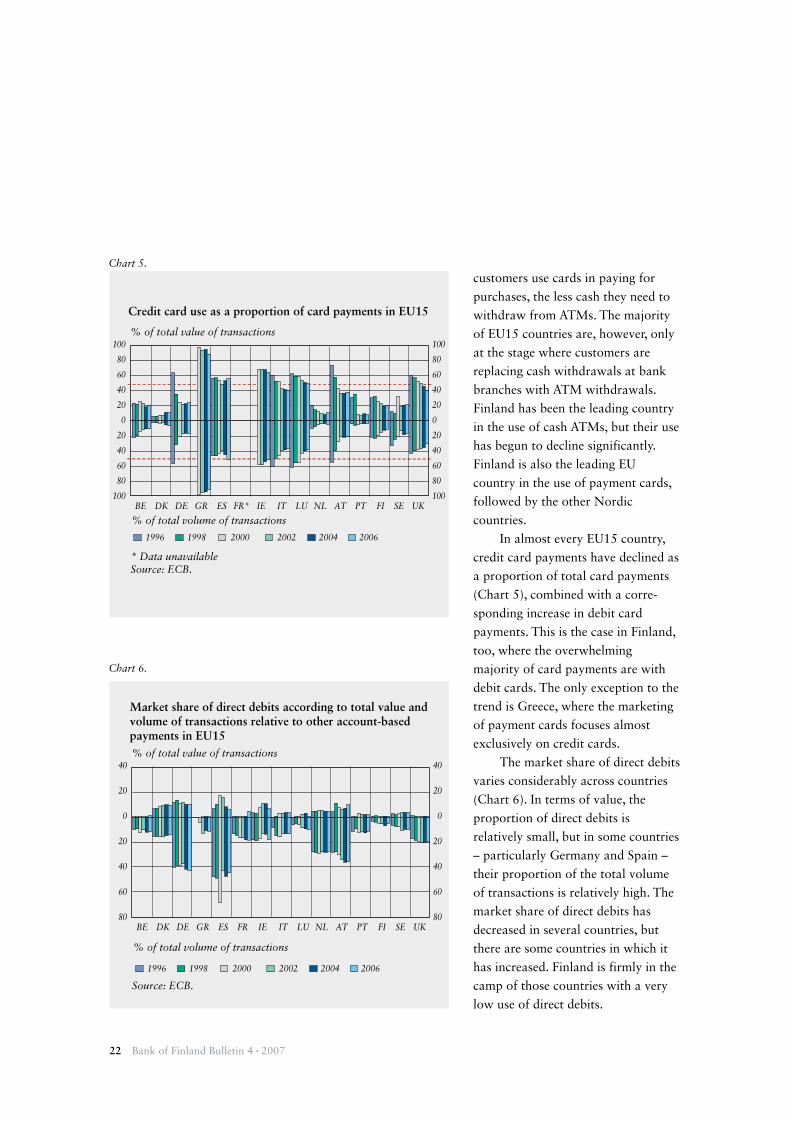
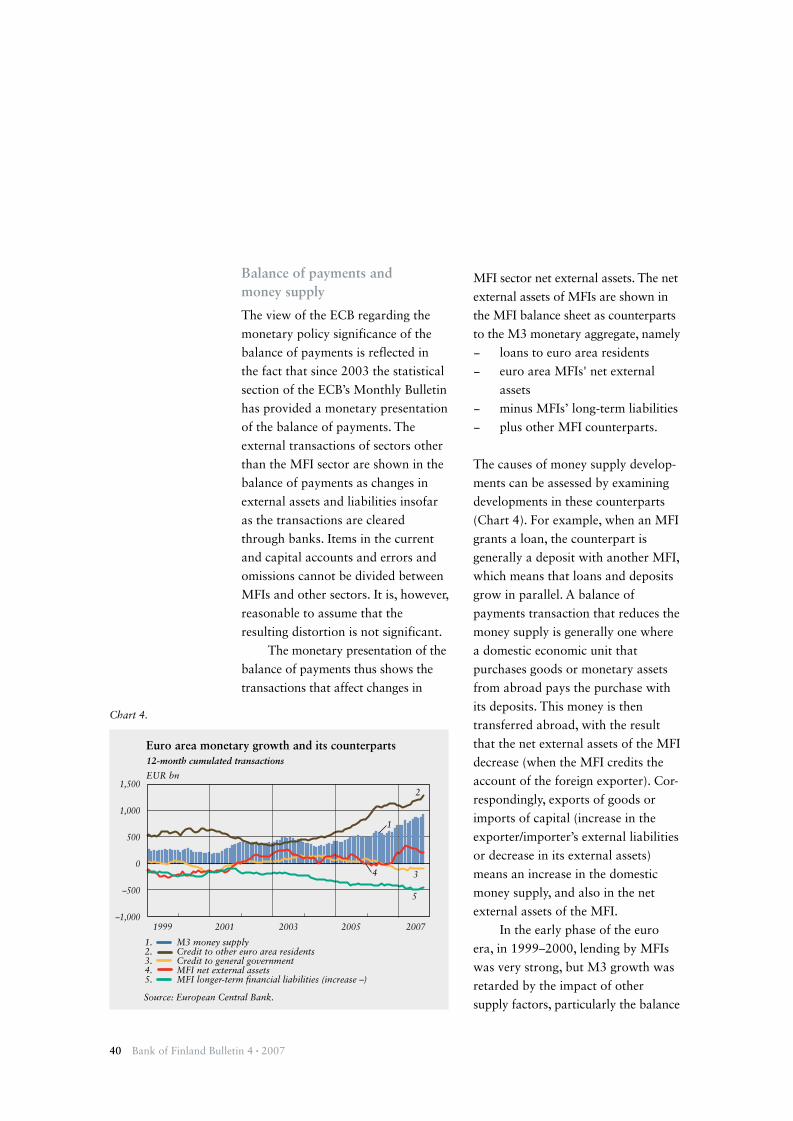
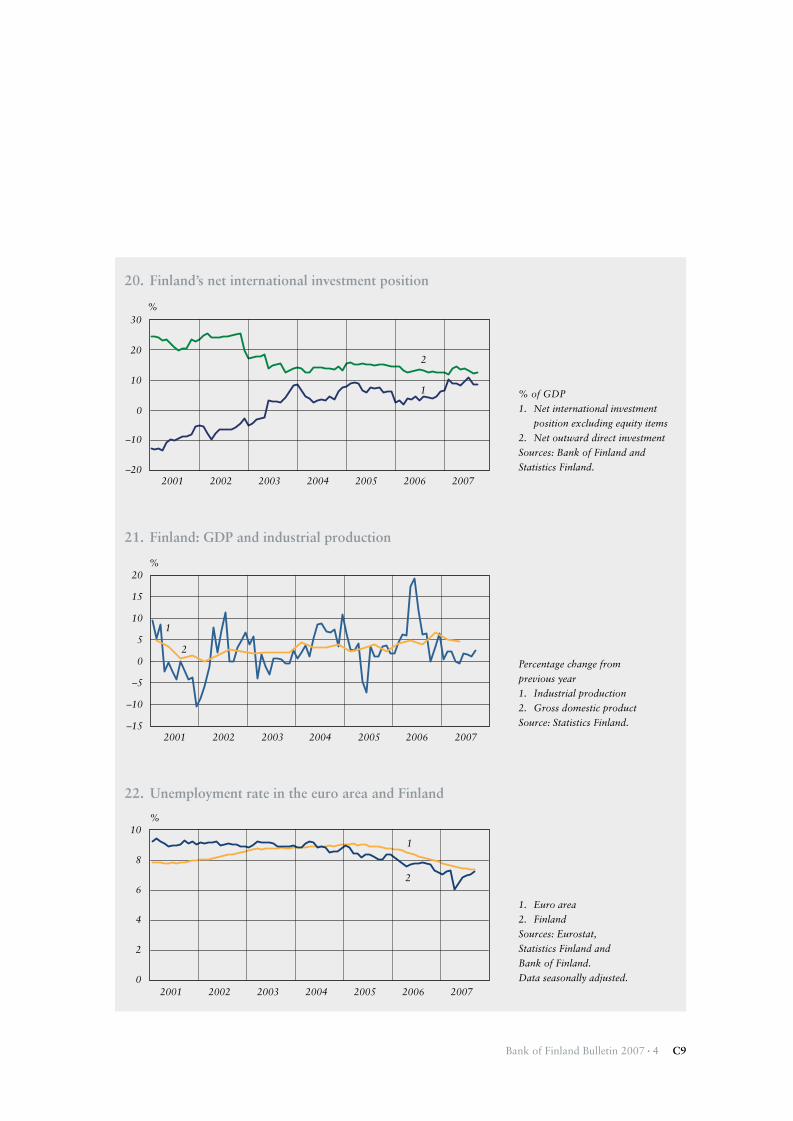
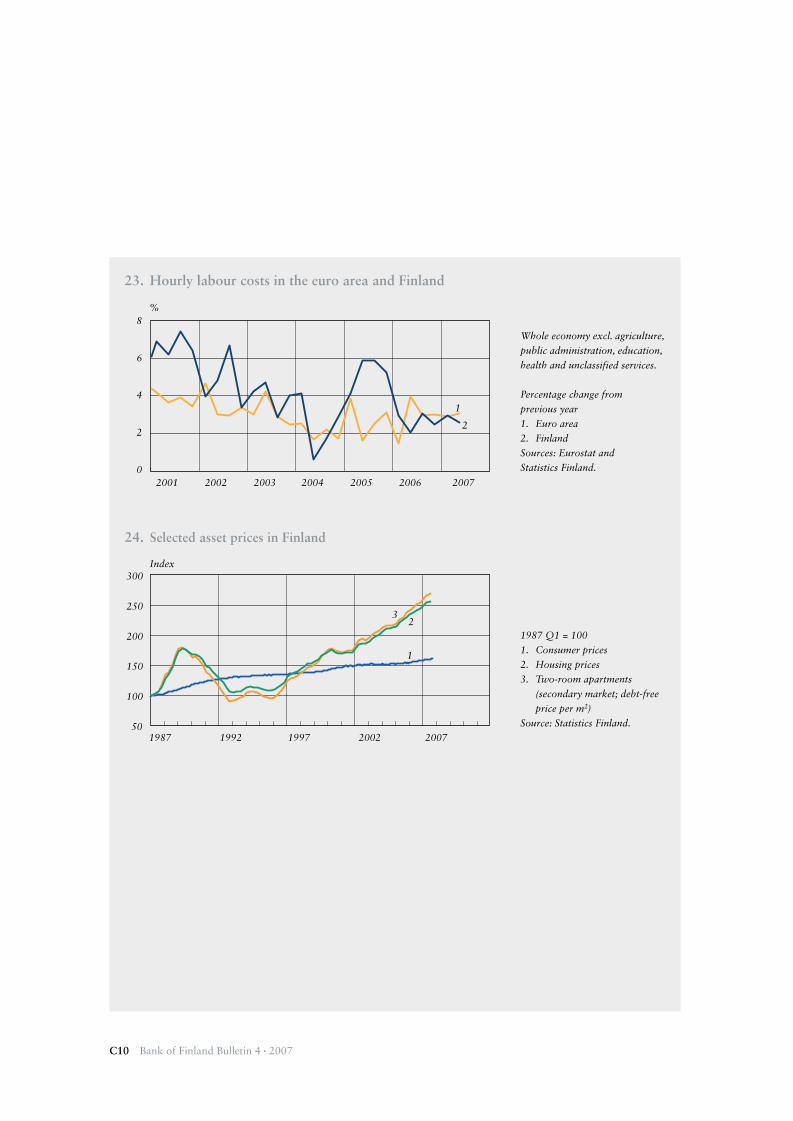