banned 1q13 results - il sole 24 ore · 1q13 results table of contents ... base and attract net new...
TRANSCRIPT

Sh
ort
“te
rmis
m”
is in
stitu
tio
nally
ba
nn
ed
1Q13 Results
Milan, 9th May 2013

Sh
ort
“te
rmis
m”
is in
stitu
tio
nally
ba
nn
ed
2
1Q13 Results Table of contents
1Q13 Highlights
Asset Management
Distribution
1Q13 Financials
Summary & Outlook
About Azimut

Sh
ort
“te
rmis
m”
is in
stitu
tio
nally
ba
nn
ed
3
1Q13 Results
1Q13 Highlights
Asset Management
Distribution
1Q13 Financials
Summary & Outlook
About Azimut

Sh
ort
“te
rmis
m”
is in
stitu
tio
nally
ba
nn
ed
4
Growth path continues, delivered solid results in a volatile 1Q
Source: Company data
1Q13 Highlights
Financials:
Total revenues €112.2 million (vs. €136.0 million in 1Q12)
Rising recurring fees (€76.2 million vs. €73.8 million)
Variable fees in-line with past few quarters (€26.0 million), compared to an extraordinary 1Q12 (€54.4
million)
Net profit €41.4 million (vs. €63.3 million in 1Q12)
Net Financial Position €314.5 million (vs. €278.2 million as of FY2012 and €166.3 million at 1Q12)
Assets under Management & Inflows:
Total Assets at 1Q13: € 20.6 billion (+14% vs. 1Q12), of which € 18.4 billion AuM (+15% vs. 1Q12)
Total Inflows in 1Q13: €744 million (+27% vs. 1Q12)
At the end of April 2013, net inflows surpassed €1 billion, already achieving 67% of the FY 2013 target of
€1.5bn
GROWTH CONTINUES IN A CHALLENGING ENVIRONMENT, CONSIDERING 1Q12 WAS A RECORD QUARTER WITH EXTRAORDINARY VARIABLE FEES
Sh
ort
“te
rmis
m”
is in
stitu
tio
nally
ba
nn
ed
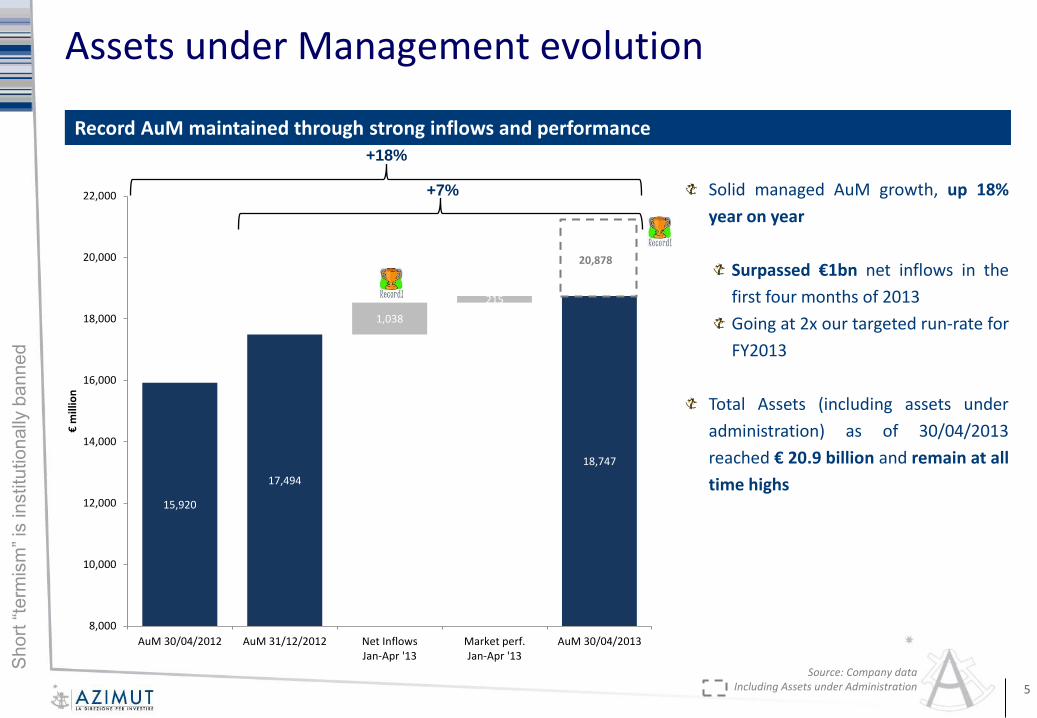
15,920
17,494
18,532 18,747
1,038
215
8,000
10,000
12,000
14,000
16,000
18,000
20,000
22,000
AuM 30/04/2012 AuM 31/12/2012 Net InflowsJan-Apr '13
Market perf.Jan-Apr '13
AuM 30/04/2013
€m
illio
n
5
Record AuM maintained through strong inflows and performance
Source: Company data Including Assets under Administration
Solid managed AuM growth, up 18%
year on year
Surpassed €1bn net inflows in the
first four months of 2013
Going at 2x our targeted run-rate for
FY2013
Total Assets (including assets under
administration) as of 30/04/2013
reached € 20.9 billion and remain at all
time highs
Assets under Management evolution
+7%
+18%
20,878

Sh
ort
“te
rmis
m”
is in
stitu
tio
nally
ba
nn
ed
6
1Q13 Results
1Q13 Highlights
Asset Management
Distribution
1Q13 Financials
Summary & Outlook
About Azimut

Sh
ort
“te
rmis
m”
is in
stitu
tio
nally
ba
nn
ed
7
Source: Bloomberg Risk free: MTSIBOTR Index (net of 12,5% withholding tax)
Italian industry index: FIDMGEND Index
+3.1
+1.9
2013 YTD weighted average performance of our funds ahead of Italian industry and risk free: +2.9%
Asset Management - Performance
99
100
101
102
103
Ita. Industry Risk free AZM WAP

Sh
ort
“te
rmis
m”
is in
stitu
tio
nally
ba
nn
ed
Source: Company data
Fund of Funds are quite entirely for asset classes not managed in house
Asset Management – Breakdown by type
8
31,2%30,6%30,3%29,9%28,9%28,6%27,1%27,2%27,1%26,3%27,1%26,5%25,5%26,1%26,6%26,2%26,2%26,0%27,1%27,3%27,2%26,8%26,9%26,8%27,2%
0%
10%
20%
30%
40%
50%
60%
70%
80%
90%
100%
FOFS IN HOUSE - LUX IN HOUSE - ITA

Sh
ort
“te
rmis
m”
is in
stitu
tio
nally
ba
nn
ed
Source: Company data at 31/03/2013
Fund of funds have the same margin as in house funds
Luxembourg Funds breakdown
9
TARGET
FORMULA TARGET 2014, FORMULA TARGET 2015, INSTITUTIONAL TARGET, BOND TARGET 2015, BOND
TARGET GIUGNO 2016, INTERNATIONAL BOND TARGET GIUGNO 2016, BOND TARGET SETT. 2016, BOND TARGET DICEMBRE 2016, BOND TARGET EQUITY OPTIONS 2016
0-30% EQUITY F1 CONSERVATIVE, CORPORATE PREMIUM , CGM
OPPORTUNISTIC CORPORATE, CGM OPPORTUNISTIC GOVERNMENT, SOLIDITY
0-70% EQUITY EUROPEAN DYNAMIC, DIVIDEND PREMIUM, STRATEGIC
TREND
0-100% EQUITY
F1 ABSOLUTE, TREND, ITALIAN TREND, PACIFIC TREND, AMERICAN TREND, EUROPEAN TREND, LONG TERM
VALUE, CGM OPPORTUNISTIC EUROPEAN, CGM OPPORTUNISTIC GLOBAL, GLOBAL GROWTH SELECTOR
MARKET NEUTRAL F1 ALPHA PLUS, MARKET NEUTRAL
QUANT QBOND, QPROTECTION, QTREND, QINTERNATIONAL
MACRO MACRO DYNAMIC TRADING, GLOBAL MACRO
COMMODITIES COMMODITY TRADING
EQUITY LONG/SHORT ACTIVE SELECTION, CORE BRANDS
MULTI ACTIVE STRATEGY
CASH MANAGEMENT CASH OVERNIGHT, CASH 12 MONTH
OTHER OTHER SINGLE MANAGER (RMB OPP., CAT BOND, MACRO
VOLATILITY, GLOBAL CURRENCIES & RATES, ETC.)
FOFs MULTIMANAGER FOFs
0-30% EQ5.9% 0-70% EQ
2.3%
0-100% EQ14.5%
MKT NEU5.1%
QUANT.2.2%
MACRO1.4%
COMMOD.0.4%
EQ. L/S1.0%
MULTI0.1%
CASH MGMT5.2%
OTHER19.9%
FOFs28.9%
TARGET12.9%
Sh
ort
“te
rmis
m”
is in
stitu
tio
nally
ba
nn
ed
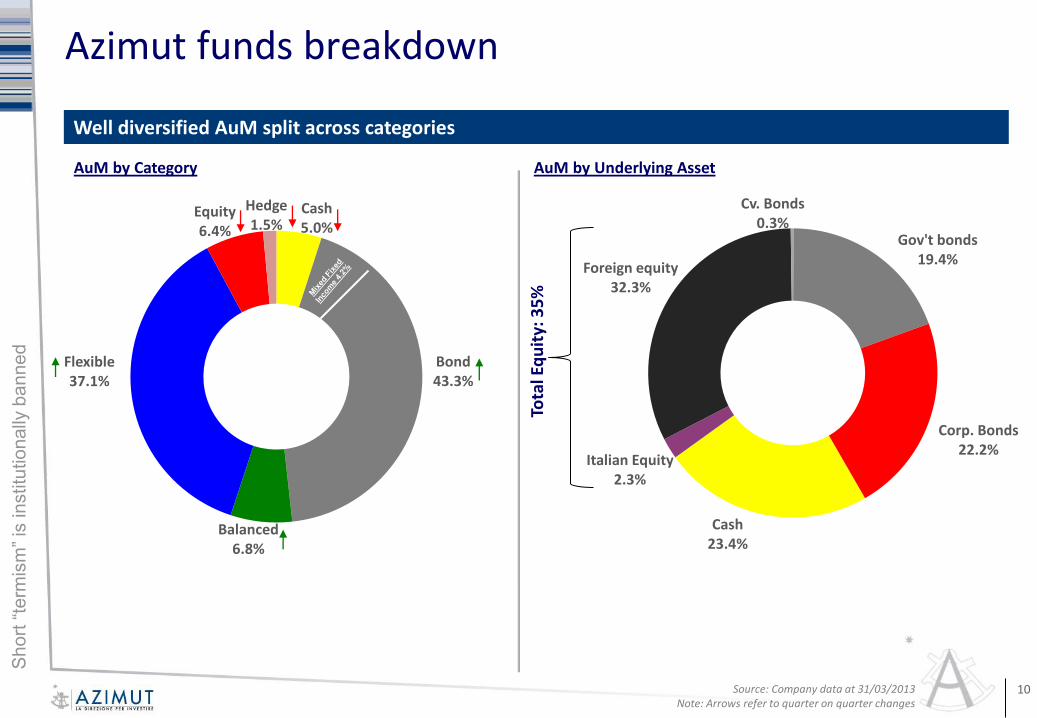
Cash5.0%
Bond43.3%
Balanced6.8%
Flexible37.1%
Equity6.4%
Hedge1.5%
Cash23.4%
Italian Equity2.3%
Foreign equity32.3%
Cv. Bonds0.3%
Gov't bonds19.4%
Corp. Bonds22.2%
Well diversified AuM split across categories
Source: Company data at 31/03/2013 Note: Arrows refer to quarter on quarter changes
AuM by Category
Azimut funds breakdown
10
AuM by Underlying Asset
Tota
l Eq
uit
y: 3
5%

Sh
ort
“te
rmis
m”
is in
stitu
tio
nally
ba
nn
ed
Gov't €30.3%
Gov't extra €1.0%
Gov't USD4.5%
Other Gov't10.8%
Corp. BDS53.4%
Europe €42.9%
Other Europe5.3%
UK7.9%
USA25.7%
ASPAC11.1%
Other7.1%
Well diversified AuM split across categories
Source: Company data at 31/03/2013
Azimut funds breakdown
11
Equities Fixed Income
Austria, Belgium, Finland, France, Germany, Italy,
Netherlands

Sh
ort
“te
rmis
m”
is in
stitu
tio
nally
ba
nn
ed
Share of new products launched since 2011
Despite a volatile market environment, new products have helped to defend the existing client base and attract net new money from existing and new customers
Innovation has and will be one of Azimuts’ key success factors
Share of new products launched since 2008
Product innovation: Azimut success story
12 Source: Company data at 31/03/2013
New products26,8%
Existing products73,2%
New products46,0%
Existing products54,0%

Sh
ort
“te
rmis
m”
is in
stitu
tio
nally
ba
nn
ed
13
1Q13 Results
1Q13 Highlights
Asset Management
Distribution
1Q13 Financials
Summary & Outlook
About Azimut

Sh
ort
“te
rmis
m”
is in
stitu
tio
nally
ba
nn
ed
14
Azimut Italian Funds’ Industry
Source: Company out of Assogestioni monthly figures Note *: CGM acquisition
2006 – 13 Funds’ net inflows as a % of total managed assets
Distribution - Funds
*
-5,0%
-4,0%
-3,0%
-2,0%
-1,0%
0,0%
1,0%
2,0%
3,0%
4,0%
5,0%
6,0%
-5,0%
-4,0%
-3,0%
-2,0%
-1,0%
0,0%
1,0%
2,0%
3,0%
4,0%
5,0%
6,0%
Jan
-06
Mar
-06
May
-06
Jul-
06
Sep
-06
No
v-0
6
Jan
-07
Mar
-07
May
-07
Jul-
07
Sep
-07
No
v-0
7
Jan
-08
Mar
-08
May
-08
Jul-
08
Sep
-08
No
v-0
8
Jan
-09
Mar
-09
May
-09
Jul-
09
Sep
-09
No
v-0
9
Jan
-10
Mar
-10
May
-10
Jul-
10
Sep
-10
No
v-1
0
Jan
-11
Mar
-11
May
-11
Jul-
11
Sep
-11
No
v-1
1
Jan
-12
Mar
-12
May
-12
Jul-
12
Sep
-12
No
v-1
2
Jan
-13
Mar
-13

Sh
ort
“te
rmis
m”
is in
stitu
tio
nally
ba
nn
ed
Launched in November 2009, the WM division is an important reality for Azimut:
135 Wealth Managers
8 external WMs, coming from top tier Italian and International Global Banks, added in 2013 alone (43 since the launch)
Successfully added teams of WMs with on average 2-3 people managing on average € 100 million
Target to reach €5.0bn AuM by the end of 2015
Continue to work to develop a broad product offering in order to meet wealth management requirements from a Personal, Family and Business perspective
Completed the first 3 years of activity reaching total AuM of €3.3 billion as of 1Q13
Distribution – Wealth Management Division
Source: Company data 15
FUND MANAGEMENT
INSURANCE PRODUCTS
DISCRETIONARY ACCOUNTS
BANKING SERVICES
WEALTH PLANNING
PORTFOLIO ANALYSIS
VENTURE CAPITAL
CHINA DESK
CORPORATE & INVESTMENT BANKING
CORPORATE ANALYSIS
TRUST
SUCCESSION PLANNING

Sh
ort
“te
rmis
m”
is in
stitu
tio
nally
ba
nn
ed
16
Maintaining a high quality clientele to alleviate impact of the European sovereign debt crisis
Distribution – Clientele breakdown
Source: Company data as of 31/03/2013
Customers segmentation based on Assets
under Management volumes:
Smaller Wealth: below € 12,500
Medium Wealth: from € 12,500 to €
125,000
Affluent: from € 125,000 to € 500,000
High Net Worth Individuals: above €
500,000
Smaller Wealth
1.2% Medium Wealth16.7%
Affluent32.8%
HNWI49.3%

Sh
ort
“te
rmis
m”
is in
stitu
tio
nally
ba
nn
ed
31/12/12* In Churn 31/03/2013
1,084 23 -1.2% 1,094
208 10 -1.2% 215
104 10 -2.9% 111
TOTAL 1,396 43 -1.4% 1,420
17
Note*: Already net of intercompany transfers. Churn includes retired FAs
Azimut continues to recruit top quality financial advisors from competition
Distribution – Recruitment of FAs
Source: Company data

Sh
ort
“te
rmis
m”
is in
stitu
tio
nally
ba
nn
ed
1 3 5 7 9 11 13 15 17
1 3 5 7 9 11 13 15 17
18
Fly to quality: Top 3 by total inflows, notwithstanding significant differences in network size …
Distribution – 1Q13 Net Inflows in Italy
Source: Assoreti 31/03/2013 Note: network size is based on average Jan-Mar figures
Network size
Total inflows (€mln)
2337
831
4271
730
1408
682 645
4972
620 513 234 -13
1457 1843
1541
699
Banca Generali
Banca Fideuram
Fineco
Finanza & Futuro
Mediolanum
Allianz
UBI

Sh
ort
“te
rmis
m”
is in
stitu
tio
nally
ba
nn
ed
100
150
200
250
300
350
400
450
500
0 500 1,000 1,500 2,000 2,500 3,000 3,500 4,000 4,500 5,000
1Q
13
In
flo
ws
pe
r FA
(€
'00
0)
1Q13 Avg n. of FA
19
… yet number 1 in FA productivity, almost doubling the industry average
Distribution – 1Q13 Net Inflows in Italy (cont’d)
Banca Generali
Banca Fideuram
Fineco
Finanza & Futuro Mediolanum
Allianz
Source: Assoreti 31/03/2013
INDUSTRY AVERAGE

Sh
ort
“te
rmis
m”
is in
stitu
tio
nally
ba
nn
ed
20
1Q13 Results
1Q13 Highlights
Asset Management
Distribution
1Q13 Financials
Summary & Outlook
About Azimut

Sh
ort
“te
rmis
m”
is in
stitu
tio
nally
ba
nn
ed
21
Consolidated reclassified Income Statement IAS/IFRS Compliant
Source: Company data
Income Statement
€/000 1Q13 1Q12 2012FY
Entry commission income 2,286 1,916 7,637Recurring fees 76,232 73,769 281,934Variable fees 26,049 54,444 119,714Other income 1,433 1,375 6,174Insurance revenues 6,190 4,484 18,114Total revenues 112,190 135,988 433,573Distribution costs (49,815) (42,545) (173,259)Commission on no load products (2,147) (4,668) (13,787)Personnell and SG&A (17,362) (15,597) (62,664)Depreciation, amort./provisions (989) (1,802) (6,704)Operating costs (70,313) (64,612) (256,414)Operating profits 41,877 71,376 177,159Interest income 3,348 2,628 10,508Net non operating costs (232) (127) (1,508)Interest expenses (794) (1,329) (4,488)Profit before tax 44,199 72,548 181,671Income tax (2,030) (8,260) (21,522)Deferred tax (673) (982) 162Net profit 41,496 63,306 160,311
Minorities 72 - (325)
Consolidated Net Profit 41,424 63,306 160,636

Sh
ort
“te
rmis
m”
is in
stitu
tio
nally
ba
nn
ed
22
Treasury shares are not booked within the NFP
NFP at the end of March does not include:
€73mln dividends (May 23rd 2013)
Cash and Total debt at the end of March do not include :
€17.7mln subordinated bond partial repayment (July 1st 2013)
€30mln Senior loan partial repayment (June 30th 2013)
Consolidated reclassified Balance Sheet IAS/IFRS Compliant
Source: Company data
Balance Sheet
€/000 31/03/2013 31/12/2012 31/03/2012
Amounts due to banks: (86,694) (86,646) (100,161) Senior Loan (80,282) (80,301) (90,592)
Trademark lease-back (6,412) (6,345) (9,569)
Securities issued: (36,086) (35,664) (53,521)
Azimut 09-16 subordinated bond 4.0% (35,259) (34,823) (52,663)
Azimut 11-16 senior 2.5% (827) (841) (858)
TOTAL DEBT (122,780) (122,310) (153,682)
CASH AND CASH EQUIVALENTS 437,289 400,466 320,030
NET FINANCIAL POSITION 314,509 278,156 166,348

Sh
ort
“te
rmis
m”
is in
stitu
tio
nally
ba
nn
ed
23
1Q13 Results
1Q13 Highlights
Asset Management
Distribution
1Q13 Financials
Summary & Outlook
About Azimut

Sh
ort
“te
rmis
m”
is in
stitu
tio
nally
ba
nn
ed
24
On track to deliver our long term targets while remaining focused on profitability
Summary & Outlook
FINANCIAL RESULTS
Completed a solid 1Q13 notwithstanding uncertainties:
Growing recurring fees
Variable fees in-line with past quarters
Robust cash flow generation
Preserve profitability across asset classes
Continue generating strong cash flow to be returned to shareholders or used for potential M&A deals
Conserve a healthy balance sheet
PRODUCTION
Solid performance YTD of +2.9%
Launched successful new products (e.g. Bond Target Equity Options), gradually increasing the exposure to equity
Remain focused on product innovation
Gradual re-introduction of more equity-like products
Keep on delivering good performance in any market condition
DISTRIBUTION
Total Assets remains at all time highs
Record inflows in 4 months of activity 67% of FY2013 target already achieved
Assuming current market conditions, well ahead of our €1.5bn net inflow target for FY 2013
Confirm our €27bn AuM target by end-2014
Focus on network quality
INTERNATIONAL EXPANSION
Increased stake in Chinese partnership
Good progress in other countries
Evaluating opportunities in South-East Asia
South America remains a priority
What’s done Outlook

Sh
ort
“te
rmis
m”
is in
stitu
tio
nally
ba
nn
ed
25
1Q13 Results
1Q13 Highlights
Asset Management
Distribution
1Q13 Financials
Outlook
About Azimut

Sh
ort
“te
rmis
m”
is in
stitu
tio
nally
ba
nn
ed
26
Azimut Group structure
Source: Company data as at 30/04/2013 Note *: Under regulatory approval
100%
AZ IM (2011)
Azimut CM (2004)
Azimut Cons. (1988)
AZ Investimenti (2005)
AZ CM (2007)
Azimut Holding (Listed: AZM.IM)
Azimut Sgr (1986)
AZ Fund (1999)
AZ Life (2003)
Ass
et
Man
age
men
t
Life
in
sura
nce
s D
istr
ibu
tio
n
Azimut Fiduc. (2007)
Tru
ste
e
Apogeo Cons. (2008)
An Zhong (AZ) IM HK (2011)
An Zhong (AZ) IM (2011)
AZ International Holdings (2010)
100%
100%
100% 100%
100% 100%
100%
100% 100% 100%
100%
100%
AZ Global (2011)
5%+5%*
60%
Global Securities (2011)
CGM (2011)
51%
Katarsis CA (2011)
75%
Eskatos CM (2011)
100%
CGM SIM (2011)
100%
AZ Swiss (2012)
90%

Sh
ort
“te
rmis
m”
is in
stitu
tio
nally
ba
nn
ed
Acquisition of Turkey’s Global Asset Management and Global Securities.
Acquisition of CGM, a Monaco-based independent asset management company.
Acquisition of Swiss company Katarsis Capital Advisors and its Luxembourg subsidiary Eskatos Capital Management. Eskatos is one of the 3/5 companies managing ILS (Insurance Linked Securities) funds domiciled in the EU.
Azimut and Siqurgest launch an asset management and distribution partnership in Switzerland targeting HNWI and Institutional clients.
Azimut and CMT launch An Zhong Investment Management in Hong Kong and Shanghai specializing in asset management and investment advisory
27
Azimut current presence
Azimut potential expansion
Aiming at covering all 3 macro areas (Americas, EMEA, Asia-Pacific) and time zones while offering a worldwide service to our clients
Where we are and where we want to be: 10% of AuM outside Italy by 2014
Going International
Azimut launches AZ Swiss joint venture with a team of portfolio managers in Switzerland focusing on macro strategies.

Sh
ort
“te
rmis
m”
is in
stitu
tio
nally
ba
nn
ed
28
Azimut’s partnership philosophy has been
implemented also in China by involving local partners,
aligning the interests of all stakeholders.
An Zhong (AZ) Investment Management in Hong
Kong is the Holding company controlling two
operating subsidiaries. Azimut, through the Holding
company, oversees them and relocated three Senior
PMs from Luxembourg.
Through the operating subsidiaries Azimut aims at
creating a regional hub and developing local
production and distribution of asset management
products and investment advisory services with a
focus on qualified investors.
An Zhong (AZ) IM (2011)
AZ International Holdings
(2010)
100%
100%
AZ Investment Management (2011)
An Zhong (AZ) IM HK (2011)
100%
2010: Definition of a frame agreement with local entrepreneurs/partners
International expansion – China / HK

Sh
ort
“te
rmis
m”
is in
stitu
tio
nally
ba
nn
ed
29
Global Securities (Trading + Distribution)
60%
Global Yatirim
Holding
40%
5%+5%*
AZ Global (Asset management)
75%
On 14th March 2011 AZ International Holdings S.A.
(“AIH”) signed a binding frame agreement with Global
Yatirim Holding and Global Portfoy Yonetimi (“GAM”) to
implement a partnership in the AM and distribution
business in Turkey.
In particular, AIH has purchased 5% of the distribution
company’s share capital (Global Menkul Değerler)
during its IPO on the Istanbul Stock Exchange while
Global Yatirim Holding holds around 75% of the capital.
Subsequently on 28th February 2012, through a capital
increase, Azimut has completed the acquisition of 60%
of the asset management company’s share capital,
Global Portföy, and on 17th January 2013 it increased its
stake in the distribution company from 5% to 10%*.
Through a team of dedicated Azimut people, Global
and Azimut are re-structuring the product range and
creating a sales force focused on the distribution of
mutual funds in order to attract new clients and AuM.
AZ International Holdings
(2010)
2011: Definition of a frame agreement with local entrepreneurs/partners (Global Investment Holdings)
International expansion – Turkey
Note *: Under regulatory approval

Sh
ort
“te
rmis
m”
is in
stitu
tio
nally
ba
nn
ed
30
51% CGM
(Asset management)
On 10th May 2011 Azimut through its subsidiary AZ
International Holdings S.A. (“AIH”) signed a binding
frame agreement with CGM (Compagnie de Gestion
privée Monegasque); the acquisition of a 51% stake
has been completed on 30th December 2011
AuC of CGM stood at nearly €800m (o/w more than
€600m AuM) – consideration of ~€ 15m (including
shareholders’ equity) paid entirely with treasury
shares
The partnership adds new competences to Azimut
Group targeting UHNWI also thanks to CGM’s
operating subsidiary in Italy
Current CGM management entered Azimut’s
shareholders’ agreement
CGM Italia SIM
100%
AZ International Holdings
(2010)
2011: Agreement for a 51% stake acquisition
International expansion – Monaco

Sh
ort
“te
rmis
m”
is in
stitu
tio
nally
ba
nn
ed
31
1988: Azimut is established by Akros Finanziaria
1990-1992: Pietro Giuliani and the most of the current top management join the company and start the recruitment of top level professionals for the distribution network (organised in 6 regional companies) and the fund managers team.
1998: Bipop-Carire acquires Azimut, which continues to operate independently.
December 2001: as a result of the Bipop restructuring, Azimut’s management buys out the business backed up by Apax Partners. Approximately 700 people invested in the MBO, completed in June 2002.
December 2002: the 6 regional distribution companies merged into Azimut Consulenza SIM.
July 2004: Azimut’s Initial Public Offering (AZM.IM)
20+ years of growth and evolution
Azimut pre-IPO history
Promotori
Azimut Holding
Azimut Piemonte
Azimut Centro-sud
Azimut Liguria-Toscana
Azimut Adriatica
Azimut Triveneto
Azimut Lombardia
20%
80%
Management and Promotori
Azimut Consulenza SIM
Azimut Holding
100%
35% 65%
Apax Partners

Sh
ort
“te
rmis
m”
is in
stitu
tio
nally
ba
nn
ed
TIMONE25.0%
FREE FLOAT75.0%
32
Total shares issued: 143.3m
Source: Consob, May 2013
Free float breakdown
Timone Fiduciaria represents the shares of around 1,200 individual shareholders (Promotori, employees, managers working for Azimut), tied up in a strong shareholders’ agreement.
Treasury shares: in excess of 7.5% of share capital
Azimut’s shareholder base
2.9%2.4%
2.1%
2.1%
2.1%
7.5%
HARRIS ASSOC.
JPMORGAN AM
ALLIANZ
BANCO POPOLARE
AVIVA
WILLIAM BLAIR & CO.
CANTILLON CAP.
TREASURY SH.
OTHER
2.3%
2.0%
52%

Sh
ort
“te
rmis
m”
is in
stitu
tio
nally
ba
nn
ed
33
A strong agreement for a long term commitment
Participants Promotori, employees and management organised in separate areas
Duration 3 years automatically renewed unless the absolute majority of the voting rights refuses. Already renewed in 2010 and 2013
Share lock-up 66%-75% of each participant’s shares are locked until retirement, regardless of the tenure within the Group
The residual 25%-34% can be sold at any time but subject to pre-emption right amongst other participants.
The price for this transfer is a 30 days rolling average.
Governance A share trust includes 100% of the voting rights of the participants.
A committee is responsible for managing and monitoring the participants’ obligations and rights under the agreement
Timone – the Shareholders agreement

Sh
ort
“te
rmis
m”
is in
stitu
tio
nally
ba
nn
ed
34
Source: Company data as of 31/12/2012
Continuous growth throughout the decade, notwithstanding turbolent years
Main growth trend - Clients, FAs and AuM
0
4,000
8,000
12,000
16,000
20,000
2002 2003 2004 2005 2006 2007 2008 2009 2010 2011 2012
Total AuM (€m)
0
4,000
8,000
12,000
16,000
20,000
2002 2003 2004 2005 2006 2007 2008 2009 2010 2011 2012
Managed AuM (€m)
60
80
100
120
140
160
2002 2003 2004 2005 2006 2007 2008 2009 2010 2011 2012
Clients ('000)
0
200
400
600
800
1000
1200
1400
2002 2003 2004 2005 2006 2007 2008 2009 2010 2011 2012
FAs

Sh
ort
“te
rmis
m”
is in
stitu
tio
nally
ba
nn
ed
35
Net inflows Performance
Note: Data in million € Includes managed assets only
AuM, Net Inflows and Performance
0
2,000
4,000
6,000
8,000
10,000
12,000
14,000
16,000
18,000
2003 2004 2005 2006 2007 2008 2009 2010 2011 2012
7,0018,221
11,052
13,281
14,897
12,147
13,881
14,61314,621
17,494
€m
illio
n

Sh
ort
“te
rmis
m”
is in
stitu
tio
nally
ba
nn
ed
36 Source: Company data as of 31/03/2013
2008-2013 A beta stock with a strong P&L
Solid financial performance (€mln)
-70
-50
-30
-10
10
30
50
70
90
110
130
1Q082Q083Q084Q081Q092Q093Q094Q091Q102Q103Q104Q101Q112Q113Q114Q111Q122Q123Q124Q121Q13
REC. FEES VF SG&A OTHER COST
0
5
10
15
20
25
30
35
40
45
50
55
60
65
70
75
1Q082Q083Q084Q081Q092Q093Q094Q091Q102Q103Q104Q101Q112Q113Q114Q111Q122Q123Q124Q121Q13
REC. MARGIN VF
0
10
20
30
40
50
60
70
80
1Q082Q083Q084Q081Q092Q093Q094Q091Q102Q103Q104Q101Q112Q113Q114Q111Q122Q123Q124Q121Q13
OPERATING PROFIT
0
10
20
30
40
50
60
70
1Q082Q083Q084Q081Q092Q093Q094Q091Q102Q103Q104Q101Q112Q113Q114Q111Q122Q123Q124Q121Q13
NET PROFIT

Sh
ort
“te
rmis
m”
is in
stitu
tio
nally
ba
nn
ed
37
Disclaimer – Safe harbour statement
This document has been issued by Azimut Holding just for information purposes. No reliance may be placed for any purposes whatsoever on the information contained in this document, or on its completeness, accuracy or fairness. Although care has been taken to ensure that the facts stated in this presentation are accurate, and that the opinions expressed are fair and reasonable, the contents of this presentation have not been verified by independent auditors, or other third parties.
Accordingly, no representation or warranty, express or implied, is made or given by or on behalf of the Company, or any of its members, directors, officers or employees or any other person. The Company and its subsidiaries, or any of their respective members, directors, officers or employees nor any other person acting on behalf of the Company accepts any liability whatsoever for any loss howsoever arising from any use of this presentation or its contents or otherwise arising in connection therewith.
The information in this document might include forward-looking statements which are based on current expectations and projections about future events. These forward-looking statements are subject to risks, uncertainties and assumptions about the Company and its subsidiaries and investments, including, among other things, the development of its business, trends in its operating industry, and future capital expenditures and acquisitions. In light of these risks, uncertainties and assumptions, the events in the forward-looking statements may not occur. No one undertakes to publicly update or revise any such forward-looking statement.
The information and opinions contained in this presentation are provided as at the date of this presentation and are subject to change without notice.
Any forward-looking information contained herein has been prepared on the basis of a number of assumptions which may prove to be incorrect and, accordingly, actual results may vary. This document does not constitute an offer or invitation to purchase or subscribe for any shares and/or investment products mentioned and no part of it shall form the basis of or be relied upon in connection with any contract or commitment whatsoever.
The information herein may not be reproduced or published in whole or in part, for any purpose, or distributed to any other party. By accepting this document you agree to be bound by the foregoing limitations.
Vittorio Pracca tel. +39.02.8898.5853
Gabriele Blei tel. +39.02.8898.5849
Email [email protected]
IR Website www.azfund.com
IR Contacts Upcoming events
25 July 2013: Board of Directors approval of 1H 2013 results
7 November 2013: Board of Directors approval of 9M 2013 results
Contacts & Corporate calendar