bark thickness and fire regime - uv
TRANSCRIPT
J.G. Pausas – Bark thickness and fire regimes – Functional Ecology
Supplementary information
Appendix S1. Methods for studying bark thickness
Measuring bark thickness
Bark thickness varies ontogenetically with tree size (Fig. 4) and thus any measure of bark thickness
should be associated with the diameter of the stem where the bark thickness was measured, and also
the location on the tree (i.e., height of the bole, or distance to the tip for branches). Ontogenetic
variation in bark thickness can be studied by measuring barks in one individual at different ages, but
more typically it is studied across individuals of different sizes in a population. In most cases,
variability in bark thickness is related to variability in the outer bark (Jackson et al. 1999, Paine et
al. 2010), although inner and outer bark thickness are rarely differentiated (see below) and the
relative proportion to total bark thickness varies among species. Hereafter, unless otherwise stated,
by bark thickness (BT) I refer to total (inner plus outer) bark thickness.
BT can be measured with a standard bark gauge or by inserting a knife or awl and measuring the
depth of penetration. The mean of several readings around the stem are usually calculated. In trees
with furrowed bark, there is a tendency to measure over the ridges/plates (maximum bark
thickness); however, if the ratio of bark ridges to furrow is not constant over the samples (e.g., over
the ontogeny, or across the species), then the measurement may overestimate the heat protection in
species or individuals with strongly furrowed bark. When comparing species, there may also be
some sampling error due to differences in the bark-wood junction depending on the wood hardness
and the sharpness of the gauge or knife. However, these errors tend to be small. Extreme cold
conditions (frost) may lead to a pronounced shrinking of the bark (Loris et al. 1999). For a more
accurate estimation, a portion of the bark can be extracted from the stem with the help of a knife or
chisel and the thickness measured with a caliper. Another advantage of this method is that it is
possible to differentiate between inner and outer bark thickness. Contour methods (Adams and
Jackson 1995, Schwilk et al. 2013) are more time consuming but enable better estimates to be made
of the variability in thickness (total, inner, and outer bark thickness) or bark roughness. For saplings
or thin branches, BT measurements are typically performed under a dissecting microscope or by
using a digital scanner from the stem cross section. Because most studies have measured BT using a
bark gauge, knife or awl, they do not differentiate between the inner and the outer bark (for
important exceptions see Jackson et al. 1999, Romero et al. 2009, Paine et al. 2010, Graves et al.

J.G. Pausas – Bark thickness and fire regimes – Functional Ecology
submitted).
Bark measurement can be made in different locations of the plant, which complicates comparison
across different studies. For trees, it is typically measured at breast height, while for small trees and
shrubs, it is measured at the lower parts of the trunk (e.g., 10cm, 50cm), below stem bifurcation.
However, because flames in surface-fire regimes are short, trees sometimes have disproportionally
thicker bark at the base. Thus, in such ecosystems it may be important to consider the BT at the
lower bole (avoiding basal swelling formations). There is some evidence that the rate at which BT
tapers height along the bole varies among species (Wiant and Koch. 1974, Odhiambo et al. 2014,
Graves et al. submitted) and this could determine survival under relatively high-intensity surface
fires.
Bark can also be measured in branches or small twigs (e.g., Paine et al. 2010, Baraloto et al. 2010),
and this is especially interesting in ecosystems where the full tree is affected by fire (crown-fire
ecosystems, see below). These measures in the branches may have the advantage that readings can
be standardized by measuring on a given diameter. If the aim of the measurement is not so much the
insulation but the allocation to bark, one possibility is to measure the bark in a branch at a fixed
distance from the tip of the branch (e.g., Rosell et al. 2014) or at a fixed age (in plants showing a
clear annual growth pattern in branches).
Comparing bark thickness
Bark thickness is typically measured for comparing among species or among habitats. The direct
BT value (absolute BT) is not always the most useful information as it depends on the tree size.
However, it indicates the absolute resistance to fire and thus it is an appropriate measure when
searching for thresholds of BT that enable survival (i.e., the safe bark thickness). For instance,
Hoffmann et al. (2012) suggest that in the Brazilian cerrado a BT of 5.9 mm is needed to ensure a
50% chance of surviving a low intensity fire (flame length < 2m) and 9.1 mm for a high-intensity
fire (flame length > 2m). These thresholds are not general values as they depend on the intensity of
fires in each ecosystem. In fact, different authors have studied the BT required for survival using
experimental fires in the lab, and the different values obtained reflect the different fire intensities
and flame temperatures simulated (see Tables S2 and S3). Absolute BT values have also been used
in databases and floras where BT is often given as an ‘average’ value for adults.
J.G. Pausas – Bark thickness and fire regimes – Functional Ecology
For comparison purposes, it is often more appropriate to use the relative bark thickness (i.e., bark
thickness divided by the diameter; BT/D). For instance, while there is no difference in absolute BT
values between afrotropical and neotropical savanna plants, the relative BT is clearly different (Fig.
5b; Dantas & Pausas 2013). However, if the relationship between BT and D is nonlinear, the BT/D
may also vary with ontogeny, and so a single value for a species may not always be
accurate. In such cases, the best approach is to measure BT for a wide range of diameters and thus
to have the full distribution of BT with tree size, and compare species or habitats by appropriate
statistical methods, such as a covariance-type analysis (Dantas & Pausas 2013) or using the
residuals of the BT-D regression (Paine et al. 2010). Performing comparison using only the linear
section of the BT-D relationship has also been proposed (Hempson et al. 2014); however, not all
species show a clear linear pattern and for some species this method excludes a considerable
amount of information.
Bark thickens with tree growth and thus the thickness of the bark is strongly related to tree diameter
through a scaling relationship that follows a power (allometric) function: BT = A·Db, where BT is
the bark thickness, D the diameter, and b the allometric coefficient (also called a scaling factor or
allometric scaling). On a log-log scale this power function yields a linear relationship with intercept
log(A) and slope b that can be estimated by a linear regression; because both BT and diameter are
subject to error, major axis regression may be a more appropriate fitting approach than standard
regression (Warton et al. 2006). The specific coefficients of this relationship reflect different
ontogenetic patterns of bark allocation and can be useful for understanding different plant strategies
(Jackson et al. 1999, Hoffmann et al. 2003; Higgins et al. 2012; Schwilk et al. 2013; Poorter et al.
2014). Plants may allocate disproportionately greater resources to BT when small (b <1, negative
allometry) such as many savanna trees; or when large (b > 1, positive allometry) such as in many
closed forests (Table 1); yet other plants may show a linear relationship with diameter (b ~ 1,
isometry; i.e., BT/D is constant). It is important to note that the allometric coefficient indicates the
rate at which bark thickens relative to size (ontogenetically) which is not the same as absolute bark
thickness because: 1) different species may attain different sizes and reach different BT; and 2)
different species may have different allometric patterns of bark thickness (e.g., negative or positive
allometry), and thus the BT function in different species may show ontogenetic crossovers (Fig. 4,
Schwilk et al. 2013; Poorter et al. 2014).
One difficulty when comparing BT values among species or ecosystems is that none of these
measures reveal the bark growth rate (temporal dimension). For two species with similar BT, or
J.G. Pausas – Bark thickness and fire regimes – Functional Ecology
similar relative BT, the species growing more quickly or living in more productive environments
would achieve a thicker bark sooner, and thus would be better able to survive a short fire interval.
For this reason, it would be informative to measure BT together with tree age. In some cases, the
age of the bark can be estimated from annual bark rings (e.g., in Querucs suber, Sánchez-González
et al. 2008, Surový et al. 2009; in Magnolia, Shimomura et al. 1988), or from the number of annual
shoot growth segments for bark in branches.
References
Adams, D.C. & Jackson, J.F. (1995) Estimating the allometry of tree bark. American Midland Naturalist 134,99-106.
Baraloto, C., Timothy Paine, C.E., Poorter, L., Beauchene, J., Bonal, D., Domenach, A.-M., Hérault, B., Patiño, S., Roggy, J.-C. & Chave, J. (2010) Decoupled leaf and stem economics in rain forest trees. Ecology Letters 13, 1338-1347.
Dantas, V.L. & Pausas, J.G. (2013) The lanky and the corky: fire-escape strategies in savanna woody species.Journal of Ecology 101, 1265-1272.
Graves, S.J., Rifai, S.W. & Putz, F.E. (submitted) Outer and inner bark thickness changes with height on stems of fire-resistant and fire-sensitive Floridian oaks (Quercus spp.).
Hempson, G.P., Midgley, J.J., Lawes, M.J., Vickers, K.J. & Kruger, L.M. (2014) Comparing bark thickness: testing methods with bark-stem data from two South African fire-prone biomes. Journal of Vegetation Science doi, 10.1111/jvs.12171.
Higgins, S.I., Bond, W.J., Combrink, H., Craine, J.M., February, E.C., Govender, N., Lannas, K., Moncreiff, G. & Trollope, W.S.W. (2012) Which traits determine shifts in the abundance of tree species in a fire-prone savanna? Journal of Ecology 100, 1400-1410.
Hoffmann, W.A., Geiger, E.L., Gotsch, S.G., Rossatto, D.R., Silva, L.C.R., Lau, O.L., Haridasan, M. & Franco, A.C. (2012) Ecological thresholds at the savanna-forest boundary: how plant traits, resourcesand fire govern the distribution of tropical biomes. Ecology Letters 15, 759–768.
Hoffmann, W.A., Orthen, B. & Do Nascimento, P.K.V. (2003) Comparative fire ecology of tropical savanna and forest trees. Functional Ecology 17, 720-726.
Jackson, J.F., Adams, D.C. & Jackson, U.B. (1999) Allometry of constitutive defense: A model and a comparative test with tree bark and fire regime. American Naturalist 153, 614-632.
Loris, K., Havranek, W. & Wieser, G. (1999) The ecological significance of thickness changes in stem, branches and twigs of Pinus cembra L. during winter. Phyton 39, 117-122.
Odhiambo, B., Meincken, M. & Seifert, T. (2014) The protective role of bark against fire damage: a comparative study on selected introduced and indigenous tree species in the Western Cape, South Africa. Trees, 1-11.
Paine, C.E.T., Stahl, C., Courtois, E.A., Patiño, S., Sarmiento, C. & Baraloto, C. (2010) Functional explanations for variation in bark thickness in tropical rain forest trees. Functional Ecology 24, 1202-1210.
Poorter, L., Mcneil, A., Hurtado, V.-H., Prins, H.H.T. & Putz, F.E. (2014) Bark traits and life history strategies of tropical dry- and moist forest trees. Functional Ecology 28, 232-242.
Romero, C., Bolker, B.M. & Edwards, C.E. (2009) Stem responses to damage: the evolutionary ecology of Quercus species in contrasting fire regimes. New Phytologist 182, 261-271.
Rosell, J.A., Gleason, S., Méndez-Alonzo, R., Chang, Y. & Westoby, M. (2014) Bark functional ecology: evidence for tradeoffs, functional coordination, and environment producing bark diversity. New Phytologist 201, 486-497.
Sánchez-González, M., Cañellas, I. & Montero, G. (2008) Base-age invariant cork growth model for Spanishcork oak (Quercus suber L.) forests. European Journal of Forest Research 127, 173-182.
Schwilk, D.W., Gaetani, M.S. & Poulos, H.M. (2013) Oak bark allometry and fire survival strategies in the Chihuahuan Desert Sky Islands, Texas, USA. PLoS ONE 8, e79285.

J.G. Pausas – Bark thickness and fire regimes – Functional Ecology
Shimomura, H., Sashida, Y., Zhao, Z., Tokumoto, H. & Kobayashi, H. (1988) Pharmacognostical studies on the Magnolia bark (I) : A preliminary study on the annual ring-like structure in the bark of Magnolia.Japanese Journal of Pharmacognosy 42, 220-227.
Surový, P., Olbrich, A., Polle, A., Ribeiro, N.A., Sloboda, B. & Langenfeld-Heyser, R. (2009) A new method for measurement of annual growth rings in cork by means of autofluorescence. Trees 23, 1237-1246.
Warton, D.I., Wright, I.J., Falster, D.S. & Westoby, M. (2006) Bivariate line-fitting methods for allometry. Biological Reviews 81, 259-291.
Wiant, H.V. & Koch, C.B. (1974) Predicting diameters inside bark from outside bark measurements on some Appalachian hardwoods. Journal of Forestry 72, 775.

J.G. Pausas – Bark thickness and fire regimes – Functional Ecology
Supplementary information
Table S1. Examples of different bark thickness values (mean, maximum, and relative values) among pine populations (i.e., within species) living in different fire regimes. P. radiata is considered a thick-barked species while P. halepensis is thin-barked (He et al. 2012). Asterisks (*) indicate the most frequent habitat of the species; BT: bark thickness; D: diameter; variability in BT mean values (var) expressed as standard error in P. radiata, and standard deviation in P. halepensis.
Species Inferred fire regime BT (cm)mean ± var
BT (cm)max
Mean BT/D(mm/cm)
Pinus radiata (1) No/low frequency fires (never inhabited)
1.4 ± 0.1 4 0.48
Frequent surface fires (historically inhabited by Native Americans)*
3.3 ± 0.1 6.6 0.85
Pinus halepesis (2) Frequent crown-fires* 2.34 ± 0.53 3.7 0.09
No crown-fires (surface fires) 3.14 ± 0.68 5.0 0.11
* (1) Coastal Californian forests (Stephens & Libby 2006); (2) Spanish eastern coast P. halepensis forests, elaborated from own data in Hernández-Serrano et al. (2013).
Table S2. Examples of experimental evidence showing the effect of bark thickness (BT, in mm) on the maximum temperature (°C) reached by the cambium, expressed as an equation with BT as an independent variable. BT60 shows the predicted bark thickness threshold to protect the cambium from reaching 60°C (given the heat applied).
Heat source Maximum cambiumtemperature (°C)
BT60
(cm)Details and reference
Wick fire, ca. 2.35 min 1 / (0.0106 + 0.00095·BT) 0.64 15 species, eastern Amazon, Uhl & Kauffman (1990)
Kerosene-soaked ropeattached to the trunk
103 – 2.3·BT (*) 1.89 11 species, North American hardwoods,Hengst & Dawson (1994)
Kerosene-soaked ropeattached to the trunk
255.9·BT^-0.552 1.40 16 species, dry forest in eastern Bolivia, Pinard & Huffman (1997)
Paraffin saturated ropeattached to the trunk
98 – 3· BT (*) 1.27 7 species, northern Australia, Lawes et al. (2011)
Propane torch to the bark,400°C, 2 min
172.91·BT^-0.4927 0.86 6 species, North America, VanderWeide& Hartnett (2011)
(*) estimated, equation is not reported in original study
J.G. Pausas – Bark thickness and fire regimes – Functional Ecology
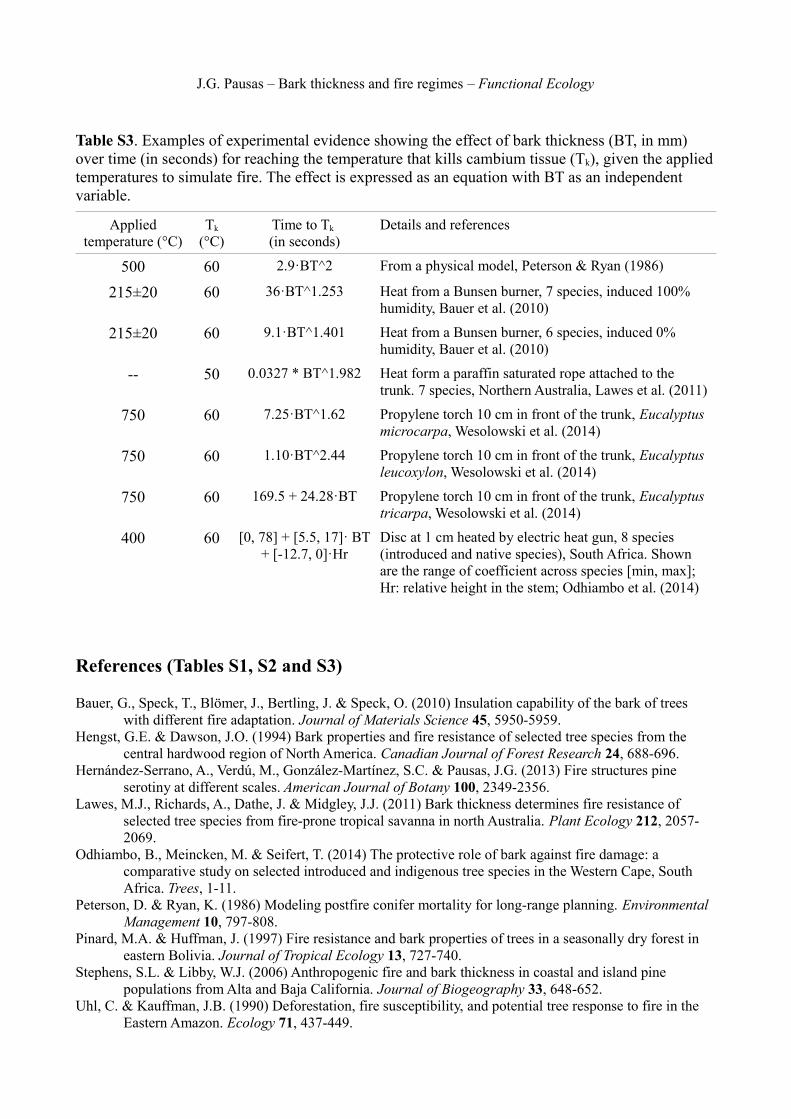
Table S3. Examples of experimental evidence showing the effect of bark thickness (BT, in mm) over time (in seconds) for reaching the temperature that kills cambium tissue (Tk), given the appliedtemperatures to simulate fire. The effect is expressed as an equation with BT as an independent variable.
Appliedtemperature (°C)
Tk
(°C)Time to Tk (in seconds)
Details and references
500 60 2.9·BT^2 From a physical model, Peterson & Ryan (1986)
215±20 60 36·BT^1.253 Heat from a Bunsen burner, 7 species, induced 100% humidity, Bauer et al. (2010)
215±20 60 9.1·BT^1.401 Heat from a Bunsen burner, 6 species, induced 0% humidity, Bauer et al. (2010)
-- 50 0.0327 * BT^1.982 Heat form a paraffin saturated rope attached to the trunk. 7 species, Northern Australia, Lawes et al. (2011)
750 60 7.25·BT^1.62 Propylene torch 10 cm in front of the trunk, Eucalyptus microcarpa, Wesolowski et al. (2014)
750 60 1.10·BT^2.44 Propylene torch 10 cm in front of the trunk, Eucalyptus leucoxylon, Wesolowski et al. (2014)
750 60 169.5 + 24.28·BT Propylene torch 10 cm in front of the trunk, Eucalyptus tricarpa, Wesolowski et al. (2014)
400 60 [0, 78] + [5.5, 17]· BT+ [-12.7, 0]·Hr
Disc at 1 cm heated by electric heat gun, 8 species (introduced and native species), South Africa. Shown are the range of coefficient across species [min, max]; Hr: relative height in the stem; Odhiambo et al. (2014)
References (Tables S1, S2 and S3)
Bauer, G., Speck, T., Blömer, J., Bertling, J. & Speck, O. (2010) Insulation capability of the bark of trees with different fire adaptation. Journal of Materials Science 45, 5950-5959.
Hengst, G.E. & Dawson, J.O. (1994) Bark properties and fire resistance of selected tree species from the central hardwood region of North America. Canadian Journal of Forest Research 24, 688-696.
Hernández-Serrano, A., Verdú, M., González-Martínez, S.C. & Pausas, J.G. (2013) Fire structures pine serotiny at different scales. American Journal of Botany 100, 2349-2356.
Lawes, M.J., Richards, A., Dathe, J. & Midgley, J.J. (2011) Bark thickness determines fire resistance of selected tree species from fire-prone tropical savanna in north Australia. Plant Ecology 212, 2057-2069.
Odhiambo, B., Meincken, M. & Seifert, T. (2014) The protective role of bark against fire damage: a comparative study on selected introduced and indigenous tree species in the Western Cape, South Africa. Trees, 1-11.
Peterson, D. & Ryan, K. (1986) Modeling postfire conifer mortality for long-range planning. Environmental Management 10, 797-808.
Pinard, M.A. & Huffman, J. (1997) Fire resistance and bark properties of trees in a seasonally dry forest in eastern Bolivia. Journal of Tropical Ecology 13, 727-740.
Stephens, S.L. & Libby, W.J. (2006) Anthropogenic fire and bark thickness in coastal and island pine populations from Alta and Baja California. Journal of Biogeography 33, 648-652.
Uhl, C. & Kauffman, J.B. (1990) Deforestation, fire susceptibility, and potential tree response to fire in the Eastern Amazon. Ecology 71, 437-449.

J.G. Pausas – Bark thickness and fire regimes – Functional Ecology
Vanderweide, B.L. & Hartnett, D.C. (2011) Fire resistance of tree species explains historical gallery forest community composition. Forest Ecology and Management 261, 1530-1538.
Wesolowski, A., Adams, M.A. & Pfautsch, S. (2014) Insulation capacity of three bark types of temperate Eucalyptus species. Forest Ecology and Management 313, 224-232.
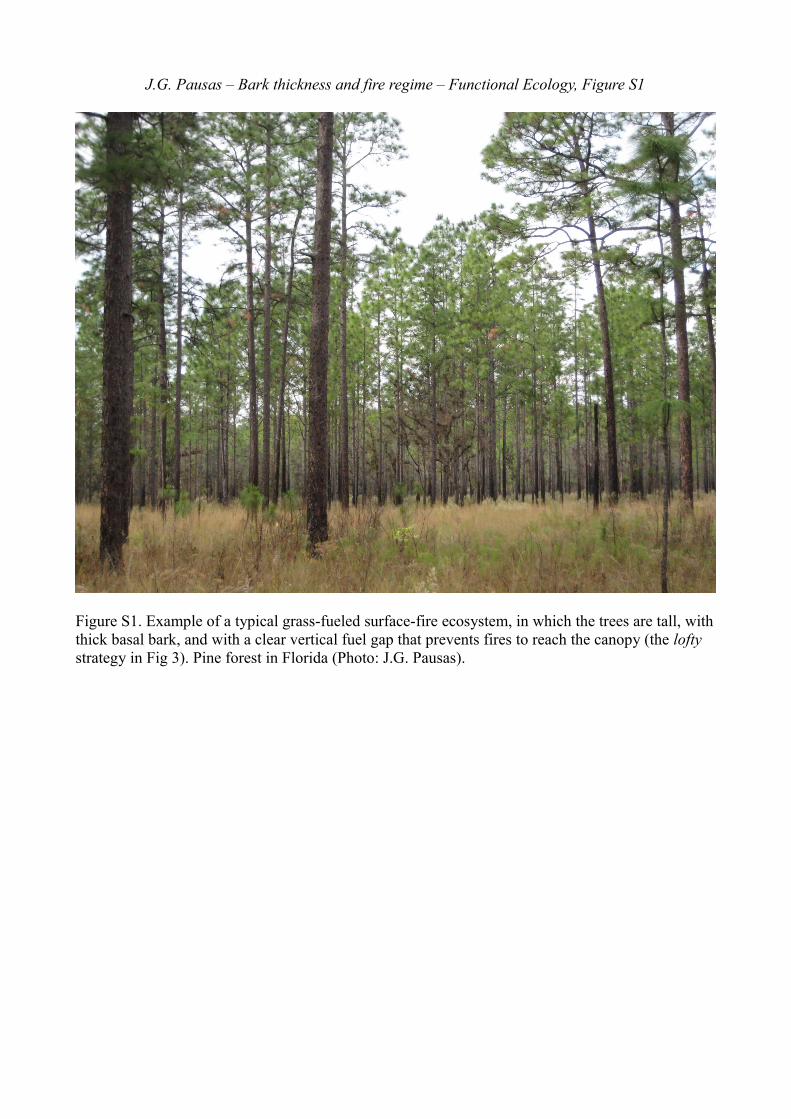
J.G. Pausas – Bark thickness and fire regime – Functional Ecology, Figure S1
Figure S1. Example of a typical grass-fueled surface-fire ecosystem, in which the trees are tall, withthick basal bark, and with a clear vertical fuel gap that prevents fires to reach the canopy (the lofty strategy in Fig 3). Pine forest in Florida (Photo: J.G. Pausas).
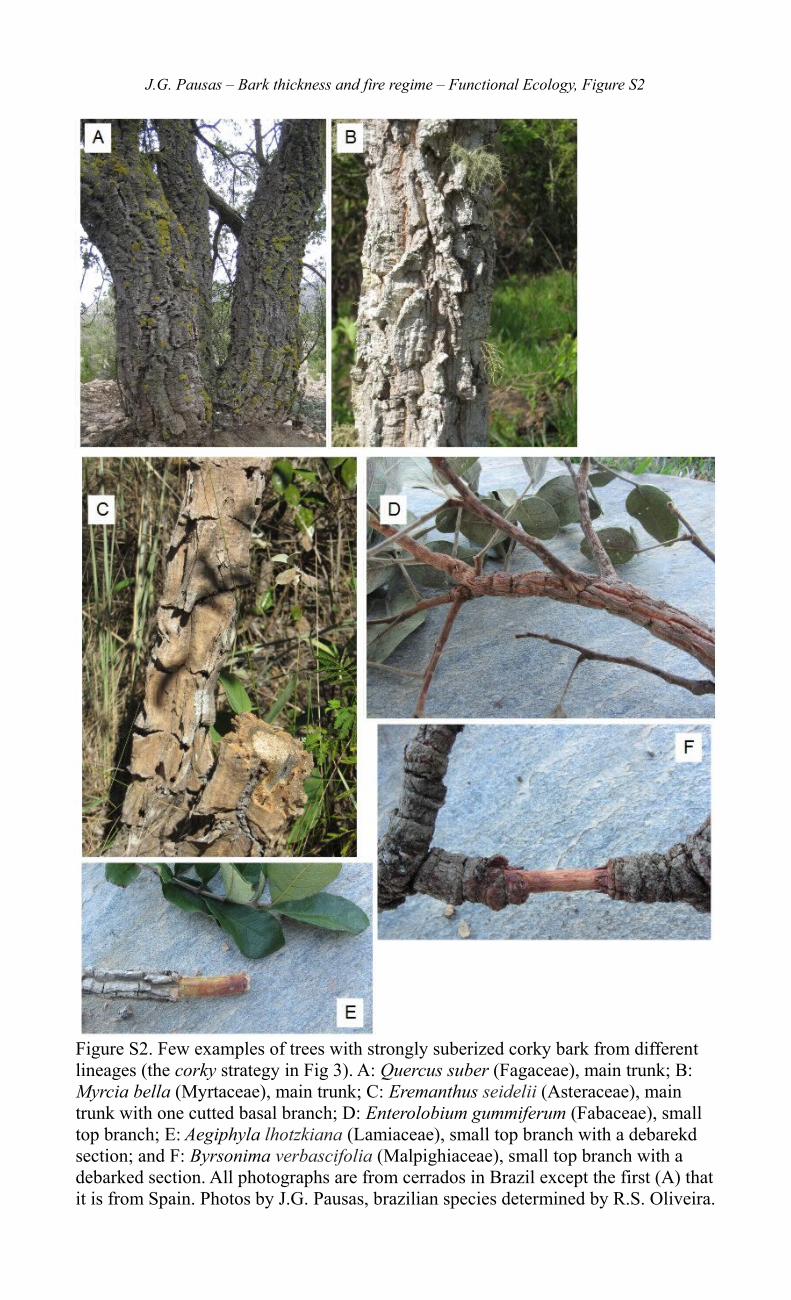
J.G. Pausas – Bark thickness and fire regime – Functional Ecology, Figure S2
Figure S2. Few examples of trees with strongly suberized corky bark from different lineages (the corky strategy in Fig 3). A: Quercus suber (Fagaceae), main trunk; B: Myrcia bella (Myrtaceae), main trunk; C: Eremanthus seidelii (Asteraceae), main trunk with one cutted basal branch; D: Enterolobium gummiferum (Fabaceae), small top branch; E: Aegiphyla lhotzkiana (Lamiaceae), small top branch with a debarekd section; and F: Byrsonima verbascifolia (Malpighiaceae), small top branch with a debarked section. All photographs are from cerrados in Brazil except the first (A) thatit is from Spain. Photos by J.G. Pausas, brazilian species determined by R.S. Oliveira.
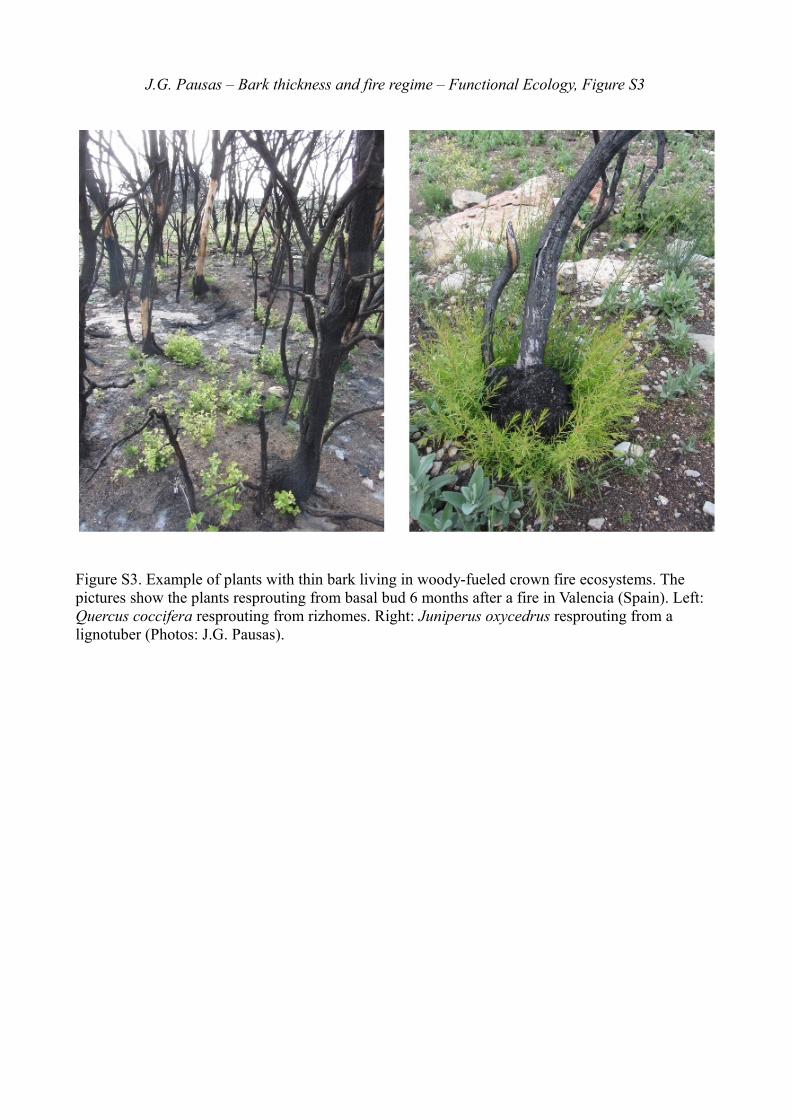
J.G. Pausas – Bark thickness and fire regime – Functional Ecology, Figure S3
Figure S3. Example of plants with thin bark living in woody-fueled crown fire ecosystems. The pictures show the plants resprouting from basal bud 6 months after a fire in Valencia (Spain). Left: Quercus coccifera resprouting from rizhomes. Right: Juniperus oxycedrus resprouting from a lignotuber (Photos: J.G. Pausas).