barriers to information and communication technology (ict
TRANSCRIPT

BARRIERS TO INFORMATION AND COMMUNICATION
TECHNOLOGY (ICT) ADOPTION AND USE
AMONGST SMEs: A STUDY OF THE SOUTH AFRICAN
MANUFACTURING SECTOR
by
PRIYAL PILLAY
Student number: 0411076G
A RESEARCH REPORT
SUBMITTED TO
THE FACULTY OF COMMERCE, LAW AND MANAGEMENT, UNIVERSITY
OF THE WITWATERSRAND,
IN PARTIAL FULFILMENT OF THE REQUIREMENTS FOR THE DEGREE
OF MASTER OF MANAGEMENT (MMENVC)
Supervisor: Dr Jose Barreira
Johannesburg, February 2016

ii
ABSTRACT
This paper aims to look at the barriers of ICT adoption amongst Small to
Medium Enterprises (SMEs) in South Africa, specifically in the high growth-
manufacturing sector. The population of the study is comprised of
manufacturing SME owners and managers in Gauteng, South Africa. The
objectives of this study are threefold. Firstly, it aims to establish which ICTs
SMEs are currently making use of in South Africa. Secondly, it will analyse the
perceived value added to SMEs through ICT adoption. And thirdly, the study
endeavours to unearth the various barriers faced by SMEs when adopting
ICTs.
The research consists of data collection from 81 SMEs in the manufacturing
sector in Gauteng, South Africa, by means of an online questionnaire. The
data was analysed through a variety of statistical techniques covering both
descriptive statistics and multivariate analysis. The following conclusions were
reached:
Three barriers examined are significantly important to the adoption of
ICTs, namely lack of existing hardware, immediate return on
investment (ROI), and lack of infrastructure.
The perceived value of ICT has a positive, significant relationship to
ICT adoption.
The majority of SMEs still predominantly make use of general ICTs,
with more advanced ICT use lagging behind significantly. The majority
of respondents have Voice Over Internet Protocol (VoIP) phone
services (69%), Internet access and e-mail (90%), as well as telephone
(89%) and fax (82%) services as ICTs that have already been
implemented.
The education level of the owner/manager has a significant, positive
relationship with the level of ICT adoption, particularly amongst
general-use ICT and production- integrating ICT.

iii
DECLARATION
I, ____Priyal Pillay______, declare that this research report is my own work
except as indicated in the references and acknowledgements. It is submitted
in partial fulfilment of the requirements for the degree of Master of
Management at the University of the Witwatersrand, Johannesburg. It has not
been submitted before for any degree or examination in this or any other
university.
Signed at ………………………………………………………………………………
on the …26th….. day of …February…………… 2016…

iv
DEDICATION
To my l wife, Joelene. Thank you for all your support and patience throughout
this challenging journey. I love you.

v
ACKNOWLEDGEMENTS
I am grateful to my supervisor, Dr Jose Barreira for his guidance and insight
during the research process.

vi
TABLE OF CONTENTS
ABSTRACT……… ............................................................... ……….ii
DECLARATION…........................................................................... iii
DEDICATION…… ........................................................................... iv
ACKNOWLEDGEMENTS ................................................................v
LIST OF TABLES. ...........................................................................x
LIST OF FIGURES ......................................................................... xii
CHAPTER 1: INTRODUCTION ........................................................1
1.1 Purpose of the study ............................................... ……………………….1
1.2 Context of the study ................................................................................. 1
1.3 Problem statement ................................................................................... 2
1.3.1 Main problem ................................................................................. 2
1.3.2 Sub-problems ................................................................................. 2
1.4 Significance of the study ......................................................................... 3
1.5 Delimitations of the study ........................................................................ 4
1.6 Definition of terms .................................................................................... 4
1.6.1 Small and medium enterprises ....................................................... 4
1.6.2 Information and communication technology (ICT) .......................... 4
CHAPTER 2: LITERATURE REVIEW .............................................6
2.1 Introduction .............................................................................................. 6
2.2 Background discussion. .......................................................................... 6
vii
2.2.1 The SMEsector .............................................................................. 7
2.2.2 SMEs and ICT in south africa ........................................................ 9
2.2.3 ICT adoption models .................................................................... 12
2.2.4 Value added through ICT adoption .............................................. 21
2.2.5 Barriers to ICT adoption by SMEs ............................................... 28
2.3 First sub-problem ................................................................................... 35
2.4 Second sub-problem .............................................................................. 35
2.5 Third sub-problem .................................................................................. 35
2.6 Conclusion of literature review ............................................................. 36
2.6.1 Hypothesis 1 ................................................................................ 36
2.6.2 Hypothesis 2 ................................................................................ 36
2.6.3 Hypothesis 3 ................................................................................ 36
2.6.4 Hypothesis 4 ................................................................................ 37
2.6.5 Hypothesis 5 ................................................................................ 37
2.6.6 Hypothesis 6 ................................................................................ 37
CHAPTER 3: RESEARCH METHODOLOGY ................................ 38
3.1 Research methodology/paradigm ......................................................... 38
3.2 Research design ..................................................................................... 39
3.3 Population and sample .......................................................................... 39
3.3.1 Population .................................................................................... 39
3.3.2 Sample and sampling method ...................................................... 40
3.4 The research instrument........................................................................ 40
3.4.1 The pilot study .............................................................................. 41
3.5 Procedure for data collection ................................................................ 41
3.6 Data analysis and interpretation ........................................................... 42
3.7 Limitations of the study ......................................................................... 44
3.8 Validity and reliability ............................................................................ 44
3.8.1 External validity ............................................................................ 44
3.8.2 Internal validity ............................................................................. 45
3.8.3 Reliability ...................................................................................... 45

viii
3.8 Ethics ...................................................................................................... 46
CHAPTER 4: PRESENTATION OF RESULTS .............................. 47
4.1 Introduction ........................................................................................ …47
4.2 Demographic profile of respondents .................................................... 47
4.2.1 Industry ........................................................................................ 47
4.2.2 Job function .................................................................................. 49
4.2.3 Years in operation ........................................................................ 49
4.2.4 Number of employees .................................................................. 50
4.2.5 Level of education ........................................................................ 50
4.3 Results pertaining to Hypothesis 1 ...................................................... 51
4.4 Results pertaining to Hypothesis 2 ...................................................... 53
4.5 Results pertaining to Hypothesis 3 ...................................................... 55
4.6 Results pertaining to Hypothesis 4 ...................................................... 60
4.6.1 Descriptive statistics .................................................................... 60
4.6.2 Multivariate statistics: Logistic regression .................................... 61
4.7 Results pertaining to Hypothesis 5 ...................................................... 64
4.7.1 Descriptive statistics .................................................................... 64
4.7.2 Multivariate statistics: Logistic regression .................................... 66
4.8 Results pertaining to Hypothesis 6 ...................................................... 69
4.9 Summary of the results ......................................................................... 71
CHAPTER 5: DISCUSSION OF THE RESULTS ........................... 73
5.1 Introduction ............................................................................................ 73
5.2 Demographic profile of respondents .................................................... 73
5.3 Discussion pertaining to Hypothesis 1 ................................................ 74
5.4 Discussion pertaining to Hypothesis 2 ................................................ 75
5.4 Discussion pertaining to Hypothesis 3 ................................................ 76
5.4 Discussion pertaining to Hypothesis 4 ................................................ 77
5.4 Discussion pertaining to Hypothesis 5 ................................................ 79

ix
5.4 Discussion pertaining to Hypothesis 6 ................................................ 80
5.5 Conclusion .............................................................................................. 81
CHAPTER 6: CONCLUSIONS AND RECOMMENDATIONS ........ 83
6.1 Introduction ............................................................................................ 83
6.2 Conclusions of the study....................................................................... 83
6.3 Recommendations ................................................................................. 84
6.4 Suggestions for further research .......................................................... 87
REFERENCES ............................................................................... 89
APPENDIX A ............................................................................... 97
Actual Research Instrument .......................................................................... 97
APPENDIX B ............................................................................. 103
Consistency matrix ....................................................................................... 103
APPENDIX C ............................................................................. 105
Instrument Consent Form ............................................................................ 105

x
LIST OF TABLES
Table 1: South African SME Internet Connectivity …………………………... 11
Table 2: Barriers to ICT Adoption………………………………………………. 34
Table 3: Cronbach’s Alpha Reliability Test Results………………………….. 45
Table 4: Industry Sector of SMEs………………………………………………. 48
Table 5: Job Function……………………………………………………………. 49
Table 6: Years in Operation…………………………………………………….. 49
Table 7: Number of Employees………………………………………………… 50
Table 8: Level of Education……………………………………………………... 50
Table 9: Perceived Value Added through ICT use…………………………… 51
Table 10: Linear Regression Model for Perceived Value and ICT Adoption. 53
Table 11: The Pearson Correlation Coefficients for Perceived Value and ICT
Adoption…………………………………………………………………………… 54
Table 12: General ICT Usage…………………………………………………... 56
Table 13: Production Integrating ICT Usage………………………………….. 56
Table 14: External Barriers to ICT Adoption……………………………………61
Table 15: Logistic Regression (General-Use ICT)……………………………. 62
Table 16: Logistic Regression (Production-Integrating ICT)………………… 63
Table 17: Logistic Regression (Market-Orientated ICT)………………………63
Table 18: Descriptive Statistics (Internal Barriers)…………………………… 65
Table 19: Logistic Regression Model (General-Use ICT)……………………. 67

xi
Table 20: Logistic Regression Model (Production-Integrating ICT)………… 67
Table 21: Logistic Regression Model (Market-Orientated ICT)……………... 68
Table 22: Linear Regression Model (General-Use ICT)……………………... 69
Table 23: Linear Regression Model (Production-Integrating ICT)………….. 70
Table 24: Linear Regression Model (Market-Orientated ICT)………………. 70

xii
LIST OF FIGURES
Figure 1: ICT Adoption Process, Including Pre-Adoption, Adoption, and Post-
Adoption Stages………………………………………………………………….. 12
Figure 2: E-Adoption Model…………………………………………………….. 14
Figure 3: Theory of Reasoned Actions………………………………………… 16
Figure 4: Technology Acceptance Model (TAM).…………………………….. 17
Figure 5: Rogers’s Diffusion of Innovation Model…………………………….. 19
Figure 6: Theory of Planned Behaviour……………………………………….. 20
Figure 7: Impact of ICT on Organisations……………………………………... 26
Figure 8: Porter’s Value Chain………………………………………………….. 27
Figure 9: Barriers to ICT Adoption……………………………………………… 28
Figure 10: Industry Sector of SMEs……………………………………………. 48
Figure 11: General ICT Usage………………………………………………….. 55
Figure 12: Production-Integrating ICT Usage…………………………………. 58
Figure 13: Market-Oriented ICT Usage………………………………………... 59
Figure 14: External Barriers to ICT Adoption…………………………………. 60
Figure 15: Descriptive Statistics (Internal Barriers)…………………………... 65

1
CHAPTER 1: INTRODUCTION
1.1 Purpose of the study
The purpose of this study is to investigate the extent to which Small to
Medium Enterprises (SMEs) in South Africa are making use of Information
and Communication Technology (ICT), as well as the barriers to ICT adoption
amongst South African SMEs within the manufacturing sector.
SMEs play a vital role in all economies, particularly those of developing
countries like South Africa where there are substantial employment and
inequality challenges. Unfortunately there are also numerous barriers that
prevent SMEs from operating successfully. Access to information is one such
problem experienced due to a lack of ICT infrastructure. Information access
plays a critical role in informed decision-making processes, making it easier
for SMEs to make good competitive decisions (Modimogale & Kroeze, 2011).
It has been argued that ICTs have the potential to add substantial value to the
output and the competitive position of SMEs. Hence, in order to compete on a
broader scale, the numerous benefits of ICTs need to be taken into
consideration and awareness thereof needs to be raised (Ismail et al., 2011).
1.2 Context of the study
The ICT revolution has affected the way people and businesses share
information and is vital to opening up access to knowledge and information,
and influencing economics. From South Africa's perspective, it is neccesary to
understand how this sector functions and what processes are needed to best
maximise its potential (Hanna, 2010).
ICT incorporates primary digital technologies like mobile phones, computers

2
and other digital communication media used to collect, organise, store,
process, analyse and communicate both internal and external to organisations
(Ritchie & Brindley, 2005). However, SMEs are often slower to adopt, or have
increased difficulties adopting these new technologies in their businesses.
Currently the widespread uses of ICTs are changing the ways in which people
and companies operate. It is a feature of the technological advancements of
this period in history where there has been immense innovation in information
management and communication so that in many countries, information and
knowledge are easily conveyed, accessed and used (Barba-Sánchez et al.,
2008). Hence, the speed of technological change and what is available for
use by firms has revolutionised how they interact which, in turn, has changed
the way business is done and how businesses compete in the marketplace.
(Modimogale & Kroeze, 2011).
1.3 Problem statement
1.3.1 Main problem
According to Ritchie and Brindley (2005), ICT plays a very important role in
the current knowledge economy. Both traditional and newer ICT tools add
increasing value to SMEs and are thus important for the competitiveness of
the business. It is imperative for SMEs to become part of this economy in
order to compete and thrive in the future. The challenge is that SMEs face
many barriers to ICT adoption and mainly make use of traditional/basic
methods in order to remain competitive, rarely taking advantage of the
available ICT tools. The purpose of this research is to investigate the extent to
which SMEs in South Africa are making use of ICT, as well as the barriers to
ICT adoption amongst South African SMEs within the manufacturing sector.
1.3.2 Sub-problems
To understand the adoption and use of ICT by SMEs.
To determine the barriers to ICT adoption and use.

3
To determine the value obtained from the use of ICT in South African
SMEs.
1.4 Significance of the study
The nature and extent of ICT adoption has been explored quite extensively in
recent research, though in Africa such work is still limited. While over the last
decade or so theree have been noteable improvements in the ICT sector in
Africa, there are still numerous structural challenges. However, the potential is
infinite and if harnessed correctly can be ifluential in adressing social and
economic challenges in the continent (Frempong, 2011).
In cross-country studies of growth that mostly include both developed and
developing countries, the availability of telecommunications infrastructure is
generally found to contribute significantly to GDP growth, alongside other
knowledge related indicators such as education. This implies that with the
necessary investment in communications infrastructure and complementary
factors at the same time, considerably higher growth rates can be achieved
(World Bank, 1998).
The SME sector has an important role to play in economic development,
poverty reduction and employment creation in developing economies
(Hallberg, 2000). As previously mentioned, nowadays the business world has
been deeply influenced by ICTs and the application thereof amongst
businesses is widespread. ICTs are rapidly changing global production, work
and business methods, and trade and consumption patterns in and between
enterprises and consumers (Alam & Noor, 2009). In South Africa, the New
Growth Path (NGP) identifies manufacturing as one of the six core pillars of
growth that will drive the South African economy. The NGP envisages that as
many as 80,000 jobs can be created in South Africa in the manufacturing
sector by 2020 and identifies the SME sector as playing a key role in this
development (SEDA, 2012).
The findings of this study are expected to benefit ICT service providers,
government policy makers, business leaders and SMEs in the manufacturing
sector. Of particular significance is that the results from this research are

4
envisaged to generate new knowledge and also to motivate individuals to
investigate any knowledge gaps that may still exist.
1.5 Delimitations of the study
Only South African SMEs were sampled. The sample consisted of
SMEs within Gauteng, South Africa. Micro enterprises and survivalist
enterprises as defined in Section 1 of the National Small Business Act
(1996) were excluded from this research.
Data was collected from SMEs in the manufacturing sector. This sector
was selected due to its high growth potential and impact on the South
African economy.
No preference was given to urban and rural SMEs as long as they
were situated within the Gauteng region.
The questionnaires were directed to the owners of the firms as well as
managers.
Questionnaire responses were gathered over a period of three months
to allow sufficient time for response. Multiple follow-ups with
respondents were done to ensure that the questionnaire was
answered.
1.6 Definition of terms
1.6.1 Small and medium enterprises
This research will follow the definition of the National Small Business Act of
1996 which states that small to medium enterprises should comprise a
minimum of 50 employees and an upper threshold of 200 employees (DTI,
2008).
1.6.2 Information and communication technology (ICT)
ICT encompasses a range of technologies, information and resources.
Selwyn (2002) argues that the term Information and Communication
Technology (ICT) can be viewed as an umbrella term for a wide range of

5
technological applications which include digital broadcast technologies,
telecommunications technologies, and electronic information resources.
Similarly to Selwyn, Ritchie and Brindley (2005) define ICT as an array of
technologies used to collect, store, process and communicate information
within an enterprise. Lucchetti and Sterlacchini (2004) further categorise ICT
into the following groupings: general-user, production-integration and market-
oriented groups. These categorisations relate to the roles of ICT or the
strategic position that ICT can play within a particular SME.
General-user ICT group: This refers to very basic ICT implementation, which
includes commonly used fax, e-mail and Internet. The levels of adoption at
this stage are generally high and are not dependent on the size of the
business. At this level, technology is usually introduced into the business in
small doses and is not coordinated.
Production-integrating ICT group: These are more advanced than the
general-user ICTs and are either linked to the production processes carried
out within the firm or based on inter-firm relationships. They are expensive
and require the relevant technological skills in order to be carried out
(Lucchetti & Sterlacchini, 2004).
Enterprise resource planning (ERP), customer relationship management
(CRM) and mobile payment systems are some examples of applications and
tools at this level. Generally, applications under this group rely on networked
technologies and, according to Galloway and Mochrie (2005), this “has
transformed the capacity of SMEs to share and transfer information.”
Market-oriented ICT group: This ICT grouping refers to the firm’s web
presence, displaying the goods and the company information on the Internet.
Some websites may have e-commerce functionality, such as offering the
ability to place orders. This relates to the marketing aspect of the business
and most recently also includes social media tools and promotion (Lucchetti &
Sterlacchini, 2004).
6
CHAPTER 2: LITERATURE REVIEW
2.1 Introduction
Previous studies on ICT adoption have shown that SMEs in developing
countries have not fully taken advantage of technological developments to
extend their businesses beyond traditional borders (Humphrey et al., 2004).
Hence, there is a need for a better understanding of the determinants of ICT
usage and factors that drive or constrain its adoption and use (Harindranath et
al., 2008).
Gagnon and Toulouse (1996) maintain that the use of ICT in business is no
longer an option but rather one of survival, with a better understanding of the
process of adopting new technologies as both essential and urgent. Similarly,
Lawson et al. (2003) maintain that organisations that do not embrace new
technologies will eventually be left behind. A study carried out by Caldeira and
Ward (2002) in Portugal showed that SMEs that were doing well locally were
unable to compete with firms which used more aggressive business methods
and tactics and, as a result, found their market share eroded.
Whilst ICT adoption studies constitute a significant area of research within the
developed world, there continues to be a need for better understanding of the
adoption and use of ICTs within the specific context of SMEs in emerging
economies.
2.2 Background discussion
In this chapter, the literature pertaining to both SMEs and ICTs will be
reviewed. The SME sector will be described in detail, also focusing on the
importance of SMEs in emerging economies such as South Africa. Key ICT
adoption models will be described at length and an in-depth analysis of the

7
literature on the value that ICT could add to businesses will be undertaken.
Furthermore, related studies on the impact of ICT on competitiveness and
performance will also be discussed. Porter’s value chain model is used to
form a theoretical basis for the value added by ICT.
The chapter then looks at the barriers to ICT adoption and why SMEs have
difficulties in adopting ICT in their businesses. The analysis looks at the main
reasons for businesses not adopting ICT, namely: 1) ICT is unsuitable for the
type of business; 2) there is an absence of knowledge about the use of ICT;
3) there are insufficient IT skills; 4) there are specific perceptions related to
the high setup cost of ITC; and 5) reasons relating to the constantly evolving
ICT environment.
Following the theoretical grounding of all the above-mentioned concepts, the
hypotheses and sub-problems relating to the literature are presented.
2.2.1 The SME sector
There is no common definition of SMEs that is widely accepted as they can
vary according to size, age, sector, motivation, mode of organisation, ethnic
background, location, knowledge base, power and control of resources and
innovative capacity (Vivienne & Roberts, 2005). In the EU, for instance, an
SME is defined as a firm with fewer than 250 employees or annual turnover of
less than ECU 40 million. In the South African context, these thresholds are
too high, and would lead to over 90% of all firms (including listed companies)
being classed as SMEs. In South Africa, SMEs are therefore classified as
micro, very small, and small or medium enterprises (also referred to as
SMMEs) with varying ceilings for each individual sector.
SMEs are often distinguished by the nature of their production and
management arrangements, trading relations, financial practices and internal
competence (Lukács, 2005). A large proportion of studies have examined the
differences in management style between large businesses and SMEs. These
studies have identified that, among other notable characteristics, SMEs tend

8
to have a small management team (often one or two individuals), they are
strongly influenced by the owner, they have little control over their own
environment and they have the desire to remain independent (Dennis, 2000).
In South Africa, SMEs can be classified as micro, very small, and small or
medium enterprises (also referred to as SMMEs) with varying ceilings for
each individual sector. This research will follow the definition of the National
Small Business Act of 1996, which states that SMMEs should comprise a
minimum of 50 employees and an upper threshold of 200 employees (DTI,
2008).
The value of the small business sector is recognised in economies worldwide,
irrespective of the economy’s developmental stage. The contribution to
economic growth, job creation and social progress is highly valued and small
businesses are regarded as an essential element in a successful formula for
achieving economic growth (Vosloo, 1994). Matlay and Weathead (2013)
observed that SMEs are generally regarded as the “backbone of the
economy.” According to the authors, the business of SMEs constitutes the
main source of economic growth and development in developing countries.
Wolf (2001) found that in most African nations, SMEs account for a significant
share of production and employment and are, therefore, directly connected to
poverty alleviation. SMEs are especially challenged in developing countries by
the globalisation of production and the shift in the importance of various
determinants of competiveness.
Researchers have shown that SMEs employ large numbers of people and
greatly contribute to the national income (Berger, 2012; Mingaine, 2013).
However, studies in China, the USA, Kenya and other African countries show
that the contributions of SMEs are not the same across all enterprises
(Mingaine, 2013; Mutwiri & Mingaine, 2014). According to Reynold (2010),
those small enterprises which survive play a much more important role in
national development. A thriving SME sector contributes to the economy by
creating more employment opportunities, increasing production levels and
paving the way for greater entrepreneurship and innovation. The dynamic role
of SMEs in developing countries sees them as engines through which the
9
growth objectives of developing countries can be achieved (Hobohm, 2001).
It is estimated that SMEs employ 22% of the adult population in developing
countries. A study conducted by Abor and Quartey (2010) shows that 91% of
formal business entities in South Africa are SMEs and that these SMEs
contribute between 52% and 57% to the GDP and provide about 61%
employment. Accordingly, governments and donors alike have recognised the
important role of the SME sector for overall development. As a result, many
government policies are geared towards supporting the SME sector growth
through a variety of programs that include tax incentives, regulatory
provisions, policy interventions, technical assistance, training and various
types of business development services (O’Shea & Stevens, 1998).
2.2.2 SMEs and ICT in South Africa
The ICT sector in South Africa can be divided broadly into the information
technology (IT), telecommunications and electronics sub-sectors. For its part,
the IT sub-sector in South Africa is dominated by the private sector,
predominantly in the form of multinational enterprises. The majority of
companies in the IT sub-sector supply either software or services, while
comparatively fewer companies provide hardware (SEDA, 2012).
ICT is regarded as a significant contributor to development in South Africa
due to its direct influence on the performance of the economy. In line with this,
the ICT sector has made a positive contribution to stimulating economic
growth and development in the country in recent years. This has been
accompanied by a marginal increase in the contribution of the sector to the
national GDP. Specifically, between 2005 and 2008, the contribution of the
ICT sector to the country’s GDP increased from 1.8%to 2% (Gillwald et al.,
2012). ICTs can improve efficiency and increase productivity in different ways,
including improving efficiency in resource allocation, reducing transaction
costs and aiding technical improvement, leading to the outward shifting of the
production function.

10
The role that ICTs play in the broader society is underscored by the 2010
World Bank study that found that for every 10% increase in broadband
penetration in emerging markets, there is a 1.38% increase in GDP growth.
Therefore, the ability of South Africa to compete in the global economy is
dependent, to a large extent, on the state of its ICT sector and, in particular,
the country's ability to facilitate and grow the sector to meet its citizens' needs
for affordable, accessible broadband. The rapid deployment of fast and
affordable broadband infrastructure remains a powerful platform for creating
an internationally competitive knowledge economy, improve productivity and
expand access to new markets (DoC, 2013).
Although South Africa is better developed and its ICT infrastructure is far
more advanced than that of other African countries, Wolf (2001) found that
SMEs in South Africa still face similar problems as in other African countries
with respect to poor management practices, limited access to technology,
limited access to credit facilities and education, unemployment, ICT
infrastructure and the role of the SME sector in the slow pace of Internet
services. The challenge is to encourage SMEs to move beyond these basic
steps and towards eventually integrating ICTs in more sophisticated business
applications. This is a significant obstacle for SMEs, especially in developing
countries as this would require management and technical skills, as well as
investments and organisational changes which they may not be able to afford
or for which they may not have ready access to.
Gono, Hariandranath and Özcan (2015) conducted a study on ICT adoption
among South African SMEs in the manufacturing and logistics industry. Their
study found that the majority of the respondents lacked ICT knowledge and,
subsequently required external expertise. This highlights the lack of skills
within the workforce (Cant et al., 2015). The study also concluded that SMEs
were dependent on their supply chain relationship, which required that they
not only maintain these relationships, but also keep up with developments in
technology. Similarly, another study conducted amongst small hotel
establishments in South Africa stated that the main pressures to adopt ICT

11
came from various stakeholders, namely customers, suppliers and
competitors (Mpofu et al., n.d.). This study also highlights the importance of
the owner/manager’s support and knowledge of ICT as a key determinant of
adoption (Cant et al., 2015).
A 2010 survey conducted by the National Youth Development Agency
(NYDA) found that even though the majority of emerging (59%) and
established (79%) SMEs have access to the Internet, there is still a large
number of SMEs that have no Internet connectivity whatsoever. Table 1
below shows the percentages of Internet connectivity of South African SMEs.
One of the reasons why there is such a high number of SMEs without Internet
access is that South Africa is considered one of the most expensive countries
in terms of Internet costs and has one of the slowest connectivity speeds
(HumanIPO, 2013). South Africa is placed 58th out of 64 countries that were
used to compare broadband access versus cost ratio (HumanIPO, 2013).
Table 1: South African SME Internet Connectivity, 2010
Emerging SMEs Established SMEs
No Internet connectivity 37% 17%
GPRS connectivity 2% 2%
3G connectivity 6% 3%
ADSL connectivity 51% 74%
Source: Cant, et al. (2015)
The high cost of connectivity and lack of infrastructure is one of the biggest
problems in South Africa. According to Herselman (2003), South Africa has
developed in an uneven manner; while the urban areas have access to the
latest technologies, the rural areas are underdeveloped with little of the
infrastructure needed to thrive in the knowledge economy, such as electricity
and telephone lines, (Modimogale & Kroeze, 2011). This further highlights the
problem of the growing digital divide between developed and developing

12
countries. As mentioned above, the South African government is aware of the
need to participate in the global knowledge economy. It has thus mandated
the national telecommunications provider, Telkom to meet its target of making
South Africa a connected country while reducing the cost of communication
through ICASA (Independent Communications Authority of South Africa)
(Modimogale & Kroeze, 2011).
2.2.3 ICT adoption models
According to Kim and Crowston (2011), an individual’s ICT adoption and use
can be understood in three different stages: pre-adoption, adoption, and post-
adoption. Figure 1 below shows the adoption processes of ICT. At the pre-
adoption stage, people may examine a new technology and consider adopting
it if they see immediate benefits or specific need. At the adoption stage, they
then form an intention and plan to adopt the technology, and they eventually
purchase and use it. Finally, at the post-adoption stage, people may either
continue to use the technology or abandon it. If they abandon a technology,
they may start to examine another technology at the same time in order to
substitute their old technology.
Figure 1: ICT Adoption Process, Including Pre-Adoption, Adoption, and
Post-Adoption Stages
According to literature, SMEs tend to adopt simple ICT infrastructure such as
Source: Kim & Crowston, 2011

13
According to literature, SMEs prefer to adopt simple ICT infrastructure, such
as basic Internet services (e-mail and web services), which are more valuable
to them on an operational level rather than a strategic level. In turn, this could
be potentially interpreted as being in line with Brown and Lockett’s (2004)
study, which suggests that SMEs are more comfortable with low complexity
ICT applications and try to avoid the more complex applications. This is not
surprising because SMEs often lack the necessary ICT skills or capacity in
their workforce (Spectrum, 1997). Parida et al. (2010) argue that SMEs do
not adopt the more advanced ICT services because they are unfeasible or
may not suit the simple nature of their specific businesses. In fact, ICT
providers used to target large firms as they usually had adequate resources
and were willing to pay for more complex ICT services. Hence, their products
are often too expensive and unmanageable for SME users.
There are numerous models and theories employed in studying ICT adoption
and post-adoption behaviours. Social psychology and its applied theories and
models are dominant in this strand of research. These theories and models
focus on the intention to adopt and use ICT as a major theoretical foundation.
The most influential theories/models looking at ICT adoption can be rooted in
the following five: 1) E-adoption model; 2)Theory of Reasoned Action (TRA)
(Fishbein & Ajzen, 1975); 3) Diffusion of Innovations Theory (DOI) (Rogers,
2003); 4) Theory of Planned Behaviour (TPB) (Ajzen, 1991); and 5)
Technology Acceptance Model (TAM) (Davis, 1989). These models and
authors are all well cited in ICT adoption studies and this study will thus focus
on these core models (Runevad & Olofsson, 2014).
14
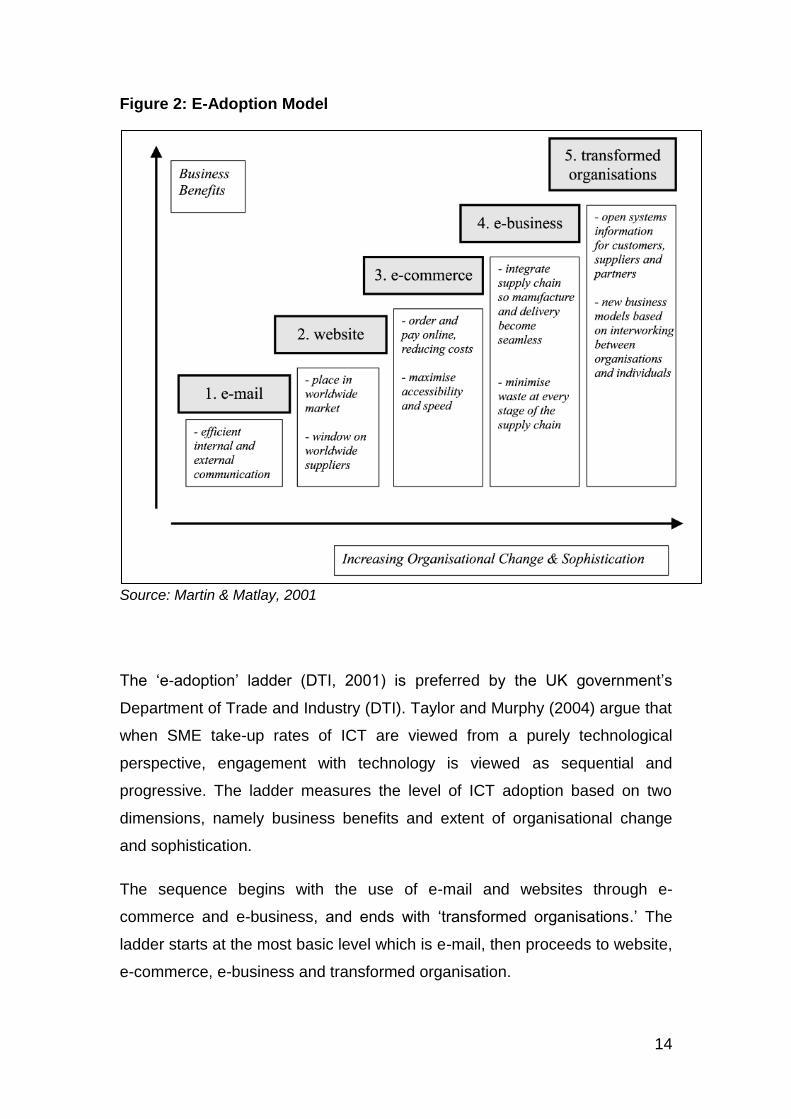
Figure 2: E-Adoption Model
Source: Martin & Matlay, 2001
The ‘e-adoption’ ladder (DTI, 2001) is preferred by the UK government’s
Department of Trade and Industry (DTI). Taylor and Murphy (2004) argue that
when SME take-up rates of ICT are viewed from a purely technological
perspective, engagement with technology is viewed as sequential and
progressive. The ladder measures the level of ICT adoption based on two
dimensions, namely business benefits and extent of organisational change
and sophistication.
The sequence begins with the use of e-mail and websites through e-
commerce and e-business, and ends with ‘transformed organisations.’ The
ladder starts at the most basic level which is e-mail, then proceeds to website,
e-commerce, e-business and transformed organisation.

15
1. E-mail: Basic e-mail communication involves communicating with co-
workers in the company and receiving/sending e-mails outside the company.
2. Website: Predominantly used for marketing purposes and for suppliers or
customers to look for information.
3. E-commerce: Customers are able to order and pay online at all times of
the day; this thus indicates higher-level accessibility.
4. E-business: Incorporates a higher level of integration with the company
functions together with e-commerce, which involves technical support and
other services.
5. Transformed organisations: This highest level of ICT sophistication
concerns integration with the firms’ business model and applies mainly to
companies that use the Internet as a platform for their daily business
activities. “The process views firms as starting with the simple use of e-mail
for the purpose of text messaging and communication. Further developmental
stages build up, step by step, through to the final goal of integrating most if
not all internal processes of business through the use of ICT” (Martin &
Matlay, 2001).
The e-adoption model offers an explanation of how the process of ICT
adoption takes place in small firms. This process views firms as starting with
the simple use of e-mail for the purposes of text messaging and
communication. Further developmental stages build up gradually through to
the final goal of integrating most, if not all, internal processes of a business
through the use of ICT (Martin & Matlay, 2001).
This ‘ladder’ model is driven by the assumption that positive benefits will result
from the development of Internet-based operations by existing small firms.
Despite previous research that outlined a more complex view of inhibitors and
motivators for small business ICT implementation, this assumption continues
to drive the process both at company and national levels (Chambers and
Parker, 2000).

16
It is argued that the ‘e-adoption’ model is problematic because it implies that
all SMEs have the need to follow one linear prescribed course, with the further
implication that not finishing at the top of the ladder is some kind of failure
(Taylor & Murphy, 2004). Moreover, Martin and Matlay (2001) also criticise
the assumption in the adoption ladder that all firms subscribe to linear
development in ICT and they argue that it fails to distinguish between
businesses of various sizes, ethnic origin, and stage of ICT adoption.
Figure 3: Theory of Reasoned Actions
Source: Ajzen & Fishbein, 1980
The Theory of Reasoned Actions (TRA) originates from social psychology and
has three general constructs: 1) behavioural intention; 2) attitude; and 3)
subjective norms. Fishbein and Ajzen (1980) developed the TRA to define the
links between the beliefs, attitudes, norms, intentions, and behaviours of
individuals. The theory assumes that a person’s behaviour is determined by
the person’s behavioural intention to perform it, and that the intention itself is
determined by the person’s attitudes and his or her subjective norms towards
the behaviour. In Figure 3 above one notices the two main aspects of TRA,
namely attitude towards behaviour and subjective norms, which lead to
intention. Intention is the ultimate motivating factor influencing one’s
behaviour (Ajzen, 1991).

17
In ICT adoption research TRA has been used as a fundamental theoretical
framework, and has also been combined with other theories and models. Both
attitude and subjective norms were found to be important determinants of
peoples’ intentions to adopt and use ICTs (Kim & Crowston, 2011). Attitude
particularly was found to have a significant influence on the intention to adopt
and continue to use ICT. One might have the belief that adopting modern ICT
is good for one’s professional career because it enhances efficiency and
effectiveness. However, it is time consuming to learn and resources are also
not always available. Each of these beliefs can be weighted based on one’s
perception of the merits of those beliefs. Regarding subjective norms,
previous studies found that subjective norms influence not only behavioural
intention, but also other constructs, including satisfaction, image and
perceived usefulness (Shareef et al., 2009).
Figure 4: Technology Acceptance Model (TAM)
Source: Davis, 1989
First proposed by Davis in 1986, the Technology Acceptance Model (TAM)
has been the dominant model in ICT adoption studies. Davis (1989)
presented the Technology Acceptance Model (TAM) to explain the
determinants of user acceptance of a wide range of technologies. In TAM,
Davis identified two theoretical constructs, including perceived usefulness

18
(PU) and perceived ease of use (PEOU), that affect the intention to use a
system.
Perceived usefulness refers to “the degree to which a person believes that
using a particular system would enhance his or her job performance”, and
perceived ease of use refers to “the degree to which a person believes that
using a particular system would be free of effort” (Davis, 1989). TAM believes
that actual technology adoption is determined by intention to use, which is
viewed as being jointly determined by the person’s attitude towards adopting
new technology innovation and perceived usefulness (Djatikusomo, 2014).
Hence, perceived usefulness and perceived ease of use are the two
determinants that have important relevance for the acceptance of information
technology (Bruner & Kumar, 2005; Davis, 1989; Talukder et al., 2008).
Numerous studies have used TAM as their theoretical background for
explaining ICT adoption. Scholars already confirmed that PU has a positive
relationship with both adoption intention (Davis, 1989) and continuance
intention (Agarwal & Karahanna, 2000; Venkatesh, 2000). In post adoption
studies, PU has been found to influence satisfaction (Bhattacherjee, 2001;
Limayem et al., 2007) and attitude toward the technology (Bhattacherjee &
Hikmet, 2008). PEOU has been found to influence both PU and adoption
intention (Davis, 1989).
Even though TAM was found to be a valid theoretical framework in studying
ICT adoption and use, it has also been criticised for several limitations,
including the original model’s intended generality, not considering non-
organisational setting (Venkatesh & Davis, 2000), overlooking the moderating
effects of ICT adoption in various contexts (Sun & Zhang, 2006).

19
Figure 5: Rogers’s Diffusion of Innovation Model
Source: Rogers, 1995
The Innovation Diffusion Theory (IDT) by Rogers (1995), as seen in Figure 5
above has been used in studying individuals’ technology adoption. The main
goal of IDT is to understand the adoption of innovation in terms of four
elements of diffusion, namely innovation, time, communication channels, and
social systems. IDT states that an individual’s technology adoption behaviour
is determined by their perceptions regarding the relative advantage,
compatibility, complexity, trialability, and observability of the innovation, as
well as social norms (Rogers, 2003). Based on information filters through the
networks – which depend on the nature of the networks – and the roles of its
opinion leaders, new innovations are either adopted or rejected. Opinion
leaders influence an audience through personal contact while intermediaries,
such as change agents and gatekeepers, also contribute to the process of
diffusion (Manueli, 2007).
There are a numerous studies that use the IDT as its theoretical framework or
combine the IDT with other theories and models to explain ICT adoption and
use. The five main constructs of IDT were employed and found to have
significant relationships with other factors in ICT adoption research. As an
example, relative advantage was shown to have a positive relationship with
attitude and relative usage intention, and compatibility was found to influence
PU, PEOU, attitude and intention. Similarly, complexity was found to have a

20
negative relationship with the technology adoption intention (Beatty et al.,
2001; Son & Benbasat, 2007). Rogers (1995) further claims that there are five
adopter categories, namely innovators, early adopters, early majority, late
majority, and laggards. Interestingly, the five categories follow a standard
deviation curve where very few innovators adopt at the beginning (2.5%), with
early adopters constituting 13.5%, the early majority constituting 34%, the late
majority another 34%, and the laggards making up the final 16% (Manueli,
2007).
Figure 6: Theory of Planned Behaviour
Source: Ajzen, 1991
Similar to TRA, the Theory of Planned Behaviour (TPB) is a well-established
social psychology theory which believes that specific salient beliefs influence
behavioural intentions and subsequent behaviour (Ajzen, 1991). TPB added
another construct to TRA called perceived behavioural control (PBC).
Perceived behavioural control refers to the perception of control over the
performance of a given behaviour. Numerous studies in ICT adoption
research have used TPB as their theoretical framework (Hsu & Chiu, 2004;
Liao et al., 2007). Similar to studies using TRA, these studies also found
21
significant relationships between attitude, subjective norms, perceived
behavioural control and behavioural intention. PBC, as an additional construct
in TPB, shed light on the importance of the perceived difficulty of the
behaviour and the person’s perceived ability to act out the behaviour. A good
number of studies found that PBC directly influences technology adoption
intention (Chau & Hu, 2001; Wu & Chen, 2005) and continuance usage
intention (Hsu et al., 2006; Liao et al., 2007).
Mathieson (1991), while trying to understand people’s intention to use
technology, compared the TAM with the TPB. From this, three main
differences were identified: 1) TAM supposes that usefulness and ease of use
are the main influences on user decisions, while TPB primarily explores
beliefs that are specific to each situation and proposes that some beliefs may
be generalised to other contexts while some may not; 2) unlike TPB, the TAM
is not as rigourous in determining social variables; and 3) TPB has a stronger
treatment of behavioural control, whereas TAM only focuses on ease of use in
regards to technology. Mathieson (1991) further suggests that while TAM is
useful for gathering general information about people’s perception of a
system, TPB can provide detailed information regarding each of its
components that might relate to a specific group of people.
2.2.4 Value added through ICT adoption
As previously mentioned, ICT can be seen primarily as digital technologies
used to collect, organise, store, process and communicate information within
and external to an organisation. ICT can fulfil a number of business needs,
such as strategic, operational or marketing needs, or a combination of these
(Ritchie & Brindley, 2005).
In the current knowledge economy, the ability of firms to create, accumulate
and disseminate knowledge represents a core function. Research has shown
that ICT can serve as a catalyst for effectively performing this function as it
enables firms to codify knowledge into a digital form and easily transmit it

22
anywhere around the world. Firms with access to ICT and with the capacity to
implement it are able to use this for transmitting and/or processing
information, which includes a wide array of technology, ranging from database
programs to local area networks (Matlay & Addis, 2003). ICT has also
speeded up the pace of globalisation and increased the complexity of
business practices, because firms today not only need to be familiar with their
local contexts but also with global developments. In order to compete in the
knowledge economy with these developments, SMEs need a strong ICT skills
base that lends itself to innovation and is ready to adapt to given changes.
Hence, ICT plays a fundamental role in reducing the uncertainties prevailing
in the economy through systems for processing and spreading information
more freely (Franco et al., 2011). ICT also provides access to information
through the Internet and, in general SMEs that effectively employ ICT have a
greater probability of becoming commercially successful (Taylor & Murphy,
2004).
ICTs have the potential to develop SMEs through its effective use and better
integration into business processes, while also assisting SMEs to make more
efficient decisions relevant to their performance. Furthermore, ICTs have the
potential to generate a step change among SMEs, making them more
competitive, innovative and able to generate growth (Barba-Sanchez et al.,
2007).
The adoption of ICTs improves information and knowledge management in
the firm, reduces transactions costs and increases the speed of transactions
for both business-to-business (B2B) and business-to-consumer (B2C)
transactions. In addition, ICTs are effective tools for improving external
communications and quality of services for established and new customers
(Lukács, 2005). ICTs enable SMEs to have access to robust business
information that leads to organisational effectiveness (Irani, 2002). These ICT
tools are no longer seen as a technical ‘service’, but as a critical resource to
enhance the competitiveness of SMEs in any business environment (Kohli &
Devaraj, 2004; Tumolo, 2001).

23
ICT and SME competitiveness
Compared to larger enterprises, flexibility is seen to be a significant source of
competitiveness for SMEs. The use of ICT can increase the competitiveness
of SMEs as they enable the creation of more flexible links with business
partners because of faster and more reliable communication channels.
Conversely however, ICTs can help larger organisations to increase their
flexibility through a restructuring of the business, which will enable them to
adapt more readily to changing conditions.
This may mean that the
competitive advantage of SMEs could also decline (Matambalya & Wolf,
2001).
In general, SMEs rely much more on informal information systems than larger
enterprises do. To get the relevant information that is needed for a rational
decision is often not cheap, especially as SMEs often have a single decision
maker – the owner/manager – whose personal resources are restricted.
However, SMEs have the advantage of smaller internal coordination costs as
decisions are made by or fewer people (Blili & Raymond, 1993).
External transaction costs are associated with the initiation, negotiation and
enforcement of contracts. The Internet can help especially to screen the
enterprises’ environments for relevant information and, in this way, get
information about sellers and customers that were previously out of reach
(Müller-Falcke, 2001). However, for the actual delivery of goods and the
transmission of payments, other infrastructure like transport and a reliable
banking system have to be in place.
With the use of ICTs, transaction costs can be lowered and, as a result, the
economies of scale in exporting can be reduced. This allows SMEs to expand
regionally and internationally, beyond local markets. However, SMEs that are
located in rural areas usually serve local niche markets and are thus protected
against competition from bigger enterprises because of high transport and
communication costs. ICTs might, therefore, also increase competition for
these enterprises so they either have to become more productive or close
down. Moreover, Apulu and Latham (2010) claim that ICT enables customers

24
to give immediate feedback that allow companies to respond expeditiously to
customers’ demands and recognise new market niches. Thus, ICT can bring
about change in organisations and make them more competitive and
innovative, and assist in increasing organisational growth.
The impact of ICT on economic performance
Information asymmetries are one of the prime causes of high transaction
costs, uncertainty and ultimately market failure. A reduction in the information
gap can reduce the ability of the better informed to extract rents from the less
informed, be it buyers or sellers of goods. As SMEs usually have less access
to information, this effect might help to reduce disadvantages and inequality.
An increase in access to information will also create new opportunities and
therefore enhance the efficiency of resource allocation (Akerlof, 1970). On a
macro level, this will then lead to faster growth and diversification of the
economy. In this context, the key role of ICTs is that they may be used to
acquire and process information and reduce uncertainty (Matambalya & Wolf,
2001).
ICTs can serve as information channels because they are able to support the
decoupling of information from its physical repository, which can be argued to
be the truly revolutionary aspect of these technologies (Evans & Wurster,
1997). This allows the immediate transmission of large volumes of information
and permits communication independent of the physical movement of
individuals. This effect allows users access to large amounts of information
and ideas, which can potentially generate large content-related externalities
that will improve innovation capacity and diffusion. The use of ICT networks is
also non-rival in nature and an increase in network size generates network
externalities (Matambalya & Wolf, 2001).
Ollo-Lopez and Aramendia-Muneta (2012) state that ICT adoption seems to
have a positive effect on productivity, whether it be directly or indirectly,
depending on the sectors, and have great potential to support sustainable
development. Furthermore, the use of e-mail, e-commerce, and social media
networks have significantly cut physical transportation needs involved in

25
sending mail, banking, advertising and buying goods (Manochehri et al.,
2012). However, it is important to recognize that there is still a need for longer
term investments in ICT because the positive impact of ICT occurs only after
a period of adoption. (Consoli, 2012; Bayo-Moriones et al., 2013).
According to Müller-Falcke (2001) Indian manufacturing SMEs which make
use of more advanced forms of ICTs have, on average, a higher labour
productivity and a higher growth rate. In a survey of 59 Indian manufacturing
SMEs mainly employing less than 50 people, Lal (1996) found that they
experienced higher profit margins, skill intensity and export and import
intensities for firms using IT. However, it is not the investment in the
technology alone, but the combination of technology investment and other
technologies, as well as relevant skills, that makes ICT work (Matambalya &
Wolf, 2001).
As seen in Figure 7, Consoli (2012) analysed the literature on ICT impact on
companies and identified and categorised the main impacts into four groups:
performance, growth, expansion and new products. Each group consists of
several dimensions, such as efficiency, productivity and product quality.

26
Figure 7: Impact of ICT on Organisations
Source: Consoli, 2012
Michael Porter describes value chains and Information Technology’s effect on
competitive advantage from the value chain model’s perspective (Porter,
1985). According to him, introducing ICT into the value chain changes the way
it operates and has a direct influence on the linkages between the various
functional units of an organisation. This relationship between ICT and an
organisation’s value chain, with ICT having the power to refine it and the
linkages within it, shows that ICT plays a keyl role in creating value for an
organisation (Porter & Millar, 1985). Figure 8 below uses Porter’s value chain
model to summarise various ways that ICT can benefit a firm.

27
Figure 8: Porter’s Value Chain
Source: Kotelnikov, 2007
Overall, as shown in the above literature, ICT can provide a number of
benefits across a wide range of intra- and inter-firm business operations and
transactions. ICT applications can contribute to improved information and
knowledge management inside the firm, can reduce transaction costs and can
increase the speed and reliability of transactions for both B2B and B2C
transactions. In addition, they are effective tools for improving external
communications and quality of services for established and new customers
(OECD, 2004). It is desirable that SMEs are motivated to adopt new

28
technologies, to implement them strategically, while also creating innovative
products more competitively. This is dependent on SMEs having a conducive
environment in which to develop and prosper, form a skilled workforce and
strive for economic growth (Barba-Sánchez et al., 2007).
2.2.5 Barriers to ICT adoption by SMEs
SMEs in South Africa face critical barriers to ICT adoption and use. Some of
the key barriers include ICT costs being too expensive, lack of finance, lack of
awareness about the benefits of ICT adoption and use, low skills levels,
security concerns and ICT applications not tailored to the way SMEs do
business (Ismail et al., 2011; Esselaar et al., (2007).
According to Kapurubandara and Lawson (2008), the barriers for SMEs in
using ICT can be generally categorised into internal and external barriers as
seen in Figure 9 below.
Figure 9: Barriers to ICT Adoption
Source: Kapurubandara & Lawson, 2008

29
Internal barriers: These barriers refer to challenges within the business
where the SME still has the ability to change internal factors within the
organisation. Some examples include lack of time or resources, and lack of
awareness on the part of the owner/manager. Internal barriers can be further
categorised into owner/manager) barriers, organisational barriers, and cost
and return on investment (Kapurubandara, 2009).
External barriers: These are barriers that cannot be resolved by the SME.
They have no control over these and are compelled to work within the
constraints, for example inadequate telecommunication infrastructure,
inadequate service providers, or government policy. Some of these barriers
can be addressed by SMEs working together. This can be done irrespective
of the industry sector to form clusters with the aim of sharing expenses,
resources and facilities. Alternatively, SMEs from the same industry sector
can work together to address certain external barriers where governmental
intervention may be required (Kapurubandara & Lawson, 2008).
Ngwenyama and Morawczynski (2007) argue that it is assumed that ICT will
bring about significant benefits, but not all environments are the same. The
issues affecting the successful implementation or adoption of ICT are both
socio-economic and technological. A major barrier in South Africa is that
many SMEs are generally seen as disadvantaged in comparison to larger
more established businesses in that they are likely to have limited availability
of resources in terms of time, money and expertise. The lingering challenge in
South Africa continues to be the expensive connectivity costs in conjunction
with a lack of infrastructure, which supports emerging technologies. According
to Vosloo (2005), South Africa due to historical context has been developed in
a disparate way, where the urban areas have high-end technologies, while the
rural areas remain underdeveloped and lack even basic infrastructures, as
well as resources needed to succeed in a knowledge economy.
From the literature reviewed above the following significant internal and
external barriers preventing SMEs from adopting ICT exist:
30
Infrastructure
In order to adopt ICT effectively, basic infrastructure such as electricity,
affordable bandwidth and government structures must be in place. Many
studies have emphasised that deteriorating rural infrastructure, poor
education, ineffective telecommunication links and poor governance are major
challenges facing developing nations (Bagchi & Udo, 2007; Gupta et al.,
2008). While South Africa is considered to have much better infrastructure
than other African nations, underdeveloped infrastructure in its rural areas still
pose major impediments to Internet adoption (Roycrofta & Anantho, 2003).
Thlabela et al. (2006) argue that improvements in the level of access to ICT
will only be achieved when issues relating to the cost of telecommunications
and the availability of ICT infrastructure are adequately addressed.
ICT unsuitable for the type of business
A significant reason for SMEs not using ICT for business purposes is related
to the perception that it does not suite the nature and needs of their specific
business (Mehrtens et al., 2001). The view that ICT is not suitable for the
business holds strong implications for SMEs aspiring to adopt ICT because
they will not take advantage of theses technologies unless these benefits
justify the need for establishing and maintaining a more advanced ICT-based
system. Thus, such unfavourable perceptions about the use of ICT can be
regarded as a justifiable reason (or barrier) for many SMEs to not engage in
e-business activities. A recent survey of SMEs with fewer than 250 employees
in 19 European countries supports this position, showing that around 40% do
not use the Internet for selling because they are of the opinion that ICT
applications and e-commerce does not suit their type of business and/or
products (OECD, 2002).

31
Absence of knowledge about the use of ICT
The lack of knowledge about the potential benefits of ICT and strategies to
support SMEs in achieving their business objectives is often another
significant barrier to ICT adoption. SMEs face the challenge that they are,
often, owner managed and the owner makes all or most of the decisions
about the business. Unfortunately the owner/manager's limitations or lack of
knowledge become limitations of the business. This barrier can be classified
as a strategic level problem. ICT needs to be considered a key player for the
SME in reaching its goals and this needs to be promoted by senior leadership
(Modimogale & Kroeze, 2011).
For innovations and technology to be used effectively, users must be
educated or trained and should possess the relevant skills. In their study of e-
commerce adoption in developing countries, Kapurubandara and Lawson
(2008) argue that the lack of skills and knowledge of technologies, as well as
the lack of understanding of the benefits they provide and low levels of
computer literacy are major impediments to the adoption and use of ICT.
Mutula and Van Brakel (2006) reported that SMEs in Botswana were not
exploiting the potential of technologies due to a lack of skills. Orford et al.
(2003) also claim that the lack of IT, poor planning and high illiteracy levels
are common problems facing the SME sector in South Africa.
Insufficient skills
As mentioned above, the owner is often the centre of the business, making all
or most of the decisions in the SME, so the adoption of ICT by the small
business depends on the owner's ICT skills, personality and attitude towards
technology. The IT skills problem forms part of the bigger problem of a
shortage of specialists in ICT in Africa. The South African government has set
up Skills Education Training Authority organisations (SETAs) in an attempt to
increase ICT skills (Modimogale & Kroeze, 2011). However, the
owner/manager’s attitude towards ICT and its value still need to change, and
each SME needs expertise to work with (Mutula & Brakel, 2007). The owner
or manager of a small firm has significant influence on the adoption of ICT. In

32
Parida’s (2010) study of three technology-based small firms, it was found that
the perception of the owner/manager had significant impacts on how the firm
viewed the role of ICT. If the SME owner was unfamiliar with operating a
computer and held the belief that ICT is only for larger firms, they were
unlikely to get involved in ICT-related activities. Thus, even when they
possessed the necessary financial resources needed to integrate ICT into
their business, they often failed to recognise the need to use ICT in their
company. However, when owners had a positive view about ICT, the main
barrier for ICT adoption was due to a lack of skilled employees. Firms that
want to adopt ICT need to have employees with a reasonable amount of
knowledge regarding the use of technology. Therefore, if SMEs have well-
trained ICT staff, they are more likely to adopt and use ICT as a competitive
tool. Furthermore, Manueli et al. (2007) suggests that business action is
driven by the key decision-makers responsible for defining appropriate ICT
goals, identifying critical ICT business needs and allocating financial
resources to facilitate ICT adoption. In addition, Gray (2006) maintain that
SME owners with appropriate qualifications and ICT skills are more growth-
oriented while those without these prerequisite characteristics are more likely
to be growth averse.
High cost
A common barrier, ICT applications are seen to be costly by SMEs so they
often do not have a budget for it. ICT is often associated with large costs and
exceeding budgets (Modimogale & Kroeze, 2011). Another problem with
regard to the cost of ICT is that SMEs often invest in unnecessarily big
solutions due to sale pitches, hype of specific products or market patterns
without considering their practical needs. Often SMEs could have purchased
a less complicated, smaller package or programme to meet their needs, and
thus paid less. Technology can be expensive or cheap, depending on which
technology platforms are chosen. Once again, understanding the role of ICT
will make it easier for the business to achieve its goal (Modimogale & Kroeze,
2011). Dixon et al. (2012) concluded that the cost of technology is a definng
influencing factor in the adoption and use of technology by many SMEs. The
33
authors argue that smaller businesses will less likely adopt and use
technology when its initial set-up cost is high. Matlay and Weathead (2013)
also recognised that many SMEs in Africa often have great difficulty when
outsourcing for financial support. Therefore, adoption and use of new
technologies may be considered too expensive and a luxury by these
enterprises because of their lack of financial support. According to Paul and
Pascale (2013), many SMEs in Africa face specific challenges in the
formulation of innovation strategies because of their limited range of
technological competencies and lack of financial resources. Pavon and Brown
(2010) also argue that the economic development in a region impacts on
accessibility and exposure to technologies, which, in turn, influences their
adoption and diffusion. In South Africa, for example, not many people use the
Internet partly because of the high telecommunication costs and poor
communication infrastructure (Gillwald et al., 2004).
Constantly evolving ICT environment
The ICT landscape is constantly and rapidly changing, so there needs to be
continuous learning and updating of technologies by all involved. With
technology evolving – getting faster, smaller, and more powerful – it is
necessary that SMEs keep abreast of these trends. There are two issues here
that pose challenges to the SME. On the one hand, it is necessary that they
monitor the kinds of technologies that their clients are using and try to make
sure that they are on par in order to serve them. On the other hand, however
the SMEs do not need to change every time there is a change in technology;
this depends on their focus area and their requirements. The ICT strategy of
the SME needs to take into consideration that technology changes at a rapid
rate, that the different technologies need to be monitored as they evolve, and
that the staff need to be excited and skilled enough to have an interest in the
changes as they unfold(Modimogale & Kroeze, 2011).
Based on the above literature reviewed, the numerous barriers to ICT
adoption unique to SMEs are summarised in Table 2 below.

34
Table 2: Barriers to ICT adoption
Barriers Source
Lack of resources
Chatzoglou &Vraimaki, 2010; Kabanda, 2001; Kahn et
al., 2012, Miller & Garnsey, 2000; Mutula & Van Brakel,
2007; Nguyen, 2009; Reimenschneider et al., 2003;
Thomas et al., 2004
Political and social barriers
Kapurubandara & Lawson (2007)
Lack of skills Esselaar et al., 2006; Kahn et al., 2012; Kapurubandara
& Lawson, 2007; Ladzani & Van Vuuren, 2002; Miller &
Garnsey, 2000; Modimogale & Kroeze, 2011; Mutula &
Van Brakel, 2007; Nguyen, 2009
Effective
leadership, and
management
Uddin, 2005;Kahn et al., 2012; Spencer et al., 2012;
Manueli et al., 2007; Miller & Garnsey, 2000
Security risks;
Untrustworthy
service providers
AlAwadhi & Morris, 2008; Cohen et al., 2013; Gatautis &
Vitkauskaite, 2009; Kapurubandara & Lawson, 2007;
Wamuyu & Maharaj, 2011
Lack of
infrastructure
Kapurubandara & Lawson, 2007;Esselaar et al., 2006;
Kahn et al., 2012; Gillwald et al., 2004; Nguyen, 2009;
Ramani et al., 2012; Suri, 2011; Wamuyu & Maharaj,
2011
Legal barriers
AlAwadhi & Morris, 2008; Kahn et al., 2012;
Kapurubandara & Lawson, 2007
Financial
constraints, high
costs
Dixon et al., 2012; Esselaar et al., 2006; Kahn et al.,
2012; Ladzani & Van Vuuren, 2002; Ndubisi &
Kahraman, 2005; Donner &Escobari, 2010; Nguyen,
2009; Ramani et al., 2012; Thomas et al., 2004;
Wamuyu & Maharaj, 2011

35
Lack of knowledge AlAwadhi & Morris, 2008; Esselaar et al., 2006;
Kabanda, 2001; Kapurubandara & Lawson, 2008;
Modimogale & Kroeze, 2011; Ndubisi & Kahraman,
2005; Orford et al., 2003; Ramani et al., 2012
No need for ICT;
unsuitable for
business
Esselaar et al., 2006; Mehrtens et al., 2001
Performance risk Wamuyu & Maharaj, 2011
Changing ICT
landscape
Modimogale & Kroeze, 2011
Source: Own
2.3 First sub-problem
The first sub-problem looks to understand the existing adoption and use of
ICT by SMEs.
2.4 Second sub-problem
The second sub-problem is to determine the barriers to ICT adoption and use.
2.5 Third sub-problem
The third sub-problem is to determine the perceived value obtained from the
use of ICT in South African SMEs.

36
2.6 Conclusion of literature review
In this chapter an in depth review was undertaken on the various literature
available on SMEs, ICT adoption models, ICT value, and barriers to ICT
adoption. To better provide SMEs with information on the benefits of ICT
adoption, it is imperative to understand existing research on ICT value and
barriers to ICT adoption. The literature showed a number of significant
barriers to ICT use and adoption in organisations, specifically SMEs.
However, through further analysis of the literature it is clear that although ICT
adoption has been explored quite extensively in recent research, in Africa and
other developing economies such work is still limited. While there have been
significant improvements in the ICT sector in Africa, there is still much to be
desired and SMEs still face the brunt of poor infrastructure and limited support
structures.
In cross border studies of growth that mostly include developed countries, the
availability of telecommunications infrastructure is often found to contribute
significantly to GDP growth along with common indicators such as education.
This implies that if the necessary investment is made in ICT infrastructure and
complementary factors at the same time, markedly higher growth rates can be
achieved (World Bank, 1998).
2.6.1 Hypothesis 1
ICTs are perceived by SMEs to add value to their businesses.
2.6.2 Hypothesis 2
Perceived value of ICT has a positive effect on its adoption and use by SMEs.
2.6.3 Hypothesis 3
Most SMEs make use of general-use ICTs.

37
2.6.4 Hypothesis 4
External factors are the greatest barriers to ICT adoption amongst SMEs.
2.6.5 Hypothesis 5
Internal factors are the greatest barriers to ICT adoption amongst SMEs.
2.6.6 Hypothesis 6
Owners/managers with a higher education level have a higher ICT adoption
rate within their business.

38
CHAPTER 3: RESEARCH METHODOLOGY
This chapter discusses the methodology used to conduct this research. Firstly
the literature on quantitative research will be discussed briefly, followed by a
review of the research design and research instrument that was used in this
study. Issues of data collection and analysis in relation to this study will be
provided, followed by a discussion on the validity and reliability of this
research.
3.1 Research methodology/paradigm
The choice of research methodology is influenced by the researcher’s
theoretical perspective and also his/her attitude towards the ways in which the
data will be used (Gray, 2004). For this research, a quantitative approach is
more suitable in order to achieve statistical significance from the survey
analysis and reach the objectives of this research, which is finding out the
barriers to ICT adoption amongst South African small and medium sized
enterprises.
Creswell and Plano Clark (2011), state that quantitative research is a mode of
inquiry often used for deductive research, when the goal is to test theories or
hypotheses, gather descriptive information, or examine relationships amongst
variables. These variables are measured and yield numeric data that can be
analysed statistically. This research is positivist in nature in that a quantitative
survey will be administered to gain an objective understanding of the barriers
to ICT adoption amongst SMEs in South Africa. Positivism is based on the
view that science is the only foundation for true knowledge (Wagner et al.,
2012). The positivist ontology puts forth that the world is external and that
there is a single objective reality to any research phenomenon or situation,
regardless of the researcher’s perspective or belief (Hudson & Ozanne,
1988). Positivist researchers remain detached from the participants of the
research by creating a distance, which is important for remaining emotionally

39
neutral and also to ensure that clear distinctions are made between reason
and emotion (Carson et al., 2001). Furthermore, within the positivism
paradigm, the function of a research study is its ability to “predict results, test
theory or find the strength of relationships between variables” (Wagner et al.,
2012).
3.2 Research design
This research is empirical in nature and is based on quantitative data
collection, which was obtained by means of a questionnaire distributed to 250
SMEs. The sample includes SMEs from the manufacturing sector and access
was be obtained via the Small Enterprise Development Agency (Seda) and
Department of Trade and Industry (DTI) contact bases, as well as online
sources and search engines. In this study, the dependent variable was ICT
adoption, and the independent variables were the various barriers to such
adoption.
Only owners or managers of the SMEs were chosen as respondents of this
study because they manage or oversee the entire operation of their firms and
are therefore in better positions to understand the current situation and future
trends of their enterprises.
An exploratory research approach was adopted, as the study was aimed at
investigating SMEs and providing significant information about SME’s usage
of ICTs in their daily activities and long-term strategies. The research is
cross-sectional due to time constraints.
3.3 Population and sample
3.3.1 Population
The population for this study is all manufacturing SME owners and managers
in Gauteng, South Africa.

40
3.3.2 Sample and sampling method
The target sample is 250 SMEs from the manufacturing sector in Gauteng,
South Africa. Probability sampling and simple random samples were used to
make sure that each SME has an equal chance or probability of selection.
The type of sample investigated was owners or managers of South African
SMEs. There was an expected sample size of 250 potential respondents. The
research sample was selected based on the following criteria:
Sector: Data for this study was collected from SMEs in only the
manufacturing sector in South Africa. This specific sector was selected
to provide a more contained sample and is based on it being a high
growth potential sector in South Africa.
South African SME: A SME was defined to be a firm with less than
250 employees. The sample for the study consisted of SMEs from the
Gauteng region within South Africa.
Area: SMEs from urban areas as well as rural areas formed part of the
sample; this was to gain insights on the differences between ICT use
and perception in these two categories.
3.4 Research instrument
The research instrument used in this study is based on questionnaires
created, tested and validated by Ismail, Jeffrey and Van Belle (2011) looking
at ICT usage amongst SMEs. The questionnaire consists of a five-point Likert
scale for use by respondents, which indicates their response to each of the
ICT relevant questions. The response options are: Strongly Disagree,
Disagree, Neutral, Agree and Strongly Agree. All questions needed to be
answered in order for the questionnaire to be taken into consideration for this
study.

41
The instrument consisted of four main sections, which includes the general
profile of the firm; Information and Communication Technologies in use;
perceived value added by ICTs; and barriers to ICT use.
Based on the literature review and results of the pilot study (see section
below) the study looked to modify and replicate this questionnaire for the
context of South African SMEs. See Appendix A for the questionnaire that
was distributed to the sample of identified SMEs.
3.4.1 The pilot study
A pilot study was conducted prior to the distribution of the questionnaire to a
sample of 20 SMEs within the manufacturing sector to test reliability and help
refine the research instrument. Certain constructs were included in the
questionnaire following the pilot study, namely options including Open Source
Software; Mobile Payment System; Document Management Software (DMS);
and Inventory Management Software.
The pilot study was useful in identifying problems with sequence, layout,
grammar, punctuation of the questions and questionnaire length. Following
the pilot study, some questions had to be reworded to improve their clarity
and purpose.
3.5 Procedure for data collection
Empirical evidence of how SMEs adopt and use ICT will be gathered on the
basis of firm size, sector and other pertinent characteristics that help provide
richer pictures of ICT adoption and use. The data for this research was
gathered by means of the online survey tool known as Qualtrics. An electronic
survey link was e-mailed to the owners and managers of the selected firms
with a cover letter, and the respondents were requested to complete and
return the questionnaire. Regular follow-up emails were sent to ensure that
participants completed the questionnaire.

42
3.6 Data analysis and interpretation
The data was analysed through a variety of statistical techniques: descriptive
statistics and multivariate analysis. The hypotheses were tested using both
descriptive and multivariate techniques, such as correlation and regression
analysis.
Quantitative data from respondents of the questionnaire was cleaned and
coded in Microsoft Excel. Thereafter the analysis was done using R statistical
software. The data was analysed by using descriptive statistics, as that
allowed the researcher relevant interpretations and discussions about the
topic under study. This descriptive analysis included mean, standard
deviation, frequencies and percentages. The results obtained were presented
in tables, charts and graphs where practical to do so. For the multivariate
statistics, a logistic regression analysis was used to evaluate factors
influencing ICT adoption choices in the SME sector. A correlation analysis
was also used to evaluate the relationship between owner/manager education
levels and ICT adoption. Furthermore, a correlation analysis was conducted to
assess the perceived value of ICT and its adoption within the SME sampled.
Data analysis methods per hypothesis are described below.
Hypotheses Analysis
H1: ICTs are perceived
by SMEs to add value to
their business
H2: Perceived value of
ICT has a positive effect
on its adoption and use
Quantitative:
Quantitative data from respondents of the
survey will be documented, coded and
processed with Statistical Analysis
Software (SAS).
Descriptive analysis will be used to
assess SME’s perception of the value of
ICT for their business.
Correlation analysis will be used to
assess the relationship between

43
by SMEs
perceived value of ICT and its adoption
within the SME.
H3: Most SMEs make
use of general-use ICTs
Quantitative:
Data from respondents of the survey will
be documented, coded and processed
with Statistical Analysis Software (SAS).
The data will be analysed using
descriptive statistics, and will include
mean, standard deviation, frequencies
and percentages.
Will be used to elicit information about
the ICT adoption patterns of the
respondents.
H4: External factors are
the greatest barriers to
ICT adoption amongst
SMEs
H5: Internal factors are
the greatest barriers to
ICT adoption amongst
SMEs
H6: Owners/managers
with a higher education
level have a higher ICT
adoption rate within their
business
Quantitative:
Data from respondents of the survey will
be documented, coded and processed
with Statistical Analysis Software (SAS).
Linear regression analysis will be used
to evaluate factors influencing ICT
adoption choices in the SME sector.
Correlation analysis will be used to
evaluate the relationship between
owner/manager education levels and ICT
adoption.

44
3.7 Limitations of the study
This study aims to investigate the barriers of ICT adoption amongst SMEs in
the manufacturing sector in South Africa. A significant limitation of the study is
that differences may exist between industry sectors and it is therefore
necessary to see if similar barriers or obstacles exist in other sectors of
industry.
Given that a quantitative approach is chosen for this research, this method
may overlook certain issues that might otherwise arise through qualitative
research with participants. Hence, richer conclusions can be drawn from a
mixed method research design, making use of qualitative structured or semi-
structured interviews, which could illicit more in-depth and revealing
responses.
Furthermore, the study is a cross-sectional analysis and cannot provide
longitudinal analysis, which may be more useful in identifying ICT trends
within a firm.
3.8 Validity and reliability
3.8.1 External validity
External validity is determined by the ability to generalise the study results
beyond the study sample. Although the manufacturing sector is significant in
size, other sectors may require that the questionnaire be further adapted to
suit industry specific needs.

45
3.8.2 Internal validity
The questionnaire that will be administered in this study is based on
questionnaires developed and validated by Ismail et al. (2011), looking
specifically at ICT usage amongst SMEs.
3.8.3 Reliability
It is extremely important that the research instrument for this study– in this
case the online questionnaire – elicits consistent and reliable responses.
When variables fall into this category, research questions return a stable
response and data can then be said to be reliable (Santos, 1999). Cronbach's
alpha is a measure of reliability related to the variation accounted for by the
true score of the “underlying construct.” Where construct is the hypothetical
variable being measured, according to the literature, Cronbach’s alpha of 0.7
and above is seen as a reliable score (Gliem, 2003; Santos, 1999).
TABLE 3: CRONBACH'S ALPHA RELIABILITY TEST RESULTS
CONSTRUCT CRONBACH’S ALHPA
ICTs in use 0.8787
Perceived ICT Value
0.8985
Barriers to ICT adoption
0.8734
Source: Own
Table 3 above shows the results of the Cronbach Alpha Reliability Test
performed on the datasets to test whether each of the variables was reliable
or not. The results revealed that all three variables meet the reliability criteria
– The “ICTs in use” variable scored a Cronbach Alpha of 0.8787; the
“Perceived ICT value” variable scored 0.8985, and the “Barriers” variable
scored 0.8734.

46
3.9 Ethics
In this study, the interests and rights of anyone affected by the study were
safeguarded. For the purposes of the study, the informed consent of the
subjects was obtained. Annexure C contains the consent form, which
informed the respondents of their confidentiality. The confidentiality of the
SMEs sampled had to be maintained; hence no details of the SMEs are
mentioned, but rather their typology is noted. The respondents were also not
asked to submit their names or personal details.

47
CHAPTER 4: PRESENTATION OF RESULTS
4.1 Introduction
In this chapter, the results of the study are presented. The data was analysed
using descriptive and multivariate analysis and the results are reported
according to the research methodology detailed in the previous chapter.
Tables are included for ease of presentation and comparison of results. A
description of the sample is presented, depicting the size of the sample, as
well as the demographics of the respondents.
4.2 Demographic profile of respondents
A total of 81 respondents of the 250 sampled SMEs completed the survey, a
response rate of 32.4 %.
4.2.1 Industry
The survey responses, as seen in Table 4 and Figure 10, indicate that the
sampled SMEs occupy a number of industries within the manufacturing
sector. The most common industry, which took part in the study, was the
textile, clothing and leather goods industry at 27%, followed by 15% in the
food, beverages and tobacco, as well as wood and paper and publishing and
printing industries, and 12% of the respondents are in the furniture industry.

48
Table 4: Industry Sector of SMEs
# Answer
Response %
11 Food, beverages and tobacco
12 15%
12 Textiles, clothing and leather goods
22 27%
13 Wood and paper; publishing and printing
12 15%
14 Petroleum products, chemicals, rubber and plastic
8 10%
15 Other non-metal mineral products
0 0%
16 Metals, metal products, machinery and equipment
2 2%
17 Electrical machinery and apparatus
7 9%
18 Radio, TV, instruments, watches and clocks
5 6%
19 Transport equipment
3 4%
20 Furniture; other manufacturing
10 12%
21 Other (Please specify):
0 0%
Total 81 100%
Figure 10: Industry Sector of SMEs

49
4.2.2 Job function
Of the 81 responses, 65% were from owners of SMEs, as seen in Table 5
below. Another 35% of responses are from managers of businesses. There
were no responses from IT managers or staff.
Table 5: Job Function
# Answer
Response %
4 Owner
53 65%
5 Manager
28 35%
6 IT
0 0%
7 Other (Please specify):
0 0%
Total 81 100%
4.2.3 Years in operation
From the responses, only 5% of SMEs surveyed have been in operation for
less than a year. Table 6 shows that 26% have been operational for one to
three years, while a majority 43% have been established for longer, between
four to five years. Of the SMEs, 26% were well established with over six years
in operation.
Table 6: Years in Operation
# Answer
Response %
1 <1
4 5%
2 1-3
21 26%
3 4-5
35 43%
4 6>
21 26%
Total 81 100%

50
4.2.4 Number of employees
Table 7 shows the current number of employees at the SMEs surveyed. It
indicates that the majority of the SMEs employ between one to ten staff
members (46%), 35% employ 11-25 staff members, and 15% employ 26-50
staff members. There were no SMEs from the survey that employed more
than 100 staff members. Of the SMEs, 81% had less than 26 employees in
their organisations.
Table 7: Number of Employees
# Answer
Response %
1 1-10
37 46%
2 11-25
28 35%
3 26-50
12 15%
4 51-100
4 5%
5 >100
0 0%
Total 81 100%
4.2.5 Level of education
From the responses by SME owners and managers, only 4% have a master’s
degree or higher as seen in Table 8 and Figure 11. The majority of
responders (35%) have a bachelor’s degree. Another 30% have a certificate
or diploma and 17% hold only a high school certificate.
Table 8: Level of Education
# Answer
Response %
1 Primary school
0 0%
2 Secondary/high school
14 17%
3 Certificate/diploma
24 30%
4 Bachelor’s degree
28 35%
5 Honours degree
12 15%
6 Master’s degree or higher
3 4%
Total 81 100%

51
4.3 Results pertaining to Hypothesis 1
Table 9: Perceived Value Added through ICT Use
# Question Disagree Neutral Agree Mean
1 Operational costs have decreased since ICT has been adopted
41.98% 35.80% 18.52% 2.74
2 I have experienced increased efficiency of tasks since ICT implementation
19.75% 38.27% 32.10% 3.12
3 Our quality of service has improved due to ICT
16.05% 35.80% 39.51% 3.16
4 The organisation has become more effective since the adoption of ICT
16.05% 38.27% 33.33% 3.12
5 The organisation has become more marketable
31.25% 35.00% 22.50% 2.94
6 Customer base has increased 23.38% 50.65% 22.08% 2.96
7 Increased revenue since implementation 24.69% 48.15% 20.99% 2.84
8 Customer satisfaction has increased 25.32% 45.57% 21.52% 2.96
9 Business processes are more efficient, tasks are performed quicker
18.75% 38.75% 36.25% 3.10
10 Turnaround time has improved 12.66% 40.51% 41.77% 3.19
11 Organisation has become more profitable 29.63% 43.21% 23.46% 2.91
12 Relationships with suppliers have been improved
15.19% 45.57% 32.91% 3.10
13 Stock levels are always up to date 17.50% 50.00% 30.00% 3.08
14 Organisational goals are being met with more ease
21.79% 44.87% 29.49% 3.05
15 Short term targets are more achievable
19.23% 38.46% 38.46% 3.17
16 Product quality has been improved 32.91% 41.77% 24.05% 2.89
17 Staff morale has increased 17.72% 45.57% 30.38% 3.10
H1: ICTs are perceived by SMEs to add value to their business

52
18 Communication within the organisation has improved
16.46% 44.30% 25.32% 3.22
19 Scheduling has become more efficient 12.35% 29.63% 43.21% 3.51
20 Employees are able to work from remote locations
39.51% 14.81% 20.99% 2.67
This part of the research looked at the value added to South African SMEs
through ICT use. The hypothesis tested was one that assumed that using ICT
in an organisation adds value to that organisation.
The respondents were asked to indicate the extent to which they agreed with
a number of statements that describe certain benefits that SMEs could gain
when adopting ICT to communicate and/or conduct business on a scale of
one to five, with higher values corresponding to higher levels of agreement.
Table 9 summarises and ranks the perceived value added through ICT
adoption. The key perceived benefits experienced by SME owners focus on
scheduling becoming more efficient (43%), service delivery (39.5%),
turnaround time (41%), and achieving short-term targets (38%).
In terms of the perceived value of ICT use, the responses clearly indicate that
the SMEs sampled feel that their operations have improved since adopting
specific ICTs for their businesses. With a maximum response value of 5, the
majority of responders agreed that scheduling has become more efficient
(mean: 3.51), turnaround time has increased (mean: 3.75), the organisation
has become more efficient (mean: 3.6) since adopting ICT, and short term
targets are more achievable (mean: 3.9).
Hypothesis 1: Accepted
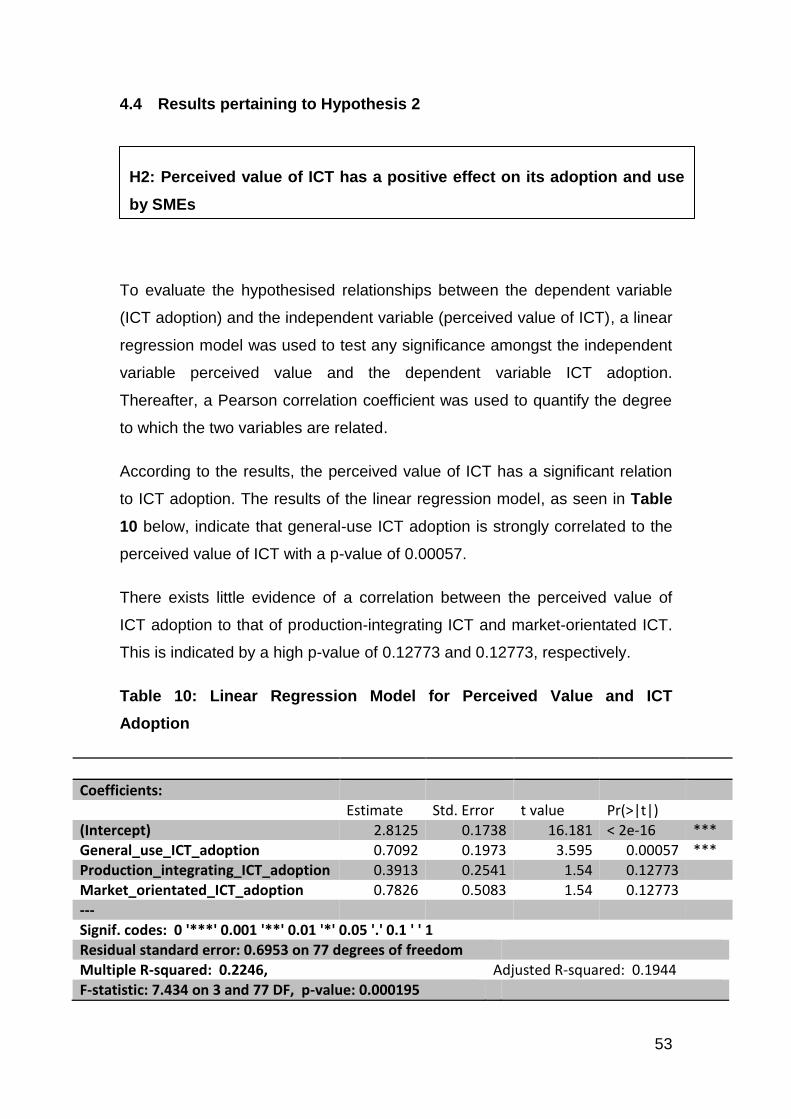
53
4.4 Results pertaining to Hypothesis 2
To evaluate the hypothesised relationships between the dependent variable
(ICT adoption) and the independent variable (perceived value of ICT), a linear
regression model was used to test any significance amongst the independent
variable perceived value and the dependent variable ICT adoption.
Thereafter, a Pearson correlation coefficient was used to quantify the degree
to which the two variables are related.
According to the results, the perceived value of ICT has a significant relation
to ICT adoption. The results of the linear regression model, as seen in Table
10 below, indicate that general-use ICT adoption is strongly correlated to the
perceived value of ICT with a p-value of 0.00057.
There exists little evidence of a correlation between the perceived value of
ICT adoption to that of production-integrating ICT and market-orientated ICT.
This is indicated by a high p-value of 0.12773 and 0.12773, respectively.
Table 10: Linear Regression Model for Perceived Value and ICT
Adoption
Coefficients: Estimate Std. Error t value Pr(>|t|) (Intercept) 2.8125 0.1738 16.181 < 2e-16 *** General_use_ICT_adoption 0.7092 0.1973 3.595 0.00057 *** Production_integrating_ICT_adoption 0.3913 0.2541 1.54 0.12773 Market_orientated_ICT_adoption 0.7826 0.5083 1.54 0.12773 --- Signif. codes: 0 '***' 0.001 '**' 0.01 '*' 0.05 '.' 0.1 ' ' 1 Residual standard error: 0.6953 on 77 degrees of freedom Multiple R-squared: 0.2246, Adjusted R-squared: 0.1944
F-statistic: 7.434 on 3 and 77 DF, p-value: 0.000195
H2: Perceived value of ICT has a positive effect on its adoption and use
by SMEs

54
The results of the Pearson correlation coefficients, as seen in Table 11 below,
show that perceived ICT value and general-use ICT adoption has a strongly
correlated coefficient of 0.40. Perceived ICT value and production-integrating
ICT adoption has a lower but still positive correlation coefficient of 0.25. This
is similar to perceived ICT value and market-orientated ICT adoption, with a
coefficient of 0.21.
Table 11: The Pearson Correlation Coefficients for Perceived Value and
ICT Adoption:
Perceived ICT value and General_use_ICT_adoption 0,4072903
Perceived ICT value and Production_integrating_ICT_adoption
0,2551552 Perceived ICT value and Market_orientated_ICT_adoption
0,2181747
Hypothesis 2: Accepted

55
4.5 Results pertaining to Hypothesis 3
In order to distinguish between the degree of ICT use and to test the
hypothesis, ICT usage was categorised into three subsections of use, namely
general ICT technology usage, production-orientated ICT technology usage
and market-orientated ICT usage. The general-use ICTs consisted of the
following technologies: VoIP, Internet access, e-mail, telephone (landline),
and fax lines. Descriptive analysis was used to determine the level of ICT
adoption amongst the three sub-sections.
The results showed that most SMEs had Internet access, e-mail services and
a telephone and fax line. More specifically the results revealed that the
majority of participants make use of VoIP (69%), Internet access and e-mail
(90%), telephone (89%) and fax lines (82%) as the ICTs already
implemented.
Figure 11: General ICT Usage
H3: Most SMEs make use of General-use ICTs

56
Table 12: General ICT Usage
# Question ICT in place
Intend to No intention
Total responses
Mean
1 VoIP 69.14% 22.22% 8.64% 81 1.40 2 Internet
access and e-mail
90.12% 9.88% 0.00% 81 1.10
3 Telephone (landline)
88.89% 9.88% 1.23% 81 1.12
4 Fax 81.48% 12.35% 6.17% 81 1.25
Of the general ICT users, as seen in Figure 11 and Table 12, 69% of SMEs
had adopted VoIP, with a further 22% intending to implement it. Internet
access and e-mail had a high usage rate of 90%, with a further 9.8%
intending to incorporate it into their businesses. Telephone (landline) use was
also high at 89%, with the remainder (9.8%) looking to implement it at some
stage in their business. Lastly, 81% had fax line in place with only 6% having
no interest in implementing it in their business.
Table 13: Production Integrating ICT Usage
# Question ICT in place Intend to No intention
Mean
5 Enterprise Resource Planning System
9.88% 12.35% 77.78% 2.68
6 Customer Relationship Management System
8.64% 23.46% 67.90% 2.59
7 Supply Chain Management System
16.05% 28.40% 55.56% 2.40
8 Intranet 1.23% 11.11% 87.65% 2.86 13 Open Source
Software 6.17% 19.75% 74.07% 2.68
14 Mobile Payment System
48.15% 35.80% 16.05% 1.68

57
15 Finance & Accounting Software
24.69% 46.91% 28.40% 2.04
16 Document Management Software (DMS)
9.88% 18.52% 71.60% 2.62
17 Inventory Management Software
9.88% 44.44% 45.68% 2.36
18 Cloud Computing
2.47% 28.40% 69.14% 2.67
The production-integrating ICTs include Enterprise Resource Planning
Systems, Customer Relationship Management Applications (CRM), Supply
Chain Management Systems, Intranet, Open Source Software, Mobile
Payment Systems; Finance and Accounting Software, Document
Management Systems (DMS), Inventory Management Software, and Cloud
Computing.
As can be seen from Table 13, there is a significantly low use of production-
integrating ICTs. The percentage of ICTs in place are: Enterprise Resource
Planning Systems (ERP) (9.88%), Customer Relationship Management
Applications (8.64%), Supply Chain Management Systems (16%), Intranet
(1.23%), Open Source Software (6.17%), Mobile Payment Systems (48.15%),
Finance and Accounting Software (24.69%), Document Management
Systems (9.88%), Inventory Management Software (9.88%), and Cloud
Computing (2.47%).

58
Figure 12: Production-Integrating ICT Usage
As seen in Figure 12 above, along with the low level of ICT adoption, there is
a significant lack of intention from the SMEs sampled to include various
production-integrating ICTs in their business. The figures are as follows:
Enterprise Resource Planning Systems (77%%), Customer Relationship
Management Applications (67%), Supply Chain Management Systems (55%),
Intranet (87.65%), Open Source Software (74%), Mobile Payment Systems
(16%), Finance and Accounting Software (28%), Document Management
Systems (71%), Inventory Management Software (45%), and Cloud
Computing (69%).
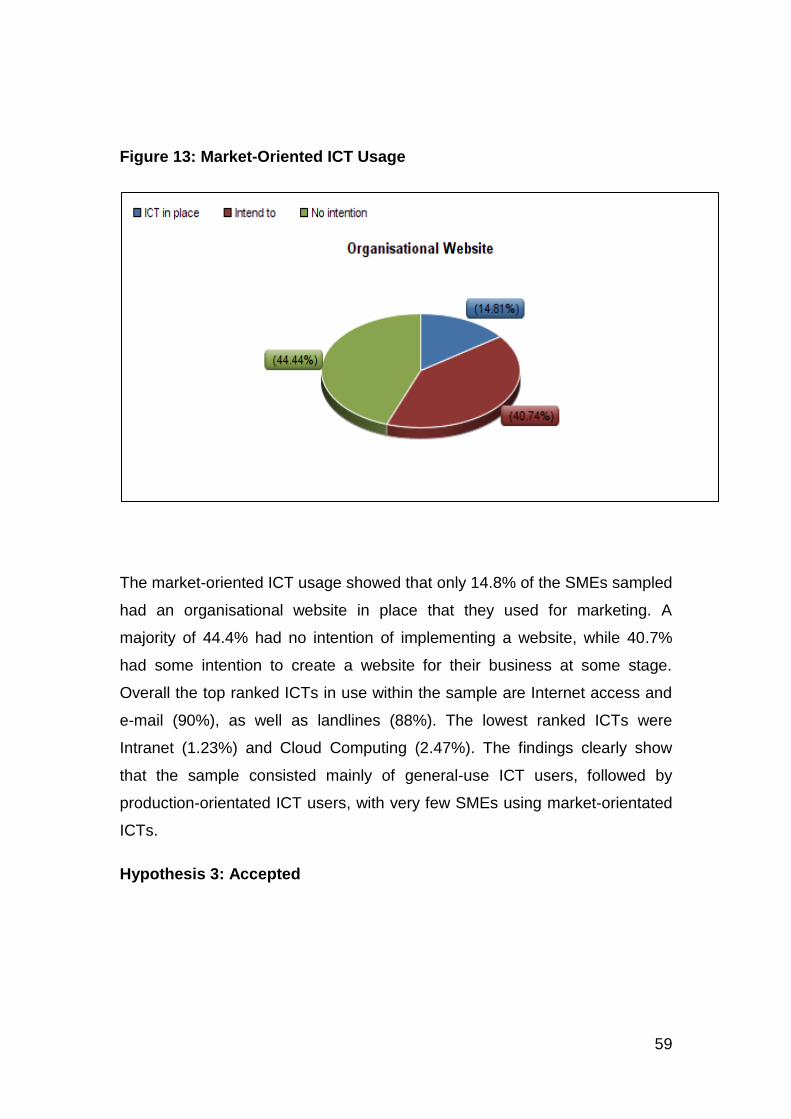
59
Figure 13: Market-Oriented ICT Usage
The market-oriented ICT usage showed that only 14.8% of the SMEs sampled
had an organisational website in place that they used for marketing. A
majority of 44.4% had no intention of implementing a website, while 40.7%
had some intention to create a website for their business at some stage.
Overall the top ranked ICTs in use within the sample are Internet access and
e-mail (90%), as well as landlines (88%). The lowest ranked ICTs were
Intranet (1.23%) and Cloud Computing (2.47%). The findings clearly show
that the sample consisted mainly of general-use ICT users, followed by
production-orientated ICT users, with very few SMEs using market-orientated
ICTs.
Hypothesis 3: Accepted

60
4.6 Results pertaining to Hypothesis 4
4.6.1 Descriptive statistics
Figure 14: External Barriers to ICT Adoption
This component of the study looked at the various barriers experienced with
regard to ICT adoption and use within South African SMEs. More specifically,
the research intended to look at the external barriers for ICT usage and
whether or not South African SMEs experience significant barriers to adoption
and usage.
Descriptive information for the characteristics of the sample is summarised in
Figure 14 and Table 14. From Figure 14 above it can be seen that 38% of
the respondents feel that security concerns are a hindrance to ICT adoption.
Of these 35% believe that business partners, suppliers and customers do not
H4: External factors are the greatest barriers to ICT adoption amongst
SMEs

61
make use of ICT. A further 37% are of the opinion that ICT applications are
not tailored to the way SMEs do business. Another 30% agree that
government regulations were a barrier experienced by SME managers and
owners when adopting ICTs.
Table 14: External Barriers to ICT Adoption
Statistic Security concerns
Business partners, suppliers and customers do not make use of ICT
ICT applications are not tailored to the way SMEs do business
No access to ICT infrastructures (e.g. electricity, telephone lines, etc.)
Unreliable service providers
Government regulations
Min Value
1 1 2 1 1 1
Max Value
5 5 5 5 5 5
Mean 3.28 3.20 3.42 2.51 3.22 3.12
Variance 1.31 0.99 0.75 1.15 1.03 0.98
Standard Deviation
1.14 0.99 0.86 1.07 1.01 0.99
Total Responses
81 81 81 81 81 81
In Table 14 above, with a maximum value of 5, the results indicate that the
major external barriers to ICTs adoption by SMEs are that ICT applications
are not tailored to the way SMEs do business (mean: 3.42), as well as
security concerns (mean: 3.28) and unreliable service providers (mean: 3.22).
4.6.2 Multivariate statistics: Logistic regression
A logistic regression model was used to determine the impact of the
independent variables (external barriers) on ICT adoption (dependent
variable). The significance of the regression coefficients of the hypothesised
independent variables were examined to determine support for the

62
hypothesis. The p-value for each term tests the null hypothesis that the
coefficient is equal to zero (no effect). A low p-value (< 0.05) indicates that the
null hypothesis can be rejected. This means that a predictor that has a low p-
value is likely to be a meaningful addition to one’s model because changes in
the predictor's value are related to changes in the response variable.
Conversely, a larger (insignificant) p-value suggests that changes in the
predictor are not associated with changes in the response (Frost, 2013). The
regression coefficient of independent variables on ICT adoption was
estimated. The overall model is significant at the 1% level.
Table 15: Logistic Regression (General-Use ICT)
Coefficients: Column1 Column2 Column3 Column4 Column5
Beta Std. Error z value Pr(>|z|)
(Intercept) 6.6482 2.2446 2.962 0.00306 ** Q8_9_Security_concerns -0.1784 0.4176 -0.427 0.66926
Q8_10_Agnostic_stakeholders -0.7013 0.5294 -1.325 0.18525 Q8_11_Not_tailored_to_SMEs 0.1536 0.4816 0.319 0.74974 Q8_12_No_access to ICT
infrastructure -1.4143 0.5915 -2.391 0.01679 * Q8_13_Unreliable_service_provider 0.5693 0.5481 1.039 0.29891
Q8_14_Government_regulations -0.1449 0.5511 -0.263 0.79263
Signif. codes: 0 '***' 0.001 '**' 0.01 '*' 0.05 '.' 0.1 ' ' 1
In Table 15 above, the logistic regression results for general-use ICT shows
that no access to ICT infrastructure is significantly related to ICT adoption with
a p-value of 0.01679.

63
Table 16: Logistic Regression (Production-Integrating ICT)
Coefficients: Column1 Column2 Column3 Column4
Beta Std. Error z value Pr(>|z|)
(Intercept) 1.81422 1.92293 0.943 0.345 Q8_9_Security_concerns -0.31775 0.37578 -0.846 0.398 Q8_10_Agnostic_stakeholders -0.48072 0.51509 -0.933 0.351 Q8_11_Not_tailored_to_SMEs -0.39636 0.5006 -0.792 0.428 Q8_12_ No_access to ICT infrastructure 0.04864 0.57792 0.084 0.933 Q8_13_Unreliable_service_provider -0.62421 0.51835 -1.204 0.229 Q8_14_Government_regulations 0.49421 0.47791 1.034 0.301
Signif. codes: 0 '***' 0.001 '**' 0.01 '*' 0.05 '.' 0.1 ' ' 1
In Table 16 above, the regression results for production-integrating ICT
adoption shows that there is no significant relationship between the external
factors and ICT adoption. This can be seen in the high p-value for all factors
which suggests that changes in the predictor are not associated with changes
in the response.
Table 17: Logistic Regression (Market-Orientated ICT)
Coefficients: Column1 Column2 Column3 Column4
Beta Std. Error z value Pr(>|z|)
(Intercept) -2.2828 4.0916 -0,558 0,577 Q8_9_Security_concerns -0.2614 0.8783 -0,298 0,766 Q8_10_Agnostic_stakeholders -0.3286 1.0191 -0,322 0,747 Q8_11_Not_tailored_to_SMEs -1.0811 1.3241 -0,816 0,414 Q8_12_ No_access to ICT infrastructure -0.3958 1.0287 -0,385 0,7
Q8_13_Unreliable_service_provider 0.6586 0.9648 0,683 0,495 Q8_14_Government_regulations 0.7527 1.0629 0,708 0,479
In Table 17 above, the regression results for market-orientated ICT adoption
indicate that there is no significant relationship between the external factors

64
and ICT adoption. All p-values for the predictor variable show a high
insignificance.
Hypothesis 4: Rejected
4.7 Results pertaining to Hypothesis 5
4.7.1 Descriptive statistics
Descriptive statistics for the characteristics of the sample is summarised in
Figure 15 and Table 18. From Figure 15 below it can be seen that 54% of
the respondents are of the opinion that ICTs are too expensive to implement
in their businesses. Also, 49% consider the low level of existing hardware
technology in place as a significant barrier. Significantly, 44% think that time
constraints are a major hindrance to implementing ICT.
H5: Internal factors are the greatest barriers to ICT adoption amongst
SMEs

65
Figure 15: Descriptive Statistics (Internal Barriers)
Table 18: Descriptive Statistics (Internal Barriers)
Statistic Employees’IT skills levels were too low
ICTs too expensive
Low level of existing hardware technology in place
Organisation required immediate ROI, ICT implementation would not deliver this result
Resistance to change within the organisation
Employees’ satisfaction with traditional technologies
Time constraints
Lack of awareness about the benefits of ICT
Min Value
1 2 1 1 1 1 1 1
Max Value
5 5 5 5 5 5 5 5
Mean 3.05 3.84 3.70 3.91 3.15 3.27 3.83 3.27
Variance 1.00 0.74 0.74 0.83 1.40 1.18 0.92 1.05
Standard Deviation
1.00 0.86 0.86 0.91 1.18 1.08 0.96 1.02
Total Responses
81 81 81 81 81 81 81 81

66
In Table 18 it can be seen that of a maximum value of 5, the mean values for
internal factors are significantly high with a low standard deviation. A low
standard deviation means that most of the numbers are very close to the
average. A high standard deviation means that the numbers are spread out.
For the section on organisations required immediate ROI, ICT implementation
would not deliver this result, we see a mean of 3.91 (SD= 0.91). Significantly,
time constraints show a mean score of 3.83 (SD= 0.96). Lastly, the cost of
ICTs is seen as a significant barrier with a mean of 3.84 (SD= 0.86).
4.7.2 Multivariate statistics: Logistic regression
A Logistic regression model was used to determine the impact of the
independent variables (internal barriers) on ICT adoption (dependent
variable). The significance of the regression coefficients of the hypothesised
independent variables were examined to determine support for the
hypothesis. The p-value for each term tests the null hypothesis that the
coefficient is equal to zero (no effect). A low p-value (< 0.05) indicates that the
null hypothesis can be rejected. In other words, a predictor that has a low p-
value is likely to be a meaningful addition to the model because changes in
the predictor's value are related to changes in the response variable.
Conversely, a larger (insignificant) p-value suggests that changes in the
predictor are not associated with changes in the response (Frost, 2013).
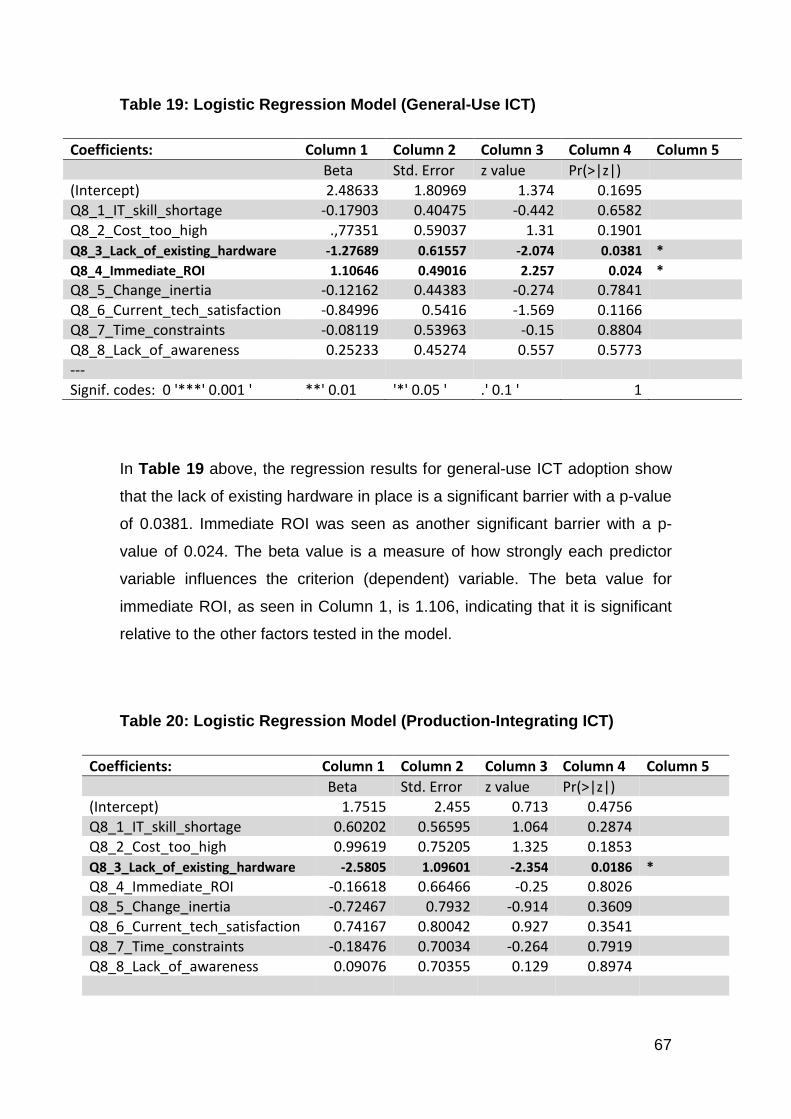
67
Table 19: Logistic Regression Model (General-Use ICT)
Coefficients: Column 1 Column 2 Column 3 Column 4 Column 5
Beta Std. Error z value Pr(>|z|)
(Intercept) 2.48633 1.80969 1.374 0.1695 Q8_1_IT_skill_shortage -0.17903 0.40475 -0.442 0.6582 Q8_2_Cost_too_high .,77351 0.59037 1.31 0.1901 Q8_3_Lack_of_existing_hardware -1.27689 0.61557 -2.074 0.0381 *
Q8_4_Immediate_ROI 1.10646 0.49016 2.257 0.024 *
Q8_5_Change_inertia -0.12162 0.44383 -0.274 0.7841 Q8_6_Current_tech_satisfaction -0.84996 0.5416 -1.569 0.1166 Q8_7_Time_constraints -0.08119 0.53963 -0.15 0.8804 Q8_8_Lack_of_awareness 0.25233 0.45274 0.557 0.5773 ---
Signif. codes: 0 '***' 0.001 ' **' 0.01 '*' 0.05 ' .' 0.1 ' 1
In Table 19 above, the regression results for general-use ICT adoption show
that the lack of existing hardware in place is a significant barrier with a p-value
of 0.0381. Immediate ROI was seen as another significant barrier with a p-
value of 0.024. The beta value is a measure of how strongly each predictor
variable influences the criterion (dependent) variable. The beta value for
immediate ROI, as seen in Column 1, is 1.106, indicating that it is significant
relative to the other factors tested in the model.
Table 20: Logistic Regression Model (Production-Integrating ICT)
Coefficients: Column 1 Column 2 Column 3 Column 4 Column 5
Beta Std. Error z value Pr(>|z|)
(Intercept) 1.7515 2.455 0.713 0.4756 Q8_1_IT_skill_shortage 0.60202 0.56595 1.064 0.2874 Q8_2_Cost_too_high 0.99619 0.75205 1.325 0.1853 Q8_3_Lack_of_existing_hardware -2.5805 1.09601 -2.354 0.0186 *
Q8_4_Immediate_ROI -0.16618 0.66466 -0.25 0.8026 Q8_5_Change_inertia -0.72467 0.7932 -0.914 0.3609 Q8_6_Current_tech_satisfaction 0.74167 0.80042 0.927 0.3541 Q8_7_Time_constraints -0.18476 0.70034 -0.264 0.7919 Q8_8_Lack_of_awareness 0.09076 0.70355 0.129 0.8974

68
In Table 20, the regression results for product-integrating ICT adoption show
that the lack of existing hardware in place is significantly related to ICT
adoption with a p-value of 0.0186.
Table 21: Logistic Regression Model (Market-Orientated ICT)
Coefficients: Column 1 Column 2 Column 3 Column 4
Beta Std. Error z value Pr(>|z|)
(Intercept) -1.0437 4.9403 -0.211 0833
Q8_1_IT_skill_shortage 0.1527 1.0894 0.14 0.889 Q8_2_Cost_too_high -0.1161 1.4201 -0.082 0.935 Q8_3_Lack_of_existing_hardware -1.8361 1.8887 -0.972 0.331 Q8_4_Immediate_ROI 1.2944 1.3291 0.974 0.33 Q8_5_Change_inertia -0.9073 1.3227 -0.686 0.493
Q8_6_Current_tech_satisfaction 0.7986 1.4952 0.534 0.593 Q8_7_Time_constraints 0.3734 1.4374 0.26 0.795 Q8_8_Lack_of_awareness -1.0935 1.1928 -0.917 0.359
In Table 21 above, the regression results for market-integrating ICT adoption,
show no significant internal barriers with all factors displaying high p-values.
Hypothesis 5: Accepted
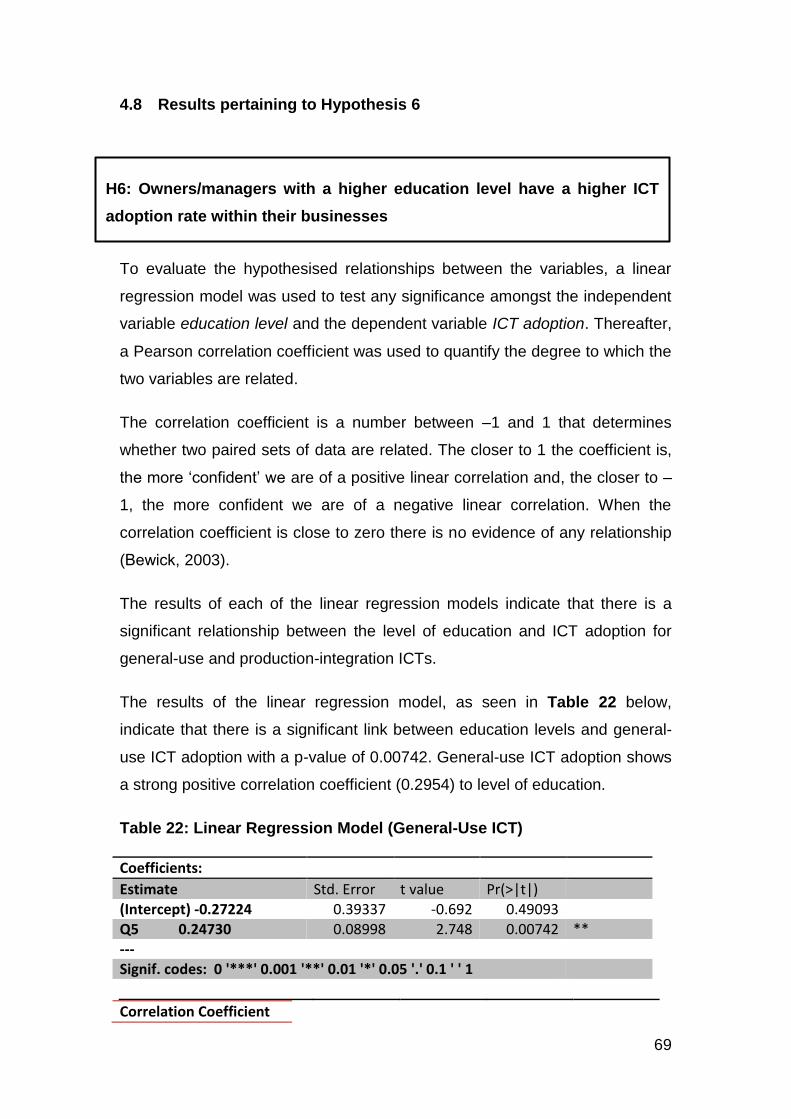
69
4.8 Results pertaining to Hypothesis 6
To evaluate the hypothesised relationships between the variables, a linear
regression model was used to test any significance amongst the independent
variable education level and the dependent variable ICT adoption. Thereafter,
a Pearson correlation coefficient was used to quantify the degree to which the
two variables are related.
The correlation coefficient is a number between –1 and 1 that determines
whether two paired sets of data are related. The closer to 1 the coefficient is,
the more ‘confident’ we are of a positive linear correlation and, the closer to –
1, the more confident we are of a negative linear correlation. When the
correlation coefficient is close to zero there is no evidence of any relationship
(Bewick, 2003).
The results of each of the linear regression models indicate that there is a
significant relationship between the level of education and ICT adoption for
general-use and production-integration ICTs.
The results of the linear regression model, as seen in Table 22 below,
indicate that there is a significant link between education levels and general-
use ICT adoption with a p-value of 0.00742. General-use ICT adoption shows
a strong positive correlation coefficient (0.2954) to level of education.
Table 22: Linear Regression Model (General-Use ICT)
Coefficients:
Estimate Std. Error t value Pr(>|t|) (Intercept) -0.27224 0.39337 -0.692 0.49093 Q5 0.24730 0.08998 2.748 0.00742 ** --- Signif. codes: 0 '***' 0.001 '**' 0.01 '*' 0.05 '.' 0.1 ' ' 1
Correlation Coefficient
H6: Owners/managers with a higher education level have a higher ICT
adoption rate within their businesses
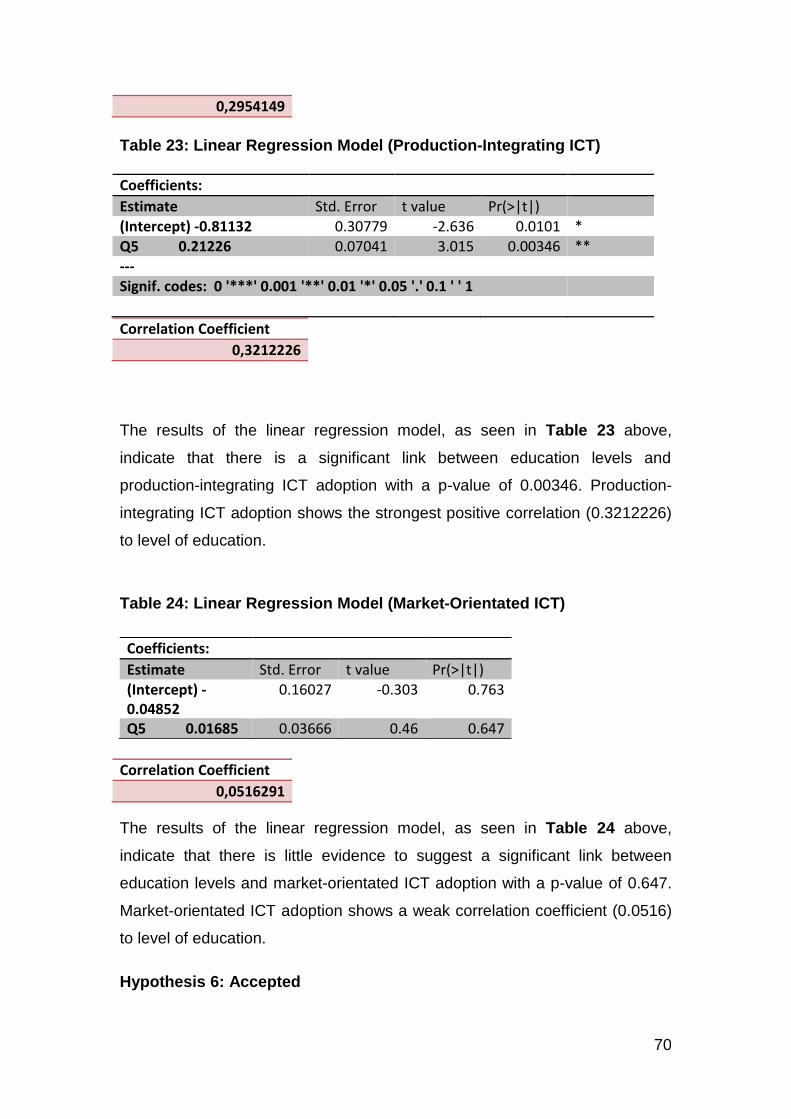
70
0,2954149
Table 23: Linear Regression Model (Production-Integrating ICT)
Coefficients:
Estimate Std. Error t value Pr(>|t|) (Intercept) -0.81132 0.30779 -2.636 0.0101 * Q5 0.21226 0.07041 3.015 0.00346 ** --- Signif. codes: 0 '***' 0.001 '**' 0.01 '*' 0.05 '.' 0.1 ' ' 1
Correlation Coefficient
0,3212226
The results of the linear regression model, as seen in Table 23 above,
indicate that there is a significant link between education levels and
production-integrating ICT adoption with a p-value of 0.00346. Production-
integrating ICT adoption shows the strongest positive correlation (0.3212226)
to level of education.
Table 24: Linear Regression Model (Market-Orientated ICT)
Correlation Coefficient
0,0516291
The results of the linear regression model, as seen in Table 24 above,
indicate that there is little evidence to suggest a significant link between
education levels and market-orientated ICT adoption with a p-value of 0.647.
Market-orientated ICT adoption shows a weak correlation coefficient (0.0516)
to level of education.
Hypothesis 6: Accepted
Coefficients:
Estimate Std. Error t value Pr(>|t|) (Intercept) -0.04852
0.16027 -0.303 0.763
Q5 0.01685 0.03666 0.46 0.647

71
4.9 Summary of the results
This chapter provided an overview of the results of the study. The chapter
covered the demographics of the sample, the linear and logistic regression
models and, finally, the correlation analysis that pertains to the six hypotheses
outlined in Chapter 3.
In summary, evidence was found to support Hypothesis 1, showing that SMEs
are of the opinion that ICT does indeed add value to their business. From the
perceived value of ICT use, the responses clearly indicate that the SMEs
sampled think that their operations have improved since adopting specific
ICTs within their businesses. With a maximum value of 5, the majority of
respondents agreed that scheduling has become more efficient (mean: 3.51),
turnaround time has increased (mean: 3.75), the organisation has become
more efficient (mean: 3.6) since adopting ICT, and short term targets are
more achievable (mean: 3.9).
Evidence was found to support Hypothesis 2. According to the results, the
perceived value of ICT has a significant relation to ICT adoption. The results
of the linear regression model indicate that general-use ICT adoption is
strongly correlated to the perceived value of ICT with a p-value of 0.00057.
Hypothesis 3 aimed to ascertain whether SMEs predominantly make use of
general-use ICTs. Through the use of descriptive statistics, it became clear
that the sample consisted mainly of general-use ICT users, followed by
production-integrating ICT users, while very few SMEs were using market-
orientated ICTs. Hence, Hypothesis 3 is accepted. The findings showed that
the majority of participants have VoIP (69%), Internet access and e-mail
(90%), and telephone (89%) and fax lines (82%) as one of the ICTs already
implemented.
Hypothesis 4 proposed that external barriers significantly prevent ICT
adoption. However, the results of the linear regression analysis proved this to

72
be false as the model identified external barriers to have no significant impact
on ICT adoption. Hence, Hypothesis 4 is rejected.
Hypothesis 5 proposed that internal barriers significantly prevent ICT
adoption. The linear regression analysis showed that for general-use ICT, the
lack of existing hardware in place was a significant barrier to ICT adoption
with a p-value of 0.0381. Immediate ROI was another significant barrier, with
a p-value of 0.024. Hypothesis 5 was thus accepted.
Hypothesis 6 aimed to establish whether education levels have a notable and
direct influence on owners/managers’ ICT adoption. The results of each of the
linear regression models indicate that there is indeed a significant relationship
between the level of education and ICT adoption for general-use and
production-integration ICTs. Furthermore, the production -integrating ICTs
showed the strongest correlation (0.3212226) to level of education.
Hypothesis 6 was therefore accepted.

73
CHAPTER 5: DISCUSSION OF THE RESULTS
5.1 Introduction
The purpose of this chapter is to discuss the results of the research that were
presented in the previous chapter. The discussion also seeks to compare the
findings of this research with the theoretical foundations drawn from previous
literature as discussed in Chapter 2. The chapter starts with a discussion of
the demographic profile of the sample. The results pertaining to the structural
aspects of the model are then discussed, covering the findings on each
hypothesis.
5.2 Demographic profile of respondents
A total of 81 respondents of the 250 sampled SMEs completed the survey,
thus a response rate of 32.4 %. This response rate, although not ideal, was
expected given the size of the sample and the limited access to the details of
the respondents.
The respondents of the online questionnaire were owners (65%) or managers
of a company (35%). There were no responses from IT managers or staff.
This is to be expected as the majority of firms in the sample had between one
to ten employees (45%), and senior management in these SMEs are often the
point of contact within the business.
The current number of employees at the SMEs surveyed indicates that the
majority of the SMEs employed between one to ten staff members (46%),
while 35% employed 11-25 staff members and 15% employed 26-50 staff
members. There were no SMEs from the survey that employed more than 100
staff members. Of these SMEs, 81% had less than 26 employees in their
organisations. A total of 46% of SMEs have been in operation for four to five
years, and only 26% for more than six years. These results are also in line

74
with expectations prior to the study. It was expected the SMEs sampled would
be fairly new businesses with a small staff complement. With this in mind, the
study envisaged to gain better knowledge about whether fledgling businesses
were making use of ICTs in their businesses to add competitive advantage.
5.3 Discussion pertaining to Hypothesis 1
In summary, evidence was found to support Hypothesis 1, showing that SMEs
are of the opinion that ICT does indeed add value to their business. Despite
the fact that a majority of SMEs in the sample make use of general ICT
technologies rather than production-integrating and market-orientated
technologies, they still seem to think that investing in ICTs could add value to
their enterprises. Interestingly, employee-centered benefits and financial
impacts appear not to be major benefits from ICT adoption.
From the perceived value of ICT use, the responses clearly indicate that the
SMEs sampled think that their operations have improved since adopting
specific ICTs within their businesses. With a maximum value of 5, the majority
of respondent agreed that scheduling has become more efficient (mean:
3.51), that the turnaround time has increased (mean: 3.75), that the
organisation has become more efficient (mean: 3.6) since adopting ICT, and
that short term targets are more achievable (mean: 3.9). This is also in line
with the findings from Ismail et al, (2011) who argue that the adoption of ICT
services does add value. Their findings maintain that general ICT usage is the
most adopted form of ICT, followed by production-orientated and advanced
ICT use. However, the most notable benefit for adoption sited in their report
was that the “organisation has turned out to be more marketable and they
H1: ICTs are perceived by SMEs to add value to their business

75
have been able to increase their customer base as a result” (Ismail et al.,
2011). In this study, however, this was found not to be true as only 22% of the
respondents were of the opinion that their businesses had become more
marketable because of ICT adoption.
5.4 Discussion pertaining to Hypothesis 2
Evidence was found to support Hypothesis 2. According to the results, the
perceived value of ICT has a significant relation to ICT adoption. The results
of the linear regression model indicate that general-use ICT adoption is
strongly correlated to the perceived value of ICT, with a p-value of 0.00057.
Davis (1989) defines perceived value as ‘’the belief that using a particular
technology will enhance the potential user’s job performance.’’ Similarly,
Kiveu’s (2013) study on ICT adoption and use among SMEs in Kenya reveals
that ICT adoption is influenced by perceived value. This means that a
potential user of ICT is more likely to adopt the ICT if she or he perceives the
technologies as useful. According to the results by Alam and Noor (2009), a
perceived benefit has a significant relation to ICT adoption. This is to be
expected as past literature has consistently shown that perceived benefit has
a significant and positive influence on ICT adoption (Bingi et al., 2000; Grover
& Goslar, 1993; Wang & Tasai, 2002).
According to Giovanni and Mario (2003), the usage of ICT applications for
business purposes has numerous advantages for its user. Presently, most
SMEs are curious about the benefits of appropriate ICT implementation.
Implementing ICT in an organisation could offer businesses a wide range of
possibilities for improving their competitiveness, such as providing
mechanisms for getting access to new market opportunities and specialised
H2: Perceived value of ICT has a positive effect on its adoption and use
by SMEs

76
information services. This follows on studies by Kim, Chan and Gupta (2007),
which shows that perceived value has a significant effect on adoption
intention. Furthermore, it fully mediates the effects of usefulness, enjoyment,
technicality and perceived fee on adoption intention. This is consistent with
prior research on perceived value which has recurrently verified perceived
value as a predictor of intention (Kim, Chan and Gupta, 2007),
In conclusion, the findings of this research are well supported by the relevant
academic literature. Hypothesis 2 is thus accepted.
5.5 Discussion pertaining to Hypothesis 3
Hypothesis 3 aimed to ascertain whether SMEs predominantly make use of
general-use ICTs. By using descriptive statistics, it became clear that the
sample consisted mainly of general-use ICT users, followed by production-
orientated ICT users, while only a few SMEs used market-orientated ICTs.
Hence, Hypothesis 3 is accepted.
The findings showed that the majority of participants have VoIP (69%),
Internet access and e-mail (90%), and telephone (89%) and fax lines (82%)
as ICTs already implemented.
The results showed that most SMEs in South Africa make use of general ICT
technologies, rather than more advanced and newer ICT technologies that are
available for use. This was expected as the cost and skills related to more
advanced ICTs are often a significant challenge for SMEs who usually have
limited resources. This is also one of the reasons that most South African
SMEs tend to adopt and use general ICTs rather than more advanced
technologies. Surprisingly however, a significant proportion of the SMEs in the
sample intended to implement more advanced technology in their firms. This,
H3: Most SMEs make use of general-use ICTs

77
then, is also in line with the findings of Ismail et al. (2011) who suggest that
general ICT usage is the most adopted form of ICT, followed by production-
orientated and advanced.
According to the existing literature, SMEs tend to adopt basic ICT
infrastructure, such as email and we Internet services which may be more
valuable to them on an operational level rather than a strategic one. In turn,
this could potentially be interpreted as being in line with Brown and Lockett’s
(2004) study, which argue that SMEs feel more at ease with low complexity
ICT applications and tend avoid the more complex applications. Parida et al.
(2010) state that SMEs do not adopt more complex ICT services because
they are unfeasible or may not suit the nature of their specific businesses. In
fact, their research indicates that ICT providers tend to target large firms as
they usually have adequate resources and are willing to pay for more complex
ICT services. Their products are often too expensive and too complex for
SME users. Unsurprisingly, the findings related to Hypothesis 3 are well
supported by the relevant academic literature.
5.6 Discussion pertaining to Hypothesis 4
Hypothesis 4 proposed that external barriers significantly prevent ICT
adoption. Lack of infrastructure was highlighted by the respondents as being
the only external barrier of statistical significance. However, the results of the
linear regression analysis proved this to be false as the model identified
external barriers to have no significant impact on ICT adoption overall. This is
surprising as it was expected that external barriers would have a far greater
influence on ICT adoption, particularly in a developing nation such as South
Africa where there are a number of infrastructure and regulatory challenges.
H4: External factors are the greatest barriers to ICT adoption amongst
SMEs

78
The finding for this study also goes against numerous studies which highlight
the lack of infrastructure and government regulations as significant external
barriers to ICT adoption.
According to Kapurubandara et al (2006), the availability of ICT infrastructure
is an important factor that hinders the adoption of ICT by SMEs. If there is
sufficient ICT infrastructure in a country, it is far easier for SMEs to adopt ICT.
Their study found that the availability of Internet facilities and
telecommunication services were some of the barriers affecting the adoption
of ICT by SMEs in developing economies. In Apulu and Latham’s (2009)
study in Nigeria, they also found that the unstable nature of the electricity
supply in the country was one of the key factors affecting the adoption of ICT
as information technologies work hand-in-hand with stable sources of
electricity supply.
It was also expected that this study would reveal that regulatory and
government barriers would be significant hurdles to ICT adoption. However,
this was shown to be false. A study by Kapurubandara and Lawson (2006)
showed that prioritising external support activities, particularly legal and
regulatory ones, demand direct intervention from the government for
solutions. Similarly, the government’s role in an overly bureaucratic regulatory
system results in delays in its decisions and is extremely costly. Appropriate
legal and regulatory frameworks would thus ensure that SMEs operate on a
level playing field.
The findings related to Hypothesis 4 are in contradiction to the relevant
academic literature and is therefore rejected.

79
5.7 Discussion pertaining to Hypothesis 5
Hypothesis 5 proposed that internal barriers significantly prevent ICT
adoption. The linear regression analysis showed that for general-use ICT, the
lack of existing hardware in place was a significant barrier to ICT adoption,
with a p-value of 0.0381. Immediate ROI was another significant barrier with a
p-value of 0.024. The descriptive analysis also indicated that respondents
were of the opinion that cost and time constraints were also important
barriers. The findings confirm that SMEs in South Africa experience significant
internal barriers to ICT adoption and use.
MacGregor et al. (2002) argue that some of the barriers to ICT adoption are
unique to SMEs, including the low level of existing hardware technology. The
lack of existing technology can be closely related to the cost of this hardware.
Cost, as the literature shows, is a common barrier for SMEs.
Cost was discovered as one of the most significant barriers in the adoption of
ICT by SMEs in South Africa. This is consistent with studies by Adam (2003),
Ismail, Jeffery and Van Belle (2011), and Harindranath et al. (2008) whose
findings indicate that cost plays a critical role in ICT adoption in organisations.
Even in SMEs that are already established and using ICT, cost remains a
critical issue. Lee and Kim (2004) state that even the adopters of ICT are
unwilling to upgrade their information systems or to adopt other advanced ICT
service applications as a result of the high adoption cost.
The cost of training and up skilling employees has continued to be a key issue
amongst SMEs. In most SMEs, there is reluctance amongst owner/managers
to invest in training their employees because they are afraid of losing their
them to large companies on completion of such training when qualifications
H5: Internal factors are the greatest barriers to ICT adoption amongst
SMEs

80
are increased (Arendt, 2008). Also, some SME managers believe that
maintaining ICT infrastructures requires a substantial amount of money. SME
owners seemed to be of the opinion that ICTs are too costly to invest in as
many of them do not have an understanding of the benefits that ICT could
have. In line with Ismail, Jeffery and Van Belle (2011), an overall lack of
awareness seems to exist amongst South African SME owners/managers
with respect to ICT technologies in itself, as well as knowledge about the
benefits that ICT can yield and who to turn to for help with regard to systems
analysis, design and building an actual system for their needs.
Previous studies also support the findings that immediate ROI is seen as a
priority for SMEs and it is perceived that this is not something that ICTs can
provide. Sorensen and Buatsi (2002), as well as Scupola (2003) have found
that small businesses require short term ROI and ICT is seen as a long-term
investment. This observation further supports the findings of MacGregor et al.
(2002) who argue that SMEs need to see an immediate return on investment
(ROI), whereas ICT is a long-term investment.
In conclusion, Hypothesis 5 is accepted and the findings of this research are
well supported by the relevant academic literature.
5.8 Discussion pertaining to Hypothesis 6
Education is a key variable, which facilitates an understanding and
appreciation of new technologies. Highly educated people are more adaptive
and there is a direct relationship between perceived usefulness and perceived
ease of use. Hence, the study sought to establish the level of education of the
H6: Owners/managers with a higher education level have a higher ICT
adoption rate within their business

81
respondents and whether this affected their ICT use. Thus, Hypothesis 6
aimed to see whether level of education has a direct influence on
owners/managers’ ICT adoption. Through the use of the linear regression
model and correlation coefficients, this was found to be statistically significant.
The results of each of the linear regression models indicated that there is a
significant relationship between level of education and ICT adoption for
general-use and production-integration ICTs. Furthermore, the production-
integrating ICTs show the strongest correlation (0.3212226) to level of
education. This supports the findings by Chibelushi (2008) and Chewet al.
(2010) who state that a person’s education level plays a major role in the
adoption of ICT in their businesses. The higher the individual’s level of
education, the more likely they are to have a greater level of ICT adoption. A
study conducted by Basant et al. (2006) also found that Brazilian SMEs that
had employees with higher levels of education were more inclined to adopt
ICT. Similarly, Mokaya and Njuguna (2012) found that the level of education
of Kenyan owners/managers influenced ICT adoption and that those who had
at least a college level education and made use of ICT tools were more likely
to use ICT on a consistent basis.
Education and training is viewed as being crucial to addressing the lack of
readiness of SMEs in adopting and developing their electronic business
capabilities (Chau, 2001). One may infer from this that higher levels of
education may lead to higher ICT adoption rates due to formal education on
business management and resources available, and/or greater awareness of
ICTs.
Evidence was therefore found to support Hypothesis 6.

82
5.9 Conclusion
In this chapter, the results of this research were explained in terms of the
findings, either drawing parallels or with or contrasting it to the existing
literature. In summary, evidence was found to support Hypothesis 1, namely
that SMEs perceive there to be value in ICT applications in their businesses.
Hypothesis 2 was also supported as there is a significant link between
perceived value and ICT adoption. Hypothesis 3 was accepted from the
descriptive statistics and is in line with numerous literature that highlights that
SMEs often make use of general ICTs rather than more advanced ones.
However, the results pertaining to hypotheses Hypothesis 4 did not display
sufficient significance for the hypotheses to be accepted. Despite the lack of
infrastructure having an impact on ICT adoption, this was shown not to be
statistically significant. Surprisingly, and in contradiction to existing literature,
external barriers were found not influence ICT adoption. With regard to
hypothesis Hypothesis 5, evidence was found to support this, with numerous
studies showing that internal barriers – particularly immediate ROI and a lack
of existing hardware – are common barriers for SMEs. The study showed that
cost and time constraints are also clear barriers and these two can be closely
linked to the aforementioned. Lastly, Hypothesis 6 aimed at ascertaining
whether or not levels of education have a direct influence on
owners/managers’ ICT adoption. Through the use of the linear regression
model and correlation coefficients this was found to be statistically significant
and was accepted. This hypothesis was also supported by existing literature
which shows that as people become better educated, they have more
knowledge of ICT applications and access to resources to facilitate the use of
these.
83
CHAPTER 6: CONCLUSIONS AND RECOMMENDATIONS
6.1 Introduction
This final chapter examines the conclusions of the study with reference to the
context set out at the beginning and highlights key differences with other
research that has emerged. The research findings are related to existing
theory and recommendations are made to SME practitioners and policy
makers. Suggestions for further areas of exploration and future research are
then presented.
6.2 Conclusions of the study
Earlier studies on ICT adoption have shown that SMEs in developing
countries have not fully taken advantage of technological developments to
extend their businesses beyond traditional borders (Humphrey et al., 2004).
Hence, there is a need for a better understanding of the determinants of ICT
usage and factors that drive or constrain its adoption and use (Harindranath et
al., 2008).
The variance between adoption patterns in developing and developed
countries focuses on support activities needed in the development. Support is
available in developed countries and it is mostly a matter of finding the
appropriate assistance for an SME encountering barriers, whereas in
developing economies this support is almost non-existent. The objectives of
this study were to understand which ICTs are currently being used by SMEs,
and also to understand and determine the various internal and external
barriers to ICT adoption. This study revealed that internal barriers, such as
immediate ROI and lack of existing hardware, significantly hinder ICT
adoption by SMEs. Lack of infrastructure is another external barrier that
impacts ICT adoption highlighted by the respondents.

84
This study provides an understanding of the challenges faced by SMEs in the
adoption of ICT in developing countries- specifically that of South Africa. The
results of the questionnaire clearly indicate the necessity to provide support
for SMEs if they are to successfully adopt ICT in order to grow their
businesses and benefit the economy of the country. While the findings
indicate that each SME has their own unique mix of factors which influences
their adoption patterns, one can see that there are significant internal barriers
that determine the level of ICT adoption by South African SMEs. These
findings contribute to the knowledge on how South African SMEs can be
encouraged to adopt ICTs throughout their businesses.
In summary, the questionnaire findings point out that SMEs need to think
more strategically about their use of ICT. In this respect, SMEs are falling
behind best practices adopted by their larger, more established counterparts
in the global economy. Private and public agents charged with the
development of SME capabilities also need to redirect their delivery
mechanisms to address the ICT capability and information gaps identified in
this research.
6.3 Recommendations
In summary, the recommendations for SMEs, policy makers and businesses
to overcome barriers and improve the implementation of ICTs are as follows:
SMEs should invest in educating their staff and management about ICT
and its benefits (Mutula & Van Brakel, 2006). SMEs should establish
ICT as a core area in the same way as the core areas of finance or
human resources are established. In so doing they will be recognising
ICT as an important function that deserves to be taken seriously. Once
this key function is established, SMEs need to identify a clear terms of
reference for this function and establish their specifications; i.e. to know
what abilities, skills and experience they are looking for when they want
to fill the roles. When looking for staff to occupy the positions, it is
imperative that competent people are chosen, with the right

85
qualifications and experience to do the job. Owners of SMEs should
also set good examples in acquiring ICT knowledge and skills and seek
to motivate their employees to do the same. In order to effectively
participate and compete in modern society, ICT proficiency is essential
for all companies- no matter how big or small they are.
SMEs should also consider investing in recruiting or outsourcing
knowledgeable ICT specialists (Perry, 2007). However, often times the
challenge is that an SME cannot afford individuals with the required
skills. If possible it would then be advisable to hire a consultant in the
short term to provide advice, training and a review of existing systems
and opportunities available. The objective will be to get a consulting
company that understands both ICT and the business aspect. Random
decision-making with regard to ICT amongst SMEs is a common
problem that must be addressed in order to give SMEs a competitive
advantage. The ability to identify company needs and the appropriate
source of support to satisfy these needs is a crucial factor to the
success of most businesses. Often SMEs fail to identify their business
needs and also approach non-professionals for advice.
It is recommended that SMEs look to build a culture that is innovative
and favourable to technology (Martin, 2005). The owner/manager must
take an active role in this process and aim to understand the benefits
and the role of ICT within their business. ICT then needs to be
prioritised as a functional area. Once this is done, the SME should
build an ICT culture within the business by gradually ensuring that the
business process is more reliant on technology and less on manual
processes, and also by continually exploring all the various and newest
technological options with their possible benefits to the SME. Regular
communication with staff about the changes and the vision of the
organisation is important to make all employees comfortable the new
processes. The SME should also invest in teaching its staff about
technology and encourage employees to use technology. As

86
recommended by Martin (2005), successful Internet adoption depends
on different roles being set out.
Through this research and based on previous literature, it is clear that
there is a greater need for SMEs and government institutions to
cooperate in addressing the barriers to ICT adoption and sustained
use. Organisations must ensure the readiness of their employees for
the change that is brought about through ICT solutions. This should not
only be restricted to their employees, but should also recognise the
multiplicative effect of appropriate ICT adoption throughout the supply
chain. Infrastructure development needs to take place to complement
the development of SME-based commerce. The cost of these
undertakings should be considered in light of the considerable
importance of SMEs to the economy.
Governments and private roles should be strengthened to improve
basic ICT skills and frameworks should be developed to encourage
greater ICT and e-business skill formation (including marketing,
organisational, security, trust and management skills in addition to ICT
skills) in conjunction with education institutions, businesses and
individuals.
The South African government, through its relevant departments,
should encourage and build linkages between SMEs and large
enterprises, and create learning and research institutions and
environments for knowledge and technology transfer. As an example,
government departments could facilitate a more widespread use of ICT
uptake by small businesses, educate SMEs on the incentives available
to assist them in this regard, increase the basic ICT skill level and
develop a mechanism that supports programs focusing on higher level
ICT skills development for businesses, educational institutions, and
individuals.
Lastly, there is a need for ICT service providers to create customised
87
ICT applications and packages for SMEs, which take into consideration
their unique characteristics, and needs. These bespoke applications
should be affordable, focus on their daily operations, offer solutions to
their problems and be easy to use. There is also a need to develop
more mobile-based ICT applications because these are the most
owned and frequently used ICT by the SMEs, particularly in Africa.
6.4 Suggestions for further research
While the research done in this project attempts to fill some of the gaps in the
existing literature, it does not address all the possible areas of research. The
following recommendations are made for future research:
In this paper, SMEs were sampled only from the Gauteng region. In
order to get a more holistic view of the ICT use amongst SMEs in
South Africa, SMEs from all over the country should be sampled. This
will give the researchers a more accurate representation of South
African SMEs and their ICT use. Also, only 81 responses were
received for this research. In order to illicit more holistic, meaningful
results, it is recommended that the sample size be increased.
The sample used in this study was only of the manufacturing sector,
particularly because it is a potentially high growth sector. An analysis of
various sectors of the South African economy could reveal interesting
results.
Researchers should try make comparisons of Ict use amongst
developing nations, particularly those in Africa. Studies can focus on
various aspects, such as simularities and differences between these
countries' adoption of ICT, technological barriers, cultural barriers and
opportunities, as well as policy issues.
88
Future research should be done on SMEs from differing sectors in
urban and rural South Africa in order to make comparisons of what the
constrainsts and succeses are.

89
REFERENCES
Abor, J., & Quartey, P. (2010). Issues in SME development in Ghana and South
Africa. International Research Journal of Finance and Economics, 39(6), 215-
228.
Agarwal, R. (2000). Framing the Domains of IT Management Research: Glimpsing
the Future through the Past. Paper presented at the Pinnaflex, Cincinnati, OH.
Agarwal, R., & Karahanna, E. (2000). Time Flies When You're Having Fun: Cognitive
Absorption and Beliefs about Information Technology Usage. MIS Quarterly,
24(4), 665-694.
Agarwal, R., & Prasad, J. (2000). A Field Study of the Adoption of Software Process
Innovations by Information Systems Professionals. IEEE Transaction on
Engineering Management, 47(3), 295-308.
Ajzen, I. (1991). The Theory of Planned Behavior. Organizational Behavior and
Human Decision Process, 52(2), 179-211.
Akerlof, G. A. (1970). The Market for "Lemons": Quality Uncertainty and the Market
Mechanism. The Quarterly Journal of Economics, 488-500.
Alam, S. S., & Noor, M. K. M. (2009). ICT Adoption in Small and Medium
Enterprises: An Empirical Evidence of Service Sectors in Malaysia.
International Journal of Business and Management, 4(2), 112.
Ardjouman, D. (2014). Factors Influencing Small and Medium Enterprises (SMEs) in
Adoption and Use of Technology in Cote d'Ivoire. International Journal of
Business and Management, 9(8), 179.
Bank, W. (1998). Latin America and the Caribbean: Education and Technology at the
Crossroads – A Discussion Paper. Washington, DC.
Barba-Sánchez, V., Del Pilar Martínez-Ruiz, M., & Jiménez-Zarco, A. I. (2007).
Drivers, Benefits and Challenges of ICT Adoption by Small and Medium Sized
Enterprises (SMEs): A Literature Review. Problems and Perspectives in
Management 5(1), 103-114.
Bayo-Moriones, A., & Lera-López, F. (2007). A Firm-Level Analysis of Determinants
of ICT Adoption in Spain. Technovation, 27(6), 352-366.

90
Beatty, R. C., Shim, J. P., & Jones, M. C. (2001). Factors Influencing Corporate
Website Adoption: A Time-Based Assessment. Information & Management,
38(6), 337-354.
Bhattacherjee, A. (2001). An Empirical Analysis of the Antecedents of Electronic
Commerce Service Continuance. Decision Support Systems, 32(2), 201-214.
Bhattacherjee, A., & Hikmet, N. (2007). Physicians' Resistance toward Healthcare
Information Technology: A Theoretical Model and Empirical Test. European
Journal of Information Systems, 16(6), 725-737.
Bhattacherjee, A., & Hikmet, N. (2008). Reconceptualizing Organizational Support
and its Effect on Information Technology Usage: Evidence from the Health
Care Sector. The Journal of Computer Information Systems, 48(4), 69-76.
Blili, S., & Raymond, L. (1993). Information Technology: Threats and Opportunities
for Small and Medium-Sized Enterprises. International Journal of Information
Management, 13(6), 439-448.
Bruner, G. C., & Kumar, A. (2005). Explaining consumer acceptance of handheld
Internet devices. Journal of business research, 58(5), 553-558.
Cant, M. C., Wiid, J.A. & Hung, Y. (2015). Internet-Based ICT Usage by SMEs: Are
the Benefits Within Reach of SMEs? Problems and Perspectives in
Management Journal, Special Issue: South Africa (2).
Carson, D., Gilmore, A., Perry, C., & Gronhaug, K. (2001). Qualitative Marketing
Research. Qualitative Marketing Research. SAGE Publications, Ltd. London,
England: SAGE Publications, Ltd.
Chau, P. Y. K., & Hu, P. J. H. (2001). Information Technology Acceptance by
Individual Professionals: A Model Comparison Approach. Decision Sciences,
32(4), 699-719.
Consoli, D. (2012). Literature Analysis on Determinant Factors and the Impact of ICT
in SMEs. Procedia-Social and Behavioral Sciences, 62, 93-97.
Davis, F. D. (1989). Perceived Usefulness, Perceived Ease of Use, and User
Acceptance in Information Technology. MIS Quarterly, 13(3), 319-340.
Dennis, A. R. (1996). Information Exchange and Use in Group Decision Making: You
Can Lead a Group to Information, But You Can't Make It Think. MIS
Quarterly, 433-457.

91
Dishaw, M. T., & Strong, D. M. (1999). Extending the Technology Acceptance Model
with Task-Technology Tit Constructs. Information & Management, 36(1), 9-21.
Dixon, T., Thompson, B., & McAllister, P. (2002). The Value of ICT for SMEs in the
UK: A Critical Literature Review: Research. Small Business Service Research
Programme.
DoC, T. (2013). National Integrated ICT Policy. Pretoria: Staatskoerant.
Esselaar, S., Gillwald, A., & Stork, C. (2006). South African Telecommunications
Sector Performance Review 2006. LINK Centre public policy research paper,
(8), 1-64.
Evans, P. B., & Wurster, T. S. (1997). The New Economics of Information. Harvard
Business Review, 5, 71-82.
Franco, M., Haase, H., Magrinho, A., & Ramos Silva, J. (2011). Scanning Practices
and Information Sources: An Empirical Study of Firm Size. Journal of
Enterprise Information Management, 24(3), 268-287.
Frempong, G. (2011). Developing Information Society in Ghana: How Far? The
Electronic Journal of Information Systems in Developing Countries, 47(8), 1-
20.
Gono, S., Harindranath, G., & Özcan, G. B.(2013). Challenges of ICT Adoption by
South African SMEs: A Study of Manufacturing and Logistics Firms. In
Proceedings of the Annual Conference of The Institute for Small Business and
Entrepreneurship.
Gray, C. (2006). Absorptive Capacity, Knowledge Management and Innovation in
Entrepreneurial Small Firms. International Journal of Entrepreneurial Behavior
& Research, 12(6), 345-360.
Hallberg, K. (2000). A Market-Oriented Strategy for Small and Medium Scale.
Hanna, N. K. (2010). Transforming Government and Building the Information
Society: Challenges and Opportunities for the Developing World. Springer
Science & Business Media, New York.
Harindranath, G., Dyerson, R., & Barnes, D. (2008). ICT Adoption and Use in UK
SMEs: A Failure of Initiatives. Electronic journal of information systems
evaluation, 11(2), 91-96.
Hernandez, B., Jimenez, J., & Martin, M. J. (2010). Business Management Software
in High-Tech Firms: The Case of the IT Services Sector. Journal of Business

92
& Industrial Marketing, 25(2), 132-146.
Hobohm, S. (2001). Small and Medium-Sized Enterprises in Economic
Development: The UNIDO Experience. Journal of Economic Cooperation,
22(1), 1-42.
Hoffman, N. P. (2000). An Examination of the "Sustainable Competitive Advantage"
Concept: Past, Present, and Future. Academy of Marketing Science Review,
4, 1-16.
Hsu, M. H., & Chiu, C. M. (2004). Predicting Electronic Service Continuance with a
Decomposed Theory of Planned Behaviour. Behaviour & Information
Technology, 23(5), 359-373.
Hsu, M. H., Yen, C. H., Chiu, C. M., & Chang, C. M. (2006). A Longitudinal
Investigation of Continued Online Shopping Behavior: An Extension of the
Theory of Planned Behavior. International Journal of Human-Computer
Studies, 64(9), 889-904.
Humphrey, J., Mansell, R., Paré, D., & Schmitz, H. (2004). E-commerce for
Developing Countries: Expectations and Reality. IDS Bulletin, 35(1), 31-39.
Irani, Z. (2002). Information Systems Evaluation: Navigating Through the Problem
Domain. Information & Management, 40(1), 11-24.
Ismail, R., Jeffery, R., & Van Belle, J. P. (2011). Using ICT as a Value Adding Tool in
South African SMEs. Journal of African Research in Business & Technology,
2011, 1-11.
Kapurubandara, M., & Lawson, R. (2006). Barriers to Adopting ICT and e-commerce
with SMEs in developing countries: an Exploratory study in Sri Lanka.
University of Western Sydney, Australia.
Kim, H. W., Chan, H. C., & Gupta, S. (2007). Value-Based Adoption of Mobile
Internet: An Empirical Investigation. Decision Support Systems, 43(1), 111-
126.
Kohli, R., & Devaraj, S. (2004). Realizing the Business Value of Information
Technology Investments: An Organizational Process. MIS Quarterly
Executive, 3(1), 53-68.
Kotelnikov, V., & Kim, H. (2007). Small and Medium Enterprises and ICT, Asia-
Pacific Development Information Programme e-Primers for the Information
Economy. Society and Polity,(APCICT).
Lal, K. (1996). Information Technology, International Orientation and Performance: A

93
Case Study of Electrical and Electronic Goods Manufacturing Firms in India.
Information Economics and Policy, 8(3), 269-280.
Lal, K. (1999). Information Technology and Exports: A Case Study of Indian
Garments Manufacturing Enterprises. Zentrum für Entwiklungsforschung-ZEF.
Lawson, R., Alcock, C., Cooper, J., & Burgess, L. (2003). Factors Affecting Adoption
of Electronic Commerce Technologies by SMEs: An Australian Study. Journal
of Small Business and Enterprise Development, 10(3), 265-276.
Lee, Y., Kozar, K. A., & Larsen, K. R. T. (2003). The Technology Acceptance Model:
Past, Present, and Future. Communications of the Association for Information
Systems, 12(50), 752-780.
Liao, C., Chen, J. L., & Yen, D. C. (2007). Theory of Planning Behavior (TPB) and
Customer Satisfaction in the Continued Use of E-Service: An Integrated
Model. Computers in Human Behavior, 23(6), 2804-2822.
Limayem, M., Hirt, S. G., & Cheung, C. M. K. (2007). How Habit Limits the Predictive
Power of Intention: The Case of Information Systems Continuance. MIS
Quarterly, 31(4), 705-737.
Lin, J., Chan, H. C., & Wei, K. K. (2006). Understanding Competing Application
Usage with the Theory of Planned Behavior. Journal of the American Society
for Information Science and Technology, 57(10), 1338-1349.
Lippert, S. K. (2007). Investigating Postadoption Utilization: An Examination into the
Role of Interorganizational and Technology Trust. IEEE Transaction on
Engineering Management, 54(3), 468-483.
Lukács, E. (2005). The Economic Role of SMEs in World Economy, Especially in
Europe. European Integration Studies 1(4), 3-12.
Manochehri, N., Al-Esmail, R., & Ashrafi, R. (2012). Examining the Impact of
Information and Communication Technologies (ICT) on Enterprise Practices:
A Preliminary Perspective from Qatar. The Electronic Journal of Information
Systems in Developing Countries, 51(3), 1-16.
Manueli, K., Latu, S., & Koh, D. (2007). ICT adoption models. In 20th Annual
Conference of the National Advisory Committee on Computing Qualifications
(NACCQ 2007).
Matlay, H., & Addis, M. (2003). Adoption of ICT and E-Commerce in Small
Businesses: An HEI-Based Consultancy Perspective. Journal of Small
Business and Enterprise Eevelopment, 10(3), 321-335.
Matlay, H., & Westhead, P. (2005). Virtual Teams and the Rise of E-
94
Entrepreneurship in Europe. International Small Business Journal, 23(3), 279-
302.
Mehrtens, J., Cragg, P. B., & Mills, A. M. (2001). A Model of Internet Adoption by
SMEs. Information & Management, 39(3), 165-176.
Modimogale, L., & Kroeze, J. H. (2011). The role of ICT within Small and Medium
enterprises in South Africa. Communications of the IBIMA.
Modimogale, L., & Kroeze, J. H. (2009). Using ICTs to Become a Competitive SME
in South Africa.
Morawczynski, O., & Ngwenyama, O. (2007). Unraveling the Impact of Investments
in ICT, Education and Health on Development: An Analysis of Archival Data of
Five West African Countries Using Regression Splines. The Electronic
Journal of Information Systems in Developing Countries, 29 (5), 1-15.
Müller-Falcke, D. (2002). Use and Impact of Information and Communication
Technologies in Developing Countries' Small Businesses: Evidence from
Indian Small Scale Industry. In Development economics and policy. Frankfurt
am Main, Germany: Peter Lang Pub.
Mutula, S. M., & Van Brakel, P. (2006). E-readiness of SMEs in the ICT Sector in
Botswana with Respect to Information Access. The Electronic Library, 24(3),
402-417.
Ollo-López, A., & Aramendía-Muneta, M. E. (2012). ICT Impact on Competitiveness,
Innovation and Environment. Telematics and Informatics, 29(2), 204-210.
Orford, J., Wood, E., Fisher, C., Herrington, M., & Segal, N. (2003). Global
entrepreneurship monitor. South African executive report.
Parida, V. (2010). Achieving Competitiveness through Externally Oriented
Capabilities. An Empirical Study of Technology-Based Small Firms. Luleå
tekniska universitet. (Doctoral thesis / Luleå University of Technology).
Paul, D., & Pascale, D. (2013). Information Technology and Economic Development:
An Introduction to the Research Issues. Research Paper. Los Angeles, CA:
Sage.
Pavon, F., & Brown, I. (2010). Factors Influencing the Adoption of the World Wide
Web for Job-Seeking in South Africa: Original Research. South African
Journal of Information Management, 12(1), 1-9.
Porter, M. E. (2001). Strategy and the Internet. Harvard Business Review, 63-78.
Porter, M. E., & Millar, V. E. (1985). How Information gives you Competitive

95
Advantage. Harvard Business Review, 63, 149–160.
Regnell, B., Runeson, P., & Wohlin, C. (2000). Towards Integration of Use Case
Modelling and Usage-Based Testing. Journal of Systems and Software, 50(2),
117-130.
Ritchie, B., & Brindley, C. (2005). ICT Adoption by SMEs: Implications for
Relationships and Management. New Technology, Work and Employment,
20(3), 205-217.
Rogers, E. M. (2003). Diffusion of Innovations. New York: Free Press.
Saeed, K. A., & Muthitacharoen, A. (2008). To Send or Not to Send: An Empirical
Assessment of Error Reporting Behavior. IEEE Transaction on Engineering
Management, 55(3), 455-467.
SEDA. (2012). Analysis of the Needs, State and Performance of Small and Medium
Businesses in the Agriculture, Manufacturing, ICT and Tourism Sectors in
South Africa, Johannesburg.
Shareef, M. A., Kumar, U., Kumar, V., & Dwivedi, Y. K. (2009). Identifying critical
factors for adoption of e-government. Electronic Government, an International
Journal, 6(1), 70-96.
Son, J., & Benbasat, I. (2007). Organizational Buyers' Adoption and Use of B2B
Electronic Marketplaces: Efficiency- and Legitimacy-Oriented Perspectives.
Journal of Management Information Systems, 24(1), 55-99.
Steyn, E., Steyn, R., & De Villiers, C. (2014). Perceptions of Mobile ICT Adoption by
South Africa Micro Entrepreneurs. Proceedings of the e-Skills for Knowledge
Production and Innovation Conference 2014, Cape Town, South Africa, 467-
486
Sun, H., & Zhang, P. (2006). The Role of Moderating Factors in User Technology
Acceptance. International Journal of Human-Computer Studies, 64(2), 53-78.
Talukder, M., Harris, H., & Mapunda, G. (2008). Adoption of innovations by
individuals within organizations: An Australian study. Asia Pacific
Management Review, 13(2).
Taylor, M., & Murphy, A. (2004). SMEs and E-Business. Journal of Small Business
and Enterprise Development, 11(3), 280-289.
Thong, J. Y. L., Hong, S.-J., & Tam, K. Y. (2006). The Effects of Post-Adoption
Beliefs on the Expectation-Confirmation Model for Information Technology
Continuance. International Journal of Human-Computer Studies, 64(9), 799-
96
810.
Venkatesh, V. (2000). Determinants of Perceived Ease of Use: Integrating Control,
Intrinsic Motivation, and Emotion into the Technology Acceptance Model.
Information Systems Research, 11(4), 342.
Venkatesh, V., & Davis, F. D. (1996). A Model of the Antecedents of Perceived Ease
of Use: Development and Test. Decision Sciences, 27(3), 451-481.
Venkatesh, V., & Davis, F. D. (2000). A Theoretical Extension of the Technology
Acceptance Model: Four Longitudinal Field Studies. Management Science,
46(2), 186.
Wangwe, S., & es Salaam, D. (2007). A Review of Methodology for Assessing ICT
Impact on Development and Economic Transformation. African Economic
Research Consortium Working Papers, Paper No: ICTWP-02, 1-31.
Wu, I. L., & Chen, J. L. (2005). An Extension of Trust and TAM Model with TPB in
the Initial Adoption of On-Line Tax: An Empirical Study. International Journal
of Human-Computer Studies, 62(6), 784-808.
Wu, J. H., & Wang, S. C. (2005). What Drives Mobile Commerce?: An Empirical
Evaluation of the Revised Technology Acceptance Model. Information &
Management, 42(5), 719-729.

97
APPENDIX A: RESEARCH INSTRUMENT
A. General Information (MCQ)
Q1 How many employees are there in your organization?
1-10
11-25
26-50
51-100
>100
Q2 Years in operation?
<1
1-3
4-5
6>
Q3 Type of Industry
Food, beverages and tobacco
Textiles, clothing and leather goods
Wood and paper; publishing and printing
Petroleum products, chemicals, rubber and plastic
Other non-metal mineral products
Metals, metal products, machinery and equipment
Electrical machinery and apparatus
Radio, TV, instruments, watches and clocks
Transport equipment
Furniture; other manufacturing
Other (Please specify):
Q4 What is your highest level of education
Primary school Secondary/High school Certificate/Diploma Bachelor degree

98
Honours degree
Master’s degree or higher
Q5 What is your current position in the firm?
Owner Manager IT Other (Please specify):
B. Information and Communication Technologies in Use
Please indicate with a (X) which of the following ICTs you have
implemented in your organisation:
ICT in
Place Intend To No Intention
General-Use ICTs :
VoIP
Internet Access and email
Telephone (landline)
Fax
Production-Integrating ICTs:
Enterprise Resource Planning
System
Customer Relationship
Management System
Supply Chain Management
System
Intranet

99
Open Source Software
Mobile Payment System
Finance & Accounting Software
Document management software
(DMS)
Inventory management software
Cloud Computing
Market-Oriented ICTs:
Organisational Website
Other (Please Specify):
C. Perceived value added through ICT Use
The following questions refer to your experience with the adopted and
implemented ICTs. Please mark the most relevant option:
Strongly
Disagree
1
Disagree
2
Neutral
3
Agree
4
Strongly
Agree
5

100
1. Operational costs have decreased since the ICT has
been adopted 1 2 3 4 5
2. I have experienced increased efficiency of tasks since
ICT implementation 1 2 3 4 5
3. Our quality of service has improved due to ICT 1 2 3 4 5
4. The organization has become more effective since the
adoption of ICT 1 2 3 4 5
5. The organization has become more marketable 1 2 3 4 5
6. Customer base has increased 1 2 3 4 5
7. Increased revenue since implementation 1 2 3 4 5
8. Customer satisfaction has increased 1 2 3 4 5
9. Business processes are more efficient, tasks are
performed quicker 1 2 3 4 5
10. Turnaround time has improved 1 2 3 4 5
11. Organization has become more profitable 1 2 3 4 5
12. Relationships with suppliers have been improved 1 2 3 4 5
13. Stock levels are always up to date 1 2 3 4 5
14. Organizational goals are being met with more ease 1 2 3 4 5
15. Short term targets are more achievable 1 2 3 4 5

101
16. Product quality has been improved 1 2 3 4 5
17. Staff morale has increased 1 2 3 4 5
18. Communication within the organisation has improved 1 2 3 4 5
19. Scheduling has become more efficient 1 2 3 4 5
20. Employees are able to work from remote locations 1 2 3 4 5
D. Barriers to ICT Use
The following questions refer to the barriers your SME experienced in
adopting ICT. Please mark the most relevant option:
Strongly
disagree
1
Disagree
2
Neutral
3
Agree
4
Strongly
agree
5
1. Employees IT skill level was too low 1 2 3 4 5
2. ICTs too expensive 1 2 3 4 5
3. Low level of existing hardware technology in place 1 2 3 4 5

102
4. Organisation required immediate ROI, ICT implementation would not deliver this result
1 2 3 4 5
5. Resistance to change within the organisation 1 2 3 4 5
6. Employees satisfaction with traditional technologies 1 2 3 4 5
7. Time constraints 1 2 3 4 5
8. Lack of awareness about the benefits of ICT 1 2 3 4 5
9. Security concerns 1 2 3 4 5
10. Business partners, suppliers and customers do not make use of ICT
1 2 3 4 5
11. ICT applications are not tailored to the way SMEs do business
1 2 3 4 5
12. No access to ICT infrastructures (e.g. electricity, telephone lines etc)
1 2 3 4 5
13. Unreliable service providers 1 2 3 4 5
14. Government regulations 1 2 3 4 5
Other Barriers (Please Specify):

103
APPENDIX B: Consistency matrix
The purpose of the study is to investigate to what extent SMEs in South Africa are making use of ICT and the barriers to ICT
adoption amongst SMEs in the manufacturing sector.
Sub-problems Literature review Hypotheses Source of data Type of data
Analysis
To understand the existing use of ICT by SMEs
DTI, 2003 Ismail et al., 2011 Jentzsch & Miniotas, 1999 SEDA, 2012 Vosloo, 1994
H3: Most SMEs make use of general-use ICTs
Online questionairre Section B Information and Communication Technologies in Use
Ordinal Quantitative: Data from respondents of the survey will be documented, coded and processed with SPSS Statistical Package. The data will be analysed using descriptive statistics, and will include mean, standard deviation, frequencies and percentages. Will be used to elicit information on the ICT adoption patterns of the respondents.
Determine the barriers to ICT adoption and use
Arendt, 2008 MacGregor et al, 2003 Modimogale, 2008
H4: External
factors are the greatest barriers to ICT adoption amongst SMEs
Online questionairre Section D Barriers to ICT
Ordinal Quantitative: Data from respondents of the survey will be documented, coded and processed with Statistical Analysis Software (SAS).
104
Mutula & Van Brakel, 2007 Ngwenyama & Morawczynski, 2007 Vrazalic, Stern,
H5: Internal
factors are the greatest barriers to ICT adoption amongst SMEs H6: Owners or managers with a higher education level have a higher ICT adoption rate within their businesses
Use Questions 1-13
Logistic regression analysis will be used to evaluate factors influencing ICT adoption choices in the SME sector. Correlation analysis will be used to evaluate the relationship between owner/manager education levels and ICT adoption.
Determine value perceived from the use of ICT in South African SMEs
Porter, 1985 Porter & Millar, 1985 Selwyn, 2002 Taylor & Murphy, 2004 Wangwe, 2007
H1: ICTs are
perceived by SMEs to add value to their business. H2: Perceived value of ICT has a positive effect on its adoption and use by SMEs
Online questionairre Section C Perceived Value Added Through ICT Use Questions 1-20
Ordinal Quantitative: Quantitative data from respondents of the survey will be documented, coded and processed with Statistical Analysis Software (SAS). Correlation analysis will be used to assess the perceived value of ICT adoption on SMEs usage.

105
APPENDIX C: Instrument Consent form
MM RESEARCH CONSENT FORM
Barriers to Information, Communication Technology (ICT) adoption and use
amongst SMEs: A study of the South African manufacturing sector.
INFORMATION SHEET AND CONSENT FORM
Who I am
Hello, my name is Priyal Pillay and I am conducting research for the purpose of
completing my MM at Wits Business School.
What I am doing
I am conducting research on identifying the Barriers to ICT adoption amongst SMEs
in South Africa.
Confidentiality
Any study records that identify you will be kept confidential to the extent possible by
law. The records from your participation may be reviewed by people responsible for
making sure that the research is done properly, including my academic supervisor/s.
(All of these people are required to keep your identity confidential.)
All study records will be destroyed after the completion and marking of my thesis.

106
Risks/discomforts
At the present time, I do not see any risks in your participation..
Benefits
There are no immediate benefits to you from participating in this study. However, this
study will be extremely helpful to us in understanding existing barriers to ICT
adoption amongst SMEs.
If you would like to receive feedback on the study, I can send you the results of the
study when it is completed sometime after July 2016.
Who to contact if you have been harmed or have any concerns
The Wits Business School has approved this research. If you have any complaints
about ethical aspects of the research or feel that you have been harmed in any way by
participating in this study, please contact the Research Office Manager at the Wits
Business School, Mmabatho Leeuw. [email protected]
If you have concerns or questions about the research you may call my academic
research supervisor Jose Barerreira (011 907 1755/6).
CONSENT
I hereby agree to participate in research on identifying the barriers to ICT adoption
amongst SMEs in South Africa. I understand that I am participating freely and
without being forced in any way to do so. I also understand that I can stop
participating at any point should I not want to continue and that this decision will not
in any way affect me negatively.
-I understand that this is a research project whose purpose is not necessarily to benefit
me personally in the immediate or short term.
-I understand that my participation will remain confidential.
I accept