barry callebaut · world’s largest supplier of gourmet & specialties chocolate for artisanal...
TRANSCRIPT
July 2010 Barry Callebaut - Roadshow presentation
Barry Callebaut 9-month key sales figures 2009/10
July 2010

July 2010 Barry Callebaut - Roadshow presentation 2
Agenda
Barry Callebaut at a glance
Highlights 9 months 2009-2010
Outlook
July 2010 Barry Callebaut - Roadshow presentation 3
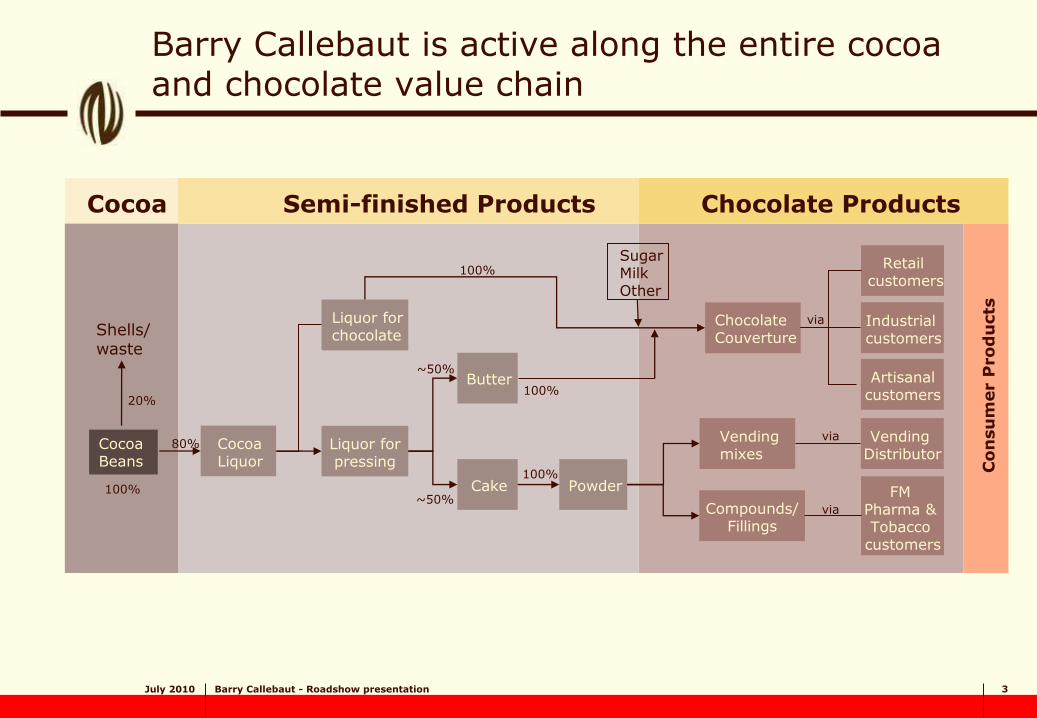
Barry Callebaut is active along the entire cocoa and chocolate value chain
Cocoa Chocolate Products Semi-finished Products
Cocoa Beans
Cocoa Liquor
Liquor for pressing
Liquor for chocolate
Butter
Cake Powder
Sugar Milk Other
Chocolate Couverture
Vending mixes
Compounds/ Fillings
Retail customers
Industrial customers
Artisanal customers
Vending Distributor
FM Pharma & Tobacco
customers
100%
Shells/ waste
20%
80%
~50%
~50%
100%
100%
100%
via
via
via
Co
nsu
mer P
ro
du
cts
July 2010 Barry Callebaut - Roadshow presentation 4
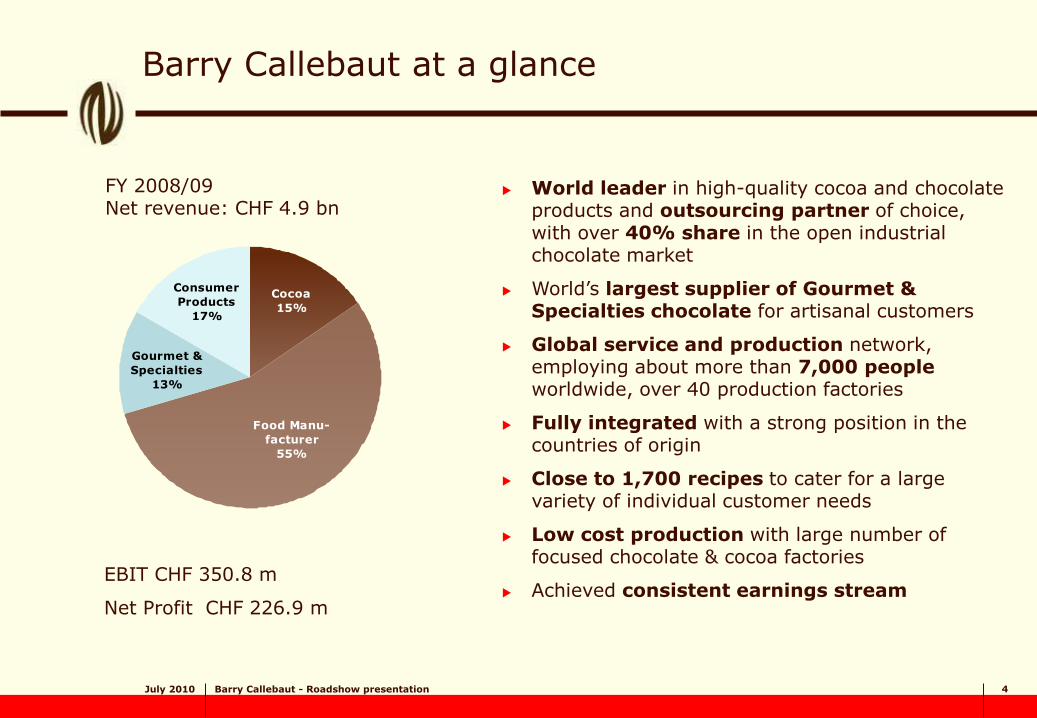
FY 2008/09 Net revenue: CHF 4.9 bn
Barry Callebaut at a glance
EBIT CHF 350.8 m
Net Profit CHF 226.9 m
11 %
52 %
23 %
World leader in high-quality cocoa and chocolate products and outsourcing partner of choice, with over 40% share in the open industrial chocolate market
World’s largest supplier of Gourmet & Specialties chocolate for artisanal customers
Global service and production network, employing about more than 7,000 people worldwide, over 40 production factories
Fully integrated with a strong position in the countries of origin
Close to 1,700 recipes to cater for a large variety of individual customer needs
Low cost production with large number of focused chocolate & cocoa factories
Achieved consistent earnings stream
Consumer
Products
17%
Gourmet &
Specialties
13%
Food Manu-
facturer
55%
Cocoa
15%
July 2010 Barry Callebaut - Roadshow presentation 5
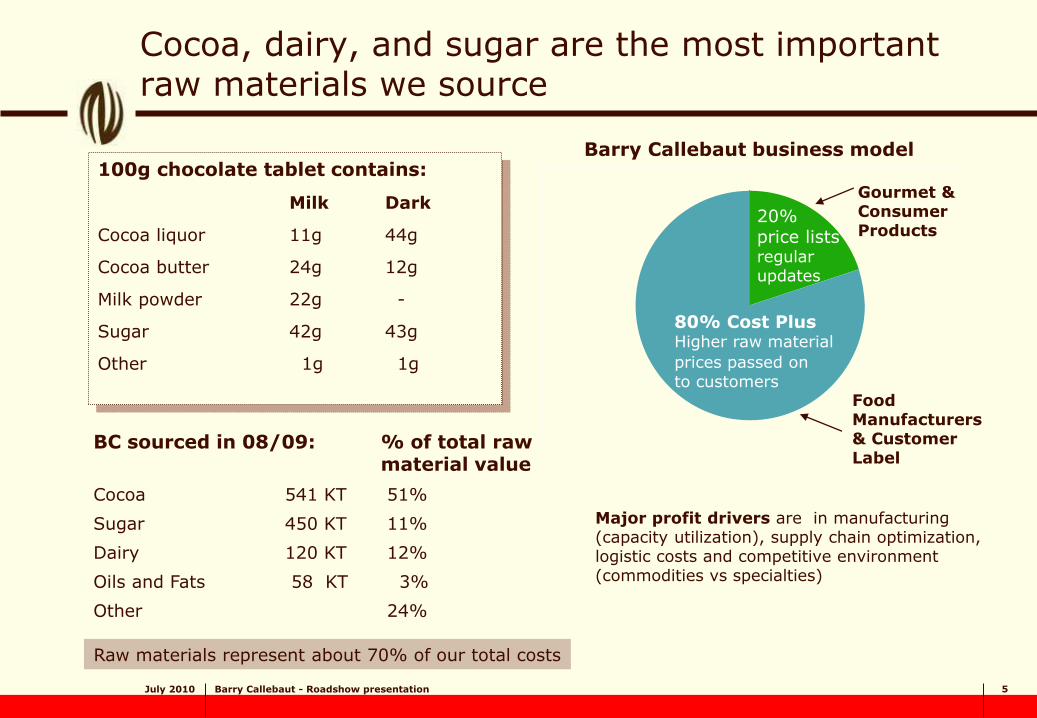
Cocoa, dairy, and sugar are the most important raw materials we source
100g chocolate tablet contains:
Milk Dark
Cocoa liquor 11g 44g
Cocoa butter 24g 12g
Milk powder 22g -
Sugar 42g 43g
Other 1g 1g
BC sourced in 08/09: % of total raw material value
Cocoa 541 KT 51%
Sugar 450 KT 11%
Dairy 120 KT 12%
Oils and Fats 58 KT 3%
Other 24%
Major profit drivers are in manufacturing (capacity utilization), supply chain optimization, logistic costs and competitive environment (commodities vs specialties)
Barry Callebaut business model
Gourmet & Consumer Products
Food Manufacturers & Customer Label
80% Cost Plus Higher raw material
prices passed on to customers
20% price lists regular updates
Raw materials represent about 70% of our total costs
July 2010 Barry Callebaut - Roadshow presentation 6
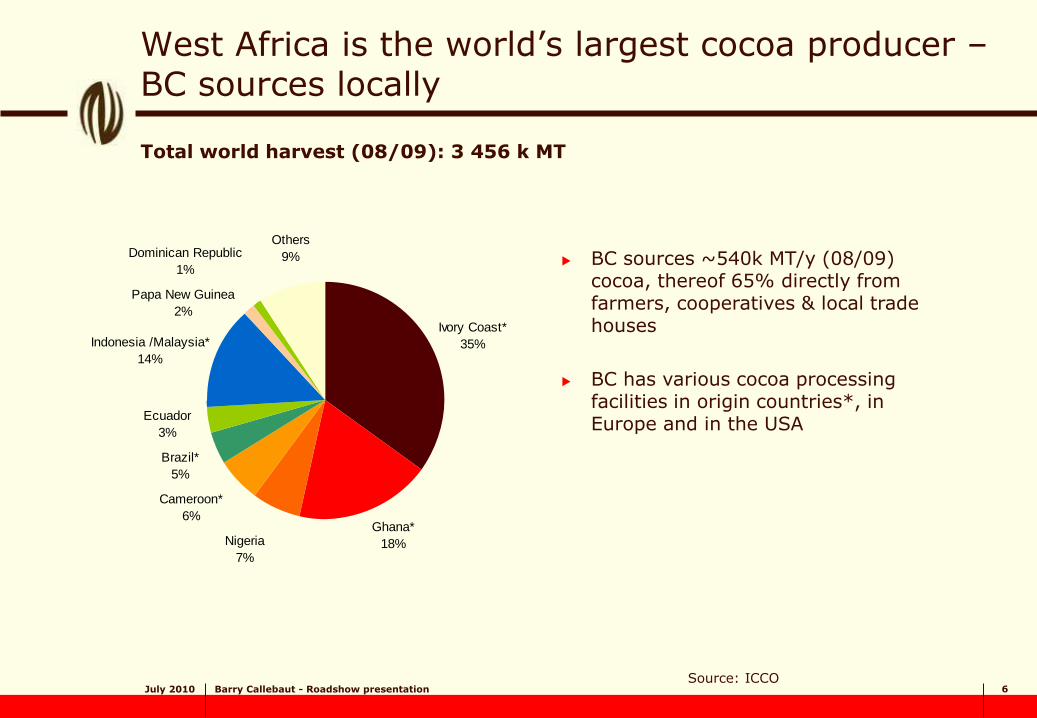
West Africa is the world’s largest cocoa producer – BC sources locally
BC sources ~540k MT/y (08/09) cocoa, thereof 65% directly from farmers, cooperatives & local trade houses
BC has various cocoa processing facilities in origin countries*, in Europe and in the USA
Source: ICCO
World total harvest: (08/09): 3456 K MT
Ivory Coast*
35%
Ghana*
18%Nigeria
7%
Cameroon*
6%
Brazil*
5%
Ecuador
3%
Indonesia /Malaysia*
14%
Papa New Guinea
2%
Dominican Republic
1%
Others
9%
Total world harvest (08/09): 3 456 k MT
July 2010 Barry Callebaut - Roadshow presentation 7
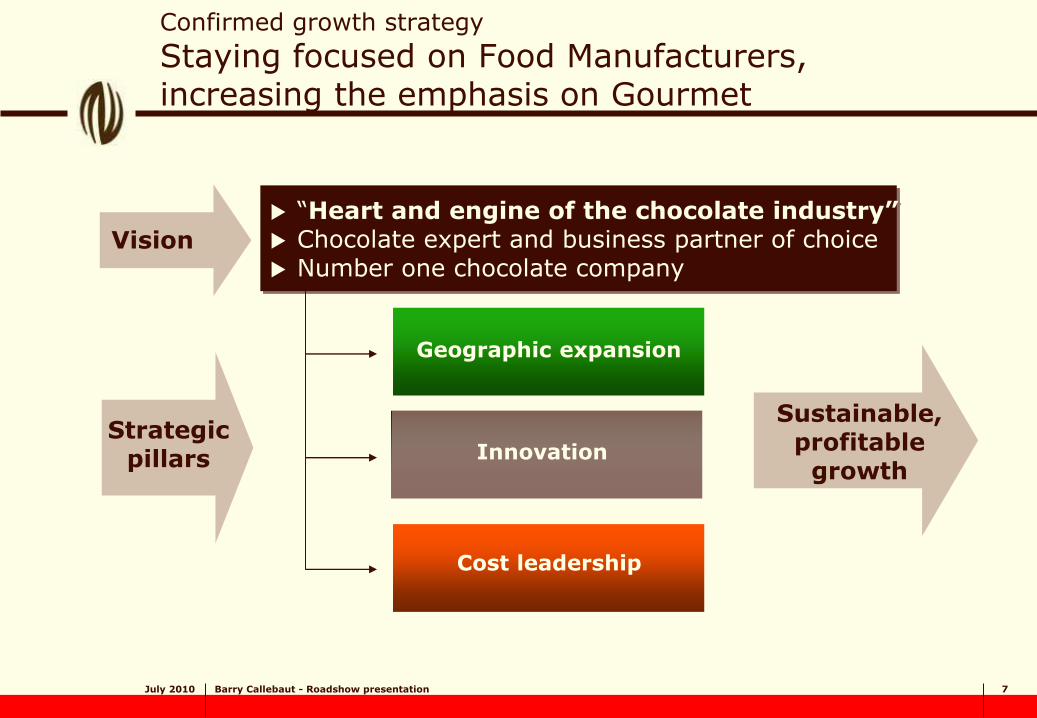
Confirmed growth strategy
Staying focused on Food Manufacturers, increasing the emphasis on Gourmet
“Heart and engine of the chocolate industry” Chocolate expert and business partner of choice Number one chocolate company
Vision
Geographic expansion
Innovation
Cost leadership
Strategic pillars
Sustainable, profitable
growth
July 2010 Barry Callebaut - Roadshow presentation 8
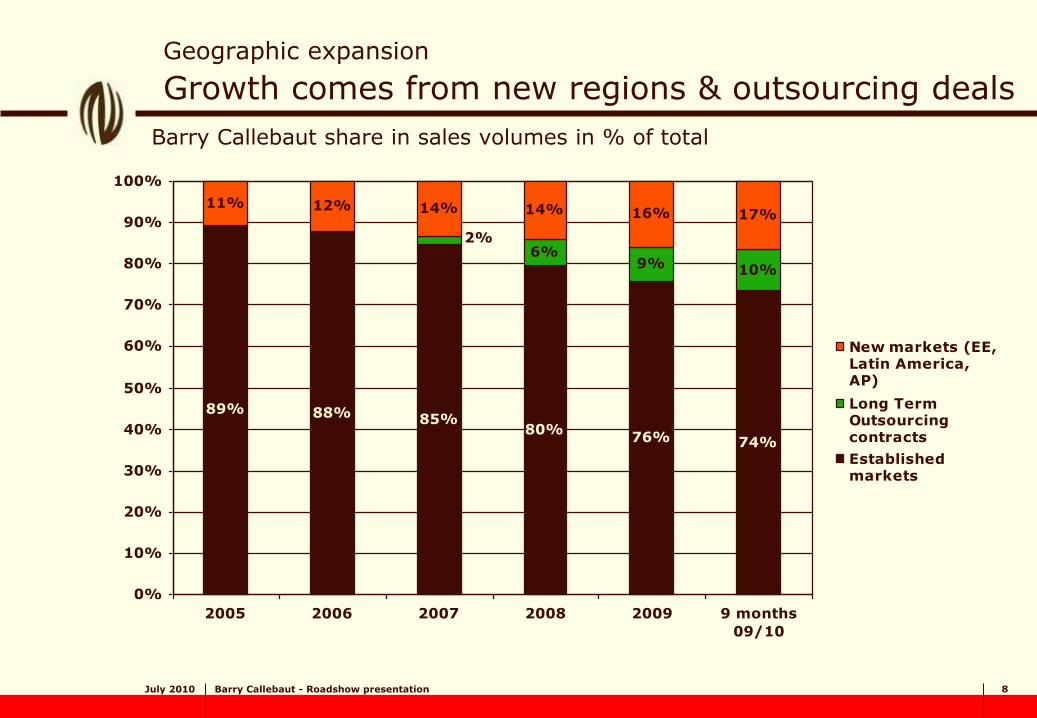
89% 88% 85%80%
76% 74%
6%9% 10%
11% 12% 14% 14% 16% 17%
2%
0%
10%
20%
30%
40%
50%
60%
70%
80%
90%
100%
2005 2006 2007 2008 2009 9 months
09/10
New markets (EE,Latin America,AP)
Long TermOutsourcingcontracts
Establishedmarkets
Barry Callebaut share in sales volumes in % of total
Geographic expansion Growth comes from new regions & outsourcing deals

July 2010 Barry Callebaut - Roadshow presentation 9
Convenience
Experience Health
Origins Fair trade Chili, honey High cocoa content
Food on-the-go Snacking Higher melting point
Organic
Polyphenols Anti-aging Memory Heart and veins
Less sugar
Less fat and still natural
Mycryo
Ethics
Corporate Social Responsibility Environmental policy Support for cocoa farmers and families in origin countries
Innovation:
BC focuses on major food trends…

July 2010 Barry Callebaut - Roadshow presentation 10
Cost leadership
Factory costs on per tonne activity down by 5%*
Capacity utilization for liquid chocolate: up from 79.4% to 82.5%
Energy consumption per tonne activity: down by 7%
CO2 per tonne activity down by 5.4%
Headcount in factories and logistics: down by -4.7% despite volume
increase, i.e. significant productivity improvement
Maintenance costs per tonne activity: down -3% at constant exchange
rates
* At constant currencies
E

July 2010 Barry Callebaut - Roadshow presentation 11
Three main growth drivers support our strategy
… … Outsourcing
• Chocolate players currently outsource 10-12% of their total production, with high potential to be increased
… Gourmet
• The Professional segment is a very fragmented market to be further developed. Currently only 13% of BC‘s business.
…
Emerging Markets
• Focus on Eastern Europe, Asia, Brazil and Mexico
July 2010 Barry Callebaut - Roadshow presentation 12
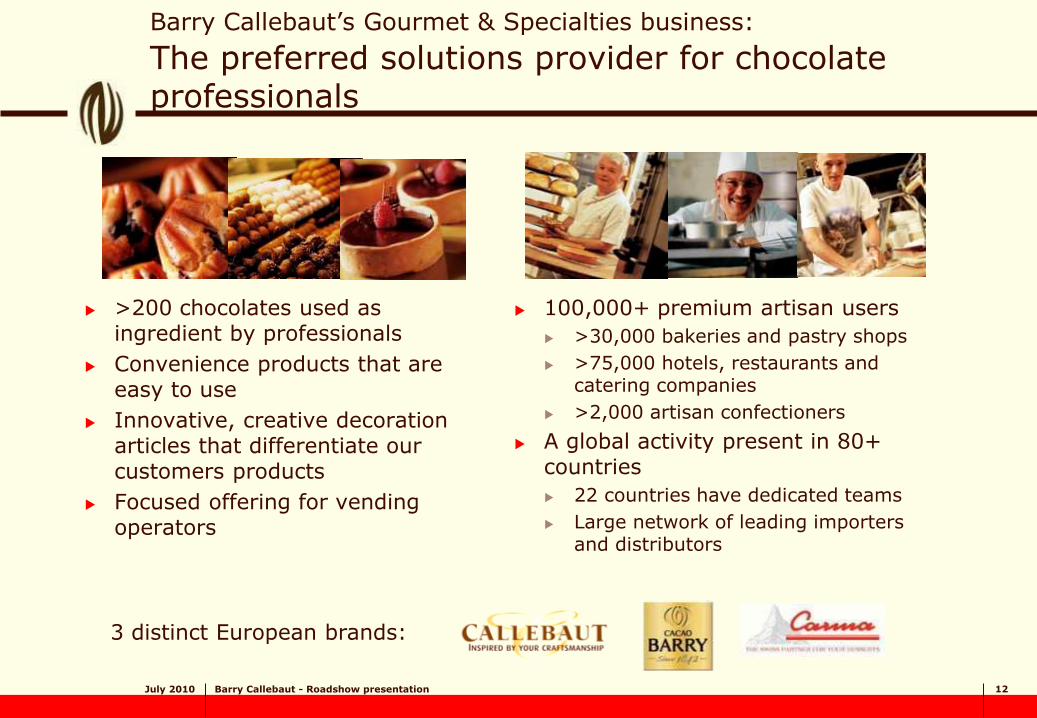
Barry Callebaut’s Gourmet & Specialties business: The preferred solutions provider for chocolate professionals
>200 chocolates used as ingredient by professionals
Convenience products that are easy to use
Innovative, creative decoration articles that differentiate our customers products
Focused offering for vending operators
100,000+ premium artisan users
>30,000 bakeries and pastry shops
>75,000 hotels, restaurants and catering companies
>2,000 artisan confectioners
A global activity present in 80+ countries
22 countries have dedicated teams
Large network of leading importers and distributors
Picture 1 to be added: our products
Picture 2 to be added: our customers
3 distinct European brands:

July 2010 Barry Callebaut - Roadshow presentation 13
Source: BC Estimates – 2009
Top 10 Manufacturers of Industrial Chocolate
(in '000 tonnes) Global industrial chocolate
production estimated at 5.5 million tonnes pa.
Top five players account for about half of this volume
Top 5 consumer chocolate players currently outsource on average 12% of their chocolate production
Expected to increase to 20-40% over the next 5 years, or additional outsourcing potential of 250-500,000 tonnes
Outsourcing
Additional market outsourcing potential between 250,000 and 500,000 tonnes
0 200 400 600 800 1000 1200
Ferrero
Lindt
ADM
Blommer
Cargill
Hershey's
Nestlé
Mars
Kraft / Cadbury
Barry Callebaut
Integrated Sold to 3rd pty Outsourced
July 2010 Barry Callebaut - Roadshow presentation 14
Take out complexity of their own production
Cost leadership in the chocolate production
Access to new technologies
Access to innovative processes /products /research
Quality management and highly flexible production
Focus resources on brand / marketing
Less capital intense process
Global networking outweighs insourcing historical roots
Same level of traceability
Avoid new capacity investments
Access to special origin beans/fair trade /organic, etc
Outsourcing
Rationale for chocolate players to outsource

July 2010 Barry Callebaut - Roadshow presentation 15 15
Market
Benefit from strong presence in mature markets but untapping opportunities in emerging markets
Source: Euromonitor
Global Chocolate Market
Gourmet
-1.0
-
1.0
2.0
3.0
4.0
5.0
6.0
-1.0% 0.0% 1.0% 2.0% 3.0% 4.0% 5.0%
CAGR 2009-2014 (Volume)
Co
nsu
mp
tio
n p
er c
apit
a (k
g)
Australasia
Latin America
Middle East and
Africa
Asia
Pacific
Eastern Europe
Western Europe North America

July 2010 Barry Callebaut - Roadshow presentation 16
Agenda
Barry Callebaut at a glance
Highlights 9 months 2009-2010
Outlook
July 2010 Barry Callebaut - Roadshow presentation 17
Highlights first nine months
In the third quarter sales volumes further accelerated supported by all regions, while world chocolate confectionery market was flat in volume terms
Growth supported by geographic expansion, increased focus in Gourmet, implementation of outsourcing volumes and market share gains
Sales volumes: 975,044 tonnes Third quarter: +11.3%
Year-to-date: +8.9%
Sales revenue: CHF 3,926.4 million Third quarter: +19.4% in local currencies (in CHF +15.9%)
Year-to-date: +11.7% in local currencies (in CHF +7.9%)
Financial targets for current fiscal year and mid-term confirmed
July 2010 Barry Callebaut - Roadshow presentation 18
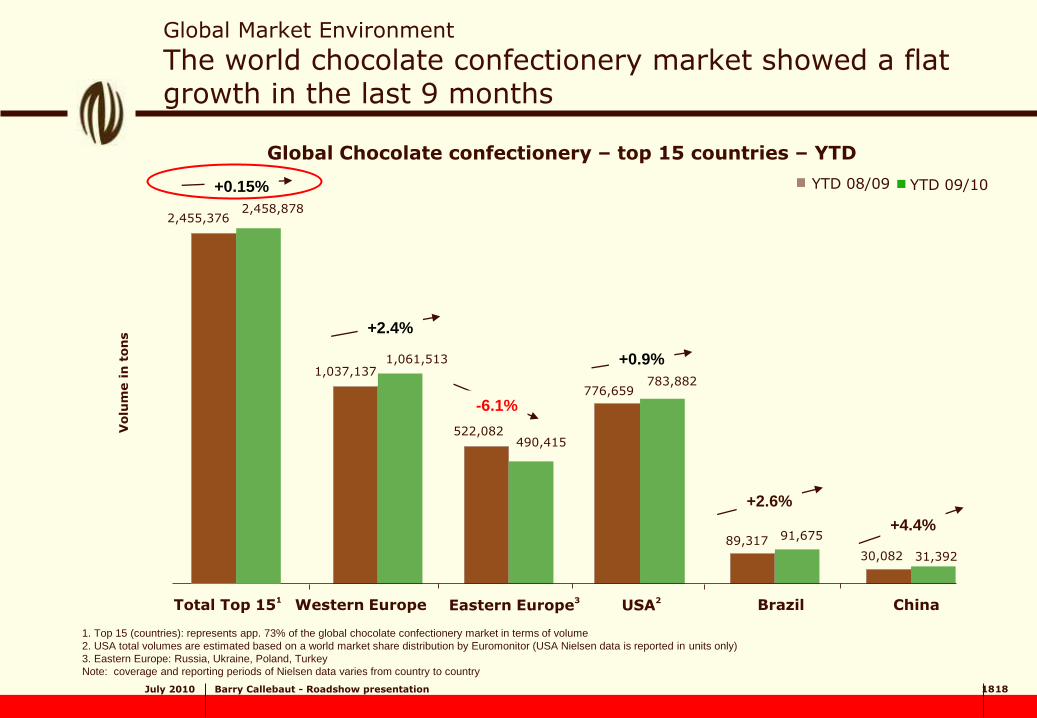
Global Market Environment
The world chocolate confectionery market showed a flat growth in the last 9 months
18
1. Top 15 (countries): represents app. 73% of the global chocolate confectionery market in terms of volume
2. USA total volumes are estimated based on a world market share distribution by Euromonitor (USA Nielsen data is reported in units only)
3. Eastern Europe: Russia, Ukraine, Poland, Turkey
Note: coverage and reporting periods of Nielsen data varies from country to country
1,037,137
30,082
89,317
776,659
522,082
1,061,513
31,392
91,675
783,882
490,415
Western Europe Eastern Europe3 Brazil China
Volu
me i
n t
on
s +2.4%
+0.9%
+2.6%
-6.1%
2,455,376 2,458,878
+0.15%
Global Chocolate confectionery – top 15 countries – YTD
YTD 08/09 YTD 09/10
Total Top 151 USA
2
+4.4%
July 2010 Barry Callebaut - Roadshow presentation 19
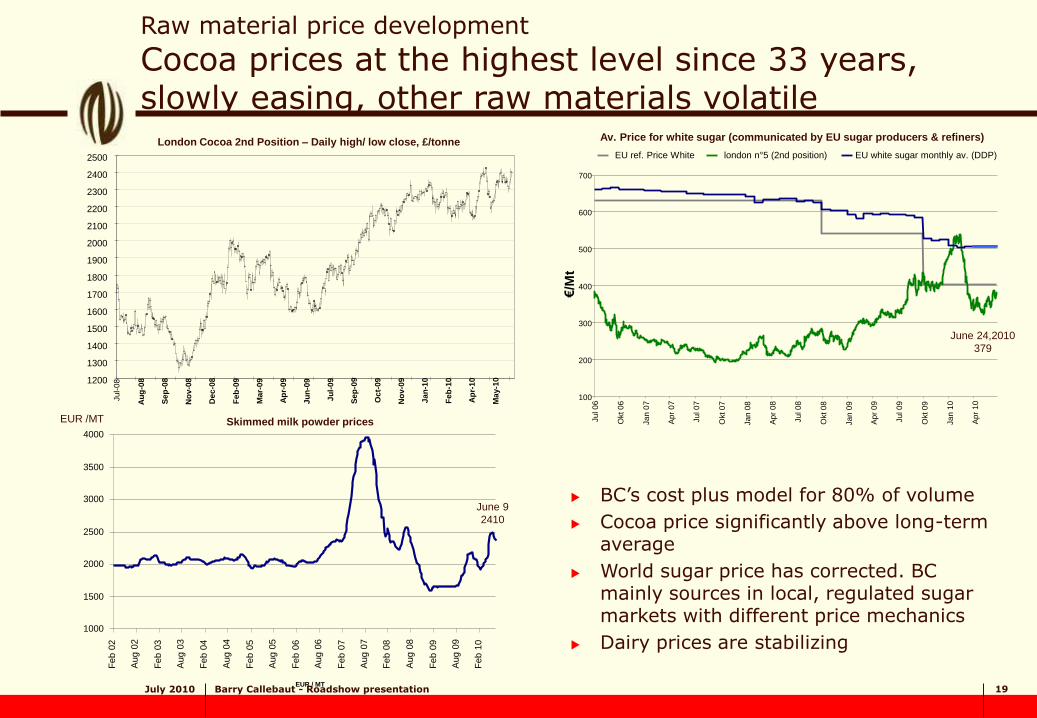
London Cocoa 2nd Position – Daily high/ low close, £/tonne
Skimmed milk powder prices
Av. Price for white sugar (communicated by EU sugar producers & refiners)
BC’s cost plus model for 80% of volume
Cocoa price significantly above long-term average
World sugar price has corrected. BC mainly sources in local, regulated sugar markets with different price mechanics
Dairy prices are stabilizing
Raw material price development
Cocoa prices at the highest level since 33 years, slowly easing, other raw materials volatile
EUR /MT
June 24,2010
379
1200
1300
1400
1500
1600
1700
1800
1900
2000
2100
2200
2300
2400
2500
Ju
l-0
8
Au
g-0
8
Se
p-0
8
No
v-0
8
Dec
-08
Fe
b-0
9
Ma
r-0
9
Ap
r-0
9
Ju
n-0
9
Ju
l-0
9
Se
p-0
9
Oc
t-0
9
No
v-0
9
Ja
n-1
0
Fe
b-1
0
Ap
r-1
0
Ma
y-1
0
100
200
300
400
500
600
700
Ju
l 0
6
Okt 0
6
Ja
n 0
7
Ap
r 0
7
Ju
l 0
7
Okt 0
7
Ja
n 0
8
Ap
r 0
8
Ju
l 0
8
Okt 0
8
Ja
n 0
9
Ap
r 0
9
Ju
l 0
9
Okt 0
9
Ja
n 1
0
Ap
r 1
0
€/M
t
EU ref. Price White london n°5 (2nd position) EU white sugar monthly av. (DDP)
1000
1500
2000
2500
3000
3500
4000
Feb 0
2
Aug 0
2
Feb 0
3
Aug 0
3
Feb 0
4
Aug 0
4
Feb 0
5
Aug 0
5
Feb 0
6
Aug 0
6
Feb 0
7
Aug 0
7
Feb 0
8
Aug 0
8
Feb 0
9
Aug 0
9
Feb 1
0
EUR / MT
June 9
2410
July 2010 Barry Callebaut - Roadshow presentation 20
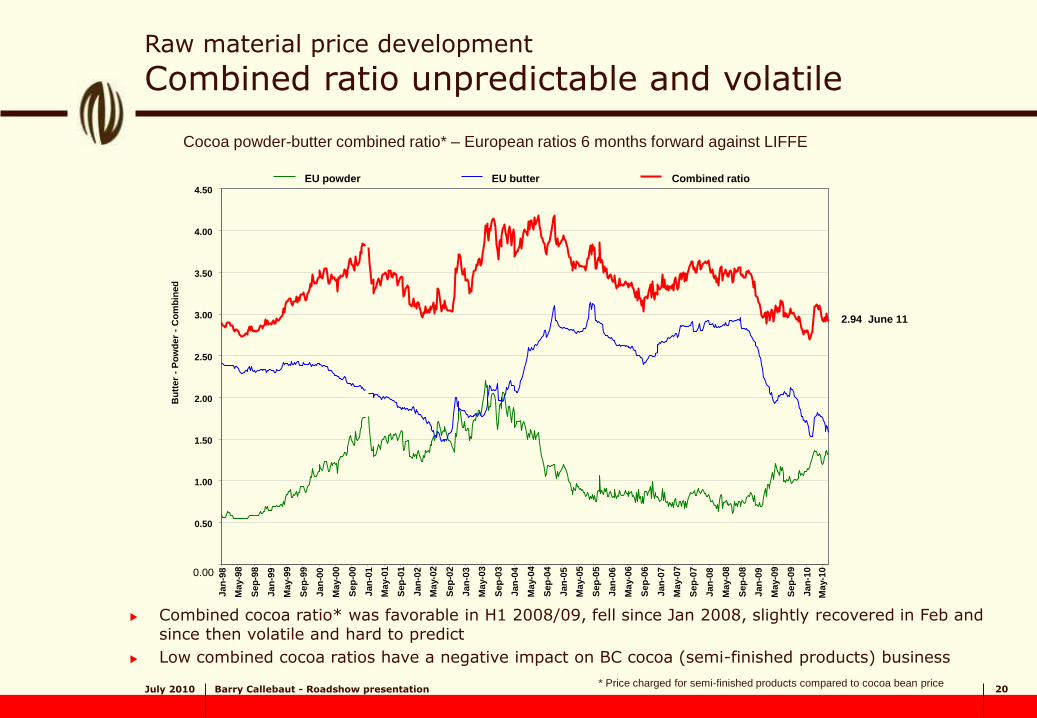
Cocoa powder-butter combined ratio* – European ratios 6 months forward against LIFFE
Combined cocoa ratio* was favorable in H1 2008/09, fell since Jan 2008, slightly recovered in Feb and since then volatile and hard to predict
Low combined cocoa ratios have a negative impact on BC cocoa (semi-finished products) business
* Price charged for semi-finished products compared to cocoa bean price
Raw material price development
Combined ratio unpredictable and volatile
2.94 June 11
0.00
0.50
1.00
1.50
2.00
2.50
3.00
3.50
4.00
4.50
Jan
-98
May-9
8
Sep
-98
Jan
-99
May-9
9
Sep
-99
Jan
-00
May-0
0
Sep
-00
Jan
-01
May-0
1
Sep
-01
Jan
-02
May-0
2
Sep
-02
Jan
-03
May-0
3
Sep
-03
Jan
-04
May-0
4
Sep
-04
Jan
-05
May-0
5
Sep
-05
Jan
-06
May-0
6
Sep
-06
Jan
-07
May-0
7
Sep
-07
Jan
-08
May-0
8
Sep
-08
Jan
-09
May-0
9
Sep
-09
Jan
-10
May-1
0
Bu
tter
- P
ow
der
- C
om
bin
ed
EU powder EU butter Combined ratio

July 2010 Barry Callebaut - Roadshow presentation 21
Volumes – 9 month
Volume growth further accelerated and all regions contributed to growth
Change in %
9 months 09/10
9 months 08/09
Group
+8.9% 975.0 895.4
Global Sourcing & Cocoa
+9.4% 156.9 143.4
Europe +5.5% 572.0 542.3
Americas +16.8% 210.5 180.2
Asia-Pacific +20.9% 35.5 29.4
Sales volume in ‘000 Metric tonnes Sales volumes up 8.9% in a
flat chocolate market and coming from a positive growth base
BC in Europe maintained its growth momentum, although the market in Eastern Europe still lags behind
Americas supported by strong growth of the corporate accounts and further implementation of outsourcing volumes
Strong performance of Asia on both Gourmet and FM, on a still low basis
July 2010 Barry Callebaut - Roadshow presentation 22
mt
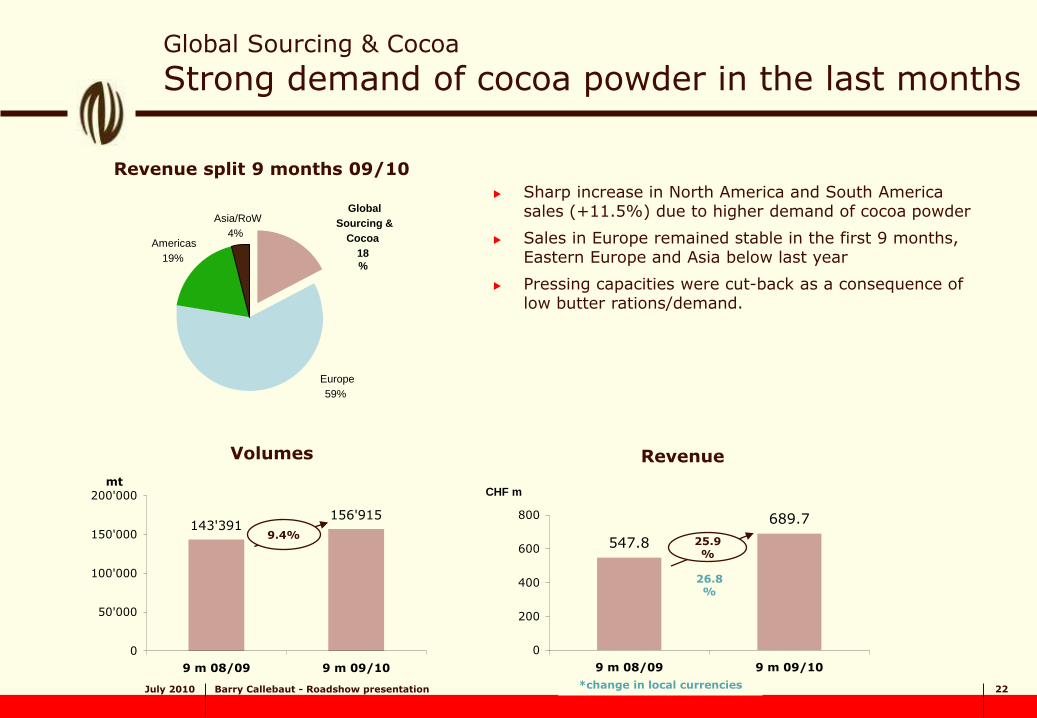
143'391156'915
0
50'000
100'000
150'000
200'000
9 m 08/09 9 m 09/10
547.8
689.7
0
200
400
600
800
9 m 08/09 9 m 09/10
CHF m
Global Sourcing & Cocoa
Strong demand of cocoa powder in the last months
Volumes
Revenue split 9 months 09/10
Revenue
*change in local currencies
Sharp increase in North America and South America
sales (+11.5%) due to higher demand of cocoa powder
Sales in Europe remained stable in the first 9 months, Eastern Europe and Asia below last year
Pressing capacities were cut-back as a consequence of low butter rations/demand.
9.4% 25.9%
26.8%
Americas
19%
Asia/RoW
4%
Europe
59%
Global
Sourcing &
Cocoa
18
%
July 2010 Barry Callebaut - Roadshow presentation 23
Region Europe
Maintained growth momentum in a flat market
Volumes Revenue
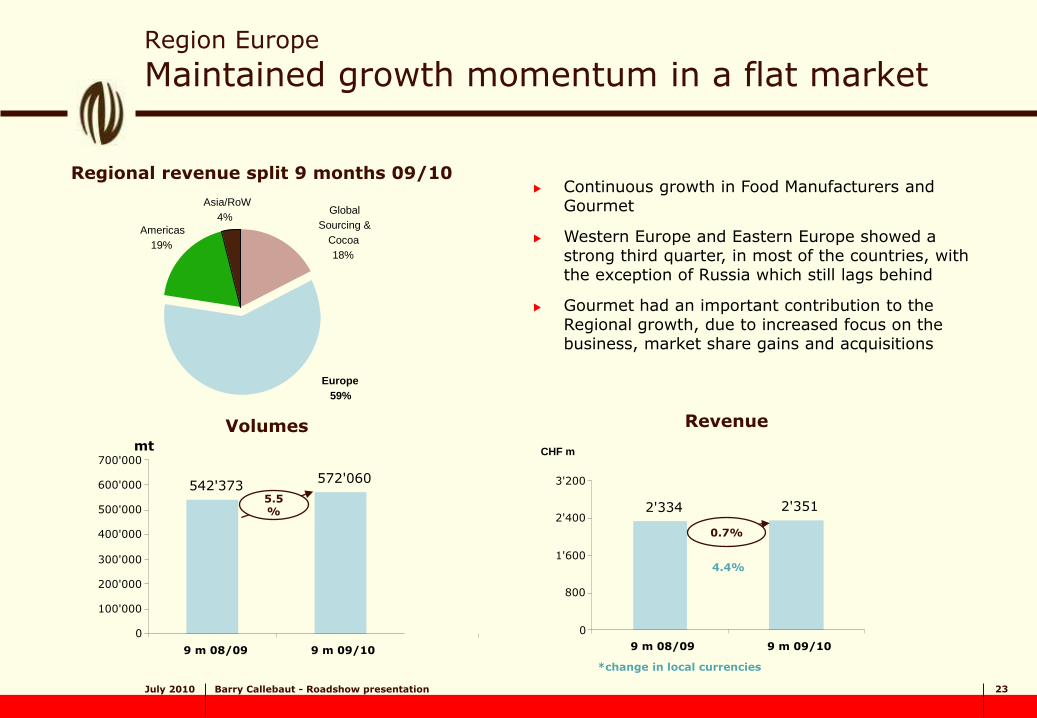
Continuous growth in Food Manufacturers and Gourmet
Western Europe and Eastern Europe showed a strong third quarter, in most of the countries, with the exception of Russia which still lags behind
Gourmet had an important contribution to the Regional growth, due to increased focus on the business, market share gains and acquisitions
Regional revenue split 9 months 09/10
mt
542'373 572'060
0
100'000
200'000
300'000
400'000
500'000
600'000
700'000
9 m 08/09 9 m 09/10
2'334 2'351
0
800
1'600
2'400
3'200
9 m 08/09 9 m 09/10
CHF m
5.5%
0.7%
Global
Sourcing &
Cocoa
18%
Americas
19%
Asia/RoW
4%
Europe
59%
*change in local currencies
4.4%
July 2010 Barry Callebaut - Roadshow presentation 24
mt
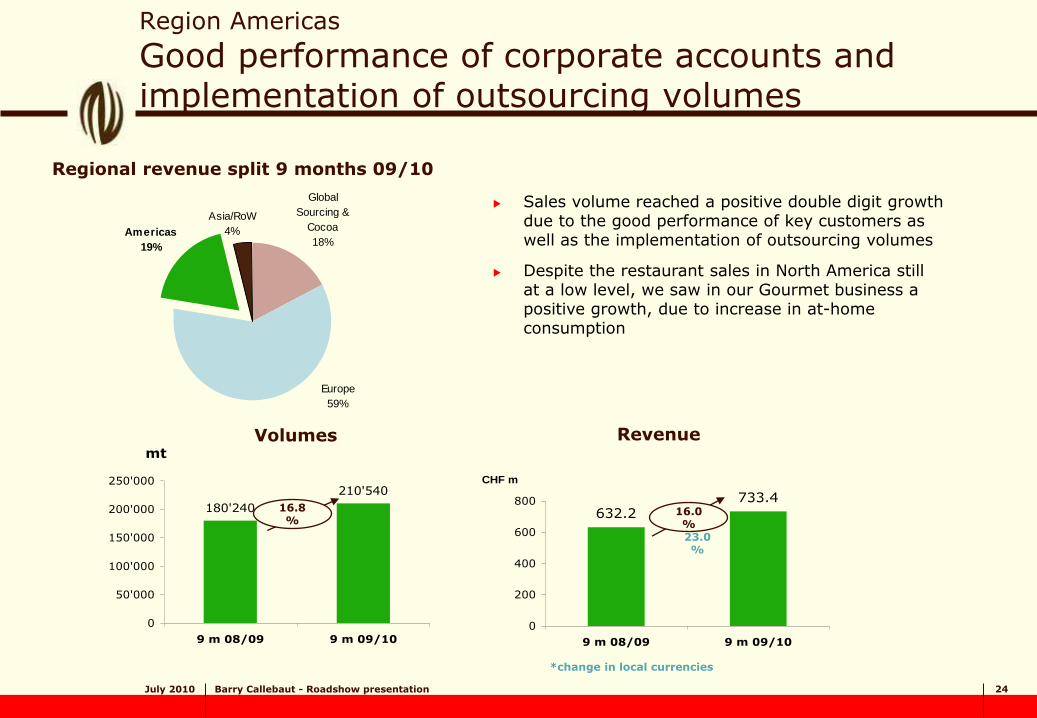
180'240
210'540
0
50'000
100'000
150'000
200'000
250'000
9 m 08/09 9 m 09/10
632.2733.4
0
200
400
600
800
9 m 08/09 9 m 09/10
CHF m
0
100'000
200'000
300'000
400'000
500'000
600'000
700'000
9 m 08/09 9 m 09/10
0
800
1'600
2'400
3'200
9 m 08/09 9 m 09/10
Region Americas
Good performance of corporate accounts and implementation of outsourcing volumes
Regional revenue split 9 months 09/10
Sales volume reached a positive double digit growth due to the good performance of key customers as well as the implementation of outsourcing volumes
Despite the restaurant sales in North America still at a low level, we saw in our Gourmet business a positive growth, due to increase in at-home consumption
Global
Sourcing &
Cocoa
18%
Asia/RoW
4%Americas
19%
Europe
59%
Volumes Revenue
*change in local currencies
16.8%
16.0% 23.0%

July 2010 Barry Callebaut - Roadshow presentation 25
Region Asia/Rest of World
Increased volumes, high demand in Gourmet & Specialties
Volumes Revenue
Food Manufacturers growth driven by geographical expansion: Korea, Australia, Japan, Thailand, Malaysia.
Further phased in outsourcing volumes in Japan
Gourmet strong increase in all countries and all brands (international and local). Bakery segment has improved
Markets in general are growing, however Korea and Japan are flat. Competitors move into Asia as market is attractive. BC benefits from being one of the first movers in that Region.
Regional revenue split 9 months 09/10
Global
Sourcing &
Cocoa
18%
Asia/RoW
4%
Europe
59%
Americas
19%
mt
29'387
35'529
0
5'000
10'000
15'000
20'000
25'000
30'000
35'000
40'000
9 m 08/09 9 m 09/10
125.3
152.4
0
50
100
150
200
9 m 08/09 9 m 09/10
CHF m
20.9%
21.6%
*change in local currencies
25.0%
July 2010 Barry Callebaut - Roadshow presentation 26
Agenda
Barry Callebaut at a glance
Highlights 9 months 2009-2010
Outlook

July 2010 Barry Callebaut - Roadshow presentation 27
Outlook:
Financial targets for 3-year period 2009/10-2011/12
Annual growth targets on average* for 2009/10 through 2011/12:
Volumes: 6-8%
EBIT: at least in line with volume growth
*Our view for the 2009-2012 period reflects current economic forecasts for the markets we operate in as well as
internal developments and their assumed impact on our performance
Barring any major unforeseen events and based on local currencies

July 2010 Barry Callebaut - Roadshow presentation 28
Summary
Further acceleration in volume growth
Contribution from all regions and all product groups
Emerging markets developing very well
Excellent growth in high-margin Gourmet & Specialties business
Three-year financial targets confirmed

July 2010 Barry Callebaut - Roadshow presentation 29
Cautionary note
Certain statements in this Letter to Investors regarding the business of Barry Callebaut are of a forward looking nature and are therefore based on management’s current assumptions about future developments. Such forward-looking statements are intended to be identified by words such as “believe,” “estimate,” “intend,” “may,” “will,” “expect,” and “project” and similar expressions as they relate to the company. Forward-looking statements involve certain risks and uncertainties because they relate to future events.
Actual results may vary materially from those targeted, expected or projected due to several factors. The factors that may affect Barry Callebaut’s future financial results are discussed in this Letter to Investors as well as in the Annual Report 2008/09. Such factors are, among others, general economic conditions, foreign exchange fluctuations, competitive product and pricing pressures as well as changes in tax regimes and regulatory developments. The reader is cautioned to not unduly rely on these forward-looking statements that are accurate only as of June 30th, 2010. Barry Callebaut does not undertake to publish any update or revision of any forward-looking statements.