basel 3 in the united states: a work in progress
TRANSCRIPT

March 2013 Conjoncture 23
Basel 3 in the United States: a work in progress ?
Céline Choulet
The planned transposition of Basel 3 in United States is providing the first occasion for a thoroughgoing revision of prudential standards for banks since the country's adoption of Basel I in 19891. In June 2012, theUS federal regulators (Federal Reserve, FDIC and OCC) put forward three rules intended to transpose theinternational solvency capital requirements (Basel 2 and Basel 3 frameworks) into US law. The comment period for these rules ended in late October 2012. Also in June2012, the regulators published a final rule revising thecalculation of risk-weighted assets for trading activities(Basel 2.5 framework). On the strength of these documents, the Basel Committee on Banking Supervision (BCBS) issued a report in October 20122
expressing an overall favourable judgment on theprocess of convergence of US standards to the new international standards.
At the time, though, the new rules were still in theproposal stage, and nothing about them was binding as to the final content or implementing conditions. If proof were needed on this point, it arrived quickly. On 9 November 2012, after reviewing just a portion of the two thousandcomments received, the US regulators announced that they would be unable to adopt final rules that could take effect on 1 January 2013, the Basel 3 deadline which they hadinitially intended to meet. The main complaints expressed by commenters concerned the transition period, deemedtoo short; the special characteristics and business modelsof small local banks, given short shrift in the proposed rules;and the removal of prudential filters on unrealised gains andlosses in available-for-sale asset portfolios, a source of excessive volatility in capital ratios. While the US regulatorsagreed that their proposed rules were indeed complex for banks of modest size, another factor in their decision topostpone transposition of Basel 3 was the EU's delay in finalising the European Commission's proposed legislation,the regulation and directive known as CRR/CRD 43.
In the end, on 14 February 2013, Governor DanielTarullo of the Federal Reserve Board announced thatthe regulators hoped to simplify and finalise the firsttwo proposals, on the definition of capital and thecalculation of risk-weighted assets under thestandardised approach, in the spring. Later in the year, a rule transposing the LCR liquidity standard for large US banks could be proposed. How and whenthese commitments will be translated into federalregulations remains to be seen, and what the final rules will say remains uncertain. It is a good bet, though, that the prime concern of the US regulatorswill be to preserve the flow of financing to themortgage lending market.
Towards a loosening of the initial proposals on solvency
Three rules were proposed in June 2012. The first increases the quality standard for instruments eligibleto be counted as prudential capital (the numerators of the solvency ratios) and raises the minimum levels of those ratios 4 (1). The second and third rules change the calculation of risk-weighted assets (the denominators of the ratios) under the two differentapproaches, standardised5 and advanced6(2). In our view, these methods fail to conform to the Basel 3framework on at least two major points(3). Before they can finalise these rules, the regulators now haveto make a tradeoff between uniform prudentialrequirements across the entire banking sector andsimpler, less burdensome rules for community banks (institutions with assets of less than 10 billiondollars)(4).
March 2013 Conjoncture 24
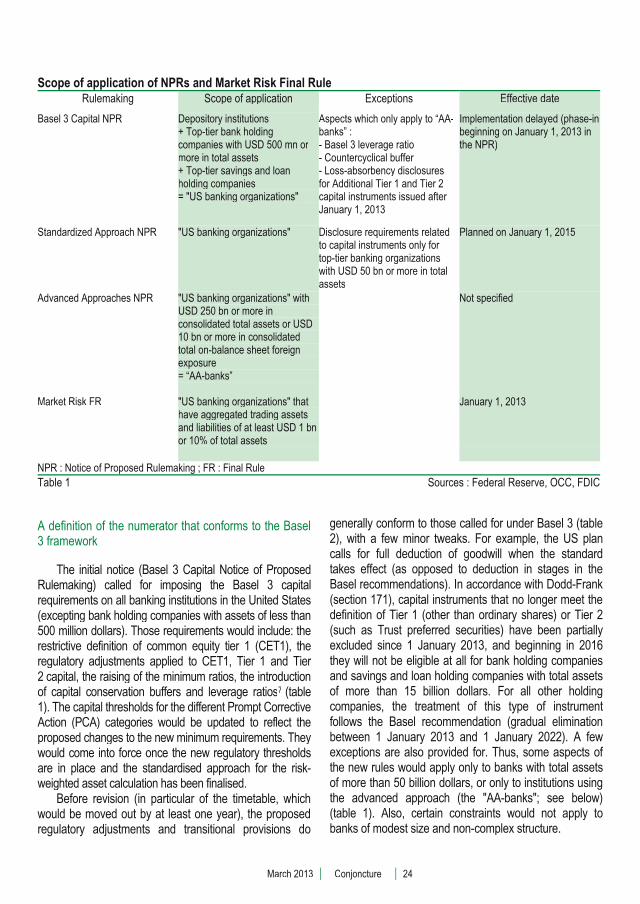
Scope of application of NPRs and Market Risk Final RuleRulemaking Exceptions Scope of application Effective date
Basel 3 Capital NPR Depository institutions + Top-tier bank holdingcompanies with USD 500 mn or more in total assets + Top-tier savings and loan holding companies= "US banking organizations"
Aspects which only apply to “AA-banks” : - Basel 3 leverage ratio- Countercyclical buffer - Loss-absorbency disclosuresfor Additional Tier 1 and Tier 2capital instruments issued after January 1, 2013
Implementation delayed (phase-inbeginning on January 1, 2013 inthe NPR)
Standardized Approach NPR Disclosure requirements related"US banking organizations" to capital instruments only for top-tier banking organizations with USD 50 bn or more in totalassets
Planned on January 1, 2015
Advanced Approaches NPR "US banking organizations" with USD 250 bn or more in consolidated total assets or USD 10 bn or more in consolidated total on-balance sheet foreign exposure = “AA-banks”
Not specified
Market Risk FR "US banking organizations" thathave aggregated trading assets and liabilities of at least USD 1 bnor 10% of total assets
January 1, 2013
NPR : Notice of Proposed Rulemaking ; FR : Final Rule Table 1 Sources : Federal Reserve, OCC, FDIC
A definition of the numerator that conforms to the Basel 3 framework
The initial notice (Basel 3 Capital Notice of ProposedRulemaking) called for imposing the Basel 3 capital requirements on all banking institutions in the United States(excepting bank holding companies with assets of less than 500 million dollars). Those requirements would include: the restrictive definition of common equity tier 1 (CET1), the regulatory adjustments applied to CET1, Tier 1 and Tier 2 capital, the raising of the minimum ratios, the introduction of capital conservation buffers and leverage ratios7 (table 1). The capital thresholds for the different Prompt CorrectiveAction (PCA) categories would be updated to reflect the proposed changes to the new minimum requirements. They would come into force once the new regulatory thresholds are in place and the standardised approach for the risk-weighted asset calculation has been finalised.
Before revision (in particular of the timetable, which would be moved out by at least one year), the proposedregulatory adjustments and transitional provisions do
generally conform to those called for under Basel 3 (table 2), with a few minor tweaks. For example, the US plancalls for full deduction of goodwill when the standard takes effect (as opposed to deduction in stages in the Basel recommendations). In accordance with Dodd-Frank (section 171), capital instruments that no longer meet the definition of Tier 1 (other than ordinary shares) or Tier 2(such as Trust preferred securities) have been partially excluded since 1 January 2013, and beginning in 2016 they will not be eligible at all for bank holding companiesand savings and loan holding companies with total assets of more than 15 billion dollars. For all other holding companies, the treatment of this type of instrument follows the Basel recommendation (gradual eliminationbetween 1 January 2013 and 1 January 2022). A fewexceptions are also provided for. Thus, some aspects of the new rules would apply only to banks with total assetsof more than 50 billion dollars, or only to institutions usingthe advanced approach (the "AA-banks"; see below) (table 1). Also, certain constraints would not apply to banks of modest size and non-complex structure.

March 2013 Conjoncture 25
Two approaches for calculating risk-weighted assets
Under the proposal, all banking institutions (with the exception of bank holding companies with total assetsnot exceeding 500 million dollars) would be subject to the second rulemaking notice (calculation of risk-weighted assets using the standardised approach) beginning 1 January 2015, with earlier applicationpermitted (Standardized Approach NPR) (table 1).Compared with the standardised approach currently used in the United States (Basel 1), the proposed rulechanges mainly the way credit risk is measured andcovered and the provisions relating to securitisation.Despite a few divergences, the proposed rule is,according to the Basel Committee, effectively similar to the Basel 2 standardised approach (which up till nowhas never been formally adopted in the United States).
Use of the new advanced approach of the third rulemaking notice (Advanced Approaches NPR) will be required only for large banks active internationally (theso-called "AA-banks"): banks with more than 250 billiondollars of assets or more than 10 billion dollars of exposure outside the United States – at present, abouttwenty institutions. Some of these banks are currently using the Basel II standardised approach as part of a parallel assessment (table 1). No timetable for implementing the new advanced approach has beenspecified. Compared with the Basel 2 advancedframework, the new advanced approach, in the spirit of Basel 3, strengthens coverage of counterparty risk andchanges how securitisation transactions are treated.
Under the Collins amendment of Section 171 of theDodd-Frank Act, no new minimum leverage or risk-based capital requirement introduced by regulators can be lessthan the "generally applicable requirements" imposed ondepository institutions under Section 38 of the Federal Deposit Insurance Act nor less than the "generally applicable requirements" in effect as of the date of enactment of the Dodd-Frank Act. In short, this July 2010 amendment puts a Basel 1 floor under any new capital rule.The regulators are now proposing that the capital and leverage ratios defined in the first two rulemaking notices (Basel 3 Capital NPR and Standardized Approach NPR) become the new "generally applicable requirements", that is, the new floor. Accordingly, all banking institutions willgradually have to implement the new standardisedapproach. The "AA-banks" will calculate their capital ratios under both of the new approaches, standardised andadvanced, and will use the least favourable of the two todetermine whether they meet the requirements.
The final rule on calculating market risk (Market RiskFR), which transposes the Basel 2.5 framework, roundsout these two proposals. Only banks whose trading book accounts for 10 per cent or more of their total assets or amounts to more than 1 billion dollars will berequired to apply it (table 1). This rule has been in effect since 1 January 2013.
Non-conformity of the denominators on two major points
The risk assessment proposed by the US regulatorsdiffers in various respects from the Basel recommendations. It is in some ways less severe (lesser weighting of senior tranches of securitisations, in particular those of poor quality8) and in other ways more severe (correlation risk temporarily doubled for bankswhose internal model has not been validated). Here wewill discuss two points of major divergence in the calculation of risk-weighted assets.
Prohibition against reliance on external credit ratings
First of all, in accordance with Section 939A of the Dodd-Frank Act, the two notices on risk-weighted assetcalculations (Standardized Approach NPR andAdvanced Approaches NPR) and the final rule onmarket risk (Market risk FR) eliminate all reference to external credit ratings.
The proposed alternative approaches, however, tendto disconnect the weightings of certain kinds of exposures from the risk inherent in them and compress the rating scale relative to the Basel 1 framework. This is the casenot only with the "investment grade criterion" proposed by the OCC (see below), which figures prominently in thenew advanced approach, but also with the measurement of credit risk in the new standardised approach (table 3).Thus, in contrast to the standardised approach to credit risk in Basel 2, the weighting associated with an exposure to a sovereign other than the US Treasury, a debt security of a non-US government entity or a foreign bank is tiednot to an external credit rating of the counterparty itself but to an assessment of the credit risk of the counterparty's country of residence (according to the country-risk classification developed by the OECD). In theend (with the notable exception of residential mortgageloans, see below), the proposed measurement of credit risk remains faithful to the Basel 1 framework for a largenumber of exposures (sovereign borrowers, banks,corporates), which will be assigned virtually uniform risk weightings (0%, 20% and 100% respectively).

March 2013 Conjoncture 26
US B
asel
3 Cap
ital N
PR: P
hase
-in ar
rang
emen
ts (J
une 7
, 201
2)Sc
ope
of a
pplic
atio
n: D
epos
itory
inst
itutio
ns, B
ank
hold
ing
com
pani
es (B
HC
) (w
ith to
tal a
sset
s >
USD
500
milli
ons)
, Sav
ings
and
loan
hol
ding
com
pani
es(S
LHC
)Al
l date
s ref
er to
Janu
ary 1
20
13
2014
20
15
2016
20
17
2018
20
19
2020
20
21
2022
Mini
mum
Com
mon
Equ
ity C
apita
l Rat
io3,
5%
4%
4,5%
Ph
ase-
in o
f ded
uctio
ns fr
om C
ET1:
G
oodw
ill (it
ems
unde
r sec
tion
(a))
100%
Oth
er in
tang
ible
s (e
xclu
ding
MSA
) (se
ctio
n (b
)) 0%
20
%
40%
60
%
80%
10
0% I
tem
s un
der s
ectio
ns (c
) to
(g)
0%
20%
40
%
60%
80
%
100%
Ite
ms
unde
r sec
tions
(h) a
nd (i
) 0%
20
%
40%
60
%
80%
10
0%Pe
rcen
tage
of t
he tr
ansi
tion
AOC
I adj
ustm
ent a
mou
nt*
100%
80
%
60%
40
%
20%
0%
Mi
nim
um T
ier 1
Capi
tal R
atio
4,5%
5,
5%
6%D
educ
tions
from
Tie
r 1 fo
r ite
ms
unde
r sec
tions
(c) t
o (g
) tha
t are
not
ded
ucte
dfro
m C
ET1
100%
80
%
60%
40
%
20%
0%
Mini
mum
Tot
al Ca
pita
l Rat
io
8%
Gra
ndfa
ther
ing
of n
on-q
ualif
ying
inst
rum
ents
issu
ed u
nder
the
Smal
l Bus
ines
sJo
bs A
ct o
f 201
0 or
, prio
r to
Oct
ober
4, 2
010,
und
er th
e Em
erge
ncy
Econ
omic
St
abiliz
atio
n Ac
t of 2
008
(e.g
., TA
RP
pref
erre
d is
suan
ces)
Perm
anen
t
Cap
ital i
nstru
men
ts th
at n
o lo
nger
qua
lify
as n
on-c
ore
Tier
1 c
apita
l or
Tier
2
capi
tal (
% in
clud
ed in
add
ition
al T
1 or
T2
capi
tal):
B
HC
& S
LHC
with
ass
ets
< U
SD 1
5bn
& de
posi
tory
inst
itutio
ns (i
tem
s is
sued
bef
ore
Sept
embe
r 12,
201
0)90
%
80%
70
%
60%
50
%
40%
30
%
20%
10
%
0%
BH
C &
SLH
C w
ith a
sset
s >=
USD
15b
n (it
ems
issu
ed b
efor
e M
ay 1
9, 2
010)
75%
50
%
25%
0%
Perc
enta
ge o
f unr
ealiz
ed g
ains
on
AFS
equi
ty s
ecur
ities
that
may
be
incl
uded
in
Tie
r 2 c
apita
l45
%
36%
27
%
18%
9%
0%
Capi
tal c
onse
rvat
ion
buffe
r
0,62
5%
1,25
%
1,87
5%
2,5%
CET
1 ra
tio +
con
serv
atio
n bu
ffer
3,5%
4%
4,
5%
5,12
5%
5,75
%
6,37
5%
7%Ti
er 1
ratio
+ c
onse
rvat
ion
buffe
r 4,
5%
5,5%
6%
6,
625%
7,
25%
7,
875%
8,
5%
Tota
l cap
ital r
atio
+ c
onse
rvat
ion
buffe
r 8%
8%
8%
8,
625%
9,
25%
9,
875%
10
,5%
Maxim
um p
oten
tial c
ount
ercy
clica
l con
serv
atio
n bu
ffer
(onl
y for
“AA-
bank
s”)
0,
625%
1,
25%
1,
875%
2,
5%
US le
vera
ge r
atio
(Ti
er 1
Cap
ital t
o av
erag
e to
tal c
onso
lidat
ed a
sset
s m
inus
amou
nts d
educ
ted
from
tier
1 ca
pita
l)4%
Base
l 3 le
vera
ge ra
tio (o
nly f
or “A
A-ba
nks”
)
Dis
clos
ure
3%G-
SIB
Surc
harg
e N
ot p
art o
f pro
pose
d ru
les
Liqu
idity
Cov
erag
e Rat
io (L
CR)
Net S
tabl
e Fun
ding
Rat
io (N
SFR)
N
otes
: C
apita
l ins
trum
ents
und
er s
ectio
ns :
(a) g
oodw
ill, n
et o
f any
ass
ocia
ted
defe
rred
tax
liabi
litie
s, in
clud
ing
any
good
will
em
bedd
ed in
the
valu
atio
n of
sig
nific
ant i
nves
tmen
ts in
the
capi
tal o
f unc
onso
lidat
ed in
stitu
tions
. (b
) int
angi
bles
oth
er th
an g
oodw
ill an
d M
SAs
(mor
tgag
e se
rvic
ing
asse
ts).
(c) d
efer
red
tax
asse
ts (D
TA).
(d) g
ain-
on-s
ale
asso
ciat
ed w
ith a
sec
uriti
zatio
n ex
posu
re.
(e) d
efin
ed b
enef
it pe
nsio
n fu
nd a
sset
s.
(f) u
nrea
lized
gai
ns a
nd lo
sses
on
certa
in c
ash
flow
hed
ges.
(g
) unr
ealiz
ed g
ains
and
loss
es th
at h
ave
resu
lted
from
cha
nges
in th
e fa
ir va
lue
of li
abili
ties,
due
to c
hang
es in
the
bank
’s o
wn
cred
it ris
k.
(h) i
nves
tmen
ts in
ow
n re
gula
tory
cap
ital i
nstru
men
ts.
(i) a
mou
nt o
f DTA
, MSA
and
sig
nific
ant i
nves
tmen
ts in
the
com
mon
sha
res
of u
ncon
solid
ated
fina
ncia
l ins
titut
ions
that
exc
eeds
the
10%
or t
he 1
5% C
ET1
capi
tal t
hres
hold
ded
uctio
n.*
net u
nrea
lized
gai
ns a
nd lo
sses
on
AFS
debt
sec
uriti
es, a
ccum
ulat
ed n
et g
ains
and
loss
es re
late
d to
def
ined
ben
efit
pens
ion
oblig
atio
ns, u
nrea
lized
gai
ns o
n AF
S eq
uity
sec
uriti
es,
accu
mul
ated
net
gai
ns a
nd lo
sses
on
cash
flow
hed
ges.
Tabl
e 2A
So
urce
s : B
asel
3 C
apita
l NPR
(Fed
, OC
C, F
DIC
), BN
P Pa
ribas

March 2013 Conjoncture 27
Basel
3: Ph
ase-in
arran
geme
nts (B
CBS,
June
2011
) Sc
ope o
f app
licati
on: In
terna
tiona
lly ac
tive b
anks
(to th
e disc
retion
of na
tiona
l auth
oritie
s)All
dates
refer
to Ja
nuary
1201
3 201
4 201
5 201
6 201
7 201
8 201
9 202
0 202
1 202
2 Min
imum
Comm
on Eq
uity C
apita
l Rati
o 3,5
%
4%
4,5%
Ph
ase-
in of
dedu
ction
s fro
m CE
T1 (i
nclud
ing a
moun
ts ex
ceed
ing th
e lim
it for
DT
As, M
SRs a
nd fin
ancia
ls)
0%
20%
40%
60%
80%
100%
Minim
um Ti
er 1 C
apita
l Rati
o4,5
%
5,5%
6%
Minim
um To
tal Ca
pital R
atio
8%Gr
andfa
therin
g of p
ublic
secto
r cap
ital in
jectio
nsiss
ued b
efore
Septe
mber
12, 2
010
Yes
No
Capit
al ins
trume
nts th
at no
long
er q
ualify
as
non-c
ore T
ier 1
capit
al or
Tier
2ca
pital
(% in
clude
d in a
dditio
nal T
1 or T
2 cap
ital)
90%
80%
70%
60%
50%
40%
30%
20%
10%
0%
Capit
al con
serva
tion b
uffer
0,6
25%
1,25%
1,8
75%
2,5%
CET1
ratio
+ co
nserv
ation
buffe
r 3,5
%
4%
4,5%
5,125
% 5,7
5%
6,375
% 7%
Tier 1
ratio
+ co
nserv
ation
buffe
r 4,5
%
5,5%
6%
6,6
25%
7,25%
7,8
75%
8,5%
Total
capit
al rat
io + c
onse
rvatio
n buff
er 8%
8,6
25%
9,25%
9,8
75%
10,5%
Ma
ximum
poten
tial co
unter
cyclica
l cons
ervati
on bu
ffer
0,6
25%
1,25%
1,8
75%
2,5%
Base
l 3 lev
erage
ratio
(3%)
Paral
lel ru
n Di
sclos
ure
Migr
ation
to P
illar 1
G-S
IB Su
rcharg
e
Phas
e-in
perio
d Fu
lly im
pleme
nted
Liquid
ity Co
verag
e Rati
o (LC
R)*
Obse
rvatio
n per
iod
60%
70%
80%
90%
100%
Net S
table F
undin
g Rati
o (NS
FR)
Obse
rvatio
n peri
od
100%
*Rev
ised f
ramew
ork i
n Jan
uary
2013
Ta
ble 2B
Sourc
e : B
CBS

March 2013 Conjoncture 28
Meth
odW
eight
Coun
terpa
rtyW
eight
Meth
odCo
unter
party
Weig
htCo
unter
party
0%US
gov
ernm
ent
0%US
gov
ernm
ent
0%De
bt de
nom
inated
inloc
al cu
rrenc
y0%
OEC
D so
vere
ign b
orro
wers
outs
ide th
e US
A0-
150%
OEC
D co
untry
risk
cla
ssific
ation
Othe
r cou
nterp
artie
s0-
150%
Coun
terpa
rty c
redit
ratin
gDe
bt de
nom
inated
infor
eign
curre
ncy
100%
Non-
OEC
D so
vere
ign d
ebt, n
eithe
rde
nom
inated
nor
fund
ed in
loca
l cur
renc
y
20%
All c
laim
s (e
xclud
ing p
refer
red
secu
rities
)20
%Al
l clai
ms
(exc
luding
prefe
rred
secu
rities
)10
0%Pr
eferre
d se
curiti
es10
0%Pr
eferre
d se
curiti
es
20%
-100
%W
ithin
an O
ECD
coun
try20
%-5
0%W
ithin
an O
ECD
coun
try10
0%O
utside
an
OEC
D co
untry
20-1
50%
OEC
D co
untry
risk
class
ificati
onO
utside
an
OEC
Dco
untry
20-1
50%
Coun
terpa
rty o
r sov
ereig
n cr
edit
ratin
g
20%
Bank
s wi
th a
head
offic
e in
an O
ECD
coun
try a
nd s
hort-
term
clai
ms
on n
on-
OEC
D ba
nks
20%
US c
ounte
rpar
ty
100%
Long
-term
clai
ms
on n
on-O
ECD
bank
s20
-150
%O
ECD
coun
try ri
sk
class
ificati
onO
ther c
ounte
rpar
ties
20-1
50%
Coun
terpa
rty o
r sov
ereig
n cr
edit
ratin
g
100%
100%
20-1
50%
Coun
terpa
rty c
redit
ratin
gTa
ble
3
Sou
rces
: Fed
, OCC
, FDI
C, B
CBS,
BNP
Par
ibas
Exam
ples o
f cred
it risk
weig
hts un
der t
he st
anda
rd ap
proa
ch
Expo
sure
s to
sov
erei
gn b
orro
wer
s (go
vern
men
t tre
asur
ies, c
entra
l ban
ks)
Expo
sure
s to
mor
tgag
e age
ncie
s (F
eder
al H
ome
Loan
ban
ks, F
anni
e Mae
, Fre
ddie
Mac
)
Clai
ms o
n pu
blic
bod
ies o
utsid
e th
e ce
ntra
l gov
ernm
ent
Clai
ms o
n ba
nks
Clai
ms o
n co
rpor
atesActua
l stan
dard
appro
ach
in
the US
A (a
proxy
for B
asel
1)Th
e new
stan
dard
appro
ach p
ropos
ed
in
the US
A (a
proxy
for B
asel
2)Th
e stan
dard
appro
ach a
pplie
d
in
Europ
e (Ba
sel 2
)
yg g

March 2013 Conjoncture 29
Incomplete transposition of the Basel 3 standardised approach
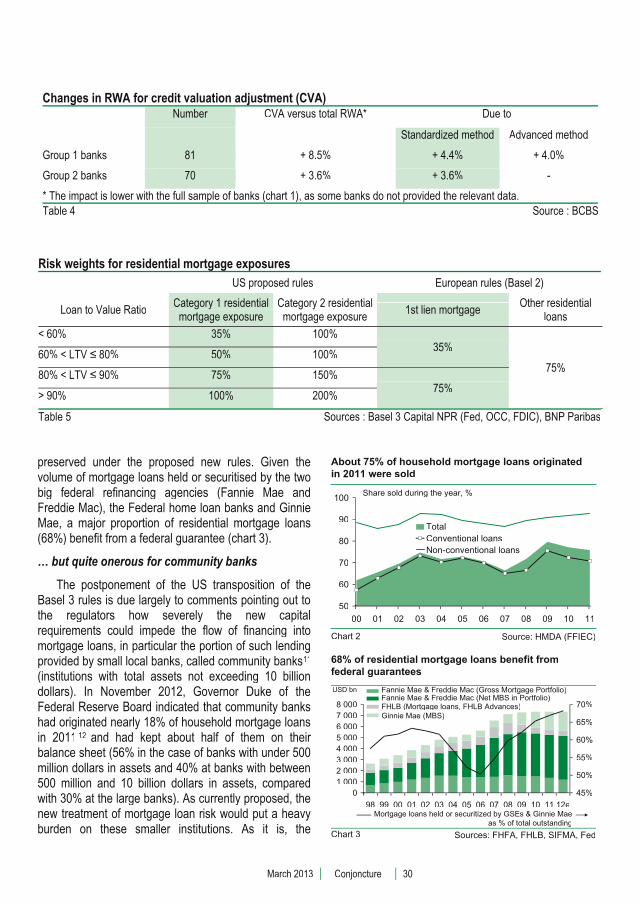
Secondly, the proposed US rules do not transposethe standardised treatment of counterparty risk under Basel 3. The main innovation of Basel 3 in the area of risk-weighted assets lies yet in the enhanced coverageof counterparty risk, in particular via the introduction of a capital charge for credit valuation adjustments (CVAs) on derivatives traded over the counter (to take intoaccount the probability of default of the counterparty)(chart 1). On the occasion of the September 2012Monitoring Exercise, the Basel Committee estimatedthat the prudential treatment of CVAs would raise large banks' total risk-weighted assets by 8.5% (with a greater effect for banks applying the standardised approach rather than the advanced approach). For banks of moremodest size, the estimated increase would be 3.6% (table 4). Lastly, the new floor under capitalrequirements of the Collins amendment is not calculated using a Basel 3 standardised approach but rather under a hybrid approach that mixes elements of the Basel 1and 2 frameworks.
* Credit valuation adjustments (CVA) and asset value correlation(AVC)** Group 1 banks are those that have Tier 1 capital in excess of EUR 3 bn and are internationally active.
Mortgage loan risk: a shift from tightening the rules to preserving loan volumes
The magnitude of the losses attributable to the recent housing crisis in the United States made an undeniable case for tightening mortgage lending criteriaand improving coverage of mortgage loan risks. At the
moment, the approach proposed by US regulators is notonly more severe than under the current framework (residential mortgage loans are generally weighted at50% in the absence of payment arrears) but also less favourable than the Basel framework (table 5). Loans fall into one of two categories. To belong to the first category, loans must meet a set of criteria: the durationof the mortgage exposure does not exceed 30 years,the terms of the mortgage exposure provide for regular periodic payments, the standards used to underwrite the residential mortgage exposure result in a conclusion that the borrower is able to repay the loan, the interest rateincreases are capped, etc. Loans that do not meet thecriteria are deemed to present too high a default risk tobelong to the first category. They are put in the secondand weighted at a minimum of 100%. The rating scale isthen derived as a function of the loan-to-value ratio(LTV) (table 5).
Stricter requirements, with relatively modest impact at the banking system level …
The way in which the mortgage loan market is financedin the United States, however, means the proposed bank capital requirements for housing risks have relatively littleeffect on the banking system as a whole.
Firstly, bank intermediation in mortgage lending isparticularly low in the United States. At end-September 2012, only 29% of the mortgage loans outstanding werecarried on banks' balance sheets, compared with anaverage of 85% in the euro zone (the flow of funds datado not make it possible to identify the proportion of loans originated by the banks themselves). The balance had been sold to issuers of mortgage backed securities(MBS) or, for a marginal part, was carried on thebalance sheets of special-purpose entities. Although the data gathered under the Home Mortgage Disclosure Acttend to understate the size of the secondary market inmortgage loans, the numbers do bring out the fact thatthese loans stay on the originator's balance sheet onlyvery temporarily9. For example, they show that 76% of household mortgage loans originated during the first three quarters of 2011 were sold during that year.Included in this figure were nearly all (92.7%) of the non-conventional loans10 and a high proportion (70.8%) of the conventional loans (chart 2).
Secondly, residential mortgage loans guaranteed by the government or a federal agency currently get privileged treatment (0% weighting if the guarantee isunconditional, 20% if it is not). This treatment is
4.9
7.9
100 100
3.85.40.70 73 13.1
90
95
100
105
110
115
120
Major banks** (101) Other banks (107)
Counterparty risk* (Basel 3)
T di b k (B l 2 5)Trading book (Basel 2.5)
Redefinition of capital (Basel 3)
Basel 2 RWA
A broader definition of risk-weighted assets: from Basel 2 to Basel 3
Chart 1 Source: BCBS
Risk-weighted assets, 100 = Basel 2
March 2013 Conjoncture 30
Changes in RWA for credit valuation adjustment (CVA)CVA versus total RWA* Due to Number
Standardized method Advanced method
Group 1 banks + 8.5% 81 + 4.0% + 4.4%
Group 2 banks + 3.6% 70 - + 3.6%
* The impact is lower with the full sample of banks (chart 1), as some banks do not provided the relevant data.Table 4 Source : BCBS
Risk weights for residential mortgage exposures US proposed rules European rules (Basel 2)
Loan to Value RatioCategory 1 residential
mortgage exposureCategory 2 residential mortgage exposure
1st lien mortgage Other residential
loans
< 60% 100%35% 35%
75% 60% < LTV � 80% 100%50%
80% < LTV � 90% 150%75% 75%
> 90% 200% 100%
Table 5 Sources : Basel 3 Capital NPR (Fed, OCC, FDIC), BNP Paribas
preserved under the proposed new rules. Given thevolume of mortgage loans held or securitised by the two big federal refinancing agencies (Fannie Mae andFreddie Mac), the Federal home loan banks and Ginnie Mae, a major proportion of residential mortgage loans (68%) benefit from a federal guarantee (chart 3).
… but quite onerous for community banks
The postponement of the US transposition of theBasel 3 rules is due largely to comments pointing out tothe regulators how severely the new capital requirements could impede the flow of financing intomortgage loans, in particular the portion of such lendingprovided by small local banks, called community banks11
(institutions with total assets not exceeding 10 billion dollars). In November 2012, Governor Duke of theFederal Reserve Board indicated that community banks had originated nearly 18% of household mortgage loans in 2011 12 and had kept about half of them on their balance sheet (56% in the case of banks with under 500 million dollars in assets and 40% at banks with between500 million and 10 billion dollars in assets, comparedwith 30% at the large banks). As currently proposed, thenew treatment of mortgage loan risk would put a heavyburden on these smaller institutions. As it is, the
50
60
70
80
90
100
00 01 02 03 04 05 06 07 08 09 10 11
TotalConventional loansNon-conventional loans
Share sold during the year, %
About 75% of household mortgage loans originatedin 2011 were sold
Chart 2 Source: HMDA (FFIEC)
01 0002 0003 0004 0005 0006 0007 0008 000
98 99 00 01 02 03 04 05 06 07 08 09 10 11 12e45%
50%
55%
60%
65%
70%
USD bn
68% of residential mortgage loans benefit fromfederal guarantees
Chart 3 Sources: FHFA, FHLB, SIFMA, Fed
Ginnie Mae (MBS)FHLB (M t l FHLB Ad )FHLB (Mortgage loans, FHLB Advances)Fannie Mae & Freddie Mac (Net MBS in Portfolio)Fannie Mae & Freddie Mac (Gross Mortgage Portfolio)
Mortgage loans held or securitized by GSEs & Ginnie Maeas % of total outstanding
March 2013 Conjoncture 31
loans that they make share many similarities (highinterest rates, balloon payments) with subprime loans – the same loans whose characteristics were used as a proxy for identifying the high-risk loans belonging to the second category. The new prudential framework would therefore increase capital requirements by a factor between two and four on mortgage lending bycommunity banks (where such loans make up 20% of assets). According to Governor Duke, default rates onthese banks' mortgage loans hardly exceeded 4% during the crisis, compared with 22% for fixed-rate subprime loans and 46% for adjustable-rate subprimeloans. This was because these banks are closer to their customer base and their lending practices were moreresponsible. Given the role played by community banksin financing their local economies (they are also quiteactive in lending to commercial real estate and smallbusiness), one of the main corrections to the initialproposals might consist in specifying conditions under which these banks would be freed from theseconstraints.
Uncertainties surrounding transposition of the Liquidity Coverage Ratio
No formal proposals have yet been made in theUnited States as to whether and how the internationalstandards on short-term and long-term liquidity (Liquidity Coverage Ratio13 and Net Stable Funding Ratio14) mightbe transposed into US law. Last June, US regulatorswere still expressing serious criticisms of the LCR, andthey seemed not to adhere to the "one size fits all"principle. Whereas the two Basel ratios are calibratedusing parameters (run rate, haircuts, weightingcoefficients, etc.) whose values are, for the most part,dictated by the college of regulators (or, moremarginally, left to the discretion of the national supervisory authority), the most recent rulemakingnotice on bank liquidity in the US (the Federal Reserve's rule proposal on 20 December 201115) relies on morequalitative requirements. These are based on internalstress scenarios tailored to the profile of each institution's activities and risks. After the Basel Committee had loosened its definition of the short-termliquidity standard (on 6 January 2013) 16 , Governor Tarullo said on 14 February that US regulators hoped to
issue a rule transposing the LCR for large US banksduring 2013. Assuming such a transposition actually takes place this year, we believe that it will not conformfully to the Basel 3 framework (1). Furthermore, arequirement of this type is unlikely to constitute as great a challenge to US banks as the one faced by European banks (2).
Which alternatives to external ratings for assessing an asset's liquidity risk?
As with the capital standards, the prohibition againstany reference to external credit ratings (required byDodd-Frank) stands as the main obstacle to a fullyconforming transposition of the Basel 3 liquidity ratio in the United States. As written, the Basel Committee'srequirements refer extensively to external credit ratings.Firstly, the scenario associated with the LCR requires, among other things, collateral to cover outstanding contracts in the event that the bank's credit rating isdowngraded (by up to 3 notches). Secondly, credit riskis one of the criteria for assessing an asset's degree of liquidity. Thus, assets in level 2 – which, together withassets in level 1, make up the full range of HQLA (high-quality liquid assets) in the numerator of the LCR (see box) – must be assigned a certain minimum credit rating(for example, BBB- for corporate bonds) by a recognised ECAI (external credit assessmentinstitution).
For banks using the advanced approach (the"AA-banks"), this obstacle can be partially circumvented because in the absence of a credit rating from arecognised ECAI, the Basel Committee allows certainassets (such as corporate bonds) to be included in theHQLA total, provided the probability of default estimatedby internal methods is at least equivalent to the minimum required credit rating (BBB- in the precedingexample). For other types of assets (in particular RMBS), however, no alternative is provided.
The US regulators might encourage the use of the"investment grade" criterion proposed by the OCC 17 , which is based on an internal assessment of the counterparty's capacity to fulfil its commitments (low risk of default, high probability of full repayment of principal and interest as scheduled). However, the use of a binary criterion – investment grade versus non-investmentgrade – would not seem to be satisfactory consideringthe fine-grained assessment of credit risk required by the LCR. By classifying liquid assets in level 2A or 2B(see below), the Basel 3 ratio distinguishes between
March 2013 Conjoncture 32
"good quality" investment-grade instruments (for example, corporate bonds rated at least AA-) and"lesser quality “investment-grade instruments (for example, corporate bonds rated from BBB- to A+).
The GSEs ease the constraint on bank liquidity
Both in Europe and in the United States, theavailable accounting data (on a consolidated basis) and monetary statistics do not allow us to do an appropriate simulation of LCR at the level of an institution, or even mean LCR at the level of a national banking system.Moreover, the US authorities have not published anyofficial quantitative impact statement comparable tothose conducted by the Basel Committee, on a sample of 209 banks worldwide, and by the EBA (European Banking Authority), on a sample of 155 Europeanbanks. The only assessment of any precision was putout by an industry association, The Clearing House Association, in December 2012. This study estimated that the average LCR (defined according to the Baselrecommendations of December 2010, i.e., without the revisions of this past January) of the eleven banksparticipating in its exercise stood at 81% in the secondquarter of 2012, up from 59% in the fourth quarter 2010.On the same standards, the average ratio of largeEuropean banks was 72% at year-end 2011 (EBA estimate) and the average ratio of large banksworldwide was 91% (Basel Committee estimate).
Even if we do not have comparable assessments of liquidity ratios, there is no question that the “originate todistribute" (OTD) model characteristic of mortgagelending in the United States partially eases the bankliquidity constraint there. It does so by increasing the available volume of high-quality liquid assets (numerator of ratio) and by reducing banks' dependence on the market for financing (denominator of the ratio).
Comparative structure of HQLA
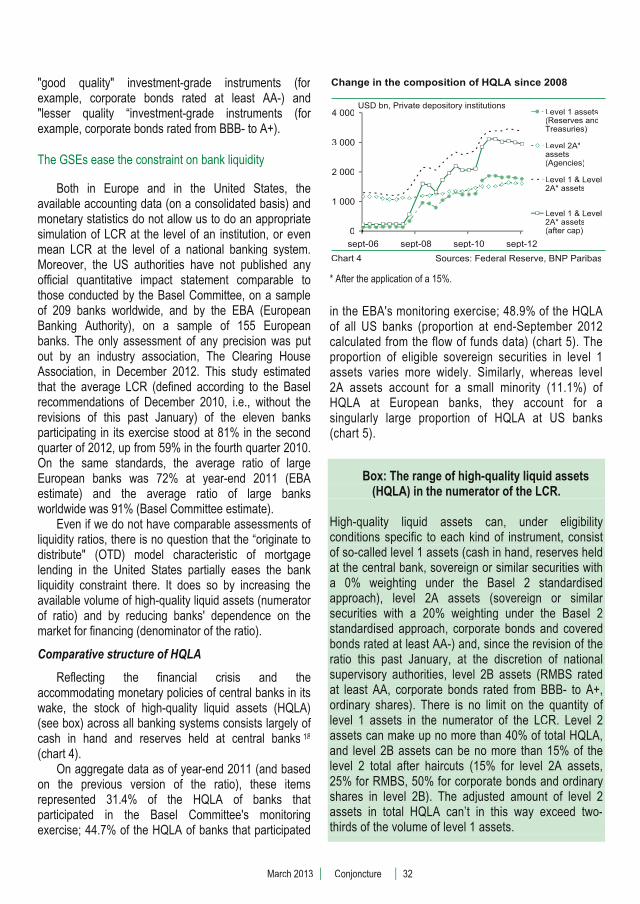
Reflecting the financial crisis and theaccommodating monetary policies of central banks in its wake, the stock of high-quality liquid assets (HQLA) (see box) across all banking systems consists largely of cash in hand and reserves held at central banks 18
(chart 4). On aggregate data as of year-end 2011 (and based
on the previous version of the ratio), these items represented 31.4% of the HQLA of banks thatparticipated in the Basel Committee's monitoringexercise; 44.7% of the HQLA of banks that participated
* After the application of a 15%.
in the EBA's monitoring exercise; 48.9% of the HQLAof all US banks (proportion at end-September 2012 calculated from the flow of funds data) (chart 5). The proportion of eligible sovereign securities in level 1assets varies more widely. Similarly, whereas level 2A assets account for a small minority (11.1%) of HQLA at European banks, they account for a singularly large proportion of HQLA at US banks (chart 5).
Box: The range of high-quality liquid assets (HQLA) in the numerator of the LCR.
High-quality liquid assets can, under eligibility conditions specific to each kind of instrument, consistof so-called level 1 assets (cash in hand, reserves held at the central bank, sovereign or similar securities with a 0% weighting under the Basel 2 standardised approach), level 2A assets (sovereign or similar securities with a 20% weighting under the Basel 2 standardised approach, corporate bonds and covered bonds rated at least AA-) and, since the revision of the ratio this past January, at the discretion of nationalsupervisory authorities, level 2B assets (RMBS ratedat least AA, corporate bonds rated from BBB- to A+,ordinary shares). There is no limit on the quantity of level 1 assets in the numerator of the LCR. Level 2 assets can make up no more than 40% of total HQLA, and level 2B assets can be no more than 15% of the level 2 total after haircuts (15% for level 2A assets, 25% for RMBS, 50% for corporate bonds and ordinary shares in level 2B). The adjusted amount of level 2 assets in total HQLA can’t in this way exceed two-thirds of the volume of level 1 assets.
0
1 000
2 000
3 000
4 000
sept-06 sept-08 sept-10 sept-12
Level 1 assets(Reserves andTreasuries)
Level 2A*assets(Agencies)
Level 1 & Level2A* assets
Level 1 & Level2A* assets(after cap)
Change in the composition of HQLA since 2008
Chart 4 Sources: Federal Reserve, BNP Paribas
USD bn, Private depository institutions

March 2013 Conjoncture 33
Agency securities make up a swollen proportion of US banks' liquid assets
Given the prominent role played by the Government Sponsored Enterprises (GSEs) in financing the mortgage loan market, the fact that agency securitiesare eligible level 2A assets is undeniably an advantage for US banks. We estimate (from an approximation onan aggregate basis) that the potential volume of level 2A assets (consisting primarily of agency securities) 19
represents 48% of the total amount of HQLA held bybanks in the United States (1,800 billion dollars of level 1 assets and 1,600 billion dollars of level 2 assets, after haircuts). With the 40% cap (see box), US bankstherefore have, even before taking level 2B assets into account, an excess of level 2 assets (approximately 400 billion dollars, or nearly 25% of the overall volume) (chart 6 and table 6).
In aggregate, though, US banks have a deficit of HQLA (LCR below 100% according to The ClearingHouse estimates). One option would be to sell the Agency securities they hold (level 2A assets) and boosttheir holdings of Treasuries (level 1 assets), providedthe yield differential corrected for the haircut makes this worthwhile. Bear in mind that the opportunity cost of holding as high a proportion of level 1 assets as possible is itself high: these assets bring in low returns, but they tie up just as much capital as any other exposure in the leverage ratio calculation.
Expanding the range of HQLA to include private-issuers RMBS: revival of the private secondary market still faces numerous hurdles
Although the United States is the world's biggestissuer of mortgage-backed securities, there is littleinterest in expanding the range of level 2 assets to
Level 2A assets, covered
bonds: 2.4%
Level 2A assets,
corporate bonds: 2.0%
Level 2Aassets, 20% risk weight:
6.7%
Level 1 assets,other: 2.5%
Level 1 assets,0% risk weight:
55.0%
Level 1 assets,Cash and
Central bank reserves: 31.4%
Composition of HQLA
Sample of banks (BCBS)p ( )
Level 1 assets,Cash and
Central bank reserves: 44.7%Level 1 assets,
0% risk weight: 40.8%
Level 1 assets,other: 3.4%
Level 2A assets, 20% risk weight:
2.4%
Level 2A assets,
corporate bonds: 0.6%
Level 2A assets, covered
bonds: 8.1%
Sample of European banks (EBA)p p ( )
Level 1 assets, Cash and
Central bank reserves: 48.9%
Level 1 assets,0% risk weight:
11.1%
Level 2A assets, 20% risk weight:
40.0%
Chart 5 Sources: BCBS, EBA, Fed, BNP Paribas
US private depository institutions (Fed, approx.BNPP)p p y ( , pp )
328 1 179 4391 440
0 1000 2000 3000 4000
US banks are restricted by banks are restricted by the 40% cap on Level 2 assets the 40% cap on Level 2 asse
Chart 6 Sources: Federal Reserve, BNP Paribas
Level 1 assets
Level 2A assets in excessdue to the cap
Level 2A assets(Agencies, after haircut and cap)
USD bn, sept 2012
Level 2A assets (after haircut)
Reserves at Fed Treasuries

March 2013 Conjoncture 34
Excess in level 2A assets Billion Level 2A assets Level 1 assets
(after haircut and cap) Level 2A assets
in excessLevel 2A assets
in excess / Level 2A assets (after haircut)
Sample of banks (Monitoring exercise, BCBS)
EUR 700 EUR 7 100 14% EUR 117*
Sample of European banks(EBA)
EUR 200 EUR 2 400 21%EUR 53**
US private depository institutions (Fed, approx. BNPP)
USD 1 200USD 1 800 25% USD 400
* 23 banks over 209** 24 banks over 155Table 6 Sources : BCBS, EBA, Fed, BNP Paribas
include private-issuer RMBS. Admittedly, the BaselCommittee's initial proposal (December 2010), whichextended eligibility only to RMBS with a federalguarantee, ran counter to any rebound in the private secondary market for mortgage loans – a prerequisitefor reform of the GSEs. As it stands, though, the eligibility conditions for private-issuer RMBSs areparticularly restrictive in the context of practices in the United States (the securities must be rated at least AA;they must have demonstrated that they are a reliablesource of liquidity in periods of stress; the securities and the underlying assets must not have been issued or originated by the bank itself or one of its subsidiaries; the securities must be subject to the risk retention rules; the underlying assets must be "fullrecourse" 20 and have an LTV less than or equal to80%). Firstly, private mortgage-backed securities,residential or otherwise, represent only 20% of all MBSoutstanding in the United States, and about 65% of all private-issuer structured products (ABS and MBS taken together) carry a rating lower than AA (source:AFME/SIFMA). Secondly, on the origination side, the mortgage loan market is highly concentrated: according to data from Inside Mortgage Finance, four institutions (all of them "AA-banks") have more thanhalf of the market between them. Thirdly, the riskretention rules have not been finalised in the United States. Lastly, state law in a number of the states, notably California, North Carolina and Washington, makes most mortgage loans "non-recourse".21. Even though it is probable that the full-recourse requirement would be removed in any US transposition of the LCR,demand from foreign banks for US private-issuers RMBS will not recovered.
A comfortable cushion of deposits
In addition to having a substantial volume of level 2assets available, US banks are also less dependent on the market for refinancing. We estimate that at the end of September 2012, US banks' deposits covered nearly127% of their loans to households and non-financial companies (loans-to-deposits ratio of 0.79), whereas inEurope the comparable figure was 77% (LTD ratio of 1.29) (figure 7). Granted, in the past few years (startingin 2009), the withdrawal of corporate liquidities placed in mutual funds, the exceptional financing capacity non-financial corporates managed to generate, the unlimitedFDIC guarantee on non-interest-bearing bank deposits (which expired on 31 December 2012) and the contraction, then slowed growth of bank lending, helped to boost the LTD ratios of US banks.
From a structural standpoint, though, it is still the preponderance of market financing in the US economythat enables US banks to sport such favourable ratios of
60%
80%
100%
120%
140%
160%
82 85 88 91 94 97 00 03 06 09 12
Eurozone
United States
More deposits than loans on US bank balance sheets
Chart 7 Sources: ECB, Federal Reserve, BNP Paribas
Private non-financial agents, loan/deposit ratio

March 2013 Conjoncture 35
loans to deposits. Of course, the institutional investors that have developed in the wake of market finance(insurance companies, pension funds, money market funds and other mutual funds) do take in a portion of thesavings of non-financial agents. Financial intermediationin credit based on securitisation (which takes loans off of bank balance sheets) allows banks to rely on a comfortable deposit base for the loans that they actuallycarry on the balance sheets. We estimate that in theUnited States, only 38% of loans to households andnon-financial companies appear on banks' balance sheets, compared with 80% in the euro zone22 (table 7).The OTD model has ultimately served to amplify the leverage effect within the economy, working through financial institutions that are on the margins of the traditional banking sector but nevertheless heavily involved in the intermediation process, such as the GSE and private issuers of ABS (asset-backed securities).
Credit intermediation (sept 2012)Loans on bank balance
sheet United-
StatesEurozone
Household loans
% of household debt 85% 38%
Non-financial corporate loans
% of NFC debt 65% 13%
Loans to privatenon-financial agents
% of debt of privatenon-financial agents
75%30%
Loans to privatenon-financial agents
% of loans to privatenon-financial agents
80%38%
* Debt : Loans and debt securitiesTable 7 Sources : Fed, ECB, BNP Paribas
� � �
In Europe, where the main rap against Basel 3 isthat it hinders bank intermediation in lending to theeconomy, all the banks are working on bringingthemselves into compliance with the new internationalstandards. In the United States, where the preponderance of market finance partially relieves thebank capital and liquidity constraints, the most telling criticisms focus on the excessive complexity of the rules for banks of modest size and on the "one size fits all"principle. The very same criticisms of the Basel 2framework (introduced in 2007 in Europe) led to a broad swath of the US banking system being excluded from its scope and delayed its transposition. Only about twentyinstitutions, starting in 2010 or 2011, embarked on aphase of parallel assessment of capital ratios, under the Basel 1 and Basel 2 advanced standards, and none of them had completed the transposition.
Besides minimum requirements for bank capitaland short-term liquidity, US regulators have committedthemselves to propose, this year, the introduction of a capital surcharge for systemically important banks. However, this provision remains on hold until theminimum solvency capital requirements are finalised.Lastly, the transposition of the long-term liquiditystandard (NSFR) appears quite uncertain: to our knowledge, US regulators have never brought up thesubject. Sceptical of its relevance, Governor Tarullo recently proposed to the Basel Committee that it think about alternatives rather than about revising thedefinition of the NSFR standard.
4 March 2013 [email protected]

March 2013 Conjoncture 36
NOTES1 Recall that US banks are currently subject to the Basel 1 standards, whereas Basel 2 has been applied in Europe since 2007 and Basel 2.5 since 2011. 2 BCBS, "Basel 3 regulatory consistency assessment (Level 2), Preliminary report: United States of America", October 2012.3 Transposition into EU law of the Basel 3 requirements for bank solvency, capital surcharges for systemically important banksand monitoring of liquidity risk (LCR standard).4 Office of the Comptroller of the Currency, Federal Reserve System, Federal Deposit Insurance Corporation, "Regulatory capitalrules: Regulatory capital, Implementations of Basel 3, Minimum regulatory capital ratios, Capital adequacy, Transition provisions, and Prompt corrective action", Joint notice of proposed rulemaking, June 2012. 5 Office of the Comptroller of the Currency, Federal Reserve System, Federal Deposit Insurance Corporation, "Regulatory capitalrules: Standardized Approach for risk-weighted assets, Market discipline and Disclosure requirements", Joint notice of proposedrulemaking, June 2012.6 Office of the Comptroller of the Currency, Federal Reserve System, Federal Deposit Insurance Corporation, "Regulatory capitalrules: Advanced Approaches Risk-based Capital Rule; Market Risk Capital Rule", Joint notice of proposed rulemaking, June 2012. 7 For a presentation on the Basel 3 standards, see Laurent Quignon: "Basel III: no Achilles’ spear" , Conjoncture, May-June 2011,BNP Paribas.8 In December 2012 the Basel Committee proposed a revision of the weightings of securitisation risk. 9 The HMDA data tend to understate the size of the secondary market in loans: loans sold during a calendar year different from the year of origination are reported as having been kept on the originator's balance sheet.10 Non-conventional loans are government-insured loans originated under programmes of the Federal Housing Authority or the Department of Veterans Affairs. Ginnie Mae and Farmer Mac generally buy loans of this type, whereas the Government-Sponsored Enterprises (Federal home loan banks, Fannie Mae and Freddie Mac) acquire the conventional loans (when theyconform to certain size and quality criteria).11 Community banks are active mainly in rural areas or areas avoided by the big banks, and their customer base consists largely of low-income and moderate-income borrowers.12 Compared with 7% for credit unions, 25% for non-bank institutions and 50% for large banks (source: HMDA). Loans of institutions operating only in rural areas were not included in the figures. 13 The LCR ratio is intended to require banks to hold sufficient high-quality, unencumbered liquid assets to offset, over a 30-dayperiod, the net outflows of liquidity that they could experience in a stress scenario. 14 The NSFR ratio requires holding a minimum amount of stable financing relative to the liquidity profile of assets and any needsfor liquidity arising from off-balance-sheet commitments over a period of one year.15 Federal Reserve System, "Enhanced prudential standards and early remediation requirements for covered companies, December 2011. 16 BCBS, "Basel 3: The Liquidity Coverage Ratio and liquidity risk monitoring tools", January 2013.17 Office of the Comptroller of the Currency, "Alternatives to the use of external credit ratings", Notice of proposed rulemaking,November 2011. 18 Although the expansion of central bank balance sheets has made it possible to boost the volume of HQLA held by banks, we point out that these reserves, unlike other liquid assets in the numerator of the LCR, are not counterparts of the money supply(claims on the public or private sector). This means that when ratios are improved by an increase in these reserves, overall liquidity in the economy is reduced. 19 The Flow of Funds tables show the amounts of reserves at the Fed, Treasuries and Agencies on banks' balance sheets. We neglect corporate bonds and covered bonds (the latter are negligible on bank balance sheets in the United States) for which we have no good data on credit ratings. 20 In the event of foreclosure, the borrower remains fully liable for any shortfall between the value of the mortgage and the amount recouped on the sale of the property. 21 Ghent, A. et Kudlyak, M. (2011), Recourse and Residential Mortgage Default: Theory and Evidence from US States, FederalReserve Bank of Richmond, working paper no. 09-10R. 22 For a presentation of the methodology used, see Céline Choulet, "Credit intermediation in the United States ", Conjoncture, May2012, BNP Paribas.

economic-research.bnpparibas.com
� Jean-Luc PROUTAT +33.(0)1.58.16.73.32 [email protected] Head
� Alexandra ESTIOT +33.(0)1.58.16.81.69 [email protected] Head – Globalisation, United States, Canada
� Hélène BAUDCHON +33.(0)1.58.16.03.63 [email protected] France, Belgium, Luxembourg
� Frédérique CERISIER +33.(0)1.43.16.95.52 [email protected] Public finance – European institutions
� Clemente De LUCIA +33.(0)1.42.98.27.62 [email protected] Euro zone, Italy - Monetary issues - Economic modeling
� Thibault MERCIER +33.(0)1.57.43.02.91 [email protected], Portugal, Greece, Ireland
� Caroline NEWHOUSE +33.(0)1.43.16.95.50 [email protected] Germany, Austria -Supervision of publications
� Catherine STEPHAN +33.(0)1.55.77.71.89 [email protected] United Kingdom, Switzerland, Nordic Countries – Labour market
� Raymond VAN DER PUTTEN +33.(0)1.42.98.53.99 [email protected] Japan, Australia, Netherlands - Environment - Pensions
� Philippe d’ARVISENET +33.(0)1.43.16.95.58 [email protected] Economist
� Laurent QUIGNON +33.(0)1.42.98.56.54 [email protected]
� Céline CHOULET +33.(0)1.43.16.95.54 [email protected]
� Julie ENJALBERT +33.(0)1.43.16.95.41 [email protected]
� Laurent NAHMIAS +33.(0)1.42.98.44.24 [email protected]
� François FAURE +33.(0)1 42 98 79 82 [email protected]
� Christine PELTIER +33.(0)1.42.98.56.27 [email protected] Deputy Head - Methodology, China, Vietnam
� Stéphane ALBY +33.(0)1.42.98.02.04 [email protected] Africa, French-speaking countries
� Sylvain BELLEFONTAINE +33.(0)1.42.98.26.77 [email protected] Latin America - Methodology, Turkey
� Sara CONFALONIERI +33.(0)1.42.98.74.26 [email protected] America
� Pascal DEVAUX X +33.(0)1.43.16.95.51 [email protected] Middle East – Scoring
� Anna DORBEC +33.(0)1.42.98.48.45 [email protected] and other CIS countries
� Hélène DROUOT +33.(0)1.42.98.33.00 [email protected]
� Jean-Loïc GUIEZE +33.(0)1.42.98.43.86 [email protected], English and Portuguese speaking countries
� Johanna MELKA +33.(0)1.58.16.05.84 [email protected] Asia – Capital Flows
� Alexandre VINCENT +33.(0)1.43.16.95.44 [email protected] Central and Eastern Europe
EMERGING ECONOMIES AND COUNTRY RISK
OECD COUNTRIES
� Michel BERNARDINI +33.(0)1.42.98.05.71 [email protected] Public Relations Officer
ECONOMIC RESEARCH DEPARTMENT
� Tarik RHARRAB +33.(0)1.43.16.95.56 [email protected] Statistics
BANKING ECONOMICS

economic-research.bnpparibas.com
The information and opinions contained in this report have been obtained from, or are based on, public sources believed to be reliable, but no representation or warranty, express or implied, is made that such information is accurate, complete or up to date and it should not be relied upon as such. This report does not constitute an offer or solicitation to buy or sell any securities or other investment. Information and opinions contained in the report are published for the assistance of recipients, but are not to be relied upon as authoritative or taken in substitution for the exercise of judgement by any recipient, are subject to changewithout notice and not intended to provide the sole basis of any evaluation of the instruments discussed herein. Any reference to past performance should not be taken as an indication of future performance. Tothe fullest extent permitted by law, no BNP Paribas group company accepts any liability whatsoever (including in negligence) for any direct or consequential loss arising from any use of or reliance on material contained in this report. All estimates and opinions included in this report are made as of the date of thisreport. Unless otherwise indicated in this report there is no intention to update this report. BNP Paribas SA and its affiliates (collectively “BNP Paribas”) may make a market in, or may, as principal or agent, buy or sell securities of any issuer or person mentioned in this report or derivatives thereon. BNP Paribas may have a financial interest in any issuer or person mentioned in this report, including a long or short position in their securities and/or options, futures or other derivative instruments based thereon. Prices, yields and other similar information included in this report are included for information purposes. Numerous factors will affectmarket pricing and there is no certainty that transactions could be executed at these prices. BNP Paribas, including its officers and employees may serve or have served as an officer, director or in an advisorycapacity for any person mentioned in this report. BNP Paribas may, from time to time, solicit, perform or have performed investment banking, underwriting or other services (including acting as adviser, manager,underwriter or lender) within the last 12 months for any person referred to in this report. BNP Paribas maybe a party to an agreement with any person relating to the production of this report. BNP Paribas, may to the extent permitted by law, have acted upon or used the information contained herein, or the research oranalysis on which it was based, before its publication. BNP Paribas may receive or intend to seekcompensation for investment banking services in the next three months from or in relation to any person mentioned in this report. Any person mentioned in this report may have been provided with sections of thisreport prior to its publication in order to verify its factual accuracy.
BNP Paribas is incorporated in France with limited liability. Registered Office 16 Boulevard des Italiens,75009 Paris. This report was produced by a BNP Paribas group company. This report is for the use of intended recipients and may not be reproduced (in whole or in part) or delivered or transmitted to any other person without the prior written consent of BNP Paribas. By accepting this document you agree to be boundby the foregoing limitations.
Certain countries within the European Economic Area:
This report is solely prepared for professional clients. It is not intended for retail clients and should not be passed on to any such persons. This report has been approved for publication in the United Kingdom byBNP Paribas London Branch. BNP Paribas London Branch is authorised and supervised by the Autorité deContrôle Prudentiel and authorised and subject to limited regulation by the Financial Services Authority. Details of the extent of our authorisation and regulation by the Financial Services Authority are available from us on request.
This report has been approved for publication in France by BNP Paribas SA, incorporated in France with Limited Liability and is authorised by the Autorité de Contrôle Prudentiel (ACP) and regulated by the Autorité des Marchés Financiers (AMF) whose head office is 16, boulevard des Italiens 75009 Paris, France.
This report is being distributed in Germany either by BNP Paribas London Branch or by BNP ParibasNiederlassung Frankfurt am Main, a branch of BNP Paribas S.A. whose head office is in Paris, France. BNPParibas S.A. – Niederlassung Frankfurt am Main, Europa Allee 12, 60327 Frankfurt is authorised and supervised by the Autorité de Contrôle Prudentiel and it is authorised and subject to limited regulation by theBundesanstalt für Finanzdienstleistungsaufsicht (BaFin).
United States: This report is being distributed to US persons by BNP Paribas Securities Corp., or by asubsidiary or affiliate of BNP Paribas that is not registered as a US broker-dealer to US major institutional investors only.BNP Paribas Securities Corp., a subsidiary of BNP Paribas, is a broker-dealer registered with the U.S. Securities and Exchange Commission and a member of the Financial Industry Regulatory Authorityand other principal exchanges. BNP Paribas Securities Corp. accepts responsibility for the content of a report prepared by another non-U.S. affiliate only when distributed to U.S. persons by BNP Paribas Securities Corp.
Japan: This report is being distributed to Japanese based firms by BNP Paribas Securities (Japan) Limited or by a subsidiary or affiliate of BNP Paribas not registered as a financial instruments firm in Japan, to certain financial institutions defined by article 17-3, item 1 of the Financial Instruments and Exchange LawEnforcement Order. BNP Paribas Securities (Japan) Limited is a financial instruments firm registeredaccording to the Financial Instruments and Exchange Law of Japan and a member of the Japan Securities Dealers Association and the Financial Futures Association of Japan. BNP Paribas Securities (Japan)Limited accepts responsibility for the content of a report prepared by another non-Japan affiliate only whendistributed to Japanese based firms by BNP Paribas Securities (Japan) Limited. Some of the foreignsecurities stated on this report are not disclosed according to the Financial Instruments and Exchange Lawof Japan.
Hong Kong: This report is being distributed in Hong Kong by BNP Paribas Hong Kong Branch, a branch of BNP Paribas whose head office is in Paris, France. BNP Paribas Hong Kong Branch is registered as a Licensed Bank under the Banking Ordinance and regulated by the Hong Kong Monetary Authority. BNP Paribas Hong Kong Branch is also a Registered Institution regulated by the Securities and FuturesCommission for the conduct of Regulated Activity Types 1, 4 and 6 under the Securities and FuturesOrdinance.
Some or all the information reported in this document may already have been published on https://globalmarkets.bnpparibas.com
© BNP Paribas (2013). All rights reserved.
Prepared by Economic Research – BNP PARIBAS
Registered Office: 16 boulevard des Italiens – 75009 PARIS
Tél : +33 (0) 1.42.98.12.34 – Internet : www.bnpparibas.com
Publisher: Baudouin Prot
Printed in France by: Ateliers J. Hiver SA – March 2013
ISSN 0224-3288 – Copyright BNP Paribas
CONJONCTUREStructural or in the news flow, two issues analysed in depth
EMERGINGAnalyses and forecasts for a selection of emerging economies
PERSPECTIVESAnalyses and forecasts for the main countries,emerging or developed
ECOWEEK
Weekly economic news and much more…
ECOFLASH
Data releases, major economic events. Our detailed views…
ECOTV In this monthly webTV, our economists make sense of economic news
ECOTV WEEK What is the main event this week? The answer is inyour two minutes of economy
To receive our publications, please subscribe on our website. You can read and watch our analyses on
EcoNews, our iPad and Android application.
http://economic-research.bnpparibas.com�
OUR PUBLICATIONS