baseline socioeconomic analysis for the marcellus · pdf filebaseline socioeconomic analysis...
TRANSCRIPT
BASELINE SOCIOECONOMIC ANALYSIS FOR THE
MARCELLUS SHALE DEVELOPMENT IN PENNSYLVANIA
A project funded by the Appalachian Regional Commission to The Institute for Public Policy & Economic Development at Wilkes University
Department of Agricultural Economics and Rural Sociology College of Agricultural Sciences - The Pennsylvania State University
Ted Alter, Ph.D. , Professor of Agricultural, Environmental and Regional Economics
Kathy Brasier, Ph.D., Assistant Professor of Rural Sociology Diane McLaughlin, Ph.D., Professor of Rural Sociology & Demography
Fern K. Willits, Ph.D., Distinguished Professor of Rural Sociology
The Institute for Public Policy & Economic Development A partnership among Keystone College, King’s College, Luzerne County Community College,
Marywood University, Misericordia University, Penn State Wilkes-Barre, The Commonwealth Medical College, University of Scranton, & Wilkes University
Teri Ooms, MBA, Executive Director
Sherry Tracewski, MPP, Research & Policy Analyst
August 31, 2010
2
Table of Contents Organization Information ..................................................................................................................... 4
Institutional Affiliations ................................................................................................................... 5 Acknowledgements .......................................................................................................................... 5
Introduction .......................................................................................................................................... 6 Background .................................................................................................................................. 6
Research Methodology & Limitations ................................................................................................. 7 The Survey ....................................................................................................................................... 7 Pennsylvania Interviews ................................................................................................................... 7 Arkansas & Texas Interviews .......................................................................................................... 9
Executive Summary ........................................................................................................................... 10 The Survey ................................................................................................................................. 10 Pennsylvania Interviews ............................................................................................................. 12 Arkansas and Texas Interviews .................................................................................................. 13 Conclusion .................................................................................................................................. 15
Data Analysis & Summary ................................................................................................................. 18 The Survey ..................................................................................................................................... 18
Introduction ................................................................................................................................ 18 The Survey ..................................................................................................................................... 19
Ascertaining the Current Views of Residents about Marcellus Gas Development .................... 21 Summary .................................................................................................................................... 31 Assessing Residents’ Attitudes Toward and Participation in their Communities ...................... 32 Summary .................................................................................................................................... 35 Exploring the Social Bases of Differences in Residents’ Knowledge and Attitudes ................. 36 Summary .................................................................................................................................... 43 Conclusions/Discussion ............................................................................................................. 43
Pennsylvania Interviews ................................................................................................................. 45 Introduction ................................................................................................................................ 45 Case Study Selection .................................................................................................................. 46 Data Analysis ............................................................................................................................. 48 Summary .................................................................................................................................... 55 Conclusion .................................................................................................................................. 56
3
Arkansas & Texas Interviews ........................................................................................................ 57 Introduction ................................................................................................................................ 57 Case Study Selection .................................................................................................................. 58 Data Analysis ............................................................................................................................. 61 Summary .................................................................................................................................... 65 Conclusion .................................................................................................................................. 66
References .......................................................................................................................................... 68 Appendix Appendix A Household Survey Questionnaire…………………………………………………70 Appendix B Household Survey Frequency Tables……………………………………………..70 Appendix C Pennsylvania Interview Questions………………………………………………..70 Appendix D Arkansas & Texas Interview Questions…………………………………………..70
4
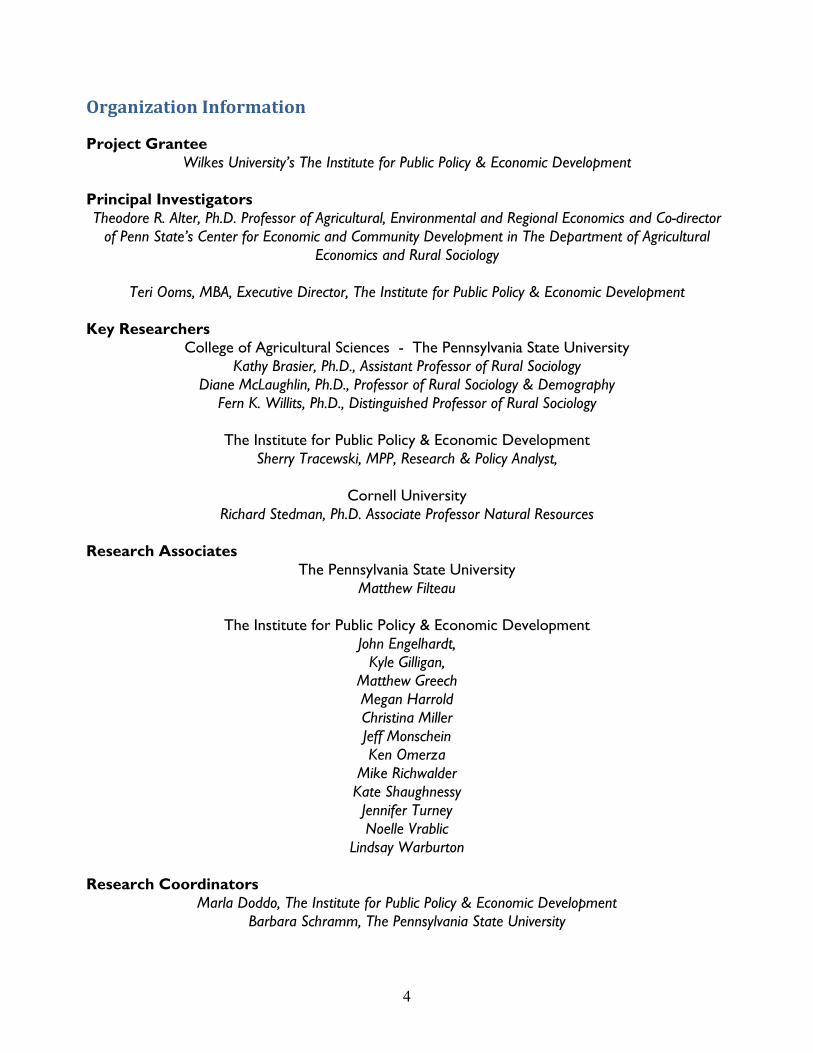
Organization Information Project Grantee
Wilkes University’s The Institute for Public Policy & Economic Development Principal Investigators Theodore R. Alter, Ph.D. Professor of Agricultural, Environmental and Regional Economics and Co-director
of Penn State’s Center for Economic and Community Development in The Department of Agricultural Economics and Rural Sociology
Teri Ooms, MBA, Executive Director, The Institute for Public Policy & Economic Development
Key Researchers
College of Agricultural Sciences - The Pennsylvania State University Kathy Brasier, Ph.D., Assistant Professor of Rural Sociology
Diane McLaughlin, Ph.D., Professor of Rural Sociology & Demography Fern K. Willits, Ph.D., Distinguished Professor of Rural Sociology
The Institute for Public Policy & Economic Development
Sherry Tracewski, MPP, Research & Policy Analyst,
Cornell University Richard Stedman, Ph.D. Associate Professor Natural Resources
Research Associates
The Pennsylvania State University Matthew Filteau
The Institute for Public Policy & Economic Development
John Engelhardt, Kyle Gilligan,
Matthew Greech Megan Harrold Christina Miller Jeff Monschein Ken Omerza
Mike Richwalder Kate Shaughnessy Jennifer Turney Noelle Vrablic
Lindsay Warburton Research Coordinators
Marla Doddo, The Institute for Public Policy & Economic Development Barbara Schramm, The Pennsylvania State University
5
Institutional Affiliations The Institute for Public Policy & Economic Development The Institute for Public Policy & Economic Development is a research based think tank founded and managed by Wilkes University in collaboration with Keystone College, King’s College, Luzerne County Community College, Marywood University, Misericordia University, Penn State Wilkes-Barre, The Commonwealth Medical College, and the University of Scranton. The Institute for Public Policy & Economic Development (The Institute) provides research, technical assistance, and facilitation and convening services to: analyze components for regional prosperity; create state and local government development strategies; impact studies; market; and feasibility studies. The Institute’s mission is to empower our customers to make good choices based on sound research, objective data, and best practices. It mobilizes the resources of regional institutions of higher education to engage business and communities in planning that is informed by research, energized by broad participation, and validated by successful implementation. Center for Economic and Community Development in the Department of Agricultural Economics & Rural Sociology The Department of Agricultural Economics and Rural Sociology, College of Agricultural Sciences, The Pennsylvania State University, conducts research, teaching and outreach in four interrelated areas: agriculture and food; environment and natural resources; community, regional and international development; and population processes and change. Located within the department, the Center for Economic and Community Development conducts research and education on economic, social, and public policy issues useful to local development organizations, citizens, and elected and appointed government officials.
Acknowledgements The project was made possible through a research grant from the Appalachian Regional Commission. Special thanks to Neil Fowler, Statewide Program Manager, Pennsylvania Department of Community & Economic Development for his support and guidance throughout the project.
6
Introduction The presence of vast natural gas reserves in the region known as the Marcellus Shale – an area including much of Pennsylvania and stretching from New York to West Virginia – has been known for decades. This geography represents a large portion of Appalachia. However, recent emphasis on domestic energy production, coupled with new technologies that make the recovery of these natural gas reserves cost effective, have led to increasing interest and activity directed toward developing these resources.
Most of the counties within the Marcellus Shale area are rural in nature, and the potential impact of widespread gas development is expected to be profound. Such development can be an economic boon − increasing economic investments, providing jobs, spurring entrepreneurial activity, and reversing population declines. At the same time, there are economic, environmental, and social risks. The hydro-fracturing process used to free the embedded gas threatens to both deplete and pollute local water supplies, and the drill pads and pipelines can destruct forests, alter wildlife habitats, and destroy landscape amenities. The influx of new workers and residents is likely to overload often inadequate community services and infrastructure, result in fleeting economic prosperity, and lead to social disruption, shifts in power structures, and changing community norms and values.
Background The purpose of this project was to assess the current social and economic conditions relating to gas well development in the Marcellus Shale formation in New York and Pennsylvania, with the goal of obtaining baseline data for future longitudinal assessment of subsequent community changes that occur in Appalachian counties. The current report, compiled and analyzed through collaborative efforts of researchers from The Institute and Penn State, details information from the following sources: 1) A Survey of Residents living in the Marcellus Region. A mail survey of a sample of 1,461 households within selected Appalachian counties in the Marcellus Shale region in Pennsylvania was carried out to ascertain current views of residents concerning gas industry development in their areas and to obtain information about their perceptions of their communities. 2) Interviews with Key Informants. Interviews of approximately 60 elected and appointed leaders, representatives of human service and educational agencies, and civic organizations were conducted in five Pennsylvania counties (Lackawanna, Luzerne, Westmoreland, Greene, and Susquehanna) and five counties in other shale rich states (Texas and Arkansas) to ascertain their perceptions of current and future economic, social, and environmental impacts associated with large scale natural gas development.
7
Research Methodology & Limitations
The Survey Geologists differ in their estimates of the exact size and location of the Marcellus Shale region. In Pennsylvania, the current research focused on the area defined by Bernstein Research as the Central Core and Tier 1 in Pennsylvania. The core and Tier 1 areas were defined in terms of depth, thickness, porosity, thermal maturity, and silica content of the shale – factors that play into the economics of the gas yield (Dell, et al. 2008). In addition to the 20 counties so defined, Washington County was added to the sampling frame because of the high incidence of drilling in that county already underway in 2009. Bernstein did not specifically define core and Tier 1 areas in New York other than to indicate that, Sullivan and Delaware Counties had experienced some activity. These, along with six other New York counties, were added to the sample area in consultation with representatives of the project at Cornell University.1 Thus, 29 counties in Pennsylvania and New York were defined as the areas of study. In Pennsylvania, the following counties were included: Bedford, Blair, Bradford, Cambria, Cameron, Centre, Clearfield, Clinton, Fayette, Greene, Indiana, Lackawanna, Lycoming, Somerset, Sullivan, Susquehanna, Tioga, Washington, Wayne, Westmoreland, and Wyoming. In New York, Broome, Chemung, Delaware, Schuyler, Steuben, Sullivan, Tioga, and Tompkins were included. An addressed-based sample of 4,496 cases was drawn at random from these counties by a commercial sampling organization (GENESYS). Questionnaires, together with a cover letter and postage-paid return envelope were mailed to the addresses, beginning in October 2009. Three subsequent mailings over the next 5 months sought to increase the response rate. Completed survey forms continued to arrive through April 2010. Of the 4,496 addresses in the sample 421 were vacant and were returned by the post office as “undeliverable.” A total of 1,461 of the remaining 4,075 questionnaires were returned with usable data – a 36% response rate. Females, younger subjects, and those who terminated their formal schooling with no post high school education were underrepresented in the sample.
Pennsylvania Interviews Counties were chosen as study sites because they have had high levels of Marcellus Shale activity. They were also chosen to represent regional differentiation as well as differences in population
1Although the current grant covered only the Pennsylvania counties, additional funding from the College of Agricultural Sciences at Penn State and from Cornell University allowed for expanding the survey to include seven (7) counties in New York. Data from that study have been combined with the Pennsylvania survey and are presented in the current report.
8
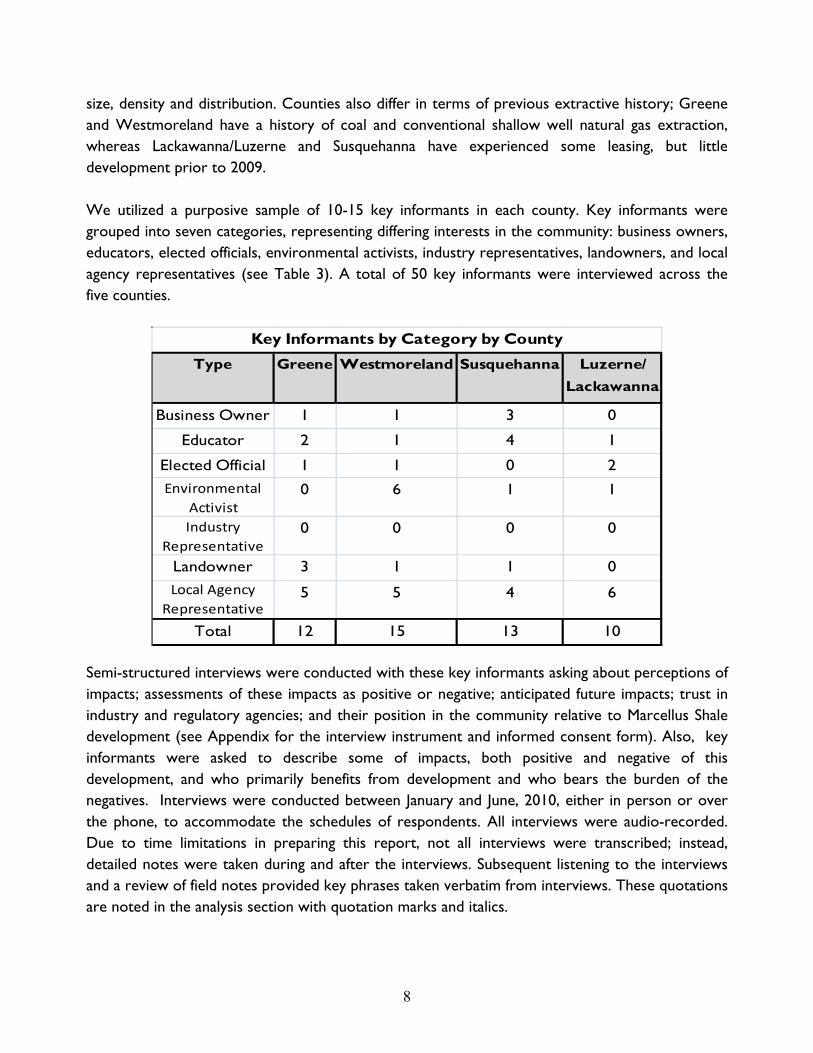
size, density and distribution. Counties also differ in terms of previous extractive history; Greene and Westmoreland have a history of coal and conventional shallow well natural gas extraction, whereas Lackawanna/Luzerne and Susquehanna have experienced some leasing, but little development prior to 2009. We utilized a purposive sample of 10-15 key informants in each county. Key informants were grouped into seven categories, representing differing interests in the community: business owners, educators, elected officials, environmental activists, industry representatives, landowners, and local agency representatives (see Table 3). A total of 50 key informants were interviewed across the five counties.
Type Greene Westmoreland Susquehanna Luzerne/ Lackawanna
Business Owner 1 1 3 0
Educator 2 1 4 1
Elected Official 1 1 0 2Environmental
Activist0 6 1 1
Industry Representative
0 0 0 0
Landowner 3 1 1 0Local Agency
Representative5 5 4 6
Total 12 15 13 10
Key Informants by Category by County
Semi-structured interviews were conducted with these key informants asking about perceptions of impacts; assessments of these impacts as positive or negative; anticipated future impacts; trust in industry and regulatory agencies; and their position in the community relative to Marcellus Shale development (see Appendix for the interview instrument and informed consent form). Also, key informants were asked to describe some of impacts, both positive and negative of this development, and who primarily benefits from development and who bears the burden of the negatives. Interviews were conducted between January and June, 2010, either in person or over the phone, to accommodate the schedules of respondents. All interviews were audio-recorded. Due to time limitations in preparing this report, not all interviews were transcribed; instead, detailed notes were taken during and after the interviews. Subsequent listening to the interviews and a review of field notes provided key phrases taken verbatim from interviews. These quotations are noted in the analysis section with quotation marks and italics.
9
Every attempt was made to ensure that the study participants would represent the range of views of leaders within each of the selected study communities. The approach to selecting individuals – identifying leaders within specific organizations and county-based leadership positions – may have led to missing potential informal opinion leaders or others with divergent opinions. This analysis does not provide a statistical summary or assess the prevalence of these views among participants. The strength of this case study approach is that it is able to describe in great detail and depth the nuances of views on development of the Marcellus, and link them to contextual factors that likely affect the origin of those views. The combination of the quantitative survey data of residents’ views with the qualitative data of leaders’ views provides a powerful picture of issues surrounding the development of the Marcellus Shale in Pennsylvania.
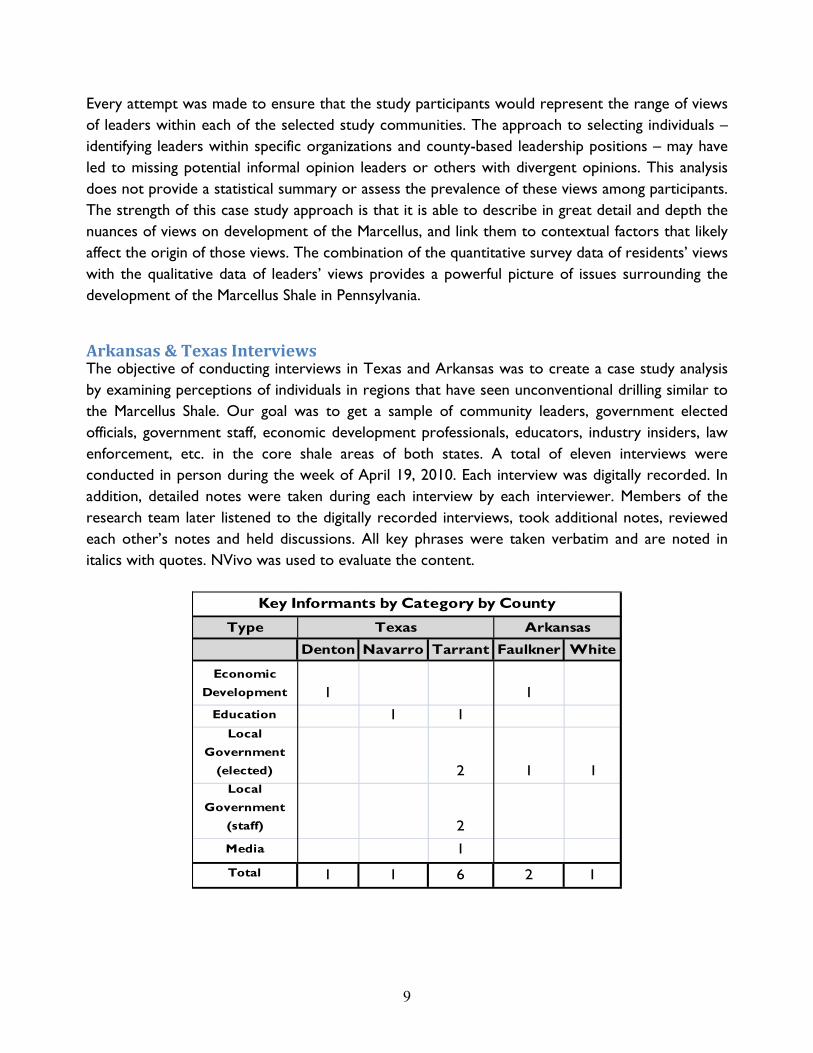
Arkansas & Texas Interviews The objective of conducting interviews in Texas and Arkansas was to create a case study analysis by examining perceptions of individuals in regions that have seen unconventional drilling similar to the Marcellus Shale. Our goal was to get a sample of community leaders, government elected officials, government staff, economic development professionals, educators, industry insiders, law enforcement, etc. in the core shale areas of both states. A total of eleven interviews were conducted in person during the week of April 19, 2010. Each interview was digitally recorded. In addition, detailed notes were taken during each interview by each interviewer. Members of the research team later listened to the digitally recorded interviews, took additional notes, reviewed each other’s notes and held discussions. All key phrases were taken verbatim and are noted in italics with quotes. NVivo was used to evaluate the content.
Type
Denton Navarro Tarrant Faulkner White
Economic Development 1 1
Education 1 1Local
Government (elected) 2 1 1
Local Government
(staff) 2Media 1
Total 1 1 6 2 1
Texas Arkansas
Key Informants by Category by County
10
Executive Summary
The Survey Of the 4,496 addresses in the sample 421 were vacant and were returned by the post office as “undeliverable.” A total of 1,461 of the remaining 4,075 questionnaires were returned with usable data – a 36% response rate. Taken together these findings suggest that most of the survey participants knew only a little about the nature and development of the natural gas industry occurring in their region. Four out of ten had talked with neighbors and friends about the changes and issues that may accompany such development, but few had sought objective information from authoritative sources. Most of their knowledge had been gleaned from media reports and discussions with others. Fewer than half reported they owned land in the region, and many of these did not own, or did not know if they owned the mineral rights. Fewer than one in five had been approached about signing a lease, just 10% had done so, and fewer than 2% actually had drilling or pipeline activity on their land. Although more than a fourth hoped to get a future job in the gas industry, virtually no one who responded to the survey was currently employed there. Many of the subjects did not believe that developing the natural gas industry would impact materially on most community services and on the overall quality of life. However, with the exception of jobs and job training opportunities, they were more likely to expect a worsening of the amenities and services in the area rather than an improvement. A majority believed that the availability of good jobs would increase, although they also felt that the quality of the natural environment and drinking water would get worse, and a sizable minority were concerned about worsening of roads and increases in the cost of living. Nevertheless, proportionately more than twice as many respondents indicated they supported developing the natural gas industry in the Marcellus Shale than were opposed, and a third reported they neither supported nor opposed such development. Asked to agree or disagree with a series of attitude questions about their views, the most common response was to take a neutral position. There was general support for natural gas extraction as a means of decreasing the nation’s reliance on foreign energy resources, and a majority felt that any negative impacts from the drilling can be prevented. More people disagreed than agreed that problems created by development of the Marcellus Shale could be fixed and just under half agreed that only a few people in the area would benefit from the development. However, for most items, there was little consensus in attitudes. Three quarters of the survey respondents living in the Marcellus Shale region described the area in which they lived as being in the country or in a small town. Most had lived in their current county more than 20 years, many had kin nearby, and most expressed strong personal attachment to the
11
area. The apparent stability of these communities was reflected in the tendency of residents to have limited interactions with others who differed from them in regard to race/ethnicity, wealth, education, and even political views. They were unlikely to place a great deal of trust in state and local government, the media, businesses, and new comers to their communities. They rated their communities positively in regard to neighborliness/friendliness and the quality of the natural environment, expressed strong community ties and trust in their neighbors and workmates. However, they were critical of the limited availability of jobs. Likely influenced by the lack of jobs and the current stagnant economy, many felt that their communities were worse off today than five years ago, and predicted that things would worsen still more in the next five years. Both personal attributes of the respondents and contextual characteristics of their counties of residence were found to be associated with the amount of knowledge respondents felt they had about the possible economic, social, and environmental impacts of, and the nature and procedures involved in Marcellus gas drilling. Educational and income levels were both strongly and positively associated with greater reported knowledge, presumably reflecting greater access to information and (perhaps) greater understanding of the information obtained. Greater community involvement would be expected to increase interaction with other residents (a primary source of information for residents living in the Shale area) and to enhance the likelihood of their access to and involvement with groups committed to addressing issues related to drilling. Males reported higher levels of knowledge than females. The number of wells drilled, visible reminders of the presence of the developing industry, likely fostered increased media coverage and residents’ discussion of possible changes inherent in the industry’s development. The significant negative association of population density with reported knowledge levels may reflect a more obvious presence of drilling activities in counties where there are fewer people and hence fewer distracting activities to garner attention. Attitudes toward deep well drilling also differed depending upon both the personal and county characteristics of respondents, but the combined effects of these factors was less than that for reported knowledge. Gender, age, education, income, and community involvement were associated with how people felt about drilling. Males and those with higher incomes expressed more positive attitudes than did their opposites. However, education was negatively associated with Attitude Scores, suggesting that respondents with more years of formal schooling were perhaps more concerned about the environmental or social impacts of drilling, and that such concern led to less positive evaluations of the industry.
12
Pennsylvania Interviews Economic Impacts: Participants from all four study counties described economic growth, especially in the food service, hospitality, and retail industries (hotels/motels, restaurants, bars, convenience stores, etc.). The two more densely populated counties, Westmoreland and Lackawanna, indicated that they are becoming regional ‘hubs’ for the natural gas industry. Because of their physical infrastructure (warehouses, office space, transportation corridors), gas companies and their subcontractors are locating their offices and equipment in these central locations where they can easily access well sites and pipelines. For those counties where leasing and drilling are occurring, participants also described increases in wealth of landowners who have signed leases and tension over the differential lease and royalty rates. This was especially acute in the counties in the southwestern part of the state, Westmoreland and Greene, with histories of leasing for coal and shallow natural gas. Because of this history, landowners might not own their sub-surface rights. Surface owners have little recourse if the owners of the sub-surface rights choose to lease those rights. Nearly all study participants expressed support for some form of taxation (a severance and/or property tax) on the natural gas industry that would provide revenue for communities affected by development. This was seen not only as remuneration for expenses directly attributable to the industry, but also as an opportunity to improve the community, its infrastructure, and what it has to offer its residents. Social Impacts: The most significant social concern expressed among study participants was the fear that development of the Marcellus Shale would create or exacerbate inequalities among local residents. This can occur directly (i.e., those with leases and royalty income versus those without) and indirectly by making life harder for those already disadvantaged. This was most often conveyed in terms of housing problems, but was also described in terms of increased cost of living and limited access to services. Several participants expressed frustration with and distrust of the natural gas industry. In Westmoreland and Greene Counties, actions of industry land men early in the development of the Marcellus Shale were seen as duplicitous, taking advantage of landowners’ lack of knowledge. In Susquehanna County, problems with one company have led many to distrust the industry. Infrastructure: Roads and traffic issues top the list of concerns about physical infrastructure in all four counties. Managing growth was a concern because of the potential costs to municipalities to extend water

13
and sewer lines. The cost and availability of housing is a significant concern in the rural counties. Participants in Greene and Susquehanna Counties described how sky-rocketing rents were making it extremely difficult for residents to find adequate, affordable housing. This was not seen in Lackawanna or Luzerne where little development has taken place, and population centers were described as able to handle more demand. Aesthetic Quality and Environmental Health: Study participants expressed concern about the impacts on the landscape, and relatedly, their desire to live in the area. For many, the rural nature of these areas is the reason they live where they do; they feared that development of the Marcellus would permanently degrade the amenities and quality of life they’ve come to appreciate. Concerns over environmental health were raised by study participants in Westmoreland and Susquehanna Counties. These concerns include water quality and quantity, forest fragmentation and wildlife habitat. Participants in Susquehanna were particularly attuned to environmental concerns given the incidents in Dimock. Dimock, a small town in Susquehanna County, has been very active in drilling and during 2009 and early 2010; there were a number of accidents ranging from potential well contamination to spills and other accidents.
Arkansas and Texas Interviews Economic Impacts: Respondents in both Texas and Arkansas discussed the positive economic impact natural gas development had on their regions. These impacts included the addition of direct and indirect jobs to the local area. Also discussed was the ripple effect the presence of the industry has had on hotels, restaurants and retail. Interviewees also discussed the increase in income many landowners who have leased their property have seen. One interviewee called it an injection of revenue into the local economy. Social Impacts: Study respondents discussed that some groups have formed in opposition to natural gas drilling. These groups, for the most part, exist to prevent drilling in a neighborhood or housing development. They form due to the fact that sub-surface mineral rights trump surface rights in Texas and Arkansas, and many times property owners cannot prevent a well from being built on their property. There did not appear to be distrust for the natural gas industry in either state. However, many of the study participants indicated that although they did not have any distrust with the industry, property owners who believed they were wronged by a company tended to have distrust for the
14
industry as a whole. In addition, key informants in both states discussed their perception that land men were not up front with landowners and that caused a level of distrust among residents. Two key informants ran educational programs that were created as a direct result of the Barnett Shale. One was an undergraduate minor in Energy Technology and Management at Texas Christian University. So far 245 students have minored in the program. The other program was a certificate program in Oil and Gas Production Technology. The program began in 2008 and 274 students have graduated with their certificate from Navarro Community College. Infrastructure: Road damage and traffic was one of the biggest concerns among interviewees. Arkansas participants described in detail how these issues were affecting each county studied. Roads were not made to sustain the current amount of impact caused by the increased truck traffic. In Texas, one government official indicated companies must define the route they will take to each drill site so that the damage can be accurately assessed. In Arkansas, a government official stated he wished he insisted on obtaining route information from firms prior to the drilling as they never anticipated the large number of tri-axle trucks that would be traveling these roads daily, weekly, and monthly. Environment: In Texas, participants discussed how the current discussion among residents in the region is focused on air quality and the amount of benzene in the air. Several interviewees mentioned that residents in the local area are concerned about high levels of benzene potentially caused by drilling. However, the Texas Commission on Environmental Quality has not yet come up with conclusive evidence proving that to be the case. In Arkansas, the concern was about water quality and damage to surface water. Arkansas government officials reported no well contamination yet. They have developed stringent testing and regulation. Government Key informants in Texas and Arkansas indicated that local government resources will be strained. Additional people are needed on the local level to carry out government functions as shale development proceeds. Local governments should have one point person who knows a single point of contact in each drilling company, has access to all truck routes, and encourages these companies to use local businesses, even providing them with necessary information about the local business community. Local government ordinances should be comprehensive and strong. They should be re-evaluated regularly.
15
Conclusion In general, most Pennsylvania study participants described development of the Marcellus Shale as a chance for ‘economic revival,’ but raised many concerns about the potential costs to various segments of the community, infrastructure, and natural environment. They expressed a desire for development strategies and tools for managing growth that provide the most benefits to their counties. Taxes were described frequently as one potential tool to provide direct income to local jurisdictions. Training programs for educating the local population for entry into gas exploration and development fields was another tool discussed for distributing the benefits from Marcellus development. Participants also wanted information that could guide their decision-making and allow them to anticipate emerging problems. Although many participants were uncertain about the likely trajectory of the development, they expressed hope that developing the Marcellus play would benefit their communities. The research study identified that while residents admittedly knew little about shale, they were supportive of the development of the industry. They did, however, indicate that they believed there could be environmental issues. Many residents that participated in the survey owned land in the shale play and some had leases. Key informants in Pennsylvania indicated that they have begun to see positive economic impact as a result of the Marcellus Shale play, but also note that the cost of living has increased and the average individual may now have difficulty buying a home or even renting an apartment. They fear continuation of these trends could increase gentrification. The wear and tear on roads is already noticeable and a concern. Further, Pennsylvania informants also indicate mineral rights tied to properties and erratic lease rates offered by natural gas industry land men are a cause for consternation and conflict, and are leading to law suits. Overall, despite mentioning some negative aspects of the natural gas play, interviewees in Arkansas and Texas had overwhelmingly positive attitudes toward natural gas drilling and the industry as a whole. Both experienced economic booms as a result of drilling and development, and acknowledge that the presence of the industry prevented job loss and even created thousands of new jobs opportunities. This economic impact greatly contributes to the positive attitudes. Comments regarding the negative side of the industry consisted of road damage, traffic (more so in Arkansas) and environmental concerns such as air and water quality. Respondents mainly agreed that the positives greatly outweighed the negatives. Key informants in Arkansas and Texas were asked if they had any advice or “lessons learned” that they could share with us as our region further develops the Marcellus Shale. Two suggested that communication with the industry and the community was of the utmost importance. They suggested local government educate residents about the process and the business. One education professional suggested community college-level programs focus on production rather than drilling because production jobs are more stable and long term. Local government officials in both Texas
16
and Arkansas strongly suggested local government require the industry to provide them with the routes they will follow to each drilling site before drilling begins. Such information will help local governments to better anticipate and assess road damage and avoid possible traffic accidents. A suggestion was made to have a point person in the county work with a single point of contact in each drilling company. Recommendations for local government were simple ― they must have a strong set of comprehensive ordinances in place regulating all aspects of drilling operations and encourage the state to upgrade all its regulations and tax codes. Texas interviewees were very supportive of natural gas development. Their experience in exploration and drilling helped them prepare for the new horizontal fracking technology. Texas, in particular, has a set of drilling regulations that have undergone two or three revisions in the past 12 years. They believe that their state and regions have fared well in this recession due to natural gas drilling, Texas’ issues stem from the gas companies’ right of eminent domain and their “insensitivity” to where they locate drill sites and pipelines. Informants indicated that they are waiting for detailed analysis from the Texas Commission on Environmental Quality (TCEQ) before concluding that the drilling is affecting air quality and increasing particulate matter into the air. Arkansas interviewees were more open with regard to potential “negative” issues of drilling. It should be noted that they are very positive and supportive of the industry; however, they are realistic about the negative impacts. They also boast of never having any water contamination issues. The Arkansas and Texas county administrators interviewed both expressed concern for local governments in light of natural gas development in Pennsylvania. They compared Pennsylvania to themselves in a “pre-drilling” phase, and believed their experiences provide important insights for Pennsylvania government officials. While they believe they have addressed most problems, they still have issues with their state’s regulatory and tax systems. Specifically, money does not trickle down into the communities to mitigate drilling issues. They also believe the state’s low severance tax is an issue and it should be increased. More pertinent to the discussion was that they believe Pennsylvania’s regulatory and tax environment is antiquated and needs immediate attention. The Arkansas government leaders indicated a contingent from Arkansas state government and several county governments spent time in Texas with leaders to discuss and review Texas regulation and taxation in order to learn as much as possible before they began to develop their own. While the study identified a baseline perception of residents, the interviews provided real time accounts of opportunities and issues. The Texas and Arkansas interviews do identify potential advantages and risks – and a means to resolve them, their accounts validate what many in Pennsylvania know. Perhaps the best takeaway from the Arkansas and Texas experiences is that
17
regulatory and tax codes must be revised expeditiously as opposed to being mired in an ongoing political debate over these issues, as is currently the case. Pennsylvania has been slow to react to drilling when leasing activity began to escalate in late 2007 and early 2008. The industry is here and it is vested. The natural resource is here and is now accessible. The present is the perfect time to ensure Pennsylvania can profit from the opportunity it affords for the long-term while protecting its air, its water, and its overall environment.
18
Data Analysis & Summary
The Survey
Introduction In 2009-2010, a household survey of residents in the Marcellus Shale region in Pennsylvania1 was conducted to obtain information on residents’ perceptions and attitudes of residents living in the region toward the emerging natural gas industry. In a democratic society, understanding the opinions of the citizenry is important if public officials, community leaders, and business representatives are to be held accountable by citizens. The survey was planned as a benchmark against which changes in residents’ views over time could be measured. As a result, information was also sought concerning respondents’ perceptions of and satisfactions with their communities today, and the positive and negative economic, social, and environmental outcomes they foresaw for the future. The availability of such baseline information for monitoring changes in residents’ views across time as circumstances are altered and new information on positive and negative impacts emerge can assist in educational efforts, program planning, and policy response by local, state, and regional decision-makers as they seek to meet the needs of their constituents. Drilling in the Marcellus Shale began in 2005, but development of the industry was slow until 2008 when leasing became extensive followed by improvements to horizontal hydraulic fracturing or “fracking” and the availability of the equipment was expanded. Although rapid development of the industry was forecast, low prices for natural gas slowed the expected growth until late 2009. As a result, this 2009-2010 study occurred during the early stages of the industry’s expansion, making it an appropriate baseline from which changes in public attitudes and actions related to the emerging industry can be assessed in the future. Analysis of data from this survey focused on the following objectives:
• Ascertain the current views of residents within the Marcellus Shale region concerning their knowledge and attitudes about the economic, social, and environmental outcomes they foresee for the future as a result of the proposed gas development as well as their sources of information.
• Assess their attitudes toward and participation in their communities today to provide information for understanding the setting in which these public views exist.
• Explore the social bases of differences in residents’ knowledge and attitudes about the Marcellus gas development by assessing the relationships of subjects’ views to their personal characteristics (e.g. age, gender, education, employment status, length of time and involvement in the community) and county-level factors available from other data sources
19
(e.g. location, number of wells drilled, population size/density, income and education levels, unemployment rates).
The Survey Geologists differ in their estimates of the exact size and location of the Marcellus Shale region. In Pennsylvania, the current research focused on the area defined by Bernstein Research as the Central Core and Tier 1 in Pennsylvania. The core and tier 1 areas were defined in terms of depth, thickness, porosity, thermal maturity, and silica content of the shale – factors that play into the economics of the gas yield (Dell, et al. 2008). In addition to the 20 counties so defined, Washington County was added to the sampling frame because of the high incidence of drilling in that county Bedford, Blair, Bradford, Cambria, Cameron, Centre, Clearfield, Clinton, Fayette, Greene, Indiana, Lackawanna, Lycoming, Somerset, Sullivan, Susquehanna, Tioga, Washington, Wayne, Westmoreland, and Wyoming. An addressed-based sample of 4,496 cases was drawn at random from these counties by a commercial sampling organization (GENESYS). Questionnaires, together with a cover letter and postage-paid return envelope were mailed to the addresses, beginning in October 2009. Three subsequent mailings over the next 5 months sought to increase the response rate. Completed survey forms continued to arrive through April 2010. Of the 4,496 addresses in the sample 421 were vacant and were returned by the post office as “undeliverable.” A total of 1,461 of the remaining 4,075 questionnaires were returned with usable data – a 36% response rate. Females, younger subjects, and those who terminated their formal schooling with no post high school education were underrepresented in the sample (Table 1).

20
Population SampleVariables
Gender Male 48.4 55.1 Female 51.6 44.9 Total 100 100
Age Less than 45 41.6 20.4 45 ‐ 64 36 48.3 65 and older 22.3 31.3 Total 100 100
Education Less than H.S. grad 12.8 6 High school grad 43.9 29.3 Some college 22.9 33.7 Bachelor's degree/Graduate work 20.4 31 Total 100 100
Table 1. Distributions of gender, age, and education in the sample and in the sampled population
%
While responses to mail surveys are often selective for males, older persons, and those with higher education, the discrepancies between the US Census parameters and the current sample are indeed large, suggesting that estimates of parameters based on these data should be interpreted with caution. Later analysis using these baseline materials will explore methods for weighting the sample or otherwise adjusting the data to call into account response bias. However, the current analysis utilized unweighted sample data to explore the above research objectives. The questionnaire used in the survey consisted of three sections. Section A asked subjects about their communities today, including evaluations of current facilities and characteristics, personal interactions and identification with the community, and general trust and confidence in various local and state individuals and groups. Section B focused on subjects’ self-perceived knowledge about the impacts and procedures of natural gas drilling, their sources of information, the extent to which they had taken action in various ways related to the industry, landownership, their direct contacts with the gas industry via leasing and jobs, trust in various groups related to the industry, and their attitudes/support for natural gas development in the area. Section C requested information on the subjects’ personal information (gender, education, marital status, employment, income and satisfactions. A copy of the questionnaire is included in Appendix A. Tables showing the frequency distributions for all variables not specifically reported in the text of this report are included in Appendix B. These include the frequency responses to each question.
21
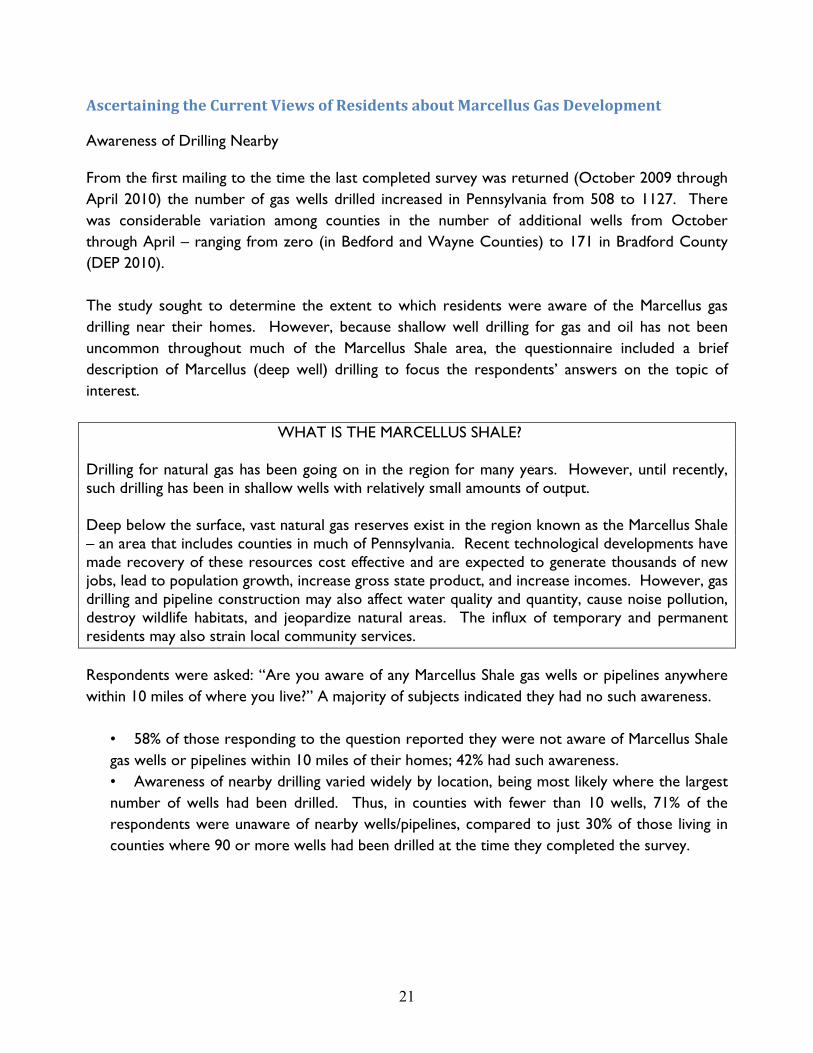
Ascertaining the Current Views of Residents about Marcellus Gas Development Awareness of Drilling Nearby From the first mailing to the time the last completed survey was returned (October 2009 through April 2010) the number of gas wells drilled increased in Pennsylvania from 508 to 1127. There was considerable variation among counties in the number of additional wells from October through April – ranging from zero (in Bedford and Wayne Counties) to 171 in Bradford County (DEP 2010). The study sought to determine the extent to which residents were aware of the Marcellus gas drilling near their homes. However, because shallow well drilling for gas and oil has not been uncommon throughout much of the Marcellus Shale area, the questionnaire included a brief description of Marcellus (deep well) drilling to focus the respondents’ answers on the topic of interest. WHAT IS THE MARCELLUS SHALE? Drilling for natural gas has been going on in the region for many years. However, until recently, such drilling has been in shallow wells with relatively small amounts of output. Deep below the surface, vast natural gas reserves exist in the region known as the Marcellus Shale – an area that includes counties in much of Pennsylvania. Recent technological developments have made recovery of these resources cost effective and are expected to generate thousands of new jobs, lead to population growth, increase gross state product, and increase incomes. However, gas drilling and pipeline construction may also affect water quality and quantity, cause noise pollution, destroy wildlife habitats, and jeopardize natural areas. The influx of temporary and permanent residents may also strain local community services. Respondents were asked: “Are you aware of any Marcellus Shale gas wells or pipelines anywhere within 10 miles of where you live?” A majority of subjects indicated they had no such awareness.
• 58% of those responding to the question reported they were not aware of Marcellus Shale gas wells or pipelines within 10 miles of their homes; 42% had such awareness. • Awareness of nearby drilling varied widely by location, being most likely where the largest number of wells had been drilled. Thus, in counties with fewer than 10 wells, 71% of the respondents were unaware of nearby wells/pipelines, compared to just 30% of those living in counties where 90 or more wells had been drilled at the time they completed the survey.
22
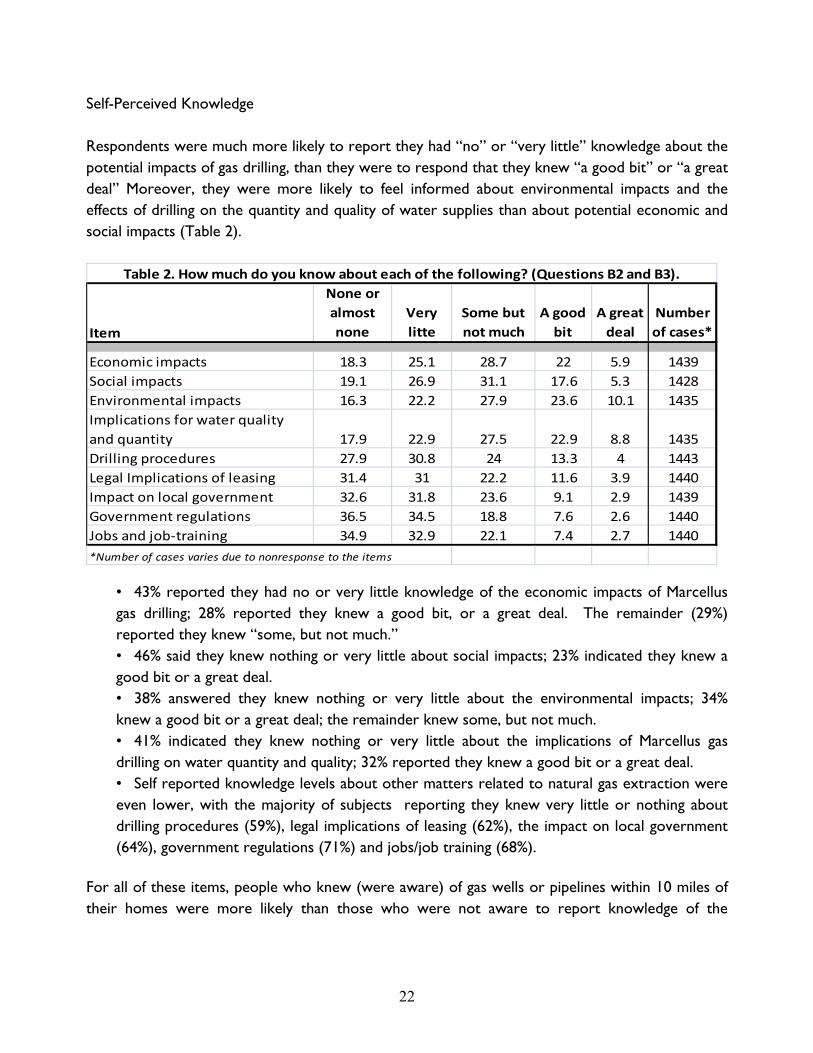
Self-Perceived Knowledge Respondents were much more likely to report they had “no” or “very little” knowledge about the potential impacts of gas drilling, than they were to respond that they knew “a good bit” or “a great deal” Moreover, they were more likely to feel informed about environmental impacts and the effects of drilling on the quantity and quality of water supplies than about potential economic and social impacts (Table 2).
Item
None or almost none
Very litte
Some but not much
A good bit
A great deal
Number of cases*
Economic impacts 18.3 25.1 28.7 22 5.9 1439Social impacts 19.1 26.9 31.1 17.6 5.3 1428Environmental impacts 16.3 22.2 27.9 23.6 10.1 1435Implications for water quality and quantity 17.9 22.9 27.5 22.9 8.8 1435Drilling procedures 27.9 30.8 24 13.3 4 1443Legal Implications of leasing 31.4 31 22.2 11.6 3.9 1440Impact on local government 32.6 31.8 23.6 9.1 2.9 1439Government regulations 36.5 34.5 18.8 7.6 2.6 1440Jobs and job‐training 34.9 32.9 22.1 7.4 2.7 1440*Number of cases varies due to nonresponse to the items
Table 2. How much do you know about each of the following? (Questions B2 and B3).
• 43% reported they had no or very little knowledge of the economic impacts of Marcellus gas drilling; 28% reported they knew a good bit, or a great deal. The remainder (29%) reported they knew “some, but not much.” • 46% said they knew nothing or very little about social impacts; 23% indicated they knew a good bit or a great deal. • 38% answered they knew nothing or very little about the environmental impacts; 34% knew a good bit or a great deal; the remainder knew some, but not much. • 41% indicated they knew nothing or very little about the implications of Marcellus gas drilling on water quantity and quality; 32% reported they knew a good bit or a great deal. • Self reported knowledge levels about other matters related to natural gas extraction were even lower, with the majority of subjects reporting they knew very little or nothing about drilling procedures (59%), legal implications of leasing (62%), the impact on local government (64%), government regulations (71%) and jobs/job training (68%).
For all of these items, people who knew (were aware) of gas wells or pipelines within 10 miles of their homes were more likely than those who were not aware to report knowledge of the
23
impacts and implications of such drilling. However, in no cases did a majority feel that they knew “a good bit” or “a great deal” about its economic, social, or environmental impacts. Thus:
• 43% of those aware of gas drilling activity nearby, compared with just 18% of those with no such awareness reported they knew at least a good bit or a great deal about the economic impacts of the gas industry. • 36% of those who were aware of drilling or pipeline construction near their homes, compared to14% of those who did not indicated they had at least a good bit of knowledge about the social impacts. • When asked about knowledge of environmental concerns and problems, 54% of those aware of nearby drilling/pipelines had a good bit or a great deal of knowledge about environmental; 46% reported they knew at least a good bit about water issues; 25% and 23% respectively of those not aware of drilling and/or pipelines nearby felt they knew at least “a good bit about these topics. • Self perceived knowledge about drilling procedures, the legal implications of leasing, impacts on local governments, the nature of government regulations related to drilling and jobs and job-training opportunities were also lower for those who were not aware of nearby wells and/or pipelines then those who had such awareness.
Sources of Knowledge Nearly one in four (24%) of those who responded to the question had actively sought information about gas development, and just over half (52%) indicated they had discussed the topic with others. Fewer than one in eight (12%) had attended a public meeting about gas development and only 6% had contacted the media or government official to express an opinion. Few had signed a petition, spoken at a public meeting, participated in a group working on gas issues, or given money to such a group (Table 3).

24
No YesNumber of cases*
Item
Sought info about gas development 75.7 24.3 1442Discussed gas development with others 51.5 48.5 1442Attended public meeting about gas development 88.4 11.6 1441Signed a petition relating to gas regulations 97.8 2.2 1439Given money to group working on gas issues 98.7 1.3 1442
Spoken at a public meeting about gas development 96.3 3.7 1442Participated in a group working on gas issues 97.3 2.7 1440Contacted the media or government officials to express opinion 93.9 6.1 1433*Number of cases varies due to nonresponse to the items.
‐‐‐‐‐‐‐‐‐‐‐‐‐‐%‐‐‐‐‐‐‐‐‐‐‐
Table 3. In the past 12 months, have you …? (Question B5)
Media reports were seen as contributing the most to respondents’ knowledge about gas well drilling, followed by neighbors/friends/relatives (Table 4).
Item
None or almost none
Very litte
Some but not much
A good bit
A great deal
Number of cases*
Media 18.4 22.4 35 17.7 6.6 1433Gas industry representatives 49.2 27.4 15.8 6.1 1.5 1422Internet 50.2 19.9 18.3 7.6 4 1417Neighbors/friends/relatives 28.9 24.7 29.4 13.4 3.7 1423Cooperative extension or other educators 58.1 23.4 11.2 5.8 1.5 1420Landowner groups 57.5 22.6 12.9 5.1 2 1422Environmental regulatory agencies 56.8 24.6 13.4 3.8 1.4 1420*Number of cases varies due to nonresponse to the items.
Table 4. How much has each of the following contributed to what you know about gas well
%
• 24% reported that a good bit or a great deal of what they knew came from media reports and an additional 35% received at least some information from this source. • 17% indicated that at least a good bit of what they knew came from neighbors, friends, and relatives, and another 29% said they got some information from these sources • 12% reported that at least a good bit of their information came from the Internet. • Other sources of at least a good bit of information were: landowner groups (7%), Cooperative Extension (7%), gas industry representatives (8%), and environmental regulatory agencies (5%).
25
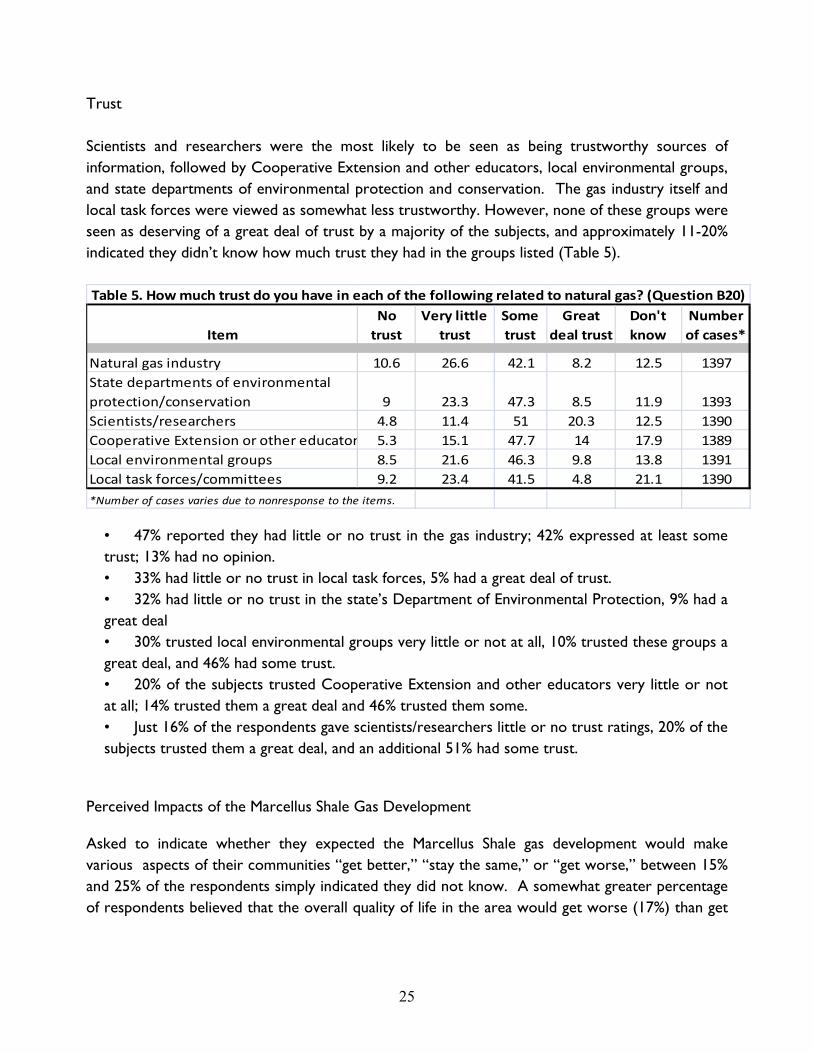
Trust Scientists and researchers were the most likely to be seen as being trustworthy sources of information, followed by Cooperative Extension and other educators, local environmental groups, and state departments of environmental protection and conservation. The gas industry itself and local task forces were viewed as somewhat less trustworthy. However, none of these groups were seen as deserving of a great deal of trust by a majority of the subjects, and approximately 11-20% indicated they didn’t know how much trust they had in the groups listed (Table 5).
ItemNo trust
Very little trust
Some trust
Great deal trust
Don't know
Number of cases*
Natural gas industry 10.6 26.6 42.1 8.2 12.5 1397State departments of environmental protection/conservation 9 23.3 47.3 8.5 11.9 1393Scientists/researchers 4.8 11.4 51 20.3 12.5 1390Cooperative Extension or other educator 5.3 15.1 47.7 14 17.9 1389Local environmental groups 8.5 21.6 46.3 9.8 13.8 1391Local task forces/committees 9.2 23.4 41.5 4.8 21.1 1390*Number of cases varies due to nonresponse to the items.
Table 5. How much trust do you have in each of the following related to natural gas? (Question B20)
• 47% reported they had little or no trust in the gas industry; 42% expressed at least some trust; 13% had no opinion. • 33% had little or no trust in local task forces, 5% had a great deal of trust. • 32% had little or no trust in the state’s Department of Environmental Protection, 9% had a great deal • 30% trusted local environmental groups very little or not at all, 10% trusted these groups a great deal, and 46% had some trust. • 20% of the subjects trusted Cooperative Extension and other educators very little or not at all; 14% trusted them a great deal and 46% trusted them some. • Just 16% of the respondents gave scientists/researchers little or no trust ratings, 20% of the subjects trusted them a great deal, and an additional 51% had some trust.
Perceived Impacts of the Marcellus Shale Gas Development Asked to indicate whether they expected the Marcellus Shale gas development would make various aspects of their communities “get better,” “stay the same,” or “get worse,” between 15% and 25% of the respondents simply indicated they did not know. A somewhat greater percentage of respondents believed that the overall quality of life in the area would get worse (17%) than get
26
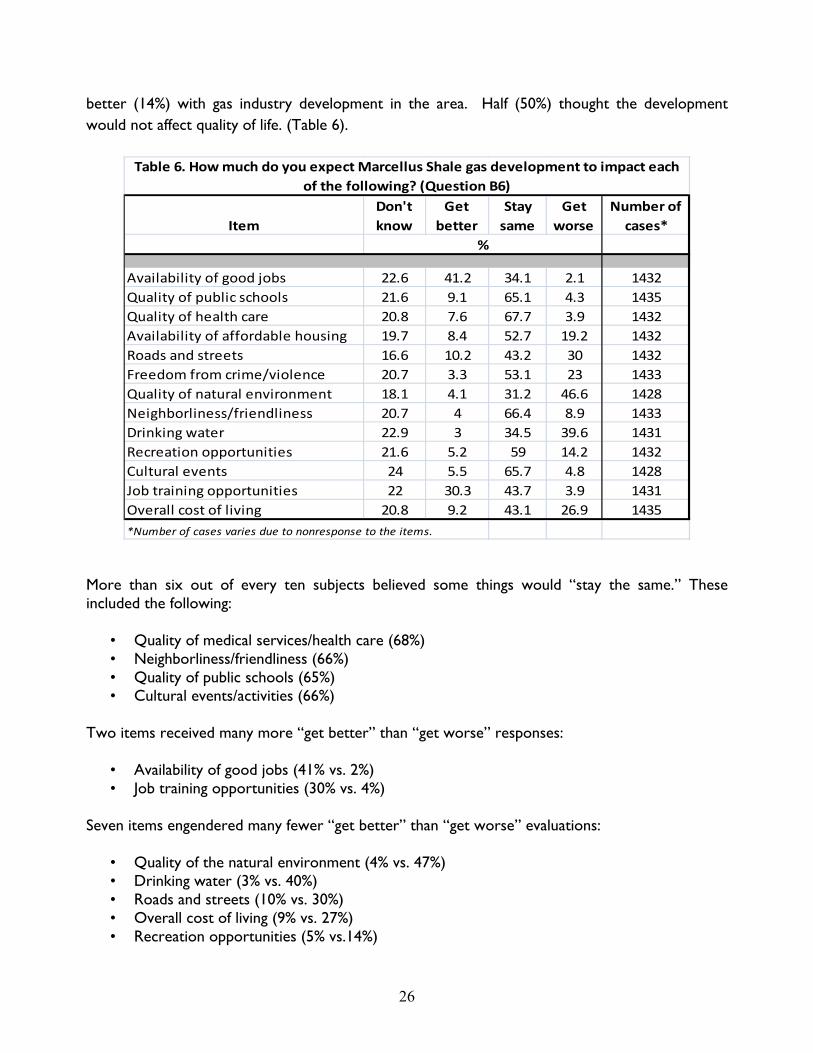
better (14%) with gas industry development in the area. Half (50%) thought the development would not affect quality of life. (Table 6).
ItemDon't know
Get better
Stay same
Get worse
Number of cases*
Availability of good jobs 22.6 41.2 34.1 2.1 1432Quality of public schools 21.6 9.1 65.1 4.3 1435Quality of health care 20.8 7.6 67.7 3.9 1432Availability of affordable housing 19.7 8.4 52.7 19.2 1432Roads and streets 16.6 10.2 43.2 30 1432Freedom from crime/violence 20.7 3.3 53.1 23 1433Quality of natural environment 18.1 4.1 31.2 46.6 1428Neighborliness/friendliness 20.7 4 66.4 8.9 1433Drinking water 22.9 3 34.5 39.6 1431Recreation opportunities 21.6 5.2 59 14.2 1432Cultural events 24 5.5 65.7 4.8 1428Job training opportunities 22 30.3 43.7 3.9 1431Overall cost of living 20.8 9.2 43.1 26.9 1435*Number of cases varies due to nonresponse to the items.
%
Table 6. How much do you expect Marcellus Shale gas development to impact each of the following? (Question B6)
More than six out of every ten subjects believed some things would “stay the same.” These included the following:
• Quality of medical services/health care (68%) • Neighborliness/friendliness (66%) • Quality of public schools (65%) • Cultural events/activities (66%)
Two items received many more “get better” than “get worse” responses:
• Availability of good jobs (41% vs. 2%) • Job training opportunities (30% vs. 4%)
Seven items engendered many fewer “get better” than “get worse” evaluations:
• Quality of the natural environment (4% vs. 47%) • Drinking water (3% vs. 40%) • Roads and streets (10% vs. 30%) • Overall cost of living (9% vs. 27%) • Recreation opportunities (5% vs.14%)
27
• Freedom from crime and violence (3% vs. 23%) • Availability of affordable housing (9% vs. 19%)
Despite the tendency to predict that gas well development would result in many negative impacts on community life, there was more support than opposition for Marcellus gas drilling in the region. When asked: “Considering everything, how do you feel about natural gas extraction from the Marcellus Shale region?”
• 47% reported they either somewhat supported (30%) or strongly supported (17%) natural gas extraction in the Marcellus shall region. • 34% neither opposed nor supported the drilling • 19% opposed or strongly opposed natural gas extraction in the region
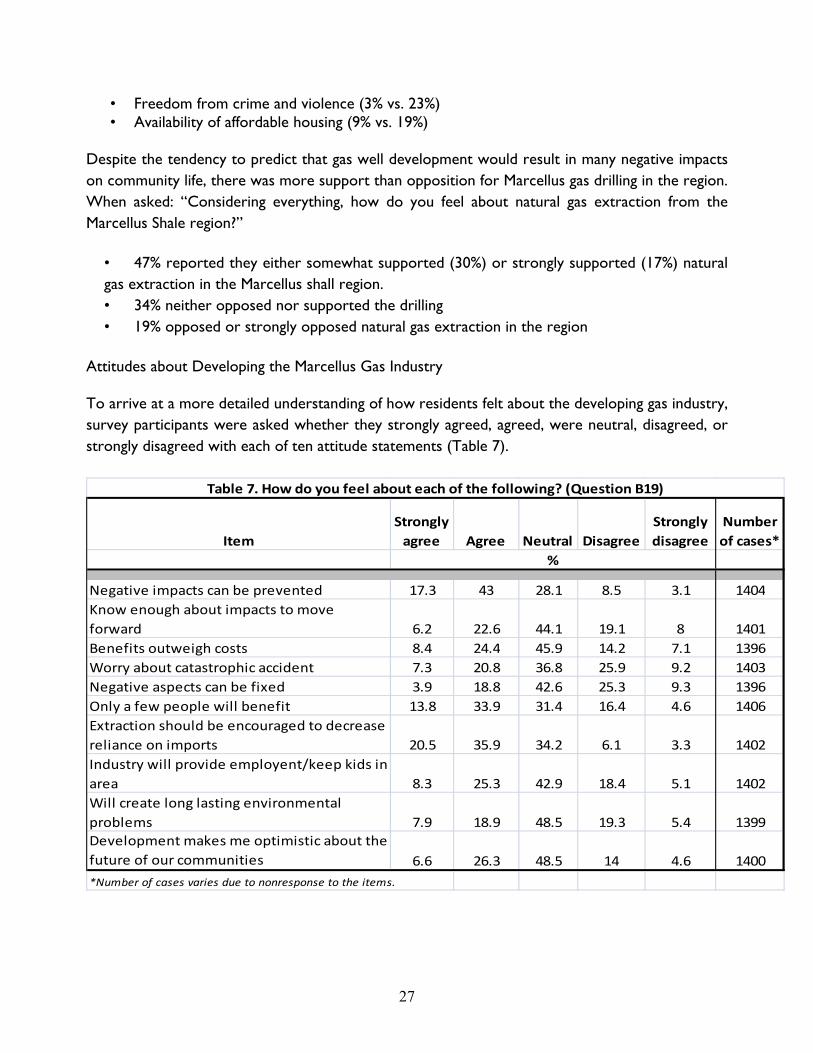
Attitudes about Developing the Marcellus Gas Industry To arrive at a more detailed understanding of how residents felt about the developing gas industry, survey participants were asked whether they strongly agreed, agreed, were neutral, disagreed, or strongly disagreed with each of ten attitude statements (Table 7).
ItemStrongly agree Agree Neutral Disagree
Strongly disagree
Number of cases*
Negative impacts can be prevented 17.3 43 28.1 8.5 3.1 1404Know enough about impacts to move forward 6.2 22.6 44.1 19.1 8 1401Benefits outweigh costs 8.4 24.4 45.9 14.2 7.1 1396Worry about catastrophic accident 7.3 20.8 36.8 25.9 9.2 1403Negative aspects can be fixed 3.9 18.8 42.6 25.3 9.3 1396Only a few people will benefit 13.8 33.9 31.4 16.4 4.6 1406Extraction should be encouraged to decrease reliance on imports 20.5 35.9 34.2 6.1 3.3 1402Industry will provide employent/keep kids in area 8.3 25.3 42.9 18.4 5.1 1402Will create long lasting environmental problems 7.9 18.9 48.5 19.3 5.4 1399Development makes me optimistic about the future of our communities 6.6 26.3 48.5 14 4.6 1400*Number of cases varies due to nonresponse to the items.
%
Table 7. How do you feel about each of the following? (Question B19)
28
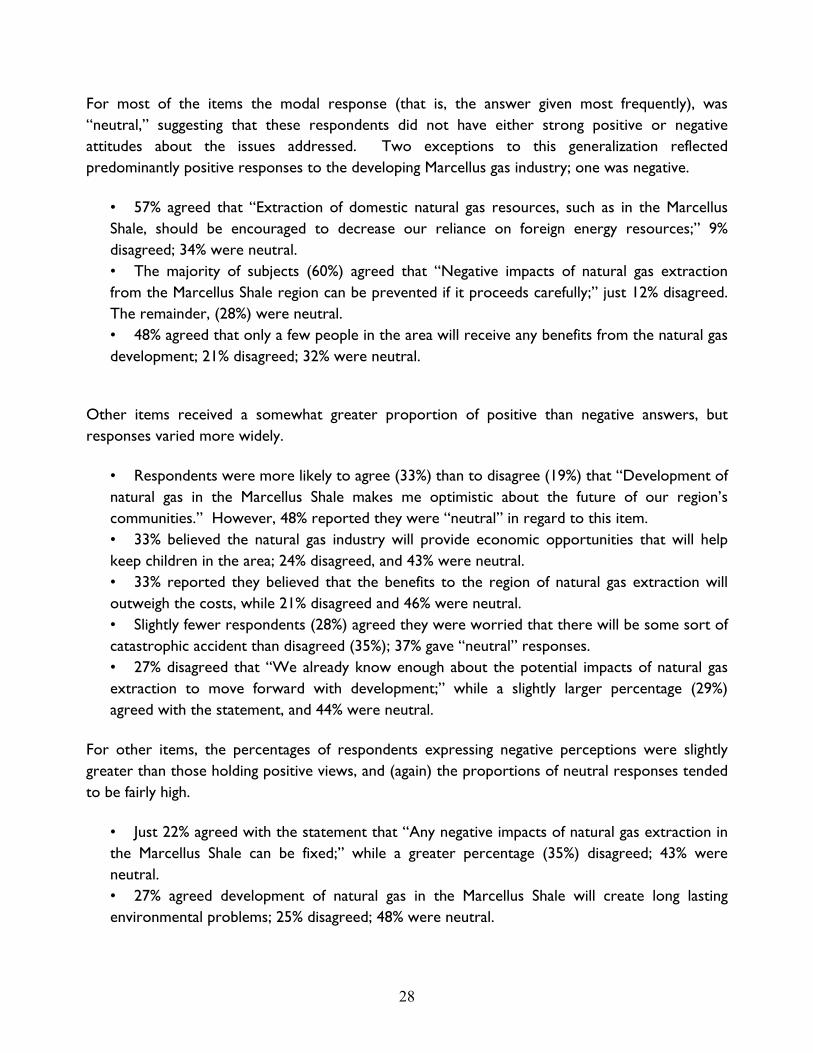
For most of the items the modal response (that is, the answer given most frequently), was “neutral,” suggesting that these respondents did not have either strong positive or negative attitudes about the issues addressed. Two exceptions to this generalization reflected predominantly positive responses to the developing Marcellus gas industry; one was negative.
• 57% agreed that “Extraction of domestic natural gas resources, such as in the Marcellus Shale, should be encouraged to decrease our reliance on foreign energy resources;” 9% disagreed; 34% were neutral. • The majority of subjects (60%) agreed that “Negative impacts of natural gas extraction from the Marcellus Shale region can be prevented if it proceeds carefully;” just 12% disagreed. The remainder, (28%) were neutral. • 48% agreed that only a few people in the area will receive any benefits from the natural gas development; 21% disagreed; 32% were neutral.
Other items received a somewhat greater proportion of positive than negative answers, but responses varied more widely.
• Respondents were more likely to agree (33%) than to disagree (19%) that “Development of natural gas in the Marcellus Shale makes me optimistic about the future of our region’s communities.” However, 48% reported they were “neutral” in regard to this item. • 33% believed the natural gas industry will provide economic opportunities that will help keep children in the area; 24% disagreed, and 43% were neutral. • 33% reported they believed that the benefits to the region of natural gas extraction will outweigh the costs, while 21% disagreed and 46% were neutral. • Slightly fewer respondents (28%) agreed they were worried that there will be some sort of catastrophic accident than disagreed (35%); 37% gave “neutral” responses. • 27% disagreed that “We already know enough about the potential impacts of natural gas extraction to move forward with development;” while a slightly larger percentage (29%) agreed with the statement, and 44% were neutral.
For other items, the percentages of respondents expressing negative perceptions were slightly greater than those holding positive views, and (again) the proportions of neutral responses tended to be fairly high.
• Just 22% agreed with the statement that “Any negative impacts of natural gas extraction in the Marcellus Shale can be fixed;” while a greater percentage (35%) disagreed; 43% were neutral. • 27% agreed development of natural gas in the Marcellus Shale will create long lasting environmental problems; 25% disagreed; 48% were neutral.
29
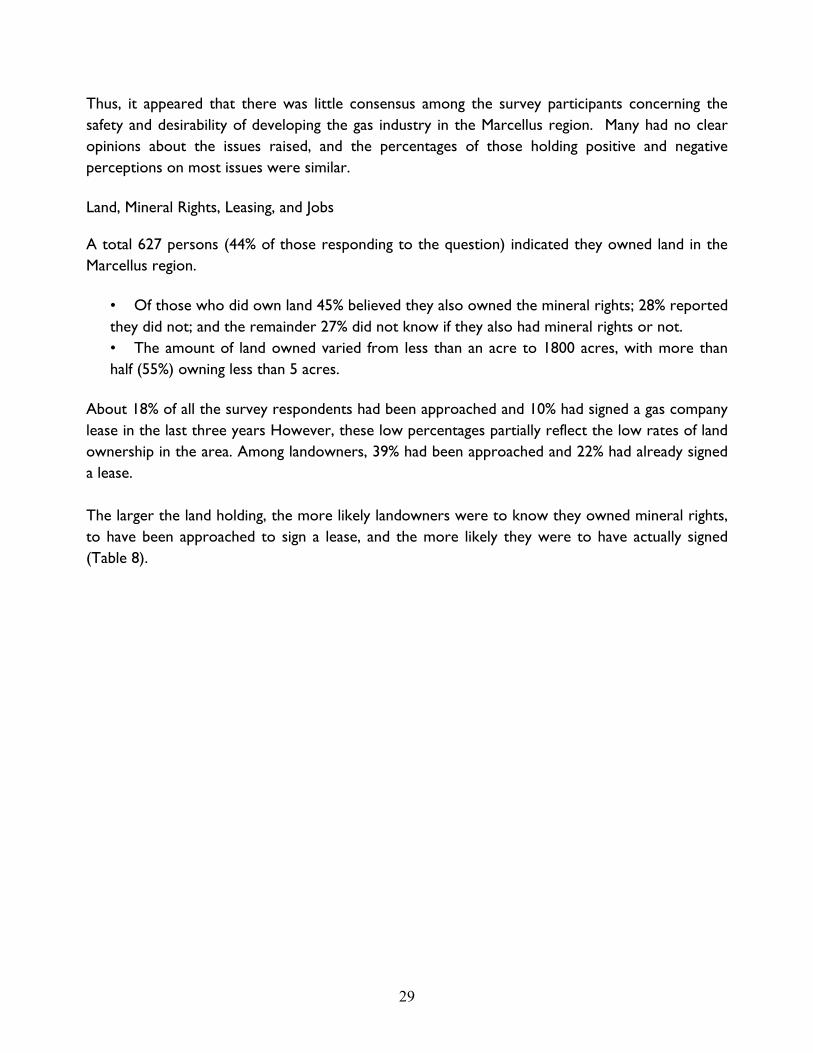
Thus, it appeared that there was little consensus among the survey participants concerning the safety and desirability of developing the gas industry in the Marcellus region. Many had no clear opinions about the issues raised, and the percentages of those holding positive and negative perceptions on most issues were similar. Land, Mineral Rights, Leasing, and Jobs A total 627 persons (44% of those responding to the question) indicated they owned land in the Marcellus region.
• Of those who did own land 45% believed they also owned the mineral rights; 28% reported they did not; and the remainder 27% did not know if they also had mineral rights or not. • The amount of land owned varied from less than an acre to 1800 acres, with more than half (55%) owning less than 5 acres.
About 18% of all the survey respondents had been approached and 10% had signed a gas company lease in the last three years However, these low percentages partially reflect the low rates of land ownership in the area. Among landowners, 39% had been approached and 22% had already signed a lease. The larger the land holding, the more likely landowners were to know they owned mineral rights, to have been approached to sign a lease, and the more likely they were to have actually signed (Table 8).

30
< 5 (N=335)a
5 ‐ 9 (N=44)
10 ‐ 24 (N=74)
25+ (N=149)
All landowners
totalItem
Own mineral rights No 39 27.3 12.3 10.1 27.8 Yes 19.5 61.3 75.3 81.8 44.8 Don't know 41.5 11.4 12.3 8.1 27.4 Total 100 100 100 100 100
Been approached about a lease No 83.4 63.6 35.1 21.5 60.6 Yes 16.6 36.4 64.9 78.5 39.4 Total 100 100 100 100 100
Signed a lease No 56 47.7 41.9 37.2 49 Yes 6.7 25 35.1 48.6 22 Don't know 37.3 27.3 23 14.2 29 Total 100 100 100 100 100
Have drilling or pipelines on land No 99.1 86.4 95.9 94.6 96.7 Yes 0.9 13.6 4.1 5.4 3.3 Total 100 100 100 100 100*Number of cases vary from these totals due to missing data. A total of 28 landowners did not specify thei
Table 8. Relationships of acres of land owned mineral rights and leasing arrangements (landowners only).
Acres owned
%
• 20% of those with less than 5 acres knew they owned mineral rights compared to 82% of those with 25 acres or more. • 17% of those with fewer than 5 acres had been approached about signing a lease, and 7% had signed. • Of those with 5-9 acres, 36% had been approached, and 25% had signed. • 65% of those with 10-24 acres had been approached, 35% had signed • 79% of landowners with 25 acres or more had been approached, and 49% had signed. • Although a sizable minority of the larger landowners had signed leases, only 26 respondents (fewer than 2%) of the total sample members (3% of all landowners) reported any drilling or pipeline development had taken place on their land as of the time of the survey.
31
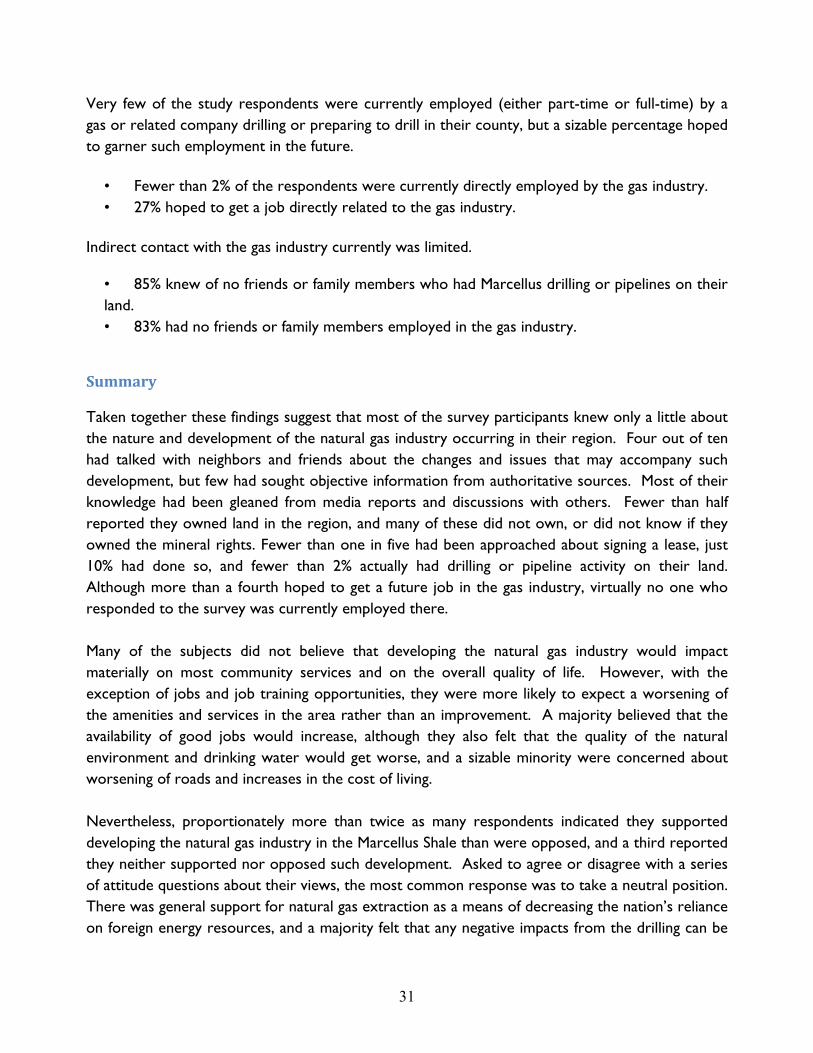
Very few of the study respondents were currently employed (either part-time or full-time) by a gas or related company drilling or preparing to drill in their county, but a sizable percentage hoped to garner such employment in the future.
• Fewer than 2% of the respondents were currently directly employed by the gas industry. • 27% hoped to get a job directly related to the gas industry.
Indirect contact with the gas industry currently was limited.
• 85% knew of no friends or family members who had Marcellus drilling or pipelines on their land. • 83% had no friends or family members employed in the gas industry.
Summary Taken together these findings suggest that most of the survey participants knew only a little about the nature and development of the natural gas industry occurring in their region. Four out of ten had talked with neighbors and friends about the changes and issues that may accompany such development, but few had sought objective information from authoritative sources. Most of their knowledge had been gleaned from media reports and discussions with others. Fewer than half reported they owned land in the region, and many of these did not own, or did not know if they owned the mineral rights. Fewer than one in five had been approached about signing a lease, just 10% had done so, and fewer than 2% actually had drilling or pipeline activity on their land. Although more than a fourth hoped to get a future job in the gas industry, virtually no one who responded to the survey was currently employed there. Many of the subjects did not believe that developing the natural gas industry would impact materially on most community services and on the overall quality of life. However, with the exception of jobs and job training opportunities, they were more likely to expect a worsening of the amenities and services in the area rather than an improvement. A majority believed that the availability of good jobs would increase, although they also felt that the quality of the natural environment and drinking water would get worse, and a sizable minority were concerned about worsening of roads and increases in the cost of living. Nevertheless, proportionately more than twice as many respondents indicated they supported developing the natural gas industry in the Marcellus Shale than were opposed, and a third reported they neither supported nor opposed such development. Asked to agree or disagree with a series of attitude questions about their views, the most common response was to take a neutral position. There was general support for natural gas extraction as a means of decreasing the nation’s reliance on foreign energy resources, and a majority felt that any negative impacts from the drilling can be

32
prevented. More people disagreed than agreed that problems created by development of the Marcellus Shale could be fixed and just under half agreed that only a few people in the area would benefit from the development. However, for most items, there was little consensus in attitudes.
Assessing Residents’ Attitudes Toward and Participation in their Communities Information on the survey respondents’ views of their current communities and the nature and types of their interactions were sought to provide baseline data for assessing changes as Marcellus Shale development occurs and to obtain contextual information concerning the social circumstances in which the Marcellus gas play respondents were situated.
• Only 9% described the area in which they lived as “a city,” and an additional 16% reported they lived in a suburban area. • 39% described the area in which they lived as “a small town” • 36% reported they lived “in the country”
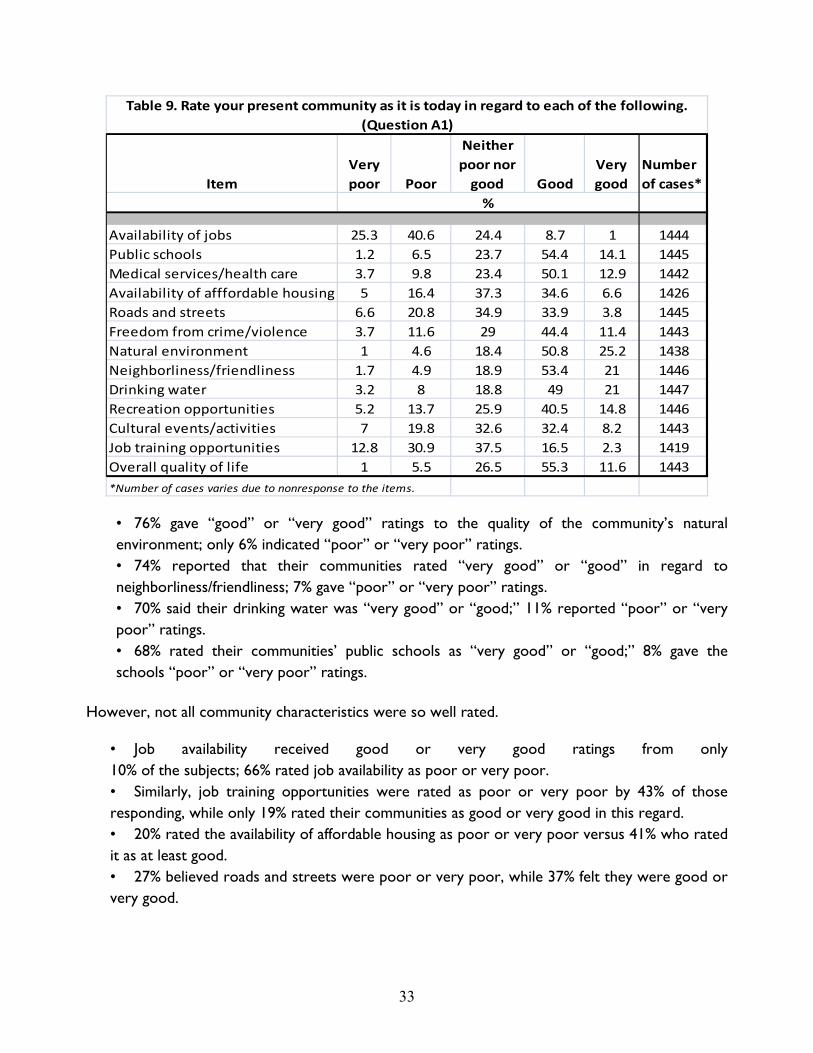
Rating the Community Asked to rate various community attributes as “very good, “good, “neither poor nor good,” “poor” or “very poor, ” two thirds (67%) of the subjects rated the overall quality of life in their communities as “good” or “very good;” very few (7%) indicated that it was “poor” or “very poor.” Most also rated the quality of the natural environment, neighborliness/friendliness of the residents, the quality of drinking water, the public schools, and medical services/health care and recreation opportunities positively (Table 9).
33
ItemVery poor Poor
Neither poor nor good Good
Very good
Number of cases*
Availability of jobs 25.3 40.6 24.4 8.7 1 1444Public schools 1.2 6.5 23.7 54.4 14.1 1445Medical services/health care 3.7 9.8 23.4 50.1 12.9 1442Availability of afffordable housing 5 16.4 37.3 34.6 6.6 1426Roads and streets 6.6 20.8 34.9 33.9 3.8 1445Freedom from crime/violence 3.7 11.6 29 44.4 11.4 1443Natural environment 1 4.6 18.4 50.8 25.2 1438Neighborliness/friendliness 1.7 4.9 18.9 53.4 21 1446Drinking water 3.2 8 18.8 49 21 1447Recreation opportunities 5.2 13.7 25.9 40.5 14.8 1446Cultural events/activities 7 19.8 32.6 32.4 8.2 1443Job training opportunities 12.8 30.9 37.5 16.5 2.3 1419Overall quality of life 1 5.5 26.5 55.3 11.6 1443*Number of cases varies due to nonresponse to the items.
%
Table 9. Rate your present community as it is today in regard to each of the following. (Question A1)
• 76% gave “good” or “very good” ratings to the quality of the community’s natural environment; only 6% indicated “poor” or “very poor” ratings. • 74% reported that their communities rated “very good” or “good” in regard to neighborliness/friendliness; 7% gave “poor” or “very poor” ratings. • 70% said their drinking water was “very good” or “good;” 11% reported “poor” or “very poor” ratings. • 68% rated their communities’ public schools as “very good” or “good;” 8% gave the schools “poor” or “very poor” ratings.
However, not all community characteristics were so well rated.
• Job availability received good or very good ratings from only 10% of the subjects; 66% rated job availability as poor or very poor. • Similarly, job training opportunities were rated as poor or very poor by 43% of those responding, while only 19% rated their communities as good or very good in this regard. • 20% rated the availability of affordable housing as poor or very poor versus 41% who rated it as at least good. • 27% believed roads and streets were poor or very poor, while 37% felt they were good or very good.
34
Moreover, many were pessimistic about changes in the community where they lived.
• 44% felt that the community was worse off now than it had been five years ago; 43% indicated it was the same; only 11% reported it was better off. • Looking ahead, 31% believed it would be worse off in five years and 50% felt it would be the same. Just 19% thought it would be better.
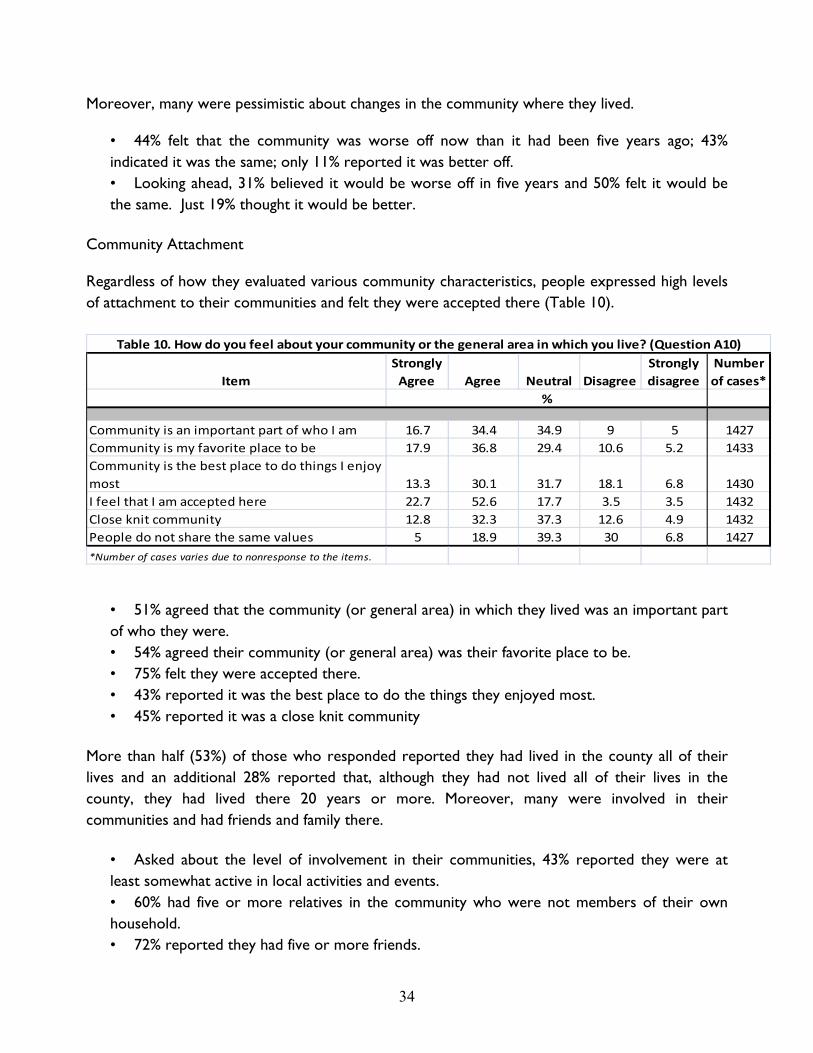
Community Attachment Regardless of how they evaluated various community characteristics, people expressed high levels of attachment to their communities and felt they were accepted there (Table 10).
ItemStrongly Agree Agree Neutral Disagree
Strongly disagree
Number of cases*
Community is an important part of who I am 16.7 34.4 34.9 9 5 1427Community is my favorite place to be 17.9 36.8 29.4 10.6 5.2 1433Community is the best place to do things I enjoy most 13.3 30.1 31.7 18.1 6.8 1430I feel that I am accepted here 22.7 52.6 17.7 3.5 3.5 1432Close knit community 12.8 32.3 37.3 12.6 4.9 1432People do not share the same values 5 18.9 39.3 30 6.8 1427*Number of cases varies due to nonresponse to the items.
Table 10. How do you feel about your community or the general area in which you live? (Question A10)
%
• 51% agreed that the community (or general area) in which they lived was an important part of who they were. • 54% agreed their community (or general area) was their favorite place to be. • 75% felt they were accepted there. • 43% reported it was the best place to do the things they enjoyed most. • 45% reported it was a close knit community
More than half (53%) of those who responded reported they had lived in the county all of their lives and an additional 28% reported that, although they had not lived all of their lives in the county, they had lived there 20 years or more. Moreover, many were involved in their communities and had friends and family there.
• Asked about the level of involvement in their communities, 43% reported they were at least somewhat active in local activities and events. • 60% had five or more relatives in the community who were not members of their own household. • 72% reported they had five or more friends.
35
For a sizable minority, interactions with those who differed from themselves in regard to race/ethnicity, wealth, education, and political views were limited.
• 52% had interacted no more than two or three times in the last year with people of a different race/ethnicity. • 54% had interacted with people much poorer then themselves no more than two or three times in the previous year. • 42% had interacted two or three times or less with people who had less education than they in the past 12 month. • 32% reported they had interacted no more than two or three times during the last year with people who differed from them in regard to political views.
Respondents expressed high levels of trust in their neighbors and in the people with whom they
worked. They were somewhat less likely to trust persons of different cultural/ethnic groups and
people who were new in the community; they were also unlikely to trust state government and
large businesses.
• 45% had a great deal of trust in their neighbors and an additional 47% expressed some trust. • 39% expressed a great deal of trust in the people they worked with and an additional 50% trusted them somewhat. • Only 5% had a great deal of trust in newcomers to the community, although 72% trusted them somewhat. • 13% trusted people from other cultural/ethnic groups a great deal; 70% expressed “some” trust. • 64% had little or no trust in the state legislature; 63% had little or no trust in the governor; 50% trusted the media very little or not at all; and 55% had little or no trust in large businesses.
Summary Three quarters of the survey respondents living in the Marcellus Shale region described the area in which they lived as being in the country or in a small town. Most had lived in their current county more than 20 years, many had kin nearby, and most expressed strong personal attachment to the area. The apparent stability of these communities was reflected in the tendency of residents to have limited interactions with others who differed from them in regard to race/ethnicity, wealth, education, and even political views. They were unlikely to place a great deal of trust in state and local government, the media, businesses, and new comers to their communities. They rated their communities positively in regard to neighborliness/friendliness and the quality of the natural environment, expressed strong community ties and trust in their neighbors and workmates.
36
However, they were critical of the limited availability of jobs. Likely influenced by the lack of jobs and the current stagnant economy, many felt that their communities were worse off today than five years ago, and predicted that things would worsen still more in the next five years.
Exploring the Social Bases of Differences in Residents’ Knowledge and Attitudes There was considerable diversity among the sample members concerning both their levels of knowledge and their attitudes concerning natural gas development in the Marcellus Shale region. In an effort to understand these differences, the relationships of selected personal and areal characteristics to knowledge and attitude measures derived from the survey responses were analyzed. Bivariate and multiple correlation/regression analyses were used to describe and test the statistical significance of the relationships. Measuring Knowledge and Attitudes Self-reported knowledge on the impacts of Marcellus gas development in the region was assessed using the items discussed above to which respondents were asked to indicate how much they knew about each of the following:
• Economic impacts of the natural gas industry. • Social impacts of natural gas well development on communities. • Effects of gas drilling on the natural environment (streams, rivers, fish, wildlife). • Implications of natural gas drilling for water quality and/or quantity. • Gas drilling procedures and practices. • Procedures and legal implications of leasing mineral rights to gas companies. • Impact of gas well development on local government. • Government regulations relating to gas well drilling. • Jobs and job-training opportunities related to gas development.
Response categories about knowledge were as follows: “none or almost none,” “very little,” “some, but not much,” “a good bit,” or “a great deal. These were scored from 0 to 4, respectively, so the higher the score, the greater the subject’s reported knowledge Cronbach’s Alpha, measuring the reliability of the index, was .952, indicating a high level of internal consistency in response patterns. For the current analysis the mean score of the subject’s answers to the nine items was calculated for each individual respondent and used as the index to overall knowledge.

37
Attitudes about Marcellus gas development were assessed using responses to the following ten items (discussed above):
a. Negative impacts of natural gas extraction from the Marcellus Shale region can be prevented if it proceeds carefully. b. We already know enough about the potential impacts of natural gas extraction to move forward with development in the Marcellus Shale. c. All in all the benefits to this region of natural gas extraction from the Marcellus Shale will outweigh the costs. d. I worry that there will be some sort of catastrophic accident involving natural gas extraction in the Marcellus Shale area. e. Any negative impacts of natural gas extraction in the Marcellus Shale can be fixed. f. Only a few people in the area will receive any benefits from the natural gas development. g. Extraction of domestic natural gas resources, such as in the Marcellus Shale should be encouraged to decrease our reliance on imported energy resources. h. The natural gas industry will provide economic opportunities that will help keep our children in the area. i. Development of natural gas in the Marcellus Shale will create long lasting environmental problems. j. Development of natural gas in the Marcellus Shale makes me optimistic about the future of our region’s communities.
The response categories – “strongly agree,” “agree,” “neutral,” “disagree,” “strongly disagree” were scored from 1 to 5, with 5 representing the most positive attitude toward gas drilling. For items d, f, and i, “strongly agree” was scored as “1” and “strongly disagree” received a score of “5”. For all other items the scoring was reversed. A composite score was calculated for each subject in the sample by taking the arithmetic mean of the ten item responses. Thus, the higher the Attitude Score, the more favorable the individual respondent’s attitude toward Marcellus gas development. The resulting Cronbach’s Alpha, measuring the reliability of the index, yielded an acceptable value of .880. Measuring Personal Attributes Data on seven personal attributes of the subjects were drawn from the completed survey forms as follows:
• Gender. Coded as Males=0; Females=1 • Age in years at the time of the survey
38
• Education. Highest level of formal education scored from 1 to 5 with 1= Did not graduate from high school; 2=high school/GED; 3=some post high school education; 4=Four year college degree; 5=graduate work or graduate degree. • Length of time in the county. Scored from 1 to 6 as follows: 6=all my life; 5=not all my life, but 20 years or more; 4=10-19 years; 3=6-9 years; 2=2-5 years; 1=1 year or less. • Household income. Scored from 1 to 7 as follows: 1=Less than $15,000; 2=$15,000-$24,999; 3=$25,000-$34,999; 4=$35,000-$49,999; 5=$50,000-$74,999; 6=$75,000-$99,999; 7=$100,000 or more. • Employment status. Coded as 0-unemployed; 1=employed. • Community involvement. Scored from 1 to 4 as: 1=not at all active; 2=not very active; 3=somewhat active; 4=very active.
Differences in the county contexts in which the respondents lived were expected to relate to their knowledge levels and attitudes. To address these expectations, data on the following five (5) county characteristics were compiled from data available from the Pennsylvania Department of Environmental Protection, information on the Internet, and US Census data:
• Number of Marcellus (deep) wells drilled between January 2008 and the month each of the survey respondents returned his/her completed questionnaires during 2009 and 2010. • Population density as measured by the number of residents per square mile in the county. • Median family income for the county • Unemployment rate in the county. • Percentage of the adult population who had completed a Bachelor’s (4-year) college degree.
Descriptive information on the measurement and source for each of these variables is included in Table 11.
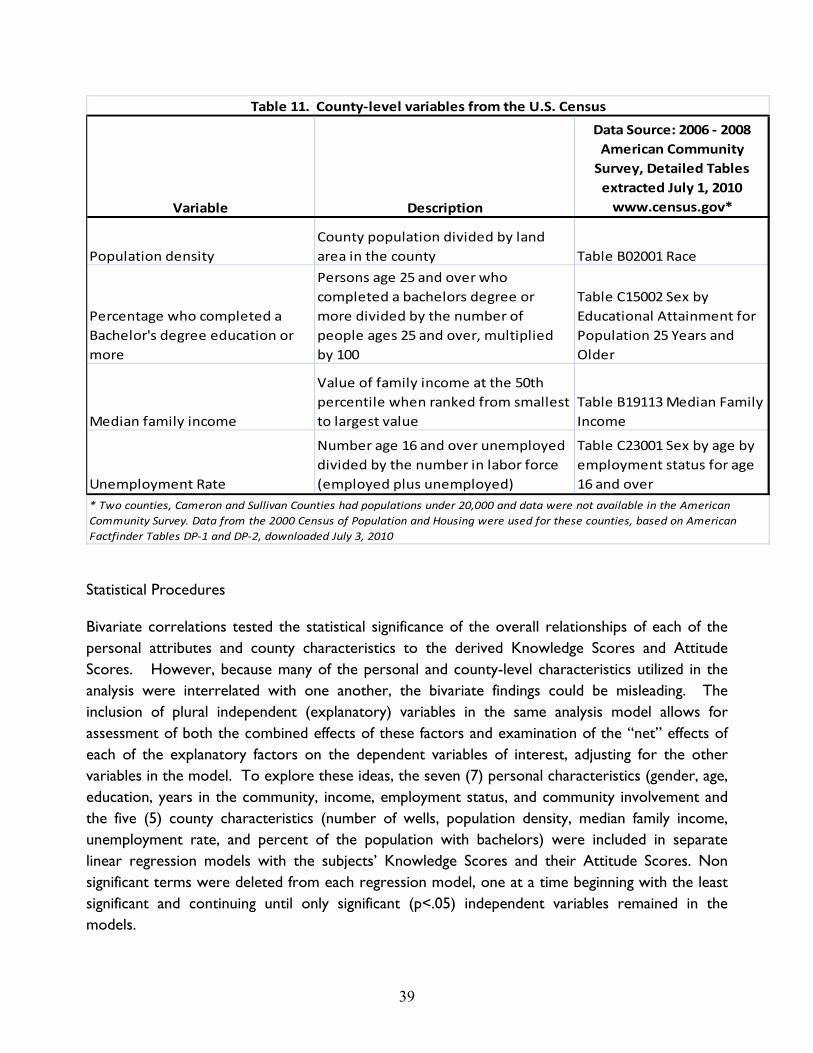
39
Variable Description
Data Source: 2006 ‐ 2008 American Community Survey, Detailed Tables extracted July 1, 2010 www.census.gov*
Population densityCounty population divided by land area in the county Table B02001 Race
Percentage who completed a Bachelor's degree education or more
Persons age 25 and over who completed a bachelors degree or more divided by the number of people ages 25 and over, multiplied by 100
Table C15002 Sex by Educational Attainment for Population 25 Years and Older
Median family income
Value of family income at the 50th percentile when ranked from smallest to largest value
Table B19113 Median Family Income
Unemployment Rate
Number age 16 and over unemployed divided by the number in labor force (employed plus unemployed)
Table C23001 Sex by age by employment status for age 16 and over
Table 11. County‐level variables from the U.S. Census
* Two counties, Cameron and Sullivan Counties had populations under 20,000 and data were not available in the American Community Survey. Data from the 2000 Census of Population and Housing were used for these counties, based on American Factfinder Tables DP‐1 and DP‐2, downloaded July 3, 2010
Statistical Procedures Bivariate correlations tested the statistical significance of the overall relationships of each of the personal attributes and county characteristics to the derived Knowledge Scores and Attitude Scores. However, because many of the personal and county-level characteristics utilized in the analysis were interrelated with one another, the bivariate findings could be misleading. The inclusion of plural independent (explanatory) variables in the same analysis model allows for assessment of both the combined effects of these factors and examination of the “net” effects of each of the explanatory factors on the dependent variables of interest, adjusting for the other variables in the model. To explore these ideas, the seven (7) personal characteristics (gender, age, education, years in the community, income, employment status, and community involvement and the five (5) county characteristics (number of wells, population density, median family income, unemployment rate, and percent of the population with bachelors) were included in separate linear regression models with the subjects’ Knowledge Scores and their Attitude Scores. Non significant terms were deleted from each regression model, one at a time beginning with the least significant and continuing until only significant (p<.05) independent variables remained in the models.
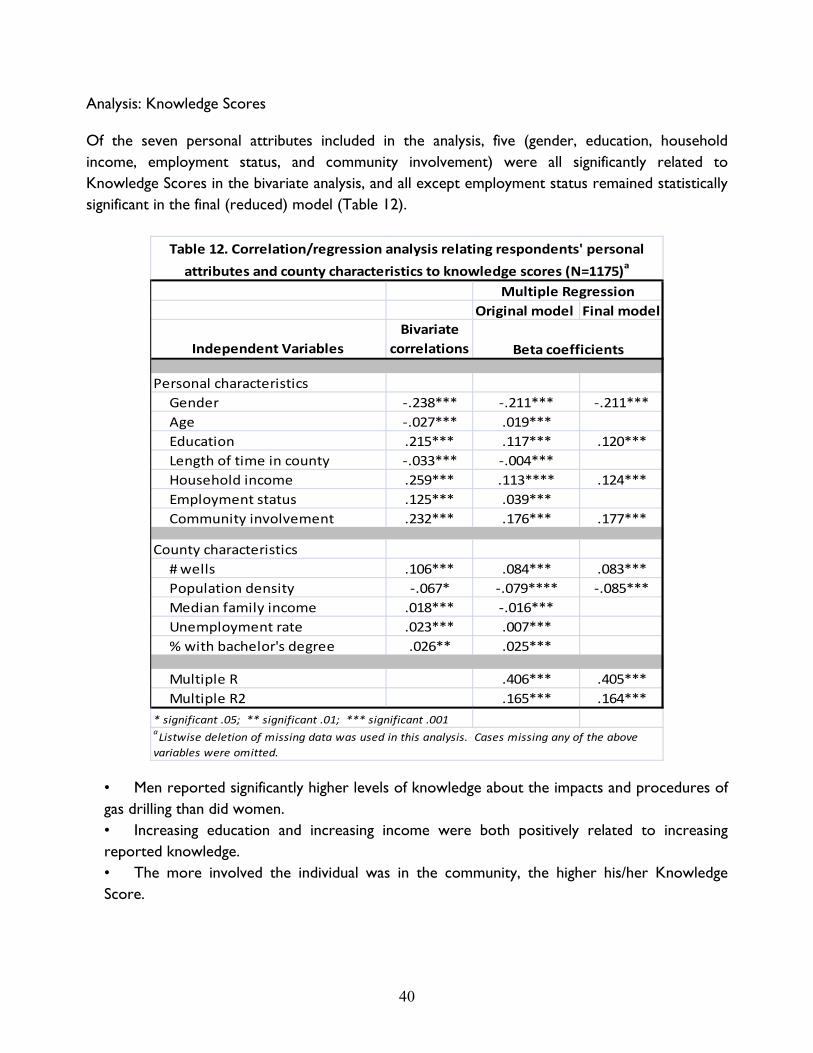
40
Analysis: Knowledge Scores Of the seven personal attributes included in the analysis, five (gender, education, household income, employment status, and community involvement) were all significantly related to Knowledge Scores in the bivariate analysis, and all except employment status remained statistically significant in the final (reduced) model (Table 12).
Original model Final model
Independent VariablesBivariate
correlations
Personal characteristics Gender ‐.238*** ‐.211*** ‐.211*** Age ‐.027*** .019*** Education .215*** .117*** .120*** Length of time in county ‐.033*** ‐.004*** Household income .259*** .113**** .124*** Employment status .125*** .039*** Community involvement .232*** .176*** .177***
County characteristics # wells .106*** .084*** .083*** Population density ‐.067* ‐.079**** ‐.085*** Median family income .018*** ‐.016*** Unemployment rate .023*** .007*** % with bachelor's degree .026** .025***
Multiple R .406*** .405*** Multiple R2 .165*** .164**** significant .05; ** significant .01; *** significant .001
Beta coefficients
Multiple Regression
Table 12. Correlation/regression analysis relating respondents' personal
attributes and county characteristics to knowledge scores (N=1175)a
aListwise deletion of missing data was used in this analysis. Cases missing any of the above variables were omitted.
• Men reported significantly higher levels of knowledge about the impacts and procedures of gas drilling than did women. • Increasing education and increasing income were both positively related to increasing reported knowledge. • The more involved the individual was in the community, the higher his/her Knowledge Score.
41
• In the bivariate analysis the employed reported higher levels of knowledge than did the unemployed, but this relationship declined to nonsignficance when the effects of the remaining variables in the model were adjusted for. • Neither age nor length of time in the county were statistically related to Knowledge Scores in either the bivariate or partialled analysis.
Only two of the county characteristics were significantly related to Knowledge Scores in the final model number of wells in the county at the time of the survey and population density.
• The larger the number of wells in the county, the higher the reported knowledge levels. • Population density was significantly associated with knowledge, with residents of counties having low population densities having higher Knowledge Scores that did those living in higher density areas.
In total, the final regression model, including only the six (significant) explanatory variables of gender, education, income community involvement, number of wells, and population density, accounted for about 16% of the total variation in Knowledge Scores in the sample. Gender had the strongest net relationship to Knowledge scores, followed by community involvement, income, and education. The relationships of the two county characteristics to Knowledge Scores, while statistically significant, were not strong. Analysis: Attitude Scores Respondents differed in their Attitudes toward the developing Marcellus gas industry depending upon their gender, age, household income, and community involvement. Education was not significantly associated with Attitude Scores in the bivariate analysis, although this relationship was statistically significant when the effects of the remaining variables were controlled (Table 13).
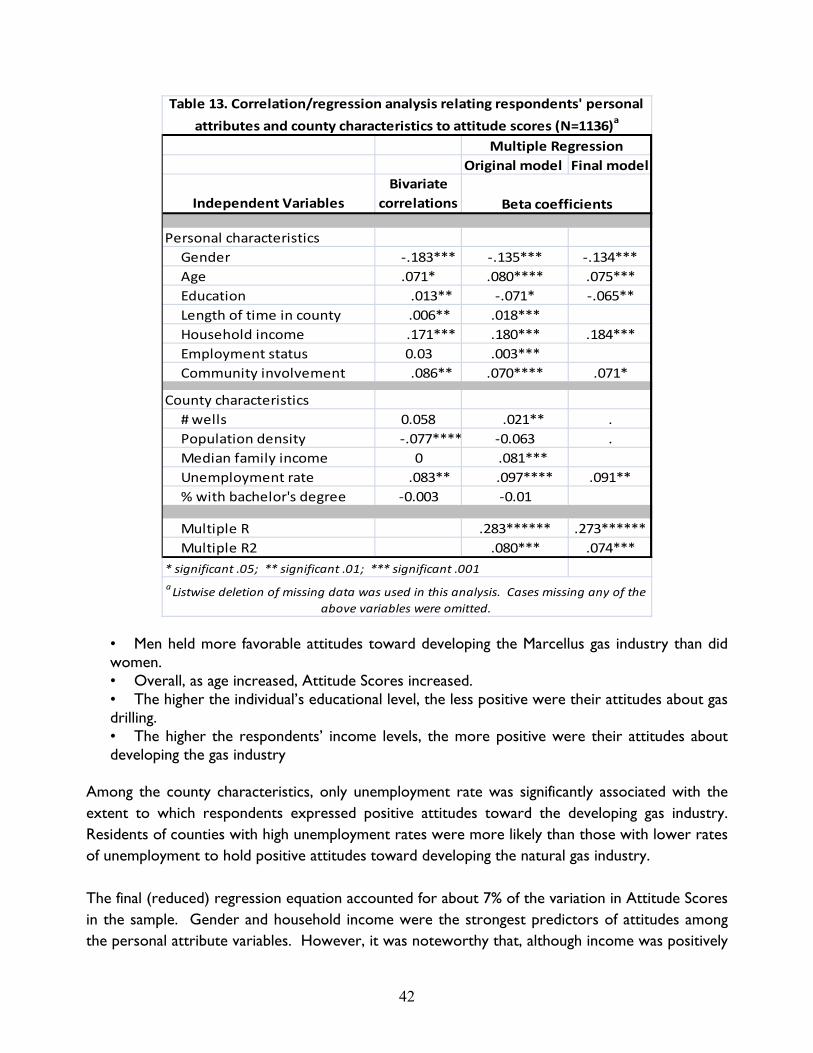
42
Original model Final model
Independent VariablesBivariate
correlations
Personal characteristics Gender ‐.183*** ‐.135*** ‐.134*** Age .071* .080**** .075*** Education .013** ‐.071* ‐.065** Length of time in county .006** .018*** Household income .171*** .180*** .184*** Employment status 0.03 .003*** Community involvement .086** .070**** .071*
County characteristics # wells 0.058 .021** . Population density ‐.077**** ‐0.063 . Median family income 0 .081*** Unemployment rate .083** .097**** .091** % with bachelor's degree ‐0.003 ‐0.01
Multiple R .283****** .273****** Multiple R2 .080*** .074**** significant .05; ** significant .01; *** significant .001aListwise deletion of missing data was used in this analysis. Cases missing any of the
above variables were omitted.
Beta coefficients
Table 13. Correlation/regression analysis relating respondents' personal
attributes and county characteristics to attitude scores (N=1136)a
Multiple Regression
• Men held more favorable attitudes toward developing the Marcellus gas industry than did women. • Overall, as age increased, Attitude Scores increased. • The higher the individual’s educational level, the less positive were their attitudes about gas drilling. • The higher the respondents’ income levels, the more positive were their attitudes about developing the gas industry
Among the county characteristics, only unemployment rate was significantly associated with the extent to which respondents expressed positive attitudes toward the developing gas industry. Residents of counties with high unemployment rates were more likely than those with lower rates of unemployment to hold positive attitudes toward developing the natural gas industry. The final (reduced) regression equation accounted for about 7% of the variation in Attitude Scores in the sample. Gender and household income were the strongest predictors of attitudes among the personal attribute variables. However, it was noteworthy that, although income was positively
43
related to favorable attitudes toward drilling, education (a correlate of income) was negatively associated with the Attitude Scores.
Summary Both personal attributes of the respondents and contextual characteristics of their counties of residence were found to be associated with the amount of knowledge respondents felt they had about the possible economic, social, and environmental impacts of, and the nature and procedures involved in Marcellus gas drilling. Educational and income levels were both strongly and positively associated with greater reported knowledge, presumably reflecting greater access to information and (perhaps) greater understanding of the information obtained. Greater community involvement would be expected to increase interaction with other residents (a primary source of information for residents living in the Shale area) and to enhance the likelihood of their access to and involvement with groups committed to addressing issues related to drilling. Males reported higher levels of knowledge than females. Although males may, in fact be better informed about these matters than females, it could also be the case that they are more likely to be confident in their knowledge or more assertive than their female counterparts. The number of wells drilled, visible reminders of the presence of the developing industry, likely fostered increased media coverage and residents’ discussion of possible changes inherent in the industry’s development. The significant negative association of population density with reported knowledge levels may reflect a more obvious presence of drilling activities in counties where there are fewer people and hence fewer distracting activities to garner attention. Attitudes toward deep well drilling also differed depending upon both the personal and county characteristics of respondents, but the combined effects of these factors was less than that for reported knowledge. Gender, age, education, income, and community involvement were associated with how people felt about drilling. Males and those with higher incomes expressed more positive attitudes than did their opposites. However, education was negatively associated with Attitude Scores, suggesting that respondents with more years of formal schooling were perhaps more concerned about the environmental or social impacts of drilling, and that such concern led to less positive evaluations of the industry.
Conclusions/Discussion Development of the natural gas industry in the Marcellus Shale region of the eastern United States is expected to bring vast changes to the rural areas of Pennsylvania where much of the drilling and pipe line construction is projected to occur. Throughout the region, established and relatively stable small towns and open country areas are likely to experience rapid economic, social, and environmental changes as gas companies compete for access to the rich reserves miles below the
44
surface. For some residents, the promises of jobs, capital investments, and increased income are seen as holding promise of a better life. For others, the threats of social upheaval and possible environmental degradation bring fears of declining social well-being and decreased quality of life. Understanding the nature and bases of such conflicting viewpoints can contribute to educational activities directed to negotiating differing values and perception which, if unresolved can lead to community conflict. Identifying the reasons that individuals are opposed to drilling can suggest regulations or policies to alleviate their concerns. The purpose of the present study was to obtain information on the views of residents in the Marcellus region during the early stages of the industry’s development. Such information was sought as a baseline for assessing and monitoring changes in public opinions across time. In the future, communities throughout the region will be called upon to face the challenges of rapid growth, environmental impacts, and social change. And, they will need to deal with the consequences of fluctuations in demand for natural gas on jobs and population change, and in the end, with the consequences of the exhaustion of the gas resources. In such a setting, it is imperative that public views on these issues be continuously monitored, called into account at all levels of government, and utilized by educators seeking to inform residents of the nature of these impacts. Such knowledge can contribute to the ability of residents, public officials, and community leaders to understand and respond in meaningful ways to these changing circumstances. Ideally a baseline survey of residents in the region should have been initiated prior to any activity by the gas industry; no such study was carried out. The rapidity of the early development efforts by the industry meant that researchers, as well as the public, were caught quite unaware of the magnitude and importance of the impending changes. The current research represents the earliest widespread and systematic assessment of public views of the Marcellus Shale region of which we are aware. Although a sizable proportion of those owning substantial land areas have been approached and have, indeed, signed leases, many residents admit to little or no knowledge of the gas industry, are neutral or undecided in their attitudes, and most have not signed leases. Equally important, few respondents have actually experienced gas drilling on their land, although the numbers of rigs in the Pennsylvania counties continue to increase. As a result, public response to Marcellus development is still very much “at baseline” and findings from the current study can provide information to chronicle how public perceptions and attitudes change across time. Previous research on the views of residents in rapidly growing, “boom” communities provides some suggestions about the expected changes that will occur. Although the information is by no means definitive, it appears that initial predictions of community detachment, followed by euphoria over the prospect of new jobs is often followed by sobering realization that development can bring environmental and social consequences that are less than desirable (Lovejoy and Little 1979; Freudenburg1981; Gilmore 1976; Thompson and Blevins 1983). During this period, polarization of communities can occur as “worst” and “best” case scenarios are advanced by competing groups.
45
However, across time, communities often experience a moderation in conflict, and a tacit acceptance of and adaptation to the changing situation (Freudenberg & Gramling 1992; Brown, et al. 2005). Whether this pattern will be found in the Marcellus situation is an empirical question and one that we hope to address in the future. The current data does suggest the presence of polarization in views among those residents who did have opinions and hence tend to support early stage circumstances described in the literature. Whether this pattern will be found in the Marcellus situation is not certain. Regardless, understanding the community change may facilitate efforts to minimize the length and severity of the “conflict” period and provide information to assist residents and their communities to respond in ways that increase the likelihood of positive outcomes while minimizing negative impacts. Understanding of residents’ knowledge and concerns is needed if community response and action is to be focused on the most salient issues, and if misperceptions are to be addressed. Moreover, publicizing the research findings can encourage public discussion of the issues surrounding natural gas extraction, foster information-seeking, and encourage citizen engagement in their communities and in the democratic process. By doing so, it may be possible to avert some problems, provide early remediation for others, and build community capacity to address new and emerging concerns.
Pennsylvania Interviews
Introduction The first Marcellus well was drilled in Washington County (PA) in 2003, and began commercial production in 2005 (Harper, 2008). Since 2003, more than thirty national and international oil and gas companies have established lease holds in the region. In Pennsylvania, 195 Marcellus wells were drilled in 2008; in 2009, this number increased to 768. During the first five months of 2010, 564 wells were drilled (PA DEP). Much of the development has occurred in Pennsylvania, because New York placed a moratorium on all permitting and drilling in July 2008, pending the results of a statewide Supplemental Generic Environmental Impact Statement (SGEIS). Previous research on communities experiencing rapid population growth associated with energy development has found that identifying residents’ perceptions during the early stages of development (Brown et al. 1989) provided a baseline for comparing community indicators as development progressed (Brown et al. 2005; Smith et al. 2001). Identifying these early perceptions establishes foundations and potential trajectories from which local leaders, landowners, and other key stakeholders can take action. This report identifies the impacts of Marcellus Shale development on communities and residents, and describes how factors such as population and previous extractive histories affect those perceptions.
46
In winter and spring of 2010, local leaders in five counties in the Marcellus Shale region in Pennsylvania were interviewed to obtain information on how the communities were being affected by natural gas exploration and development. This information provided important windows into the experiences in these areas; it also established baseline data from which we can assess future changes. We intend to re-visit these communities as the development progresses, to identify major changes in perceptions of the impacts and to ascertain the kinds of strategic actions these community leaders have taken to address their concerns. Describing and assessing these strategies within the context each county’s unique social, economic, and environmental histories will provide useful information for educational efforts, policy directions, and program planning by local, state, and regional decision-makers. Here we summarize a qualitative data collection effort to describe the views of local leaders in each of five Pennsylvania counties. This information examines the range of experiences within these counties from the perspective of individuals charged with serving their constituents in multiple capacities, and who have access to information about the current effects of development on multiple sectors of their communities. We analyze this information in light of the historical, social, economic, and environmental context of these communities.
Case Study Selection To understand the impacts of development and to predict potential impacts as the drilling moves across the state and region, we chose counties with the highest initial activity. The most active counties since 2008, in terms of both wells drilled and permitted (according to DEP data), were Washington, Susquehanna, Westmoreland, Greene, Fayette, Tioga, Bradford, and Lycoming (see Table 1). Although the relative rankings of counties on this list have changed over the past three years, the list has remained relatively consistent.
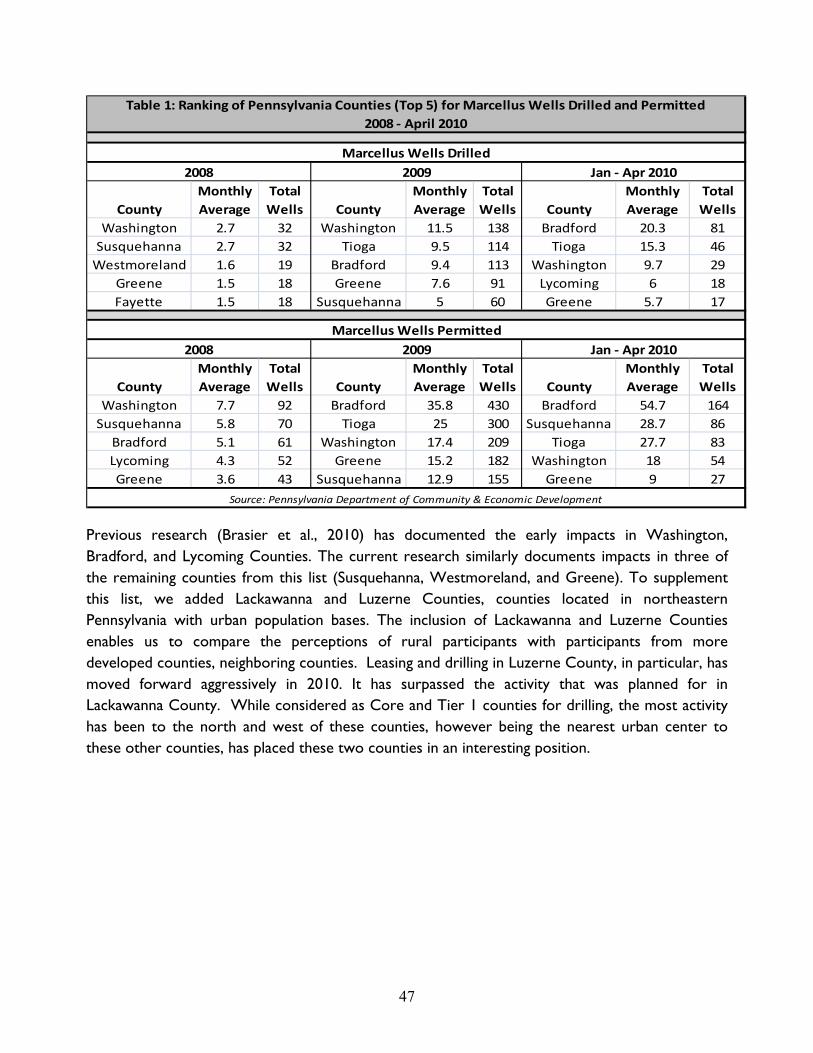
47
CountyMonthly Average
Total Wells County
Monthly Average
Total Wells County
Monthly Average
Total Wells
Washington 2.7 32 Washington 11.5 138 Bradford 20.3 81Susquehanna 2.7 32 Tioga 9.5 114 Tioga 15.3 46Westmoreland 1.6 19 Bradford 9.4 113 Washington 9.7 29
Greene 1.5 18 Greene 7.6 91 Lycoming 6 18Fayette 1.5 18 Susquehanna 5 60 Greene 5.7 17
CountyMonthly Average
Total Wells County
Monthly Average
Total Wells County
Monthly Average
Total Wells
Washington 7.7 92 Bradford 35.8 430 Bradford 54.7 164Susquehanna 5.8 70 Tioga 25 300 Susquehanna 28.7 86Bradford 5.1 61 Washington 17.4 209 Tioga 27.7 83Lycoming 4.3 52 Greene 15.2 182 Washington 18 54Greene 3.6 43 Susquehanna 12.9 155 Greene 9 27
2008 2009 Jan ‐ Apr 2010
Source: Pennsylvania Department of Community & Economic Development
Table 1: Ranking of Pennsylvania Counties (Top 5) for Marcellus Wells Drilled and Permitted 2008 ‐ April 2010
2009Marcellus Wells Drilled
Jan ‐ Apr 2010
Marcellus Wells Permitted
2008
Previous research (Brasier et al., 2010) has documented the early impacts in Washington, Bradford, and Lycoming Counties. The current research similarly documents impacts in three of the remaining counties from this list (Susquehanna, Westmoreland, and Greene). To supplement this list, we added Lackawanna and Luzerne Counties, counties located in northeastern Pennsylvania with urban population bases. The inclusion of Lackawanna and Luzerne Counties enables us to compare the perceptions of rural participants with participants from more developed counties, neighboring counties. Leasing and drilling in Luzerne County, in particular, has moved forward aggressively in 2010. It has surpassed the activity that was planned for in Lackawanna County. While considered as Core and Tier 1 counties for drilling, the most activity has been to the north and west of these counties, however being the nearest urban center to these other counties, has placed these two counties in an interesting position.
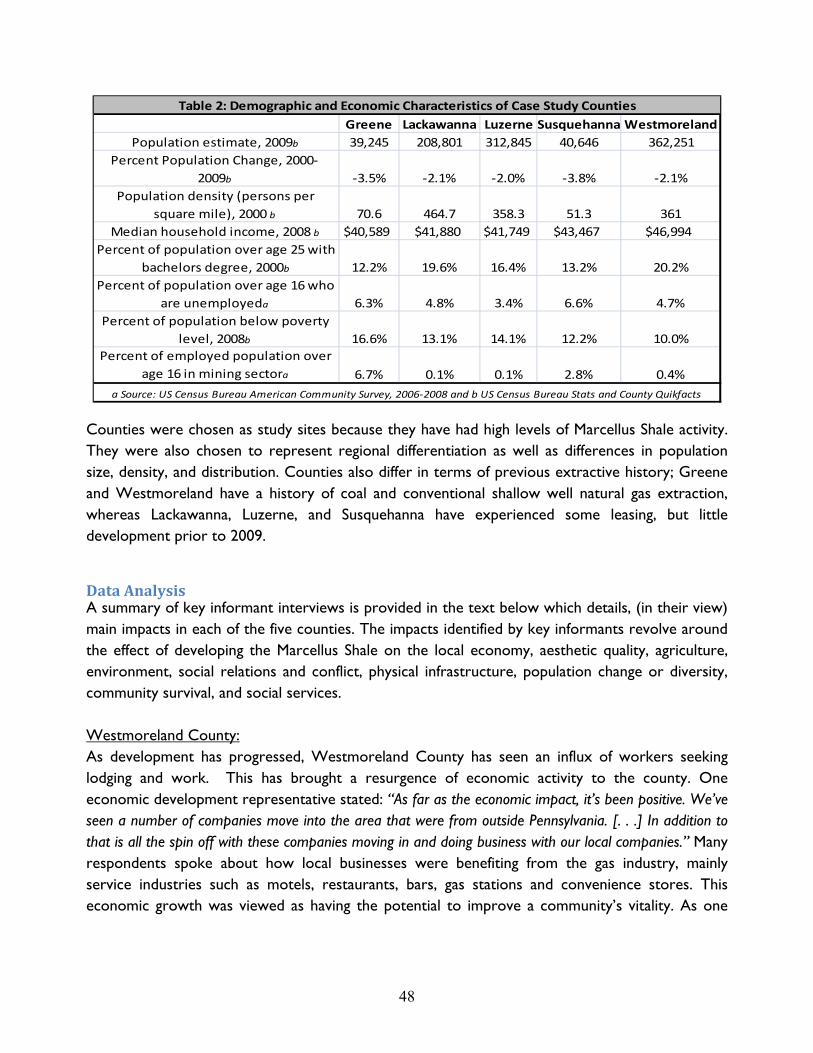
48
Greene Lackawanna Luzerne Susquehanna WestmorelandPopulation estimate, 2009b 39,245 208,801 312,845 40,646 362,251
Percent Population Change, 2000‐2009b ‐3.5% ‐2.1% ‐2.0% ‐3.8% ‐2.1%
Population density (persons per square mile), 2000 b 70.6 464.7 358.3 51.3 361
Median household income, 2008 b $40,589 $41,880 $41,749 $43,467 $46,994Percent of population over age 25 with
bachelors degree, 2000b 12.2% 19.6% 16.4% 13.2% 20.2%Percent of population over age 16 who
are unemployeda 6.3% 4.8% 3.4% 6.6% 4.7%Percent of population below poverty
level, 2008b 16.6% 13.1% 14.1% 12.2% 10.0%Percent of employed population over
age 16 in mining sectora 6.7% 0.1% 0.1% 2.8% 0.4%a Source: US Census Bureau American Community Survey, 2006‐2008 and b US Census Bureau Stats and County Quikfacts
Table 2: Demographic and Economic Characteristics of Case Study Counties
Counties were chosen as study sites because they have had high levels of Marcellus Shale activity. They were also chosen to represent regional differentiation as well as differences in population size, density, and distribution. Counties also differ in terms of previous extractive history; Greene and Westmoreland have a history of coal and conventional shallow well natural gas extraction, whereas Lackawanna, Luzerne, and Susquehanna have experienced some leasing, but little development prior to 2009.
Data Analysis A summary of key informant interviews is provided in the text below which details, (in their view) main impacts in each of the five counties. The impacts identified by key informants revolve around the effect of developing the Marcellus Shale on the local economy, aesthetic quality, agriculture, environment, social relations and conflict, physical infrastructure, population change or diversity, community survival, and social services. Westmoreland County: As development has progressed, Westmoreland County has seen an influx of workers seeking lodging and work. This has brought a resurgence of economic activity to the county. One economic development representative stated: “As far as the economic impact, it’s been positive. We’ve seen a number of companies move into the area that were from outside Pennsylvania. [. . .] In addition to that is all the spin off with these companies moving in and doing business with our local companies.” Many respondents spoke about how local businesses were benefiting from the gas industry, mainly service industries such as motels, restaurants, bars, gas stations and convenience stores. This economic growth was viewed as having the potential to improve a community’s vitality. As one
49
government representative stated: “Anytime you have a positive economic influx there is the possibility for reviving an area.” Participants also noted how the local economic climate has also changed due to increased wealth. Landowners signing gas leases have received some sizable bonuses. This wealth has, as one respondent stated: “Changed the evaluation of farm land and some of the strategies people look at to sell land. Farm land averages, in Westmoreland County $5,000 per acre and all of a sudden it was $10,000 per acre.” Key informants suggested that the exploration of natural gas and increased wealth have the potential to increase property values in Westmoreland County for those properties in which the surface and sub-surface rights have not been severed. Participants see the economic climate as creating a “. . . Buzz, [bringing] people together. [. . .] it’s bringing all these people together that live in close proximity to each other that may or may not have much to do with each other. From the standpoint of getting the community to talk to one another, it’s a pretty neat thing. [. . .] It has pulled people together around a common issue and I think that’s a plus. The challenge will be between the haves and have nots.” Those signing leases have already benefited from natural gas development; however, some key informants feared tension between those benefiting from the development and those not directly benefiting but having to live with the (negative) community changes. Leasing has brought increased wealth to many landholders; however, a recurrent theme among participants was that “landmen” working for the natural gas industry took advantage of landowners early in the development of the Marcellus Shale. Most people had not heard of the Marcellus Shale or its potential for natural gas extraction. As this respondent stated: “If you asked the average Joe on the street two years ago they wouldn’t even know what Marcellus was.” Further, Westmoreland County has a history of shallow natural gas extraction, which had traditionally paid low lease and royalty rates. There is a long history in Pennsylvania, and particularly in the southwest region of leasing for coal and shallow natural gas extraction, often without any actual mining or drilling occurring. Leasing was seen as a low-risk way to get a few extra dollars. For those who owned their sub-surface rights, the bonuses of $5 per acre and royalty payments of 12.5% seemed ‘normal.’ Participants described how landmen exploited this history and lack of knowledge. As word of leasing and production potential spread through word of mouth and education campaigns, lease terms started escalating, and tensions rose between those who had signed early and the natural gas companies. As a result, many came to distrust the gas industry and its subcontractors. As development evolved in Westmoreland County, respondents believed awareness of the Marcellus Shale and the potential implications of development increased. One respondent from the environmental community felt: “. . . Water impacts are huge, fragmentation of forests; I think there’s going to be an accident bigger than Dunkard Creek.” Environmental concerns also included the fear that growth would lead to sprawl, posing risks for wildlife habitat and the agrarian legacy in
50
Westmoreland County. Others felt negative impacts to the natural environment would be temporary: “. . . You see a six acre pad it looks terrible, the roads are all dusty, and everything, but you go back to that same site two years later and it’s all graded and revegetated and there’s a single pipe sticking out of the ground and the wildlife starts coming back in. So, I think they are starting to see the longer term impacts and how the industry works.” Participants felt new challenges would emerge for Westmoreland County, “The road issues are certainly there, noise. We haven’t been hit so far by compressor stations yet, but certainly that’s going to grow and I think there will increasingly be conversations about ‘what’s happening here?’” Overall, key informants in Westmoreland County reported mixed views related to development of the Marcellus Shale. Increased economic activity was seen having the potential for an ‘economic revival’; however, development was also believed to pose threats to the agrarian culture and landscape as well as the natural environment. Greene County: Similar to Westmoreland County, Greene County has experienced significant economic activity related to development of the Marcellus. As described by one study participant, the economic benefits are dispersed through various sectors of the county, “Obviously the gas stations, are selling gas and diesel. The local Wal-Mart here, they’re busy all the time. And then the tire shops, Napa Stores, Advanced Auto stores, they get the spin off from it. And then they [the industry] lease land and put up their stuff there. So, that’s a positive impact. You can’t even find a house to rent in the county, that’s just how full everything is right now.” As described by this participant, one of the major concerns associated with development is the lack of housing. Industry workers are seeking alternative housing options, including hotels, trailer parks and RV parks, “. . . The hotels are filled and charging an arm and a leg. And the others are coming in with their RVs.” Some workers were known to stay as far away as Pittsburgh and commute to the county for work. The housing shortage was a particular concern for local residents, especially those with lower incomes. A recent fire at the county’s largest residential facility created additional stress on the local housing stock. Many low income residents searching for housing in or around the Waynesboro area have had difficulty finding affordable housing. Local residents needing both emergency and permanent housing have relocated outside the county and the state (some moving to West Virginia). Participants reported a housing shortage causing rents and purchase prices to increase dramatically. In addition, other participants reported that overall living expenses had increased as well, “A lot of the costs have gone up, and some of the businesses in the area have done well because it’s the only thing we have available. The community is suffering, because the people not making the decent incomes still have to pay more.”

51
While part of the county’s business sector believed development was “. . . A godsend,” others were cynical of the development’s ‘benefits’ because of the unequal distribution of costs and benefits from the development: “They like it because they’re the ones reaping the benefit from it. They’re getting royalty checks on a regular basis and they enjoy the extra income. There are a few people who benefit, but there are a lot of people that bear the brunt of what is going on.” One couple interviewed spoke of their life since the Marcellus development: “I had a well, a functioning well for my drinking water for about 18 years. Since this drilling rig pulled in here 900 ft. from my house on my neighbors property here, now I no longer have a functioning well. They’re hauling me water now, and that’s only because I had to push them.” This development was on their land; however the lease was signed by their neighbors who own the mineral rights. This couple is receiving only the negatives of development: a contaminated well, dust, road damage, noise, lights, truck traffic, and an impaired view. This respondent described his experience as “Totally, 100% negative. The stress level, not just with me, but my wife.... I was actually out of town, and I hated to call home because that’s all we talked about for three months. That was the first thing we spoke about and the last thing we spoke about.” The level of change resulting from large-scale natural gas development in a rural area like Greene County creates great uncertainty about the future. As one study participant stated, development of the Marcellus: “. . . Has changed our community dramatically due to the influx of people, the influx of heavy equipment, landscaping, and I’m not saying in a bad way it has destroyed our community, but it has altered our community more than in the last 100 years. And with the projected times, we can only see our communities evolving into something that we’re not even able to comprehend.” Several study participants reported being frustrated because of the inability of local municipalities to directly benefit from development, especially through a property or severance tax. One township supervisor reflected a feeling of powerlessness in relation to the industry: “Right now, on the Marcellus exploration we’re seeing no positive impacts. As for the municipality, they tear our roads up, and we have to allow them to pretty much tear them up.” His concern echoed several study participants who believed: “Local government needs some help. That’s on the severance tax. If they would get the gas companies to pay and give it back to the municipalities, especially the host municipalities we could do something for these people. We can upgrade our equipment, and serve them better, upgrade our roads, maybe add some recreational facilities.” In order to meet the needs of long-term residents many participants believed gas should “. . . Be taxed like how coal is taxed” (i.e., through property tax). These study participants indicated that some kind of mechanism is needed to return funds to the affected communities. Study participants believed a tax would enable local municipalities to improve their social and physical infrastructure and residents not receiving direct compensation would then benefit from Marcellus development. Study participants also mentioned concerns related to the lack of training and hiring local people to work in the industry. Others were concerned about impacts on social and physical
52
infrastructure, such as water and sewer lines and the criminal justice system. One law enforcement officer described how a local correctional institution began to incarcerate out-of-state natural gas workers. These offenses have largely been minor to date, but he envisioned that crime would increase: “…the Marcellus Shale development in Greene County is really starting to pick up. So, I’m anticipating more of that.” Study participants in Greene County had mixed feelings about development. They desired an end to the problems associated with the drilling process, “I don’t know how much longer this is going to continue. It’s a lot worse now than it was before. I hope things stop and level out, so things get back to normal a bit.” Yet they remained optimistic about the future: “Call us in ten years…, and I hope to tell you how economically correct this was for our communities.” Susquehanna County: Similar to Greene and Westmoreland Counties, participants from Susquehanna County described the impacts from development on local businesses, housing access, economic opportunities, physical infrastructure, and traffic and safety:
The roads, they’ve just destroyed the roads around here. The money is starting to come in; for instance, you can’t rent a place. If you’re a young married couple and you want to rent a home for a few years, that isn’t going to happen. If you’re older [. . .] rents have gone way up. People with rental properties, food service, hotels, gas stations, tools and so forth are experiencing the impact from the gas right now. There are a lot more jobs available in the paper now. The traffic is just out of control. Every other vehicle is affiliated with the gas industry.
Participants specifically mentioned that businesses catering to the needs of the gas industry, local charities, and environmental consulting businesses have had increased activity, investments, and hiring. Study participants in Susquehanna County expressed concerns similar to those in Greene County about increased inequality among residents. Change in Susquehanna County was described as “regrettable if it becomes carried to an extreme. That is, dividing our society into two groups: those that have royalties and those that don’t.” Also similar to other counties, participants reported increased housing costs in Susquehanna County that made affordability for community residents a real concern. One landlord stated: “Properties that I rented for $500/ month are easily worth $950 to $1,000/ month. So that makes it difficult for local people to afford.” Some educational institutions in the county were creating new training programs providing local residents with the certification, experience and skills to work in the gas industry. This training was believed, by some, to eliminate the gap between those benefiting from the industry’s presence and those bearing the burden.
53
While some respondents were excited about the county’s development, others feared it would turn into an industrial zone. One business owner stated: “I’m starting to have second thoughts about the development, because the reason you live in Susquehanna County is the peace and quiet, and that is starting to go away to some bit. So, professionally it’s been good for me but personally I’m starting to have some second thoughts.” In addition to aesthetic quality, environmental health was a significant concern among many. Study participants frequently referenced the incidents in Dimock, PA.2 This exposure to technological hazards with both human and environmental safety impacts, so early in the development process, has heightened awareness of the risks involved. Several participants mentioned that a severance tax, with some portion going back to affected communities, could assist the county and municipalities manage some of the impending changes to the social and physical infrastructure, social life, economic climate, and environmental quality: “…The severance tax, how will that directly affect the county? Will Susquehanna County receive the benefits…? I think the county expects a large amount of income and some financial opportunities that they never had.” Perceptions of how Susquehanna County will change in the future are multifaceted. While some felt the development would bring positive changes, such as economic growth, others felt this economic growth would permanently change the aesthetic and environmental quality of the county. One investment planner reported hearing “‘I’m just going to walk away from this property,’” from several clients who were satisfied with the income from leasing but unsatisfied with the changes to the landscape and aesthetics. Compressors, well heads, and pipelines were said to be permanent “scars.” Others believed: “What will be affected most will be quality of life. The peace and quiet that we used to know will be gone.” They believed that quality of life would gradually worsen as development progressed. Uncertainty was the overriding sentiment when study participants were asked about the future of the County. How the evolution of development will progress is unknown. However, many felt the development would out-live them. As stated by one of our respondents: “We’re in the early stages, I’m not quite sure we realize the impact of it.” Lackawanna and Luzerne: Luzerne and Lackawanna Counties have seen significantly less permitting and drilling than the other counties in this report. Activity increased dramatically once the interview phase was completed. Many study participants echoed this individual from Lackawanna County: “Right now I think it’s just unknown what’s going to happen.” Although the development was described as being in the early phases, and with little drilling occurring in these counties, participants did report significant changes. These included increased economic activity, changes to the landscape, the new
2 The PA Department of Environmental Protection assessed penalties against Cabot Oil and Gas for technical failures that led to methane migration (which destroyed private drinking wells in the area), and chemical spills.
54
curricula offered by educational institutions, and impacts on roads and physical infrastructure. One Luzerne County participant commented that roads have, “ Gone to hell. In the spring they turn into soup.” The road destruction was attributed to the increased truck traffic in the county. Similar to other counties, the increased traffic development has increased business activity, especially for hotels/motels and restaurants. One participant noted that: “. . . My daughter works at a restaurant in [name of township] said ‘folks with southern accents and T-shirts that say Halliburton and Chesapeake Energy are regularly dining at this place and filling the hotel rooms in that area.” Many respondents believed the multiplier effects of the Marcellus development would be especially important for warehouses, trucking, and the rail road. Study participants referenced the higher concentration of population in Lackawanna and Luzerne Counties as to why their Marcellus experience will be different from other parts of the state. While neighboring counties were described as exploration counties—mainly, Susquehanna, Bradford—Lackawanna and Luzerne were described as potential areas of urbanization and physical infrastructure development. Some participants described how populated areas would be perfect locations for warehousing essential materials and supplying the industry via the three interstates running through the counties. Other participants believed these counties, because of their locations and populations, would be fine locations for repair, welding and fabricating businesses. Several respondents from Luzerne and Lackawanna Counties echoed this elected official in Lackawanna County: “I think it’s going to have an impact in the upper county. I think you’re going to see Carbondale impacted economically, corporations using the city for office space and headquarters. . . . I also see population growth. I think they’re going to naturally pick Carbondale because you have neighbors and quality of life, more than just a rural center.” Study participants suggested that Luzerne and Lackawanna County communities could manage the growth associated with the industry. One elected official in Lackawanna County believed: “You talk about smart growth; we could accept 5,000 people tomorrow and have enough city services to get it covered.” The growth has the potential of reversing recent population declines in rural parts of Lackawanna and Luzerne Counties, “Now I think we’ve seen a shift, increased growth.” This growth was attributed to migration from Scranton, New York and the Poconos. Study participants suggested that urban centers in the Counties would experience development much differently than the northern rural areas of these two counties. Several respondents believed:
The further north you go it’s going to look dramatically different in ten years. You’re going to see a lot of population increases, percentages will grow as you go toward the border. The wealth creation up there is going to see a different array of banks and school systems will all be new. You’re going to see a lot of new things north of here. Here I think you’re going to see more of a stabilization of our economy, maybe a shift in our economy that is more supportive of the Marcellus play.
55
Others were unsure if Marcellus development would be a reality in Lackawanna County due to its existing infrastructure. One environmental advocate stated: “I don’t really see that there is going to be a lot in Lackawanna County, but Lackawanna County is pretty populated, so I don’t know.” This respondent also believed the nonrenewable nature of natural gas would not bring sustainable economic development: “It’s not going to be permanent.” Others in the economic development sector of these counties felt sustainable development would be possible if the recent wealth creation experienced by landowners and businesses were distributed throughout the community.
Summary All five counties selected for this analysis provided unique insights into the early impacts and experiences of development of the Marcellus Shale. The counties represent differing levels of population as well as histories of extraction. In this section we summarize the main similarities across the counties, as well as some key differences in how the development of the Marcellus Shale was experienced by formal and informal leaders. We organize this summary in terms of impacts on the local economy, social relationships, physical infrastructure, aesthetic quality, and environmental health. Economic Impacts: Participants from all four counties described economic growth, especially in the food service, hospitality, and retail industries (hotels/motels, restaurants, bars, convenience stores, etc.). The two more densely populated counties, Westmoreland and Lackawanna, indicated that they are becoming regional ‘hubs’ for the industry. Because of their physical infrastructure (warehouses, office space, transportation corridors), gas companies and their subcontractors are locating their offices and equipment in these central locations where they can easily access well sites and pipelines. For those counties where leasing and drilling are occurring, participants also described increases in wealth of landowners who have signed leases and tension over the differential lease and royalty rates. This was especially acute in the counties in the southwestern part of the state, Westmoreland and Greene, with histories of leasing for coal and shallow natural gas. Because of this history, landowners might not own their sub-surface rights. Surface owners have little recourse if the owners of the sub-surface rights choose to lease those rights. Nearly all study participants expressed support for some form of taxation (a severance and/or property tax) on the natural gas industry that would provide revenue for communities affected by development. This was seen not only as remuneration for expenses directly attributable to the industry, but also as an opportunity to improve the community, its infrastructure, and what it has to offer its residents.
56
Social Impacts: The most significant social concern expressed among study participants was the fear that development of the Marcellus Shale would create or exacerbate inequalities among local residents. This can occur directly (i.e., those with leases and royalty income versus those without) and indirectly by making life harder for those already disadvantaged. This was most often conveyed in terms of housing problems, but was also described in terms of increased living expenses and limited access to services. Several participants expressed frustration with and distrust of the natural gas industry. In Westmoreland and Greene Counties, actions of landmen early in the development of the Marcellus Shale were seen as duplicitous, taking advantage of landowners’ lack of knowledge. In Susquehanna County, problems with one company have led many to distrust the industry. Physical Infrastructure: Roads and traffic issues top the list of concerns about physical infrastructure in all four counties. Managing growth was a concern because of the potential costs to municipalities to extend water and sewer lines. The cost and availability of housing is a significant concern in the rural counties. Participants in Greene and Susquehanna Counties described how sky-rocketing rents were making it extremely difficult for residents to find adequate, affordable housing. This was not seen in Lackawanna or Luzerne where little development has taken place, and population centers were described as able to handle more demand. Aesthetic Quality and Environmental Health: Study participants expressed concern about the impacts on the landscape, and relatedly, their desire to live in the area. For many, the rural nature is the reason they live where they do; they feared that development of the Marcellus would permanently degrade the amenities and quality of life they’ve come to appreciate. Concerns over environmental health were raised by study participants in Westmoreland and Susquehanna Counties. These concerns include water quality and quantity, forest fragmentation and wildlife habitat. Participants in Susquehanna were particularly attuned to environmental concerns given the incidents in Dimock.
Conclusion In general, most study participants described development of the Marcellus Shale as a chance for ‘economic revival,’ but raised many concerns about the potential costs to various segments of the community, infrastructure, and natural environment. They expressed a desire for development strategies and tools for managing growth that provide the most benefits to their counties. Taxes were described frequently as one potential tool to provide direct income to local jurisdictions.
57
Training programs for educating the local population for entry into gas exploration and development fields was another tool discussed for distributing the benefits from Marcellus development. Participants also wanted information that could guide their decision-making and allow them to anticipate emerging problems. Although many participants were uncertain about the likely trajectory of the development, they expressed hope that developing the Marcellus ‘play’ would benefit their communities.
Arkansas & Texas Interviews
Introduction There are several unconventional gas plays throughout the United States. One of those plays, the Barnett Shale, located in north central Texas, was the first unconventional shale play in the country. The Barnett Shale is a hydrocarbon-producing geological formation of great economic significance to Texas. It covers 5,000 square miles and 18 counties. (Texas RRC).The Barnett Shale is one of the most significant onshore natural gas fields in North America and the largest in Texas, with thousands of wells producing hundreds of billions of cubic feet of natural gas each year (Perryman). Although many have known about the Barnett Shale for several years, it wasn’t until drilling techniques advanced in the 1990’s that it became a recoverable resource. Significant drilling activity began in the late 1990's. The success that independents have had in producing from the Barnett Shale is beginning to attract the interest of the large companies. (Texas RRC). Texas has a rich history of natural resource development and as a result respondents had very positive attitudes toward the Barnett Shale play. The Fayetteville Shale is an unconventional gas reservoir located on the Arkansas side of the Arkoma Basin, ranging in thickness from 50 to 325 feet and ranging in depth from 1,500 to 6,500 feet. The Fayetteville Shale is aerially extensive and may be present across ten counties in central and eastern Arkansas (University of Arkansas, 2006). Arkansas has a history of natural resource development but none as impactful as the Fayetteville Shale play which began in 2004. In April 2010, two members of the research team travelled to Texas and Arkansas to conduct interviews and gather information on the economic and social effects of these two unconventional gas plays. The interviews aimed to examine how the presence of the shale affects the community, how residents have reacted, and relationship with industry among several other areas. A total of eight interviews were conducted in Texas ― two with educators; four with local government (two elected officials – city and county and two government staff); one with an economic development professional; and one with a local writer/editor. The interviews took place in both urban and rural areas. Interviews were conducted in Tarrant, Denton, and Navarro Counties.
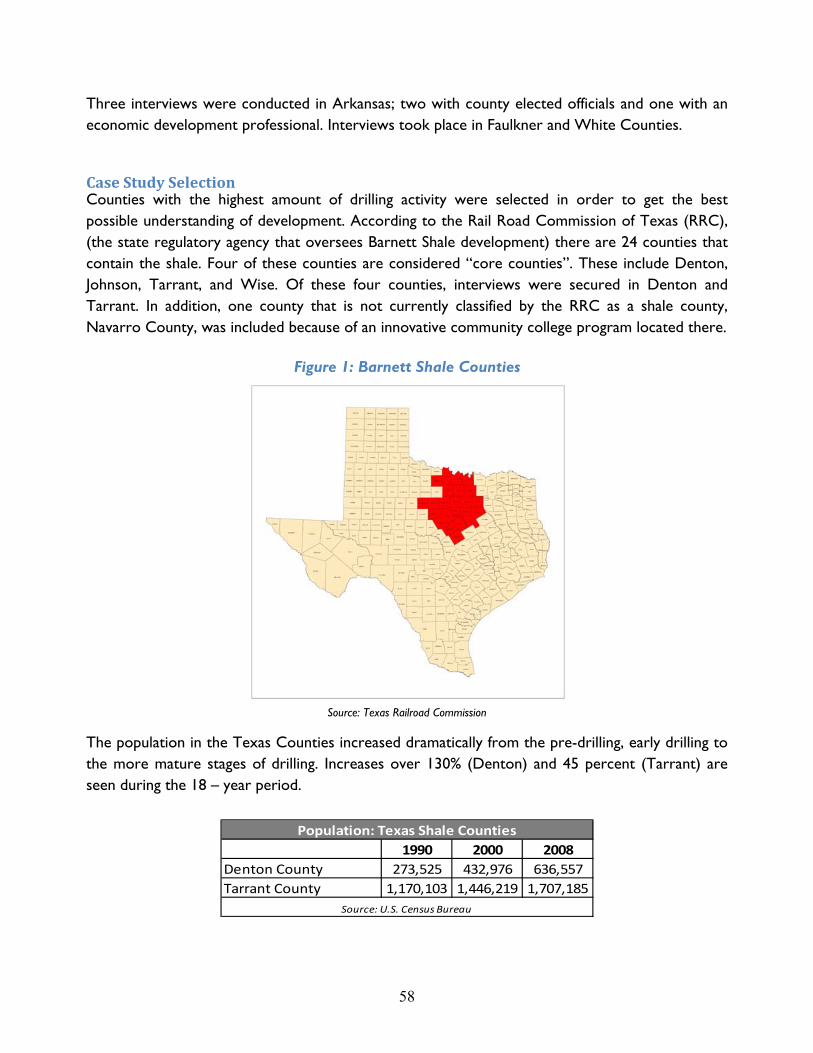
58
Three interviews were conducted in Arkansas; two with county elected officials and one with an economic development professional. Interviews took place in Faulkner and White Counties.
Case Study Selection Counties with the highest amount of drilling activity were selected in order to get the best possible understanding of development. According to the Rail Road Commission of Texas (RRC), (the state regulatory agency that oversees Barnett Shale development) there are 24 counties that contain the shale. Four of these counties are considered “core counties”. These include Denton, Johnson, Tarrant, and Wise. Of these four counties, interviews were secured in Denton and Tarrant. In addition, one county that is not currently classified by the RRC as a shale county, Navarro County, was included because of an innovative community college program located there.
Figure 1: Barnett Shale Counties
Source: Texas Railroad Commission
The population in the Texas Counties increased dramatically from the pre-drilling, early drilling to the more mature stages of drilling. Increases over 130% (Denton) and 45 percent (Tarrant) are seen during the 18 – year period.
1990 2000 2008Denton County 273,525 432,976 636,557Tarrant County 1,170,103 1,446,219 1,707,185
Population: Texas Shale Counties
Source: U.S. Census Bureau

59
Increases in median household income were also demonstrated. Denton County showed a 98 percent increase and Tarrant County posted a 71 percent increase.
1990 2000 2008Denton County 36,914$ 58,216$ 73,275$ Tarrant County 32,335$ 46,178$ 55,425$
Source: U.S. Census Bureau
Median household Income: Texas Shale Counties
The Texas counties also experienced increases in the poverty level from 2000 to 2008 after experiencing decreases from 1990 to 2000. The price of the median family home increased by almost 100 percent in Denton and 88 percent in Tarrant County.
Housing Values: Texas Shale Counties 1990 2000 2008 Denton County $ 89,100 $ 133,200 $ 178,100 Tarrant County $ 72,900 $ 90,300 $ 137,100
Source: U.S. Census Bureau
According to IRS in-migration data, Texas Counties essentially doubled their in-migration patterns form 2002 – 2007 over the period 1997 – 2002. Denton County, Texas exploded in terms of jobs in all sectors except (manufacturing) and saw increases in all types of establishments. Denton saw huge gains each year beginning from 1998 to 1999 in all categories. Those increases were consistent through the entire study period. Denton’s growth in establishments showed diversity as well. There were a number of sectors where larger companies (100+) were evident. The 500+ categories with significant growth were wholesale, information, administration, healthcare, arts, other services and management of companies. In Arkansas, “the most active area of natural gas development is from western Faulkner County through eastern White County” (University of Arkansas). Because of this, Faulkner and White Counties were selected.
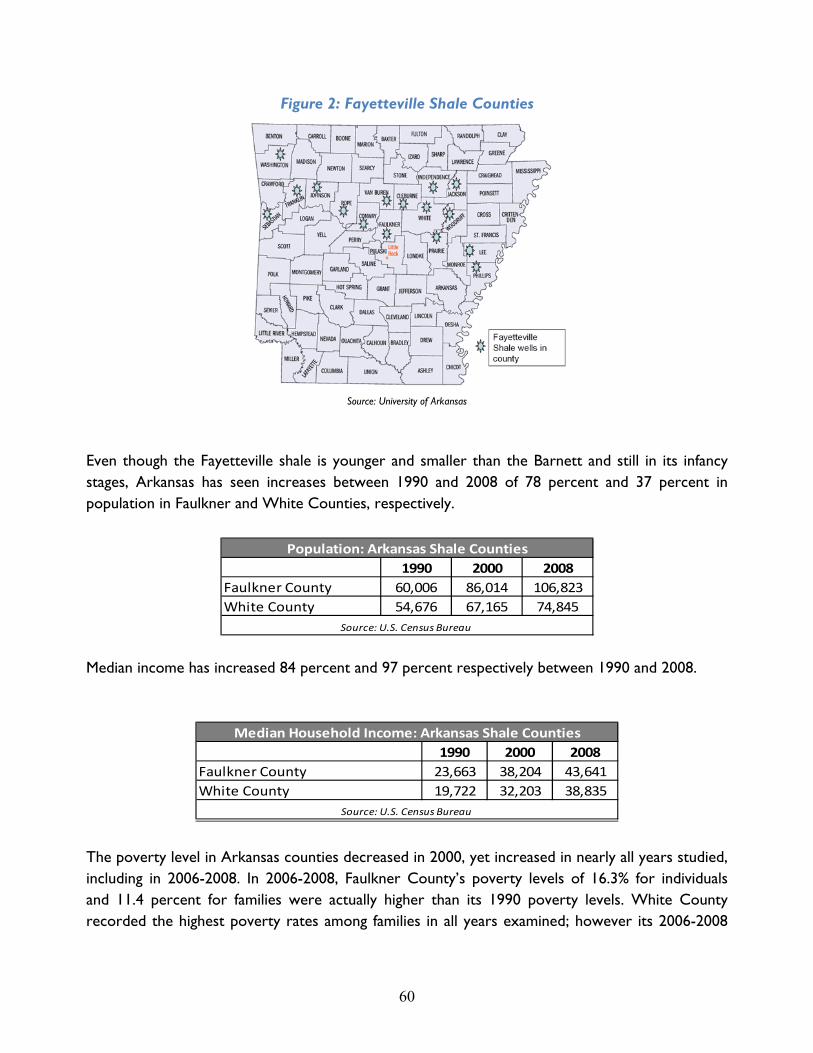
60
Figure 2: Fayetteville Shale Counties
Source: University of Arkansas
Even though the Fayetteville shale is younger and smaller than the Barnett and still in its infancy stages, Arkansas has seen increases between 1990 and 2008 of 78 percent and 37 percent in population in Faulkner and White Counties, respectively.
1990 2000 2008Faulkner County 60,006 86,014 106,823White County 54,676 67,165 74,845
Population: Arkansas Shale Counties
Source: U.S. Census Bureau Median income has increased 84 percent and 97 percent respectively between 1990 and 2008.
1990 2000 2008Faulkner County 23,663 38,204 43,641White County 19,722 32,203 38,835
Source: U.S. Census Bureau
Median Household Income: Arkansas Shale Counties
The poverty level in Arkansas counties decreased in 2000, yet increased in nearly all years studied, including in 2006-2008. In 2006-2008, Faulkner County’s poverty levels of 16.3% for individuals and 11.4 percent for families were actually higher than its 1990 poverty levels. White County recorded the highest poverty rates among families in all years examined; however its 2006-2008
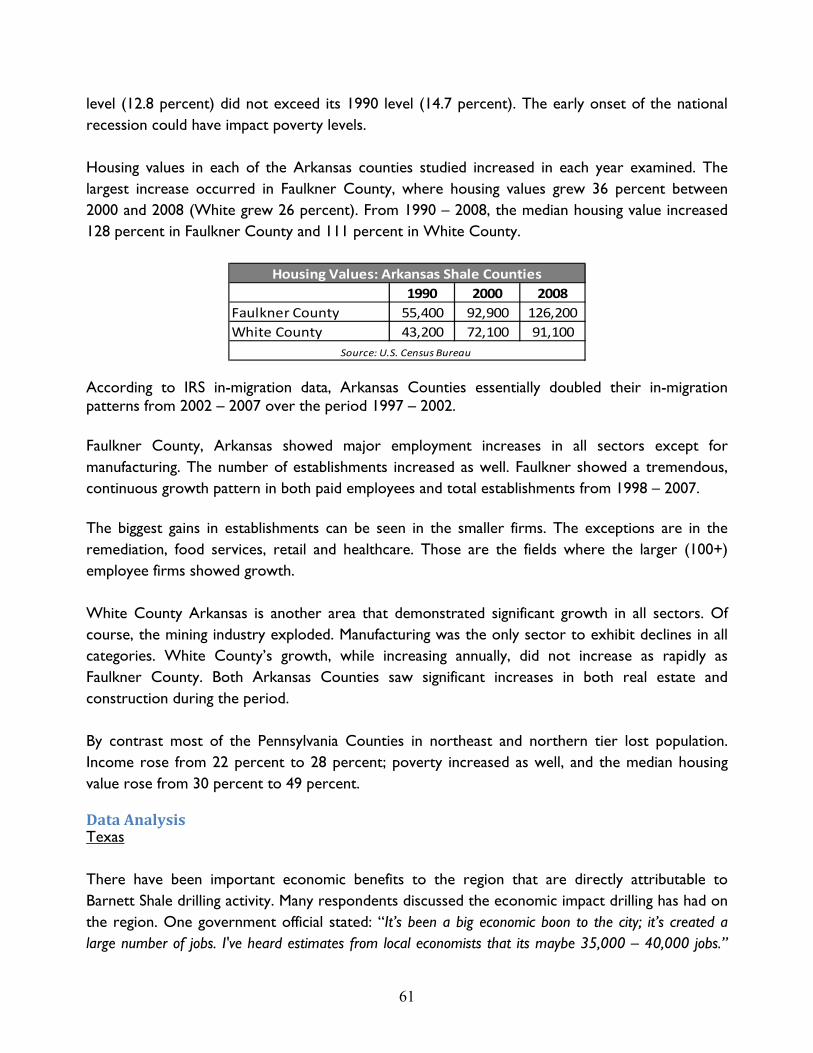
61
level (12.8 percent) did not exceed its 1990 level (14.7 percent). The early onset of the national recession could have impact poverty levels. Housing values in each of the Arkansas counties studied increased in each year examined. The largest increase occurred in Faulkner County, where housing values grew 36 percent between 2000 and 2008 (White grew 26 percent). From 1990 – 2008, the median housing value increased 128 percent in Faulkner County and 111 percent in White County.
1990 2000 2008Faulkner County 55,400 92,900 126,200White County 43,200 72,100 91,100
Housing Values: Arkansas Shale Counties
Source: U.S. Census Bureau
According to IRS in-migration data, Arkansas Counties essentially doubled their in-migration patterns from 2002 – 2007 over the period 1997 – 2002. Faulkner County, Arkansas showed major employment increases in all sectors except for manufacturing. The number of establishments increased as well. Faulkner showed a tremendous, continuous growth pattern in both paid employees and total establishments from 1998 – 2007. The biggest gains in establishments can be seen in the smaller firms. The exceptions are in the remediation, food services, retail and healthcare. Those are the fields where the larger (100+) employee firms showed growth. White County Arkansas is another area that demonstrated significant growth in all sectors. Of course, the mining industry exploded. Manufacturing was the only sector to exhibit declines in all categories. White County’s growth, while increasing annually, did not increase as rapidly as Faulkner County. Both Arkansas Counties saw significant increases in both real estate and construction during the period. By contrast most of the Pennsylvania Counties in northeast and northern tier lost population. Income rose from 22 percent to 28 percent; poverty increased as well, and the median housing value rose from 30 percent to 49 percent.
Data Analysis Texas There have been important economic benefits to the region that are directly attributable to Barnett Shale drilling activity. Many respondents discussed the economic impact drilling has had on the region. One government official stated: “It’s been a big economic boon to the city; it’s created a large number of jobs. I've heard estimates from local economists that its maybe 35,000 – 40,000 jobs.”
62
Another suggested the presence of the drilling will likely get the region out of the recession much faster than other parts of the country and indicated that without the presence of the Barnett Shale industry -- there would be far fewer jobs in the area. Several of the key informants acknowledged that they had seen a decrease in drilling and jobs due to the currently low price of natural gas; however, each expected to see an increase in the near future. In addition to increased jobs in the area, many respondents discussed the effect of the bonuses and royalty payments to landowners:
It has been an injection of revenue into our citizen’s pockets, initially for the lease and now with production online…we’ve always said that the Barnett was like a continuous stimulus package to our citizens because that’s a $100-$300 dollar check every month. There are a lot of factors as to why we are doing so good compared to the rest of the country. I attribute part of that success to this.
Although all interviewees had very positive views overall, a few interviewees were able to report on negative impacts from the shale development. These individuals cited their experiences observing others concerns. One respondent discussed that his opinion that gas industry has been insensitive when it comes to where they drill, build facilities, or build pipelines: “There has been a constant challenge in neighborhoods about where you locate drill sites. In Texas, an oil [or gas] company has the right of eminent domain as it relates to pipelines. They have been somewhat insensitive at least initially about where they put their pipelines; they can take your property and put a pipeline across.” Two interviewees mention environmental issues, specifically air quality. Several interviewees mentioned that residents in the local area are concerned about high levels benzene potentially caused by drilling. However, the Texas Commission on Environmental Quality has not yet come up with conclusive evidence proving that to be the case. Road congestion did not seem to be a contentious issue most likely because of the vast infrastructure in the Dallas/Fort Worth area. Interviewees stated they felt that a large majority of residents in the local area have responded quite positively overall. Respondents said they have not seen a great deal of pushback in the community. A few interviewees indicated there were some local groups who were considered drilling opponents mainly because of potential environmental issues. Respondents were asked about the level of trust among the community and the natural gas industry. A few indicated that only a small minority had distrust for the industry while others said there is wide distrust because companies did not have adequate public relations campaigns. A few mentioned that the “landmen” whose goal it was the lease properties early on were not very ethical and created a negative view of the entire industry. Another said a few smaller companies have not done good work and they also create a negative view of industry. Several interviewees had leases on their personal properties. Both elected officials also stated that their respective local government has leases on public land.
63
Arkansas Interviewees indicated the region has greatly benefitted economically. People in the community have benefitted from leases and royalties and local government has benefitted from the purchase of easements and pipeline crossings as well as an increase in sales tax revenue. Small stores have gone from near closing to thriving and restaurants are filled mainly because of the Fayetteville Shale. One economic development representative stated: “We are almost untouched by the national economy.” He went on to discuss that restaurant revenue has increased four percent in the region over the past year, while new industry specific jobs within county increased by 3,000-4,000: Additional lodging (hotels and motels) has opened within the last three to five years throughout this region. Additionally small business owners have had noticeable growth. One specific example was cited of a small family owned and operated trucking firm which grew from a few employees to over 100 employees in a span of two to three years. Two interviewees mentioned that they thought the natural gas drilling helped with national security – decreasing dependence on foreign oil and gas. One interviewee mentioned that the region was not feeling recession as much as other parts of the county and that could create an over-confidence. Residents receiving bonus and royalty checks could extend themselves because of this additional disposable income when it could decrease at any time due to dropping gas prices. In addition, both government officials discussed the strain that the drilling has put on their offices. Blue collar jobs in the county paid well prior to the shale exploration, but the new businesses in the region are now paying up to $90,000 salaries to some workers in their industry. Mention was made of passing a convenience store early one morning and the number of gas related trucks that were in the parking lot, with workers buying coffee, gas, and water on their way to work. This was noticeable in this rural area as commerce such as this was unheard of prior to the shale play. One interviewee discussed the initial shock the development had on the community and the affects of differing dollar amount land owners received for leasing their property. According to one government official: “Initially people were overwhelmed. There was a title wave that simply overwhelmed people because they really didn’t know what to anticipate. Unfortunately, there were some people taken advantage of during that process because as leases increased to $300, $400, $1000, those that leased for $50 thought they were taken advantage of; they felt a sense of being betrayed.” Key informants expressed some concern about the environmental effect of natural gas development. Another negative mentioned was the use of water and what should be done with waste water. Also addressed was the creation of artificial ponds to collect water and the effect that may have on watershed and erosion.
Anytime the earth is moved and structures are built it changes the course of mother nature especially when it comes to water so water begins to try another route it hasn’t found before and as a result because the dirt has been moved you have much more erosion, you
64
have much more silt in creeks, ponds and rivers which will affect the quality of life. And you have new found drainage issues. In the next 5-10 years we’ll be dealing with drainage and erosion issues.
Roads and infrastructure were greatly affected by the development of Fayetteville Shale. All three interviewees discussed the impact on roads in the region – both an increase in traffic and damage from industry trucks. All indicated the roads were not designed to handle the current truck load, “One of the huge negatives is the traffic. One of my biggest concerns is increased traffic on county roads.” The damage to infrastructure, much of which is on two lane dirt and cinder roads, is prevalent. One government officials also commented that the roads are a major concern for their jurisdiction as school buses travel them heavily taking children to and from school on a daily basis, in many remote areas of the county. One informant indicated that there has been over $200 million in road damages in a five county area over the past few years with $6 million occurring in Faulkner County alone. Mineral rights have become a priority in real estate sales. Postings state whether mineral rights are conveyed. Officials did visit Texas to learn how to structure ordinances, and how to plan in regard to fire and ambulance services. In Arkansas, there was significant discussion surrounding the tax and regulatory environment. Local government officials indicated that the severance tax is “ridiculously low.” The county receives only .02 on every dollar, the school district .85 on every dollar and the remainder goes to the state. Local government’s revenue is generated on sales tax receipts and job creation. It was further elaborated that there are inefficiencies in what the gas companies pay. The gas companies pay the state to fix roads; however the state doesn’t use money for that purpose. So it becomes another source of revenue for the state. The gas companies then help the local government fix the roads so in essence, they are paying for road repair twice. The message was that Pennsylvania needs to move fast and furious to improve both its regulatory environment and its tax structure. Land use issues resulting from new business development is another problem. Most rural local governments do not have the appropriate land use and zoning in place. There is also a lack of understanding regarding mineral rights ownership and that is now coming to the forefront in a number of legal issues. Further, residents are very naïve as they sign leases. They do not ask the proper questions or make any demands regarding construction, reclamation, and monitoring. Distrust is evident as there is a lack of understanding with regard to how lease rates are determined and there are significant variances in lease rates among residents. Landmen are highly suspect.
65
There are some social disadvantages to drilling. Specifically, mismanagement of wealth was cited as people who never had money, now do, and do not know how to manage it.
Summary Each county selected for this analysis provide unique insights into the early impacts and experiences of development of the Marcellus Shale. The counties represent differing levels of population as well as histories of extraction. In this section we summarize the main similarities across the counties, as well as some key differences in how the development of the Marcellus Shale is being experienced by formal and informal leaders. We organize this summary in terms of impacts on the local economy, social relationships, physical infrastructure, aesthetic quality, and environmental health. Economic Impacts: Respondents in both Texas and Arkansas discussed the positive economic impact natural gas development had on their regions. These impacts included the addition of direct and indirect jobs to the local area. Also discussed was the ripple effect the presence of the industry has had on hotels, restaurants and retail. Interviewees also discussed the increase in income many landowners who have leased their property have seen. One interviewee called it an injection of revenue into the local economy. Social Impacts: Study respondents discussed that some groups have formed in opposition to natural gas drilling. These groups, for the most part, exist to prevent drilling in a neighborhood or housing development. They form due to the fact that mineral rights trump surface rights in Texas and Arkansas and many times property owners cannot prevent a well from being built on their property. There did not appear to be distrust for the natural gas industry in either state. However, many of the study participants indicated that although they did not have any distrust with the industry, property owners who believed they were wronged by a company tended to have distrust for the industry as a whole. In addition, key informants in both states discussed their perception that landmen were not up front with landowners and that caused a level of distrust among residents. Two key informants ran educational programs that were created as a direct result of the Barnett Shale. One was an undergraduate minor in Energy Technology and Management. So far 245 students have minored in the program. The other program was a certificate program in Oil and Gas Production Technology. The program began in 2008 and 274 students have graduated with their certificate.
66
Infrastructure: Road damage and traffic was one of the biggest concerns among interviewees. Arkansas participants described in detail how these issues were affecting each county studied. Roads were not made to sustain the current amount of impact caused by the increased truck traffic. In Texas, one government official indicated companies must define the route they will take to each drill site so that the damage can be accurately assessed. In Arkansas, a government official stated he wished he insisted on obtaining route information from firms prior to the drilling as they never anticipated the large number of tri-axle trucks that would be traveling these roads daily, weekly, and monthly. Environment: In Texas, participants discussed how the current discussion among residents in the region is focused on air quality and the amount of benzene in the air. Several interviewees mentioned that residents in the local area are concerned about high levels of benzene potentially caused by drilling. However, the Texas Commission on Environmental Quality has not yet come up with conclusive evidence proving that to be the case. In Arkansas, the concern was about water quality and damage to the surface. Arkansas government officials reported no well contamination yet. They have developed stringent testing and regulation. Government Local government resources will be strained as respondents in both Arkansas and Texas detailed. Additional people will be needed on the local level to carry out government functions as shale develops. Local government should have one point person who knows a single point of contact in each drilling company, has access to all truck routes, and encourages companies to use local businesses, and even provides them with necessary information. Local government ordinances should be comprehensive and strong. They should be re-evaluated regularly.
Conclusion Overall, despite mentioning some negative aspects of the gas plays, interviewees in both regions had overwhelmingly positive attitudes toward natural gas drilling and the industry as a whole. Both experienced economic boons as a result of drilling and acknowledge the presence of the industry prevented job loss and even created thousands of new job opportunities. This economic impact greatly contributes to the positive attitudes. Comments regarding the negative side of the industry consisted of road damage, traffic (more so in Arkansas) and environmental concerns such as air and water quality. Respondents mainly agreed that the positives greatly outweighed the negative. Key informants were asked if they had any advice or “lessons learned” that they could share with us as our region further develops the Marcellus Shale. Two suggested that communication with the industry and the community was of the utmost importance. They suggested local government educate residents about the process and the business. One education professional suggested community college level programs focus on production rather than drilling because production

67
jobs are more stable and long term. Local government officials in both Texas and Arkansas strongly suggested local government require the industry to provide them with the routes they will follow to each drilling site. This will help them to better assess road damage and avoid possible traffic accidents. A suggestion was made to have a point person in the county work with a single point of contact in each drilling company. Recommendations for local government were simple: have a strong set of comprehensive ordinances in place regulating all aspects of drilling operations. Encourage the state to upgrade all its regulations and tax codes.

68
References Brasier, K., M. Filteau, D. McLaughlin, J. Jacquet, R. Stedman, T. Kelsey, and S. Goetz. 2010. Residents’ Perceptions of Community and Environmental Impacts from Development of Natural Gas in the Marcellus Shale: A Comparison of Pennsylvania and New York Case Studies. Unpublished manuscript. Brown, R. B., S. F. Dorius, and R. S. Krannich. 2005. “The Boom-Bust Recovery Cycle: Dynamics of Change in Community Satisfaction and Social Integration in Delta, Utah.” Rural Sociology 70(1): 28-49. Brown, R. B., H. R. Geertsen, and R. S. Krannich. 1989. “Community Satisfaction and Social Integration in a Boomtown: A Longitudinal Analysis.” Rural Sociology 54: 568-86. Dell, B. P., Noam Lockshin, and Scott Gruber. 2008. “Bernstein E&Ps: Where is the Core of the Marcellus? New York: Sanford C. Bernstein & Co. http://www.thefriendsvillegroup.org/bernsteinreport.pdf (retrieved 07/23/2010). Engelder T. and G.G.Lash. 2008. “Marcellus shale play’s Vast Resource Potential Creating Stir in Appalachia” American Oil and Gas Reporter 51(6): 76-87. Freudenburg, William R., 1981. “Women and Men in an Energy Boom Town: Adjustment, Alienation and Adaptation” Rural Sociology 46: 220-44. Freudenburg, William R. and Robert Gramling. 1992. “Community Impacts of Technological Change: Toward a Longitudinal Perspective” Social Forces 70(4): 937-955. Gilmore, John. S. 1976. “Boom Towns May Hinder Energy Resource Development: Isolated Rural Communities Can-not Handle Sudden Industrialization and Growth Without Help” Science191:535-40. Harper, J. A. 2008. “The Marcellus Shale – An Old “New” Gas Reservoir in Pennsylvania.” Pennsylvania Geology 38:2-13. Lovejoy, Stephen. B. and Ronald. L. Little. 1979. “Energy Development and Local Employment” The Social Science Journal 16:2. Pennsylvania Department of Environmental Protection (DEP) 2010. “Marcellus Shale.” http://www.dep.state.pa.us/dep/deputate/minres/oilgas/new_forms/marcellus/marcellus.htm (retrieved 07/23/2010). Projecting the Economic Impact of the Fayetteville Shale Play for 2005-2008. University of Arkansas. May 2006. p.ii. Smith, M. D., R. S. Krannich, and L. M. Hunter. 2001. “Growth, Decline, Stability, and Disruption: A Longitudinal Analysis of Social Well-Being in Four Western Rural Communities.” Rural Sociology 66: 425-50. The Institute for Public Policy & Economic Development. A Primer on Marcellus Shale. May 2008. 1-7. The Institute for Public Policy & Economic Development. The Impact of Marcellus Shale in Northeastern Pennsylvania with Emphasis on Charities, Crime, and Poverty. June 2008.
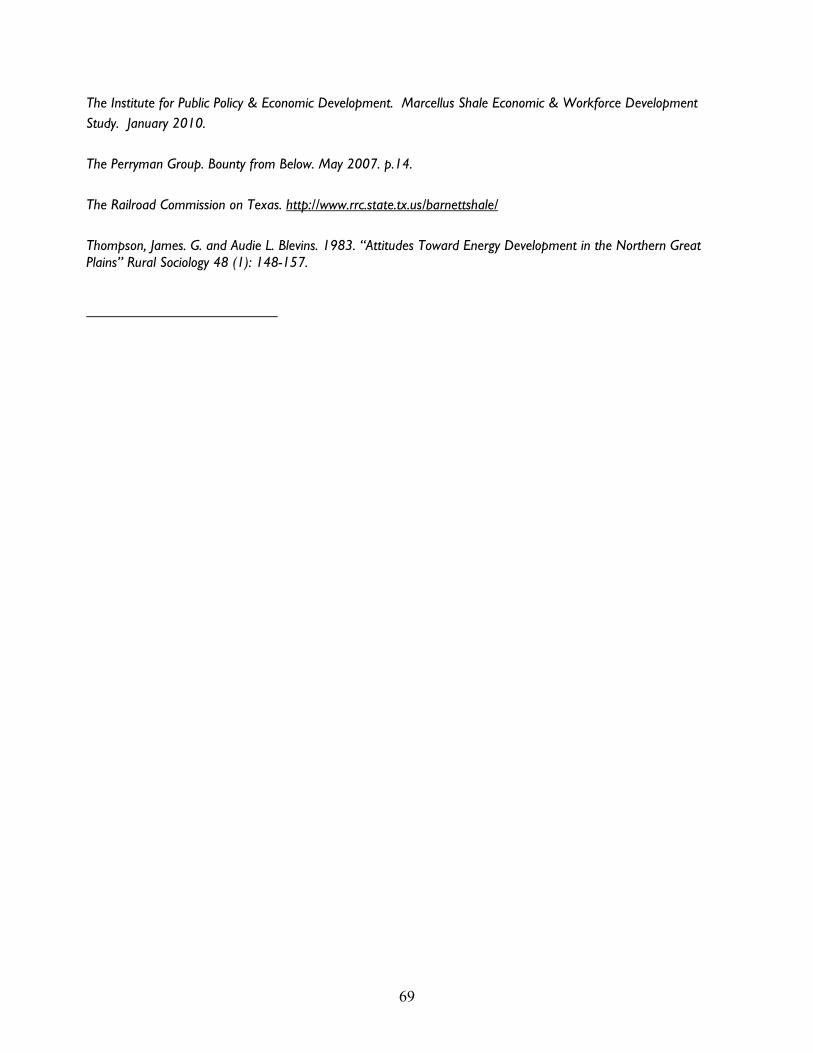
69
The Institute for Public Policy & Economic Development. Marcellus Shale Economic & Workforce Development Study. January 2010. The Perryman Group. Bounty from Below. May 2007. p.14. The Railroad Commission on Texas. http://www.rrc.state.tx.us/barnettshale/ Thompson, James. G. and Audie L. Blevins. 1983. “Attitudes Toward Energy Development in the Northern Great Plains” Rural Sociology 48 (1): 148-157.
70
Appendix
Appendix A ― The Household Survey
Appendix B ― Survey Frequency Tables
Appendix C ―Pennsylvania Key Informant Questionnaire
Appendix D ―Arkansas & Texas Key Informant Questionnaire

Survey Questionnaire APPENDIX A
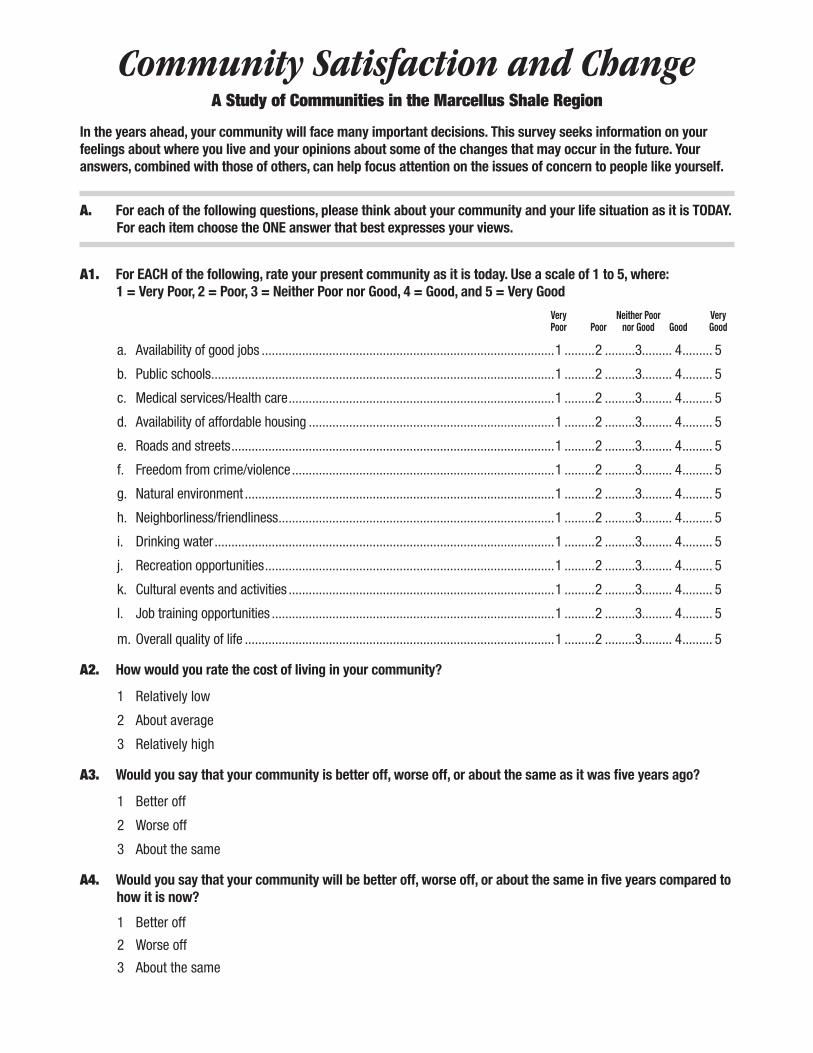
Community Satisfaction and ChangeA Study of Communities in the Marcellus Shale Region
In the years ahead, your community will face many important decisions. This survey seeks information on your feelings about where you live and your opinions about some of the changes that may occur in the future. Your answers, combined with those of others, can help focus attention on the issues of concern to people like yourself.
A. For each of the following questions, please think about your community and your life situation as it is TODAY. For each item choose the ONE answer that best expresses your views.
A1. For EACH of the following, rate your present community as it is today. Use a scale of 1 to 5, where: 1 = Very Poor, 2 = Poor, 3 = Neither Poor nor Good, 4 = Good, and 5 = Very Good
Very Neither Poor Very Poor Poor nor Good Good Good
a. Availability of good jobs .......................................................................................1 .........2 .........3......... 4 ......... 5
b. Public schools ......................................................................................................1 .........2 .........3......... 4 ......... 5
c. Medical services/Health care ...............................................................................1 .........2 .........3......... 4 ......... 5
d. Availability of affordable housing .........................................................................1 .........2 .........3......... 4 ......... 5
e. Roads and streets ................................................................................................1 .........2 .........3......... 4 ......... 5
f. Freedom from crime/violence ..............................................................................1 .........2 .........3......... 4 ......... 5
g. Natural environment ............................................................................................1 .........2 .........3......... 4 ......... 5
h. Neighborliness/friendliness ..................................................................................1 .........2 .........3......... 4 ......... 5
i. Drinking water .....................................................................................................1 .........2 .........3......... 4 ......... 5
j. Recreation opportunities ......................................................................................1 .........2 .........3......... 4 ......... 5
k. Cultural events and activities ...............................................................................1 .........2 .........3......... 4 ......... 5
l. Job training opportunities ....................................................................................1 .........2 .........3......... 4 ......... 5
m. Overall quality of life ............................................................................................1 .........2 .........3......... 4 ......... 5
A2. How would you rate the cost of living in your community?
1 Relatively low
2 About average
3 Relatively high
A3. Would you say that your community is better off, worse off, or about the same as it was five years ago?
1 Better off
2 Worse off
3 About the same
A4. Would you say that your community will be better off, worse off, or about the same in five years compared to how it is now?
1 Better off
2 Worse off
3 About the same
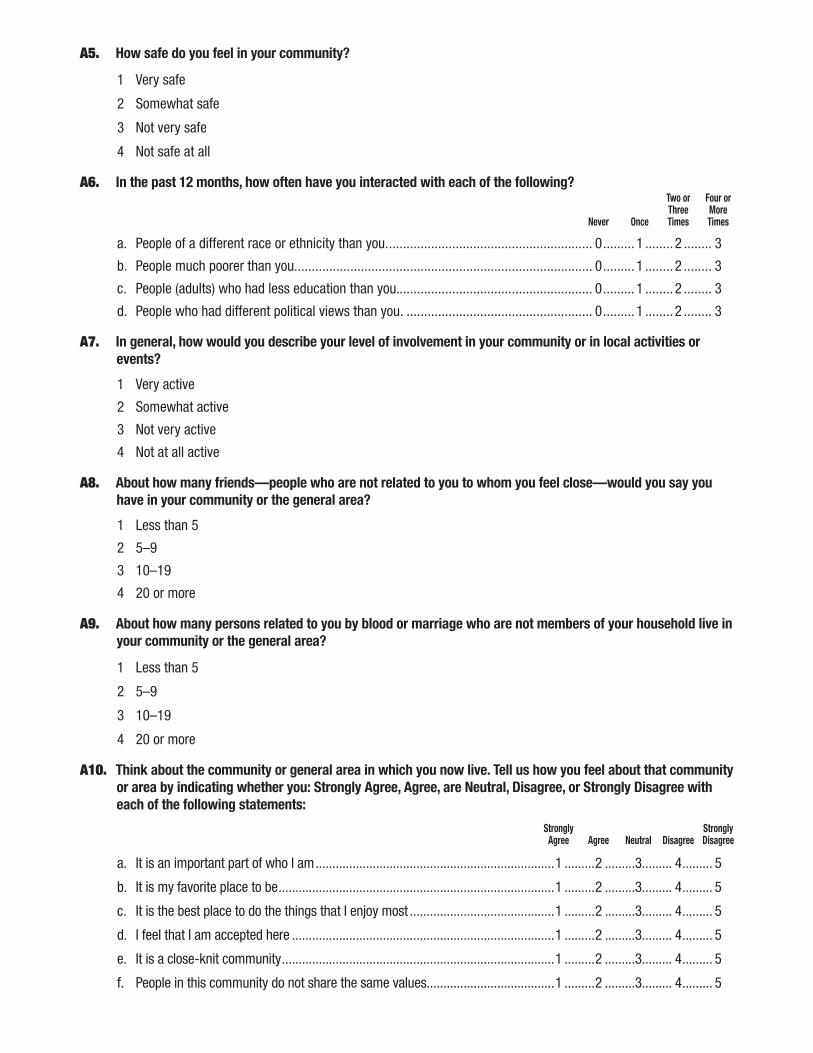
A5. How safe do you feel in your community?
1 Very safe
2 Somewhat safe
3 Not very safe
4 Not safe at all
A6. In the past 12 months, how often have you interacted with each of the following? Two or Four or Three More Never Once Times Times
a. People of a different race or ethnicity than you. .......................................................... 0 ......... 1 ........ 2 ........ 3
b. People much poorer than you. .................................................................................... 0 ......... 1 ........ 2 ........ 3
c. People (adults) who had less education than you. ....................................................... 0 ......... 1 ........ 2 ........ 3
d. People who had different political views than you. ..................................................... 0 ......... 1 ........ 2 ........ 3
A7. In general, how would you describe your level of involvement in your community or in local activities or events?
1 Very active
2 Somewhat active
3 Not very active
4 Not at all active
A8. About how many friends—people who are not related to you to whom you feel close—would you say you have in your community or the general area?
1 Less than 5
2 5–9
3 10–19
4 20 or more
A9. About how many persons related to you by blood or marriage who are not members of your household live in your community or the general area?
1 Less than 5
2 5–9
3 10–19
4 20 or more
A10. Think about the community or general area in which you now live. Tell us how you feel about that community or area by indicating whether you: Strongly Agree, Agree, are Neutral, Disagree, or Strongly Disagree with each of the following statements:
Strongly Strongly Agree Agree Neutral Disagree Disagree
a. It is an important part of who I am .......................................................................1 .........2 .........3......... 4 ......... 5
b. It is my favorite place to be ..................................................................................1 .........2 .........3......... 4 ......... 5
c. It is the best place to do the things that I enjoy most ...........................................1 .........2 .........3......... 4 ......... 5
d. I feel that I am accepted here ..............................................................................1 .........2 .........3......... 4 ......... 5
e. It is a close-knit community .................................................................................1 .........2 .........3......... 4 ......... 5
f. People in this community do not share the same values......................................1 .........2 .........3......... 4 ......... 5
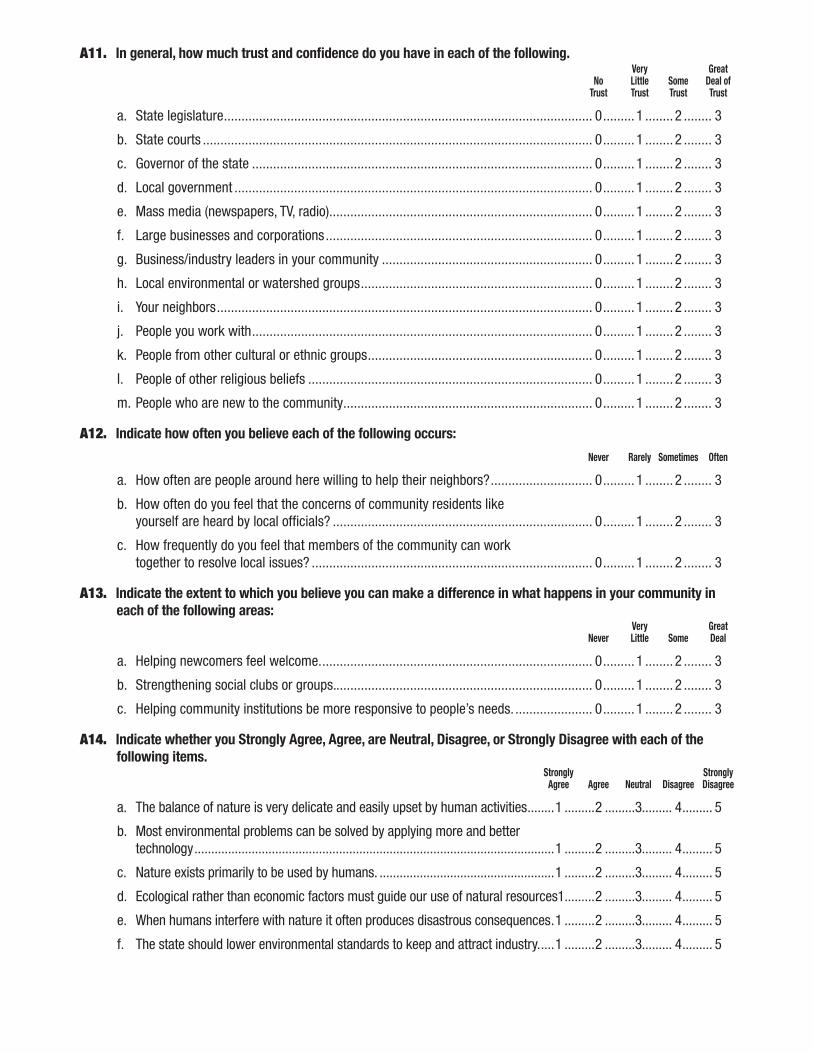
A11. In general, how much trust and confidence do you have in each of the following. Very Great No Little Some Deal of Trust Trust Trust Trust
a. State legislature ......................................................................................................... 0 ......... 1 ........ 2 ........ 3
b. State courts ............................................................................................................... 0 ......... 1 ........ 2 ........ 3
c. Governor of the state ................................................................................................. 0 ......... 1 ........ 2 ........ 3
d. Local government ...................................................................................................... 0 ......... 1 ........ 2 ........ 3
e. Mass media (newspapers, TV, radio)........................................................................... 0 ......... 1 ........ 2 ........ 3
f. Large businesses and corporations ............................................................................ 0 ......... 1 ........ 2 ........ 3
g. Business/industry leaders in your community ............................................................ 0 ......... 1 ........ 2 ........ 3
h. Local environmental or watershed groups .................................................................. 0 ......... 1 ........ 2 ........ 3
i. Your neighbors ........................................................................................................... 0 ......... 1 ........ 2 ........ 3
j. People you work with ................................................................................................. 0 ......... 1 ........ 2 ........ 3
k. People from other cultural or ethnic groups ................................................................ 0 ......... 1 ........ 2 ........ 3
l. People of other religious beliefs ................................................................................. 0 ......... 1 ........ 2 ........ 3
m. People who are new to the community ....................................................................... 0 ......... 1 ........ 2 ........ 3
A12. Indicate how often you believe each of the following occurs:
Never Rarely Sometimes Often
a. How often are people around here willing to help their neighbors? ............................. 0 ......... 1 ........ 2 ........ 3
b. How often do you feel that the concerns of community residents like yourself are heard by local officials? .......................................................................... 0 ......... 1 ........ 2 ........ 3
c. How frequently do you feel that members of the community can work together to resolve local issues? ................................................................................ 0 ......... 1 ........ 2 ........ 3
A13. Indicate the extent to which you believe you can make a difference in what happens in your community in each of the following areas:
Very Great Never Little Some Deal
a. Helping newcomers feel welcome. ............................................................................. 0 ......... 1 ........ 2 ........ 3
b. Strengthening social clubs or groups. ......................................................................... 0 ......... 1 ........ 2 ........ 3
c. Helping community institutions be more responsive to people’s needs. ...................... 0 ......... 1 ........ 2 ........ 3
A14. Indicate whether you Strongly Agree, Agree, are Neutral, Disagree, or Strongly Disagree with each of the following items.
Strongly Strongly Agree Agree Neutral Disagree Disagree
a. The balance of nature is very delicate and easily upset by human activities ........1 .........2 .........3......... 4 ......... 5
b. Most environmental problems can be solved by applying more and better technology ...........................................................................................................1 .........2 .........3......... 4 ......... 5
c. Nature exists primarily to be used by humans. ....................................................1 .........2 .........3......... 4 ......... 5
d. Ecological rather than economic factors must guide our use of natural resources 1.........2 .........3......... 4 ......... 5
e. When humans interfere with nature it often produces disastrous consequences .1 .........2 .........3......... 4 ......... 5
f. The state should lower environmental standards to keep and attract industry. ....1 .........2 .........3......... 4 ......... 5
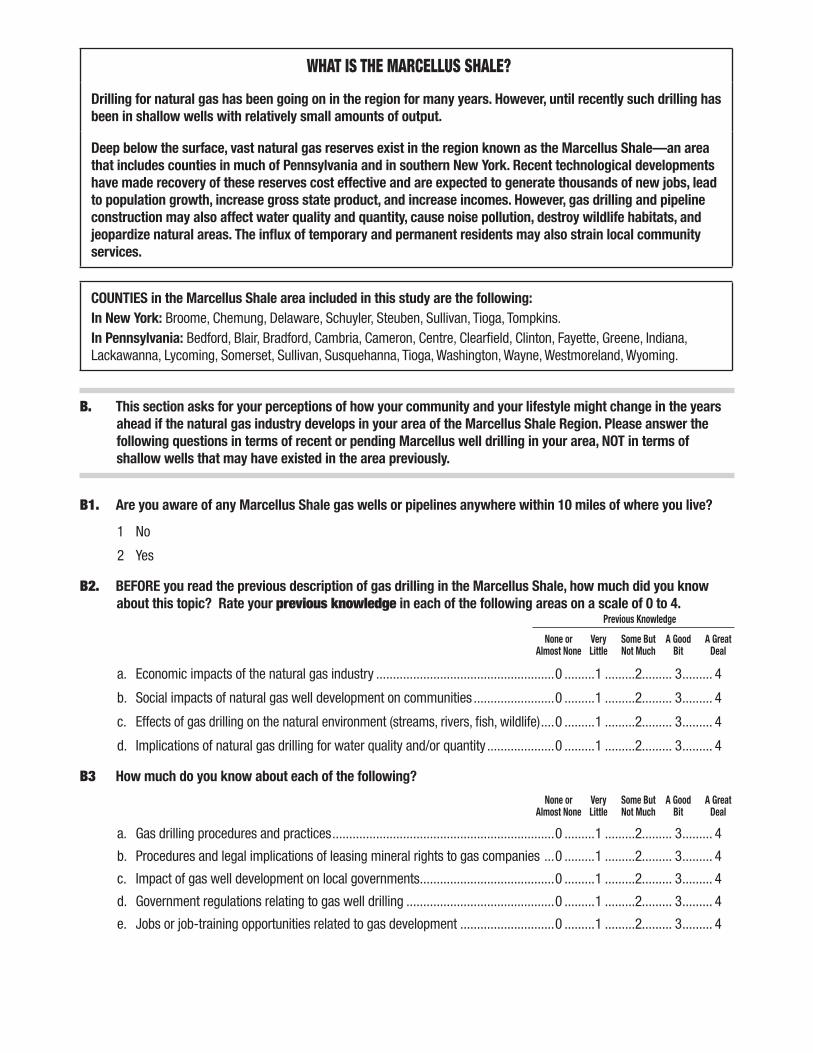
WHAT IS THE MARCELLUS SHALE?
Drilling for natural gas has been going on in the region for many years. However, until recently such drilling has been in shallow wells with relatively small amounts of output.
Deep below the surface, vast natural gas reserves exist in the region known as the Marcellus Shale—an area that includes counties in much of Pennsylvania and in southern New York. Recent technological developments have made recovery of these reserves cost effective and are expected to generate thousands of new jobs, lead to population growth, increase gross state product, and increase incomes. However, gas drilling and pipeline construction may also affect water quality and quantity, cause noise pollution, destroy wildlife habitats, and jeopardize natural areas. The influx of temporary and permanent residents may also strain local community services.
COUNTIES in the Marcellus Shale area included in this study are the following:In New York: Broome, Chemung, Delaware, Schuyler, Steuben, Sullivan, Tioga, Tompkins.In Pennsylvania: Bedford, Blair, Bradford, Cambria, Cameron, Centre, Clearfield, Clinton, Fayette, Greene, Indiana, Lackawanna, Lycoming, Somerset, Sullivan, Susquehanna, Tioga, Washington, Wayne, Westmoreland, Wyoming.
B. This section asks for your perceptions of how your community and your lifestyle might change in the years ahead if the natural gas industry develops in your area of the Marcellus Shale Region. Please answer the following questions in terms of recent or pending Marcellus well drilling in your area, NOT in terms of shallow wells that may have existed in the area previously.
B1. Are you aware of any Marcellus Shale gas wells or pipelines anywhere within 10 miles of where you live?
1 No
2 Yes
B2. BEFORE you read the previous description of gas drilling in the Marcellus Shale, how much did you know about this topic? Rate your previous knowledge in each of the following areas on a scale of 0 to 4.
Previous Knowledge
None or Very Some But A Good A Great Almost None Little Not Much Bit Deal
a. Economic impacts of the natural gas industry .....................................................0 .........1 .........2......... 3 ......... 4
b. Social impacts of natural gas well development on communities ........................0 .........1 .........2......... 3 ......... 4
c. Effects of gas drilling on the natural environment (streams, rivers, fish, wildlife) ....0 .........1 .........2......... 3 ......... 4
d. Implications of natural gas drilling for water quality and/or quantity ....................0 .........1 .........2......... 3 ......... 4
B3 How much do you know about each of the following?
None or Very Some But A Good A Great Almost None Little Not Much Bit Deal
a. Gas drilling procedures and practices ..................................................................0 .........1 .........2......... 3 ......... 4
b. Procedures and legal implications of leasing mineral rights to gas companies ...0 .........1 .........2......... 3 ......... 4
c. Impact of gas well development on local governments ........................................0 .........1 .........2......... 3 ......... 4
d. Government regulations relating to gas well drilling ............................................0 .........1 .........2......... 3 ......... 4
e. Jobs or job-training opportunities related to gas development ............................0 .........1 .........2......... 3 ......... 4

B4. Indicate how much each of the following has contributed to what you know about gas well drilling in the Marcellus Shale?
Very Pretty A Great None Little Some Much Deal
a. Media (Newspapers, radio, television) ..................................................................0 .........1 .........2......... 3 ......... 4
b. Natural gas industry representatives ...................................................................0 .........1 .........2......... 3 ......... 4
c. Internet ................................................................................................................0 .........1 .........2......... 3 ......... 4
d. Neighbors/ friends/ relatives ................................................................................0 .........1 .........2......... 3 ......... 4
e. Cooperative Extension or other educators ...........................................................0 .........1 .........2......... 3 ......... 4
f. Landowner groups. ..............................................................................................0 .........1 .........2......... 3 ......... 4
g. Environmental regulatory agencies ......................................................................0 .........1 .........2......... 3 ......... 4
B5. In the past twelve months, have you:
a. Sought information about natural gas development in your area? ....................................................No ...... Yes
b. Discussed natural gas development in your area with others?..........................................................No ...... Yes
c. Attended public meetings about natural gas development? ..............................................................No ...... Yes
d. Signed a petition related to natural gas regulations? ........................................................................No ...... Yes
e. Given money to a group working on issues related to natural gas development? ..............................No ...... Yes
f. Spoken or commented at a public meeting about natural gas development? ....................................No ...... Yes
g. Actively participated in a group working on natural gas issues? .......................................................No ...... Yes
h. Contacted by e-mail, phone, or letter the media or government officials to express your opinions about natural gas development? ................................................................................No ...... Yes
B6. Indicate how you expect Marcellus Shale gas development to impact each of the following things in your community:
Get Stay the Get Don’t Better Same Worse Know
a. Availability of good jobs ............................................................................................. 1 ......... 2 ........ 3 ........ 0
b. Quality of public schools ............................................................................................ 1 ......... 2 ........ 3 ........ 0
c. Quality of medical services/Health care ...................................................................... 1 ......... 2 ........ 3 ........ 0
d. Availablility of affordable housing ............................................................................... 1 ......... 2 ........ 3 ........ 0
e. Roads and streets ...................................................................................................... 1 ......... 2 ........ 3 ........ 0
f. Freedom from crime/violence .................................................................................... 1 ......... 2 ........ 3 ........ 0
g. Quality of the natural environment ............................................................................. 1 ......... 2 ........ 3 ........ 0
h. Neighborliness/friendliness ........................................................................................ 1 ......... 2 ........ 3 ........ 0
i. Drinking water ........................................................................................................... 1 ......... 2 ........ 3 ........ 0
j. Recreation opportunities ............................................................................................ 1 ......... 2 ........ 3 ........ 0
k. Cultural events or activities ........................................................................................ 1 ......... 2 ........ 3 ........ 0
l. Job training opportunities .......................................................................................... 1 ......... 2 ........ 3 ........ 0
m. Overall quality of life .................................................................................................. 1 ......... 2 ........ 3 ........ 0
n. Overall cost of living ................................................................................................... 1 ......... 2 ........ 3 ........ 0
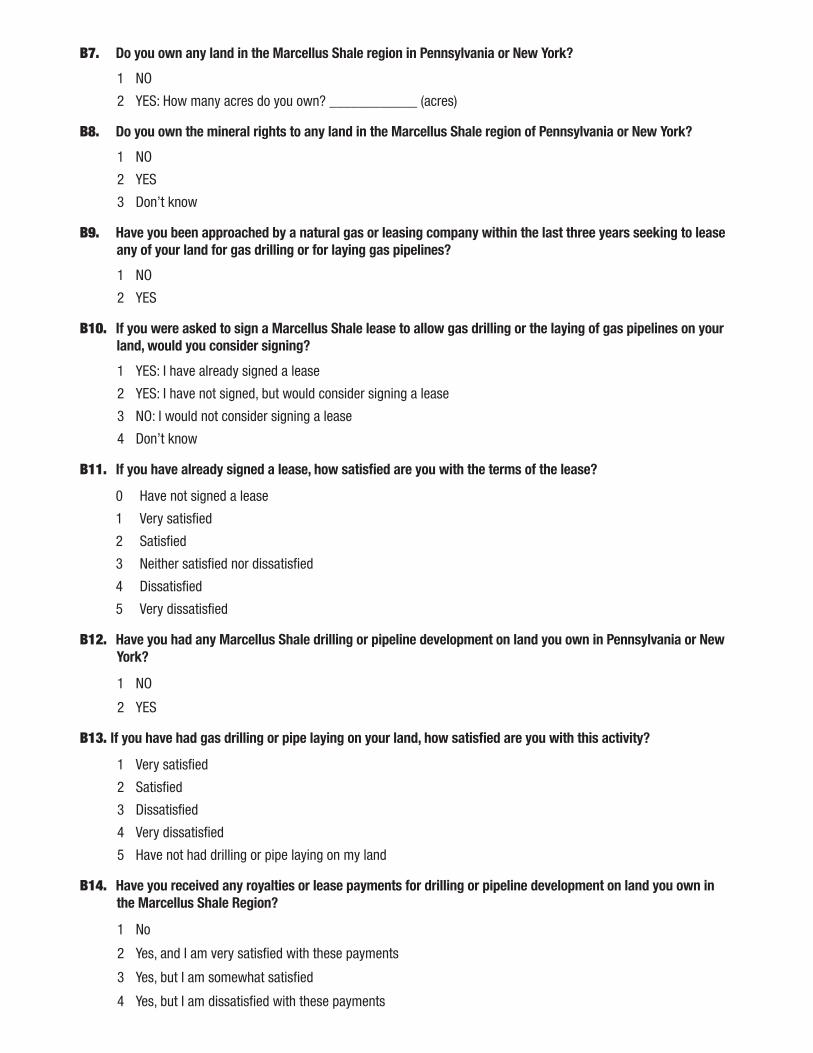
B7. Do you own any land in the Marcellus Shale region in Pennsylvania or New York?
1 NO
2 YES: How many acres do you own? ____________ (acres)
B8. Do you own the mineral rights to any land in the Marcellus Shale region of Pennsylvania or New York?
1 NO
2 YES
3 Don’t know
B9. Have you been approached by a natural gas or leasing company within the last three years seeking to lease any of your land for gas drilling or for laying gas pipelines?
1 NO
2 YES
B10. If you were asked to sign a Marcellus Shale lease to allow gas drilling or the laying of gas pipelines on your land, would you consider signing?
1 YES: I have already signed a lease
2 YES: I have not signed, but would consider signing a lease
3 NO: I would not consider signing a lease
4 Don’t know
B11. If you have already signed a lease, how satisfied are you with the terms of the lease?
0 Have not signed a lease
1 Very satisfied
2 Satisfied
3 Neither satisfied nor dissatisfied
4 Dissatisfied
5 Very dissatisfied
B12. Have you had any Marcellus Shale drilling or pipeline development on land you own in Pennsylvania or New York?
1 NO
2 YES
B13. If you have had gas drilling or pipe laying on your land, how satisfied are you with this activity?
1 Very satisfied
2 Satisfied
3 Dissatisfied
4 Very dissatisfied
5 Have not had drilling or pipe laying on my land
B14. Have you received any royalties or lease payments for drilling or pipeline development on land you own in the Marcellus Shale Region?
1 No
2 Yes, and I am very satisfied with these payments
3 Yes, but I am somewhat satisfied
4 Yes, but I am dissatisfied with these payments
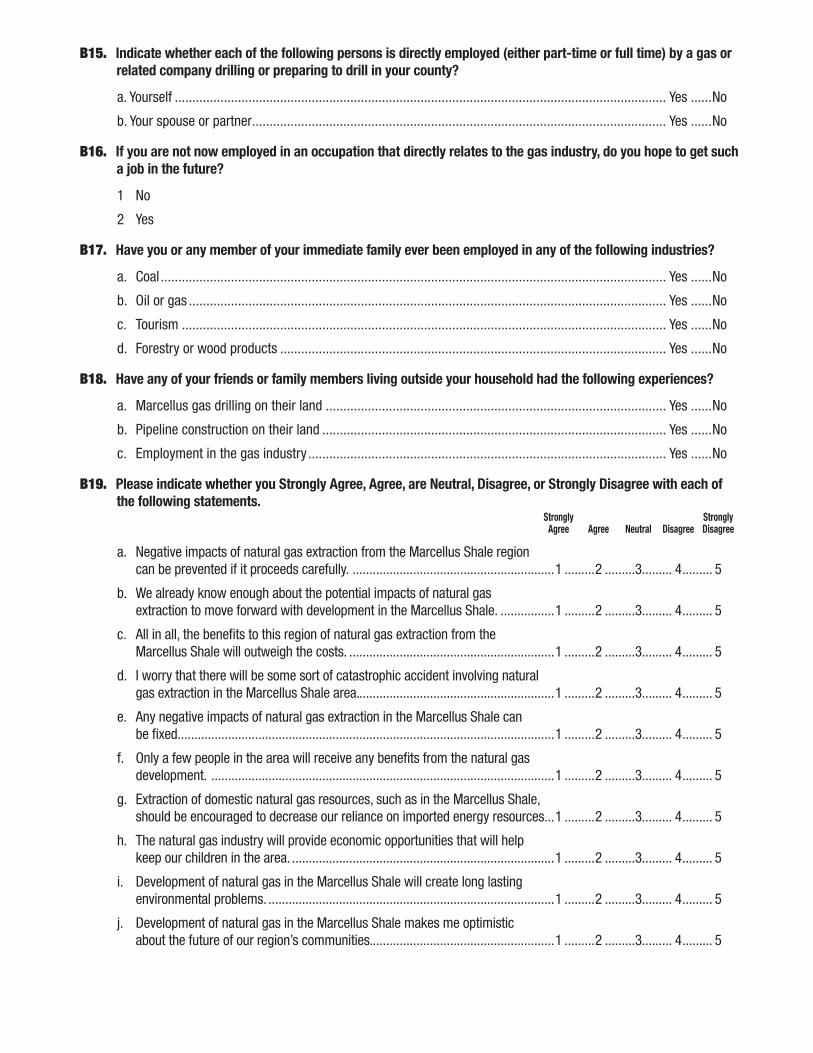
B15. Indicate whether each of the following persons is directly employed (either part-time or full time) by a gas or related company drilling or preparing to drill in your county?
a. Yourself ............................................................................................................................................ Yes ......No
b. Your spouse or partner ...................................................................................................................... Yes ......No
B16. If you are not now employed in an occupation that directly relates to the gas industry, do you hope to get such a job in the future?
1 No
2 Yes
B17. Have you or any member of your immediate family ever been employed in any of the following industries?
a. Coal ................................................................................................................................................ Yes ......No
b. Oil or gas ........................................................................................................................................ Yes ......No
c. Tourism .......................................................................................................................................... Yes ......No
d. Forestry or wood products .............................................................................................................. Yes ......No
B18. Have any of your friends or family members living outside your household had the following experiences?
a. Marcellus gas drilling on their land ................................................................................................. Yes ......No
b. Pipeline construction on their land .................................................................................................. Yes ......No
c. Employment in the gas industry ...................................................................................................... Yes ......No
B19. Please indicate whether you Strongly Agree, Agree, are Neutral, Disagree, or Strongly Disagree with each of the following statements.
Strongly Strongly Agree Agree Neutral Disagree Disagree
a. Negative impacts of natural gas extraction from the Marcellus Shale region can be prevented if it proceeds carefully. ............................................................1 .........2 .........3......... 4 ......... 5
b. We already know enough about the potential impacts of natural gas extraction to move forward with development in the Marcellus Shale. ................1 .........2 .........3......... 4 ......... 5
c. All in all, the benefits to this region of natural gas extraction from the Marcellus Shale will outweigh the costs. .............................................................1 .........2 .........3......... 4 ......... 5
d. I worry that there will be some sort of catastrophic accident involving natural gas extraction in the Marcellus Shale area...........................................................1 .........2 .........3......... 4 ......... 5
e. Any negative impacts of natural gas extraction in the Marcellus Shale can be fixed. ...............................................................................................................1 .........2 .........3......... 4 ......... 5
f. Only a few people in the area will receive any benefits from the natural gas development. ......................................................................................................1 .........2 .........3......... 4 ......... 5
g. Extraction of domestic natural gas resources, such as in the Marcellus Shale, should be encouraged to decrease our reliance on imported energy resources. ..1 .........2 .........3......... 4 ......... 5
h. The natural gas industry will provide economic opportunities that will help keep our children in the area. ..............................................................................1 .........2 .........3......... 4 ......... 5
i. Development of natural gas in the Marcellus Shale will create long lasting environmental problems. .....................................................................................1 .........2 .........3......... 4 ......... 5
j. Development of natural gas in the Marcellus Shale makes me optimistic about the future of our region’s communities. ......................................................1 .........2 .........3......... 4 ......... 5
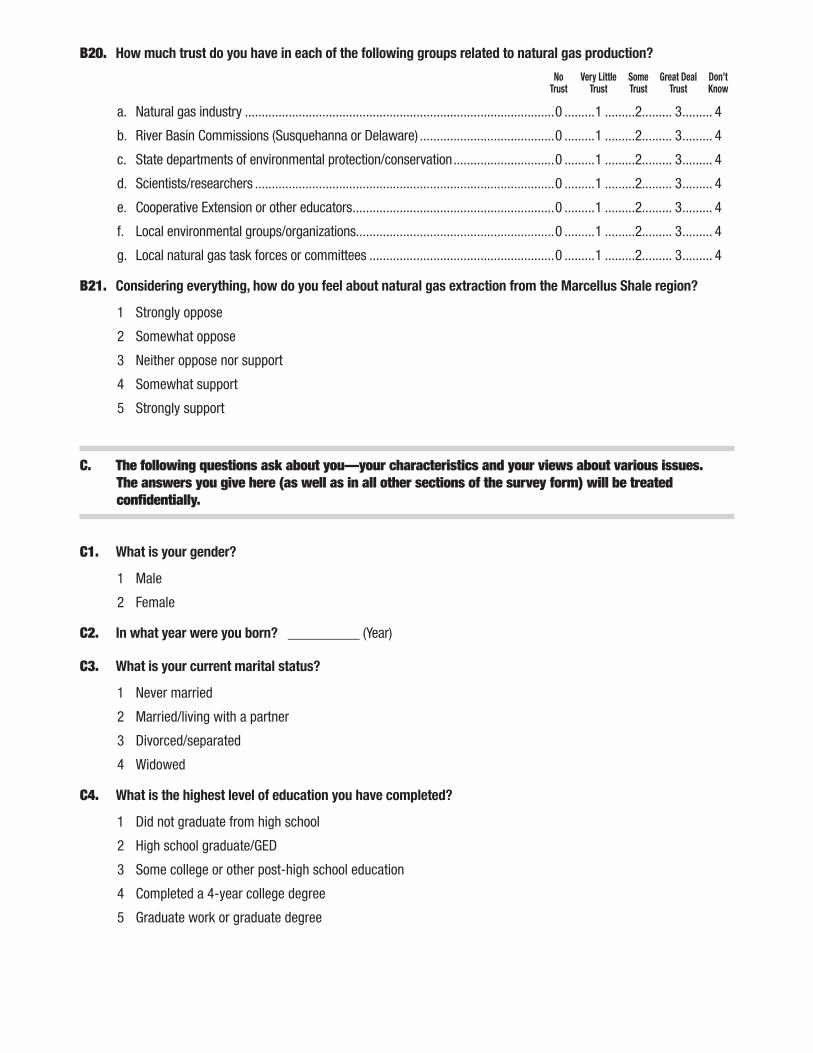
B20. How much trust do you have in each of the following groups related to natural gas production?
No Very Little Some Great Deal Don’t Trust Trust Trust Trust Know
a. Natural gas industry ............................................................................................0 .........1 .........2......... 3 ......... 4
b. River Basin Commissions (Susquehanna or Delaware) ........................................0 .........1 .........2......... 3 ......... 4
c. State departments of environmental protection/conservation ..............................0 .........1 .........2......... 3 ......... 4
d. Scientists/researchers .........................................................................................0 .........1 .........2......... 3 ......... 4
e. Cooperative Extension or other educators ............................................................0 .........1 .........2......... 3 ......... 4
f. Local environmental groups/organizations...........................................................0 .........1 .........2......... 3 ......... 4
g. Local natural gas task forces or committees .......................................................0 .........1 .........2......... 3 ......... 4
B21. Considering everything, how do you feel about natural gas extraction from the Marcellus Shale region?
1 Strongly oppose
2 Somewhat oppose
3 Neither oppose nor support
4 Somewhat support
5 Strongly support
C. The following questions ask about you—your characteristics and your views about various issues. The answers you give here (as well as in all other sections of the survey form) will be treated confidentially.
C1. What is your gender?
1 Male
2 Female
C2. In what year were you born? __________ (Year)
C3. What is your current marital status?
1 Never married
2 Married/living with a partner
3 Divorced/separated
4 Widowed
C4. What is the highest level of education you have completed?
1 Did not graduate from high school
2 High school graduate/GED
3 Some college or other post-high school education
4 Completed a 4-year college degree
5 Graduate work or graduate degree

C5. Counting yourself, how many people live in your household? _________ (number)
C6. How many persons under 18 years of age live in your household? ______ (number; if none, write “none”)
C7. In what county and state do you live?
_________________ (County) _________________ (State)
C8. How long have you lived in this county?
1 all my life
2 not all my life, but 20 years or more
3 10-19 years
4 6-9 years
5 2–5 years
6 1 year or less
C9. How would you describe the area in which you live?
1 A city
2 A small town
3 A suburban area
4 In the country, but not on a farm
5 On a farm
C10. In the past two years, how often have you done each of the following? Two or Four or Three More Never Once Times Times
a. Participated in one or more community clubs or organizations. ................................. 0 ......... 1 ........ 2 ........ 3
b. Attended a public meeting where there was discussion of school or town affairs. ..... 0 ......... 1 ........ 2 ........ 3
c. Served on a local board, council, government commission, committee or as an officer of a community organization. .......................................................................... 0 ......... 1 ........ 2 ........ 3
d. Contacted a government agency or official or the media (radio, television, newspaper) about a local issue. ................................................................................. 0 ......... 1 ........ 2 ........ 3
e. Worked or gave time or money for special projects at a church or religious organization. .............................................................................................................. 0 ......... 1 ........ 2 ........ 3
f. Given time or money for special projects or activities to organizations in the community, other than religious organizations. ........................................................... 0 ......... 1 ........ 2 ........ 3
g. Met informally or worked with others in your community or neighborhood to address some community issue or problem. .............................................................. 0 ......... 1 ........ 2 ........ 3
C11. Which of the following best describes YOUR current work situation? (Circle ONE answer.)
1 Self employed
2 Employed full-time
3 Employed part-time
4 Not employed, but looking for work
5 Not employed, not looking for work
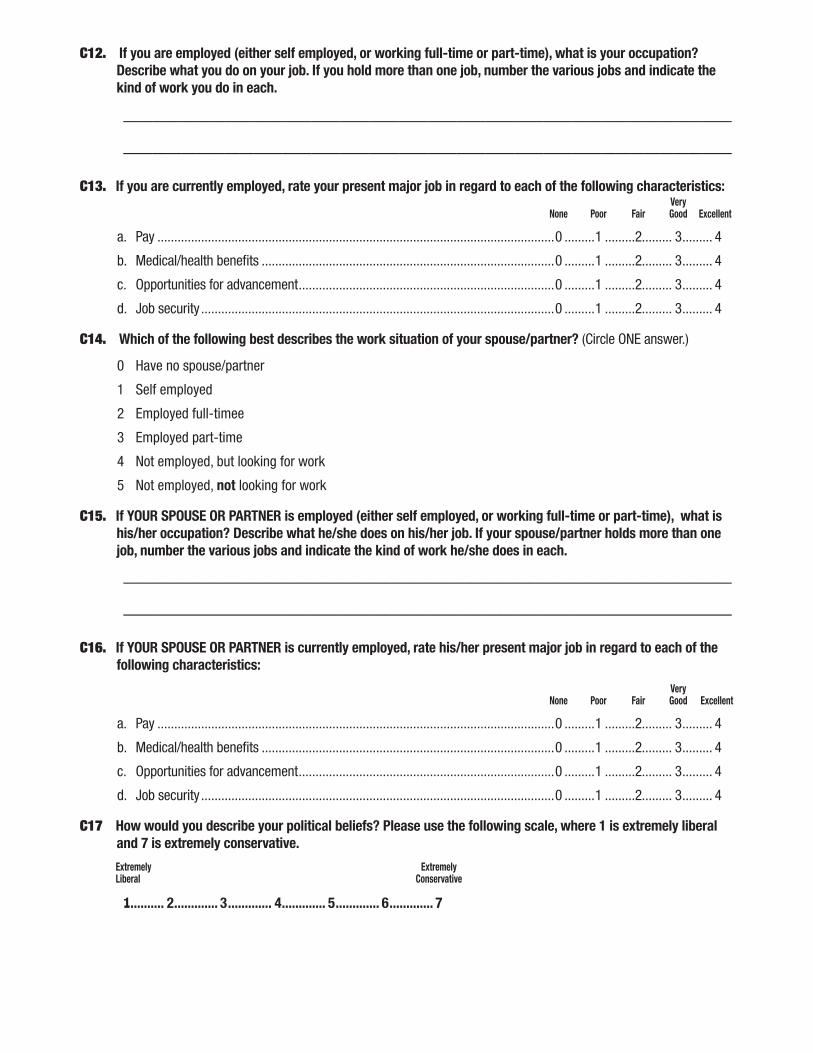
C12. If you are employed (either self employed, or working full-time or part-time), what is your occupation? Describe what you do on your job. If you hold more than one job, number the various jobs and indicate the kind of work you do in each.
——————————————————————————————————————————
——————————————————————————————————————————
C13. If you are currently employed, rate your present major job in regard to each of the following characteristics: Very None Poor Fair Good Excellent
a. Pay ......................................................................................................................0 .........1 .........2......... 3 ......... 4
b. Medical/health benefits .......................................................................................0 .........1 .........2......... 3 ......... 4
c. Opportunities for advancement ............................................................................0 .........1 .........2......... 3 ......... 4
d. Job security .........................................................................................................0 .........1 .........2......... 3 ......... 4
C14. Which of the following best describes the work situation of your spouse/partner? (Circle ONE answer.)
0 Have no spouse/partner
1 Self employed
2 Employed full-timee
3 Employed part-time
4 Not employed, but looking for work
5 Not employed, not looking for work
C15. If YOUR SPOUSE OR PARTNER is employed (either self employed, or working full-time or part-time), what is his/her occupation? Describe what he/she does on his/her job. If your spouse/partner holds more than one job, number the various jobs and indicate the kind of work he/she does in each.
——————————————————————————————————————————
——————————————————————————————————————————
C16. If YOUR SPOUSE OR PARTNER is currently employed, rate his/her present major job in regard to each of the following characteristics:
Very None Poor Fair Good Excellent
a. Pay ......................................................................................................................0 .........1 .........2......... 3 ......... 4
b. Medical/health benefits .......................................................................................0 .........1 .........2......... 3 ......... 4
c. Opportunities for advancement ............................................................................0 .........1 .........2......... 3 ......... 4
d. Job security .........................................................................................................0 .........1 .........2......... 3 ......... 4
C17 How would you describe your political beliefs? Please use the following scale, where 1 is extremely liberal and 7 is extremely conservative.
Extremely Extremely Liberal Conservative
1 ............ 2 ............. 3 ............. 4 ............. 5 ............. 6 ............. 7
C18. How satisfied are you with your family’s financial situation?
1 Very satisfied
2 More or less satisfied
3 Not at all satisfied
C19. Would you say that you and your family are better off, worse off, or about the same financially as you were a year ago?
1 Better off
2 Worse off
3 About the same
C20. Looking ahead, do you think that a year from now, your family will be better off financially than you are now, worse off, or about the same as you are now?
1 Better off
2 Worse off
3 About the same
C21. Taking all things together, how satisfied are you with your life as a whole? Rate your satisfaction on a scale from 0 to 6 where 0 means completely dissatisfied and 6 means completely satisfied.
Completely Completely Dissatisfied Satisfied
0 .........1 ..........2 ..........3 .......... 4 .......... 5 ...........6
C22. What was the total income of your household (before taxes) last year?
1 Less than $15,000
2 $15,000 to $24,999
3 $25,000 to $34,999
4 $35,000 to $49,999
5 $50,000 to $74,999
6 $75,000 to $99,999
7 $100,000 or more
Thank you for taking the time to make your views known. If you have any additional comments, please write them below or on the back of this page.
This study is being carried out through the collaborative efforts of:
The Pennsylvania State University University Park, PA
Institute for Public Policy and Economic Development Scranton/Wilkes Barre, PA
Cornell University Ithaca, NY
The project is funded by the Appalachian Regional Commission, The Pennsylvania State University, Cornell University, and the Institute for Public Policy and Economic Development.
Please return the completed questionnaire to:
Community Satisfaction and ChangeThe Pennsylvania State University106 Armsby BuildingUniversity Park, PA 16802
The Pennsylvania State University is committed to the policy that all persons shall have equal access to programs, facilities, admission, and employment without regard to personal characteristics not related to ability, performance, or qualifications as determined by University policy or by state or federal authorities. It is the policy of the University to maintain an academic and work environment free of discrimination, including harassment. The Pennsylvania State University prohibits discrimination and harassment against any person because of age, ancestry, color, disability or handicap, national origin, race, religious creed, sex, sexual orientation, gender identity, or veteran status. Discrimination or harassment against faculty, staff, or students will not be tolerated at The Pennsylvania State University. Direct all inquiries regarding the nondiscrimination policy to the Affirmative Action Director, The Pennsylvania State University, 328 Boucke Building, University Park, PA 16802-5901; Tel 814-865-4700/V, 814-863-1150/TTY.© The Pennsylvania State University 2009 10/09mpc

Survey Frequency Tables APPENDIX B
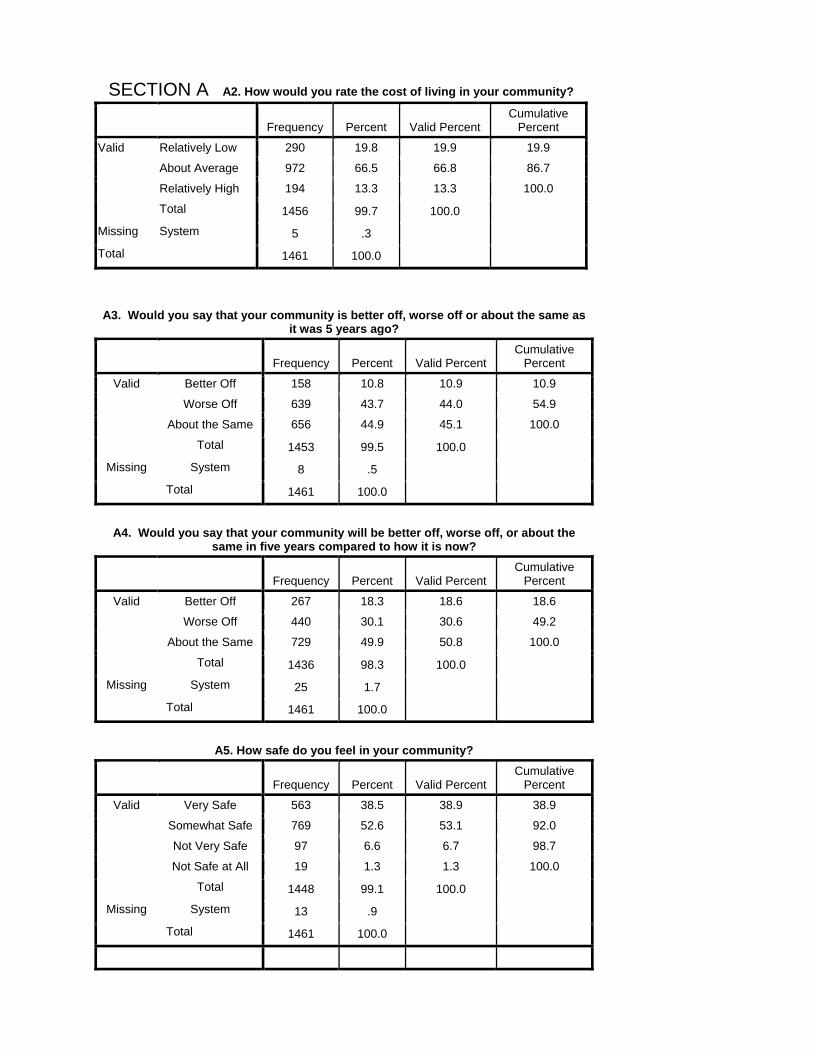
SECTION A A2. How would you rate the cost of living in your community?
Frequency Percent Valid Percent
Cumulative Percent
Valid Relatively Low 290 19.8 19.9 19.9
About Average 972 66.5 66.8 86.7
Relatively High 194 13.3 13.3 100.0
Total 1456 99.7 100.0 Missing System 5 .3 Total 1461 100.0
A3. Would you say that your community is better off, worse off or about the same as
it was 5 years ago?
Frequency Percent Valid Percent
Cumulative Percent
Valid Better Off 158 10.8 10.9 10.9
Worse Off 639 43.7 44.0 54.9
About the Same 656 44.9 45.1 100.0
Total 1453 99.5 100.0 Missing System 8 .5
Total 1461 100.0
A4. Would you say that your community will be better off, worse off, or about the same in five years compared to how it is now?
Frequency Percent Valid Percent
Cumulative Percent
Valid Better Off 267 18.3 18.6 18.6
Worse Off 440 30.1 30.6 49.2
About the Same 729 49.9 50.8 100.0
Total 1436 98.3 100.0 Missing System 25 1.7
Total 1461 100.0
A5. How safe do you feel in your community?
Frequency Percent Valid Percent
Cumulative Percent
Valid Very Safe 563 38.5 38.9 38.9
Somewhat Safe 769 52.6 53.1 92.0
Not Very Safe 97 6.6 6.7 98.7
Not Safe at All 19 1.3 1.3 100.0
Total 1448 99.1 100.0 Missing System 13 .9
Total 1461 100.0
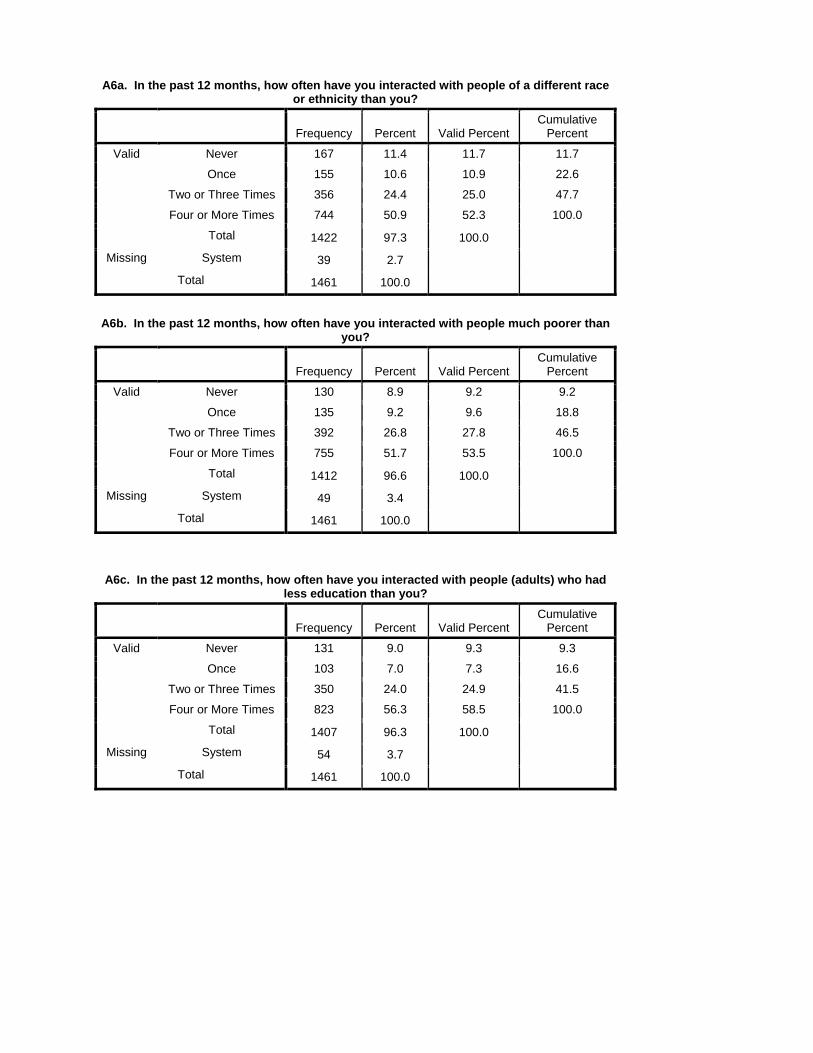
A6a. In the past 12 months, how often have you interacted with people of a different race or ethnicity than you?
Frequency Percent Valid Percent
Cumulative Percent
Valid Never 167 11.4 11.7 11.7
Once 155 10.6 10.9 22.6
Two or Three Times 356 24.4 25.0 47.7
Four or More Times 744 50.9 52.3 100.0
Total 1422 97.3 100.0 Missing System 39 2.7
Total 1461 100.0
A6b. In the past 12 months, how often have you interacted with people much poorer than you?
Frequency Percent Valid Percent
Cumulative Percent
Valid Never 130 8.9 9.2 9.2
Once 135 9.2 9.6 18.8
Two or Three Times 392 26.8 27.8 46.5
Four or More Times 755 51.7 53.5 100.0
Total 1412 96.6 100.0 Missing System 49 3.4
Total 1461 100.0
A6c. In the past 12 months, how often have you interacted with people (adults) who had less education than you?
Frequency Percent Valid Percent
Cumulative Percent
Valid Never 131 9.0 9.3 9.3
Once 103 7.0 7.3 16.6
Two or Three Times 350 24.0 24.9 41.5
Four or More Times 823 56.3 58.5 100.0
Total 1407 96.3 100.0 Missing System 54 3.7
Total 1461 100.0
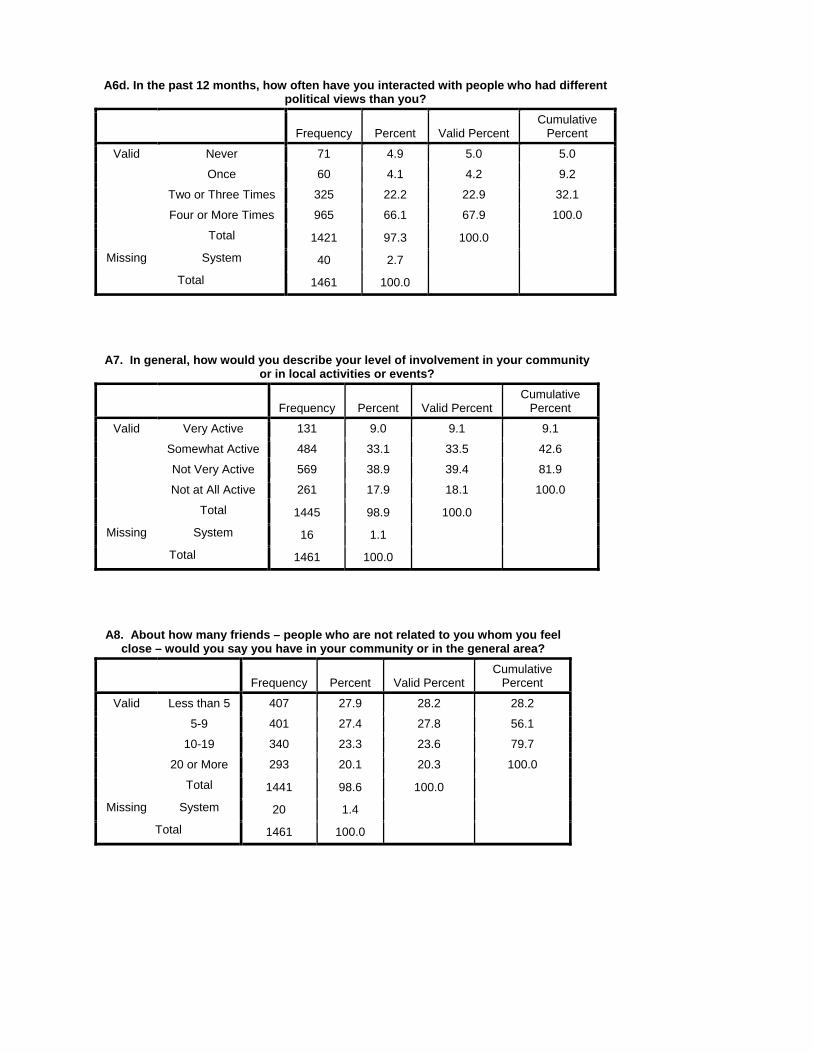
A6d. In the past 12 months, how often have you interacted with people who had different political views than you?
Frequency Percent Valid Percent
Cumulative Percent
Valid Never 71 4.9 5.0 5.0
Once 60 4.1 4.2 9.2
Two or Three Times 325 22.2 22.9 32.1
Four or More Times 965 66.1 67.9 100.0
Total 1421 97.3 100.0 Missing System 40 2.7
Total 1461 100.0
A7. In general, how would you describe your level of involvement in your community or in local activities or events?
Frequency Percent Valid Percent
Cumulative Percent
Valid Very Active 131 9.0 9.1 9.1
Somewhat Active 484 33.1 33.5 42.6
Not Very Active 569 38.9 39.4 81.9
Not at All Active 261 17.9 18.1 100.0
Total 1445 98.9 100.0 Missing System 16 1.1
Total 1461 100.0
A8. About how many friends – people who are not related to you whom you feel close – would you say you have in your community or in the general area?
Frequency Percent Valid Percent
Cumulative Percent
Valid Less than 5 407 27.9 28.2 28.2
5-9 401 27.4 27.8 56.1
10-19 340 23.3 23.6 79.7
20 or More 293 20.1 20.3 100.0
Total 1441 98.6 100.0 Missing System 20 1.4
Total 1461 100.0
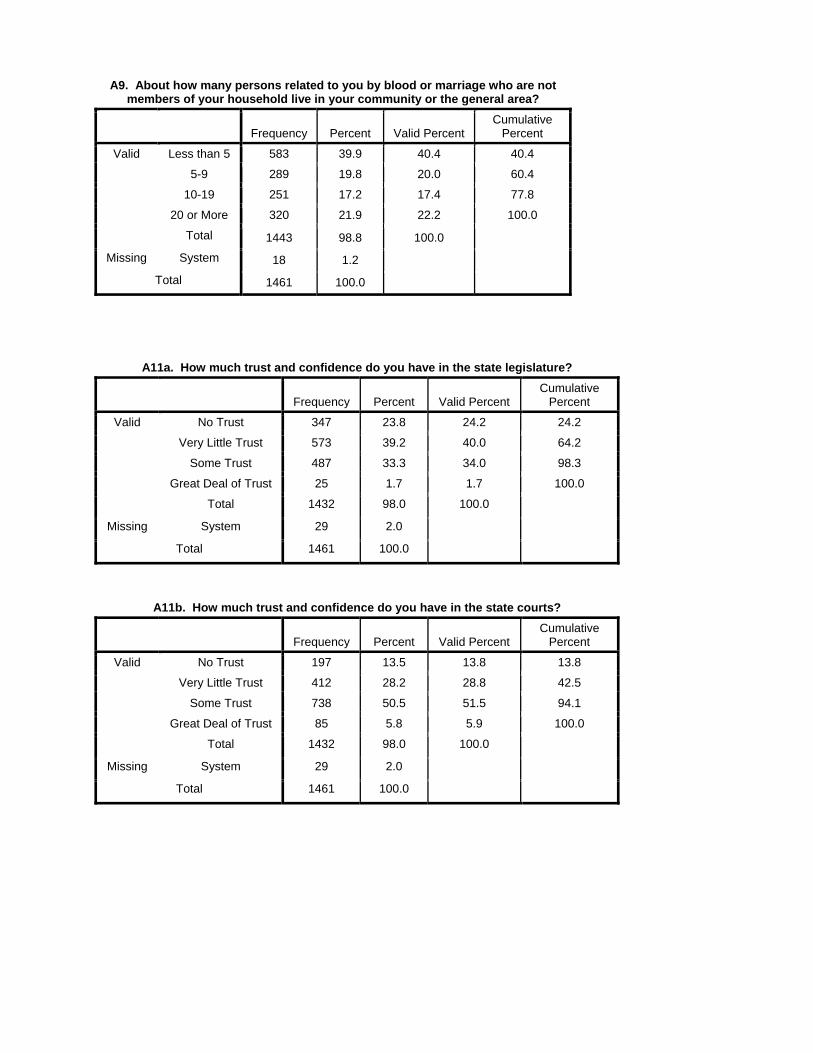
A9. About how many persons related to you by blood or marriage who are not members of your household live in your community or the general area?
Frequency Percent Valid Percent
Cumulative Percent
Valid Less than 5 583 39.9 40.4 40.4
5-9 289 19.8 20.0 60.4
10-19 251 17.2 17.4 77.8
20 or More 320 21.9 22.2 100.0
Total 1443 98.8 100.0 Missing System 18 1.2
Total 1461 100.0
A11a. How much trust and confidence do you have in the state legislature?
Frequency Percent Valid Percent
Cumulative Percent
Valid No Trust 347 23.8 24.2 24.2
Very Little Trust 573 39.2 40.0 64.2
Some Trust 487 33.3 34.0 98.3
Great Deal of Trust 25 1.7 1.7 100.0
Total 1432 98.0 100.0 Missing System 29 2.0
Total 1461 100.0
A11b. How much trust and confidence do you have in the state courts?
Frequency Percent Valid Percent
Cumulative Percent
Valid No Trust 197 13.5 13.8 13.8
Very Little Trust 412 28.2 28.8 42.5
Some Trust 738 50.5 51.5 94.1
Great Deal of Trust 85 5.8 5.9 100.0
Total 1432 98.0 100.0 Missing System 29 2.0
Total 1461 100.0

A11c. How much trust and confidence do you have in the governor of the state?
Frequency Percent Valid Percent
Cumulative Percent
Valid No Trust 495 33.9 34.6 34.6
Very Little Trust 413 28.3 28.9 63.5
Some Trust 454 31.1 31.7 95.2
Great Deal of Trust 68 4.7 4.8 100.0
Total 1430 97.9 100.0 Missing System 31 2.1
Total 1461 100.0
A11d. How much trust and confidence do you have in local government?
Frequency Percent Valid Percent
Cumulative Percent
Valid No Trust 203 13.9 14.3 14.3
Very Little Trust 430 29.4 30.2 44.5
Some Trust 682 46.7 48.0 92.5
Great Deal of Trust 107 7.3 7.5 100.0
Total 1422 97.3 100.0 Missing System 39 2.7
Total 1461 100.0
A11e How much trust and confidence do you have in the mass media?
Frequency Percent Valid Percent
Cumulative Percent
Valid No Trust 280 19.2 19.6 19.6
Very Little Trust 432 29.6 30.2 49.8
Some Trust 635 43.5 44.4 94.1
Great Deal of Trust 84 5.7 5.9 100.0
Total 1431 97.9 100.0 Missing System 30 2.1
Total 1461 100.0
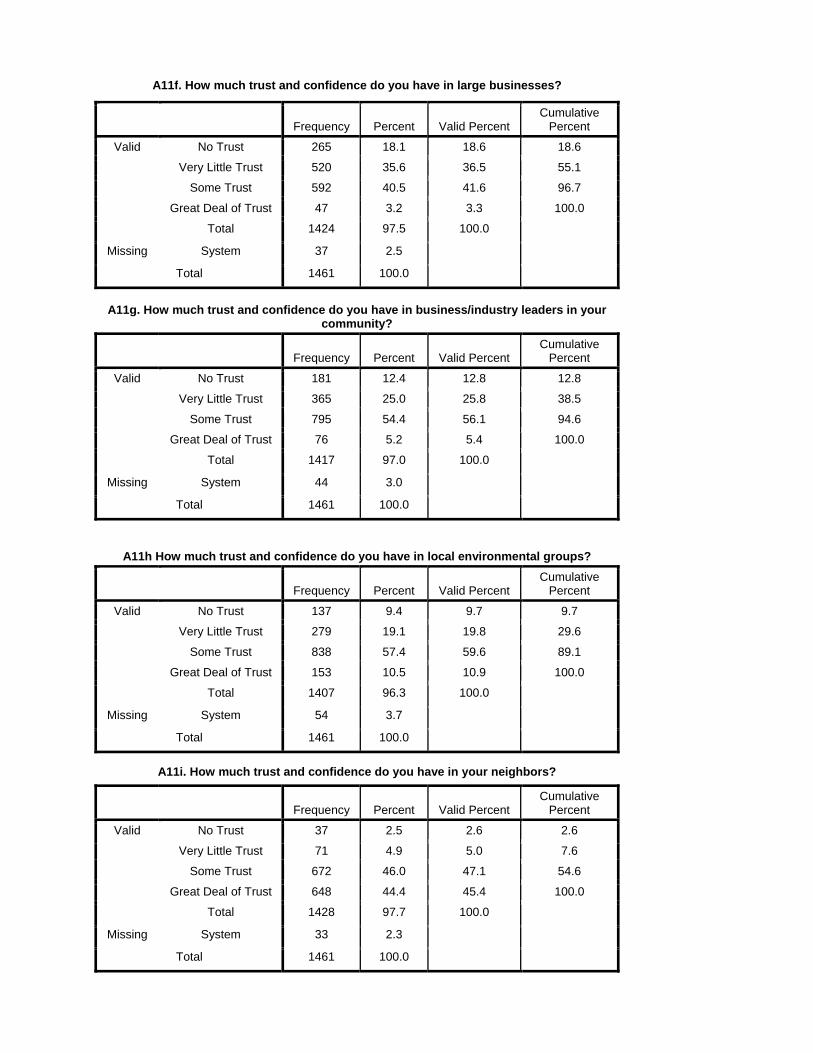
A11f. How much trust and confidence do you have in large businesses?
Frequency Percent Valid Percent
Cumulative Percent
Valid No Trust 265 18.1 18.6 18.6
Very Little Trust 520 35.6 36.5 55.1
Some Trust 592 40.5 41.6 96.7
Great Deal of Trust 47 3.2 3.3 100.0
Total 1424 97.5 100.0 Missing System 37 2.5
Total 1461 100.0
A11g. How much trust and confidence do you have in business/industry leaders in your community?
Frequency Percent Valid Percent
Cumulative Percent
Valid No Trust 181 12.4 12.8 12.8
Very Little Trust 365 25.0 25.8 38.5
Some Trust 795 54.4 56.1 94.6
Great Deal of Trust 76 5.2 5.4 100.0
Total 1417 97.0 100.0 Missing System 44 3.0
Total 1461 100.0
A11h How much trust and confidence do you have in local environmental groups?
Frequency Percent Valid Percent
Cumulative Percent
Valid No Trust 137 9.4 9.7 9.7
Very Little Trust 279 19.1 19.8 29.6
Some Trust 838 57.4 59.6 89.1
Great Deal of Trust 153 10.5 10.9 100.0
Total 1407 96.3 100.0 Missing System 54 3.7
Total 1461 100.0
A11i. How much trust and confidence do you have in your neighbors?
Frequency Percent Valid Percent
Cumulative Percent
Valid No Trust 37 2.5 2.6 2.6
Very Little Trust 71 4.9 5.0 7.6
Some Trust 672 46.0 47.1 54.6
Great Deal of Trust 648 44.4 45.4 100.0
Total 1428 97.7 100.0 Missing System 33 2.3
Total 1461 100.0

A11j. How much trust and confidence do you have in the people you work with?
Frequency Percent Valid Percent
Cumulative Percent
Valid No Trust 49 3.4 3.8 3.8
Very Little Trust 98 6.7 7.5 11.3
Some Trust 651 44.6 50.0 61.3
Great Deal of Trust 504 34.5 38.7 100.0
Total 1302 89.1 100.0 Missing System 159 10.9
Total 1461 100.0
A11k. How much trust and confidence do you have in people from other cultural or ethnic groups?
Frequency Percent Valid Percent
Cumulative Percent
Valid No Trust 68 4.7 4.8 4.8
Very Little Trust 180 12.3 12.8 17.7
Some Trust 977 66.9 69.5 87.2
Great Deal of Trust 180 12.3 12.8 100.0
Total 1405 96.2 100.0 Missing System 56 3.8
Total 1461 100.0
A11l How much trust and confidence do you have in people of other religious beliefs?
Frequency Percent Valid Percent
Cumulative Percent
Valid No Trust 39 2.7 2.8 2.8
Very Little Trust 113 7.7 8.0 10.8
Some Trust 981 67.1 69.8 80.6
Great Deal of Trust 272 18.6 19.4 100.0
Total 1405 96.2 100.0 Missing System 56 3.8
Total 1461 100.0
A11m. How much trust and confidence do you have in people who are new in the community?
Frequency Percent Valid Percent
Cumulative Percent
Valid No Trust 55 3.8 3.9 3.9
Very Little Trust 268 18.3 19.1 23.0
Some Trust 1005 68.8 71.6 94.7
Great Deal of Trust 75 5.1 5.3 100.0
Total 1403 96.0 100.0 Missing System 58 4.0
Total 1461 100.0
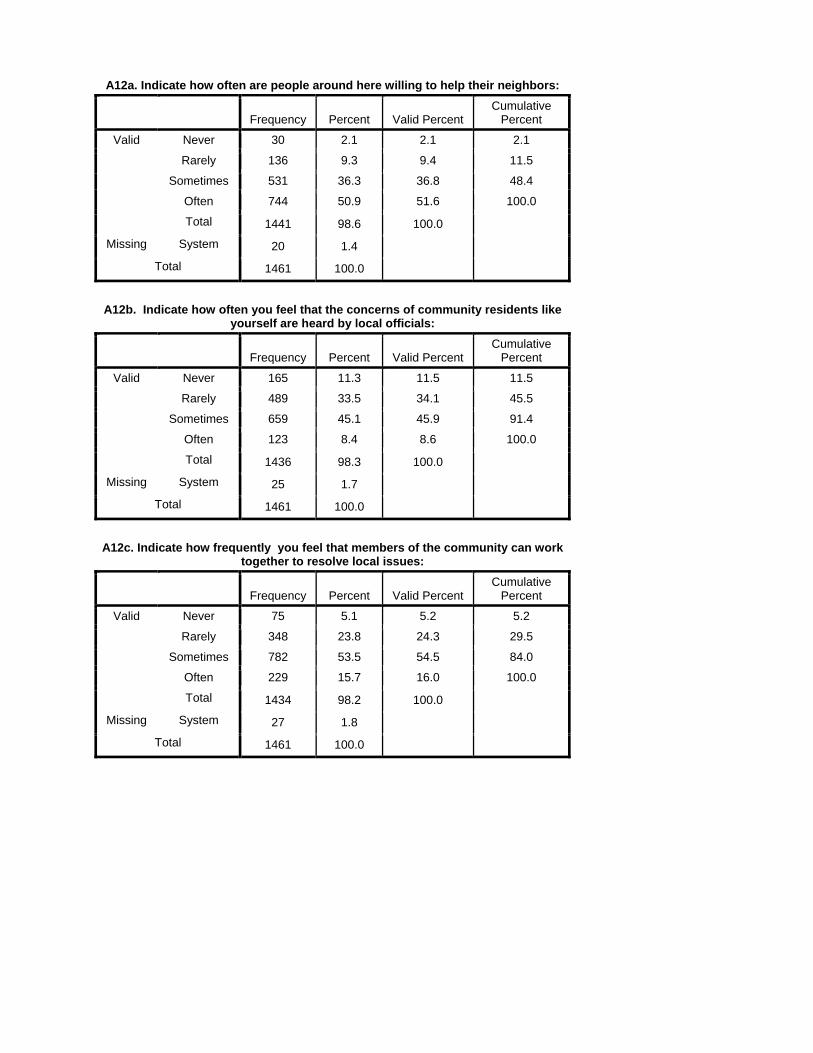
A12a. Indicate how often are people around here willing to help their neighbors:
Frequency Percent Valid Percent
Cumulative Percent
Valid Never 30 2.1 2.1 2.1
Rarely 136 9.3 9.4 11.5
Sometimes 531 36.3 36.8 48.4
Often 744 50.9 51.6 100.0
Total 1441 98.6 100.0 Missing System 20 1.4
Total 1461 100.0
A12b. Indicate how often you feel that the concerns of community residents like yourself are heard by local officials:
Frequency Percent Valid Percent
Cumulative Percent
Valid Never 165 11.3 11.5 11.5
Rarely 489 33.5 34.1 45.5
Sometimes 659 45.1 45.9 91.4
Often 123 8.4 8.6 100.0
Total 1436 98.3 100.0 Missing System 25 1.7
Total 1461 100.0
A12c. Indicate how frequently you feel that members of the community can work together to resolve local issues:
Frequency Percent Valid Percent
Cumulative Percent
Valid Never 75 5.1 5.2 5.2
Rarely 348 23.8 24.3 29.5
Sometimes 782 53.5 54.5 84.0
Often 229 15.7 16.0 100.0
Total 1434 98.2 100.0 Missing System 27 1.8
Total 1461 100.0
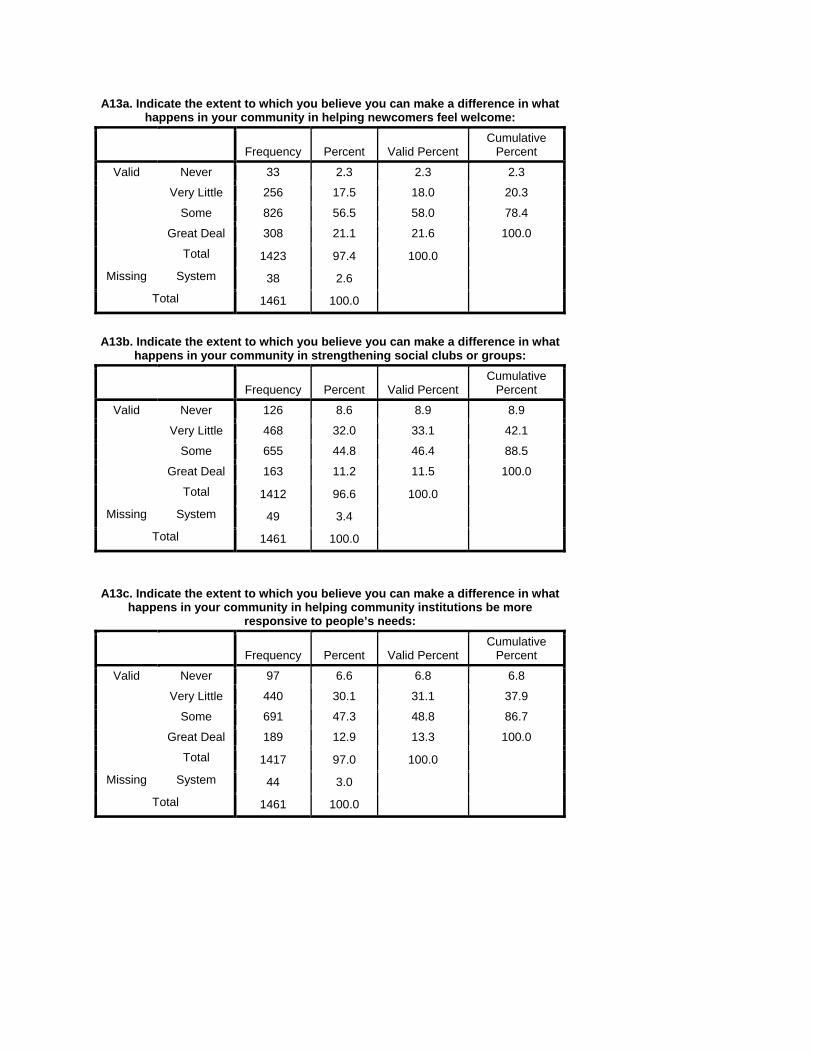
A13a. Indicate the extent to which you believe you can make a difference in what
happens in your community in helping newcomers feel welcome:
Frequency Percent Valid Percent
Cumulative Percent
Valid Never 33 2.3 2.3 2.3
Very Little 256 17.5 18.0 20.3
Some 826 56.5 58.0 78.4
Great Deal 308 21.1 21.6 100.0
Total 1423 97.4 100.0 Missing System 38 2.6
Total 1461 100.0
A13b. Indicate the extent to which you believe you can make a difference in what happens in your community in strengthening social clubs or groups:
Frequency Percent Valid Percent
Cumulative Percent
Valid Never 126 8.6 8.9 8.9
Very Little 468 32.0 33.1 42.1
Some 655 44.8 46.4 88.5
Great Deal 163 11.2 11.5 100.0
Total 1412 96.6 100.0 Missing System 49 3.4
Total 1461 100.0
A13c. Indicate the extent to which you believe you can make a difference in what happens in your community in helping community institutions be more
responsive to people’s needs:
Frequency Percent Valid Percent
Cumulative Percent
Valid Never 97 6.6 6.8 6.8
Very Little 440 30.1 31.1 37.9
Some 691 47.3 48.8 86.7
Great Deal 189 12.9 13.3 100.0
Total 1417 97.0 100.0 Missing System 44 3.0
Total 1461 100.0
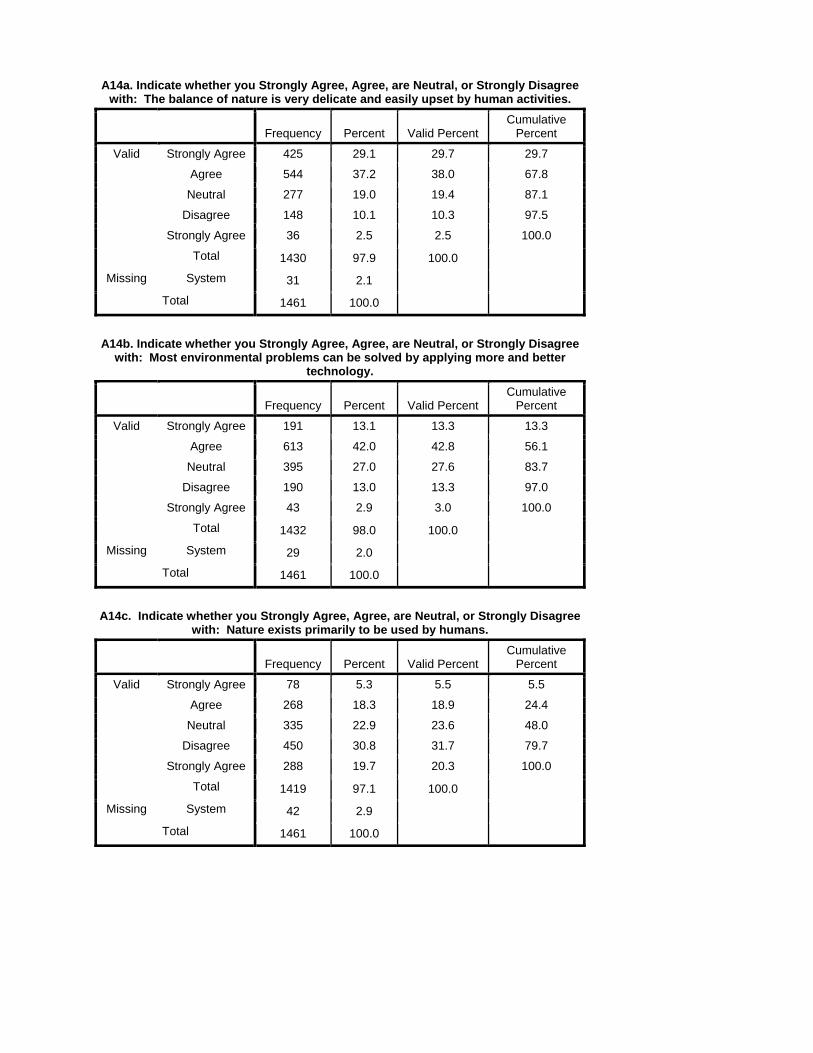
A14a. Indicate whether you Strongly Agree, Agree, are Neutral, or Strongly Disagree with: The balance of nature is very delicate and easily upset by human activities.
Frequency Percent Valid Percent
Cumulative Percent
Valid Strongly Agree 425 29.1 29.7 29.7
Agree 544 37.2 38.0 67.8
Neutral 277 19.0 19.4 87.1
Disagree 148 10.1 10.3 97.5
Strongly Agree 36 2.5 2.5 100.0
Total 1430 97.9 100.0 Missing System 31 2.1
Total 1461 100.0
A14b. Indicate whether you Strongly Agree, Agree, are Neutral, or Strongly Disagree with: Most environmental problems can be solved by applying more and better
technology.
Frequency Percent Valid Percent
Cumulative Percent
Valid Strongly Agree 191 13.1 13.3 13.3
Agree 613 42.0 42.8 56.1
Neutral 395 27.0 27.6 83.7
Disagree 190 13.0 13.3 97.0
Strongly Agree 43 2.9 3.0 100.0
Total 1432 98.0 100.0 Missing System 29 2.0
Total 1461 100.0
A14c. Indicate whether you Strongly Agree, Agree, are Neutral, or Strongly Disagree with: Nature exists primarily to be used by humans.
Frequency Percent Valid Percent
Cumulative Percent
Valid Strongly Agree 78 5.3 5.5 5.5
Agree 268 18.3 18.9 24.4
Neutral 335 22.9 23.6 48.0
Disagree 450 30.8 31.7 79.7
Strongly Agree 288 19.7 20.3 100.0
Total 1419 97.1 100.0 Missing System 42 2.9
Total 1461 100.0
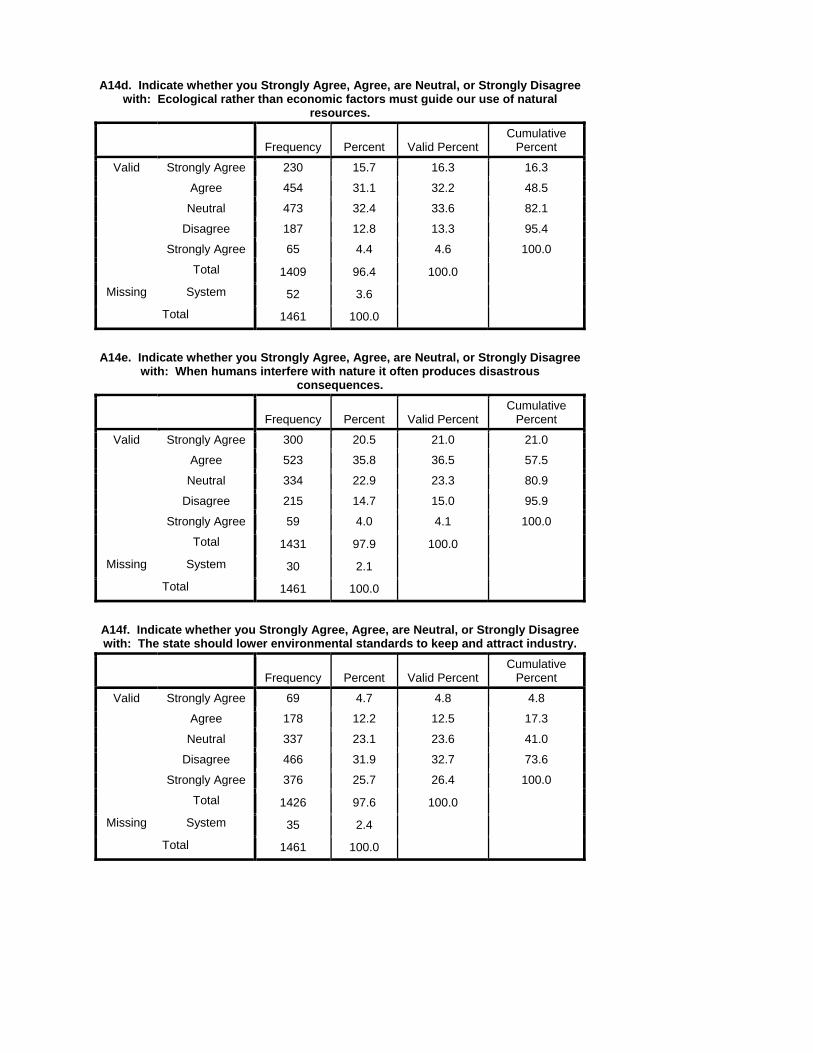
A14d. Indicate whether you Strongly Agree, Agree, are Neutral, or Strongly Disagree with: Ecological rather than economic factors must guide our use of natural
resources.
Frequency Percent Valid Percent
Cumulative Percent
Valid Strongly Agree 230 15.7 16.3 16.3
Agree 454 31.1 32.2 48.5
Neutral 473 32.4 33.6 82.1
Disagree 187 12.8 13.3 95.4
Strongly Agree 65 4.4 4.6 100.0
Total 1409 96.4 100.0 Missing System 52 3.6
Total 1461 100.0
A14e. Indicate whether you Strongly Agree, Agree, are Neutral, or Strongly Disagree with: When humans interfere with nature it often produces disastrous
consequences.
Frequency Percent Valid Percent
Cumulative Percent
Valid Strongly Agree 300 20.5 21.0 21.0
Agree 523 35.8 36.5 57.5
Neutral 334 22.9 23.3 80.9
Disagree 215 14.7 15.0 95.9
Strongly Agree 59 4.0 4.1 100.0
Total 1431 97.9 100.0 Missing System 30 2.1
Total 1461 100.0
A14f. Indicate whether you Strongly Agree, Agree, are Neutral, or Strongly Disagree with: The state should lower environmental standards to keep and attract industry.
Frequency Percent Valid Percent
Cumulative Percent
Valid Strongly Agree 69 4.7 4.8 4.8
Agree 178 12.2 12.5 17.3
Neutral 337 23.1 23.6 41.0
Disagree 466 31.9 32.7 73.6
Strongly Agree 376 25.7 26.4 100.0
Total 1426 97.6 100.0 Missing System 35 2.4
Total 1461 100.0
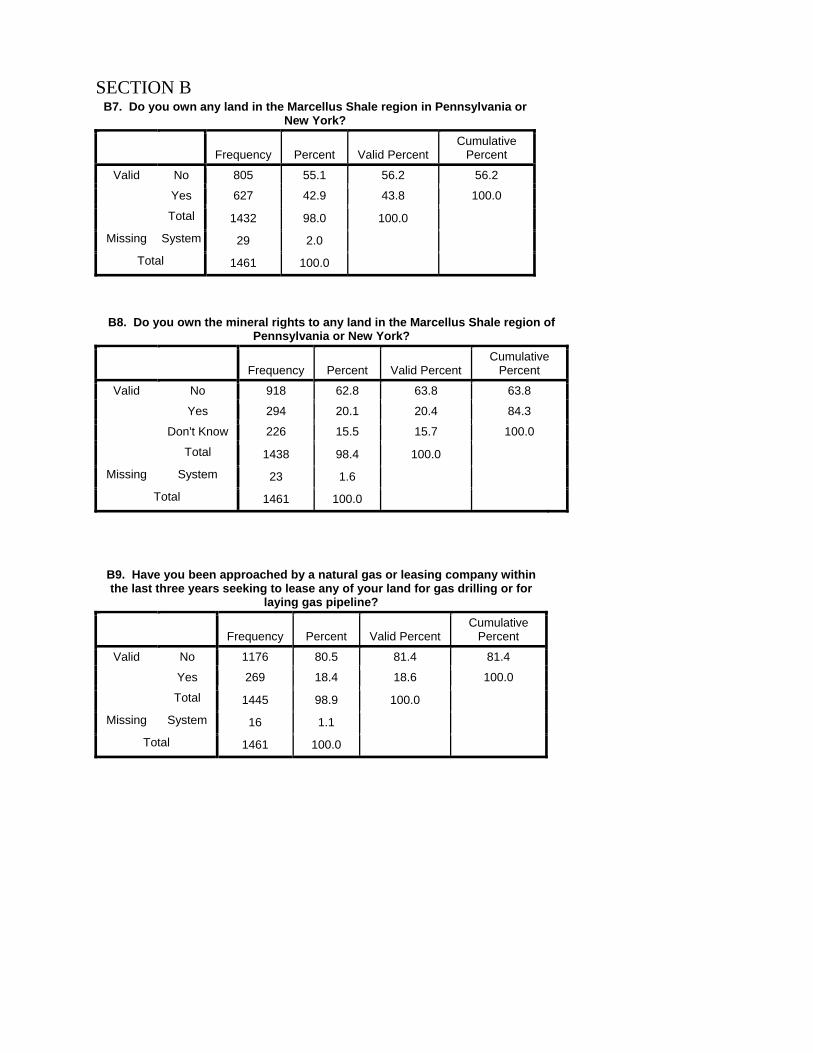
SECTION B B7. Do you own any land in the Marcellus Shale region in Pennsylvania or
New York?
Frequency Percent Valid Percent
Cumulative Percent
Valid No 805 55.1 56.2 56.2
Yes 627 42.9 43.8 100.0
Total 1432 98.0 100.0 Missing System 29 2.0
Total 1461 100.0
B8. Do you own the mineral rights to any land in the Marcellus Shale region of Pennsylvania or New York?
Frequency Percent Valid Percent
Cumulative Percent
Valid No 918 62.8 63.8 63.8
Yes 294 20.1 20.4 84.3
Don't Know 226 15.5 15.7 100.0
Total 1438 98.4 100.0 Missing System 23 1.6
Total 1461 100.0
B9. Have you been approached by a natural gas or leasing company within the last three years seeking to lease any of your land for gas drilling or for
laying gas pipeline?
Frequency Percent Valid Percent
Cumulative Percent
Valid No 1176 80.5 81.4 81.4
Yes 269 18.4 18.6 100.0
Total 1445 98.9 100.0 Missing System 16 1.1
Total 1461 100.0
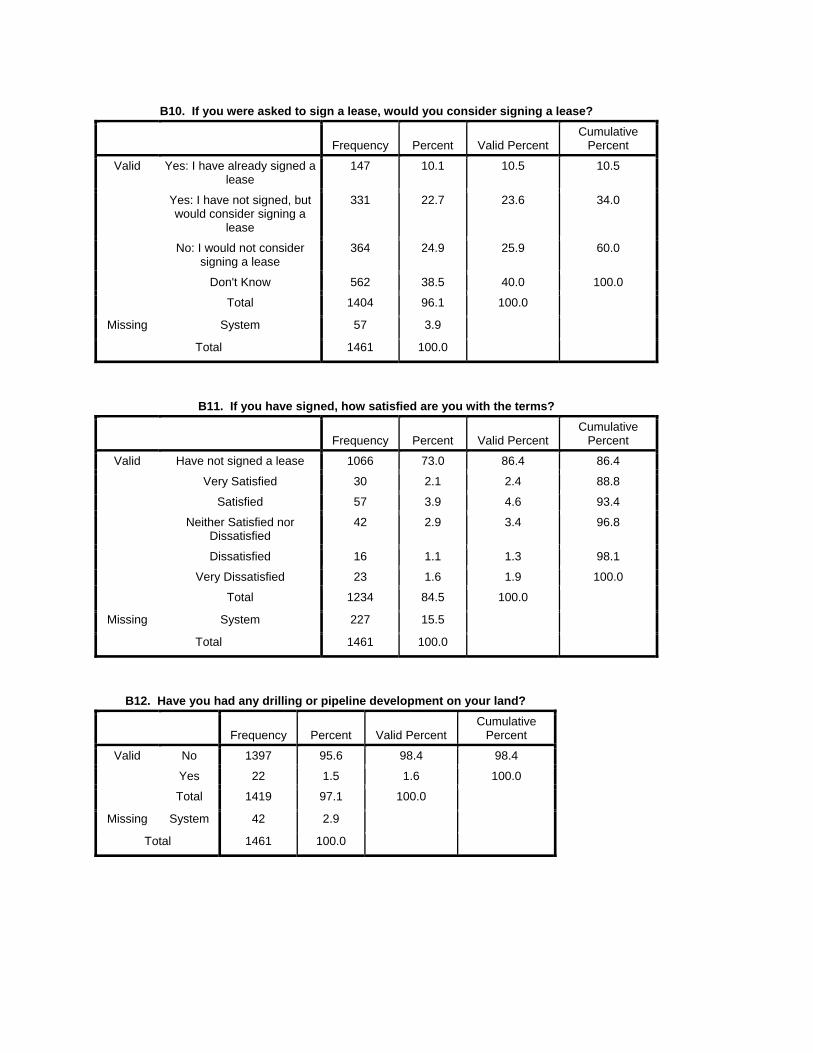
B10. If you were asked to sign a lease, would you consider signing a lease?
Frequency Percent Valid Percent
Cumulative Percent
Valid Yes: I have already signed a lease
147 10.1 10.5 10.5
Yes: I have not signed, but would consider signing a
lease
331 22.7 23.6 34.0
No: I would not consider signing a lease
364 24.9 25.9 60.0
Don't Know 562 38.5 40.0 100.0
Total 1404 96.1 100.0 Missing System 57 3.9
Total 1461 100.0
B11. If you have signed, how satisfied are you with the terms?
Frequency Percent Valid Percent
Cumulative Percent
Valid Have not signed a lease 1066 73.0 86.4 86.4
Very Satisfied 30 2.1 2.4 88.8
Satisfied 57 3.9 4.6 93.4
Neither Satisfied nor Dissatisfied
42 2.9 3.4 96.8
Dissatisfied 16 1.1 1.3 98.1
Very Dissatisfied 23 1.6 1.9 100.0
Total 1234 84.5 100.0 Missing System 227 15.5
Total 1461 100.0
B12. Have you had any drilling or pipeline development on your land?
Frequency Percent Valid Percent
Cumulative Percent
Valid No 1397 95.6 98.4 98.4
Yes 22 1.5 1.6 100.0
Total 1419 97.1 100.0 Missing System 42 2.9
Total 1461 100.0
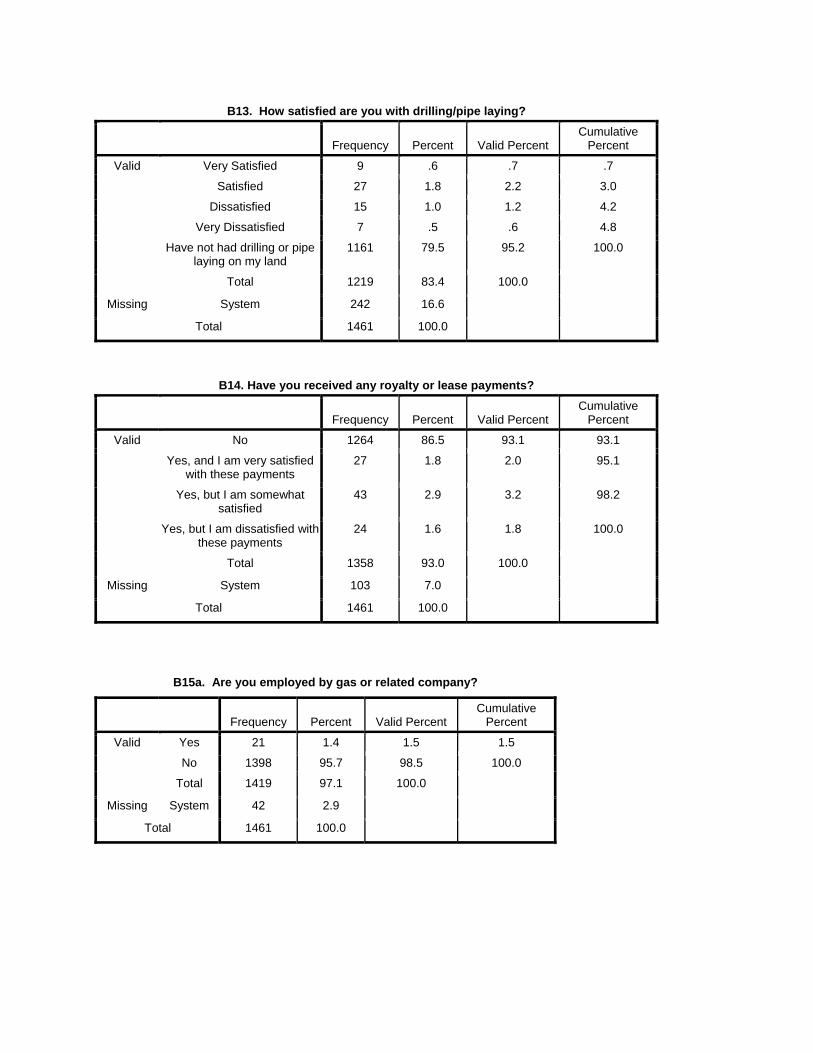
B13. How satisfied are you with drilling/pipe laying?
Frequency Percent Valid Percent
Cumulative Percent
Valid Very Satisfied 9 .6 .7 .7
Satisfied 27 1.8 2.2 3.0
Dissatisfied 15 1.0 1.2 4.2
Very Dissatisfied 7 .5 .6 4.8
Have not had drilling or pipe laying on my land
1161 79.5 95.2 100.0
Total 1219 83.4 100.0 Missing System 242 16.6
Total 1461 100.0
B14. Have you received any royalty or lease payments?
Frequency Percent Valid Percent
Cumulative Percent
Valid No 1264 86.5 93.1 93.1
Yes, and I am very satisfied with these payments
27 1.8 2.0 95.1
Yes, but I am somewhat satisfied
43 2.9 3.2 98.2
Yes, but I am dissatisfied with these payments
24 1.6 1.8 100.0
Total 1358 93.0 100.0 Missing System 103 7.0
Total 1461 100.0
B15a. Are you employed by gas or related company?
Frequency Percent Valid Percent
Cumulative Percent
Valid Yes 21 1.4 1.5 1.5
No 1398 95.7 98.5 100.0
Total 1419 97.1 100.0 Missing System 42 2.9
Total 1461 100.0
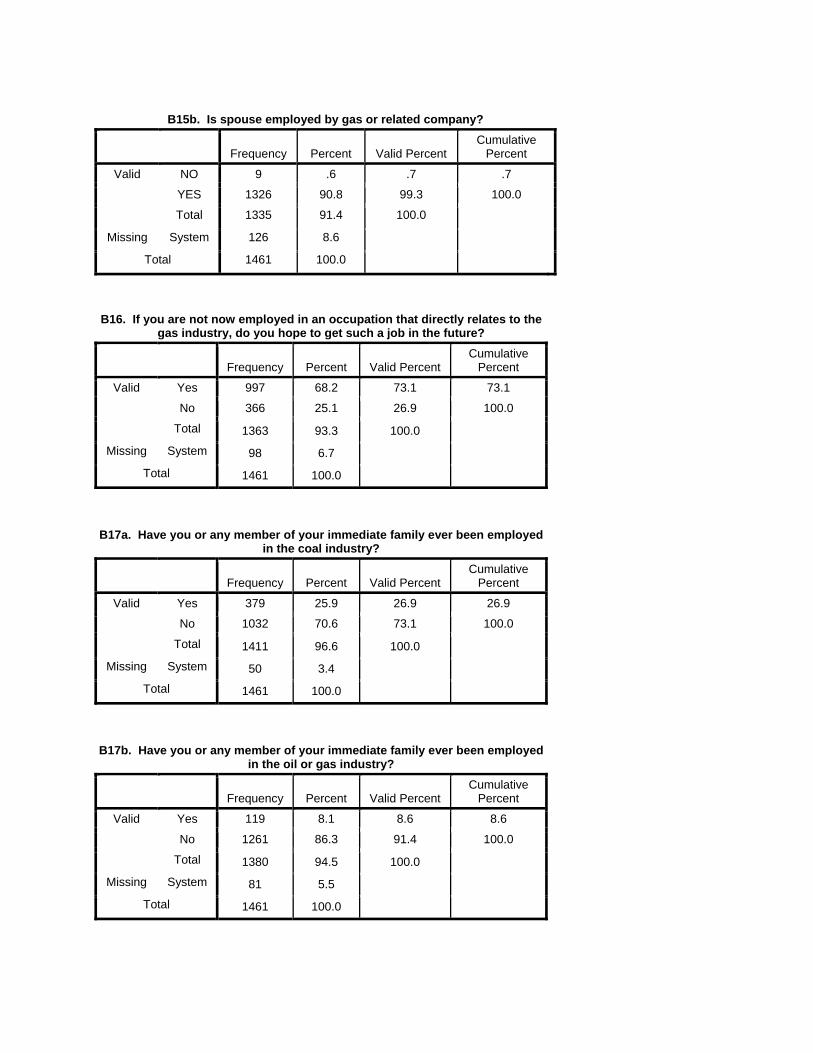
B15b. Is spouse employed by gas or related company?
Frequency Percent Valid Percent
Cumulative Percent
Valid NO 9 .6 .7 .7
YES 1326 90.8 99.3 100.0
Total 1335 91.4 100.0 Missing System 126 8.6
Total 1461 100.0
B16. If you are not now employed in an occupation that directly relates to the gas industry, do you hope to get such a job in the future?
Frequency Percent Valid Percent
Cumulative Percent
Valid Yes 997 68.2 73.1 73.1
No 366 25.1 26.9 100.0
Total 1363 93.3 100.0 Missing System 98 6.7
Total 1461 100.0
B17a. Have you or any member of your immediate family ever been employed in the coal industry?
Frequency Percent Valid Percent
Cumulative Percent
Valid Yes 379 25.9 26.9 26.9
No 1032 70.6 73.1 100.0
Total 1411 96.6 100.0 Missing System 50 3.4
Total 1461 100.0
B17b. Have you or any member of your immediate family ever been employed in the oil or gas industry?
Frequency Percent Valid Percent
Cumulative Percent
Valid Yes 119 8.1 8.6 8.6
No 1261 86.3 91.4 100.0
Total 1380 94.5 100.0 Missing System 81 5.5
Total 1461 100.0
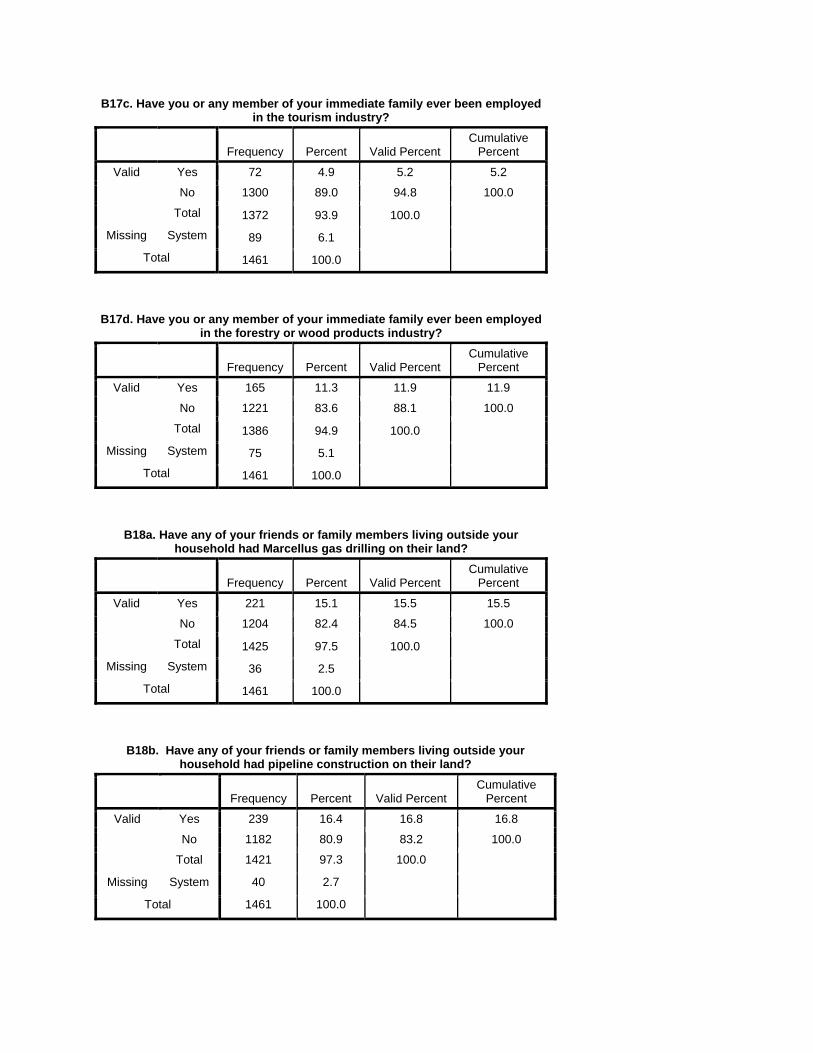
B17c. Have you or any member of your immediate family ever been employed
in the tourism industry?
Frequency Percent Valid Percent
Cumulative Percent
Valid Yes 72 4.9 5.2 5.2
No 1300 89.0 94.8 100.0
Total 1372 93.9 100.0 Missing System 89 6.1
Total 1461 100.0
B17d. Have you or any member of your immediate family ever been employed in the forestry or wood products industry?
Frequency Percent Valid Percent
Cumulative Percent
Valid Yes 165 11.3 11.9 11.9
No 1221 83.6 88.1 100.0
Total 1386 94.9 100.0 Missing System 75 5.1
Total 1461 100.0
B18a. Have any of your friends or family members living outside your household had Marcellus gas drilling on their land?
Frequency Percent Valid Percent
Cumulative Percent
Valid Yes 221 15.1 15.5 15.5
No 1204 82.4 84.5 100.0
Total 1425 97.5 100.0 Missing System 36 2.5
Total 1461 100.0
B18b. Have any of your friends or family members living outside your household had pipeline construction on their land?
Frequency Percent Valid Percent
Cumulative Percent
Valid Yes 239 16.4 16.8 16.8
No 1182 80.9 83.2 100.0
Total 1421 97.3 100.0 Missing System 40 2.7
Total 1461 100.0
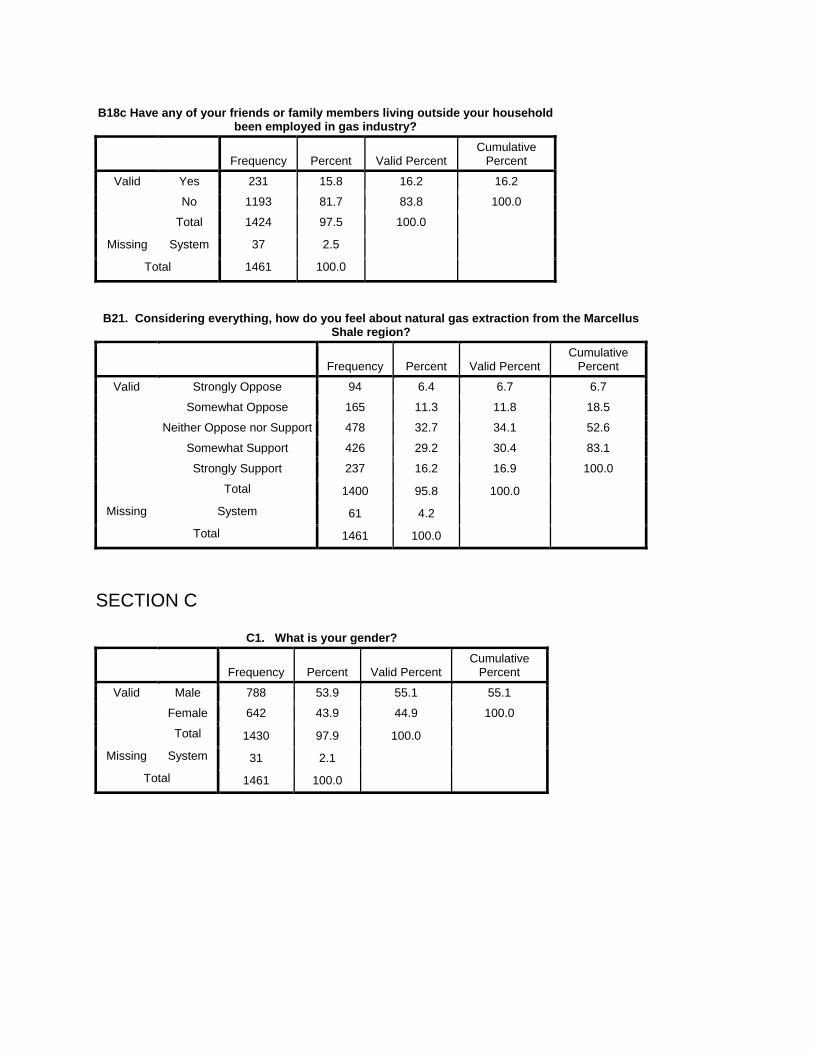
B18c Have any of your friends or family members living outside your householdbeen employed in gas industry?
Frequency Percent Valid Percent
Cumulative Percent
Valid Yes 231 15.8 16.2 16.2
No 1193 81.7 83.8 100.0
Total 1424 97.5 100.0 Missing System 37 2.5
Total 1461 100.0
B21. Considering everything, how do you feel about natural gas extraction from the Marcellus
Shale region?
Frequency Percent Valid Percent
Cumulative Percent
Valid Strongly Oppose 94 6.4 6.7 6.7
Somewhat Oppose 165 11.3 11.8 18.5
Neither Oppose nor Support 478 32.7 34.1 52.6
Somewhat Support 426 29.2 30.4 83.1
Strongly Support 237 16.2 16.9 100.0
Total 1400 95.8 100.0 Missing System 61 4.2
Total 1461 100.0
SECTION C
C1. What is your gender?
Frequency Percent Valid Percent
Cumulative Percent
Valid Male 788 53.9 55.1 55.1
Female 642 43.9 44.9 100.0
Total 1430 97.9 100.0 Missing System 31 2.1
Total 1461 100.0
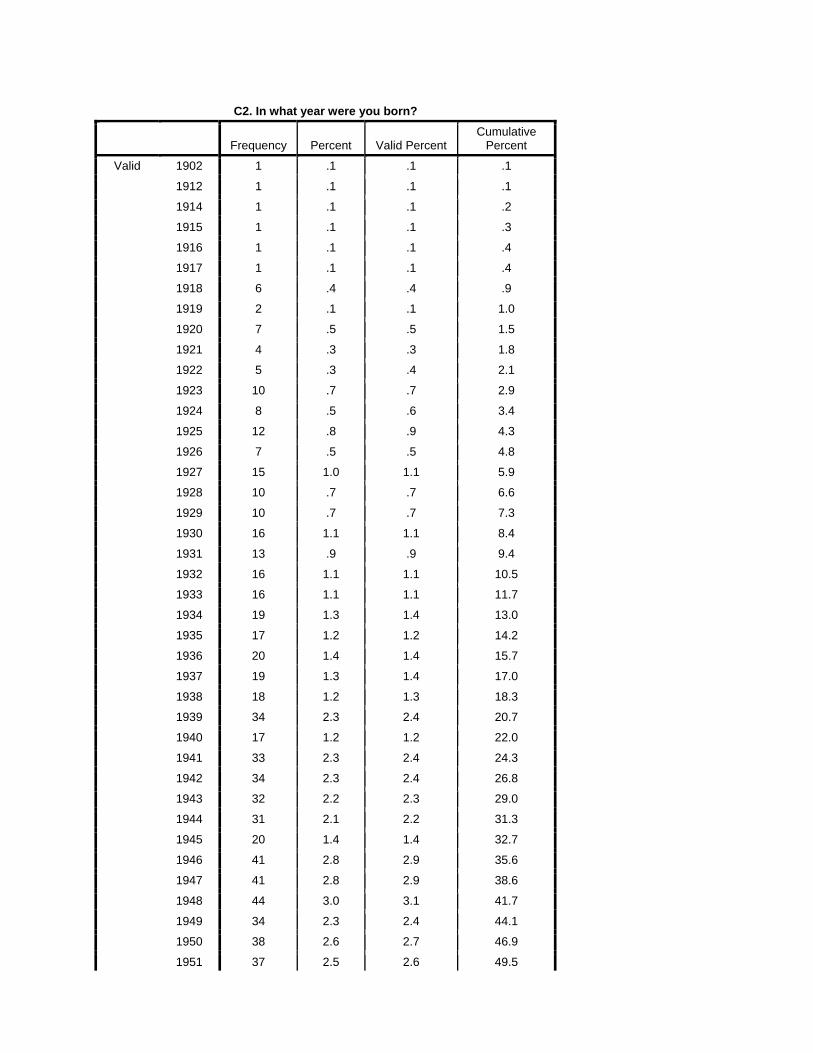
C2. In what year were you born?
Frequency Percent Valid Percent
Cumulative Percent
Valid 1902 1 .1 .1 .1
1912 1 .1 .1 .1
1914 1 .1 .1 .2
1915 1 .1 .1 .3
1916 1 .1 .1 .4
1917 1 .1 .1 .4
1918 6 .4 .4 .9
1919 2 .1 .1 1.0
1920 7 .5 .5 1.5
1921 4 .3 .3 1.8
1922 5 .3 .4 2.1
1923 10 .7 .7 2.9
1924 8 .5 .6 3.4
1925 12 .8 .9 4.3
1926 7 .5 .5 4.8
1927 15 1.0 1.1 5.9
1928 10 .7 .7 6.6
1929 10 .7 .7 7.3
1930 16 1.1 1.1 8.4
1931 13 .9 .9 9.4
1932 16 1.1 1.1 10.5
1933 16 1.1 1.1 11.7
1934 19 1.3 1.4 13.0
1935 17 1.2 1.2 14.2
1936 20 1.4 1.4 15.7
1937 19 1.3 1.4 17.0
1938 18 1.2 1.3 18.3
1939 34 2.3 2.4 20.7
1940 17 1.2 1.2 22.0
1941 33 2.3 2.4 24.3
1942 34 2.3 2.4 26.8
1943 32 2.2 2.3 29.0
1944 31 2.1 2.2 31.3
1945 20 1.4 1.4 32.7
1946 41 2.8 2.9 35.6
1947 41 2.8 2.9 38.6
1948 44 3.0 3.1 41.7
1949 34 2.3 2.4 44.1
1950 38 2.6 2.7 46.9
1951 37 2.5 2.6 49.5
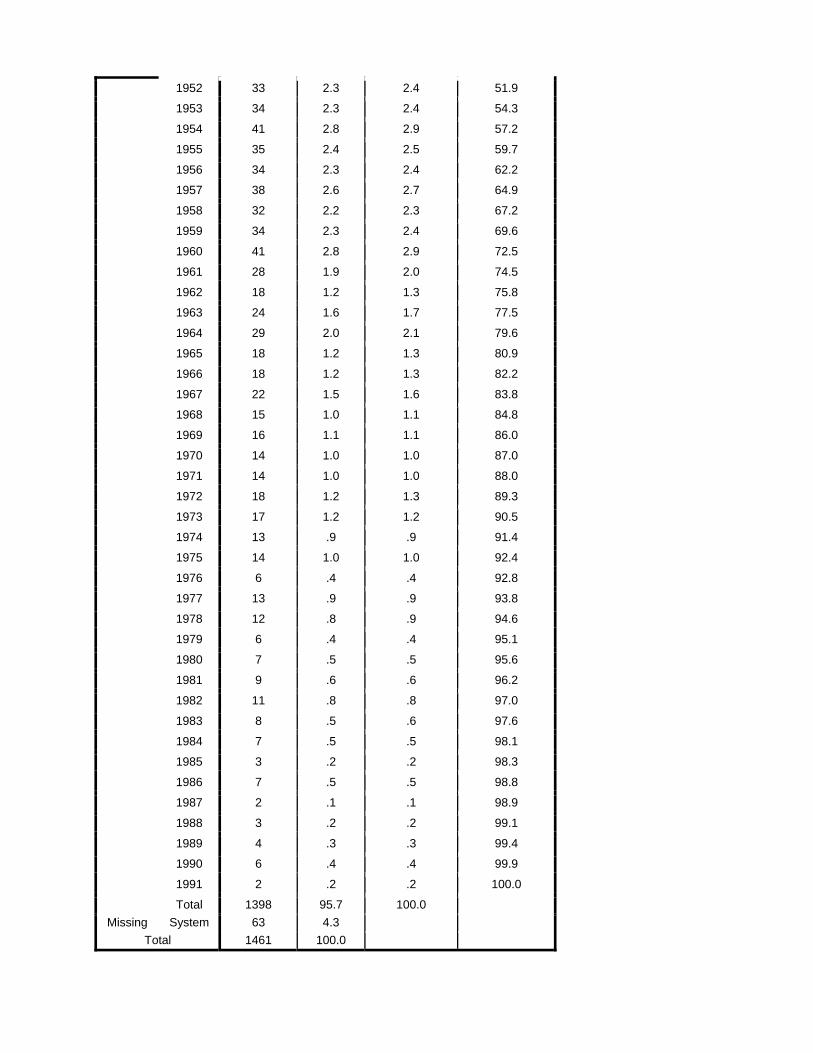
1952 33 2.3 2.4 51.9
1953 34 2.3 2.4 54.3
1954 41 2.8 2.9 57.2
1955 35 2.4 2.5 59.7
1956 34 2.3 2.4 62.2
1957 38 2.6 2.7 64.9
1958 32 2.2 2.3 67.2
1959 34 2.3 2.4 69.6
1960 41 2.8 2.9 72.5
1961 28 1.9 2.0 74.5
1962 18 1.2 1.3 75.8
1963 24 1.6 1.7 77.5
1964 29 2.0 2.1 79.6
1965 18 1.2 1.3 80.9
1966 18 1.2 1.3 82.2
1967 22 1.5 1.6 83.8
1968 15 1.0 1.1 84.8
1969 16 1.1 1.1 86.0
1970 14 1.0 1.0 87.0
1971 14 1.0 1.0 88.0
1972 18 1.2 1.3 89.3
1973 17 1.2 1.2 90.5
1974 13 .9 .9 91.4
1975 14 1.0 1.0 92.4
1976 6 .4 .4 92.8
1977 13 .9 .9 93.8
1978 12 .8 .9 94.6
1979 6 .4 .4 95.1
1980 7 .5 .5 95.6
1981 9 .6 .6 96.2
1982 11 .8 .8 97.0
1983 8 .5 .6 97.6
1984 7 .5 .5 98.1
1985 3 .2 .2 98.3
1986 7 .5 .5 98.8
1987 2 .1 .1 98.9
1988 3 .2 .2 99.1
1989 4 .3 .3 99.4
1990 6 .4 .4 99.9
1991 2 .2 .2 100.0
Total 1398 95.7 100.0 Missing System 63 4.3
Total 1461 100.0
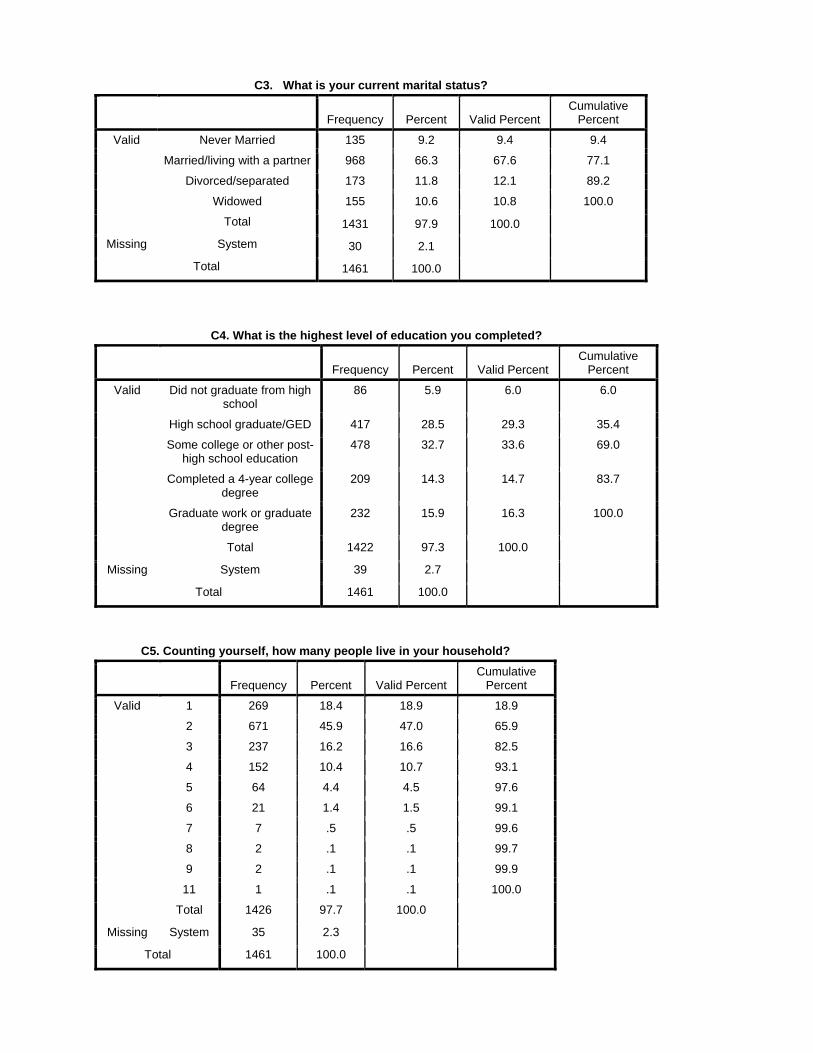
C3. What is your current marital status?
Frequency Percent Valid Percent
Cumulative Percent
Valid Never Married 135 9.2 9.4 9.4
Married/living with a partner 968 66.3 67.6 77.1
Divorced/separated 173 11.8 12.1 89.2
Widowed 155 10.6 10.8 100.0
Total 1431 97.9 100.0 Missing System 30 2.1
Total 1461 100.0
C4. What is the highest level of education you completed?
Frequency Percent Valid Percent
Cumulative Percent
Valid Did not graduate from high school
86 5.9 6.0 6.0
High school graduate/GED 417 28.5 29.3 35.4
Some college or other post-high school education
478 32.7 33.6 69.0
Completed a 4-year college degree
209 14.3 14.7 83.7
Graduate work or graduate degree
232 15.9 16.3 100.0
Total 1422 97.3 100.0 Missing System 39 2.7
Total 1461 100.0
C5. Counting yourself, how many people live in your household?
Frequency Percent Valid Percent
Cumulative Percent
Valid 1 269 18.4 18.9 18.9
2 671 45.9 47.0 65.9
3 237 16.2 16.6 82.5
4 152 10.4 10.7 93.1
5 64 4.4 4.5 97.6
6 21 1.4 1.5 99.1
7 7 .5 .5 99.6
8 2 .1 .1 99.7
9 2 .1 .1 99.9
11 1 .1 .1 100.0
Total 1426 97.7 100.0 Missing System 35 2.3
Total 1461 100.0
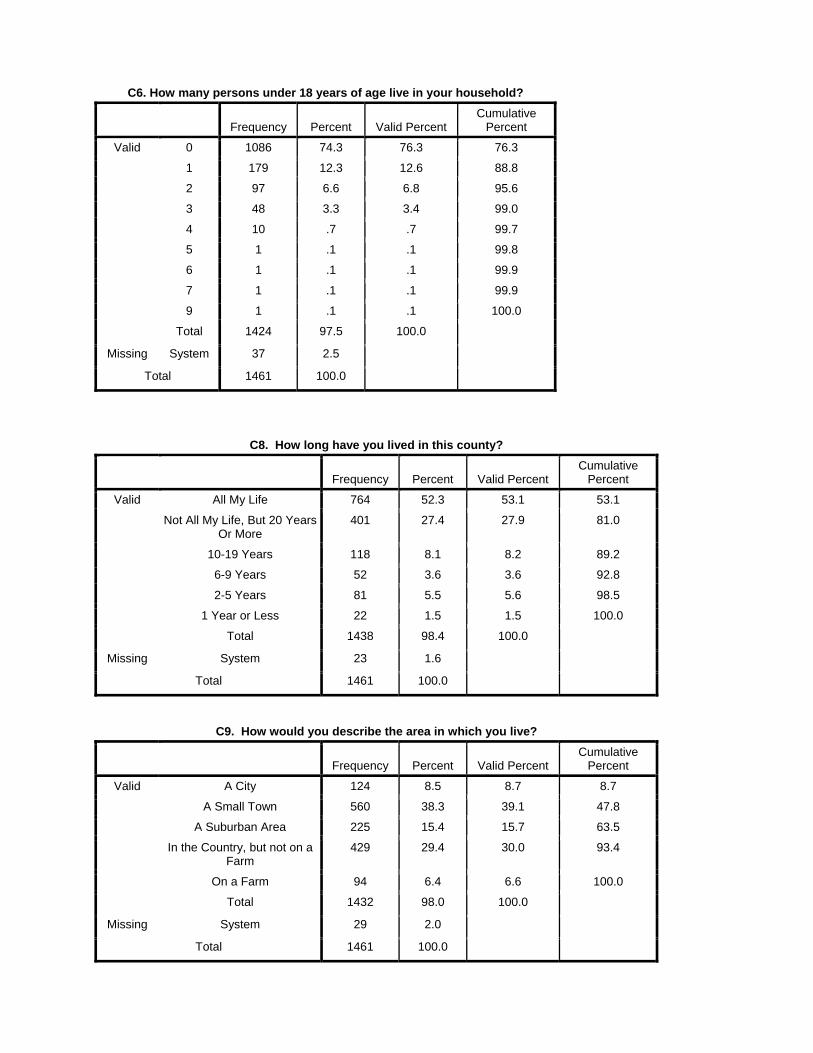
C6. How many persons under 18 years of age live in your household?
Frequency Percent Valid Percent
Cumulative Percent
Valid 0 1086 74.3 76.3 76.3
1 179 12.3 12.6 88.8
2 97 6.6 6.8 95.6
3 48 3.3 3.4 99.0
4 10 .7 .7 99.7
5 1 .1 .1 99.8
6 1 .1 .1 99.9
7 1 .1 .1 99.9
9 1 .1 .1 100.0
Total 1424 97.5 100.0 Missing System 37 2.5
Total 1461 100.0
C8. How long have you lived in this county?
Frequency Percent Valid Percent
Cumulative Percent
Valid All My Life 764 52.3 53.1 53.1
Not All My Life, But 20 Years Or More
401 27.4 27.9 81.0
10-19 Years 118 8.1 8.2 89.2
6-9 Years 52 3.6 3.6 92.8
2-5 Years 81 5.5 5.6 98.5
1 Year or Less 22 1.5 1.5 100.0
Total 1438 98.4 100.0 Missing System 23 1.6
Total 1461 100.0
C9. How would you describe the area in which you live?
Frequency Percent Valid Percent
Cumulative Percent
Valid A City 124 8.5 8.7 8.7
A Small Town 560 38.3 39.1 47.8
A Suburban Area 225 15.4 15.7 63.5
In the Country, but not on a Farm
429 29.4 30.0 93.4
On a Farm 94 6.4 6.6 100.0
Total 1432 98.0 100.0 Missing System 29 2.0
Total 1461 100.0
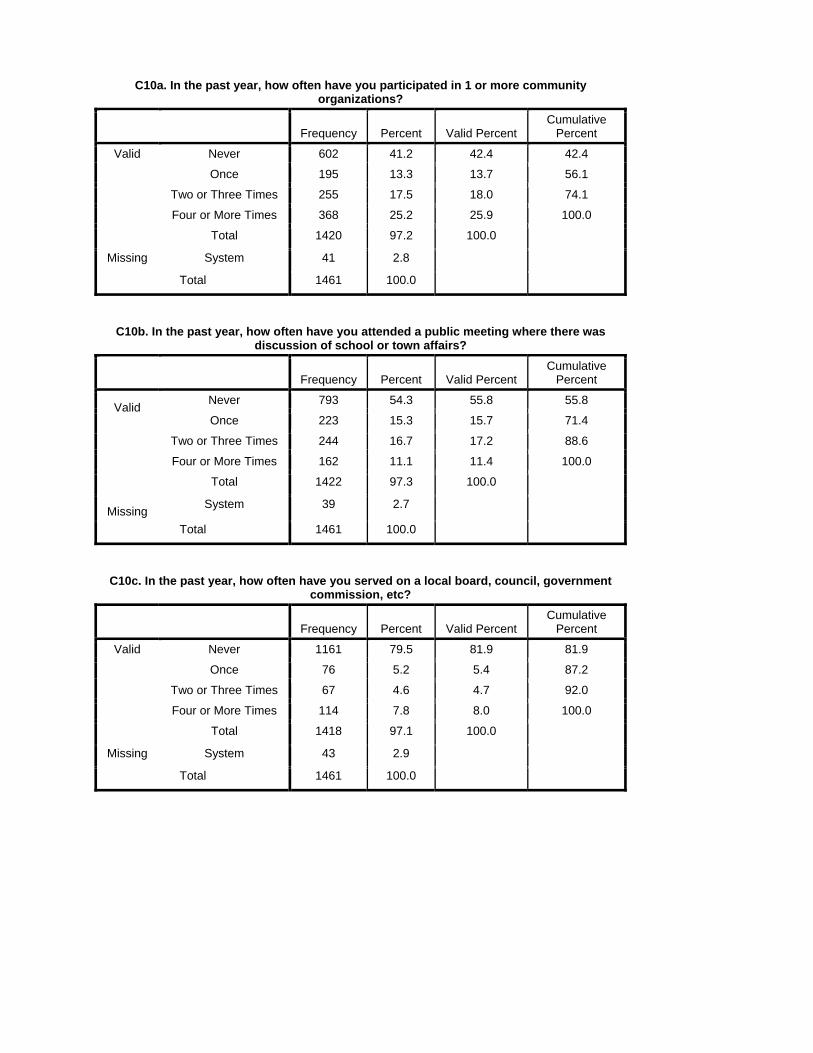
C10a. In the past year, how often have you participated in 1 or more community organizations?
Frequency Percent Valid Percent
Cumulative Percent
Valid Never 602 41.2 42.4 42.4
Once 195 13.3 13.7 56.1
Two or Three Times 255 17.5 18.0 74.1
Four or More Times 368 25.2 25.9 100.0
Total 1420 97.2 100.0 Missing System 41 2.8
Total 1461 100.0
C10b. In the past year, how often have you attended a public meeting where there was
discussion of school or town affairs?
Frequency Percent Valid Percent
Cumulative Percent
Valid Never 793 54.3 55.8 55.8
Once 223 15.3 15.7 71.4
Two or Three Times 244 16.7 17.2 88.6
Four or More Times 162 11.1 11.4 100.0
Total 1422 97.3 100.0
Missing System 39 2.7 Total 1461 100.0
C10c. In the past year, how often have you served on a local board, council, government
commission, etc?
Frequency Percent Valid Percent
Cumulative Percent
Valid Never 1161 79.5 81.9 81.9
Once 76 5.2 5.4 87.2
Two or Three Times 67 4.6 4.7 92.0
Four or More Times 114 7.8 8.0 100.0
Total 1418 97.1 100.0 Missing System 43 2.9
Total 1461 100.0

C10d. In the past year, how often have you contacted government agency or official or the
media about local issue?
Frequency Percent Valid Percent
Cumulative Percent
Valid Never 956 65.4 67.2 67.2
Once 185 12.7 13.0 80.2
Two or Three Times 190 13.0 13.4 93.6
Four or More Times 91 6.2 6.4 100.0
Total 1422 97.3 100.0 Missing System 39 2.7
Total 1461 100.0
C10e. In the past year, how often have you worked/gave money for a church project?
Frequency Percent Valid Percent
Cumulative Percent
Valid Never 420 28.7 29.6 29.6
Once 147 10.1 10.3 39.9
Two or Three Times 299 20.5 21.0 60.9
Four or More Times 555 38.0 39.1 100.0
Total 1421 97.3 100.0 Missing System 40 2.7
Total 1461 100.0
C10f. In the past year, how often have you given time/money for nonreligious community
activities/organization in the community?
Frequency Percent Valid Percent
Cumulative Percent
Valid Never 428 29.3 30.2 30.2
Once 171 11.7 12.1 42.3
Two or Three Times 413 28.3 29.2 71.5
Four or More Times 403 27.6 28.5 99.9
5 1 .1 .1 100.0
Total 1416 96.9 100.0 Missing System 45 3.1
Total 1461 100.0
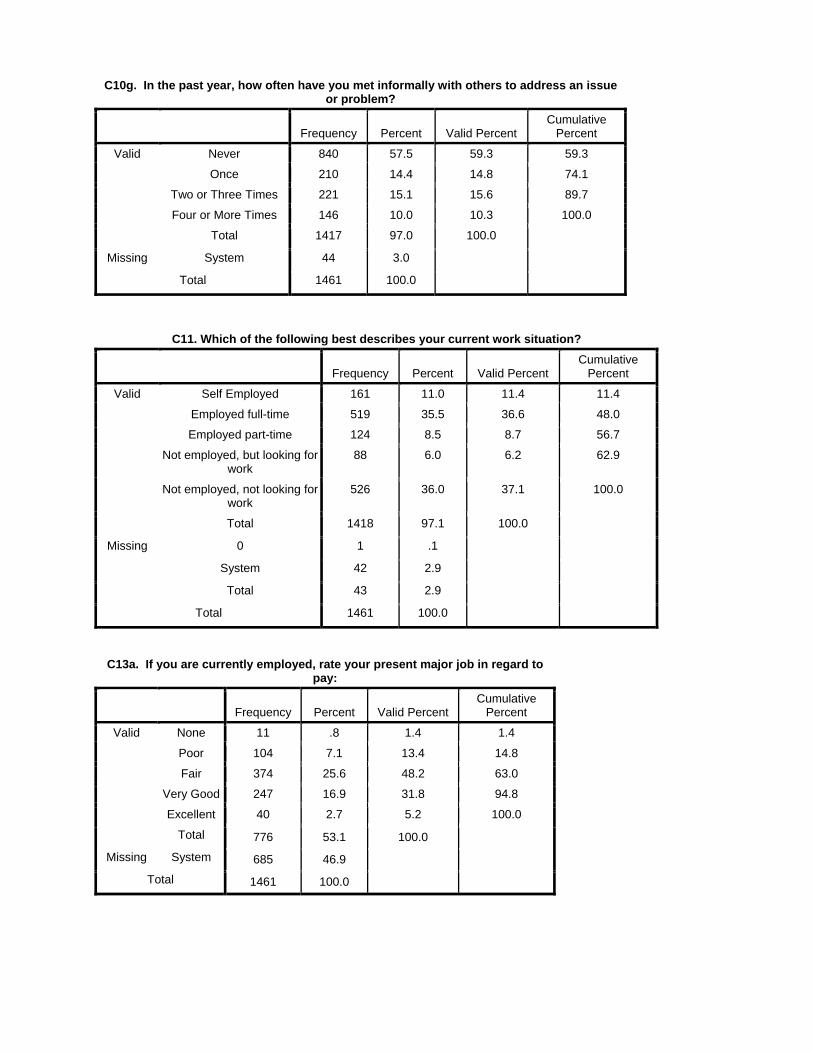
C10g. In the past year, how often have you met informally with others to address an issue or problem?
Frequency Percent Valid Percent
Cumulative Percent
Valid Never 840 57.5 59.3 59.3
Once 210 14.4 14.8 74.1
Two or Three Times 221 15.1 15.6 89.7
Four or More Times 146 10.0 10.3 100.0
Total 1417 97.0 100.0 Missing System 44 3.0
Total 1461 100.0
C11. Which of the following best describes your current work situation?
Frequency Percent Valid Percent
Cumulative Percent
Valid Self Employed 161 11.0 11.4 11.4
Employed full-time 519 35.5 36.6 48.0
Employed part-time 124 8.5 8.7 56.7
Not employed, but looking for work
88 6.0 6.2 62.9
Not employed, not looking for work
526 36.0 37.1 100.0
Total 1418 97.1 100.0 Missing 0 1 .1
System 42 2.9 Total 43 2.9
Total 1461 100.0
C13a. If you are currently employed, rate your present major job in regard to
pay:
Frequency Percent Valid Percent
Cumulative Percent
Valid None 11 .8 1.4 1.4
Poor 104 7.1 13.4 14.8
Fair 374 25.6 48.2 63.0
Very Good 247 16.9 31.8 94.8
Excellent 40 2.7 5.2 100.0
Total 776 53.1 100.0 Missing System 685 46.9
Total 1461 100.0
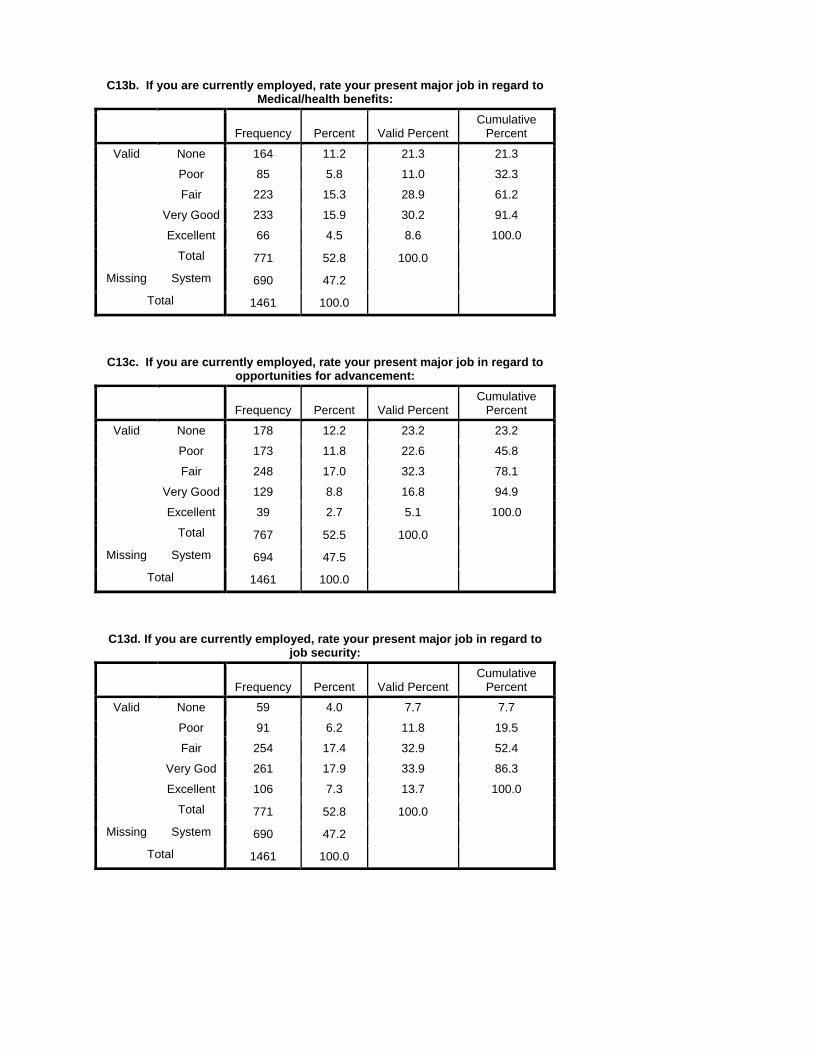
C13b. If you are currently employed, rate your present major job in regard to Medical/health benefits:
Frequency Percent Valid Percent
Cumulative Percent
Valid None 164 11.2 21.3 21.3
Poor 85 5.8 11.0 32.3
Fair 223 15.3 28.9 61.2
Very Good 233 15.9 30.2 91.4
Excellent 66 4.5 8.6 100.0
Total 771 52.8 100.0 Missing System 690 47.2
Total 1461 100.0
C13c. If you are currently employed, rate your present major job in regard to opportunities for advancement:
Frequency Percent Valid Percent
Cumulative Percent
Valid None 178 12.2 23.2 23.2
Poor 173 11.8 22.6 45.8
Fair 248 17.0 32.3 78.1
Very Good 129 8.8 16.8 94.9
Excellent 39 2.7 5.1 100.0
Total 767 52.5 100.0 Missing System 694 47.5
Total 1461 100.0
C13d. If you are currently employed, rate your present major job in regard to job security:
Frequency Percent Valid Percent
Cumulative Percent
Valid None 59 4.0 7.7 7.7
Poor 91 6.2 11.8 19.5
Fair 254 17.4 32.9 52.4
Very God 261 17.9 33.9 86.3
Excellent 106 7.3 13.7 100.0
Total 771 52.8 100.0 Missing System 690 47.2
Total 1461 100.0
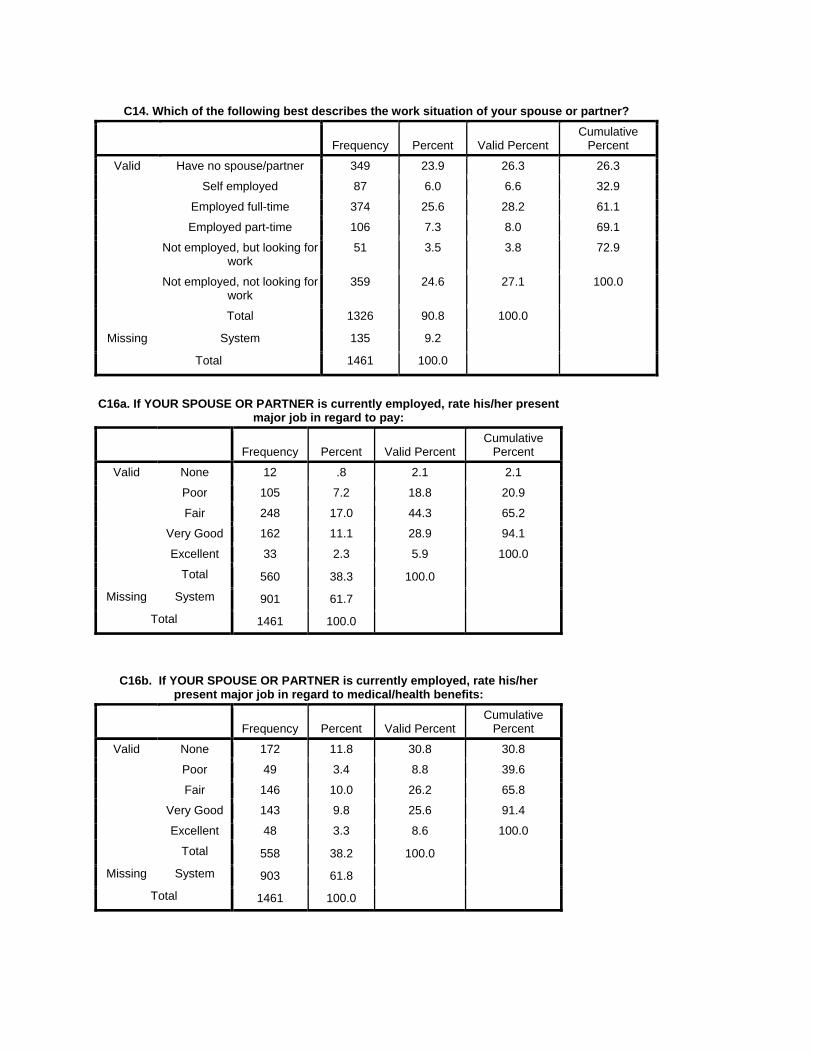
C14. Which of the following best describes the work situation of your spouse or partner?
Frequency Percent Valid Percent
Cumulative Percent
Valid Have no spouse/partner 349 23.9 26.3 26.3
Self employed 87 6.0 6.6 32.9
Employed full-time 374 25.6 28.2 61.1
Employed part-time 106 7.3 8.0 69.1
Not employed, but looking for work
51 3.5 3.8 72.9
Not employed, not looking for work
359 24.6 27.1 100.0
Total 1326 90.8 100.0 Missing System 135 9.2
Total 1461 100.0
C16a. If YOUR SPOUSE OR PARTNER is currently employed, rate his/her present major job in regard to pay:
Frequency Percent Valid Percent
Cumulative Percent
Valid None 12 .8 2.1 2.1
Poor 105 7.2 18.8 20.9
Fair 248 17.0 44.3 65.2
Very Good 162 11.1 28.9 94.1
Excellent 33 2.3 5.9 100.0
Total 560 38.3 100.0 Missing System 901 61.7
Total 1461 100.0
C16b. If YOUR SPOUSE OR PARTNER is currently employed, rate his/her present major job in regard to medical/health benefits:
Frequency Percent Valid Percent
Cumulative Percent
Valid None 172 11.8 30.8 30.8
Poor 49 3.4 8.8 39.6
Fair 146 10.0 26.2 65.8
Very Good 143 9.8 25.6 91.4
Excellent 48 3.3 8.6 100.0
Total 558 38.2 100.0 Missing System 903 61.8
Total 1461 100.0
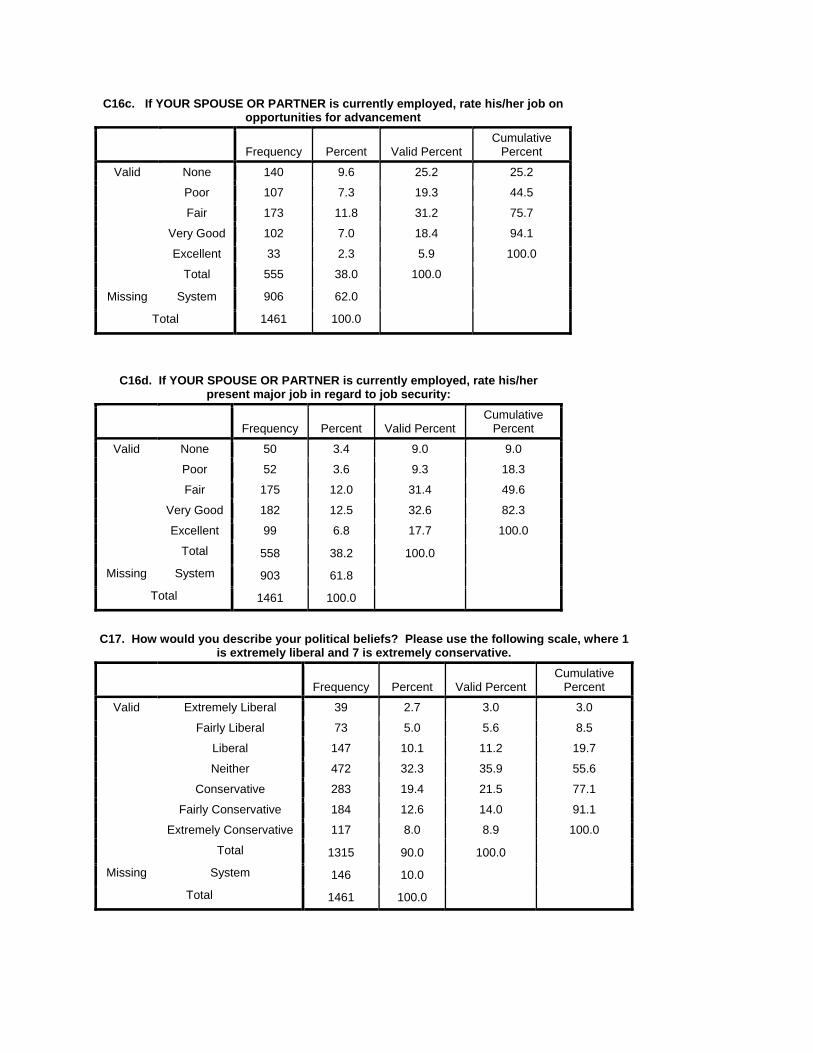
C16c. If YOUR SPOUSE OR PARTNER is currently employed, rate his/her job on
opportunities for advancement
Frequency Percent Valid Percent
Cumulative Percent
Valid None 140 9.6 25.2 25.2
Poor 107 7.3 19.3 44.5
Fair 173 11.8 31.2 75.7
Very Good 102 7.0 18.4 94.1
Excellent 33 2.3 5.9 100.0
Total 555 38.0 100.0 Missing System 906 62.0
Total 1461 100.0
C16d. If YOUR SPOUSE OR PARTNER is currently employed, rate his/her present major job in regard to job security:
Frequency Percent Valid Percent
Cumulative Percent
Valid None 50 3.4 9.0 9.0
Poor 52 3.6 9.3 18.3
Fair 175 12.0 31.4 49.6
Very Good 182 12.5 32.6 82.3
Excellent 99 6.8 17.7 100.0
Total 558 38.2 100.0 Missing System 903 61.8
Total 1461 100.0
C17. How would you describe your political beliefs? Please use the following scale, where 1 is extremely liberal and 7 is extremely conservative.
Frequency Percent Valid Percent
Cumulative Percent
Valid Extremely Liberal 39 2.7 3.0 3.0
Fairly Liberal 73 5.0 5.6 8.5
Liberal 147 10.1 11.2 19.7
Neither 472 32.3 35.9 55.6
Conservative 283 19.4 21.5 77.1
Fairly Conservative 184 12.6 14.0 91.1
Extremely Conservative 117 8.0 8.9 100.0
Total 1315 90.0 100.0 Missing System 146 10.0
Total 1461 100.0
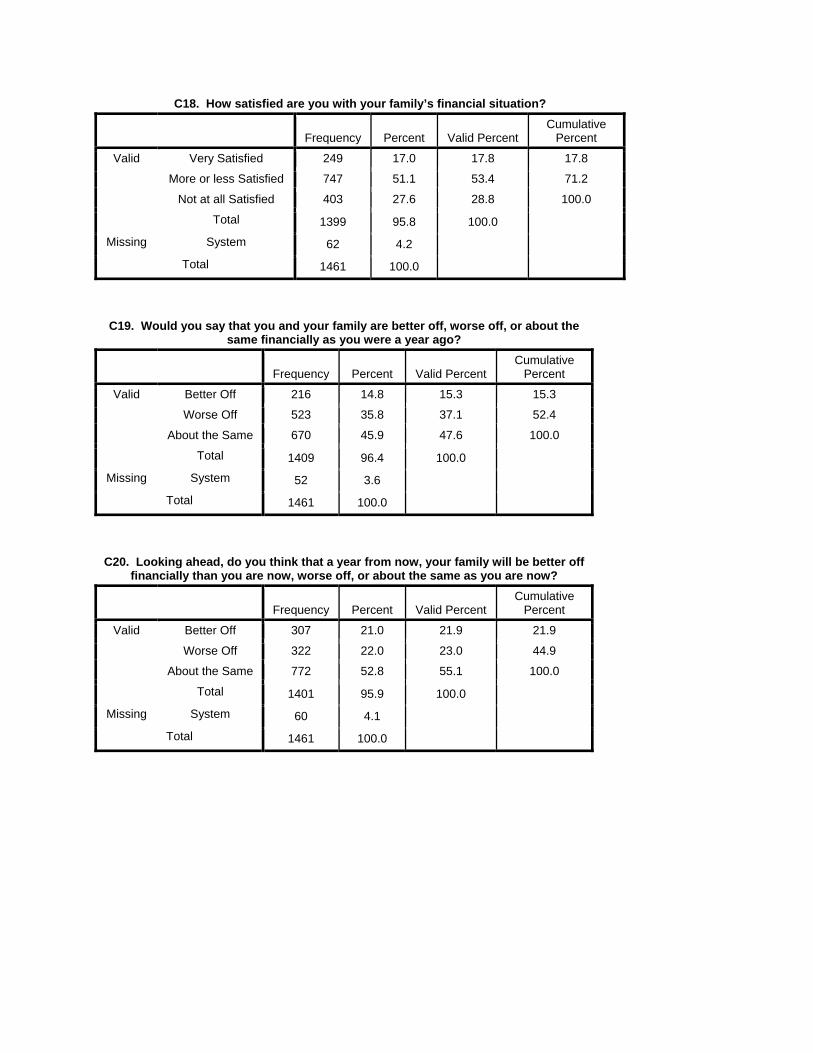
C18. How satisfied are you with your family’s financial situation?
Frequency Percent Valid Percent
Cumulative Percent
Valid Very Satisfied 249 17.0 17.8 17.8
More or less Satisfied 747 51.1 53.4 71.2
Not at all Satisfied 403 27.6 28.8 100.0
Total 1399 95.8 100.0 Missing System 62 4.2
Total 1461 100.0
C19. Would you say that you and your family are better off, worse off, or about the same financially as you were a year ago?
Frequency Percent Valid Percent
Cumulative Percent
Valid Better Off 216 14.8 15.3 15.3
Worse Off 523 35.8 37.1 52.4
About the Same 670 45.9 47.6 100.0
Total 1409 96.4 100.0 Missing System 52 3.6
Total 1461 100.0
C20. Looking ahead, do you think that a year from now, your family will be better off financially than you are now, worse off, or about the same as you are now?
Frequency Percent Valid Percent
Cumulative Percent
Valid Better Off 307 21.0 21.9 21.9
Worse Off 322 22.0 23.0 44.9
About the Same 772 52.8 55.1 100.0
Total 1401 95.9 100.0 Missing System 60 4.1
Total 1461 100.0
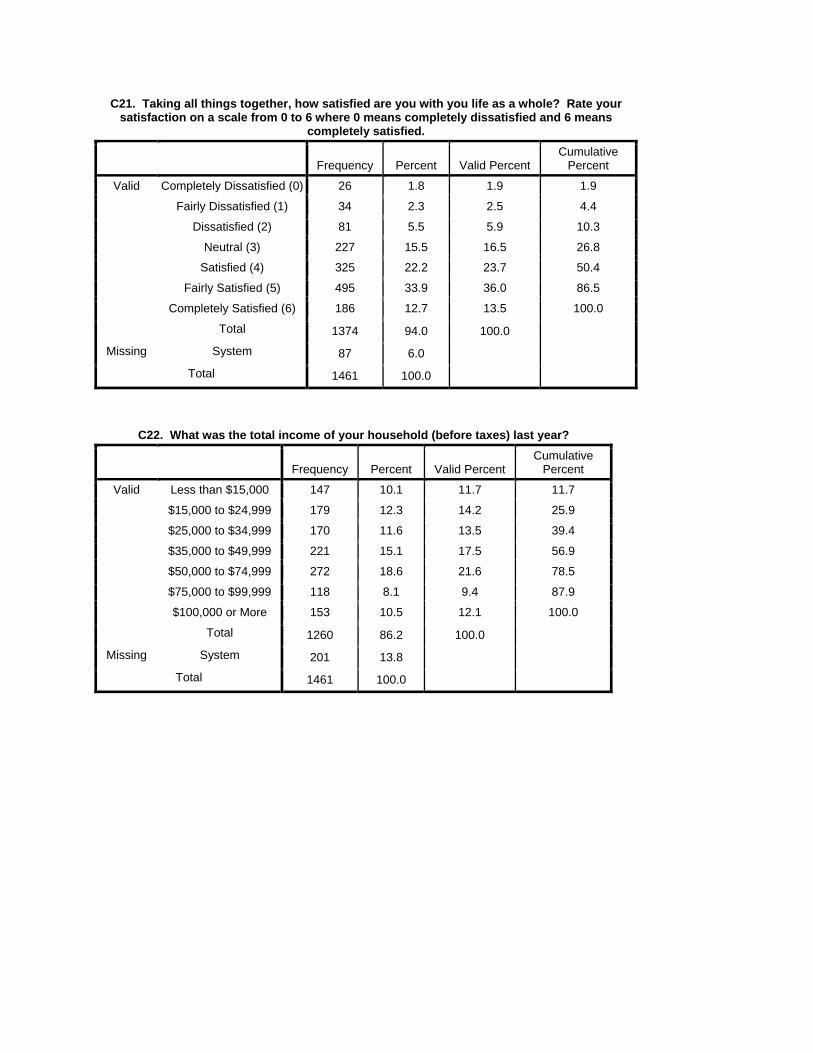
C21. Taking all things together, how satisfied are you with you life as a whole? Rate your
satisfaction on a scale from 0 to 6 where 0 means completely dissatisfied and 6 means completely satisfied.
Frequency Percent Valid Percent
Cumulative Percent
Valid Completely Dissatisfied (0) 26 1.8 1.9 1.9
Fairly Dissatisfied (1) 34 2.3 2.5 4.4
Dissatisfied (2) 81 5.5 5.9 10.3
Neutral (3) 227 15.5 16.5 26.8
Satisfied (4) 325 22.2 23.7 50.4
Fairly Satisfied (5) 495 33.9 36.0 86.5
Completely Satisfied (6) 186 12.7 13.5 100.0
Total 1374 94.0 100.0 Missing System 87 6.0
Total 1461 100.0
C22. What was the total income of your household (before taxes) last year?
Frequency Percent Valid Percent
Cumulative Percent
Valid Less than $15,000 147 10.1 11.7 11.7
$15,000 to $24,999 179 12.3 14.2 25.9
$25,000 to $34,999 170 11.6 13.5 39.4
$35,000 to $49,999 221 15.1 17.5 56.9
$50,000 to $74,999 272 18.6 21.6 78.5
$75,000 to $99,999 118 8.1 9.4 87.9
$100,000 or More 153 10.5 12.1 100.0
Total 1260 86.2 100.0 Missing System 201 13.8
Total 1461 100.0
Pennsylvania Interview Questions APPENDIX C
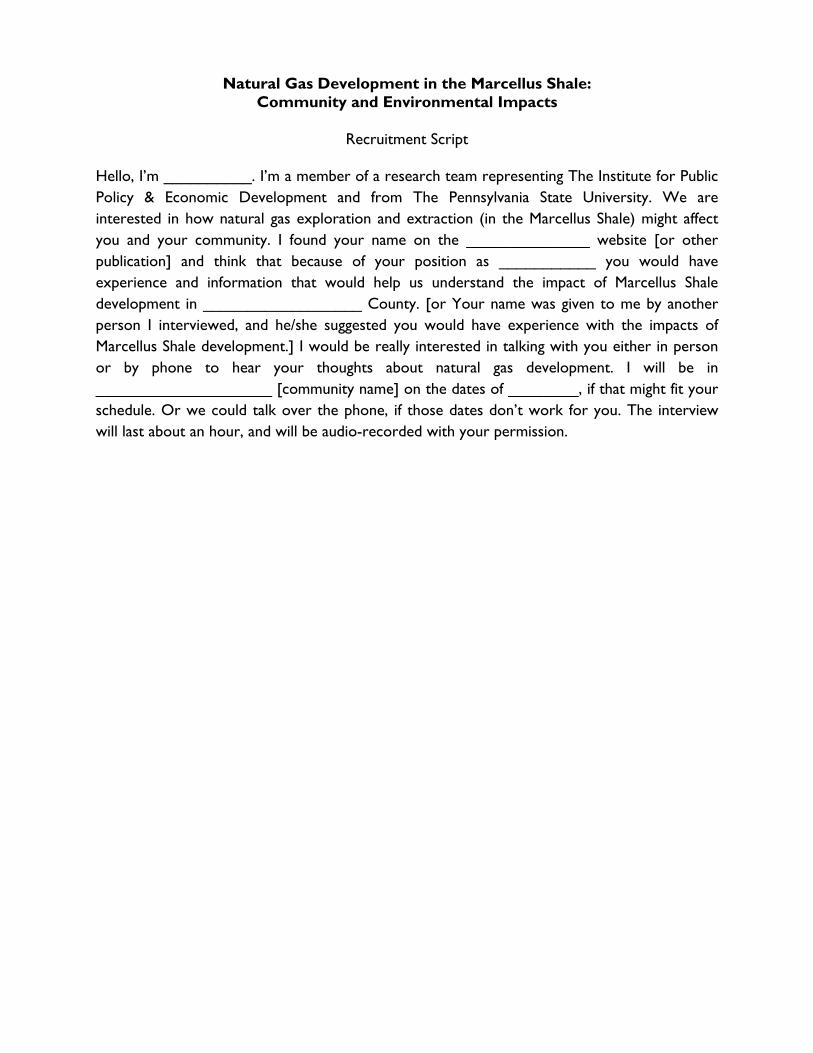
Natural Gas Development in the Marcellus Shale:
Community and Environmental Impacts
Recruitment Script Hello, I’m __________. I’m a member of a research team representing The Institute for Public Policy & Economic Development and from The Pennsylvania State University. We are interested in how natural gas exploration and extraction (in the Marcellus Shale) might affect you and your community. I found your name on the ______________ website [or other publication] and think that because of your position as ___________ you would have experience and information that would help us understand the impact of Marcellus Shale development in __________________ County. [or Your name was given to me by another person I interviewed, and he/she suggested you would have experience with the impacts of Marcellus Shale development.] I would be really interested in talking with you either in person or by phone to hear your thoughts about natural gas development. I will be in ____________________ [community name] on the dates of ________, if that might fit your schedule. Or we could talk over the phone, if those dates don’t work for you. The interview will last about an hour, and will be audio-recorded with your permission.
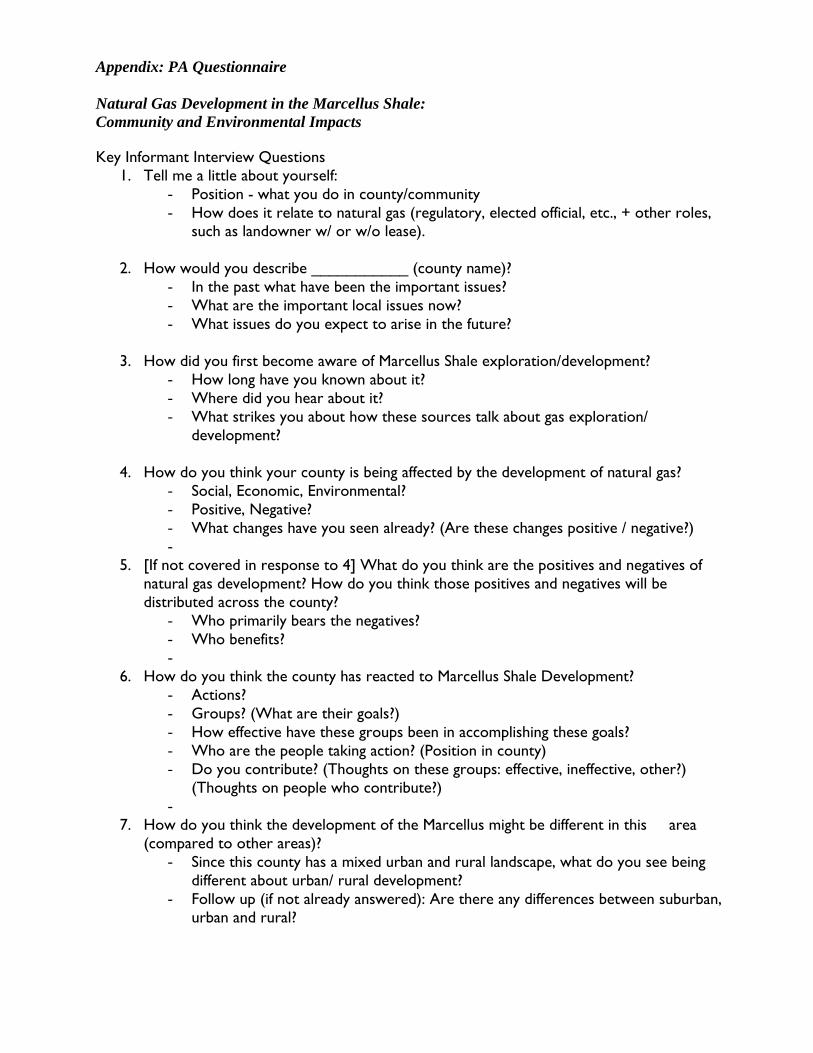
Appendix: PA Questionnaire Natural Gas Development in the Marcellus Shale: Community and Environmental Impacts Key Informant Interview Questions
1. Tell me a little about yourself: - Position - what you do in county/community - How does it relate to natural gas (regulatory, elected official, etc., + other roles,
such as landowner w/ or w/o lease).
2. How would you describe ___________ (county name)? - In the past what have been the important issues? - What are the important local issues now? - What issues do you expect to arise in the future?
3. How did you first become aware of Marcellus Shale exploration/development?
- How long have you known about it? - Where did you hear about it? - What strikes you about how these sources talk about gas exploration/
development?
4. How do you think your county is being affected by the development of natural gas? - Social, Economic, Environmental? - Positive, Negative? - What changes have you seen already? (Are these changes positive / negative?) -
5. [If not covered in response to 4] What do you think are the positives and negatives of natural gas development? How do you think those positives and negatives will be distributed across the county?
- Who primarily bears the negatives? - Who benefits? -
6. How do you think the county has reacted to Marcellus Shale Development? - Actions? - Groups? (What are their goals?) - How effective have these groups been in accomplishing these goals? - Who are the people taking action? (Position in county) - Do you contribute? (Thoughts on these groups: effective, ineffective, other?)
(Thoughts on people who contribute?) -
7. How do you think the development of the Marcellus might be different in this area (compared to other areas)?
- Since this county has a mixed urban and rural landscape, what do you see being different about urban/ rural development?
- Follow up (if not already answered): Are there any differences between suburban, urban and rural?
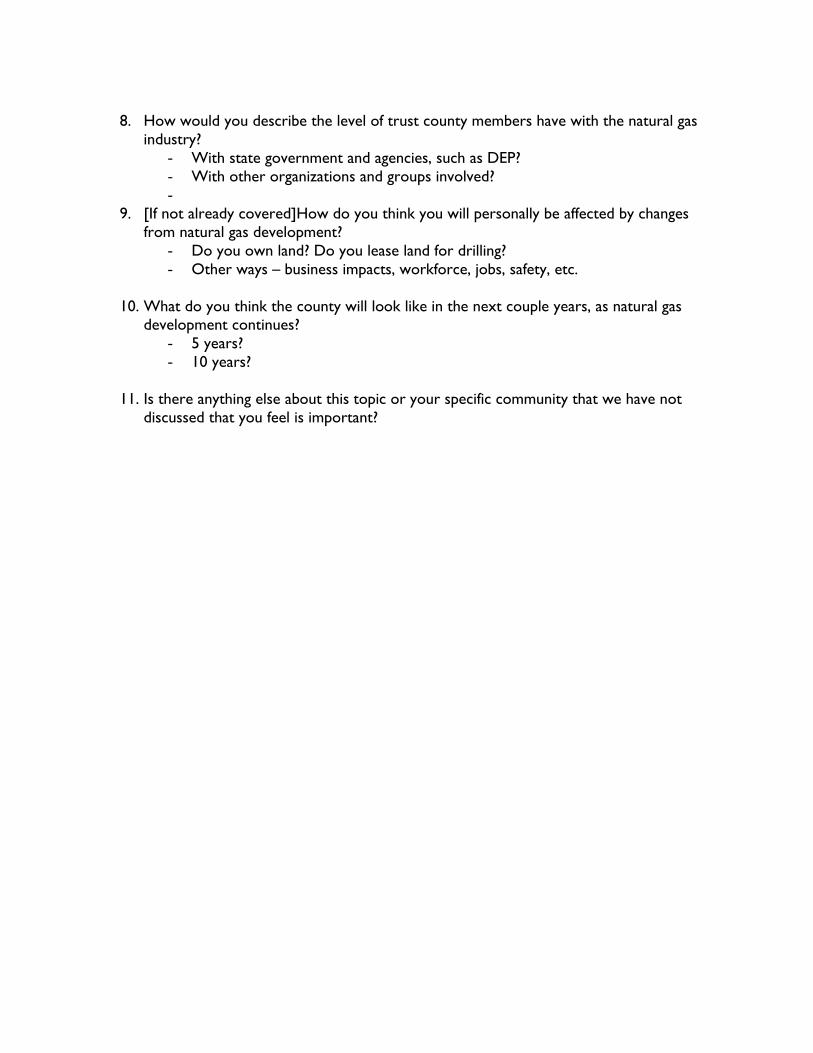
8. How would you describe the level of trust county members have with the natural gas industry?
- With state government and agencies, such as DEP? - With other organizations and groups involved? -
9. [If not already covered]How do you think you will personally be affected by changes from natural gas development?
- Do you own land? Do you lease land for drilling? - Other ways – business impacts, workforce, jobs, safety, etc.
10. What do you think the county will look like in the next couple years, as natural gas
development continues? - 5 years? - 10 years?
11. Is there anything else about this topic or your specific community that we have not
discussed that you feel is important?
Appendix: Informed Consent Form
Informed Consent Form for Social Science Research The Pennsylvania State University & The Institute for Public Policy & Economic Development
Title of Project: Natural Gas Development in the Marcellus Shale: Community and Environmental Impacts Principal Investigator: Kathy Brasier, 105B Armsby Bldg., University Park, PA 16802, 814-865-7321, [email protected] Other Investigator(s): Stephan Goetz, 7-E Armsby, University Park, PA 16802, 814-863-4656, [email protected]. Diane McLaughlin, 110C Armsby Bldg., University Park, PA 16802, 814-863-8626, [email protected]. Rich Stedman, 122-D Fernow Hall, Cornell University Ithaca, NY 14853, 607-255-9729, [email protected]. Tim Kelsey, 105A, Armsby Bldg., University Park, PA 16802, 814-865-9542, [email protected]. Fern K. Willits (Bunny), 113 Armsby Bldg, University Park, PA 16802, 814-863-8647, [email protected]. Jeffery Jacquet, 211 E. Court St. Ithaca, NY 14850, [email protected]. Matthew Filteau, 103 Armsby Bldg, University Park, PA 16802, [email protected]. Teri Ooms, 7 South Main Street, Suite 201, Wilkes-Barre, PA 18701, [email protected], 570-207-0340. Sherry Tracewski, 7 South Main Street, Suite 201, Wilkes Barre, PA 18701, [email protected], 570- 408-9850. Marla Doddo, 7 South Main Street, Suite 201, Wilkes-Barre, PA 18701, [email protected], 570-207-0340
Purpose of the Study: The purpose of this research is to assess perceptions of local leaders about how natural gas exploration and extraction in the Marcellus Shale (using deep wells) might impact you and your community—now, and in the future. Interviews will be conducted either face to face or over the telephone. Procedures to be Followed: You will be asked about your experiences and views related to development of natural gas in the Marcellus Shale. Particularly, your thoughts about the effects of this development on your community and surrounding area are important to this study. Duration: The interview will last between sixty and ninety minutes. Statement of Confidentiality: The information you provide will be kept confidential; only the project team members listed above will know your identity. Your name will not be linked to your responses. All information that could identify you will be removed from written transcripts. Interviews will be audio-recorded with your permission. The tape recordings will be stored in a locked drawer in the office of the project director, Kathy Brasier. Only the investigators listed above will have access to these recordings. The audio recordings will be destroyed 3 years after the project has ended (August, 2012). Right to Ask Questions: Participants have the right to ask questions and have those questions. Please contact Kathy Brasier at 814-865-732 with any questions, complaints or concerns about this research. Voluntary Participation: Your decision to be in this research is voluntary and if you participate there is no compensation. You do not have to answer any questions you do not want to answer. You may withdraw from this research at any time. To participate you must be 18 years of age or older to take part in this research study. You will be given a copy of this form for your records. Completion of the interview implies your consent to participate in this research and to be audio recorded.

Arkansas & Texas Interview Questions APPENDIX D
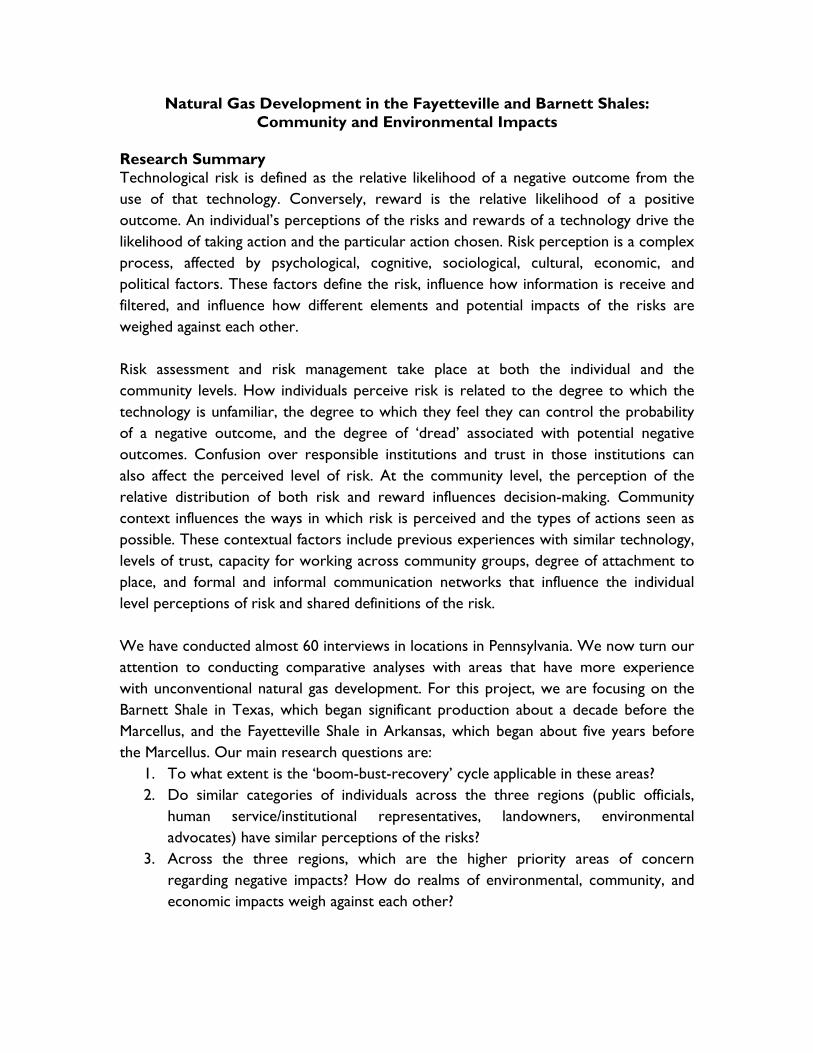
Natural Gas Development in the Fayetteville and Barnett Shales: Community and Environmental Impacts
Research Summary Technological risk is defined as the relative likelihood of a negative outcome from the use of that technology. Conversely, reward is the relative likelihood of a positive outcome. An individual’s perceptions of the risks and rewards of a technology drive the likelihood of taking action and the particular action chosen. Risk perception is a complex process, affected by psychological, cognitive, sociological, cultural, economic, and political factors. These factors define the risk, influence how information is receive and filtered, and influence how different elements and potential impacts of the risks are weighed against each other. Risk assessment and risk management take place at both the individual and the community levels. How individuals perceive risk is related to the degree to which the technology is unfamiliar, the degree to which they feel they can control the probability of a negative outcome, and the degree of ‘dread’ associated with potential negative outcomes. Confusion over responsible institutions and trust in those institutions can also affect the perceived level of risk. At the community level, the perception of the relative distribution of both risk and reward influences decision-making. Community context influences the ways in which risk is perceived and the types of actions seen as possible. These contextual factors include previous experiences with similar technology, levels of trust, capacity for working across community groups, degree of attachment to place, and formal and informal communication networks that influence the individual level perceptions of risk and shared definitions of the risk. We have conducted almost 60 interviews in locations in Pennsylvania. We now turn our attention to conducting comparative analyses with areas that have more experience with unconventional natural gas development. For this project, we are focusing on the Barnett Shale in Texas, which began significant production about a decade before the Marcellus, and the Fayetteville Shale in Arkansas, which began about five years before the Marcellus. Our main research questions are:
1. To what extent is the ‘boom-bust-recovery’ cycle applicable in these areas? 2. Do similar categories of individuals across the three regions (public officials,
human service/institutional representatives, landowners, environmental advocates) have similar perceptions of the risks?
3. Across the three regions, which are the higher priority areas of concern regarding negative impacts? How do realms of environmental, community, and economic impacts weigh against each other?

4. What community-level factors (trust, communication networks, previous history, relative distribution of risks) affect the ways in which the case study locations collectively perceive risk and take actions based on those perceptions?
Natural Gas Development in the Fayetteville and Barnett Shales: Community and Environmental Impacts
Recruitment Script
Hello, I’m __________. I’m a member of a research team from The Institute for Public Policy & Economic Development and The Pennsylvania State University. We are planning a research trip to interview community members and leaders about their experiences with the natural gas exploration and extraction in the Fayetteville/Barnett Shale, and would very much like to talk with you. As you may know, the Marcellus Shale in our region is rapidly being developed, and we’re trying to understand your experiences with natural gas extraction so we can prepare community members for the challenges and opportunities that may lie ahead. I found your name on the ______________ website [or other publication] and think that because of your position you would have experience and information that would help us understand the impacts of Fayetteville/Barnett Shale development. [or Your name was given to me by another person I interviewed, and he/she suggested you would have experience with the impacts of Fayetteville/Barnett Shale development.] I would be really interested in talking with you. Our research team will be in ____________________ [community name] on the dates of ________, if that might fit your schedule. Or we could talk over the phone, if those dates don’t work for you. The interview will last about an hour, and will be audio-recorded with your permission.
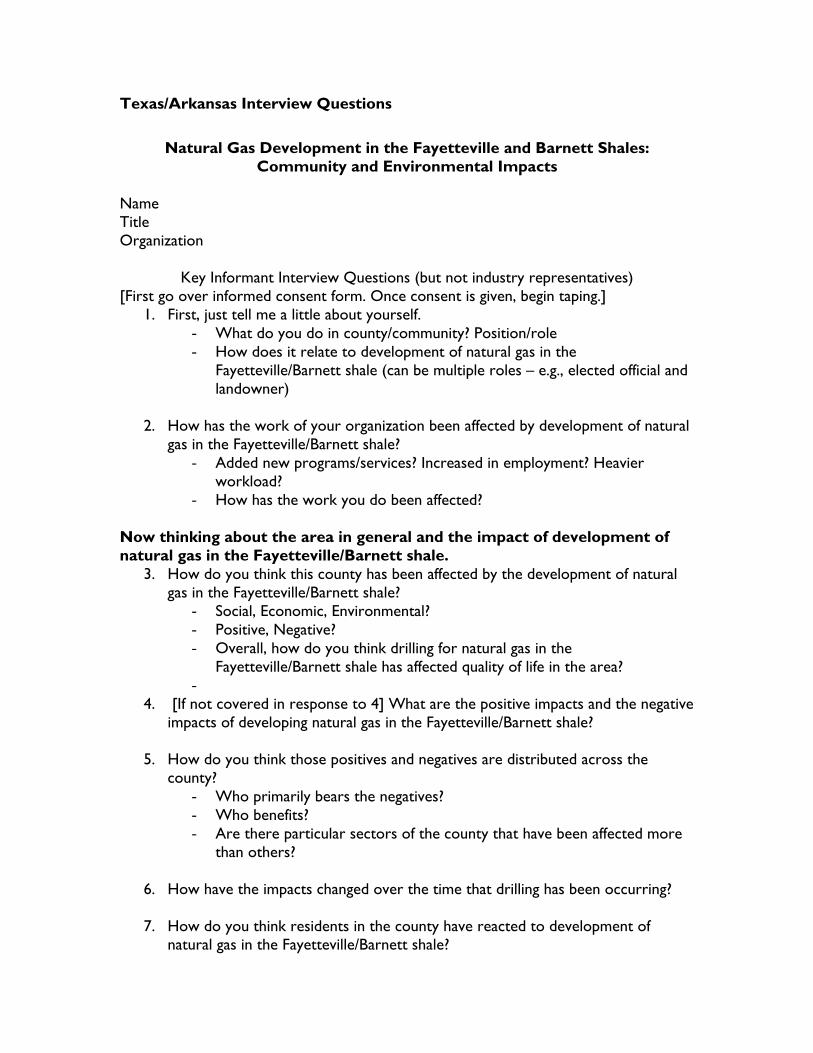
Texas/Arkansas Interview Questions
Natural Gas Development in the Fayetteville and Barnett Shales: Community and Environmental Impacts
Name Title Organization
Key Informant Interview Questions (but not industry representatives)
[First go over informed consent form. Once consent is given, begin taping.] 1. First, just tell me a little about yourself.
- What do you do in county/community? Position/role - How does it relate to development of natural gas in the
Fayetteville/Barnett shale (can be multiple roles – e.g., elected official and landowner)
2. How has the work of your organization been affected by development of natural
gas in the Fayetteville/Barnett shale? - Added new programs/services? Increased in employment? Heavier
workload? - How has the work you do been affected?
Now thinking about the area in general and the impact of development of natural gas in the Fayetteville/Barnett shale.
3. How do you think this county has been affected by the development of natural gas in the Fayetteville/Barnett shale?
- Social, Economic, Environmental? - Positive, Negative? - Overall, how do you think drilling for natural gas in the
Fayetteville/Barnett shale has affected quality of life in the area? -
4. [If not covered in response to 4] What are the positive impacts and the negative impacts of developing natural gas in the Fayetteville/Barnett shale?
5. How do you think those positives and negatives are distributed across the county?
- Who primarily bears the negatives? - Who benefits? - Are there particular sectors of the county that have been affected more
than others?
6. How have the impacts changed over the time that drilling has been occurring?
7. How do you think residents in the county have reacted to development of natural gas in the Fayetteville/Barnett shale?
- Positive/negative? - Actions? - Groups? (What are their goals?) - How effective have these groups been in accomplishing these goals? - Who are the people taking action? (Position in county)
8. How would you describe the level of trust within the community?
- Between residents and the natural gas industry? - Between residents and local government - Between residents and state government/agencies? - Between local government and the natural gas industry? - Between local organizations and the natural gas industry?
Now I want to ask some questions specific to the experiences of your organization or agency. For Local Government Officials
9. What impacts have you seen on community services, physical infrastructure, or local government itself from development of natural gas in the Fayetteville/Barnett shale?
- Have there been major land use and/or zoning changes? - How have your public works and public services programs dealt with the
change – fiscally, equipment, staffing? - Changes in economic and community development? - Crime? - Emergency services? - Social services? - And any other aspects of local government?
10. Do you have any reports or data you might be willing to share with us related to impacts of the natural gas industry on local government and its services?
For Economic Development Professionals –
11. What kinds of changes have you seen in the local business community as a result of development of natural gas in the Fayetteville/Barnett shale?
- New companies (startups, relocations)? What types? - Impacts on existing businesses? (availability of workers, expansion, spin-
offs, etc.) - What kinds of impacts have there been in terms of the workforce?
Availability? Training? Wages or salaries? 12. Do you have any reports or data you might be willing to share with us related to
economic developing in the region as affected by the natural gas industry? For Workforce Development Professionals
13. Have there been changes in workforce training programs related to development of natural gas in the Fayetteville/Barnett shale?
- Specifically related to emergency responders? (EMS/Police/Fire/Hazmat) - Changes to enrollment? Or types of people enrolling?
14. Have there been changes in how workforce training is delivered? - Staffing? Resources? - partnerships, funding, locations, techniques, outreach, etc.
15. Do you have any reports or data you might be willing to share with us related to workforce training for the natural gas industry?
For Healthcare Professionals
16. How would you describe any changes in public health related to development of natural gas in the Fayetteville/Barnett shale?
- Change in number or type of industry-related injuries or illnesses? - Change in hospital staffing? - Change in training or training needs of staff? - Change in emergency medicine and emergency management procedures? - How have allied healthcare organizations been affected? - Change in uninsured or under insured patients?
17. Have there been changes in how health care services are delivered? - Staffing? Resources? - partnerships, funding, locations, techniques, outreach, etc.
18. Do you have any reports or data you might be willing to share with us related to impacts of the natural gas industry on health care services?
For Social Service Professionals
19. How would you describe any changes in social service needs related to development of the natural gas in the Fayetteville/Barnett shale?
- Aid for low income families? - Housing needs? - Mental health needs? - Substance abuse needs? - Domestic violence needs? - New services not needed previously?
20. Have there been changes in how social services are delivered? - Staffing? Resources? - partnerships, funding, locations, techniques, outreach, etc.
21. Do you have any reports or data you might be willing to share with us related to impacts of the natural gas industry on social services?
For Emergency Response Professionals
22. How would you describe any changes in emergency response needs related to development of the natural gas in the Fayetteville/Barnett shale?
- Types of calls? - Number of calls? - 911 system?
23. Have there been changes in how emergency response services are delivered? - Staffing? Resources? - partnerships, funding, locations, techniques, outreach, etc.
24. Do you have any reports or data you might be willing to share with us related to impacts of the natural gas industry on emergency response services?
For Education Professionals 25. How would you describe any changes in education related to development of
the natural gas in the Fayetteville/Barnett shale? - Student composition? - Student educational needs? (bilingual, ESL, social service support,
counseling, etc.) - Changes in programs for students related to oil and gas industry (science,
technology, engineering, math; vocational and technical) - Student career counseling? Career choices and paths?
26. Have there been changes in how educational services are delivered? - Staffing? Resources? - partnerships, funding, locations, techniques, outreach, etc.
27. Do you have any reports or data you might be willing to share with us related to impacts of the natural gas industry on educational services?
For State Agency Personnel
28. In general, what do you think are the major impacts of drilling in the Fayetteville/Barnett shale at the state level?
- Environment and water impacts - Impacts on state agencies
• Revenue? Expenses? • Employees? • Public relations?
29. What strategies have been most useful for managing the development of the development of natural gas in the Fayetteville/Barnett shale?
- Regulations - Economic development efforts - Taxes / taxation changes - Setting up communication channels - Outreach/education
30. How responsive are the drilling companies to state regulation? 31. Do you have any reports or data you might be willing to share with us related to
impacts of the natural gas industry on state agencies and services? ALL RESPONDENTS
32. Are there some ‘lessons learned’ that you would like to share with us, as we develop ideas and recommendations for the Marcellus shale region?
- More successful strategies or approaches? These could be in your organization or others in the community.
- Priority areas to tackle first? Taxation, regulation, etc. - Strategies about how to organize and prepare locally?

33. Looking back…. Are there steps you wish you or your organization would have taken sooner, issues you would like to have prioritized differently, or actions you would like to take back?
34. Is there anything else about this topic or your specific community that we have
not discussed that you feel is important?