basic thermodynamics – module 1
TRANSCRIPT

Basic Thermodynamics – Module 1
Lecture 9: Thermodynamic Properties of Fluids
Thermodynamic Properties of fluids
Most useful properties:
Properties like pressure, volume and temperature which can be measured directly. Also viscosity, thermal conductivity, density etc can be measured.
Properties like internal energy, enthalpy etc. which cannot be measured directly
Pure Substance
A pure substance is one which consists of a single chemical species.
Concept of Phase
Substances can be found in different states of aggregation. Ice, water and steam are the three
different physical states of the same species . Based on the physical states of aggregation the substances are generally classified into three states as
a. Solid b. liquid c. gas
The different states of aggregation in which a pure substance can exist, are called its phases. Mixtures also exist in different phases. For example, a mixture of alcohol and water can exist in both liquid and vapour phases. The chemical composition of the vapour phase is generally different from that of the liquid phase.
mywbut.com
1

Generalizing the above observations, it can be said that a system which is uniform throughout both in chemical composition and physical state, is called a homogeneous substance or a phase.
All substances,-solids, liquids and gases, change their specific volume depending on the range of applied pressure and temperature.
When the changes in the specific volume is negligible as in the case of liquids and solids, the substance may be treated as incompressible.
The isothermal compressibility of a substance κ is defined as
The coefficient of volume expansion of a substance is defined as
Equations of State
Equations that relate the pressure, temperature and specific volume or molar volume of a substance. They predict the relationship of a “gas” reasonably well within selected regions.
Boyle's law:
at constant pressure
mywbut.com
2
or,
Constant at constant temperature
Charles' Law:
At constant pressure
At constant volume
Boyle's law and Charles' law can be combined to yield
Where R is the characteristic gas constant. If the specific volume is substituted by the molar volume, then R is substituted by the universal gas constant, 8.314 kJ / kmol K. Again, it can be shown that for an ideal gas .
In summary, the Ideal gas equation:
where R is the specific constant
, where is the universal gas constant (8.314 kJ / k mole K) M is the molar mass, defined as the mass of one mole of a substance. We can also write where is the molar volume.
Example: M = 28 kg / kmol for nitrogen (since its molar mass is 28)
mywbut.com
3

M =32 kg / kmol for oxygen ( O2 with a molar mass of 32)
Note: Many gases such as air, oxygen can be treated as ideal gases. However, dense gases such as water vapor and refrigerant vapor should not be treated as ideal gas. Use property table instead.
Ideal Gas
The kinetic theory of gases models a gas as a collection of elastic particles. The statistical analysis of these with some assumptions results as the ideal gas law
Most gases deviate from ideal gas in the vicinity of the critical point and saturated vapour line .
Most gases behaves like ideal gas at high temperature and low pressure regions.
Joules Experiment
Refer to figure 9.1
Figure 9.1
One of the vessels was filled in with air at 22 atm pressure and the other vessel was evacuated. The initial temperature of the water bath was measured. The valve was opened allowing air to
mywbut.com
4
occupy both the containers. The temperature of the water bath was measured again and it was found that the temperature did not change. The gas contained in both the vessels is our system. W=0 and Q=0. Since the number of moles of the gas also remains constant, it follows that
. The pressure and the volume of the gas changed and yet the internal energy did not change. Hence
So,
(9.1)
(9.2)
Since,
(9.3)
(9.4)
Van der Waal's equation of state:
The gases at low pressure and high temperatures follow ideal gas law. Gases that do not follow ideal gas law are required to be represented by a similar set of mathematical relations. The first effort was from Clausius.
Clausius Proposed
(9.5)
mywbut.com
5
Van der Waals, by applying the laws of mechanics to individual molecules, introduced two correction terms in the equation of ideal gas. Van der Waals equation of state is given by.
(9.6)
The term accounts for the intermolecular forces and b accounts for the volume occupied by the gas molecules.
Since Van der Waal's equation takes into account the inter-molecular forces, it is expected to hold good for liquid phase also. Now a days, the Van der Waal's equation is used to predict the phase equilibrium data. The constants and b are determined from experimental data. However, rearranging the Van der Waal's equation, we get
(9.7)
Therefore, a plot of P versus T at constant volume gives a straight line with a slope
and an intercept . An interesting feature can be obtained from the following form
(9.8)
For low temperature, three positive real roots exist for a certain range of pressure. As the temperature increases, the three real roots approach one another and at the critical temperature they become equal.
For only one real value of exists. three real values of exists, where is the critical temperature of the gas.
mywbut.com
6

Figure 9.2
Refer to Fig 9.2. The curve ABDEF is predicted by the Van der Waals equation of state. The curve ABDEF is practically not realizable. The physically feasible curve is the straight line path from A to F. It can be shown that the straight line AF is such that the area ABDA is exactly equal to the area DEFD for a stable system.
mywbut.com
7

Lecture 10: The Constants of Van der Waals Equation and Compressibility Chart
The Van der Waals Constants
The constants and are different for different substances. We can get the estimates of and of a substance by knowing the critical values of that substance.
Before we proceed further, let us look at the mathematical function
For the maximum value of x: and
For the minimum value of x: and
For the point of inflection, and
From the Figure 9.2 we can see that the critical point is a point of inflection.
The critical isotherm must show a point of inflection at the critical point
(10.1)
(10.2)
At the critical point, the Van der Waals equation is
(10.3)
One can solve the above three equations to obtain
(10.4)
mywbut.com
8

Alternatively, one can calculate the Van der Waals constants and in terms of critical constants.
(10.5)
The constants and can be determined for any substance from the critical point data (Table
10-1) At the critical point, one can see that
(10.6)
Table 10.1 Some typical values of Van der Waals constants
Gas Constants kPa (m3/ kmol)2
Constants ( m3/ kmol )
Air 135.8 0.0364
Ammonia (NH3 ) 423.3 0.0373
Carbon-dioxide(CO2 ) 364.3 0.0427
Hydrogen (H2 ) 24.7 0.0265
Oxygen (O2 ) 136.9 0.0315
Nirtogen (N2 ) 136.1 0.0385
Virial Equations of State
mywbut.com
9

For any gas, we can write
(10.7)
or,
(10.8)
An alternate expression is
(10.9)
Both expressions are known as virial expansions introduced by Kamerlingh Onnes. etc are called virial coefficients. and are called second virial coefficients, and are called third virial coefficients and so on. For a given gas, these coefficients are functions of temperature only.
Compressibility Chart
To quantify deviation of real behavior from the ideal gas behavior, we introduce a new term namely, the compressibility factor. The compressibility factor Z is defined as the ratio of the actual volume to the volume predicted by the ideal gas law at a given temperature and pressure.
Z = (Actual volume) / (volume predicted by the ideal gas law)
(10.10)
If the gas behaves like an ideal gas, Z =1 at all temperatures and pressures. A plot of Z as a function of temperature and pressure should reveal the extent of deviation from the ideal gas law. Figure 10.1 shows a plot of Z as a function of temperature and pressure for N2.
mywbut.com
10

Figure 10.1
For each substance, a compressibility factor chart or compressibility chart is available.
Figure 10.2
It would be very convenient if one chart could be used for all substances. The general shapes of the vapour dome and of the constant temperature lines on the plane are similar.
mywbut.com
11

This similarity can be exploited by using dimensionless properties called reduced properties. The reduced pressure is the ratio of the existing pressure to the critical pressure of the substance and the same is followed for the reduced temperature and reduced volume. Then
(10.11)
At the same temperature and pressure, the molar volumes of different gases are different. However, it is found from experimental data that at the same reduced pressure and reduced temperature, the reduced volumes of different gases are approximately the same.
Therefore for all substances
(10.12)
or,
(10.13)
Where is called critical compressibility factor? Experimental values of
for most substance fall within a narrow range 0.2-0.3. Therefore from the above equation we can write
(10.14)
When Z is plotted as a function of reduced pressure and , a single plot, known as general compressibility chart (Figure 10.2) is found to be satisfactory for a wide variety of substances. Although necessarily approximate, the plots are extremely useful in situations where detailed data on a particular gas are lacking but its critical properties are available.
mywbut.com
12

Lecture 11: Phase-Change Process of Pure Substances
There are certain situations when two phases of a pure substance coexist in equilibrium. As a commonly used substance water may be taken up to demonstrate the basic principles involved. However, all pure substances exhibit the same general behavior.
We shall remember the following definitions:
Saturated State: A state at which a phase change begins or ends
Saturation Temperature: Temperature at which phase change (liquid-vapour) begins or ends at a given pressure
Saturation Pressure: It is the pressure at which phase change begins or ends at a specified temperature.
Saturated Liquid: It is the substance at which is fully liquid (no-vapour).
Saturated Vapour: It is the substance at which is fully vapour (no-liquid).
Subcooled liquid: If the temperature of the liquid (T) is less then then the liquid is called sub-cooled liquid.
Superheated vapour: If the temperature of the vapour (T) is greater than then the vapour is called superheated vapour.
Graphical Representation of Data for Pure Substances
mywbut.com
13
The commonly used thermodynamic diagrams are
a. Pressure versus Temperature ( P − T )
b. Pressure versus Volume ( P − )
c. Temperature versus Volume (T − )
d. Temperature versus entropy ( T − S )
e. Enthalpy versus entropy ( h − S )
f. Pressure versus enthalpy ( P − h )
(a) Pressure-Temperature Diagram
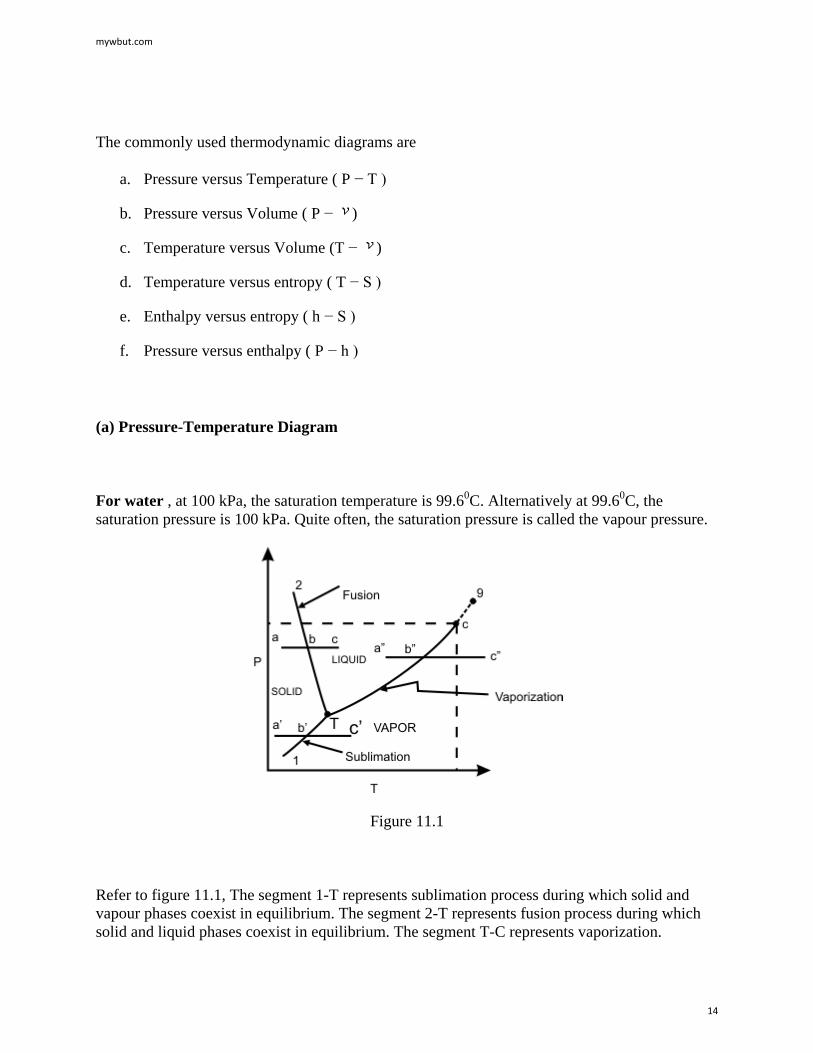
For water , at 100 kPa, the saturation temperature is 99.60C. Alternatively at 99.60C, the saturation pressure is 100 kPa. Quite often, the saturation pressure is called the vapour pressure.
Figure 11.1
Refer to figure 11.1, The segment 1-T represents sublimation process during which solid and vapour phases coexist in equilibrium. The segment 2-T represents fusion process during which solid and liquid phases coexist in equilibrium. The segment T-C represents vaporization.
mywbut.com
14

Sublimation curve 1-T separates solid and vapour. 2-T separates solid and liquid and T-C separates liquid and vapour. Three curves meet at T, which is called the triple-point, where all the three phases-solid, liquid and vapour coexist in equilibrium. At the triple point no thermodynamic property of the system can be varied independently. The system is said to be invariant.
Along, 1-T, or T-C, the system is univariant, that is only one thermodynamic property of the system can be varied independently. The system is bivariant in the single phase’s region.
The curve 2-T can be extended indefinitely, the curve T-C terminates at point C which is called the critical point.
The critical point represents highest temperature and pressure at which both the liquid phase and vapour phase can coexist in equilibrium.
At the critical point, the specific volumes and all other thermodynamic properties of the liquid phase and the vapour phase are identical.
and are called the critical temperature and critical pressure, respectively. If the substance exist as a liquid on the curve T−C, it is called saturated liquid, and if it exists as a vapour, it is called a saturated vapour. Under the constant pressure, the line abc indicates melting, - sublimation and - vaporization.
(b) Diagram
Refer to the diagram as shown in Figure 11.2.
mywbut.com
15

Figure 11.2
The isotherm is at a temperature greater than the critical temperature . The isotherms
and are at temperatures less than the critical temperature and they cross the phase boundary. The point C represents the critical point. The curve AC is called the saturated liquid line; and the curve CB is called the saturated vapour line. The area under the curve ACB is the two-phase region where both liquid and vapour phase are present. Left to the curve AC is the liquid region. Region to the right of curve CB is the vapour region
The isotherm appears in three segments: DE, EF and FG. DE is almost vertical, because the change in the volume of liquid is very small for a large change in pressure. The segment FG is less steep because vapour is compressible. Segment EF is horizontal, because the phase change from liquid to vapour occurs at constant pressure and constant temperature for a pure substance. EF represents all possible mixtures of saturated liquid and saturated vapour. The total volume of the mixture is the sum of the volumes of the liquid and vapour phases.
(11.1)
Dividing by the total mass m of the mixture, m an average specific volume for mixture is obtained
(11.2)
Since the liquid phase is a saturated liquid and the vapour phase is a saturated vapour,
mywbut.com
16

(11.3)
so,
(11.4)
Introducing the definition of quality or dryness fraction and noting that
the above expression becomes
(11.5)
The increase in specific volume due to vaporization is often denoted by
(11.6)
Again we can write
(11.7)
or,
(11.8)
or,
(11.9)
Known as lever rule. At the critical point, the specific volumes and all other thermodynamic properties of the liquid phase and the vapour phase are identical.
(c) Diagram
mywbut.com
17

Refer to diagram shown in Fig 11.3. Let us consider constant pressure heating of liquid water in a cylinder-piston assembly. If the water is initially at state 1, on heating at constant pressure, the temperature and the specific volume of the water increase and follows the path 1-2 as shown in Fig 11.3(a).
Figure 11.3
At point 2 vaporization starts. The vaporization process is represented by 2-3. During vaporization, temperature and pressure remain constant. The point 3 represents saturated vapour. Further heating produces super heated vapour, which is vapour above its saturation temperature at the specified pressure. If the constant pressure heating is done at several different pressures, the resulting temperature-volume diagram becomes as it is shown in Fig 11.3 (b). The curve AC represents saturated liquid line and the curve BC represents the saturated vapour line.
(d) T-s diagram
Let us refer to the T-s diagram shown in Figure 11.4
mywbut.com
18

Figure 11.4
(e) Enthalpy-entropy diagram or Mollier diagram.
Refer to figure 11.5 which is known as h-s diagram.
mywbut.com
19

Heat interaction in an isobaric process is equal to change in enthalpy of the system.
For a flow process (will be discussed later) the work done by an adiabatic device is equal to the decrease in enthalpy of the flowing fluid.
A throttling process is an isenthalpic process. A throttling process is a process in which a fluid flows from a region of high pressure to a region of low pressure without exchanging energy as heat or work.
A reversible adiabatic process is an isentropic process.
Specific internal energy and enthalpy
or,
[on a unit mass basis]
or,
[on per mole basis]
Data for specific internal energy, u and enthalpy, h can be calculated from the property tables in the same way as for specific volume.
(11.10)
Increase in specific internal energy is often denoted by The specific enthalpy is
(11.11)
mywbut.com
20

Increase in specific enthalpy is often denoted by .
Steam Tables
Two Saturated steam tables
Saturated Steam Pressure Table Saturated Steam Temperature Table
Similar tables can exist for any pure substance (e.g. Freon 12)
Saturated Steam: Pressure Table (kJ/kg)
P T (m3/kg) h (kJ/kg) s (kJ/kg k) (bar) (0c)
0.01 6.98 0.05 32.90 0.10 45.83
. .
. .
. . 2.0 120.23
In this table pressure is selected as the independent variable.
Saturated Steam: Temperature Table
T P h s ( oc) (bar)
0 6.1×10⁻³ 2 4 . . . . . .
374.15 221.2
mywbut.com
21
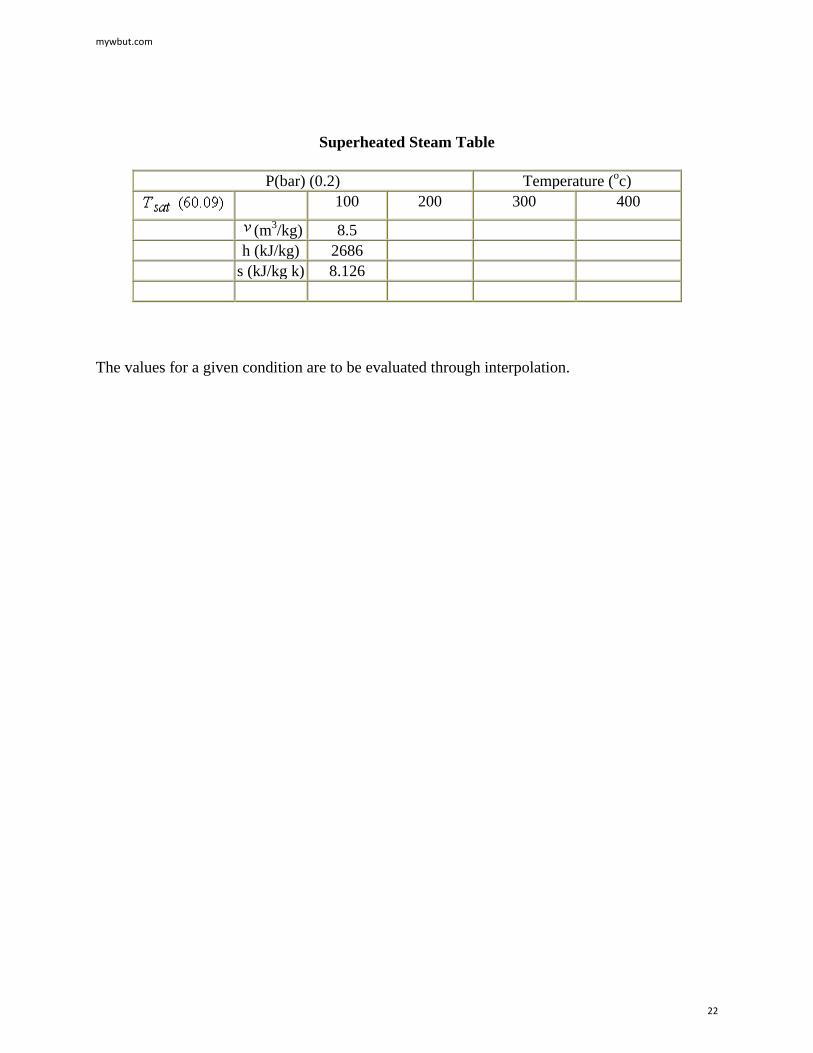
Superheated Steam Table
P(bar) (0.2) Temperature (oc)
100 200 300 400
(m3/kg) 8.5 h (kJ/kg) 2686 s (kJ/kg k) 8.126
The values for a given condition are to be evaluated through interpolation.
mywbut.com
22