bathymetric controls on calving processes at pine island
TRANSCRIPT

The Cryosphere, 12, 2039–2050, 2018https://doi.org/10.5194/tc-12-2039-2018© Author(s) 2018. This work is distributed underthe Creative Commons Attribution 4.0 License.
Bathymetric controls on calving processes at Pine Island GlacierJan Erik Arndt1, Robert D. Larter2, Peter Friedl3, Karsten Gohl1, Kathrin Höppner3, and the Science Team ofExpedition PS104*
1Alfred Wegener Institute Helmholtz Centre for Polar and Marine Research, Am Handelshafen 12,27570 Bremerhaven, Germany2British Antarctic Survey, High Cross Madingley Road, Cambridge, CB3 0ET, UK3German Aerospace Center (DLR), German Remote Sensing Data Center, Oberpfaffenhofen,Münchener Str. 20, 82234 Wessling, Germany*A full list of authors and their affiliations appears at the end of the paper.
Correspondence: Jan Erik Arndt ([email protected])
Received: 27 November 2017 – Discussion started: 12 January 2018Revised: 27 April 2018 – Accepted: 10 May 2018 – Published: 15 June 2018
Abstract. Pine Island Glacier is the largest current Antarcticcontributor to sea-level rise. Its ice loss has substantially in-creased over the last 25 years through thinning, accelerationand grounding line retreat. However, the calving line posi-tions of the stabilising ice shelf did not show any trend withinthe observational record (last 70 years) until calving in 2015led to unprecedented retreat and changed the alignment of thecalving front. Bathymetric surveying revealed a ridge belowthe former ice shelf and two shallower highs to the north.Satellite imagery shows that ice contact on the ridge waslikely lost in 2006 but was followed by intermittent contactresulting in back stress fluctuations on the ice shelf. Continu-ing ice-shelf flow also led to occasional ice-shelf contact withthe northern bathymetric highs, which initiated rift formationthat led to calving. The observations show that bathymetry isan important factor in initiating calving events.
1 Introduction
Ice loss from Pine Island Glacier (PIG) currently provides thelargest contribution to sea-level rise from any single Antarc-tic glacial outlet (Shepherd et al., 2012). Ice losses from PIGand neighbouring outlets in the eastern Amundsen Sea em-bayment, which collectively drain about a third of the WestAntarctic Ice Sheet, now account for about 5–10 % of cur-rent global mean sea-level rise (Shepherd et al., 2012; Rig-not et al., 2008; Lee et al., 2012). Remote sensing data showthat ice loss in this sector has increased greatly over the past
25 years through ice thinning and flow acceleration, which istriggered by thinning of the floating ice shelves at rates be-tween 3.9 and 5.3 m yr−1 (Rignot, 2008; Rignot et al., 2008,2014; Pritchard et al., 2009; Wingham et al., 2009). Inte-gration of remote sensing data with oceanographic observa-tions shows that this thinning results from enhanced basalmelting driven by incursion of relatively warm CircumpolarDeep Water (CDW) onto the continental shelf (Jacobs et al.,1996, 2011; Pritchard et al., 2012; Nakayama et al., 2013;Dutrieux et al., 2014a). Precise dating of changes in sedi-ment cores recovered beneath the PIG ice shelf indicates thatthe present phase of thinning and retreat was initiated in the1940s (Smith et al., 2017), which is consistent with the hy-pothesis that CDW incursion increased at this time, drivenby wind stress changes associated with a large El Niño eventbetween 1939 and 1942 (Steig et al., 2012). In the 1990s thegrounding line of PIG was located on a ridge in the bed whichrises to 700–800 m below sea level along its crest (Rignot etal., 2014; Joughin et al., 2016). Between 1992 and 2011 thegrounding line retreated 31 km at the centre of PIG, migrat-ing to a position on the bed 400 m deeper than in 1992 (Rig-not et al., 2014), after which the retreat stagnated (Konrad etal., 2018). Upstream of this grounding line position the bedsteadily increases in depth for more than 200 km (Fig. S3 inthe Supplement, Fretwell et al., 2013). Glaciological theoryand ice sheet models imply that grounding lines are unstableon these upstream-deepening beds (Favier et al., 2014; Katzand Worster, 2010; Weertman, 1974; Schoof, 2007), raisingthe prospect of runaway retreat along the trunk of PIG. Ice
Published by Copernicus Publications on behalf of the European Geosciences Union.

2040 J. E. Arndt et al.: Bathymetric controls on calving processes at Pine Island Glacier
shelves downstream of the grounding line have a buttressingeffect on the grounded portion of marine-based ice streamsand, therefore, are an important factor in maintaining the up-stream glacier stability (Schoof, 2007; Gudmundsson, 2013).Fürst et al. (2016) showed that 87.9 % of the ice shelf at thedownstream end of PIG provides back stress to the upstreamglacier, highlighting that even small changes in calving be-haviour may affect the upstream glacier here.
Despite the thinning and flow acceleration of PIG andsustained, rapid thinning of the ice shelf over at least thepast 25 years, the position of the ice front had not shownany clear trend over 68 years of observations prior to 2015(Bindschadler, 2002; MacGregor et al., 2012; Rignot, 2002;Fig. 1). In 2011 a rift developed that 2 years later, in Novem-ber 2013, resulted in calving of the 720 km2 iceberg B-31(Bigg et al., 2014). This calving front remained in an ori-entation similar to that of calving fronts throughout previ-ous decades, which were consistently aligned 10–30◦ eastof north (Rignot, 2002; MacGregor et al., 2012). Less than2 years later, in August 2015, another major calving event(580 km2 area) resulted in retreat of the northern part of theice front to a position a further ∼ 15 km upstream of whereit had been after the 2013 calving, representing the most re-treated ice front position observed up until that time (Jeonget al., 2016). The August 2015 event occurred along rift R1,which had first been identified together with another, parallelrift, R2, in 2013–2014 (Jeong et al., 2016) and also resultedin a realignment of the calving front to 55◦ east of north. Thisnew retreated and realigned calving line location has beenrecently reconfirmed by a calving event in September 2017(280 km2 area) that resulted in a calving front location nearlyidentical to the one in 2015 (Fig. 1).
The recent retreat of the calving front presented an oppor-tunity during the research cruise PS104 on RV Polarstern inFebruary 2017 to survey the bathymetry of a ∼ 370 km2 areathat had previously been covered by the ice shelf throughoutthe period for which observational records exist. This areaincluded a bathymetric high on which the northern part ofthe PIG ice shelf was pinned in the past, as previously recog-nised (Bindschadler, 2002; Rignot, 2002). Although the ex-istence of the pinning point was recognised, details of thebathymetry beneath the ice shelf remained poorly known,hampering the investigation of the relation between ice-shelfcavity bathymetry and calving. This is a more widespreadproblem as until recently the only reliable way of determin-ing bathymetry beneath ice shelves was by seismic sounding,which requires considerable logistical investment even to ob-tain soundings at a spacing of several kilometres (e.g. Bris-bourne et al., 2014). Two expeditions over the past decadehave collected bathymetry data beneath Pine Island Glacierfrom autonomous underwater vehicles, but the data are lim-ited to the vicinity of widely spaced survey lines and onlycover a small fraction of the cavity area (Jenkins et al.,2010; Davies et al., 2017). Here we present continuous multi-beam bathymetry data from the newly exposed area at the
front of PIG together with satellite synthetic aperture radar(SAR) and optical imagery and use this unique combinationof highly resolved data to investigate the role of the pinningpoint and other bathymetric features in the calving develop-ment of the PIG ice shelf.
2 Methods
2.1 Swath bathymetry
Swath bathymetric data of RV Polarstern research cruisePS104 have been acquired with the hull-mounted TeledyneHydrosweep DS3 system. This system uses a transmittingfrequency of 15.5 kHz and has 0.2 % of the water depth ver-tical measurement accuracy in the centre beam and up to0.5 % of the water depth for the outer beams. The data wereprocessed, sound-velocity corrected and edited for outlierswith the CARIS HIPS and SIPS software. The sound velocityprofile used was obtained from a conductivity-temperature-depth cast carried out nearby shortly before the survey. Datagridding was performed at 25 m resolution with a weightedmoving average gridding algorithm in the software QPS Fle-dermaus.
2.2 Remote sensing
Satellite data acquired with different SAR sensors onboard the European Remote Sensing Satellite 2 (ERS-2),RADARSAT-1, the Advanced Land Observing Satellite 1(ALOS-1), Envisat, TerraSAR-X, TanDEM-X and Sentinel-1A/B as well as data from the optical Advanced SpaceborneThermal Emission and Reflection Radiometer (ASTER)were used in order to derive a time series of images from2002 to 2017 over the region near the bathymetric ridge (Ta-ble 1). For the SAR data, intensity images were extractedfrom data acquired in single-look complex (SLC) format. Inorder to obtain roughly square pixels on the ground and toreduce speckle noise, multi-looking was performed by ap-plying sensor-dependent multi-look factors to the range andazimuth direction (Table 1). The resulting multi-look inten-sity (MLI) images were radiometrically calibrated, geocodedand orthorectified. For orthorectification the Bedmap2 digitalelevation model (Fretwell et al., 2013) resampled to a 100 mspatial resolution served as a source of topographic informa-tion.
2.3 Ice thickness data
We considered trying to estimate the time of ice-shelf contactloss with the bathymetric high by comparing the bathymetrydata to ice-shelf thickness measurements. However, thick-ness estimates from radar surveys (Vaughan et al., 2012)and those calculated from the ice-shelf freeboard measuredby satellite altimetry (Chuter and Bamber, 2015; Griggs andBamber, 2011) show differences up to ∼ 100 m. These dif-
The Cryosphere, 12, 2039–2050, 2018 www.the-cryosphere.net/12/2039/2018/
J. E. Arndt et al.: Bathymetric controls on calving processes at Pine Island Glacier 2041
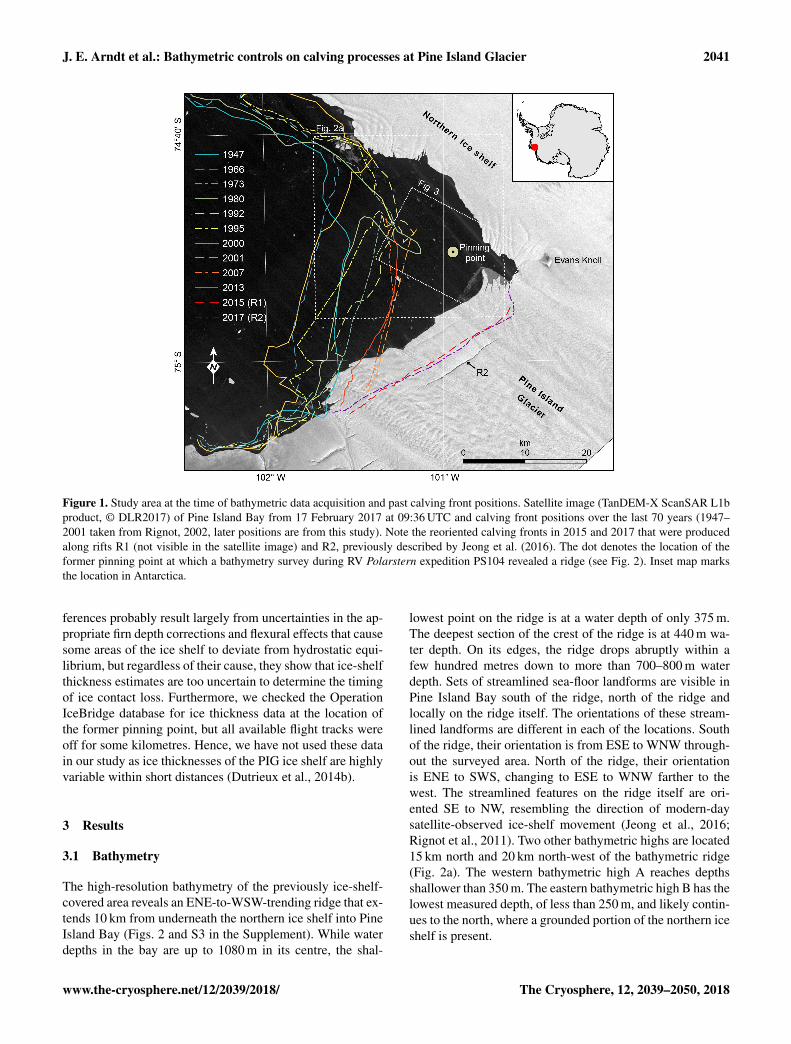
Figure 1. Study area at the time of bathymetric data acquisition and past calving front positions. Satellite image (TanDEM-X ScanSAR L1bproduct, © DLR2017) of Pine Island Bay from 17 February 2017 at 09:36 UTC and calving front positions over the last 70 years (1947–2001 taken from Rignot, 2002, later positions are from this study). Note the reoriented calving fronts in 2015 and 2017 that were producedalong rifts R1 (not visible in the satellite image) and R2, previously described by Jeong et al. (2016). The dot denotes the location of theformer pinning point at which a bathymetry survey during RV Polarstern expedition PS104 revealed a ridge (see Fig. 2). Inset map marksthe location in Antarctica.
ferences probably result largely from uncertainties in the ap-propriate firn depth corrections and flexural effects that causesome areas of the ice shelf to deviate from hydrostatic equi-librium, but regardless of their cause, they show that ice-shelfthickness estimates are too uncertain to determine the timingof ice contact loss. Furthermore, we checked the OperationIceBridge database for ice thickness data at the location ofthe former pinning point, but all available flight tracks wereoff for some kilometres. Hence, we have not used these datain our study as ice thicknesses of the PIG ice shelf are highlyvariable within short distances (Dutrieux et al., 2014b).
3 Results
3.1 Bathymetry
The high-resolution bathymetry of the previously ice-shelf-covered area reveals an ENE-to-WSW-trending ridge that ex-tends 10 km from underneath the northern ice shelf into PineIsland Bay (Figs. 2 and S3 in the Supplement). While waterdepths in the bay are up to 1080 m in its centre, the shal-
lowest point on the ridge is at a water depth of only 375 m.The deepest section of the crest of the ridge is at 440 m wa-ter depth. On its edges, the ridge drops abruptly within afew hundred metres down to more than 700–800 m waterdepth. Sets of streamlined sea-floor landforms are visible inPine Island Bay south of the ridge, north of the ridge andlocally on the ridge itself. The orientations of these stream-lined landforms are different in each of the locations. Southof the ridge, their orientation is from ESE to WNW through-out the surveyed area. North of the ridge, their orientationis ENE to SWS, changing to ESE to WNW farther to thewest. The streamlined features on the ridge itself are ori-ented SE to NW, resembling the direction of modern-daysatellite-observed ice-shelf movement (Jeong et al., 2016;Rignot et al., 2011). Two other bathymetric highs are located15 km north and 20 km north-west of the bathymetric ridge(Fig. 2a). The western bathymetric high A reaches depthsshallower than 350 m. The eastern bathymetric high B has thelowest measured depth, of less than 250 m, and likely contin-ues to the north, where a grounded portion of the northern iceshelf is present.
www.the-cryosphere.net/12/2039/2018/ The Cryosphere, 12, 2039–2050, 2018

2042 J. E. Arndt et al.: Bathymetric controls on calving processes at Pine Island Glacier
Table 1. SAR and optical satellite imagery used in this study.
SAR imagery
Platform Sensor Mode SAR band Time interval Multi-look factors MLI spatial(yyyy-mm-dd) (range × azimuth) resolution (m)
ERS-2 AMI SAR IM C-band 2004-10-162010-12-04
1 × 5 ∼ 20 m
Envisat ASAR IM C-band 2006-02-052009-10-18
1 × 5 ∼ 20 m
ALOS PALSAR FBS L-band 2006-11-042007-12-29
1 × 3 ∼ 10 m
RADARSAT-1 SAR Standard C-band 2007-03-012008-04-29
1 × 4 ∼ 20 m
TerraSAR-X/ TanDEM-X SAR SM X-band 2011-09-212014-08-28
5 × 5 ∼ 10 m
Sentinel-1A/B SAR IW C-band 2014-10-102017-09-24
5 × 1 ∼ 20 m
Optical imagery
Platform Sensor Time interval (yyyy-mm-dd) Spatial resolution (m)
Terra ASTER (VNIR) 2005-01-032013-02-17
15 m
3.2 Ice-shelf contact with the bathymetric ridge
Analysis of the satellite data shows that an ice rumple waspresent at the location of the shallowest part of the bathymet-ric ridge in the past (Fig. 3; see also Movie S1 in the Supple-ment). These rumples were previously observed in Landsatimages between January 1973 and January 2001 by Bind-schadler (2002), who also described rifts oriented perpendic-ular to ice-shelf flow forming immediately downstream ofthe rumple. Three of these ∼ 3 km long rifts are still observedabout 5 km downstream in an image collected in March 2002(Fig. 3a), but since then no intense rifting has been observedand only more subtle rifts are detected downstream of therumple. However, in images collected over the following 3years, the ice rumple continues to be observed above thebathymetric ridge and irregularities in the ice surface orig-inating there are carried downstream, indicating continuedice-shelf contact. The ice rumple is observed for the last timein March 2005 (Fig. 3b). A rift oriented in a NNW–SSE di-rection above the bathymetric ridge is visible in January 2006(Fig. 3c). Similar rifting is not visible on younger satelliteimages. Therefore, this indicates that the ice shelf thinnedsufficiently so that either ice contact became too light to pro-duce imprints on the ice surface or that the ice shelf did notground at all any more.
In the time since reduced ice contact was documented, icerifting increasingly took place further to the east near EvansKnoll with rifts predominantly being oriented in the N–S di-rection. In the last years before the 2015 calving event, therifted northern margin flowed across the bathymetric ridge
with no indication of ice contact at the ice surface (Fig. 3d).However, an iceberg grounded on top of the bathymetricridge after the calving event indicates that at least weak orintermittent ice contact was active before the calving event.
3.3 Calving events
Since the last evident ice contact between the ice shelf andbathymetric ridge was visible on the ice surface in 2006,four major calving events took place at PIG (Figs. 4 and 5).In 2007, the calving front was located approximately 8 kmwest of the pinning point and produced a curved calving line(Fig. 4a). At the time of rift initiation, the northern front ofthe PIG ice shelf moved above bathymetric high A. Fouryears later, in 2011, a similar rift with a curved shape ap-peared further to the east, this time only 2 km west of thepinning point (Fig. 4b). At this time, very dense ice mélangeconsisting of thick fragments of the rifted PIG margin and ofthe northern ice shelf was present north-west of the rift be-tween bathymetric high B and PIG. The rift further openedfrom north to south and led to calving of iceberg B-31 in2013. In the same year, an ice mélange developed north ofthe bathymetric ridge between PIG ice shelf and the north-ern ice shelf, along the downstream projection of PIG’s lat-eral shear zone, and remained present until it disintegrated in2014 and early 2015, immediately prior to the 2015 calvingevent (Jeong et al., 2016; see also Movie S2 in the Supple-ment). The calving occurred along one of the pair of rifts(R1) that had appeared in the ice shelf 1–2 years earlier(Jeong et al., 2016) and produced a calving front located eastof the former pinning point that was linear and aligned 55◦
The Cryosphere, 12, 2039–2050, 2018 www.the-cryosphere.net/12/2039/2018/

J. E. Arndt et al.: Bathymetric controls on calving processes at Pine Island Glacier 2043
Figure 2. Bathymetry of submarine ridge and adjacent sea floor at 25 m grid resolution. (a) Hill-shaded plan view with 350, 400 and 450 mcontours. Note the shoal areas in the north-west, labelled A and B. Palaeo-ice flow inferred from drumlins and lineations are shown bywhite arrows, and direction of recent ice-shelf flow is shown by dashed arrows. Light blue area delineates ice-covered area at time of dataacquisition as shown in Fig. 1. (b) 3-D view of submarine ridge showing subtle lineaments oriented in the same direction as recent ice-shelfflow on its crest.
east of north (Fig. 4c). The calved iceberg rapidly broke apartwithin a month. Icebergs originating from the southern partof the ice shelf immediately drifted westward out of the re-gion. The northern iceberg (∼ 115 km2), however, remainedabove the bathymetric ridge for a year, slowly rotating 90◦
in a clockwise direction around a point on the high duringthis time (Fig. 4c and Movie S2). Two years later, in Septem-ber 2017, calving occurred along rift R2 (Fig. 5). The newcalving front varied by less than 1 km from the calving lineposition of the 2015 event. Immediately before the calving,the ice-shelf front was still > 4 km south-east of the bathy-metric ridge. The calved iceberg broke apart into > 15 parts
(each ≤ 50 km2) within only 2 months. A new rift R3, lo-cated approximately 4 km upstream of the calving line witha similar orientation to R1 and R2, became visible for thefirst time in a satellite image taken on the 13 October 2017(inset of Fig. 5).
4 Discussion
The streamlined morphology visible in the new bathymetrydata resembles drumlins and glacial lineations as discoveredin other formerly glaciated areas. These features were pro-
www.the-cryosphere.net/12/2039/2018/ The Cryosphere, 12, 2039–2050, 2018

2044 J. E. Arndt et al.: Bathymetric controls on calving processes at Pine Island Glacier
Figure 3. Time series of ASTER satellite images taken from the area of the submarine ridge. Lines indicate depth contours of 350 m (darkred), 400 m (light red) and 450 m (blue). (a) Taken on 28 March 2002; note the ice rumple on top of the ridge. (b) Taken on 1 March 2005;note continued ice rumple and increased rifting in the east. (c) Taken on 18 January 2006; note the rift forming on top of the ridge. (d) Takenon 10 February 2013; note the absence of ice irregularities on top of the ridge, continuous intense rifting to its east and ice mélange to itsnorth.
duced by past ice movement with their orientation indicatingthe direction of ice flow at the time (Graham et al., 2009).The drumlins and lineations located in the deeper parts adja-cent to the ridge show a converging flow of ice west of theridge (Fig. 2a). In the southern part of the newly surveyedarea, ice originated from PIG. In the northern part ice orig-inated from a tributary located north of Evans Knoll. Datedsediment cores located ∼ 100 km downstream of the mod-ern grounding line in inner Pine Island Bay suggests thatthe grounding line retreated from this position before at least11.7 cal kyr BP (Hillenbrand et al., 2013). Rapid thinning ofPIG at around 8 cal kyr BP has been documented by investi-gation of cosmogenic exposure ages of rocks from the hinter-land (Johnson et al., 2014). Hence, a grounded ice stream set-ting forming drumlins and lineations in the deep sections ofthe trough was likely last active before about 8 ka. The linea-ments on the bathymetric ridge, however, were likely formedat a later stage, when the ice sheet had further thinned andretreated, as indicated by their slightly different orientation.This angle coincides with the modern-day ice-flow directionof PIG ice shelf and implies that the lineaments probablyformed by the ice shelf while it remained grounded on theridge until the ice shelf sufficiently thinned or retreated. Nev-ertheless, we cannot rule out that multiple glacial cycles wereneeded to form these lineaments, as the ridge crest probablyconsists of resistant bedrock. Therefore, the lineaments alter-natively may represent the average ice-flow direction duringthese glacial cycles.
Pinning point loss probably resulted from rapid thinningof the ice shelf that has occurred over the past two decades,exceeding 5 m yr−1 in recent years (Pritchard et al., 2012;Rignot et al., 2013). The time series of satellite imagery sug-gests that the ice shelf lost contact with the shallowest partof the bathymetric ridge at some time in 2006, or at leastcontact was too weak after that to produce a surface ex-pression (Fig. 3). Weak or intermittent ice contact was alsostill present until the 2015 calving event, when a calved ice-berg remained stationary on top of the ridge for about ayear (Fig. 4c and Movie S2). These circumstances providea relatively good timing constraint for the loss of ice-shelfcontact. Hence, the glacial lineations located on top of thebathymetric ridge formed, or at least ice covered, until thelast decade, making them some of the youngest submarineglacial landforms mapped in Antarctica. In addition, this de-tailed chronological information makes the bathymetric ridgea possible target to study benthic biological recolonisation(Gutt et al., 2011) in the Pacific realm of West Antarctica.
Since 2006 four major calving events have taken place atPIG in 2007, 2013, 2015 (Fig. 4) and 2017 (Fig. 5). Theseevents were different in comparison to calving events before.The 2007 and 2013 calving events occurred for the first timealong curved calving lines, which had not been observed be-fore (Fig. 1). The 2015 event resulted in the most retreatedcalving position observed and reorientation of the calvingfront to 55◦ east of north, which is 25 to 45◦ clockwise incomparison to previous calving fronts (Fig. 1). The calving
The Cryosphere, 12, 2039–2050, 2018 www.the-cryosphere.net/12/2039/2018/

J. E. Arndt et al.: Bathymetric controls on calving processes at Pine Island Glacier 2045
Figure 4. Time series of satellite images taken shortly before or after iceberg calving events of Pine Island Glacier that took place after 2006when last imprints of ice contact with the bathymetric ridge were observed. Lines indicate depth contours of 350 m (dark red), 400 m (lightred) and 450 m (blue). (a) ERS image taken on 6 October 2007; note the curved calving line that is induced by back stress affecting thenorthern part of PIG ice shelf as a result of ice contact with the shallow bathymetry at A. (b) Aster image taken on 22 December 2011; notethe curved calving line that is probably induced by dense iceberg mélange being trapped between the northern ice shelf near bathymetrichigh B and Pine Island Glacier. (c) TanDEM-X-SAR image (© DLR2015) taken on 30 August 2015; note the 1–2 km sized icebergs stuckon shallow bathymetry in top left corner and the stationary large iceberg located on top of the bathymetric ridge.
front also reverted to being straight, and this reorientationand straight shape were reconfirmed by the 2017 event. Pin-ning point loss results in reduced back stress to the ice shelfthrough reduction of basal drag (Favier et al., 2014) and thetopography of an ice-shelf cavity is important for an internal
water exchange (De Rydt et al., 2014). Therefore, in the fol-lowing we evaluate how the bathymetric ridge and the twohighs A and B affected the development of the PIG ice shelf.
Less than a year after imprints of ice contact with thebathymetric ridge had been imaged in satellite data for the
www.the-cryosphere.net/12/2039/2018/ The Cryosphere, 12, 2039–2050, 2018
2046 J. E. Arndt et al.: Bathymetric controls on calving processes at Pine Island Glacier
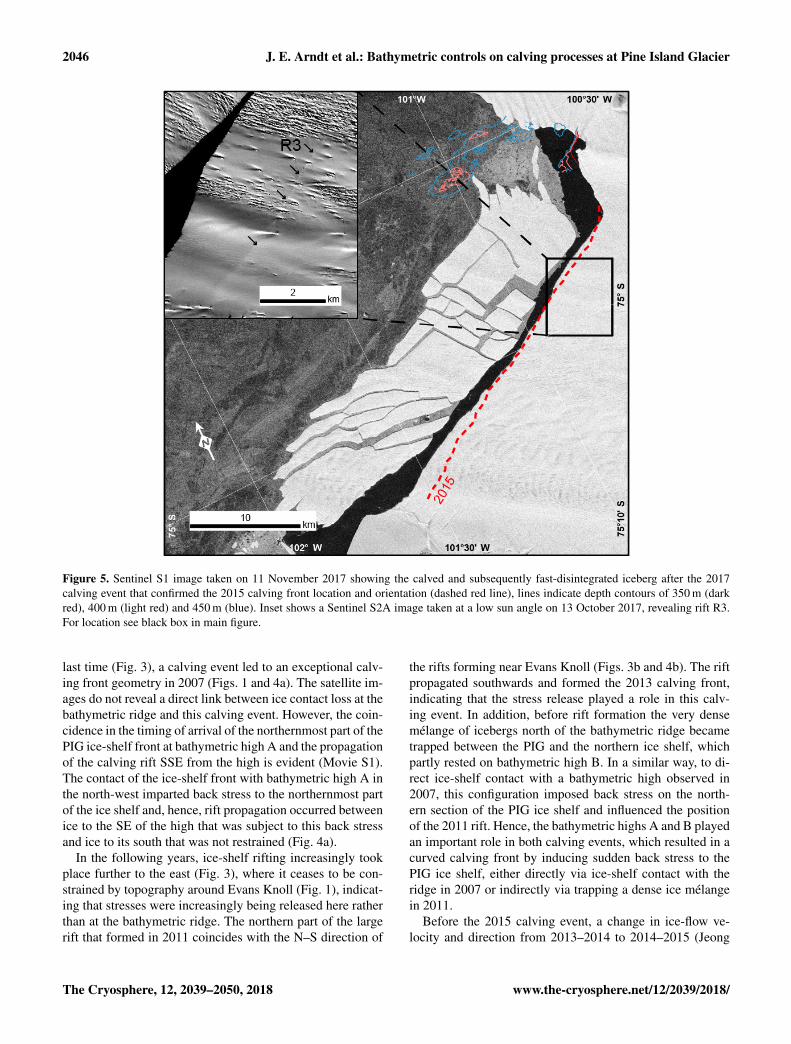
Figure 5. Sentinel S1 image taken on 11 November 2017 showing the calved and subsequently fast-disintegrated iceberg after the 2017calving event that confirmed the 2015 calving front location and orientation (dashed red line), lines indicate depth contours of 350 m (darkred), 400 m (light red) and 450 m (blue). Inset shows a Sentinel S2A image taken at a low sun angle on 13 October 2017, revealing rift R3.For location see black box in main figure.
last time (Fig. 3), a calving event led to an exceptional calv-ing front geometry in 2007 (Figs. 1 and 4a). The satellite im-ages do not reveal a direct link between ice contact loss at thebathymetric ridge and this calving event. However, the coin-cidence in the timing of arrival of the northernmost part of thePIG ice-shelf front at bathymetric high A and the propagationof the calving rift SSE from the high is evident (Movie S1).The contact of the ice-shelf front with bathymetric high A inthe north-west imparted back stress to the northernmost partof the ice shelf and, hence, rift propagation occurred betweenice to the SE of the high that was subject to this back stressand ice to its south that was not restrained (Fig. 4a).
In the following years, ice-shelf rifting increasingly tookplace further to the east (Fig. 3), where it ceases to be con-strained by topography around Evans Knoll (Fig. 1), indicat-ing that stresses were increasingly being released here ratherthan at the bathymetric ridge. The northern part of the largerift that formed in 2011 coincides with the N–S direction of
the rifts forming near Evans Knoll (Figs. 3b and 4b). The riftpropagated southwards and formed the 2013 calving front,indicating that the stress release played a role in this calv-ing event. In addition, before rift formation the very densemélange of icebergs north of the bathymetric ridge becametrapped between the PIG and the northern ice shelf, whichpartly rested on bathymetric high B. In a similar way, to di-rect ice-shelf contact with a bathymetric high observed in2007, this configuration imposed back stress on the north-ern section of the PIG ice shelf and influenced the positionof the 2011 rift. Hence, the bathymetric highs A and B playedan important role in both calving events, which resulted in acurved calving front by inducing sudden back stress to thePIG ice shelf, either directly via ice-shelf contact with theridge in 2007 or indirectly via trapping a dense ice mélangein 2011.
Before the 2015 calving event, a change in ice-flow ve-locity and direction from 2013–2014 to 2014–2015 (Jeong
The Cryosphere, 12, 2039–2050, 2018 www.the-cryosphere.net/12/2039/2018/

J. E. Arndt et al.: Bathymetric controls on calving processes at Pine Island Glacier 2047
et al., 2016) shows that the northern section that later on be-came the stationary iceberg behaved differently compared tothe calved central and southern parts. In the northern sec-tion, (1) ice-flow velocity stayed nearly the same instead ofincreasing and (2) ice-flow direction rotated 2–3◦ clockwiseinstead of more or less remaining the same. This observa-tion could indicate slight contact of ice with the bathymet-ric ridge in Fig. 2b, which was located on the northernmostedge of the ice shelf by then. This is supported by the ob-servation of the stationary northern iceberg (Fig. 4c), whichcan only be explained by bottom contact. Ice contact that oc-curred even before the calving event, therefore, would ex-plain the observed reduced flow speed in the northern ice-shelf section and the general westward flow direction of theice shelf would have resulted in clockwise rotation with ananchor point in the north. Radar and upward-looking sonardata showed that the base of PIG ice shelf is highly irregu-lar (Vaughan et al., 2012; Dutrieux et al., 2014b) and, there-fore, suggest that the initial loss of ice contact likely wouldbe followed by a phase of intermittent contact. Hence, theirregular ice-shelf thickness likely led to regrounding on thebathymetric ridge and triggered different ice-flow behaviourin the northern part. Furthermore, this asymmetry probablyexplains the rapid break-up of the calved ice due to the dif-ferent rotation and forcing in the northern section.
The resulting re-orientated calving line of the 2015 event,however, was predominantly controlled by rift R1 and by thedisintegration of ice mélange between PIG and the northernice shelf as described by Jeong et al. (2016). This is sup-ported by the 2017 calving event, which was controlled byrift R2 (Fig. 1), with the calved part being more than 4 kmaway from the former pinning point (Fig. S3 in the Supple-ment). The R1 and R2 rifts were hypothesised by Jeong etal. (2016) to originate from basal crevasses filled by warmocean waters. Nevertheless, the pinning point loss could havecontributed to the formation of these rifts through back stresschanges following the initial pinning point loss around 2006and during the period of intermittent ice contact that we haveshowed continued until the 2015 calving event. The align-ment of these rifts between the new outermost pinning pointin the north, near Evans Knoll, and the position from which atributary glacier flows into the ice shelf in the south is consis-tent with this hypothesis. This observation will be an impor-tant consideration for improved understanding and modellingof the rift formation process.
Due to its morphology, in addition, the bathymetric ridgepossibly played a role in clearing the ice mélange. Apartfrom an open marine gateway for ice into Pine Island Bay,a force is needed to push the ice mélange into the bay. Ice-berg trajectories are predominantly steered by currents andwind (Death et al., 2006). Therefore, a water exchange fromthe ice-shelf cavity across the bathymetric ridge would sup-port flushing the trapped icebergs westward. The ridge, be-ing continuously shallower than 450 m, in combination withthe ice shelf and icebergs trapped in the mélange (reaching
drafts of hundreds of metres), however, would have limitedthis kind of water exchange. After sufficient thinning tookplace, the water column possibly reached a threshold that en-abled sufficient circulation of water, allowing ice mélangedisintegration.
The current calving front aligns with the new downstream-most pinning point in the north, near Evans Knoll, and wherethe ice shelf is under pressure from a tributary ice streamflowing into it in the south. In the decades before, when otherpinning points further downstream, including the discoveredbathymetric ridge, were active, this was also the case (Fig. 1).Even unpinning PIG in the 1970s from the crest of a ridge lo-cated 30 km upstream of the former calving line that rises to∼ 700 m below sea level in the centre of the ice shelf (Jenkinset al., 2010; Smith et al., 2017) did not result in calving lineretreat in the following decades (MacGregor et al., 2012) aspinning points further downstream remained active. This cor-relation suggests that the final pinning/constriction points arean important control on the orientation of the calving line ofPIG. However, in a thinner ice shelf, crevasses that developedin the glacier upstream of the grounding line will penetratea greater fraction of the total thickness, and therefore theyare more likely to control calving positions (Yu et al., 2017;Bassis and Jacobs, 2013; Bassis and Walker, 2011). Hence,we cannot exclude that the change in calving line orientationis a result of thinning and ocean melting of basal crevasses assuggested by Jeong et al. (2016). It is possibly enhanced byback stress variations due to intermittent ice contact with thebathymetric ridge between 2006 and 2015, and is not solelyconstrained by the outermost pinning points.
Konrad et al. (2017) show how changes to the ice shelfand grounding line region of PIG and other Amundsen Seaembayment glaciers propagate upstream on a timescale of afew years. Thus, the recent reduction of back stress can beexpected to propagate to the grounded trunk of PIG, causingfurther acceleration of flow and thus further dynamic thin-ning. Accordingly, a restabilisation of the ice shelf due to re-pinning at a ridge, e.g. by a very rapid advance or thickeningof the ice shelf, cannot be expected in the foreseeable future,at least for as long as rapid basal melting driven by CDWincursion continues. Instead, the ice-shelf calving line seemsto have made an irreversible step to a new position and ori-entation in 2015, which has been confirmed in 2017, follow-ing progressive detachment from the pinning point over theprevious decade. We do not expect further significant rapidcalving line retreat in the next few years. The northern mar-gin is now stabilised by a pinning point near Evans Knoll,which rises above sea level where the nearby ice-shelf thick-ness is about 450 m, and the southern margin is stabilised bythick tributary ice inflow (Fretwell et al., 2013). Neverthe-less, continued rapid ice-shelf thinning as observed in otherstudies (Pritchard et al., 2012; Rignot et al., 2013) and asconfirmed by our observation of pinning point loss (Fig. 3)will further destabilise the PIG ice shelf in the future andat some stage is expected to lead to calving occurring even
www.the-cryosphere.net/12/2039/2018/ The Cryosphere, 12, 2039–2050, 2018

2048 J. E. Arndt et al.: Bathymetric controls on calving processes at Pine Island Glacier
further upstream. Rapid iceberg disintegration into smallersized icebergs after the two most recent calving events tookplace within 1–2 months (maximum size ∼ 115 km2 in 2015and ∼ 50 km2 in 2017, Figs. 4 and 5) in contrast to previ-ous calving events that resulted in stable large icebergs, e.g.B-31 (720 km2, Bigg et al., 2014), and possibly reflect thisdestabilising trend. The newly discovered rift R3 (inset ofFig. 5) will likely trigger the next calving event. In compar-ison to the 2015 (10–20 km) and 2017 (8 km) calving event,R3 is located only 4 km upstream of the current calving front,therefore indicating that the trend to smaller sized icebergswill persist.
5 Conclusions
Multibeam bathymetry data from a previously ice-shelf-covered area revealed a bathymetric ridge that rises to 375 mat its shallowest point and two shallower bathymetric highs,A and B, to the north.
The bathymetric ridge acted as a pinning point to the PIGuntil 2006. Between 2006 and 2015 ice contact likely per-sisted at least intermittently and induced variable back stressto PIG.
Four calving events have occurred since 2006. The 2007event is a result of back stress induced by bathymetric highA to the north-eastern part of PIG after ice front advance tothe high. The 2013 event resulted from back stress inducedby a dense ice mélange trapped between PIG and bathymet-ric high B. The 2015 event was triggered by clearing of anorthern ice mélange and rift R1 as suggested by Jeong etal. (2016). The 2017 event was triggered by rift R2 and thenext calving will likely occur along the newly identified riftR3. These rifts align with the terminal ice-shelf stabilisingpoints to the north and south and calving occurred when theymigrated past the stabilising points. We suggest that (a) re-duced and variable back stress after 2006 favoured the forma-tion of these rifts, (b) the clearing of the ice mélange was con-strained by water flux over the bathymetric ridge and (c) thelight ice-shelf contact with the ridge initiated the final break-up in 2015.
In the last decade, the size of calved icebergs has shrunkand their speed of disintegration accelerated, possibly due toice-shelf destabilisation by continuous rapid ice-shelf thin-ning.
Data availability. The bathymetric data are available athttps://doi.org/doi:10.1594/PANGAEA.881546 (Arndt, 2017).The processed satellite images are available upon request from theauthors.
The Supplement related to this article is available onlineat https://doi.org/10.5194/tc-12-2039-2018-supplement.
Team list. Karsten Gohl (Alfred Wegener Institute Helmholtz Cen-tre for Polar and Marine Research, Bremerhaven, Germany), Victo-ria Afanasyeva (VNIIOkeangeologia, St. Petersburg, Russia), JanErik Arndt (Alfred Wegener Institute, Germany), Torsten Bick-ert (MARUM – Center for Marine Environmental Sciences Uni-versity of Bremen, Bremen, Germany), Steve Bohaty (NationalOceanographic Centre, Southhampton, UK), Ricarda Dziadek (Al-fred Wegener Institute, Germany), Benjamin Ebermann (Techni-cal University of Dresden, Dresden, Germany), Werner Ehrmann(University of Leipzig, Leipzig, Germany), Oliver Esper (AlfredWegener Institute, Germany), Thomas Frederichs (MARUM, Ger-many), Tim Freudenthal (MARUM), Catalina Gebhardt (AlfredWegener Institute, Germany), Claus-Dieter Hillenbrand (BritishAntarctic Survey, Cambridge, UK), Katharina Hochmuth (AlfredWegener Institute, Germany), Johann Klages (Alfred Wegener Insti-tute), Kevin Küssner (Alfred Wegener Institute, Germany), RobertLarter (British Antarctic Survey), Yanina Najman (Lancaster Uni-versity, Lancaster, UK), Heiko Pälike (MARUM), Florian Riefs-tahl (Alfred Wegener Institute), Thomas Ronge (Alfred WegenerInstitute), Mirko Scheinert (Technical University of Dresden, Ger-many), Patric Simões Pereira (Imperial Colledge, London, UnitedKingdom), James Smith (British Antarctic Survey, UK), GabrieleUenzelmann-Neben (Alfred Wegener Institute, Germany), Tina vande Flierdt (Imperial Colledge), Max Zundel (University of Bremen,Bremen, Germany).
Author contributions. JEA, RDL and KG developed the concept ofthis paper. JEA was responsible for bathymetry data acquisition andprocessing. PF and KH were responsible for satellite data acquisi-tion and processing. JEA and RDL led the writing of this paper andall authors contributed to the development of the paper.
Competing interests. The authors declare that they have no conflictof interest.
Acknowledgements. The TerraSAR-X acquisitions during the RVPolarstern’s expedition PS104 were provided by DLR through theTerraSAR-X science project OCE3373 (Fig. 1) and the TanDEM-Xscience proposal XTI_GLAC7015 (Fig. 4c, Movie S2 in theSupplement). The ERS and Envisat data were provided free ofcharge by ESA via the Earth Observation Link (EOLi) client.Sentinel-1 data were downloaded from ESA’s Copernicus OpenAccess Hub. We thank JAXA for providing the ALOS PALSARdata and Matthias Braun (University of Erlangen-Nuremberg)for kindly sharing processed RADARSAT-1 intensity images.ASTER data from the L1B Orthorectifed Registered Radianceat the Sensor V003 Product (AST14OTH) were retrieved via theNASA Reverb portal. We thank the crew of RV Polarstern andthe scientific staff on board during expedition PS104 for theirhelp and assistance. We thank John B. Anderson, Lauren M.Simkins, Seongsu Jeong and an anonymous reviewer for commentson a previous version of this manuscript and Seongsu Jeong forsharing the Sentinel S2A image, showing rift R3. Jan Erik Arndtwas funded by the Deutsche Forschungsgemeinschaft (DFG,German Research Foundation) – AR 1087/1-1. This study is partof the PACES II (Polar Regions and Coasts in the changing Earth
The Cryosphere, 12, 2039–2050, 2018 www.the-cryosphere.net/12/2039/2018/

J. E. Arndt et al.: Bathymetric controls on calving processes at Pine Island Glacier 2049
System) programme of the Alfred-Wegener-Institut and the PolarScience for Planet Earth Programme of the British Antarctic Survey.
The article processing charges for this open-accesspublication were covered by a ResearchCentre of the Helmholtz Association.
Edited by: Chris R. StokesReviewed by: Lauren Simkins and one anonymous referee
References
Arndt, J. E.: Bathymetry measured near Pine Island Glacier dur-ing POLARSTERN cruise PS104, link to GeoTIFF, PANGAEA,https://doi.org/10.1594/PANGAEA.881546, 2017.
Bassis, J. N. and Jacobs, S.: Diverse calving patternslinked to glacier geometry, Nat. Geosci., 6, 833–836,https://doi.org/10.1038/ngeo1887, 2013.
Bassis, J. N. and Walker, C. C.: Upper and lower limits onthe stability of calving glaciers from the yield strength en-velope of ice, P. Roy. Soc. A-Math. Phy., 468, 913–931,https://doi.org/10.1098/rspa.2011.0422, 2012.
Bigg, G. R., Marsh, R. A., Wilton, D. J., and Ivchenko, V.: B31– a giant iceberg in the Southern Ocean, Ocean Challenge, 20,32–34, 2014.
Bindschadler, R. A.: History of lower Pine Island Glacier, WestAntarctica, from Landsat imagery, J. Glaciol., 48, 536–544,https://doi.org/10.3189/172756502781831052, 2002.
Brisbourne, A. M., Smith, A. M., King, E. C., Nicholls, K. W., Hol-land, P. R., and Makinson, K.: Seabed topography beneath LarsenC Ice Shelf from seismic soundings, The Cryosphere, 8, 1–13,https://doi.org/10.5194/tc-8-1-2014, 2014.
Chuter, S. J. and Bamber, J. L.: Antarctic ice shelf thicknessfrom CryoSat-2 radar altimetry, Geophys. Res. Lett., 42, 10721–710729, https://doi.org/10.1002/2015GL066515, 2015.
Davies, D., Bingham, R. G., Graham, A. G. C., Spagnolo, M.,Dutrieux, P., Vaughan, D. G., Jenkins, A., and Nitsche, F.O.: High-resolution sub-ice-shelf seafloor records of twenti-eth century ungrounding and retreat of Pine Island Glacier,West Antarctica, J. Geophys. Res.-Earth, 122, 1698–1714,https://doi.org/10.1002/2017JF004311, 2017.
Death, R., Siegert, M. J., Bigg, G. R., and Wadley, M. R.:Modelling iceberg trajectories, sedimentation rates and melt-water input to the ocean from the Eurasian Ice Sheet at theLast Glacial Maximum, Palaeogeogr. Palaeocl., 236, 135–150,https://doi.org/10.1016/j.palaeo.2005.11.040, 2006.
De Rydt, J., Holland, P. R., Dutrieux, P., and Jenkins, A.: Ge-ometric and oceanographic controls on melting beneath PineIsland Glacier, J. Geophys. Res.-Oceans, 119, 2420–2438,https://doi.org/10.1002/2013JC009513, 2014.
Dutrieux, P., De Rydt, J., Jenkins, A., Holland, P. R., Ha,H. K., Lee, S. H., Steig, E. J., Ding, Q., Abrahamsen, E.P., and Schröder, M.: Strong Sensitivity of Pine Island Ice-Shelf Melting to Climatic Variability, Science, 343, 174–178,https://doi.org/10.1126/science.1244341, 2014a.
Dutrieux, P., Stewart, C., Jenkins, A., Nicholls, K. W., Corr,H. F. J., Rignot, E., and Steffen, K.: Basal terraces on
melting ice shelves, Geophys. Res. Lett., 41, 5506–5513,https://doi.org/10.1002/2014GL060618, 2014b.
Favier, L., Durand, G., Cornford, S. L., Gudmundsson, G. H.,Gagliardini, O., Gillet-Chaulet, F., Zwinger, T., Payne, A. J.,and Le Brocq, A. M.: Retreat of Pine Island Glacier controlledby marine ice-sheet instability, Nat. Clim. Change, 4, 117–121,https://doi.org/10.1038/nclimate2094, 2014.
Fretwell, P., Pritchard, H. D., Vaughan, D. G., Bamber, J. L., Bar-rand, N. E., Bell, R., Bianchi, C., Bingham, R. G., Blanken-ship, D. D., Casassa, G., Catania, G., Callens, D., Conway, H.,Cook, A. J., Corr, H. F. J., Damaske, D., Damm, V., Ferracci-oli, F., Forsberg, R., Fujita, S., Gim, Y., Gogineni, P., Griggs,J. A., Hindmarsh, R. C. A., Holmlund, P., Holt, J. W., Jacobel,R. W., Jenkins, A., Jokat, W., Jordan, T., King, E. C., Kohler,J., Krabill, W., Riger-Kusk, M., Langley, K. A., Leitchenkov,G., Leuschen, C., Luyendyk, B. P., Matsuoka, K., Mouginot,J., Nitsche, F. O., Nogi, Y., Nost, O. A., Popov, S. V., Rignot,E., Rippin, D. M., Rivera, A., Roberts, J., Ross, N., Siegert,M. J., Smith, A. M., Steinhage, D., Studinger, M., Sun, B.,Tinto, B. K., Welch, B. C., Wilson, D., Young, D. A., Xiangbin,C., and Zirizzotti, A.: Bedmap2: improved ice bed, surface andthickness datasets for Antarctica, The Cryosphere, 7, 375–393,https://doi.org/10.5194/tc-7-375-2013, 2013.
Fürst, J. J., Durant, G., Gillet-Chaulet, F., Tavard, L., Rankl,M., Braun, M., and Gagliardini, O.: The safety band ofAntarctic ice shelves, Nat. Clim. Change, 6, 479–482,https://doi.org/10.1038/nclimate2912, 2016.
Graham, A. G. C., Larter, R. D., Gohl, K., Hillenbrand, C.-D.,Smith, J. A., and Kuhn, G.: Bedform signature of a West Antarc-tic palaeo-ice stream reveals a multi-temporal record of flowand substrate control, Quaternary Sci. Rev., 28, 2774–2793,https://doi.org/10.1016/j.quascirev.2009.07.003, 2009.
Griggs, J. A. and Bamber, J. L.: Antarctic ice-shelf thick-ness from satellite radar altimetry, J. Glaciol, 57, 485–493,https://doi.org/10.3189/002214311796905659, 2011.
Gudmundsson, G. H.: Ice-shelf buttressing and the stabil-ity of marine ice sheets, The Cryosphere, 7, 647–655,https://doi.org/10.5194/tc-7-647-2013, 2013.
Gutt, J., Barratt, I., Domack, E. W., d’Udekem d’Acoz, C., Dimm-ler, W., Grémare, A., Heilmayer, O., Isla, E., Janussen, D.,Jorgensen, E., Kock, K.-H., Lehnert, L. S., López-Gonzáles,P., Langner, S., Linse, K., Manjón-Cabeza, M. E., Meißner,M., Montiel, A., Raes, M., Robert, H., Rose, A., Schepisi, E.S., Saucède, T., Scheidat, M., Schenke, H.-W., Seiler, J., andSmith, C. R.: Biodiversity change after climate-induced ice-shelf collapse in the Antarctic, Deep-Sea Res. Pt. II, 58, 74–83,https://doi.org/10.1016/j.dsr2.2010.05.024, 2011.
Hillenbrand, C.-D., Kuhn, G., Smith, J. A., Gohl, K., Graham, A.G. C., Larter, R. D., Klages, J. P., Downey, R., Moreton, S. G.,Forwick, M., and Vaughan, D. G.: Grounding-line retreat of theWest Antarctic Ice Sheet from inner Pine Island Bay, Geology,41, 35–38, https://doi.org/10.1130/G33469.1, 2013.
Jacobs, S. S., Hellmer, H. H., and Jenkins, A.: Antarctic Ice Sheetmelting in the southeast Pacific, Geophys. Res. Lett., 23, 957–960, https://doi.org/10.1029/96GL00723, 1996.
Jacobs, S. S., Jenkins, A., Giulivi, C. F., and Dutrieux,P.: Stronger ocean circulation and increased melting underPine Island Glacier ice shelf, Nat. Geosci., 4, 519–523,https://doi.org/10.1038/ngeo1188, 2011.
www.the-cryosphere.net/12/2039/2018/ The Cryosphere, 12, 2039–2050, 2018

2050 J. E. Arndt et al.: Bathymetric controls on calving processes at Pine Island Glacier
Jenkins, A., Dutrieux, P., Jacobs, S. S., McPhail, S. D., Perrett, J.R., Webb, A. T., and White, D.: Observations beneath Pine IslandGlacier in West Antarctica and implications for its retreat, Nat.Geosci., 3, 468–472, https://doi.org/10.1038/ngeo890, 2010.
Jeong, S., Howat, I. M., and Bassis, J. N.: Accelerated iceshelf rifting and retreat at Pine Island Glacier, WestAntarctica, Geophys. Res. Lett., 43, 11720–711725,https://doi.org/10.1002/2016GL071360, 2016.
Johnson, J. S., Bentley, M. J., Smith, J. A., Finkel, R. C., Rood, D.H., Gohl, K., Balco, G., Larter, R. D., and Schaefer, J. M.: RapidThinning of Pine Island Glacier in the Early Holocene, Science,343, 999–1001, https://doi.org/10.1126/science.1247385, 2014.
Joughin, I., Shean, D. E., Smith, B. E., and Dutrieux, P.: Ground-ing line variability and subglacial lake drainage on Pine Is-land Glacier, Antarctica, Geophys. Res. Lett., 43, 9093–9102,https://doi.org/10.1002/2016GL070259, 2016.
Katz, R. F. and Worster, M. G.: Stability of ice-sheet ground-ing lines, P. Roy. Soc. A-Math. Phy., 466, 1597–1620,https://doi.org/10.1098/rspa.2009.0434, 2010.
Konrad, H., Gilbert, L., Cornford, S. L., Payne, A., Hogg,A., Muir, A., and Shepherd, A.: Uneven onset and paceof ice-dynamical imbalance in the Amundsen Sea Embay-ment, West Antarctica, Geophys. Res. Lett., 44, 910–918,https://doi.org/10.1002/2016GL070733, 2017.
Konrad, H., Shepherd, A., Gilbert, L., Hogg, A., McMil-lan, M., Muir, A., and Slater, T.: Net retreat of Antarc-tic glacier grounding lines, Nat. Geosci., 11, 258–262,https://doi.org/10.1038/s41561-018-0082-z, 2018.
Lee, H., Shum, C. K., Howat, I. M., Monaghan, A., Ahn, Y., Duan,J., Guo, J.-Y., Kuo, C.-Y., and Wang, L.: Continuously acceler-ating ice loss over Amundsen Sea catchment, West Antarctica,revealed by integrating altimetry and GRACE data, EPSL, 321–322, 74–80, https://doi.org/10.1016/j.epsl.2011.12.040, 2012.
MacGregor, J. A., Catania, G. A., Markowski, M. S., and Andrews,A. G.: Widespread rifting and retreat of ice-shelf margins in theeastern Amundsen Sea Embayment between 1972 and 2011, J.Glaciol., 58, 458–466, https://doi.org/10.3189/2012JoG11J262,2012.
Nakayama, Y., Schröder, M., and Hellmer, H. H.: From cir-cumpolar deep water to the glacial meltwater plume on theeastern Amundsen Shelf, Deep-Sea Res. Pt. I, 77, 50–62,https://doi.org/10.1016/j.dsr.2013.04.001, 2013.
Pritchard, H. D., Arthern, R. J., Vaughan, D. G., and Edwards,L. A.: Extensive dynamic thinning on the margins of theGreenland and Antarctic ice sheets, Nature, 461, 971–975,https://doi.org/10.1038/nature08471, 2009.
Pritchard, H. D., Ligtenberg, S. R. M., Fricker, H. A., Vaughan, D.G., van den Broeke, M. R., and Padman, L.: Antarctic ice-sheetloss driven by basal melting of ice shelves, Nature, 484, 502–505,https://doi.org/10.1038/nature10968, 2012.
Rignot, E.: Ice-shelf changes in Pine Island Bay,Antarctica, 1947–2000, J. Glaciol., 48, 247–256,https://doi.org/10.3189/172756502781831386, 2002.
Rignot, E.: Changes in West Antarctic ice stream dynamics ob-served with ALOS PALSAR data, Geophys. Res. Lett., 35,L12505, https://doi.org/10.1029/2008gl033365, 2008.
Rignot, E., Bamber, J. L., van den Broeke, M. R., Davis,C., Li, Y., van de Berg, W. J., and van Meijgaard, E.:Recent Antarctic ice mass loss from radar interferometry
and regional climate modelling, Nat. Geosci., 1, 106–110,https://doi.org/10.1038/ngeo102, 2008.
Rignot, E., Mouginot, J., and Scheuchl, B.: Ice Flowof the Antarctic Ice Sheet, Science, 333, 1427–1430,https://doi.org/10.1126/science.1208336, 2011.
Rignot, E., Jacobs, S., Mouginot, J., and Scheuchl, B.: Ice-Shelf Melting Around Antarctica, Science, 341, 266–270,https://doi.org/10.1126/science.1235798, 2013.
Rignot, E., Mouginot, J., Morlighem, M., Seroussi, H., andScheuchl, B.: Widespread, rapid grounding line retreat of PineIsland, Thwaites, Smith, and Kohler glaciers, West Antarc-tica, from 1992 to 2011, Geophys. Res. Lett., 41, 3502–3509,https://doi.org/10.1002/2014GL060140, 2014.
Schoof, C.: Ice sheet grounding line dynamics: Steady states,stability, and hysteresis, J. Geophys. Res., 112, FS03S28,https://doi.org/10.1029/2006JF000664, 2007.
Shepherd, A., Ivins, E. R., A, G., Barletta, V. R., Bentley, M. J.,Bettadpur, S., Briggs, K. H., Bromwich, D. H., Forsberg, R.,Galin, N., Horwath, M., Jacobs, S., Joughin, I., King, M. A.,Lenaerts, J. T. M., Li, J., Ligtenberg, S. R. M., Luckman, A.,Luthcke, S. B., McMillan, M., Meister, R., Milne, G., Mouginot,J., Muir, A., Nicolas, J. P., Paden, J., Payne, A. J., Pritchard, H.,Rignot, E., Rott, H., Sørensen, L. S., Scambos, T. A., Scheuchl,B., Schrama, E. J. O., Smith, B., Sundal, A. V., van Angelen,J. H., van de Berg, W. J., van den Broeke, M. R., Vaughan,D. G., Velicogna, I., Wahr, J., Whitehouse, P. L., Wingham,D. J., Yi, D., Young, D., and Zwally, H. J.: A Reconciled Es-timate of Ice-Sheet Mass Balance, Science, 338, 1183–1189,https://doi.org/10.1126/science.1228102, 2012.
Smith, J. A., Andersen, T. J., Shortt, M., Gaffney, A. M., Truffer, M.,Stanton, T. P., Bindschadler, R., Dutrieux, P., Jenkins, A., Hillen-brand, C. D., Ehrmann, W., Corr, H. F. J., Farley, N., Crowhurst,S., and Vaughan, D. G.: Sub-ice-shelf sediments record historyof twentieth-century retreat of Pine Island Glacier, Nature, 541,77–80, https://doi.org/10.1038/nature20136, 2017.
Steig, E. J., Ding, Q., Battisti, D. S., and Jenkins, A.: Tropical forc-ing of Circumpolar Deep Water Inflow and outlet glacier thin-ning in the Amundsen Sea Embayment, West Antarctica, Ann.Glaciol., 53, 19–28, https://doi.org/10.3189/2012AoG60A110,2012.
Vaughan, D. G., Corr, H. F. J., Bindschadler, R. A., Dutrieux, P.,Gudmundsson, G. H., Jenkins, A., Newman, T., Vornberger, P.,and Wingham, D. J.: Subglacial melt channels and fracture inthe floating part of Pine Island Glacier, Antarctica, J. Geophys.Res.-Earth, 117, F03012, https://doi.org/10.1029/2012JF002360,2012.
Weertman, J.: Stability of the Junction of an Ice Sheet and an IceShelf, J. Glaciol., 13, 3–11, https://doi.org/10.3198/1974JoG13-67-3-11, 1974.
Wingham, D. J., Wallis, D. W., and Shepherd, A.: Spa-tial and temporal evolution of Pine Island Glacier thin-ning, 1995–2006, Geophys. Res. Lett., 36, L17501,https://doi.org/10.1029/2009GL039126, 2009.
Yu, H., Rignot, E., Morlighem, M., and Seroussi, H.: Icebergcalving of Thwaites Glacier, West Antarctica: full-Stokes mod-eling combined with linear elastic fracture mechanics, TheCryosphere, 11, 1283–1296, https://doi.org/10.5194/tc-11-1283-2017, 2017.
The Cryosphere, 12, 2039–2050, 2018 www.the-cryosphere.net/12/2039/2018/