battery optimal sizing under a synergistic framework with
TRANSCRIPT
Battery Optimal Sizing under a Synergistic Framework with DQN Based Power Managements for the Fuel Cell Hybrid Powertrain Jianwei Li, Hanxiao Wang, Hongwen He, Zhongbao Wei, Qingqing Yang, and Petar Igic Author post-print (accepted) deposited by Coventry University’s Repository Original citation & hyperlink: Li, J., Wang, H., He, H., Wei, Z., Yang, Q. and Igic, P., 2021. Battery Optimal Sizing under a Synergistic Framework with DQN Based Power Managements for the Fuel Cell Hybrid Powertrain. IEEE Transactions on Transportation Electrification. https://dx.doi.org/[DOI] DOI 10.1109/TTE.2021.3074792 ISSN 2332-7782 Publisher: IEEE © 2021 IEEE. Personal use of this material is permitted. Permission from IEEE must be obtained for all other uses, in any current or future media, including reprinting/republishing this material for advertising or promotional purposes, creating new collective works, for resale or redistribution to servers or lists, or reuse of any copyrighted component of this work in other works. Copyright © and Moral Rights are retained by the author(s) and/ or other copyright owners. A copy can be downloaded for personal non-commercial research or study, without prior permission or charge. This item cannot be reproduced or quoted extensively from without first obtaining permission in writing from the copyright holder(s). The content must not be changed in any way or sold commercially in any format or medium without the formal permission of the copyright holders. This document is the author’s post-print version, incorporating any revisions agreed during the peer-review process. Some differences between the published version and this version may remain and you are advised to consult the published version if you wish to cite from it.
2332-7782 (c) 2021 IEEE. Personal use is permitted, but republication/redistribution requires IEEE permission. See http://www.ieee.org/publications_standards/publications/rights/index.html for more information.
This article has been accepted for publication in a future issue of this journal, but has not been fully edited. Content may change prior to final publication. Citation information: DOI 10.1109/TTE.2021.3074792, IEEETransactions on Transportation Electrification
> REPLACE THIS LINE WITH YOUR PAPER IDENTIFICATION NUMBER (DOUBLE-CLICK HERE TO EDIT) <
1
Abstract—This paper proposes a synergistic approach that traverses the battery optimal size simultaneously against the optimal power management based on deep reinforcement learning (DRL). A fuel cell hybrid electric vehicle (FC-HEV) with the fuel cell/battery hybrid powertrain is used as the study case. The battery plays a key role in current transportation electrification, and the optimal sizing of the battery is critical for both system technical performances and economical revenues, especially in the hybrid design. The optimal battery design should coordinate the static sizing study against the dynamic power distribution for a given system, but few works provided the synergistic consideration of the two parts. In this study, the interaction happens in each sizing point with the optimal power sharing between the battery and the FC, aiming at minimizing the summation of hydrogen consumption, FC degradation and battery degradation. Under the proposed framework, the power management is developed with deep Q network (DQN) algorithm, considering multi-objectives that minimizing hydrogen consumption and suppressing system degradation. In the case study, optimal sizing parameters with lowest cost are determined. Leveraged by the optimal size, the hybrid system economy with synergistic approach is improved by 16.0%, comparing with the conventional FC configuration.
Index Terms—deep reinforcement learning, fuel cell hybrid electric vehicle, hybrid energy storage system, power management, sizing study
I. INTRODUCTION
ITH the growing concerns on greenhouse gas emissions, the noise pollution related to engine operation, as well as
the fossil fuel shortage, the global vehicle industry has been putting increasing efforts on vehicle electrification [1]. Some commercialized attempts include electric vehicles (EV), hybrid electric vehicles (HEV) and fuel cell electric vehicles (FCEV) [2]. Fuel cell (FC) has been regarded as a promising option to replace the internal combustion engine (ICE) [3]. Comparing with EVs, time consumed by hydrogen refilling is competitive with traditional gas refilling, and the stored energy in the FC can outperform batteries of similar size [4]. However, several drawbacks of FC have been the obstacle of taking it as the sole power source on vehicles: i) its response to power demand is
Hanxiao Wang, Hongwen He, Jianwei Li and Zhongbao We are with the
School of Mechanical Engineering, Beijing Institute of Technology, Beijing, China, Petar Igic, Jianwei Li and Qingqing Yang are with the Centre for
slow [5]; ii) its longevity is sensitive to load variation [6]; iii) cold start is difficult [7]; iv) FCs cannot absorb energy, thus regenerative braking is impossible [8]. As the power demand of vehicle fluctuates drastically, FC-only energy storage system (ESS) would be oversized to satisfy the peak power demand [9], which is a waste during most of the operation time. Therefore, a hybrid energy storage system (HESS) combining the FC system with an auxiliary high-power device is more applicable under the complex and fast-changing vehicle working condition [10]. Li-ion battery can reach much higher power in vehicular application [11, 12], and FC/Li-ion battery HESS is discussed in this study.
Power conversion in the FC-HEV powertrain has two stages: DC-DC conversion between the power sources and DC bus, and DC-AC conversion between DC bus and the motor. In the FC/battery HESS, FC power is usually controlled by a DC-DC converter, while battery may connect to the DC bus directly or also be controlled by a DC-DC converter. Fully-active topology denotes the configuration that both FC and battery power flow are actively controlled by DC-DC converters [13]. It is the most flexible configuration, but the hybrid system would bulkier and with lower efficiency because of the two DC-DC converters, and the cost would be higher. FC-active configuration keeps one DC-DC converter for FC controlling, and the battery is connected directly to the DC bus. It requires less investment, and is widely used because it successfully facilitates the power split control between FC and battery [14]. To balance system investment and performance, the FC-active topology may be the optimal option, and it is selected for the hybrid power system in this study. In this architecture, FC is the active power source with the DC-DC converter between the FC and the DC bus, and the FC output power can be actively controlled. The Li-ion batteries directly connect to the DC bus, supplementing power demand or absorb excess power passively. As the battery responds passively without active control, its performance would be much dependent on its key size parameters, like capacity and maximum C-rate [15]. Battery size would influence its performance in system dynamic characteristics [16], regenerative braking endurance, and adjusting FC working conditions [8]. Thus, delicate battery sizing study would be indispensable to design a HESS with optimal performance and reasonable investment.
Due to the heterogeneous type of the components, the power
Advanced Low Carbon Propulsion Systems (C-ALPS), IFTC, Coventry University, England, UK (Corresponding Author: Jianwei Li Email: [email protected]; [email protected])
Battery Optimal Sizing under a Synergistic Framework with DQN Based Power Managements
for the Fuel Cell Hybrid Powertrain Jianwei Li Member, IEEE, Hanxiao Wang, Hongwen He Senior Member IEEE Zhongbao Wei, Member IEEE
Qingqing Yang Member, IEEE, Petar Igic Senior Member IEEE
W
Authorized licensed use limited to: COVENTRY UNIVERSITY. Downloaded on June 17,2021 at 13:49:33 UTC from IEEE Xplore. Restrictions apply.
2332-7782 (c) 2021 IEEE. Personal use is permitted, but republication/redistribution requires IEEE permission. See http://www.ieee.org/publications_standards/publications/rights/index.html for more information.
This article has been accepted for publication in a future issue of this journal, but has not been fully edited. Content may change prior to final publication. Citation information: DOI 10.1109/TTE.2021.3074792, IEEETransactions on Transportation Electrification
> REPLACE THIS LINE WITH YOUR PAPER IDENTIFICATION NUMBER (DOUBLE-CLICK HERE TO EDIT) <
2
management strategy (PMS) and component sizes are the key factors influencing the control performance and system economy of a hybrid powertrain [17]. The optimal system design should coordinate the static sizing study against the dynamic power distribution. However, the key difficulty lies in that the sizing study and the power management are coupling together, and its impractical to conduct PMS optimization without a specific size. Thus, few works have presented a synergistic consideration of the two parts.
A. Sizing optimization methods
Previous research of HESS sizing study includes different scenarios like microgrids [18] and charging systems [19] and transportation [3, 7, 20-28]. Among sizing study for HESS in transportation applications, some researchers used statistical description of driving cycles to determine the size of the power sources [21, 22]. Some scholars tried to conduct sizing study with global optimization algorithms [3, 20, 25], where the power between different components is simply split according to frequency. Eldeeb et al. [20] proposed a genetic algorithm-based optimization method to minimize system cost of the HESS on a plug-in HEV (PHEV), where weight and volume were also investigated to decide the optimal battery unit and supercapacitor size. The sizing process is conducted with a developed hybrid Particle Swarm–Nelder–Mead algorithm in [25]. For FC/battery HESS sizing study, Ziaeinejad et al. proposed an iterative sizing method without analyzing the dynamics of power distribution [7]; while some researchers considered dynamic driving cycles in their proposed sizing methods, but failed to consider fuel cell degradation [26-28]. These sizing methods may be static analysis, neglecting the dynamics of PMS, or rely on global optimizations with heavy computational loads.
B. Power management strategies
Some of the existing PMS are based on either predefined rules or global optimization algorithms [29-31]. The rules are usually created by expert experience, well suited for real-time applications, but is generally not optimal [6]; while optimization-based approaches usually require the detailed trip information or accurate prediction, and may consume hours to obtain the optimization results. Reinforcement learning (RL) based PMS has attracted much research attention in recent years. Comparing with existing PMS, RL algorithms could reached near-optimal performance in fuel economy with much less time consumption comparing to global optimization algorithms. It is particularly suitable when the accurate system model or global information is not available [32]. Some researchers have applied RL-based algorithms in HEV/PHEV PMS issues [33-37], but research of RL-based PMS for FC-HEV is not abundant [38-40]. Hsu et al. [38] applied Q-learning on the FCHEV, and designed two working modes with different reward functions, but fuel cell degradation is not considered in this PMS. Yuan et al. [40] proposed a Q-learning based hierarchical strategy for plug-in FCHEVs. The influence of FC start-stop on its degradation is considered, but other working conditions that might accelerate fuel cell degradation were not considered. Q-
learning is one of the most classic reinforcement learning algorithms, but its inherent drawback is that it can only deal with discrete problems. For multi-dimensional optimization problems like PMS for FC-HEV, the discretized state values in Q-learning would most likely lead to bad convergence ability and poor optimality. Deep Q network (DQN) is an effective deep reinforcement learning algorithm, which employs deep neural network to replace the discrete evaluation matrix in Q-learning, and therefore is more suitable for handling such problems with high-dimensional or continuous state space. In above algorithm designs, although fuel economy is taken as an optimization objective, the cost analysis of component degradation during operation is barely comprehensively conducted. Also, the factors accelerating fuel cell degradation is not well evaluated.
C. Contribution of this study
As sizing study and PMS are coupled issues, they should be synergistically considered to realize best system performance. Nevertheless, in existing researches, the two parts are generally discussed separately. Sizing parameters of vehicle power system are usually determined in a static way, where the onboard power system is designed to meet static indicators like maximum power, energy requirement, etc. During PMS optimization, the sizes of components in the HESS are usually predefined and constant, which may not be the optimal one for system economy even if with an optimized PMS. While in sizing study, if statistical description of driving cycles is analyzed, the optimality of the PMS cannot be promised; if global searching algorithms are adopted, heavy computational loads would be required [41]. Sizing study and PMS should be considered as a whole: on the one hand, out of fuel cell's inherent need for stable operation, different battery sizes would decide the upper bound of the PMS performance; on the other hand, PMS would determine the possible score of each sizing point in aspects about component life and hydrogen consumption. To realize this, the static sizing parameters should be turned into optimization variables, and the dynamics of PMS should be fully recognized. Moreover, multiple objectives should be considered with high-efficiency optimization methods.
Considering above issues, the following improvements are proposed in this study:
First, a synergistic approach is developed to reach better overall system economy, where the sizing study on key parameters of the battery and PMS optimization are collaboratively considered and investigated. Under the synergistic framework, static sizing study as well as the dynamic power distribution is coordinated.
Second, a multi-objective power management method is developed to find the optimal power distribution at each sizing point with minimal operation cost and component degradation. Meanwhile, a comprehensive cost analysis is established based on the results of power management, which is used to traverse and quantitatively label the whole sizing space.
In addition, the DQN algorithm is applied in FC-HEV, for the first time, to realized multi-objective power distribution in
Authorized licensed use limited to: COVENTRY UNIVERSITY. Downloaded on June 17,2021 at 13:49:33 UTC from IEEE Xplore. Restrictions apply.
2332-7782 (c) 2021 IEEE. Personal use is permitted, but republication/redistribution requires IEEE permission. See http://www.ieee.org/publications_standards/publications/rights/index.html for more information.
This article has been accepted for publication in a future issue of this journal, but has not been fully edited. Content may change prior to final publication. Citation information: DOI 10.1109/TTE.2021.3074792, IEEETransactions on Transportation Electrification
> REPLACE THIS LINE WITH YOUR PAPER IDENTIFICATION NUMBER (DOUBLE-CLICK HERE TO EDIT) <
3
an open literature. In proposed multi-objective deep Q network (MDQN) based PMS framework, conditions accelerating fuel cell degradation are well considered. Comparing with global optimization methods, one of the advantages of proposed MDQN-based PMS is the control-strategies can be extracted from the trained RL agent and transferred into vehicle control unit for real-time application, after the optimal size and optimized PMS is derived.
The remainder of this paper is organized as follows: Section II describes the FCHEV model; Section Ⅲ introduces the synergistic framework; Section Ⅳ illustrates the simulation results and Section Ⅴ gives the conclusion.
II. FUEL CELL HYBRID ELECTRIC VEHICLE MODELING
The control-oriented vehicle model is established in this section.
A. Vehicle Configuration
Most part of the power output from the HESS is to provide the vehicle with driving force. Here, the power required to overcome the driving resistance in longitudinal direction is considered as the power demand, and is calculated according to the longitudinal dynamic model of the FC-HEV described in [42] and the permanent magnet synchronous motor model according to [43]. The discussed FC-HEV is a commercial city bus, and its parameters are measured from the city bus produced by Yutong Bus Company [42]. Configuration and parameters of the FC-HEV are listed in Table 1.
B. Fuel Cell Modeling
Among the several types of fuel cells available in the market, proton exchange membrane fuel cell (PEMFC) has become one of the most adaptable fuel cells as a mobile power supply for vehicles due to its high-power output, simple structure, and easy operation [44]. Besides, PEMFC's best working temperature is 80℃-90℃, but it also can operate normally at room temperature. In the presented study, PEMFC is employed as the main power source, and the PEMFC model is constructed as follows [45]:
0
1ln( )
/ 3 1FC
FC OC ohm FCd
IV E NA R I
i sT
(1)
where 𝑉 (V), 𝐼 (A) are the FC stack output voltage and current, respectively; 𝑅 (Ω) is the internal resistance; 𝐸 (V)
is the open-circuit voltage; 𝑖 (A) is the exchanged current; 𝑁 is the number of cells; 𝐴 is the Tafel slope; and 𝑇 is the reaction time.
Current output 𝐼 is controlled by DC-DC converter, and the output power 𝑃 can be calculated as:
𝑃 𝑉 ∗ 𝐼 (2) An empirical equivalent fuel cell degradation model
proposed in [46] is employed to quantify the operational degradation of fuel cell. According to this model, the working conditions that would accelerate fuel cell degradation can mainly be classified into four categories: load changing, startup and shutdown, idling, and high-power load. The empirical formula for the percentage voltage decline of a fuel cell stack is shown as follows:
1 1 2 2 3 3 4( )FC pk k t k t k t k n (3)
where Δ𝜙 (%) denotes the performance decline, defined as the percentage voltage drop in a fixed current; 𝑡 , 𝑡 , 𝑡 and 𝑛 are duration of idling, duration of dynamic loading, duration of heavy loading, and start-stop count, respectively. The value and definition of parameters in (3) are summarized in Table. 2.
With this degradation quantification model, the operational degradation of fuel cell in different scenarios or under different PMS can be evaluated and transformed into system cost.
C. Fuel Cell Modeling
Lithium-iron Phosphate battery is used as the other part of power source in the HESS to assist the FC, and the internal resistance battery model is adopted here to represent the dynamic characteristics of the battery [47]. During HESS
operation, battery state is updated as follows:
𝑆𝑜𝐶 𝐼 /𝑄
𝑈𝑉 𝑆𝑜𝐶 𝐼 𝑟 𝑆𝑜𝐶 , 𝑐ℎ𝑎𝑟𝑔𝑖𝑛𝑔
𝑉 𝑆𝑜𝐶 𝐼 𝑟 𝑆𝑜𝐶 , 𝑑𝑖𝑠𝑐ℎ𝑎𝑟𝑔𝑖𝑛𝑔 (4)
where 𝑉 𝑆𝑜𝐶 is the open circuit voltage as a function of battery state of charge (SoC); 𝑟(Ω) is the internal resistance and is different in charging or discharging; 𝑄 (Ah) is the battery capacity; 𝑈 (V), and 𝐼 (A) are the output voltage and current, respectively.
In this study, battery SoC is limited between 0.3-0.8. An empirical equivalent battery degradation model proposed in [48] is employed to quantify the operational degradation of battery. Li-ion battery is considered to reach the end of its life when 20% of capacity has been lost, during which the battery can work about 5000 full cycles [49]. The life of the battery is also affected by the charge/discharge rate (C-rate). The fitting result of the relationship between the battery's cycle life correction factor and C-rate is presented as follows [48]:
TABLE I FCHEV PARAMETERS
Component Parameter Value
Traction Motor Maximum Power/kw 150 Maximum torque/Nm 2000
Fuel cell Type PEMFC
Maximum power/kw 75 DC-DC
converter Maximum power/kw 75
Battery type Type LiFePO4
DC bus Voltage/V 576
Vehicle
Loaded mass/kg 14000 Air resistance coefficient 0.55
Rolling resistance coefficient
0.0095
Tire rolling radius/mm 473 Transmission efficiency 0.93
Windward area/m2 6.6
TABLE Ⅱ FC DEGRADATION MODEL COEFFICIENTS
Coefficient Value Definition
𝑘 0.00356(/h) Output power less than 10% of
rated power
𝑘 0.00126(/h) Power variations rate larger
than 10% of max power 𝑘 0.00147 (/h) Higher than 90% of max power 𝑘 0.00196(/count) One full start-stop count
𝐾𝑝 1.47 Modified coefficient for on-
road systems
Authorized licensed use limited to: COVENTRY UNIVERSITY. Downloaded on June 17,2021 at 13:49:33 UTC from IEEE Xplore. Restrictions apply.
2332-7782 (c) 2021 IEEE. Personal use is permitted, but republication/redistribution requires IEEE permission. See http://www.ieee.org/publications_standards/publications/rights/index.html for more information.
This article has been accepted for publication in a future issue of this journal, but has not been fully edited. Content may change prior to final publication. Citation information: DOI 10.1109/TTE.2021.3074792, IEEETransactions on Transportation Electrification
> REPLACE THIS LINE WITH YOUR PAPER IDENTIFICATION NUMBER (DOUBLE-CLICK HERE TO EDIT) <
4
𝜉 𝜉 |𝐶𝑟𝑎𝑡𝑒| 𝜉 |𝐶𝑟𝑎𝑡𝑒| 𝜉 (5)
where 𝜉 , 𝜉 , 𝜉 are the curve-fitting coefficients, and their values are 0.0023, -0.1014 and 1.1146, respectively. The model originates from rain-flow cycle counting algorithm [50], which reconstructs battery charging/discharging half cycles with different depth of discharge, and evaluates the loss of lifetime with the reconstructed cycles. Therefore, the aging effect of charging is considered in integration with discharging, and negative C-rate from regenerative braking is considered in the form of absolute value.
The total energy that battery can release during its service life is constant. Therefore, the life degradation factor of a battery can be formulated as:
Δ𝜙𝑃 _ 𝜉 𝑑𝑡
5000 ∗ 3600 ∗ 𝐸 (6)
where 𝑃 _ (kW) is the discharge power during battery operation; 𝐸 (kWh) is the capacity of the battery.
III. SYNERGISTIC SIZING-PMS FRAMEWORK
Energy management strategy and component sizing study are coupled issues, but are usually separately discussed in existing literatures. The synergistic sizing-PMS framework simultaneously deriving both optimized sizing parameters and the corresponding optimal PMS is introduced in this section.
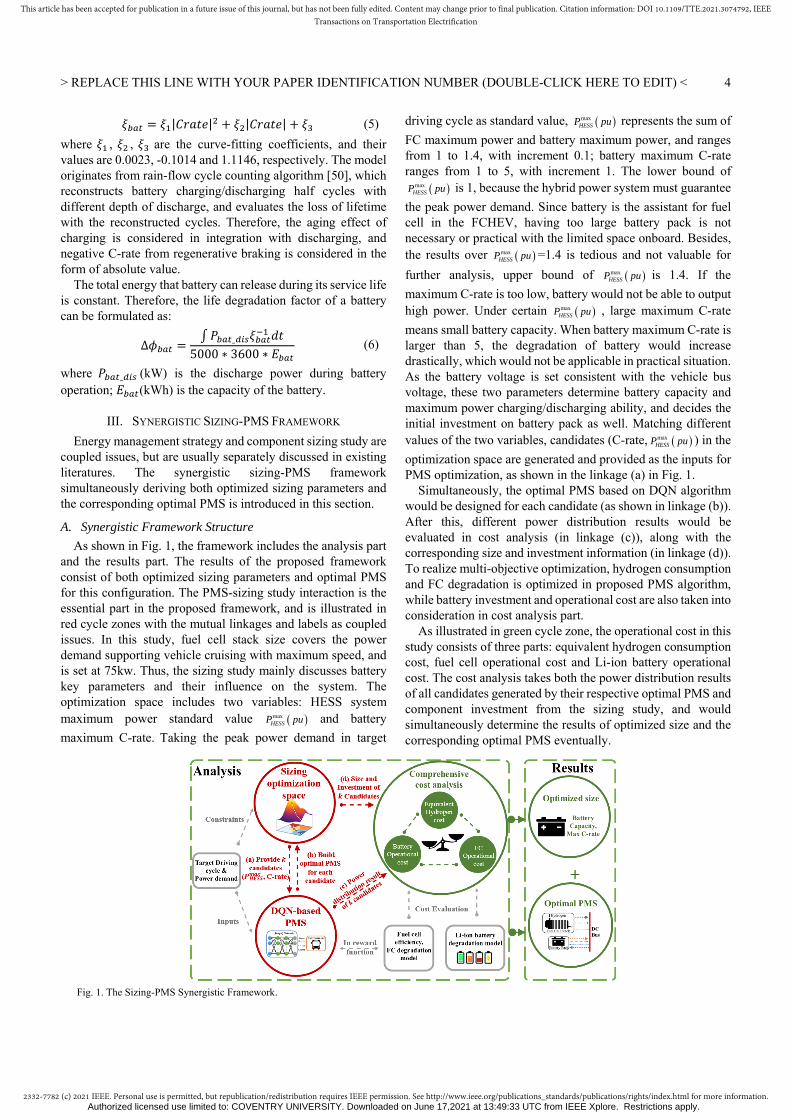
A. Synergistic Framework Structure
As shown in Fig. 1, the framework includes the analysis part and the results part. The results of the proposed framework consist of both optimized sizing parameters and optimal PMS for this configuration. The PMS-sizing study interaction is the essential part in the proposed framework, and is illustrated in red cycle zones with the mutual linkages and labels as coupled issues. In this study, fuel cell stack size covers the power demand supporting vehicle cruising with maximum speed, and is set at 75kw. Thus, the sizing study mainly discusses battery key parameters and their influence on the system. The optimization space includes two variables: HESS system maximum power standard value max
HESSP pu and battery
maximum C-rate. Taking the peak power demand in target
driving cycle as standard value, maxHESSP pu represents the sum of
FC maximum power and battery maximum power, and ranges from 1 to 1.4, with increment 0.1; battery maximum C-rate ranges from 1 to 5, with increment 1. The lower bound of
maxHESSP pu is 1, because the hybrid power system must guarantee
the peak power demand. Since battery is the assistant for fuel cell in the FCHEV, having too large battery pack is not necessary or practical with the limited space onboard. Besides, the results over max
HESSP pu =1.4 is tedious and not valuable for
further analysis, upper bound of maxHESSP pu is 1.4. If the
maximum C-rate is too low, battery would not be able to output high power. Under certain max
HESSP pu , large maximum C-rate
means small battery capacity. When battery maximum C-rate is larger than 5, the degradation of battery would increase drastically, which would not be applicable in practical situation. As the battery voltage is set consistent with the vehicle bus voltage, these two parameters determine battery capacity and maximum power charging/discharging ability, and decides the initial investment on battery pack as well. Matching different values of the two variables, candidates (C-rate, max
HESSP pu ) in the
optimization space are generated and provided as the inputs for PMS optimization, as shown in the linkage (a) in Fig. 1.
Simultaneously, the optimal PMS based on DQN algorithm would be designed for each candidate (as shown in linkage (b)). After this, different power distribution results would be evaluated in cost analysis (in linkage (c)), along with the corresponding size and investment information (in linkage (d)). To realize multi-objective optimization, hydrogen consumption and FC degradation is optimized in proposed PMS algorithm, while battery investment and operational cost are also taken into consideration in cost analysis part.
As illustrated in green cycle zone, the operational cost in this study consists of three parts: equivalent hydrogen consumption cost, fuel cell operational cost and Li-ion battery operational cost. The cost analysis takes both the power distribution results of all candidates generated by their respective optimal PMS and component investment from the sizing study, and would simultaneously determine the results of optimized size and the corresponding optimal PMS eventually.
Fig. 1. The Sizing-PMS Synergistic Framework.
Authorized licensed use limited to: COVENTRY UNIVERSITY. Downloaded on June 17,2021 at 13:49:33 UTC from IEEE Xplore. Restrictions apply.
2332-7782 (c) 2021 IEEE. Personal use is permitted, but republication/redistribution requires IEEE permission. See http://www.ieee.org/publications_standards/publications/rights/index.html for more information.
This article has been accepted for publication in a future issue of this journal, but has not been fully edited. Content may change prior to final publication. Citation information: DOI 10.1109/TTE.2021.3074792, IEEETransactions on Transportation Electrification
> REPLACE THIS LINE WITH YOUR PAPER IDENTIFICATION NUMBER (DOUBLE-CLICK HERE TO EDIT) <
5
As shown in the grey box zone, the target typical driving cycle is used as the power demand input and constraints on PMS optimization and sizing optimization space design. Widely adopted typical driving cycles includes Urban Dynamometer Driving Schedule (UDDS), the New European Driving Cycle (NEDC), etc. The input driving cycle is flexible, and should be determined according to target vehicle types and working scenarios. In this study, as the power system is designed for a fuel cell hybrid city bus, the Chinese typical urban driving cycle (CTUDC) is used to simulate city driving conditions. The details of the testing driving cycle is described in [51]. Component models as described in section Ⅱ are used in PMS optimization and cost analysis to calculate hydrogen consumption and operational costs.
B. Comprehensive cost analysis Details
Hydrogen consumption consists of the hydrogen consumed by fuel cell and the equivalent hydrogen transformed from battery output power, which can be described as:
Δ𝑚 𝑓 𝑃 (7)
Δ𝑚 Δ𝐸 /𝜂 𝐿𝐻𝑉 (8) where Δ𝐸 (J) is the change of battery stored energy, 𝜂 is the efficiency factor, and 𝐿𝐻𝑉 (J/kg) is the low heat value of hydrogen. Hydrogen mass consumed by fuel cell is a function of its output power.
Then the equivalent fuel cost can be derived as:
𝐶𝑜𝑠𝑡 Δ𝑚𝐻2 𝐹𝐶 𝛥𝑚𝐻2 𝑏𝑎𝑡 𝑃𝑟𝑖𝑐𝑒𝑓𝑢𝑒𝑙 (9)
Fuel cell operational cost includes quantified degradation cost and the average investment in DC-DC converter. The price of the DC-DC converter for FC is ¥300/kW[48]. In this study, fuel cell initial investment including the cost of DC-DC converter is regarded as distributed averagely through the whole service life and integrated into the degradation cost [52]. According to the fuel cell degradation quantification model (3), fuel cell operational cost can be calculated as follows:
𝐶𝑜𝑠𝑡Δ𝜙10%
∗ 𝑃𝑟𝑖𝑐𝑒 𝑃𝑟𝑖𝑐𝑒 / (10)
where 𝑃𝑟𝑖𝑐𝑒 (¥) denotes fuel cell investment, and 10% is because of fuel cell is considered at its end when it reaches 10% of percentage voltage drop. 𝑃𝑟𝑖𝑐𝑒 / denotes the investment on the DC-DC converter.
According to the battery degradation quantification model (5), (6), battery degradation cost can be calculated as follows:
𝑃𝑟𝑖𝑐𝑒 𝑃𝑟𝑖𝑐𝑒 _ ∗ 𝑄 (11)
𝐶𝑜𝑠𝑡 Δ𝜙 ∗ 𝑃𝑟𝑖𝑐𝑒 (12) where 𝑃𝑟𝑖𝑐𝑒 _ (¥/Ah) denotes battery unit price; 𝑄 (Ah) is the battery capacity.
𝑃𝑟𝑖𝑐𝑒 denotes the initial investment of the battery pack. As Δ𝜙 is the percentage drop of battery service life, battery initial investment is regarded as distributed averagely through the whole service life and integrated into the degradation cost. In this way, the operational cost of the battery would not only be related with degradation, but also be influenced with its initial investment.
After the quantification of each part of cost is established, the
overall operational cost of the HESS during certain driving cycle can be derived as the sum of each part:
𝐶𝑜𝑠𝑡 𝐶𝑜𝑠𝑡𝐻2 𝐶𝑜𝑠𝑡 𝐶𝑜𝑠𝑡 (13) The prices of hydrogen, battery unit and fuel cell unit are set
as ¥70/kg [53], ¥2000/Ah [54], and ¥3000/kW [55], respectively.
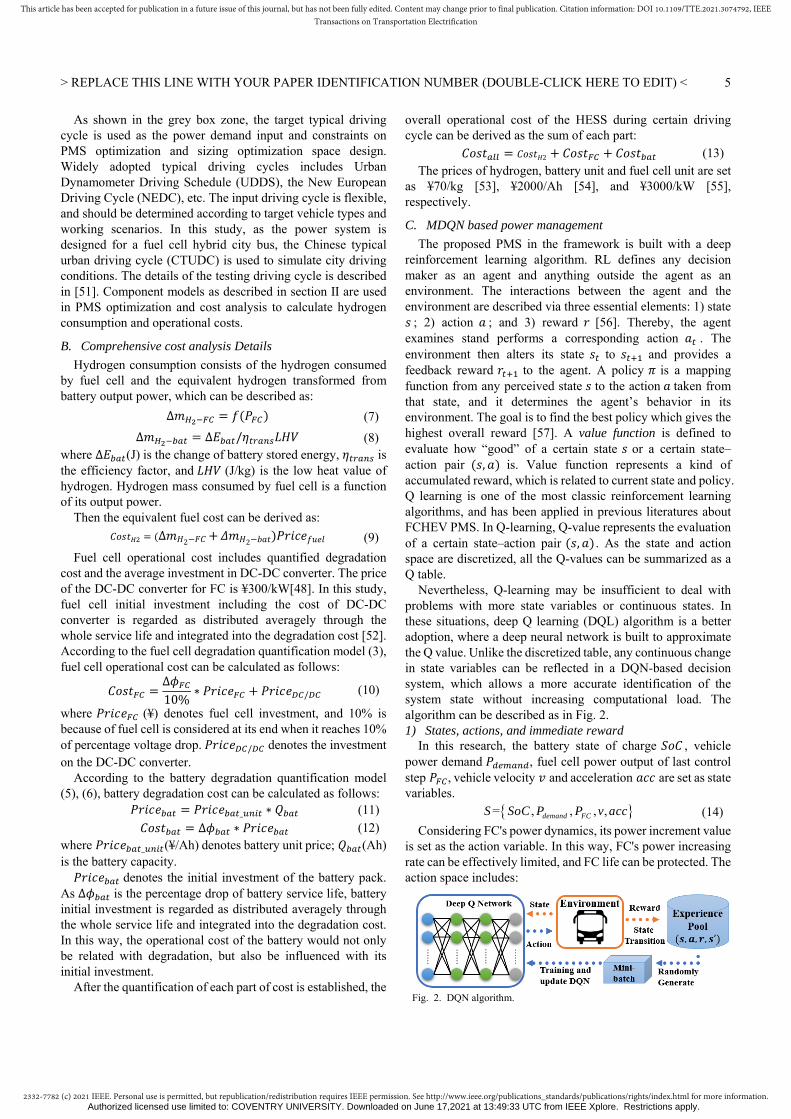
C. MDQN based power management
The proposed PMS in the framework is built with a deep reinforcement learning algorithm. RL defines any decision maker as an agent and anything outside the agent as an environment. The interactions between the agent and the environment are described via three essential elements: 1) state 𝑠 ; 2) action 𝑎 ; and 3) reward 𝑟 [56]. Thereby, the agent examines stand performs a corresponding action 𝑎 . The environment then alters its state 𝑠 to 𝑠 and provides a feedback reward 𝑟 to the agent. A policy 𝜋 is a mapping function from any perceived state 𝑠 to the action 𝑎 taken from that state, and it determines the agent’s behavior in its environment. The goal is to find the best policy which gives the highest overall reward [57]. A value function is defined to evaluate how “good” of a certain state 𝑠 or a certain state–action pair 𝑠, 𝑎 is. Value function represents a kind of accumulated reward, which is related to current state and policy. Q learning is one of the most classic reinforcement learning algorithms, and has been applied in previous literatures about FCHEV PMS. In Q-learning, Q-value represents the evaluation of a certain state–action pair 𝑠, 𝑎 . As the state and action space are discretized, all the Q-values can be summarized as a Q table.
Nevertheless, Q-learning may be insufficient to deal with problems with more state variables or continuous states. In these situations, deep Q learning (DQL) algorithm is a better adoption, where a deep neural network is built to approximate the Q value. Unlike the discretized table, any continuous change in state variables can be reflected in a DQN-based decision system, which allows a more accurate identification of the system state without increasing computational load. The algorithm can be described as in Fig. 2. 1) States, actions, and immediate reward
In this research, the battery state of charge 𝑆𝑜𝐶 , vehicle power demand 𝑃 , fuel cell power output of last control step 𝑃 , vehicle velocity 𝑣 and acceleration 𝑎𝑐𝑐 are set as state variables.
= , , , ,demand FCS SoC P P v acc (14)
Considering FC's power dynamics, its power increment value is set as the action variable. In this way, FC's power increasing rate can be effectively limited, and FC life can be protected. The action space includes:
Fig. 2. DQN algorithm.
Authorized licensed use limited to: COVENTRY UNIVERSITY. Downloaded on June 17,2021 at 13:49:33 UTC from IEEE Xplore. Restrictions apply.
2332-7782 (c) 2021 IEEE. Personal use is permitted, but republication/redistribution requires IEEE permission. See http://www.ieee.org/publications_standards/publications/rights/index.html for more information.
This article has been accepted for publication in a future issue of this journal, but has not been fully edited. Content may change prior to final publication. Citation information: DOI 10.1109/TTE.2021.3074792, IEEETransactions on Transportation Electrification
> REPLACE THIS LINE WITH YOUR PAPER IDENTIFICATION NUMBER (DOUBLE-CLICK HERE TO EDIT) <
6
max max max1, 0, 1, 0.5 , , , 0Fc Fc FcA R R R set (15)
where maxFcR denotes FC max power increasing rate, so the
actions include increasing 1kW, remain unchanged, decrease
1kW, increase half of maxFcR , increase max
FcR , decrease maxFcR ,
and set 0. After the action is taken, the FC power output at each time
step is always constrained as follows: 0 𝑃 𝑃 (16) The single-step reward function needs to be appropriately
defined in accordance with the optimization objective, reward function is one of the key factors in determining the performance of the DQN. As the RL agent is always trying to maximize the reward, the reciprocal form is adopted in reward function to ensure the consistency. In this work, the optimization objectives include minimizing equivalent hydrogen consumption as well as suppressing FC degradation. The DQN-algorithm with this multi-objective reward function is named MDQN. According to (10)-(12), the reward function is defined as:
𝑟 𝜔 Δ𝑚𝐻2 𝐹𝐶 𝛥𝑚𝐻2 𝑏𝑎𝑡 (17)
𝑟 𝜔 Δ𝜙𝐹𝐶 (18)
𝑟 tanh 𝛼
𝜔 𝑟 𝜔 𝑟𝜔 SoC (19)
where 𝛼 is a factor, 𝜔 , and 𝜔 are weight factors between two optimization objectives; 𝜔 is the punishment value to constrain battery SoC. When battery SoC is within 0.3-0.8, 𝜔 0.
It must be noted that, battery degradation cost is not included in the reward function of MDQN. Because of the distinct dynamics of the power components, adding battery degradation cost into reward function reduced battery's high C-rate discharging scenarios, but fuel cell would take more control steps to return to high-efficiency and stable operation after drastic variation in power output, which leads to fuel cell degradation and more hydrogen consumption. It did not help in reducing the overall cost. But the necessity of controlling battery degradation cost is still recognized, and this part of impact is put into overall system cost. 2) MDQN structure
In proposed MDQN-PMS, Q-network with multi-layer perceptron is designed to learn the relationship between environment states and optimal actions. The inputs of the Q-network are the normalized continuous state variables, as defined in (14). The outputs are the Q-values of each action. Therefore, the third layer includes the Q values of each action level and the action with largest Q-value is selected for output. Besides, there are 2 hidden layers with 50 and 100 number of neurons, respectively, and all of them are fully connected Relu layers. 3) MDQN training
As the backpropagation and gradient decent in training the Q-network requires a loss, a target Q-network 𝑄∗ is built based on the evaluation Q-network. These two networks share the same structure, but the weights and biases 𝜃∗ in the target Q-network are periodically copied from the evaluation Q-network
parameters 𝜃 , and kept constant between the updates. According to the mathematical preconditions of machine learning, there will be issues if we train the network with these consecutive samples, owing to the strong correlations between the samples in a short time period. Therefore, an experience pool is built to store the state transition that would be used to train the Q-network, and the data saved in the experience pool would be quadruplets 𝑠, 𝑎, 𝑟, 𝑠′ that contains the current state 𝑠, the action 𝑎, the immediate reward after executing the action 𝑟, and the state at the next moment 𝑠’. A batch of data would be randomly selected from the experience pool each time the Q-network is trained. The exact procedure of MDQN-PMS is demonstrated in Table 3, and the hyperparameters are listed in Table 4.
IV. SIMULATION RESULTS AND DISCUSSION
In this section, the results of comprehensive cost analysis are summarized and illustrated. In this study, models of the components in the hybrid power system and RL algorithms are programmed in Python. The performance of the different PMS is trained and then tested in Matlab/Simulink platform.
A. Sizing study results
With the optimized power distribution result of each candidate, comprehensive operational cost analysis is
completed to search for the optimal system size. The results are illustrated in heat graphs. The two dimensions represents the two sizing parameters, battery maximum C-rate, and standardized maximum system power rating (pu), (C-rate,
maxHESSP pu ). Each cube represents the result of one candidate,
where the color would be darker if the value is smaller.
TABLE III MDQN-PMS FRAMEWORK
Initialization: experience pool 𝑬; random parameters 𝜽 for evaluation Q-network; parameters 𝜽∗ for target Q-network, 𝜽∗ 𝜽 1. For each episode: 2. 𝑠 𝑠 3. For 1 t (one CTUDC length): 4. 𝜖 𝑟𝑎𝑛𝑑𝑜𝑚 0, 1 5. If 𝜖 < 𝜖 : 6. 𝑎 𝑎𝑟𝑔 max 𝑄∗ 𝑠 , 𝑎; 𝜃
Else: 𝑎 𝑟𝑎𝑛𝑑𝑜𝑚 𝑎
7. 𝑠 𝑓 𝑎 8. 𝑟 𝑓′ 𝑠 , 𝑎 9. Store 𝑠 , 𝑎 , 𝑟 , 𝑠 in 𝐸 10. Randomly sample minibatch 𝐷 from 𝐸 11. 𝑦 𝑟 𝛾 max 𝑄∗ 𝑠 , 𝑎′; 𝜃 12. train 𝑄's parameter 𝜃 with a gradient decent step,
𝑙𝑜𝑠𝑠 𝑦 𝑄 𝑠 , 𝑎 ; 𝜃 13. Every 50 steps update 𝜃∗ 𝜃 14. End for 15. End for
TABLE Ⅳ MDQN HYPERPARAMETERS
Parameters Value Discount factor (𝛾) 0.99
Greedy possibility (𝜖) From 0 to 0.9 Replace target iteration 200
Memory pool size 2000 Learning rate (𝛼) 0.0025
Nodes in each layer 50, 100
Authorized licensed use limited to: COVENTRY UNIVERSITY. Downloaded on June 17,2021 at 13:49:33 UTC from IEEE Xplore. Restrictions apply.
2332-7782 (c) 2021 IEEE. Personal use is permitted, but republication/redistribution requires IEEE permission. See http://www.ieee.org/publications_standards/publications/rights/index.html for more information.
This article has been accepted for publication in a future issue of this journal, but has not been fully edited. Content may change prior to final publication. Citation information: DOI 10.1109/TTE.2021.3074792, IEEETransactions on Transportation Electrification
> REPLACE THIS LINE WITH YOUR PAPER IDENTIFICATION NUMBER (DOUBLE-CLICK HERE TO EDIT) <
7
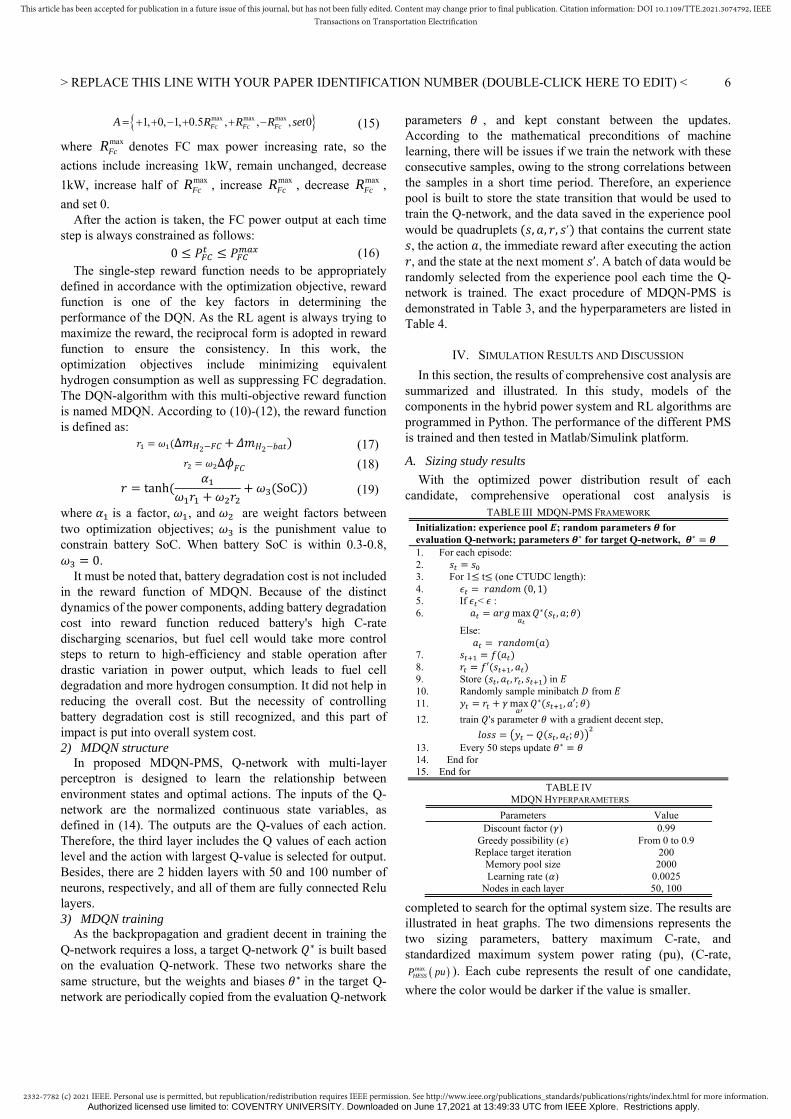
1) Component degradation The quantified degradation of both components is
summarized in Fig. 3. The x-axis of the graph represents battery maximum C-rate, while y-axis is the standardized maximum system power rating (pu). As the size of FC stack is set constant in this study, different max
HESSP pu and battery maximum C-rate
would require a specific battery capacity. Under the same maximum C-rate, larger battery size is required with higher
maxHESSP pu .
Fuel cell degradation is shown in Fig. (3)(a). Under the same system power standard max
HESSP pu , as battery maximum power
charging/discharging ability is generally the same, there is no significant distinction in how the battery can protect the fuel cell. Besides, MDQN-based PMS considered both cutting down hydrogen consumption and suppressing fuel cell degradation. Rather than simply relying on battery as much as possible, the power distribution between fuel cell and battery tried to seek a balance between two objectives. Therefore, the relationship between FC degradation and different maximum C-rate cannot
be concluded into a straight forward and unitary pattern. Basically, FC degradation is smaller with larger max
HESSP pu ,
which is equal to larger battery size. Therefore, in FC-protection aspect, larger battery power rating would be preferable. According to the battery degradation illustrated in Fig. 3 (b), with smaller maximum C-rate and larger system power rating, the output current would be restrained, and battery degradation would be smaller since battery degradation is directly related to C-rate. Therefore, in battery-protection aspect, larger battery size and the smaller maximum C-rate would be a better option. 2) Operational cost analysis
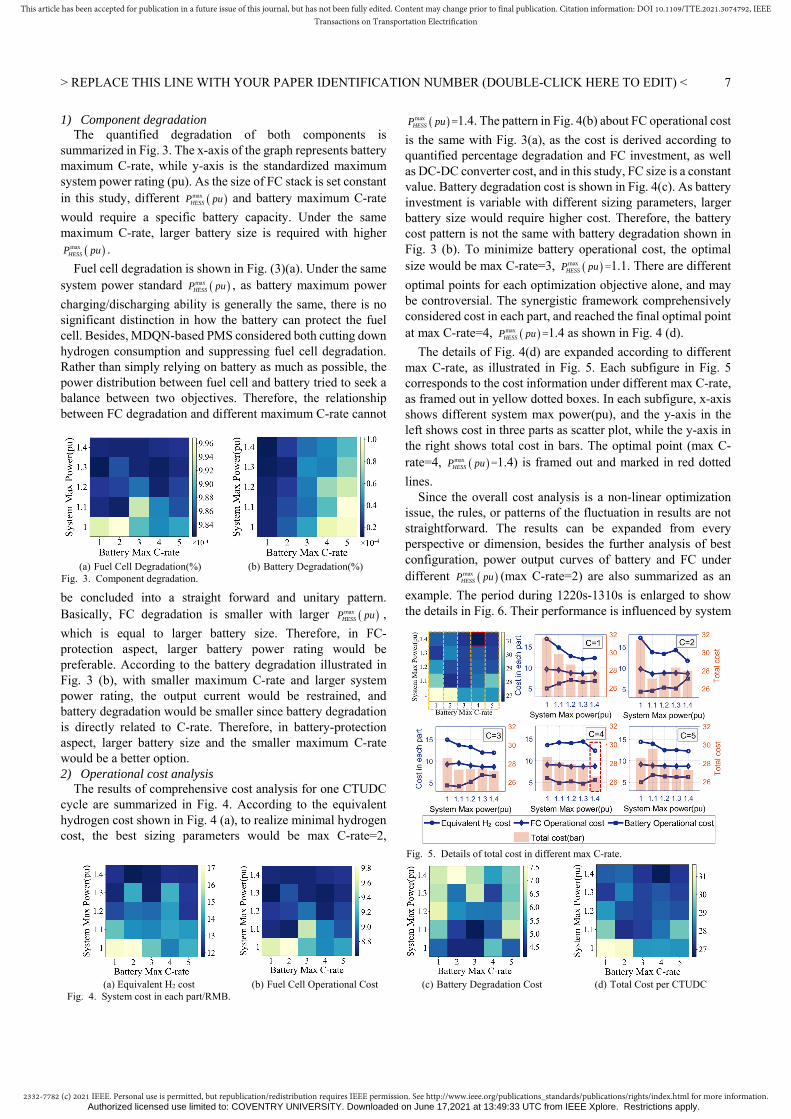
The results of comprehensive cost analysis for one CTUDC cycle are summarized in Fig. 4. According to the equivalent hydrogen cost shown in Fig. 4 (a), to realize minimal hydrogen cost, the best sizing parameters would be max C-rate=2,
maxHESSP pu =1.4. The pattern in Fig. 4(b) about FC operational cost
is the same with Fig. 3(a), as the cost is derived according to quantified percentage degradation and FC investment, as well as DC-DC converter cost, and in this study, FC size is a constant value. Battery degradation cost is shown in Fig. 4(c). As battery investment is variable with different sizing parameters, larger battery size would require higher cost. Therefore, the battery cost pattern is not the same with battery degradation shown in Fig. 3 (b). To minimize battery operational cost, the optimal size would be max C-rate=3, max
HESSP pu =1.1. There are different
optimal points for each optimization objective alone, and may be controversial. The synergistic framework comprehensively considered cost in each part, and reached the final optimal point at max C-rate=4, max
HESSP pu =1.4 as shown in Fig. 4 (d).
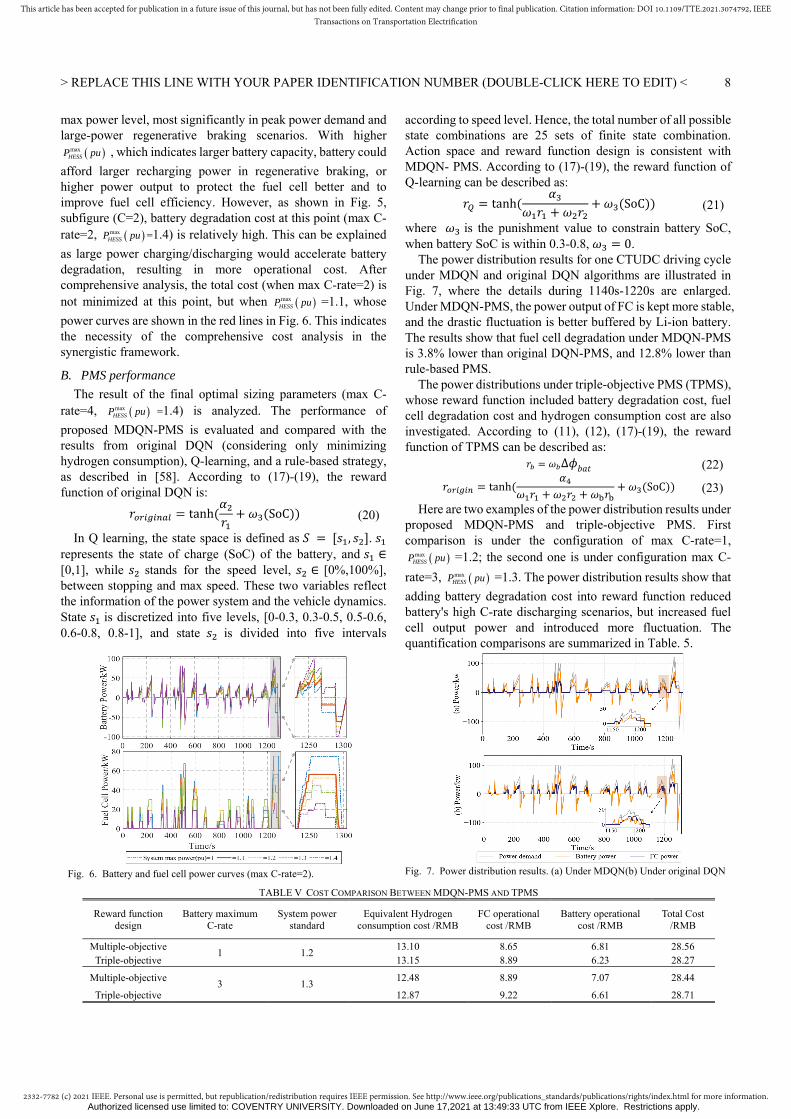
The details of Fig. 4(d) are expanded according to different max C-rate, as illustrated in Fig. 5. Each subfigure in Fig. 5 corresponds to the cost information under different max C-rate, as framed out in yellow dotted boxes. In each subfigure, x-axis shows different system max power(pu), and the y-axis in the left shows cost in three parts as scatter plot, while the y-axis in the right shows total cost in bars. The optimal point (max C-rate=4, max
HESSP pu =1.4) is framed out and marked in red dotted
lines. Since the overall cost analysis is a non-linear optimization
issue, the rules, or patterns of the fluctuation in results are not straightforward. The results can be expanded from every perspective or dimension, besides the further analysis of best configuration, power output curves of battery and FC under different max
HESSP pu (max C-rate=2) are also summarized as an
example. The period during 1220s-1310s is enlarged to show the details in Fig. 6. Their performance is influenced by system
(a) Fuel Cell Degradation(%) (b) Battery Degradation(%)
Fig. 3. Component degradation.
(a) Equivalent H2 cost (b) Fuel Cell Operational Cost (c) Battery Degradation Cost (d) Total Cost per CTUDC
Fig. 4. System cost in each part/RMB.
Fig. 5. Details of total cost in different max C-rate.
Authorized licensed use limited to: COVENTRY UNIVERSITY. Downloaded on June 17,2021 at 13:49:33 UTC from IEEE Xplore. Restrictions apply.
2332-7782 (c) 2021 IEEE. Personal use is permitted, but republication/redistribution requires IEEE permission. See http://www.ieee.org/publications_standards/publications/rights/index.html for more information.
This article has been accepted for publication in a future issue of this journal, but has not been fully edited. Content may change prior to final publication. Citation information: DOI 10.1109/TTE.2021.3074792, IEEETransactions on Transportation Electrification
> REPLACE THIS LINE WITH YOUR PAPER IDENTIFICATION NUMBER (DOUBLE-CLICK HERE TO EDIT) <
8
max power level, most significantly in peak power demand and large-power regenerative braking scenarios. With higher
maxHESSP pu , which indicates larger battery capacity, battery could
afford larger recharging power in regenerative braking, or higher power output to protect the fuel cell better and to improve fuel cell efficiency. However, as shown in Fig. 5, subfigure (C=2), battery degradation cost at this point (max C-rate=2, max
HESSP pu =1.4) is relatively high. This can be explained
as large power charging/discharging would accelerate battery degradation, resulting in more operational cost. After comprehensive analysis, the total cost (when max C-rate=2) is not minimized at this point, but when max
HESSP pu =1.1, whose
power curves are shown in the red lines in Fig. 6. This indicates the necessity of the comprehensive cost analysis in the synergistic framework.
B. PMS performance
The result of the final optimal sizing parameters (max C-rate=4, max
HESSP pu =1.4) is analyzed. The performance of
proposed MDQN-PMS is evaluated and compared with the results from original DQN (considering only minimizing hydrogen consumption), Q-learning, and a rule-based strategy, as described in [58]. According to (17)-(19), the reward function of original DQN is:
𝑟 tanh 𝛼𝑟
𝜔 SoC (20)
In Q learning, the state space is defined as 𝑆 𝑠 , 𝑠 . 𝑠 represents the state of charge (SoC) of the battery, and 𝑠 ∈ [0,1], while 𝑠 stands for the speed level, 𝑠 ∈ [0%,100%], between stopping and max speed. These two variables reflect the information of the power system and the vehicle dynamics. State 𝑠 is discretized into five levels, [0-0.3, 0.3-0.5, 0.5-0.6, 0.6-0.8, 0.8-1], and state 𝑠 is divided into five intervals
according to speed level. Hence, the total number of all possible state combinations are 25 sets of finite state combination. Action space and reward function design is consistent with MDQN- PMS. According to (17)-(19), the reward function of Q-learning can be described as:
𝑟 tanh 𝛼
𝜔 𝑟 𝜔 𝑟𝜔 SoC (21)
where 𝜔 is the punishment value to constrain battery SoC, when battery SoC is within 0.3-0.8, 𝜔 0.
The power distribution results for one CTUDC driving cycle under MDQN and original DQN algorithms are illustrated in Fig. 7, where the details during 1140s-1220s are enlarged. Under MDQN-PMS, the power output of FC is kept more stable, and the drastic fluctuation is better buffered by Li-ion battery. The results show that fuel cell degradation under MDQN-PMS is 3.8% lower than original DQN-PMS, and 12.8% lower than rule-based PMS.
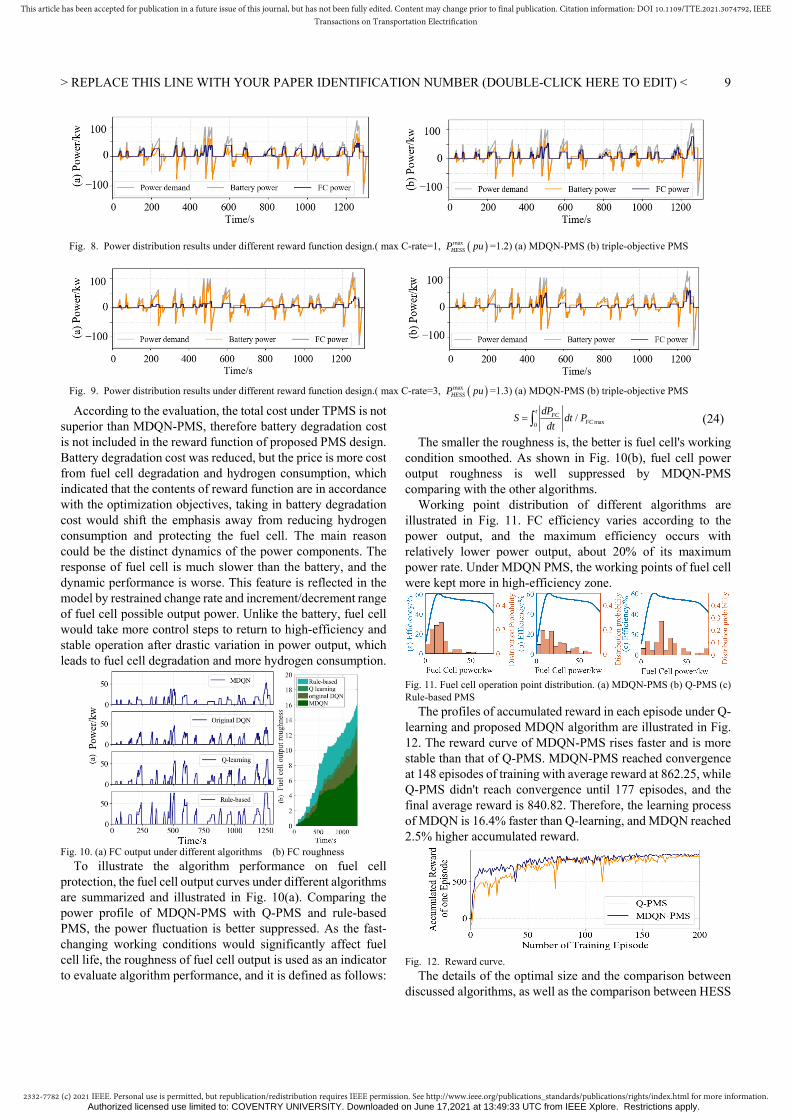
The power distributions under triple-objective PMS (TPMS), whose reward function included battery degradation cost, fuel cell degradation cost and hydrogen consumption cost are also investigated. According to (11), (12), (17)-(19), the reward function of TPMS can be described as:
𝑟 𝜔 Δ𝜙𝑏𝑎𝑡 (22)
𝑟 tanh 𝛼
𝜔 𝑟 𝜔 𝑟 𝜔 𝑟𝜔 SoC (23)
Here are two examples of the power distribution results under proposed MDQN-PMS and triple-objective PMS. First comparison is under the configuration of max C-rate=1,
maxHESSP pu =1.2; the second one is under configuration max C-
rate=3, maxHESSP pu =1.3. The power distribution results show that
adding battery degradation cost into reward function reduced battery's high C-rate discharging scenarios, but increased fuel cell output power and introduced more fluctuation. The quantification comparisons are summarized in Table. 5.
Fig. 7. Power distribution results. (a) Under MDQN(b) Under original DQN
Fig. 6. Battery and fuel cell power curves (max C-rate=2).
TABLE Ⅴ COST COMPARISON BETWEEN MDQN-PMS AND TPMS
Reward function design
Battery maximum C-rate
System power standard
Equivalent Hydrogen consumption cost /RMB
FC operational cost /RMB
Battery operational cost /RMB
Total Cost /RMB
Multiple-objective 1 1.2
13.10 8.65 6.81 28.56 Triple-objective 13.15 8.89 6.23 28.27
Multiple-objective 3 1.3
12.48 8.89 7.07 28.44
Triple-objective 12.87 9.22 6.61 28.71
Authorized licensed use limited to: COVENTRY UNIVERSITY. Downloaded on June 17,2021 at 13:49:33 UTC from IEEE Xplore. Restrictions apply.
2332-7782 (c) 2021 IEEE. Personal use is permitted, but republication/redistribution requires IEEE permission. See http://www.ieee.org/publications_standards/publications/rights/index.html for more information.
This article has been accepted for publication in a future issue of this journal, but has not been fully edited. Content may change prior to final publication. Citation information: DOI 10.1109/TTE.2021.3074792, IEEETransactions on Transportation Electrification
> REPLACE THIS LINE WITH YOUR PAPER IDENTIFICATION NUMBER (DOUBLE-CLICK HERE TO EDIT) <
9
According to the evaluation, the total cost under TPMS is not superior than MDQN-PMS, therefore battery degradation cost is not included in the reward function of proposed PMS design. Battery degradation cost was reduced, but the price is more cost from fuel cell degradation and hydrogen consumption, which indicated that the contents of reward function are in accordance with the optimization objectives, taking in battery degradation cost would shift the emphasis away from reducing hydrogen consumption and protecting the fuel cell. The main reason could be the distinct dynamics of the power components. The response of fuel cell is much slower than the battery, and the dynamic performance is worse. This feature is reflected in the model by restrained change rate and increment/decrement range of fuel cell possible output power. Unlike the battery, fuel cell would take more control steps to return to high-efficiency and stable operation after drastic variation in power output, which leads to fuel cell degradation and more hydrogen consumption.
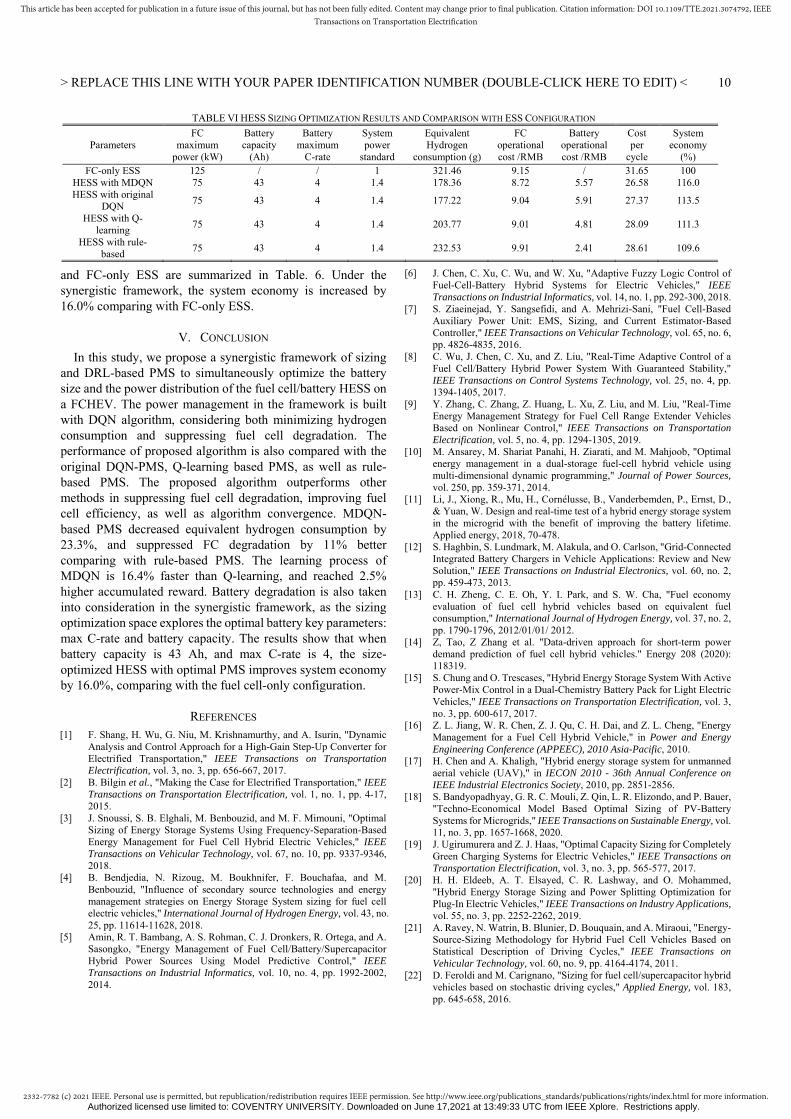
Fig. 10. (a) FC output under different algorithms (b) FC roughness
To illustrate the algorithm performance on fuel cell protection, the fuel cell output curves under different algorithms are summarized and illustrated in Fig. 10(a). Comparing the power profile of MDQN-PMS with Q-PMS and rule-based PMS, the power fluctuation is better suppressed. As the fast-changing working conditions would significantly affect fuel cell life, the roughness of fuel cell output is used as an indicator to evaluate algorithm performance, and it is defined as follows:
max0/
tFC
FC
dPS dt P
dt (24)
The smaller the roughness is, the better is fuel cell's working condition smoothed. As shown in Fig. 10(b), fuel cell power output roughness is well suppressed by MDQN-PMS comparing with the other algorithms.
Working point distribution of different algorithms are illustrated in Fig. 11. FC efficiency varies according to the power output, and the maximum efficiency occurs with relatively lower power output, about 20% of its maximum power rate. Under MDQN PMS, the working points of fuel cell were kept more in high-efficiency zone.
Fig. 11. Fuel cell operation point distribution. (a) MDQN-PMS (b) Q-PMS (c) Rule-based PMS
The profiles of accumulated reward in each episode under Q-learning and proposed MDQN algorithm are illustrated in Fig. 12. The reward curve of MDQN-PMS rises faster and is more stable than that of Q-PMS. MDQN-PMS reached convergence at 148 episodes of training with average reward at 862.25, while Q-PMS didn't reach convergence until 177 episodes, and the final average reward is 840.82. Therefore, the learning process of MDQN is 16.4% faster than Q-learning, and MDQN reached 2.5% higher accumulated reward.
Fig. 12. Reward curve.
The details of the optimal size and the comparison between discussed algorithms, as well as the comparison between HESS
Fig. 8. Power distribution results under different reward function design.( max C-rate=1, maxHESSP pu =1.2) (a) MDQN-PMS (b) triple-objective PMS
Fig. 9. Power distribution results under different reward function design.( max C-rate=3, max
HESSP pu =1.3) (a) MDQN-PMS (b) triple-objective PMS
Authorized licensed use limited to: COVENTRY UNIVERSITY. Downloaded on June 17,2021 at 13:49:33 UTC from IEEE Xplore. Restrictions apply.
2332-7782 (c) 2021 IEEE. Personal use is permitted, but republication/redistribution requires IEEE permission. See http://www.ieee.org/publications_standards/publications/rights/index.html for more information.
This article has been accepted for publication in a future issue of this journal, but has not been fully edited. Content may change prior to final publication. Citation information: DOI 10.1109/TTE.2021.3074792, IEEETransactions on Transportation Electrification
> REPLACE THIS LINE WITH YOUR PAPER IDENTIFICATION NUMBER (DOUBLE-CLICK HERE TO EDIT) <
10
and FC-only ESS are summarized in Table. 6. Under the synergistic framework, the system economy is increased by 16.0% comparing with FC-only ESS.
V. CONCLUSION
In this study, we propose a synergistic framework of sizing and DRL-based PMS to simultaneously optimize the battery size and the power distribution of the fuel cell/battery HESS on a FCHEV. The power management in the framework is built with DQN algorithm, considering both minimizing hydrogen consumption and suppressing fuel cell degradation. The performance of proposed algorithm is also compared with the original DQN-PMS, Q-learning based PMS, as well as rule-based PMS. The proposed algorithm outperforms other methods in suppressing fuel cell degradation, improving fuel cell efficiency, as well as algorithm convergence. MDQN-based PMS decreased equivalent hydrogen consumption by 23.3%, and suppressed FC degradation by 11% better comparing with rule-based PMS. The learning process of MDQN is 16.4% faster than Q-learning, and reached 2.5% higher accumulated reward. Battery degradation is also taken into consideration in the synergistic framework, as the sizing optimization space explores the optimal battery key parameters: max C-rate and battery capacity. The results show that when battery capacity is 43 Ah, and max C-rate is 4, the size-optimized HESS with optimal PMS improves system economy by 16.0%, comparing with the fuel cell-only configuration.
REFERENCES [1] F. Shang, H. Wu, G. Niu, M. Krishnamurthy, and A. Isurin, "Dynamic
Analysis and Control Approach for a High-Gain Step-Up Converter for Electrified Transportation," IEEE Transactions on Transportation Electrification, vol. 3, no. 3, pp. 656-667, 2017.
[2] B. Bilgin et al., "Making the Case for Electrified Transportation," IEEE Transactions on Transportation Electrification, vol. 1, no. 1, pp. 4-17, 2015.
[3] J. Snoussi, S. B. Elghali, M. Benbouzid, and M. F. Mimouni, "Optimal Sizing of Energy Storage Systems Using Frequency-Separation-Based Energy Management for Fuel Cell Hybrid Electric Vehicles," IEEE Transactions on Vehicular Technology, vol. 67, no. 10, pp. 9337-9346, 2018.
[4] B. Bendjedia, N. Rizoug, M. Boukhnifer, F. Bouchafaa, and M. Benbouzid, "Influence of secondary source technologies and energy management strategies on Energy Storage System sizing for fuel cell electric vehicles," International Journal of Hydrogen Energy, vol. 43, no. 25, pp. 11614-11628, 2018.
[5] Amin, R. T. Bambang, A. S. Rohman, C. J. Dronkers, R. Ortega, and A. Sasongko, "Energy Management of Fuel Cell/Battery/Supercapacitor Hybrid Power Sources Using Model Predictive Control," IEEE Transactions on Industrial Informatics, vol. 10, no. 4, pp. 1992-2002, 2014.
[6] J. Chen, C. Xu, C. Wu, and W. Xu, "Adaptive Fuzzy Logic Control of Fuel-Cell-Battery Hybrid Systems for Electric Vehicles," IEEE Transactions on Industrial Informatics, vol. 14, no. 1, pp. 292-300, 2018.
[7] S. Ziaeinejad, Y. Sangsefidi, and A. Mehrizi-Sani, "Fuel Cell-Based Auxiliary Power Unit: EMS, Sizing, and Current Estimator-Based Controller," IEEE Transactions on Vehicular Technology, vol. 65, no. 6, pp. 4826-4835, 2016.
[8] C. Wu, J. Chen, C. Xu, and Z. Liu, "Real-Time Adaptive Control of a Fuel Cell/Battery Hybrid Power System With Guaranteed Stability," IEEE Transactions on Control Systems Technology, vol. 25, no. 4, pp. 1394-1405, 2017.
[9] Y. Zhang, C. Zhang, Z. Huang, L. Xu, Z. Liu, and M. Liu, "Real-Time Energy Management Strategy for Fuel Cell Range Extender Vehicles Based on Nonlinear Control," IEEE Transactions on Transportation Electrification, vol. 5, no. 4, pp. 1294-1305, 2019.
[10] M. Ansarey, M. Shariat Panahi, H. Ziarati, and M. Mahjoob, "Optimal energy management in a dual-storage fuel-cell hybrid vehicle using multi-dimensional dynamic programming," Journal of Power Sources, vol. 250, pp. 359-371, 2014.
[11] Li, J., Xiong, R., Mu, H., Cornélusse, B., Vanderbemden, P., Ernst, D., & Yuan, W. Design and real-time test of a hybrid energy storage system in the microgrid with the benefit of improving the battery lifetime. Applied energy, 2018, 70-478.
[12] S. Haghbin, S. Lundmark, M. Alakula, and O. Carlson, "Grid-Connected Integrated Battery Chargers in Vehicle Applications: Review and New Solution," IEEE Transactions on Industrial Electronics, vol. 60, no. 2, pp. 459-473, 2013.
[13] C. H. Zheng, C. E. Oh, Y. I. Park, and S. W. Cha, "Fuel economy evaluation of fuel cell hybrid vehicles based on equivalent fuel consumption," International Journal of Hydrogen Energy, vol. 37, no. 2, pp. 1790-1796, 2012/01/01/ 2012.
[14] Z, Tao, Z Zhang et al. "Data-driven approach for short-term power demand prediction of fuel cell hybrid vehicles." Energy 208 (2020): 118319.
[15] S. Chung and O. Trescases, "Hybrid Energy Storage System With Active Power-Mix Control in a Dual-Chemistry Battery Pack for Light Electric Vehicles," IEEE Transactions on Transportation Electrification, vol. 3, no. 3, pp. 600-617, 2017.
[16] Z. L. Jiang, W. R. Chen, Z. J. Qu, C. H. Dai, and Z. L. Cheng, "Energy Management for a Fuel Cell Hybrid Vehicle," in Power and Energy Engineering Conference (APPEEC), 2010 Asia-Pacific, 2010.
[17] H. Chen and A. Khaligh, "Hybrid energy storage system for unmanned aerial vehicle (UAV)," in IECON 2010 - 36th Annual Conference on IEEE Industrial Electronics Society, 2010, pp. 2851-2856.
[18] S. Bandyopadhyay, G. R. C. Mouli, Z. Qin, L. R. Elizondo, and P. Bauer, "Techno-Economical Model Based Optimal Sizing of PV-Battery Systems for Microgrids," IEEE Transactions on Sustainable Energy, vol. 11, no. 3, pp. 1657-1668, 2020.
[19] J. Ugirumurera and Z. J. Haas, "Optimal Capacity Sizing for Completely Green Charging Systems for Electric Vehicles," IEEE Transactions on Transportation Electrification, vol. 3, no. 3, pp. 565-577, 2017.
[20] H. H. Eldeeb, A. T. Elsayed, C. R. Lashway, and O. Mohammed, "Hybrid Energy Storage Sizing and Power Splitting Optimization for Plug-In Electric Vehicles," IEEE Transactions on Industry Applications, vol. 55, no. 3, pp. 2252-2262, 2019.
[21] A. Ravey, N. Watrin, B. Blunier, D. Bouquain, and A. Miraoui, "Energy-Source-Sizing Methodology for Hybrid Fuel Cell Vehicles Based on Statistical Description of Driving Cycles," IEEE Transactions on Vehicular Technology, vol. 60, no. 9, pp. 4164-4174, 2011.
[22] D. Feroldi and M. Carignano, "Sizing for fuel cell/supercapacitor hybrid vehicles based on stochastic driving cycles," Applied Energy, vol. 183, pp. 645-658, 2016.
TABLE Ⅵ HESS SIZING OPTIMIZATION RESULTS AND COMPARISON WITH ESS CONFIGURATION
Parameters FC
maximum power (kW)
Battery capacity
(Ah)
Battery maximum
C-rate
System power
standard
Equivalent Hydrogen
consumption (g)
FC operational cost /RMB
Battery operational cost /RMB
Cost per
cycle
System economy
(%) FC-only ESS 125 / / 1 321.46 9.15 / 31.65 100
HESS with MDQN 75 43 4 1.4 178.36 8.72 5.57 26.58 116.0 HESS with original
DQN 75 43 4 1.4 177.22 9.04 5.91 27.37 113.5
HESS with Q-learning 75 43 4 1.4 203.77 9.01 4.81 28.09 111.3
HESS with rule-based 75 43 4 1.4 232.53 9.91 2.41 28.61 109.6
Authorized licensed use limited to: COVENTRY UNIVERSITY. Downloaded on June 17,2021 at 13:49:33 UTC from IEEE Xplore. Restrictions apply.
2332-7782 (c) 2021 IEEE. Personal use is permitted, but republication/redistribution requires IEEE permission. See http://www.ieee.org/publications_standards/publications/rights/index.html for more information.
This article has been accepted for publication in a future issue of this journal, but has not been fully edited. Content may change prior to final publication. Citation information: DOI 10.1109/TTE.2021.3074792, IEEETransactions on Transportation Electrification
> REPLACE THIS LINE WITH YOUR PAPER IDENTIFICATION NUMBER (DOUBLE-CLICK HERE TO EDIT) <
11
[23] M. Shahverdi, M. S. Mazzola, Q. Grice, and M. Doude, "Pareto Front of Energy Storage Size and Series HEV Fuel Economy Using Bandwidth-Based Control Strategy," IEEE Transactions on Transportation Electrification, vol. 2, no. 1, pp. 36-51, 2016.
[24] J. Shen, S. Dusmez, and A. Khaligh, "Optimization of Sizing and Battery Cycle Life in Battery/Ultracapacitor Hybrid Energy Storage Systems for Electric Vehicle Applications," IEEE Transactions on Industrial Informatics, vol. 10, no. 4, pp. 2112-2121, 2014.
[25] T. Mesbahi, F. Khenfri, N. Rizoug, P. Bartholomeus, and P. L. Moigne, "Combined Optimal Sizing and Control of Li-Ion Battery/Supercapacitor Embedded Power Supply Using Hybrid Particle Swarm–Nelder–Mead Algorithm," IEEE Transactions on Sustainable Energy, vol. 8, no. 1, pp. 59-73, 2017.
[26] X. Wu, X. Hu, X. Yin, L. Li, Z. Zeng, and V. Pickert, "Convex programming energy management and components sizing of a plug-in fuel cell urban logistics vehicle," Journal of Power Sources, vol. 423, pp. 358-366, 2019.
[27] C. Zheng, G. Xu, J. Jeong, S. W. Cha, Y.-i. Park, and W. Lim, "Power source sizing of fuel cell hybrid vehicles considering vehicle performance and cost," International Journal of Precision Engineering and Manufacturing, vol. 15, no. 3, pp. 527-533, 2014/03/01 2014.
[28] C. Liu and L. Liu, "Optimal power source sizing of fuel cell hybrid vehicles based on Pontryagin's minimum principle," International Journal of Hydrogen Energy, vol. 40, no. 26, pp. 8454-8464, 2015.
[29] J Li, R Xiong et al. "Design/test of a hybrid energy storage system for primary frequency control using a dynamic droop method in an isolated microgrid power system." Applied Energy 201 (2017): 257-269.
[30] A.-A. Mamun, Z. Liu, D. M. Rizzo, and S. Onori, "An Integrated Design and Control Optimization Framework for Hybrid Military Vehicle Using Lithium-Ion Battery and Supercapacitor as Energy Storage Devices," IEEE Transactions on Transportation Electrification, vol. 5, no. 1, pp. 239-251, 2019.
[31] L. Tang, G. Rizzoni, and S. Onori, "Energy Management Strategy for HEVs Including Battery Life Optimization," IEEE Transactions on Transportation Electrification, vol. 1, no. 3, pp. 211-222, 2015.
[32] B. Xu et al., "Ensemble Reinforcement Learning-Based Supervisory Control of Hybrid Electric Vehicle for Fuel Economy Improvement," IEEE Transactions on Transportation Electrification, vol. 6, no. 2, pp. 717-727, 2020.
[33] Y. Zou, T. Liu, D. Liu, and F. Sun, "Reinforcement learning-based real-time energy management for a hybrid tracked vehicle," Applied Energy, vol. 171, pp. 372-382, 2016.
[34] T. Liu, Y. Zou, D. Liu, and F. Sun, "Reinforcement Learning of Adaptive Energy Management With Transition Probability for a Hybrid Electric Tracked Vehicle," IEEE Transactions on Industrial Electronics, vol. 62, no. 12, pp. 7837-7846, 2015.
[35] X. Lin, P. Bogdan, N. Chang, and M. Pedram, "Machine learning-based energy management in a hybrid electric vehicle to minimize total operating cost," in 2015 IEEE/ACM International Conference on Computer-Aided Design (ICCAD), 2015, pp. 627-634.
[36] J. Wu, H. He, J. Peng, Y. Li, and Z. Li, "Continuous reinforcement learning of energy management with deep Q network for a power split hybrid electric bus," Applied Energy, vol. 222, pp. 799-811, 2018.
[37] B. Bäker, A. Dietermann, C. Schroer, and R. Liessner, "Deep Reinforcement Learning for Advanced Energy Management of Hybrid Electric Vehicles," presented at the Proceedings of the 10th International Conference on Agents and Artificial Intelligence, 2018.
[38] R. C. Hsu, S. Chen, W. Chen, and C. Liu, "A Reinforcement Learning Based Dynamic Power Management for Fuel Cell Hybrid Electric Vehicle," in 2016 Joint 8th International Conference on Soft Computing and Intelligent Systems (SCIS) and 17th International Symposium on Advanced Intelligent Systems (ISIS), 2016, pp. 460-464.
[39] H. Sun, Z. Fu, F. Tao, L. Zhu, and P. Si, "Data-driven reinforcement-learning-based hierarchical energy management strategy for fuel cell/battery/ultracapacitor hybrid electric vehicles," Journal of Power Sources, vol. 455, 2020.
[40] J. Yuan, L. Yang, and Q. Chen, "Intelligent energy management strategy based on hierarchical approximate global optimization for plug-in fuel cell hybrid electric vehicles," International Journal of Hydrogen Energy, vol. 43, no. 16, pp. 8063-8078, 2018.
[41] H. Li, H. Chaoui, and H. Gualous, "Cost Minimization Strategy for Fuel Cell Hybrid Electric Vehicles Considering Power Sources Degradation," IEEE Transactions on Vehicular Technology, vol. 69, no. 11, pp. 12832-12842, 2020.
[42] Y. Bai, H. He, J. Li, S. Li, Y.-x. Wang, and Q. Yang, "Battery anti-aging control for a plug-in hybrid electric vehicle with a hierarchical optimization energy management strategy," Journal of Cleaner Production, vol. 237, 2019.
[43] X. Wang, H. He, F. Sun, and J. Zhang, "Application Study on the Dynamic Programming Algorithm for Energy Management of Plug-in Hybrid Electric Vehicles," Energies, vol. 8, no. 4, pp. 3225-3244, 2015.
[44] N. Sulaiman, M. A. Hannan, A. Mohamed, E. H. Majlan, and W. R. Wan Daud, "A review on energy management system for fuel cell hybrid electric vehicle: Issues and challenges," Renewable and Sustainable Energy Reviews, vol. 52, pp. 802-814, 2015.
[45] Y.-X. Wang, K. Ou, and Y.-B. Kim, "Modeling and experimental validation of hybrid proton exchange membrane fuel cell/battery system for power management control," International Journal of Hydrogen Energy, vol. 40, no. 35, pp. 11713-11721, 2015/09/21/ 2015.
[46] Z. Hu et al., "Multi-objective energy management optimization and parameter sizing for proton exchange membrane hybrid fuel cell vehicles," Energy Conversion and Management, vol. 129, pp. 108-121, 2016.
[47] Bai, Y., Li, J., He, H., Dos Santos, R. C., & Yang, Q. (2020). Optimal design of a hybrid energy storage system in a plug-in hybrid electric vehicle for battery lifetime improvement. IEEE Access, 8, 142148-142158.
[48] M. Masih-Tehrani, M.-R. Ha'iri-Yazdi, V. Esfahanian, and A. Safaei, "Optimum sizing and optimum energy management of a hybrid energy storage system for lithium battery life improvement," Journal of Power Sources, vol. 244, pp. 2-10, 2013.
[49] C. Ju, P. Wang, L. Goel, and Y. Xu, "A Two-Layer Energy Management System for Microgrids With Hybrid Energy Storage Considering Degradation Costs," IEEE Transactions on Smart Grid, vol. 9, no. 6, pp. 6047-6057, 2018.
[50] E. Schaltz, A. Khaligh, and P. O. Rasmussen, "Influence of Battery/Ultracapacitor Energy-Storage Sizing on Battery Lifetime in a Fuel Cell Hybrid Electric Vehicle," IEEE Transactions on Vehicular Technology, vol. 58, no. 8, pp. 3882-3891, 2009.
[51] X. Wu, J. Chen, and C. Hu, "Dynamic Programming-Based Energy Management System for Range-Extended Electric Bus," Mathematical Problems in Engineering, vol. 2015, pp. 1-11, 2015.
[52] B. Zakeri and S. Syri, "Electrical energy storage systems: A comparative life cycle cost analysis," Renewable and Sustainable Energy Reviews, vol. 42, pp. 569-596, 2015.
[53] Y. K. Salkuyeh, B. A. Saville, and H. L. MacLean, "Techno-economic analysis and life cycle assessment of hydrogen production from different biomass gasification processes," International Journal of Hydrogen Energy, vol. 43, no. 20, pp. 9514-9528, 2018.
[54] M. Marinaro et al., "Bringing forward the development of battery cells for automotive applications: Perspective of R&D activities in China, Japan, the EU and the USA," Journal of Power Sources, vol. 459, 2020.
[55] W. Li et al., "Willingness to pay for hydrogen fuel cell electric vehicles in China: A choice experiment analysis," International Journal of Hydrogen Energy, vol. 45, no. 59, pp. 34346-34353, 2020/12/04/ 2020.
[56] R. S. Sutton and A. G. J. I. T. o. N. N. Barto, "Reinforcement Learning: An Introduction," vol. 9, no. 5, pp. 1054-1054.
[57] He, H., Shi, M., Li, J., Cao, J., & Han, M. Design and experiential test of a model predictive path following control with adaptive preview for autonomous buses. Mechanical Systems and Signal Processing, 2021, 07701.
[58] Z. Chen, N. Guo, Q. Zhang, J. Shen, and R. Xiao, "An Optimized Rule Based Energy Management Strategy for a Fuel Cell/Battery Vehicle," in 2017 IEEE Vehicle Power and Propulsion Conference (VPPC), 2017, pp. 1-6.
Jianwei Li (M’17) received the B.Eng. degree from North China Electric Power University and the Ph.D. degree in Electrical Engineering from the University of Bath, U.K. He has worked with the University of Liege, Beijing Institute of Technology, CU and University of Oxford. His research interests include electrical energy storages
and hybrid energy storages, electrical vehicles, batteries, fuel cells and power management of the multi-vector system.
Authorized licensed use limited to: COVENTRY UNIVERSITY. Downloaded on June 17,2021 at 13:49:33 UTC from IEEE Xplore. Restrictions apply.

2332-7782 (c) 2021 IEEE. Personal use is permitted, but republication/redistribution requires IEEE permission. See http://www.ieee.org/publications_standards/publications/rights/index.html for more information.
This article has been accepted for publication in a future issue of this journal, but has not been fully edited. Content may change prior to final publication. Citation information: DOI 10.1109/TTE.2021.3074792, IEEETransactions on Transportation Electrification
> REPLACE THIS LINE WITH YOUR PAPER IDENTIFICATION NUMBER (DOUBLE-CLICK HERE TO EDIT) <
12
Hanxiao Wang was born in Hangzhou, Zhejiang, China in 1996. She received the B.S. degree in vehicle engineering from Beijing Institute of Technology, Beijing, in 2018. She is currently pursuing the M.S. degree in vehicle engineering at Beijing Institute of Technology, Beijing, China. Her research interest includes reinforcement
learning-based energy management for vehicle hybrid power system and component sizing for vehicle powertrain.
Hongwen He (M’03–SM’12) received the M.Sc. degree from the Jilin University of Technology, Changchun, China, in 2000 and the Ph.D. degree from the Beijing Institute of Technology, Beijing, China, in 2003, both in vehicle engineering. He is currently a Professor with the National Engineering Laboratory for Electric Vehicles, Beijing
Institute of Technology. His research interests include power battery modeling and simulation on electric vehicles, design, and control theory of the hybrid power trains.
Zhongbao Wei (M'19) received the B.Eng. and the M.Sc. degrees in instrumental science and technology from Beihang University, China, in 2010 and 2013, and the Ph.D. degree in power engineering from Nanyang Technological University, Singapore, in 2017. He has been a research fellow with Energy
Research Institute @ NTU, Nanyang Technological University from 2016 to 2018. He is currently a Professor in vehicle engineering with the National Engineering Laboratory for Electric Vehicles, School of Mechanical Engineering, Beijing Institute of Technology, China. His research interests include modeling, identification, state estimation, diagnostic for battery system, and energy management for hybrid energy systems.
Qingqing Yang (S’14, M’17) received Ph.D. degree from the University of Bath, U.K. She worked as a Lead Engineer on the electrical engineering when she was in the Beijing Electric Power Research Institute, State Grid Corporation of China. She is currently a Lecture with Coventry University. Her research interests include HVDC control and
protection, applied superconductivity, virtual inertia in the power systems and artificial intelligence applications in energy storage and smart grids.
Petar Igic (SM’18) received the Dipl.-Eng. and Mag.Sc. degrees in electrical and electronics engineering from University of Nis, Nis, Serbia, in 1993 and 1997 respectively. He received PhD from Swansea University, Swansea, Wales, United Kingdom in 2000. From 2000 to 2018, he was with the College of Engineering, Swansea
University, where he served as an academic member of staff, EEE director of study and director of the College’s Electronic Systems Design Centre. He is currently full Professor within the Centre for Advanced Low Carbon Propulsion Systems (C-ALPS), IFTC, Coventry University, England, UK. His main research interests include Si and WBG power semiconductor applications for energy conversion in automotive industry and renewable energy applications.
Authorized licensed use limited to: COVENTRY UNIVERSITY. Downloaded on June 17,2021 at 13:49:33 UTC from IEEE Xplore. Restrictions apply.