optimal sizing of energy communities with fair revenue
TRANSCRIPT
Universita di Pisa
Dipartimento di Informatica
Technical Report
Optimal sizing of energy communities
with fair revenue sharing and
exit clauses: value, role and business
model of aggregators and users
Davide Fioriti
DESTEC, Universita di Pisa
Largo Lucio Lazzarino, 56122 Pisa, Italy
Antonio Frangioni
Dipartimento di Informatica, Universita di Pisa
Largo B. Pontecorvo 3, 56127 Pisa
Davide Poli
DESTEC, Universita di Pisa
Largo Lucio Lazzarino, 56122 Pisa, Italy
May 4, 2021
LICENSE: Creative Commons: Attribution-Noncommercial - No Derivative Works
ADDRESS: Largo B. Pontecorvo 3, 56127 Pisa, Italy. TEL: +39 050 2212700 FAX: +39 050 2212726

Optimal sizing of energy communities with fair revenue sharing and
exit clauses: value, role and business model of aggregators and users
Davide Fioriti
DESTEC, Universita di Pisa
Largo Lucio Lazzarino, 56122 Pisa, Italy
Antonio Frangioni
Dipartimento di Informatica, Universita di Pisa
Largo B. Pontecorvo 3, 56127 Pisa
Davide Poli
DESTEC, Universita di Pisa
Largo Lucio Lazzarino, 56122 Pisa, Italy
May 4, 2021
Abstract
Energy communities (ECs) are essential policy tools to meet the Energy Transition goals, as they can
promote renewable energy sources, demand side management, demand response and citizen participation
in energy matters. However, to fully unleash their potential, their design and scheduling requires a
coordinated technical operation that the community itself may be ill-equipped to manage, in particular
in view of the mutual technical and legal constraints ensuing from a coordinated design. Aggregators and
Energy Service COmpanies (ESCOs) can perform this support role, but only provided that their goals
are aligned to those of the community, not to incur in the agency problem.
In this study, we propose a business model for aggregators of ECs, and its corresponding technical
optimization problem, taking into account all crucial aspects: i) alleviating the risk of the agency problem,
ii) fairly distributing the reward awarded to the EC, iii) estimating the fair payment for the aggregator
services, and iv) defining appropriate exit clauses that rule what happens when a user leaves the EC. A
detailed mathematical model is derived and discussed, employing several fair and theoretically-consistent
reward distribution schemes, some of which are, to the best of our knowledge, proposed here for the first
time. A case study is developed to quantify the value of the aggregator and compare the coordinated
solution provided by the aggregator with non-coordinated configurations, numerically illustrating the
impact of the reward distribution schemes.
The results show that, in the case study, the aggregator enables reducing costs by 16% with respect to
a baseline solution, and enables reaching 52.5% renewable share and about 46% self/shared consumption,
whereas these same numbers are only 28-35% for the non-coordinated case. Our results suggest that
the aggregator fair retribution is around 16-24% the added benefit produced with respect to the non-
coordinated solution, and that stable reward distribution schemes such as Shapley/Core or Nucleolus are
1
recommended. Moreover, the results highlight the unwanted effect that some non-cooperative ECs may
have an added benefit without providing any positive effect to the power system.
Our work lays the foundations for future studies on business models of aggregators for ECs and
provides a methodology and preliminary results that can help policy makers and developers in tailoring
national-level policies and market-offerings.
Keywords:Mixed Integer Linear Programming (MILP), hybrid Renewable/Citizenship Energy Community
system (REC/CEC), coalition game theory, cooperative game, Energy Service COmpany (ESCO), Peak
power management
Nomenclature
Indices and sets
i ∈ I index and set of the microgrid users
j ∈ J ⊆ I ∪A Any subset of users contained in I, eventually including the aggregator A, and its index
t ∈ T index and set of the time-step of the simulation
w ∈W index and set of payment periods of the peak power component for users and microgrid (i.e. one
every month)
tw ∈ Tw ⊆ T index and subset of the indices t referring to a peak-period w
y ∈ Y index and set of the years of the investment
a ∈ Aj set of the assets of user j; multiple types of technologies are taken into account in the following
categories: battery (B), battery converter (C), and renewable assets (R).
b/c/r ∈ AB/C/Rj ⊆ Aj index and subset of assets of user j, depending on technology type.
c(b), b(c) Converter technology c corresponding to the battery technology b and viceversa: a single converter
is coupled to each battery technology.
Variables
PU,M+/U,M−j,t Energy injected (+) or absorbed (-) at each user POD and contributing to the total energy
shared within the EC
PU,P+/U,P−j,t Energy injected (+) or absorbed (-) at each user POD without being shared within the EC
xa,Uj Installed capacity for each technology a by the user j
PR,Uj,t Total non-dispatchable renewable production for technology r in time step t of user j
Pc+/c−,Uj,t Discharging (+) and charging (-) power of the battery converter in time step t of user j and
technology c
PU,maxj,w Maximum power usage at the user POD j
2

Eb,Uj,t State of charge of the battery of the user (U) j at time step t and battery technology b
σ Fraction of the economic surplus generated by the EC kept by the aggregator
θ Economic margin of current coalition subset to remain in the grand-coalition with respect to creating
their own energy community.
Expressions
PU,POD+/−j,t Power exchanged at the POD of user j in time step t
ESHt Energy shared among users in the EC in time step t
NPV A(J/I) Net Present Value of the aggregator for a given set of users
NPV UA(J/I)j Net Present Value including the reward of a member of the energy community composed by
a set of users
NPV Uj Net Present Value of a user in the non-cooperative formulation
SW tot/U,NA/NC/ANC/CO(J/I) Total (tot) or Users (U) social welfare in the NA/NC/ANC/CO case
RU,Pj,t Net contribution to the electricity bill with respect to the public grid by user j
RCUj,y Replacement costs of the assets by user j
RV Uj,y Recovery value of the assets by user j at the end of the project
CU,Pj,w Costs of the peak power for the user j in every peak period w
CAPEXUj,a Investment costs of user j and asset a
CU,Mj,a Yearly maintenance costs of device a owned by user j
PU+/U−j,t Upper bound of the power supplied (+) or absorbed (-) by user j in time step t
ECRy(J) Reward awarded to the energy community.
v(J) Shared benefit created by the energy community with members J .
V exiti Exit cost to be paid by user i when leaving the community
Parameters
d Discount factor
∆ Time resolution
NY,aj Lifetime of the components of technology a
πP+t Price received when electricity is injected into the public grid.
πP−,V/Ft Variable (V) and fixed (F) costs paid when electricity is absorbed from the public grid
3
πRt Reward benefit awarded to the energy community for every energy unit consumed within the com-
munity
PLj,t Load demand of user j in time step t
pr,Uj,t Specific renewable production for technology rj of user j at time step t
βb,maxj , βb,min
j Maximum and minimum state of charge of the battery
ηbj Roundtrip efficiency of the battery technology b of user j
ca,Uj Investment cost for each unit of technology a for a user j
ca,U,Mj Maintenance cost of each unit of technology a for the user j
cPPw Peak power tariff related to the national electricity market in each payment period w
mTt ,m
Ww Multiplier weights of peak power and energy costs
NPV U,NCj Annualized profits of each user j without the aggregate in the NC configuration.
xa,Uj Upper bound of the maximum installed capacity for each technology a by the user j
ηLj Efficiency of the distribution system between the user and the junction box
Acronyms
EC Energy Community
ESCO Energy Service COmpany
POD Point Of Delivery
NA No-Assets case
NC Non-Cooperative case
ANC Aggregated Non-Cooperative
CO COoperative case
NPV Net Present Value
NPC Net Present Cost
SW Social Welfare
SC Social Cost
CAPEX CAPital EXpenditure
OPEX OPerational EXpenditure
Sh Shapley Value reward distribution scheme
4
Nuc Nucleolus reward distribution scheme
ShC Shapley value/Core reward distribution scheme
ShNuc Shapley value/Nucleolus reward distribution scheme
VarC MinVariance/Core reward distribution scheme
VarNuc MinVariance/Nucleolus reward distribution scheme
1 Introduction
1.1 Motivation
The need of meeting an increasing share of energy demand using renewable sources, combined with the
uncertain production of wind and solar power plants, is raising pressure on the stability of existing power
systems. The creation of the so-called Energy Communities (ECs), i.e., local, organized and coordinated
aggregates of consumers and prosumers [21], is widely recognised as a useful tool to alleviate this burden,
attract private financing, meet the environmental targets, and ultimately addressing the Energy Transition
challenge [27].
ECs are an hot topic with a huge technical and economical potential. While there are no less than 3500
ECs in the European Union alone [10], and others in US, Canada and New Zeland [7, 23, 21], yet, a surge in
the numbers is expected, as most countries have not finalized the adoption of specific policies [21, 27]. Being
among the world leaders in Energy Transition, the EU has approved the first directive (RED II) on Renewable
Energy Communities (REC) in mid 2018, followed by the IEMD directive that broadens the concept to that
of “Citizenship Energy Community” (CEC) also accounting for sharing of non-renewable energy sources [27].
Yet, the full adoption of both directives is demanded to national governments, and most countries, among
which Italy [4], have only approved temporary regulations while working to estimate social responses and
tailor the best framework for their population. While ECs can create benefits, they may also lead to mutual
constraints among users, including energy dependence, privacy issues, organizational problems and economic
counterparts, with repercussions on the network grid and financing schemes. These have to be properly
accounted for, since the initial design of the regulation acts issued by national authorities [7].
The literature regarding the optimal sizing of district energy systems or aggregated microgrids is rich [19].
However, most studies focus on the technical problem of finding the optimal solution and overlook that the
creation of an energy community, while providing environmental and efficiency benefits, may lead to concerns
regarding the ownership of common assets, the risks of users leaving the community, the fair distribution of
profits, and possible barriers for users to join. Therefore, it is timely to address the issue of optimal sizing
of ECs also accounting for these non-technical concerns. In this study, we propose a sizing methodology
based on a custom business model for ECs that is aimed at stimulating the cooperation of users and the
optimal operation of the EC by the community manager, or aggregator, also including exit clauses to rule
how users can leave the community. The proposed business model highlights the role of aggregators and it
is well aligned to current EC regulation and objectives.
5
1.2 Literature analysis
The recent US [6] and EU [27] policies supporting renewable energy communities provide frameworks for
energy sharing, thus unleashing the full potential of community microgrids and aggregators [13, 51, 54, 53, 26].
Traditionally, aggregators are private operators that act on the energy market on behalf of a set of
consumers and prosumers [41] to provide benefits by bidding/hedging on the market to achieve a lower
energy purchase price, properly operating generation and storage systems, and/or implementing demand-
side management or demand response policies [45, 25, 8]. Given this purpose, most studies have traditionally
focused on techniques to optimally operate the aggregate [20, 3, 17], usually focusing on economic indicators.
Some studies have focused at maximizing the social welfare of the aggregate, but overlooking how profits
shall be distributed among participants [16, 15]. Others, instead, have proposed game-theoretic approaches,
be them cooperative or non-cooperative, to identify the best profit allocation [41, 46, 18, 33, 11, 52].
In [41], a non-cooperative approach for coordinating multiple electricity aggregators is proposed to provide
additional flexibility in a network. A similar approach is proposed in [52] but for power-heating systems.
Given the focus on storage for providing flexibility, competition between storage aggregators have been
simulated in [30] and optimal bidding strategies have been estimated. In these non-cooperative studies, the
players are often aggregators whose business profit hinges on trading in the electricity market. In the case
of ECs, players (i.e, users) are typically not interested in direct trading, and they would rather delegate this
role. As a consequence, a cooperative approach is more appropriate, especially considering the social focus
of EC policies expressed by EU [27].
In cooperative formulations, the users cooperate with the goal of achieving the cheapest solution. Ac-
cording to the cooperative game theory, the stability of a coalition depends on the cost/profit allocation that
shall adhere to two main principles: rationality and efficiency [46, 18]. Rationality guarantees that no subset
of users benefit from leaving the community, while efficiency specifies that all benefits given by the aggregate
shall be completely distributed among all components of the aggregate. All solutions that are efficient and
rational belong to the “Core”, which is a key concept in game theory [1, 2]. The Core definition is embedded
in the Nucleolus concept adopted in [18] for the coordination of multiple microgrids in a distribution system:
rationality and efficiency properties are satisfied, but concerns about fairness arise because the approach
mainly focuses on strengthening the stability of the coalition. Moreover, the Nash Bargaining theory has also
been proposed for reactive power compensation in distribution networks [33], where profits are shared equally
among the players. However, these principles lead to a wide set of different allocation of costs and rewards
[12], which shall be fair according to each player’s contribution [40, 9]. In [48], a fair-efficient approach is
proposed to distribute profits according to a modified Shapley value, which is a reference-key measure in
economics for profit allocation in a coalition [14] but may suffer from stability issues [22]. The Owen sharing
method is proposed in [32] to distribute the profits generated by the aggregated bidding of a group of wind
turbines that makes use of dual variables to distribute profits. The Owen method uses the dual solution to
distribute profits among the players in a linear production game; while Owen solution belongs to the core
[36], they may not achieve desirable properties such as these of Nucleolus or Shapley. In [2] a min-variance
allocation mechanism is discussed to distribute profits among an energy community where prosumers could
install PV assets only. This approach may reduce computational time while achieving stability. Fewer studies
have instead focused on combining the optimal sizing and operations of networked microgrids with different
cost-allocation rules, such as Nash Bargaining, Shapley Value or Myerson Value [46, 37, 47]. In the case of
6
Nash Bargaining, however, profits tend to be equally distributed among the players, which is not a desirable
characteristic in that it does not account for the specific benefits provided by each user, and therefore it
does not properly stimulate users in the installation of assets. On the other hand, the Myerson Value ap-
proach applies to partially connected grids [31], which is not the case for typical ECs. Nucleolus and Core
concepts lead to efficient and rational profit allocation, but concerns about fairness and uniqueness arise;
conversely, the Shapley Value is widely recognized as a fair measure, but rationality is not guaranteed [50].
For this reason, in this study we start from Core, Nucleolus, Shapley value and Min-Variance as the main
distribution schemes and we propose some novel profit-sharing allocation methods that try to inherit the
best characteristics of each.
Furthermore, most of the studies from the literature only focus on aggregate of users without discussing
a complete business models for ECs that addresses all relevant concerns, i.e., optimal management for the
community, remunerating the fair economic benefit to the aggregator, and the long-term sustainability of the
community. This work aims at providing a comprehensive treatment of all these aspects.
According to the EU directives (RED-II and IEMD) [27], ECs shall be no-profit entities that incentive
the participation into energy matters and promote the use of renewable energy with environmental benefits
[10]. Accordingly, most of the literature considers the community manager to be any member of the EC
whose objective is the maximisation of the social welfare of the community itself [24, 50, 29]. However, most
members would not have the skills for properly sizing and coordinating the system. Most likely, the functions
of the community manager will be externalized outside the community to an ESCO or an aggregator. This,
however, requires defining a reward scheme for the community manager to properly compensate its skills and
labour while ensuring that its objective does not deviate from the goals of the EC users, thus avoiding the
“agency problem” [44]. In this study we discuss this concept in details and propose a business model, and a
corresponding mathematical formulation, for the optimal design and management of the community power
system that aims at aligning the aggregator’s goal with the community’s objective.
In any EC the problem of the assets’ ownership inevitably also arises, and there are mainly two alternatives
depending on the organization: the components are bought or leased by the entire community [5] or by a
specific user [29]. Both options lead to intertwined financial (CAPEX/OPEX) and/or physical (shared assets)
constraints that may be a barrier to create an EC. The general gist of the EU policies [27] is that citizens and
companies shall be free to choose their personal affairs, as failure to ensure this may reduce the participation
and ultimately hinder the financial stability of the community. Therefore, the membership contracts between
each user and the EC shall have specific clauses, which we refer to as “exit” in our development, to address
these concerns; this can have implications in terms of optimal design. We believe that this matter shall be
properly taken into account, while the literature [46, 37, 47] tends to overlook this hurdle and mainly focuses
on the optimal operations of the system [40, 9], and sometimes its optimal design [24, 50, 29].
1.3 Contributions
The main contributions of our work are as follows:
1. development of several new reward allocation mechanisms (Shapley-Core, Shapley-Nucleolus and Min-
Variance-Nucleolus) and comparison to existing methodologies (Shapley, Nucleolus, Min/Variance) to
reach efficient, rational and fair distribution of the reward received by the EC;
2. proposal of the exit clauses that clearly state at which conditions a user can leave the community;
7
3. proposal and discussion of a business model to alleviate the “agency problem” in the design and man-
agement of ECs;
4. extensive comparison of different fair game theoretic mechanism to allocate the collective profits;
5. evaluation of the fair benefit generated by the aggregator, considered as a player contrary to standard
approaches;
6. development of a mathematical optimization model to properly size the EC considering all the above-
mentioned novelties.
1.4 Organization
Our work is structured as follows. Section 2 introduces the organization of ECs and Section 3 describes the
proposed business model for both ECs and aggregators. Game-theoretic methodologies to allocate among the
users and the aggregator the profits generated by the EC are discussed in Section 4, and then implemented
in the mathematical modelling in Section 5. The case study is presented in Section 6 and results are detailed
in Section 7. Finally, conclusions are drawn.
2 The organization of Energy Community
2.1 Description
According to the EU regulation [10], an Energy Community is a no-profit entity whose participants take
collective actions with the goal of possibly engaging all energy customers in energy matters and promote
social innovation. Therefore, in terms of organisation, the EU directives do not pose significant constraints
except that the entity “energy community” shall be no-profit [10], and that in the case of renewable energy
communities (REC), shared energy shall be renewable [27]. Yet, these limitations are loosened up in the
IEMD directive, with the definition of Citizen Energy Communities (CEC). EU countries have only recently
started some initiatives issuing temporary regulations, e.g., in Italy [4] or UK [34], but no stable directives
have been released yet. However, the final implementation is not expected to be significantly different, except
possibly for limitations on the geographical localization and extension of the EC.
In this subsection we provide the business model background for the proposed methodology and we clarify
the possible roles of aggregators and ESCOs in the context of ECs, as sketched in Fig. 1 and Fig. 2.
2.2 Main challenges for the formation of an Energy Community
The incentive of forming ECs is typically based on the awarding of an economic benefit when energy is
produced and consumed among users of the EC [4, 34], thereby lessening the stress on the grid placed
upstream. Currently, the Italian Authority is promoting ECs by means of a Feed-in-Tariff-based mechanism,
similarly to UK till 2019, but other innovative models are expected to promote the coordination with local
Distributor System Operators, producers and consumers [34]. This is the reason why in the proposed schemes
of Fig. 1 and Fig. 2 an economic benefit is rewarded to the entity “Energy Community”.
The current trend in EC adoption—e.g., in the UK, where the business figure of intermediaries seems to
emerge [34]—indicates that the creation of an EC requires a number of skills that rarely belong to a local
8
group of citizens whose main activities are not energy-related. Hence, the optimal design and operation of
the system requires additional skills that may not be present within the EC; this will only be more pressing
in the foreseeable future when innovative business models will emerge. Thus, these activities will have to be
externalized to an aggregator or ESCO (from now on, simply denoted as “the aggregator” for the sake of
expediency) by means of specific service contracts, as shown in Fig. 1 and Fig. 2. In this view, aggregators
will be a fundamental support for ECs, provided that their goals are aligned with the ones of the components
of the EC; failure to ensure this would result in the well-known “agency problem” [44].
A further challenge for the creation of the community lays in the responsibility and ownership of the
assets operated in the EC. Firstly, the new installation of assets implies upfront costs that some users may
not be able or willing to pay. When affordability is the issue, leasing or loans are viable options, despite
being typically more expensive due to the intermediary costs. However, all the users’ contributions, be
them economic or other, such as availability for lending space to install assets, shall be accounted for in
the distribution of the economic benefit awarded to the EC entity with efficient, rational and fair allocation
criteria [46, 37, 47]. Secondly, assets may be installed at a consumer property, but the ownership may be of
the consumer itself, the EC or a third company lending the asset for a fee. When the consumer does not own
the asset, clauses for addressing how upfront costs are shared and how any issue possibly occurring along the
lifetime of the project is solved should be put in place. This is especially critical when assets belonging to
the community are installed at consumers’ places. As shown in Fig. 1 and Fig. 2, assets may be installed also
in locations owned by the EC for the benefit of the community; in this case the EC bears the risks of their
ownership, supervision and management with respect to the other users, especially considering the diverse
nature and specific contribution of the users and their aims.
In our work we primarily consider the case when the assets of the EC are owned (or lent) by the users
and installed at their properties. This is considered as a flexible option because each user will be responsible
of their assets and is directly motivated to maximize their return. Anyway, the proposed approach can easily
be extended to tackle system configurations where part of the assets are owned by the EC.
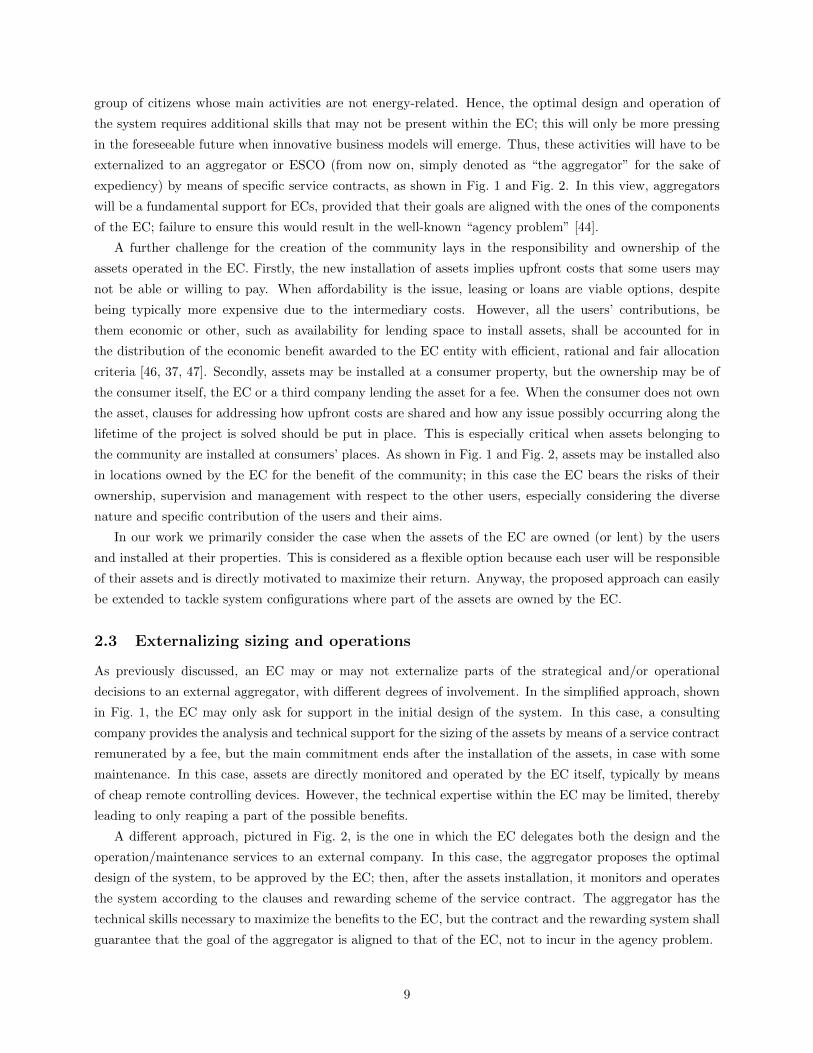
2.3 Externalizing sizing and operations
As previously discussed, an EC may or may not externalize parts of the strategical and/or operational
decisions to an external aggregator, with different degrees of involvement. In the simplified approach, shown
in Fig. 1, the EC may only ask for support in the initial design of the system. In this case, a consulting
company provides the analysis and technical support for the sizing of the assets by means of a service contract
remunerated by a fee, but the main commitment ends after the installation of the assets, in case with some
maintenance. In this case, assets are directly monitored and operated by the EC itself, typically by means
of cheap remote controlling devices. However, the technical expertise within the EC may be limited, thereby
leading to only reaping a part of the possible benefits.
A different approach, pictured in Fig. 2, is the one in which the EC delegates both the design and the
operation/maintenance services to an external company. In this case, the aggregator proposes the optimal
design of the system, to be approved by the EC; then, after the assets installation, it monitors and operates
the system according to the clauses and rewarding scheme of the service contract. The aggregator has the
technical skills necessary to maximize the benefits to the EC, but the contract and the rewarding system shall
guarantee that the goal of the aggregator is aligned to that of the EC, not to incur in the agency problem.
9
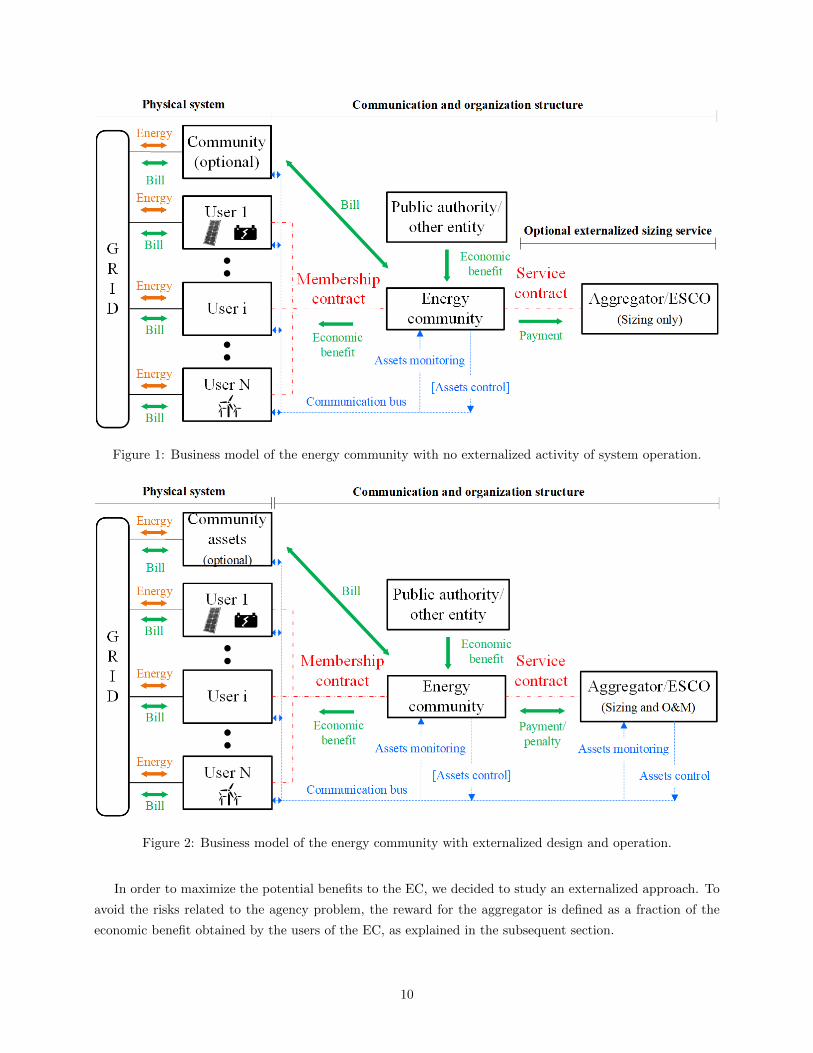
Figure 1: Business model of the energy community with no externalized activity of system operation.
Figure 2: Business model of the energy community with externalized design and operation.
In order to maximize the potential benefits to the EC, we decided to study an externalized approach. To
avoid the risks related to the agency problem, the reward for the aggregator is defined as a fraction of the
economic benefit obtained by the users of the EC, as explained in the subsequent section.
10
3 The business model of the Energy Community and the aggre-
gator
3.1 Key features of the proposed business model
We propose an externalized business model (see Fig. 2) where:
1. users join the EC by means of membership contracts;
2. the EC may economically support users in funding new installations, but installed assets at each user
property, be them in full property or on lease, are full responsibility of the user;
3. in the membership contract, exit clauses specify that any user leaving the aggregate shall reimburse
the EC up a given economic amount, varying with the exit year;
4. the membership contract enables the EC and its technical advisors to access the real-time consumption
data and to control some of the user’s devices (e.g., batteries), which implies that proper remote
communication systems are set in place at the users’ premises;
5. the EC delegates the optimal design, maintenance and operation to an aggregator by means of a service
contract with clauses that reduce the risk of the agency problem, as later detailed;
6. each user buys on the public market the electricity absorbed from the grid, and is paid from the public
market for his extra production injected into the grid;
7. the benefits of the aggregate are rewarded to the EC that distributes them between the aggregator and
the users according to a fair scheme, as discussed in Section 4.
3.2 Service contract to avoid the agency problem
In order to determine the best possible sizing of the system, the aggregator solves a mathematical optimization
problem succinctly, described in (1).
max{NPV A s.t. Agg./Users constraints, SWU,CO ≥ SWU,NC
}(1)
The objective is maximizing its own return NPV A while accounting for users constraints, and in particular
the fact that the social welfare SWU,CO of the EC, i.e., the sum of the users’ NPV (NPV Ui ), must be no
lower than without the aggregator (SWU,NC). Depending on the rewarding scheme, (1) may not lead to
maximize the users’ social welfare, as represented by the mathematical optimization problem: the aggregator
shall provide the users with a system configuration that is better than without him (SWU,CO ≥ SWU,NC),
but this value may not be the global optimum for the aggregate.
max{SWU =
∑i∈I NPV
Ui s.t. Users constraints
}(2)
For instance, were the aggregator be rewarded with a constant fee (NPV A = const), it would have lower
incentives to design and operate the system to maximize the real EC welfare; in other words, any feasible
solution of (1) would be optimal, contrary to the EC’s will. To avoid this issue, for the aggregator we propose
11
a rewarding schemethat is proportional to the benefit obtained by the community with respect to the case
where the aggregator was not in place (SW tot,NC), as shown in (3) where σ > 0 is a constant parameter.
NPV A = σ(SWU,CO − SWU,NC
)(3)
By doing so, the aggregator objective is an affine function with respect to the objective of (2), which means
that (1) achieves the same solution as (2), provided that the aggregators constraints are not restrictive with
respect to the users’ ones.
3.3 The No-Assets (NA), Non-Cooperative (NC) and Aggregated Non-Cooperative
(ANC) configurations
In order to gauge the effect of an aggregator following our proposed business model, we define three possible
alternative configurations. In the No-Asset (NA) configuration no user installs any assets, and therefore all
the energy needs are met by buying all electricity from the public market, without any EC intervention.
Since the corresponding energy bill can be very expensive, users may rationally prefer to install assets in
their properties with the goal of maximizing their own profits, still without any EC being in place. In the
corresponding Non-Cooperative (NC) configuration each user is independent and operates its own assets at
its maximum profitability, regardless of the others; this is the configuration that we have chosen as base
case scenario for the numerical simulations. It is worth mentioning that that we assume that each user,
and therefore also the EC, is expected to be able to optimally size the system in this non-cooperative way,
possibly with an external advisory.
When an EC is put in place the optimal collective solution can be more profitable than with the NC
approach, since mutual energy exchanges within the EC yield economic benefits. Thus, users optimized
independently in a NC way can still rationally decide to form an EC to benefit from the this additional
reward without changing their behaviour. We denote as Aggregated Non-Cooperative (ANC) an EC that is
formed on the same technical solution of the NC case, i.e., without any increase in the coordination of users’
systems. It is worth remarking that the corresponding unintended margin is related to the enabling policy
framework of the EC, as discussed in details in the following.
3.4 The exit clause
The combined optimization of the entire EC as a whole enables achieving higher profits than the NC and ANC
configurations, but creates mutual constraints. That is, if a user leaves the EC the other members may not
achieve the expected profitability targets. We propose the use of economic “exit” clauses in the membership
contract whereby users are obliged to pay a time-decreasing fee in the event they leave the aggregate. These
clauses are taken into account during the development of the mathematical model (cf. Section 5) and we
provide a methodology to quantify the exit fee so as to ensure that the remaining users are not damaged.
4 Game-theoretic reward allocation
In this section we describe some game-theoretic criteria that can be used to fairly distribute the total EC
reward among the users and with the aggregator (if any).
12
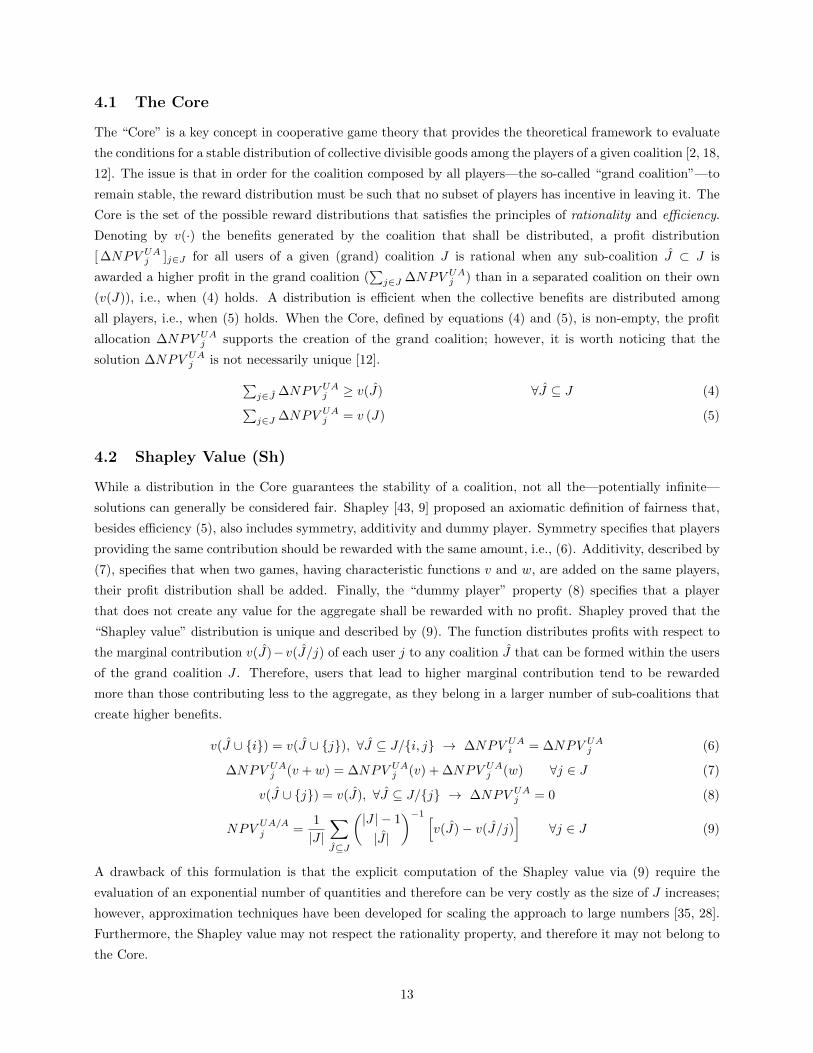
4.1 The Core
The “Core” is a key concept in cooperative game theory that provides the theoretical framework to evaluate
the conditions for a stable distribution of collective divisible goods among the players of a given coalition [2, 18,
12]. The issue is that in order for the coalition composed by all players—the so-called “grand coalition”—to
remain stable, the reward distribution must be such that no subset of players has incentive in leaving it. The
Core is the set of the possible reward distributions that satisfies the principles of rationality and efficiency.
Denoting by v(·) the benefits generated by the coalition that shall be distributed, a profit distribution
[ ∆NPV UAj ]j∈J for all users of a given (grand) coalition J is rational when any sub-coalition J ⊂ J is
awarded a higher profit in the grand coalition (∑
j∈J ∆NPV UAj ) than in a separated coalition on their own
(v(J)), i.e., when (4) holds. A distribution is efficient when the collective benefits are distributed among
all players, i.e., when (5) holds. When the Core, defined by equations (4) and (5), is non-empty, the profit
allocation ∆NPV UAj supports the creation of the grand coalition; however, it is worth noticing that the
solution ∆NPV UAj is not necessarily unique [12].∑
j∈J ∆NPV UAj ≥ v(J) ∀J ⊆ J (4)∑
j∈J ∆NPV UAj = v (J) (5)
4.2 Shapley Value (Sh)
While a distribution in the Core guarantees the stability of a coalition, not all the—potentially infinite—
solutions can generally be considered fair. Shapley [43, 9] proposed an axiomatic definition of fairness that,
besides efficiency (5), also includes symmetry, additivity and dummy player. Symmetry specifies that players
providing the same contribution should be rewarded with the same amount, i.e., (6). Additivity, described by
(7), specifies that when two games, having characteristic functions v and w, are added on the same players,
their profit distribution shall be added. Finally, the “dummy player” property (8) specifies that a player
that does not create any value for the aggregate shall be rewarded with no profit. Shapley proved that the
“Shapley value” distribution is unique and described by (9). The function distributes profits with respect to
the marginal contribution v(J)−v(J/j) of each user j to any coalition J that can be formed within the users
of the grand coalition J . Therefore, users that lead to higher marginal contribution tend to be rewarded
more than those contributing less to the aggregate, as they belong in a larger number of sub-coalitions that
create higher benefits.
v(J ∪ {i}) = v(J ∪ {j}), ∀J ⊆ J/{i, j} → ∆NPV UAi = ∆NPV UA
j (6)
∆NPV UAj (v + w) = ∆NPV UA
j (v) + ∆NPV UAj (w) ∀j ∈ J (7)
v(J ∪ {j}) = v(J), ∀J ⊆ J/{j} → ∆NPV UAj = 0 (8)
NPVUA/Aj =
1
|J |∑J⊆J
(|J | − 1
|J |
)−1 [v(J)− v(J/j)
]∀j ∈ J (9)
A drawback of this formulation is that the explicit computation of the Shapley value via (9) require the
evaluation of an exponential number of quantities and therefore can be very costly as the size of J increases;
however, approximation techniques have been developed for scaling the approach to large numbers [35, 28].
Furthermore, the Shapley value may not respect the rationality property, and therefore it may not belong to
the Core.
13
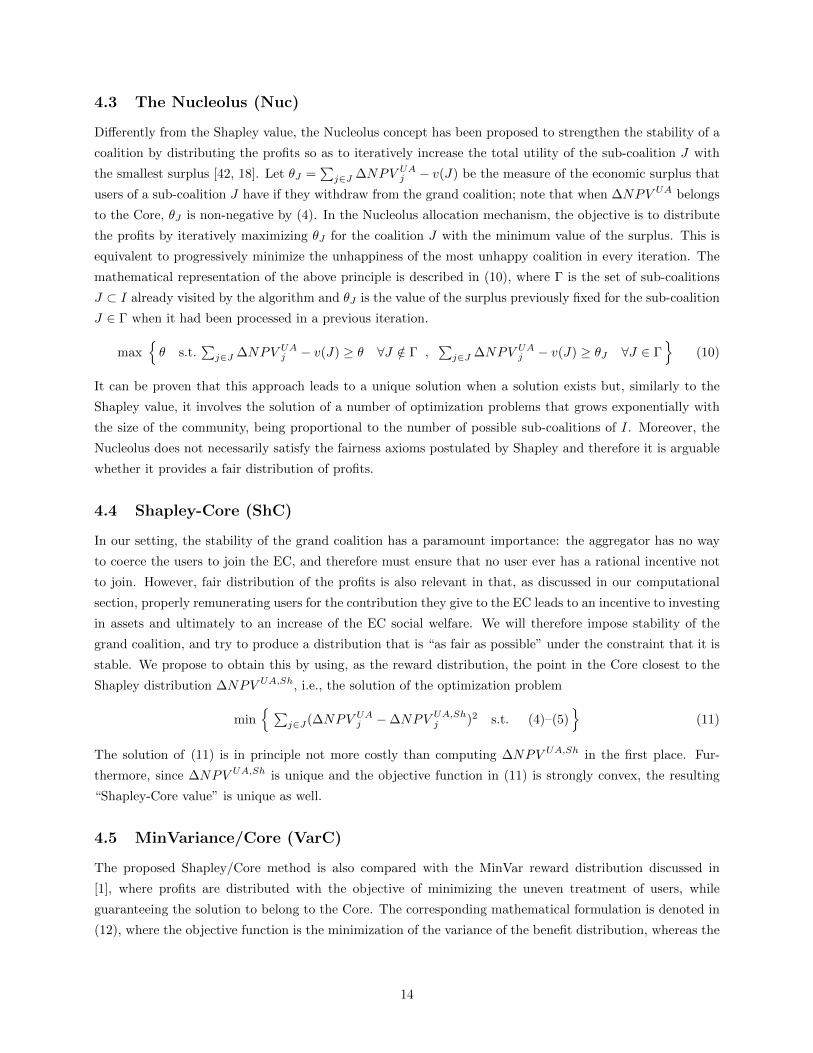
4.3 The Nucleolus (Nuc)
Differently from the Shapley value, the Nucleolus concept has been proposed to strengthen the stability of a
coalition by distributing the profits so as to iteratively increase the total utility of the sub-coalition J with
the smallest surplus [42, 18]. Let θJ =∑
j∈J ∆NPV UAj − v(J) be the measure of the economic surplus that
users of a sub-coalition J have if they withdraw from the grand coalition; note that when ∆NPV UA belongs
to the Core, θJ is non-negative by (4). In the Nucleolus allocation mechanism, the objective is to distribute
the profits by iteratively maximizing θJ for the coalition J with the minimum value of the surplus. This is
equivalent to progressively minimize the unhappiness of the most unhappy coalition in every iteration. The
mathematical representation of the above principle is described in (10), where Γ is the set of sub-coalitions
J ⊂ I already visited by the algorithm and θJ is the value of the surplus previously fixed for the sub-coalition
J ∈ Γ when it had been processed in a previous iteration.
max{θ s.t.
∑j∈J ∆NPV UA
j − v(J) ≥ θ ∀J /∈ Γ ,∑
j∈J ∆NPV UAj − v(J) ≥ θJ ∀J ∈ Γ
}(10)
It can be proven that this approach leads to a unique solution when a solution exists but, similarly to the
Shapley value, it involves the solution of a number of optimization problems that grows exponentially with
the size of the community, being proportional to the number of possible sub-coalitions of I. Moreover, the
Nucleolus does not necessarily satisfy the fairness axioms postulated by Shapley and therefore it is arguable
whether it provides a fair distribution of profits.
4.4 Shapley-Core (ShC)
In our setting, the stability of the grand coalition has a paramount importance: the aggregator has no way
to coerce the users to join the EC, and therefore must ensure that no user ever has a rational incentive not
to join. However, fair distribution of the profits is also relevant in that, as discussed in our computational
section, properly remunerating users for the contribution they give to the EC leads to an incentive to investing
in assets and ultimately to an increase of the EC social welfare. We will therefore impose stability of the
grand coalition, and try to produce a distribution that is “as fair as possible” under the constraint that it is
stable. We propose to obtain this by using, as the reward distribution, the point in the Core closest to the
Shapley distribution ∆NPV UA,Sh, i.e., the solution of the optimization problem
min{ ∑
j∈J(∆NPV UAj −∆NPV UA,Sh
j )2 s.t. (4)–(5)}
(11)
The solution of (11) is in principle not more costly than computing ∆NPV UA,Sh in the first place. Fur-
thermore, since ∆NPV UA,Sh is unique and the objective function in (11) is strongly convex, the resulting
“Shapley-Core value” is unique as well.
4.5 MinVariance/Core (VarC)
The proposed Shapley/Core method is also compared with the MinVar reward distribution discussed in
[1], where profits are distributed with the objective of minimizing the uneven treatment of users, while
guaranteeing the solution to belong to the Core. The corresponding mathematical formulation is denoted in
(12), where the objective function is the minimization of the variance of the benefit distribution, whereas the
14
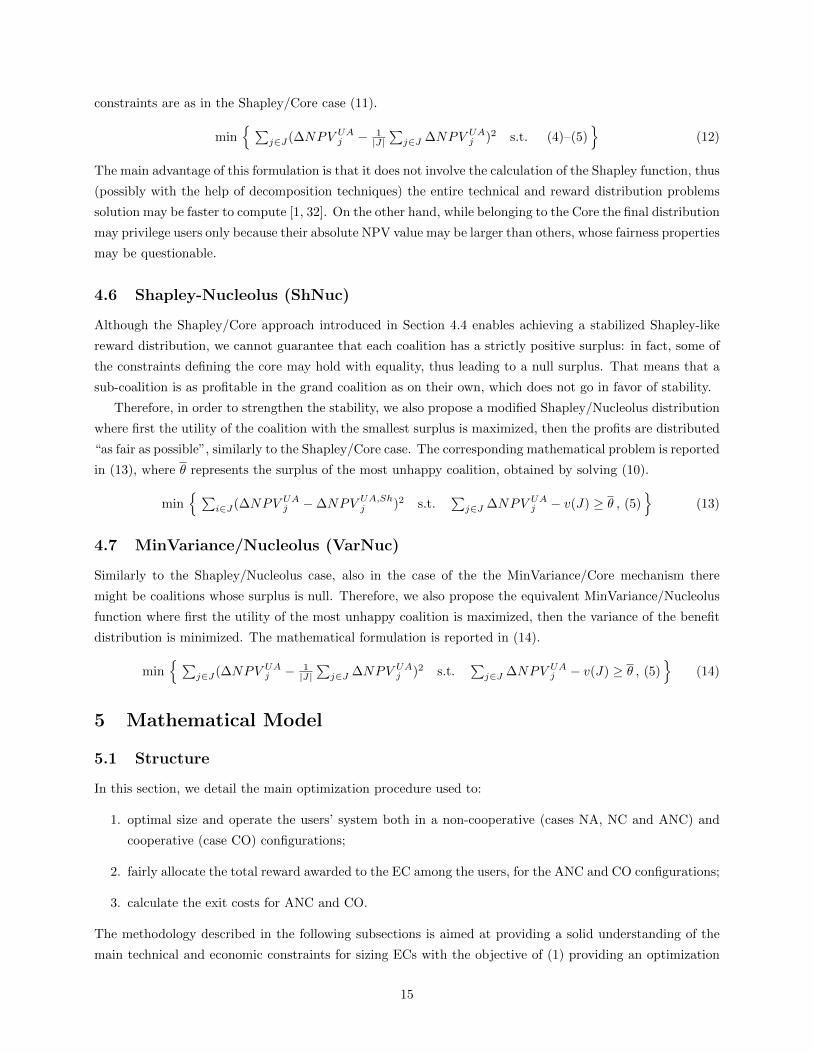
constraints are as in the Shapley/Core case (11).
min{ ∑
j∈J(∆NPV UAj − 1
|J|∑
j∈J ∆NPV UAj )2 s.t. (4)–(5)
}(12)
The main advantage of this formulation is that it does not involve the calculation of the Shapley function, thus
(possibly with the help of decomposition techniques) the entire technical and reward distribution problems
solution may be faster to compute [1, 32]. On the other hand, while belonging to the Core the final distribution
may privilege users only because their absolute NPV value may be larger than others, whose fairness properties
may be questionable.
4.6 Shapley-Nucleolus (ShNuc)
Although the Shapley/Core approach introduced in Section 4.4 enables achieving a stabilized Shapley-like
reward distribution, we cannot guarantee that each coalition has a strictly positive surplus: in fact, some of
the constraints defining the core may hold with equality, thus leading to a null surplus. That means that a
sub-coalition is as profitable in the grand coalition as on their own, which does not go in favor of stability.
Therefore, in order to strengthen the stability, we also propose a modified Shapley/Nucleolus distribution
where first the utility of the coalition with the smallest surplus is maximized, then the profits are distributed
“as fair as possible”, similarly to the Shapley/Core case. The corresponding mathematical problem is reported
in (13), where θ represents the surplus of the most unhappy coalition, obtained by solving (10).
min{ ∑
i∈J(∆NPV UAj −∆NPV UA,Sh
j )2 s.t.∑
j∈J ∆NPV UAj − v(J) ≥ θ , (5)
}(13)
4.7 MinVariance/Nucleolus (VarNuc)
Similarly to the Shapley/Nucleolus case, also in the case of the the MinVariance/Core mechanism there
might be coalitions whose surplus is null. Therefore, we also propose the equivalent MinVariance/Nucleolus
function where first the utility of the most unhappy coalition is maximized, then the variance of the benefit
distribution is minimized. The mathematical formulation is reported in (14).
min{ ∑
j∈J(∆NPV UAj − 1
|J|∑
j∈J ∆NPV UAj )2 s.t.
∑j∈J ∆NPV UA
j − v(J) ≥ θ , (5)}
(14)
5 Mathematical Model
5.1 Structure
In this section, we detail the main optimization procedure used to:
1. optimal size and operate the users’ system both in a non-cooperative (cases NA, NC and ANC) and
cooperative (case CO) configurations;
2. fairly allocate the total reward awarded to the EC among the users, for the ANC and CO configurations;
3. calculate the exit costs for ANC and CO.
The methodology described in the following subsections is aimed at providing a solid understanding of the
main technical and economic constraints for sizing ECs with the objective of (1) providing an optimization
15

method for ECs based on the proposed business model, (2) evaluating advantages and drawbacks of the
selected game-theoretic reward allocation functions, and (3) calculating the exit costs. In particular, as
clarified in the following, these three main problems are decoupled and can be solved in a row: first (1),
then (2) and finally (3). This characteristic of the problem dramatically simplifies the solving strategy and
therefore considerably enhances the practical usefulness of the proposed approach.
In particular, to perform task 1, cost parameters at the user place and adequate forecasts of both the load
demand and renewable energy production for the selected users are needed. In the NA, NC and ANC cases,
those assessments are performed by each user independently, if necessary with the support of a delegate;
conversely in the CO case a central entity like an aggregator shall receive enough information to do so. In
the latter case, as discussed in Section 3, users’ privacy can be addressed by legal agreements that forbid
the aggregator to misuse the private information, thus that requirement is not expected to be a significant
barrier for the EC creation.
To properly estimate the operation costs, the model accounts for the seasonality in the load profile, the
renewable energy production and their variability along the year. In particular, the yearly simulations are
approximated by using representative days so as to guarantee a good compromise between accuracy of the
results and low computational cost. According to the suggestion of [39], in this study 12 representative days
are selected to capture the main variations in both the load and renewable production power profiles.
5.2 Optimal design and sizing model
In this section, we introduce the main techno-economic modeling of the optimization of the users’ energy sys-
tem and the aggregate for the different configurations under consideration: No-Assets (NA), Non-Cooperative
(NC), Aggregated Non-Cooperative (ANC) and COoperative (CO).
5.2.1 User objective
In the NA, NC and ANC configurations, each single user j ∈ J aims at maximizing its own Net Present Value
(NPV), shown in (15), that does not account for any reward by the EC, since no coordination is in place. The
NPV accounts for the net economic balance RU,Pj,y between energy sold and bought from the public market,
the costs CU,Pj,y due to the peak power, the investment costs CAPEXU
j,y, the replacement of the assets RCUj,y
and their residual value RV Uj,y at the end of the project lifetime |Y |, taking into account the discount factor
d.
max NPV Uj =
∑y∈Y
[RU,P
j,y − CU,Pj,y − CAPEX
Uj,y −RC
Uj,y +RV U
j,y
](1 + d)
y (15)
The net economic balance due to the energy exchanged with the public grid is shown in (16). Be the EC
in place or not, every unit of energy drained by the user at its own POD, corresponding to a non-null power
dispatch of PU,POD−j,t , is bought from the public market at the national price πP−,V
t + πP−,Ft , where πP−,F
t
is the tariff component on the demand consumption and πP−,Vt is the tariff on the withdrawing. The same
applies when energy is sold, yet with power dispatch PU,POD+j,t and price πP+
t < πP−,Vt . Accordingly, the
peak power cost CU,Pj,y is proportional to the maximum power exchange PU,max
j,w at the POD, be it inwards or
outwards. As representative days are used to characterize the yearly load demand, the coefficients mTt and
16
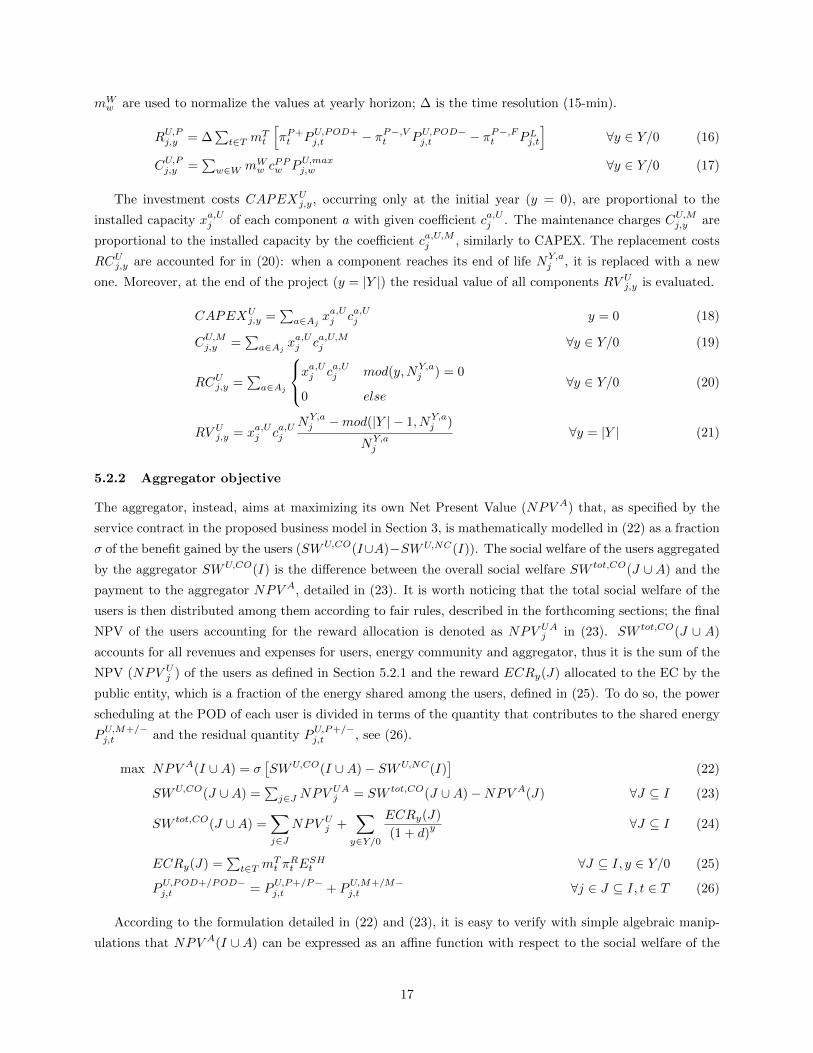
mWw are used to normalize the values at yearly horizon; ∆ is the time resolution (15-min).
RU,Pj,y = ∆
∑t∈T m
Tt
[πP+t PU,POD+
j,t − πP−,Vt PU,POD−
j,t − πP−,Ft PL
j,t
]∀y ∈ Y/0 (16)
CU,Pj,y =
∑w∈W mW
w cPPw PU,max
j,w ∀y ∈ Y/0 (17)
The investment costs CAPEXUj,y, occurring only at the initial year (y = 0), are proportional to the
installed capacity xa,Uj of each component a with given coefficient ca,Uj . The maintenance charges CU,Mj,y are
proportional to the installed capacity by the coefficient ca,U,Mj , similarly to CAPEX. The replacement costs
RCUj,y are accounted for in (20): when a component reaches its end of life NY,a
j , it is replaced with a new
one. Moreover, at the end of the project (y = |Y |) the residual value of all components RV Uj,y is evaluated.
CAPEXUj,y =
∑a∈Aj
xa,Uj ca,Uj y = 0 (18)
CU,Mj,y =
∑a∈Aj
xa,Uj ca,U,Mj ∀y ∈ Y/0 (19)
RCUj,y =
∑a∈Aj
xa,Uj ca,Uj mod(y,NY,a
j ) = 0
0 else∀y ∈ Y/0 (20)
RV Uj,y = xa,Uj ca,Uj
NY,aj −mod(|Y | − 1, NY,a
j )
NY,aj
∀y = |Y | (21)
5.2.2 Aggregator objective
The aggregator, instead, aims at maximizing its own Net Present Value (NPV A) that, as specified by the
service contract in the proposed business model in Section 3, is mathematically modelled in (22) as a fraction
σ of the benefit gained by the users (SWU,CO(I∪A)−SWU,NC(I)). The social welfare of the users aggregated
by the aggregator SWU,CO(I) is the difference between the overall social welfare SW tot,CO(J ∪ A) and the
payment to the aggregator NPV A, detailed in (23). It is worth noticing that the total social welfare of the
users is then distributed among them according to fair rules, described in the forthcoming sections; the final
NPV of the users accounting for the reward allocation is denoted as NPV UAj in (23). SW tot,CO(J ∪ A)
accounts for all revenues and expenses for users, energy community and aggregator, thus it is the sum of the
NPV (NPV Uj ) of the users as defined in Section 5.2.1 and the reward ECRy(J) allocated to the EC by the
public entity, which is a fraction of the energy shared among the users, defined in (25). To do so, the power
scheduling at the POD of each user is divided in terms of the quantity that contributes to the shared energy
PU,M+/−j,t and the residual quantity P
U,P+/−j,t , see (26).
max NPV A(I ∪A) = σ[SWU,CO(I ∪A)− SWU,NC(I)
](22)
SWU,CO(J ∪A) =∑
j∈J NPVUAj = SW tot,CO(J ∪A)−NPV A(J) ∀J ⊆ I (23)
SW tot,CO(J ∪A) =∑j∈J
NPV Uj +
∑y∈Y/0
ECRy(J)
(1 + d)y ∀J ⊆ I (24)
ECRy(J) =∑
t∈T mTt π
Rt E
SHt ∀J ⊆ I, y ∈ Y/0 (25)
PU,POD+/POD−j,t = P
U,P+/P−j,t + P
U,M+/M−j,t ∀j ∈ J ⊆ I, t ∈ T (26)
According to the formulation detailed in (22) and (23), it is easy to verify with simple algebraic manip-
ulations that NPV A(I ∪ A) can be expressed as an affine function with respect to the social welfare of the
17
entire system (SW tot,CO(J ∪A)), as shown in (27).
NPV A(J ∪A) =σ
1 + σSW tot,CO(J ∪A)− SWU,NC(J)
1 + σ∀J ⊆ I (27)
In fact, both σ and SWU,NC(I) are constants for the problem of the aggregator. Moreover, since the
remuneration of the aggregator cannot but be a positive fraction of the total generated profits, σ is a strictly
positive constant, which means that the solution obtained by maximizing NPV A(I ∪ A) is equivalent to
one obtained by maximizing over the social welfare of the aggregate (SW tot,CO(J ∪ A)). This confirms
that the proposed business model enables aligning the optimization problem of the aggregator towards the
maximization of the social welfare for the entire system, which goes in favor of addressing the potential
agency problem.
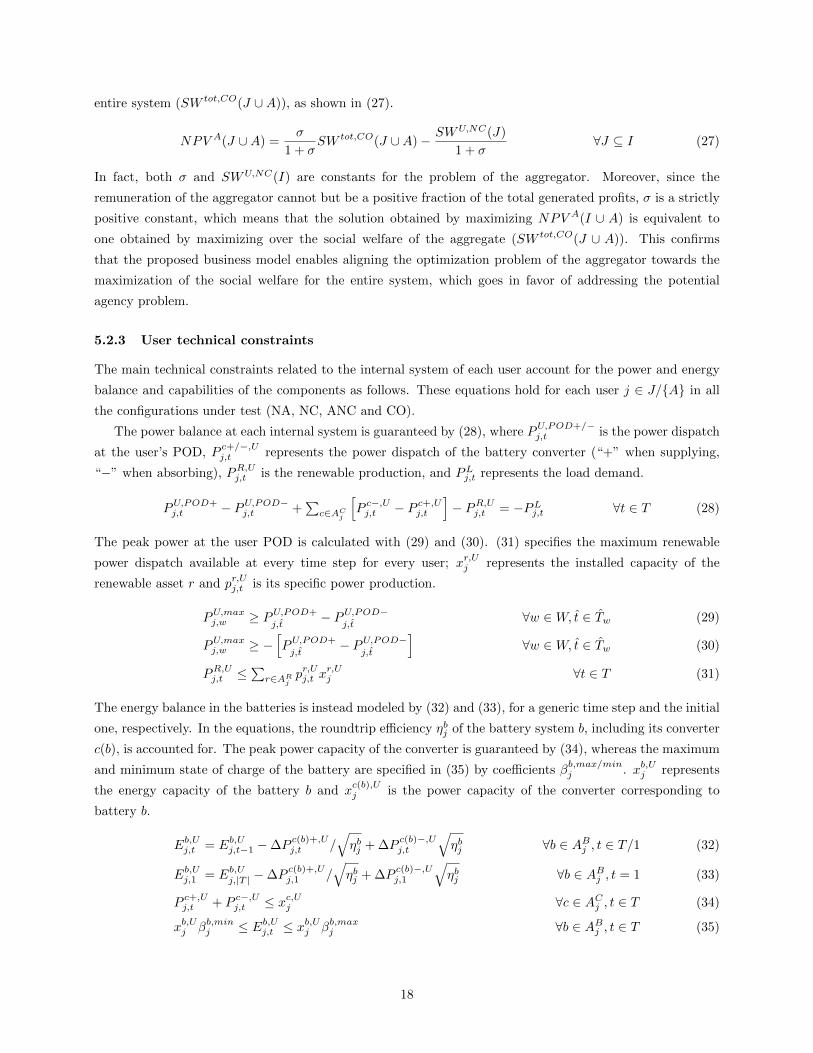
5.2.3 User technical constraints
The main technical constraints related to the internal system of each user account for the power and energy
balance and capabilities of the components as follows. These equations hold for each user j ∈ J/{A} in all
the configurations under test (NA, NC, ANC and CO).
The power balance at each internal system is guaranteed by (28), where PU,POD+/−j,t is the power dispatch
at the user’s POD, Pc+/−,Uj,t represents the power dispatch of the battery converter (“+” when supplying,
“−” when absorbing), PR,Uj,t is the renewable production, and PL
j,t represents the load demand.
PU,POD+j,t − PU,POD−
j,t +∑
c∈ACj
[P c−,Uj,t − P c+,U
j,t
]− PR,U
j,t = −PLj,t ∀t ∈ T (28)
The peak power at the user POD is calculated with (29) and (30). (31) specifies the maximum renewable
power dispatch available at every time step for every user; xr,Uj represents the installed capacity of the
renewable asset r and pr,Uj,t is its specific power production.
PU,maxj,w ≥ PU,POD+
j,t− PU,POD−
j,t∀w ∈W, t ∈ Tw (29)
PU,maxj,w ≥ −
[PU,POD+
j,t− PU,POD−
j,t
]∀w ∈W, t ∈ Tw (30)
PR,Uj,t ≤
∑r∈AR
jpr,Uj,t x
r,Uj ∀t ∈ T (31)
The energy balance in the batteries is instead modeled by (32) and (33), for a generic time step and the initial
one, respectively. In the equations, the roundtrip efficiency ηbj of the battery system b, including its converter
c(b), is accounted for. The peak power capacity of the converter is guaranteed by (34), whereas the maximum
and minimum state of charge of the battery are specified in (35) by coefficients βb,max/minj . xb,Uj represents
the energy capacity of the battery b and xc(b),Uj is the power capacity of the converter corresponding to
battery b.
Eb,Uj,t = Eb,U
j,t−1 −∆Pc(b)+,Uj,t /
√ηbj + ∆P
c(b)−,Uj,t
√ηbj ∀b ∈ AB
j , t ∈ T/1 (32)
Eb,Uj,1 = Eb,U
j,|T | −∆Pc(b)+,Uj,1 /
√ηbj + ∆P
c(b)−,Uj,1
√ηbj ∀b ∈ AB
j , t = 1 (33)
P c+,Uj,t + P c−,U
j,t ≤ xc,Uj ∀c ∈ ACj , t ∈ T (34)
xb,Uj βb,minj ≤ Eb,U
j,t ≤ xb,Uj βb,max
j ∀b ∈ ABj , t ∈ T (35)
18
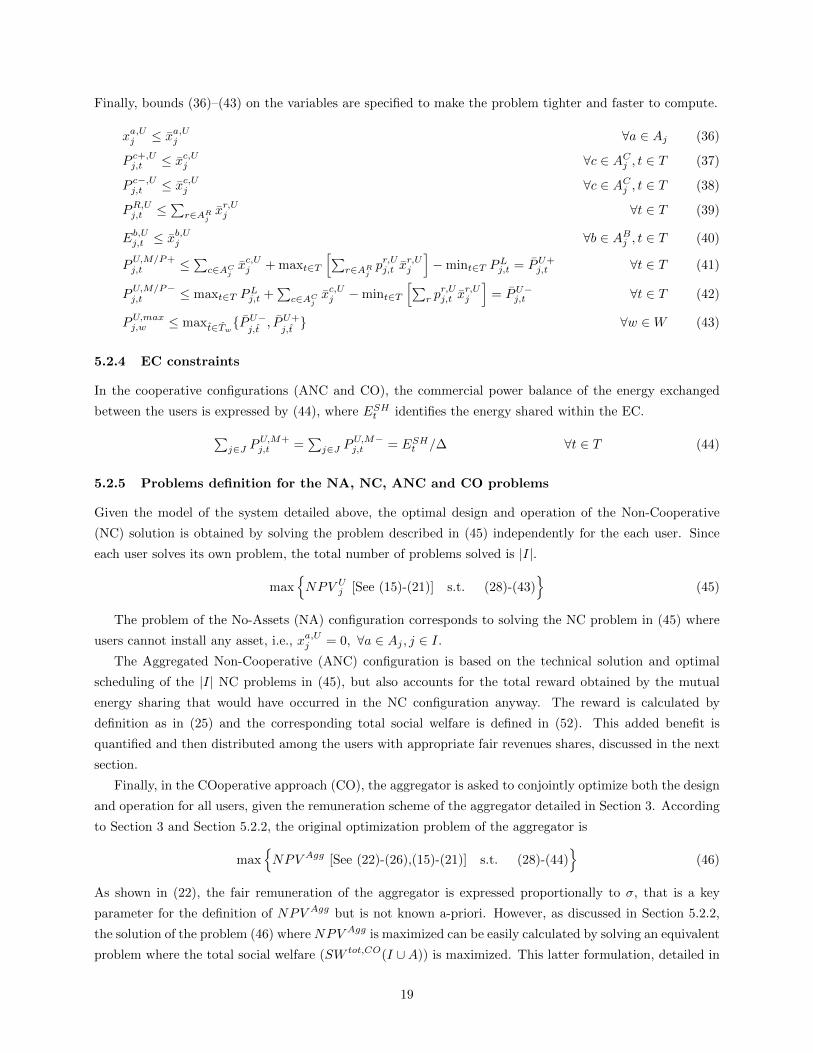
Finally, bounds (36)–(43) on the variables are specified to make the problem tighter and faster to compute.
xa,Uj ≤ xa,Uj ∀a ∈ Aj (36)
P c+,Uj,t ≤ xc,Uj ∀c ∈ AC
j , t ∈ T (37)
P c−,Uj,t ≤ xc,Uj ∀c ∈ AC
j , t ∈ T (38)
PR,Uj,t ≤
∑r∈AR
jxr,Uj ∀t ∈ T (39)
Eb,Uj,t ≤ x
b,Uj ∀b ∈ AB
j , t ∈ T (40)
PU,M/P+j,t ≤
∑c∈AC
jxc,Uj + maxt∈T
[∑r∈AR
jpr,Uj,t x
r,Uj
]−mint∈T P
Lj,t = PU+
j,t ∀t ∈ T (41)
PU,M/P−j,t ≤ maxt∈T P
Lj,t +
∑c∈AC
jxc,Uj −mint∈T
[∑r p
r,Uj,t x
r,Uj
]= PU−
j,t ∀t ∈ T (42)
PU,maxj,w ≤ maxt∈Tw
{PU−j,t
, PU+j,t} ∀w ∈W (43)
5.2.4 EC constraints
In the cooperative configurations (ANC and CO), the commercial power balance of the energy exchanged
between the users is expressed by (44), where ESHt identifies the energy shared within the EC.∑
j∈J PU,M+j,t =
∑j∈J P
U,M−j,t = ESH
t /∆ ∀t ∈ T (44)
5.2.5 Problems definition for the NA, NC, ANC and CO problems
Given the model of the system detailed above, the optimal design and operation of the Non-Cooperative
(NC) solution is obtained by solving the problem described in (45) independently for the each user. Since
each user solves its own problem, the total number of problems solved is |I|.
max{NPV U
j [See (15)-(21)] s.t. (28)-(43)}
(45)
The problem of the No-Assets (NA) configuration corresponds to solving the NC problem in (45) where
users cannot install any asset, i.e., xa,Uj = 0, ∀a ∈ Aj , j ∈ I.
The Aggregated Non-Cooperative (ANC) configuration is based on the technical solution and optimal
scheduling of the |I| NC problems in (45), but also accounts for the total reward obtained by the mutual
energy sharing that would have occurred in the NC configuration anyway. The reward is calculated by
definition as in (25) and the corresponding total social welfare is defined in (52). This added benefit is
quantified and then distributed among the users with appropriate fair revenues shares, discussed in the next
section.
Finally, in the COoperative approach (CO), the aggregator is asked to conjointly optimize both the design
and operation for all users, given the remuneration scheme of the aggregator detailed in Section 3. According
to Section 3 and Section 5.2.2, the original optimization problem of the aggregator is
max{NPV Agg [See (22)-(26),(15)-(21)] s.t. (28)-(44)
}(46)
As shown in (22), the fair remuneration of the aggregator is expressed proportionally to σ, that is a key
parameter for the definition of NPV Agg but is not known a-priori. However, as discussed in Section 5.2.2,
the solution of the problem (46) where NPV Agg is maximized can be easily calculated by solving an equivalent
problem where the total social welfare (SW tot,CO(I ∪A)) is maximized. This latter formulation, detailed in
19
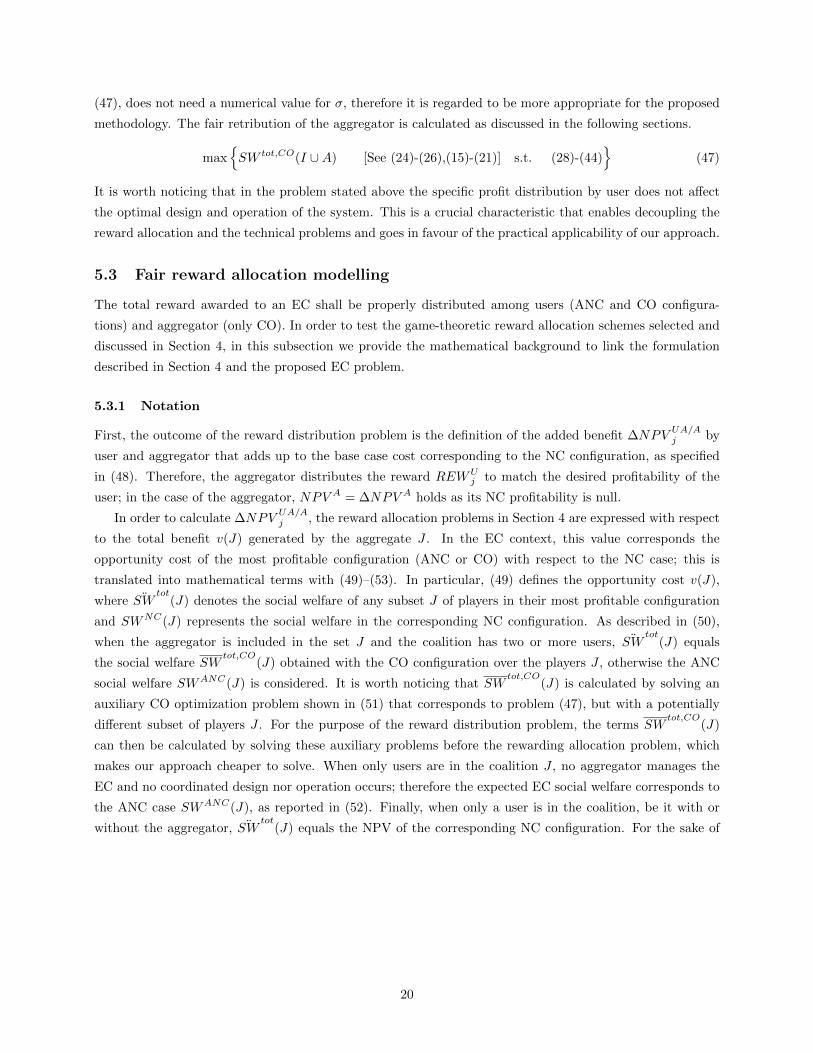
(47), does not need a numerical value for σ, therefore it is regarded to be more appropriate for the proposed
methodology. The fair retribution of the aggregator is calculated as discussed in the following sections.
max{SW tot,CO(I ∪A) [See (24)-(26),(15)-(21)] s.t. (28)-(44)
}(47)
It is worth noticing that in the problem stated above the specific profit distribution by user does not affect
the optimal design and operation of the system. This is a crucial characteristic that enables decoupling the
reward allocation and the technical problems and goes in favour of the practical applicability of our approach.
5.3 Fair reward allocation modelling
The total reward awarded to an EC shall be properly distributed among users (ANC and CO configura-
tions) and aggregator (only CO). In order to test the game-theoretic reward allocation schemes selected and
discussed in Section 4, in this subsection we provide the mathematical background to link the formulation
described in Section 4 and the proposed EC problem.
5.3.1 Notation
First, the outcome of the reward distribution problem is the definition of the added benefit ∆NPVUA/Aj by
user and aggregator that adds up to the base case cost corresponding to the NC configuration, as specified
in (48). Therefore, the aggregator distributes the reward REWUj to match the desired profitability of the
user; in the case of the aggregator, NPV A = ∆NPV A holds as its NC profitability is null.
In order to calculate ∆NPVUA/Aj , the reward allocation problems in Section 4 are expressed with respect
to the total benefit v(J) generated by the aggregate J . In the EC context, this value corresponds the
opportunity cost of the most profitable configuration (ANC or CO) with respect to the NC case; this is
translated into mathematical terms with (49)–(53). In particular, (49) defines the opportunity cost v(J),
where ¨SWtot
(J) denotes the social welfare of any subset J of players in their most profitable configuration
and SWNC(J) represents the social welfare in the corresponding NC configuration. As described in (50),
when the aggregator is included in the set J and the coalition has two or more users, ¨SWtot
(J) equals
the social welfare SWtot,CO
(J) obtained with the CO configuration over the players J , otherwise the ANC
social welfare SWANC(J) is considered. It is worth noticing that SWtot,CO
(J) is calculated by solving an
auxiliary CO optimization problem shown in (51) that corresponds to problem (47), but with a potentially
different subset of players J . For the purpose of the reward distribution problem, the terms SWtot,CO
(J)
can then be calculated by solving these auxiliary problems before the rewarding allocation problem, which
makes our approach cheaper to solve. When only users are in the coalition J , no aggregator manages the
EC and no coordinated design nor operation occurs; therefore the expected EC social welfare corresponds to
the ANC case SWANC(J), as reported in (52). Finally, when only a user is in the coalition, be it with or
without the aggregator, ¨SWtot
(J) equals the NPV of the corresponding NC configuration. For the sake of
20
comprehensiveness, we also report the social welfare of the NC case, shown in (53).
NPV UAj (J) = NPV U,NC
j (J) + ∆NPV UAj (J) = NPV U
j (J) +REWUj (J) ∀j ∈ J, J ⊆ I ∪ {A} (48)
v(J) = ¨SWtot
(J)− SWNC(J) ∀J ⊆ I ∪ {A} (49)
¨SWtot
(J) =
SWtot,CO
(J) {A} ∈ J ∧ |J | > 2
SWANC(J) {A} /∈ J
NPV U,NCj J = {i, A}
0 J = ∅ ∨ J = {A}
∀J ⊆ I ∪ {A} (50)
SWtot,CO
(J) = max{SW tot,CO(J) s.t. (28)-(44)
}∀J ⊆ I ∪ {A} : {A} ∈ J (51)
SWANC(J) =
SWNC(J) +
∑y
ECRANCy (J)
(1 + d)y |J | > 1
SWNC(J) |J | ≤ 1
∀J ⊆ I (52)
SWNC(J) =
∑
j∈J NPVU,NCj J 6= ∅
0 J = ∅∀J ⊆ I (53)
5.3.2 Reward allocation problems
Crucially, the optimal design and operation models stated in Section 5.2 are not constrained by the reward
distribution problems, which means that the two problems can be decoupled and solved in sequence: first,
the EC design and operation are optimized; then, the reward allocation and the exit costs are calculated
accordingly.
Therefore, the optimal reward allocation problems discussed in Section 4 can be solved as-is, provided the
mathematical links stated in (48)–(53). For the sake of clarity, we do not repeat the mathematical modelling of
the different reward schemes, but the corresponding problems have been implemented and solved accordingly.
5.4 Exit clauses
Finally, equations (54) and (55) describe the procedure to calculate the value of the exit clauses, aimed
at preserving the economic benefits of the EC players in the case a user leaves the aggregate, as discussed
in Section 3. In particular, when a user i leaves at year 1, the rest of the aggregate can only achieve the
social welfare SWtot,CO
(I/i ∪ A) (I/{i}), whereas before the user exited, their reward was SW tot,CO(I ∪A)−NPV UA
i ; therefore, the user shall pay this difference V exiti,1 , namely the exit clause. SW
tot,CO(I/i ∪A)
has already been calculated by the auxiliary problems detailed in (51) and NPV UAi is the total user NPV
accounting for a specific reward scheme, calculated with the methodology in the previous subsection.
However, it is unlikely that a user exits the EC within the first year. It is more plausible that the event
occurs y years after the installation, e.g. because unexpected personal needs. In that case, the exit cost V exiti,y
for the user exiting in a generic year y shall decrease because the EC is affected for the remaining years of
21
the project (|Y | − y + 1), as detailed in (55).
V exiti,1 = SW tot,CO(I ∪A)−NPV UA
i − SW tot,CO(I/i ∪A) ∀i ∈ I, y = 1 (54)
V exiti,y = V exit
i,1
∑|Y |−y+1y=1
1(1+d)y∑|Y |
y=11
(1+d)y
∀i ∈ I, y ∈ Y : y > 1 (55)
By using the proposed exit cost, the energy community and aggregator are provided with a tool to quantify
and clarify what happens in the case a user leaves the aggregate.
6 Case Study
The case study aims at validating the proposed business model and comparing both the different optimization
methodologies (NA, NC, ANC and CO) and the different reward distribution schemes. The numerical example
focuses on a possible EC composed by 10 large residential/commercial users served by a typical distribution
substation in the peri-urban area of an Italian city. However, due to lack of Italian data and given their
similar socio-economic behaviour, we used as a reference the electrical profiles measured from a Portuguese
substation [49], with average yearly demand in the range 12-31 MWh/y. The location favour the installation of
PV solar and wind resources; data about the corresponding energy output for our study has been determined
according to [38]. When energy is purchased from the grid, the electricity price is assumed to be 18c€/kWh,
of which 2c€/kWh corresponds to fixed costs (πP−,Ft ); when energy is sold to the grid, the tariff (πP+
t ) is
5c€/kWh [4]. Moreover, the EC reward price (πRt ) is assumed to be 10.8c€/kWh, in agreement with the
present Italian regulation [4].
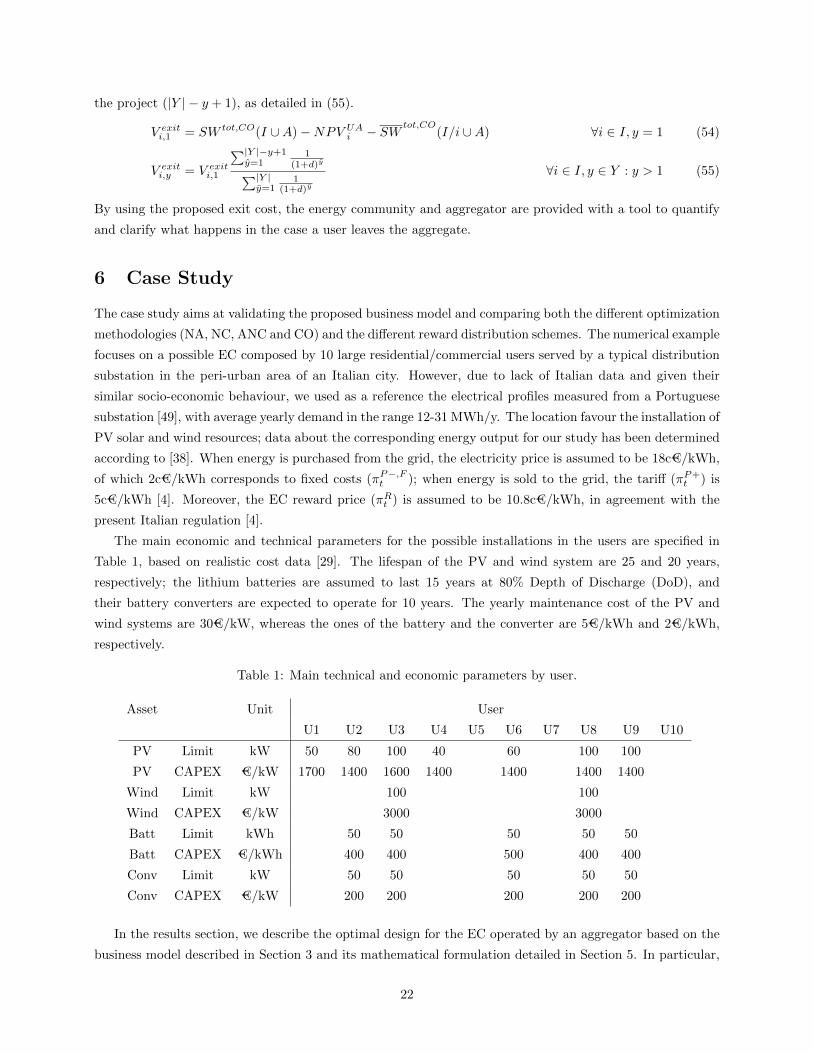
The main economic and technical parameters for the possible installations in the users are specified in
Table 1, based on realistic cost data [29]. The lifespan of the PV and wind system are 25 and 20 years,
respectively; the lithium batteries are assumed to last 15 years at 80% Depth of Discharge (DoD), and
their battery converters are expected to operate for 10 years. The yearly maintenance cost of the PV and
wind systems are 30€/kW, whereas the ones of the battery and the converter are 5€/kWh and 2€/kWh,
respectively.
Table 1: Main technical and economic parameters by user.
Asset Unit User
U1 U2 U3 U4 U5 U6 U7 U8 U9 U10
PV Limit kW 50 80 100 40 60 100 100
PV CAPEX €/kW 1700 1400 1600 1400 1400 1400 1400
Wind Limit kW 100 100
Wind CAPEX €/kW 3000 3000
Batt Limit kWh 50 50 50 50 50
Batt CAPEX €/kWh 400 400 500 400 400
Conv Limit kW 50 50 50 50 50
Conv CAPEX €/kW 200 200 200 200 200
In the results section, we describe the optimal design for the EC operated by an aggregator based on the
business model described in Section 3 and its mathematical formulation detailed in Section 5. In particular,
22
the cooperative model (CO) is compared to both the non-cooperative configurations (NA, NC and ANC)
to highlight the possible benefits provided by the aggregator; possible fair schemes (Shapley value, Core,
Nucleolus and Core/Shapley) to distribute the reward granted to the energy community are compared.
7 Results
The main economic results of the proposed method are shown in Fig. 3, Fig. 6, Fig. 9, Fig. 10 and Table 3,
whereas the main technical results are reported in Fig. 7, Fig. 8, Fig. 4, Fig. 5 and Fig. 11. For simplicity, since
most of the numerical values of the social welfare and NPV are negative values, we refer to their opposite,
namely Social Cost (SC = −SW ) and Net Present Cost (NPC = −NPV ), respectively.
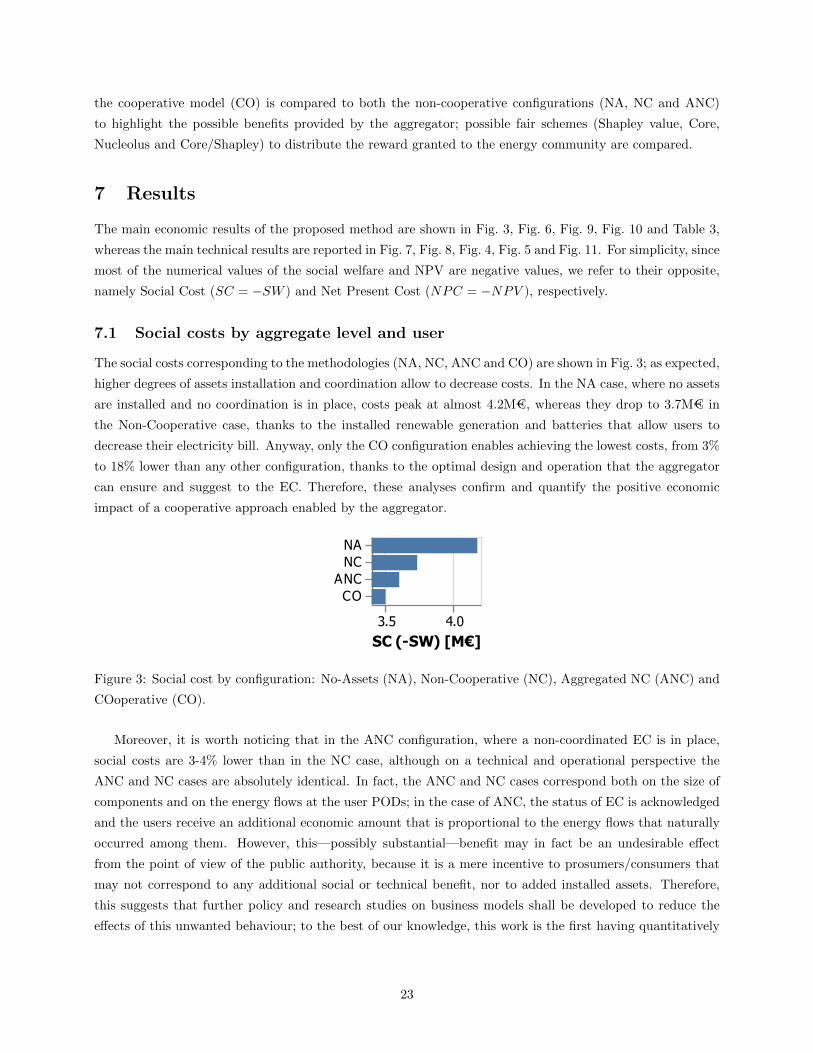
7.1 Social costs by aggregate level and user
The social costs corresponding to the methodologies (NA, NC, ANC and CO) are shown in Fig. 3; as expected,
higher degrees of assets installation and coordination allow to decrease costs. In the NA case, where no assets
are installed and no coordination is in place, costs peak at almost 4.2M€, whereas they drop to 3.7M€ in
the Non-Cooperative case, thanks to the installed renewable generation and batteries that allow users to
decrease their electricity bill. Anyway, only the CO configuration enables achieving the lowest costs, from 3%
to 18% lower than any other configuration, thanks to the optimal design and operation that the aggregator
can ensure and suggest to the EC. Therefore, these analyses confirm and quantify the positive economic
impact of a cooperative approach enabled by the aggregator.
3.5 4.0SC (-SW) [M€]
NANCANCCO
Figure 3: Social cost by configuration: No-Assets (NA), Non-Cooperative (NC), Aggregated NC (ANC) and
COoperative (CO).
Moreover, it is worth noticing that in the ANC configuration, where a non-coordinated EC is in place,
social costs are 3-4% lower than in the NC case, although on a technical and operational perspective the
ANC and NC cases are absolutely identical. In fact, the ANC and NC cases correspond both on the size of
components and on the energy flows at the user PODs; in the case of ANC, the status of EC is acknowledged
and the users receive an additional economic amount that is proportional to the energy flows that naturally
occurred among them. However, this—possibly substantial—benefit may in fact be an undesirable effect
from the point of view of the public authority, because it is a mere incentive to prosumers/consumers that
may not correspond to any additional social or technical benefit, nor to added installed assets. Therefore,
this suggests that further policy and research studies on business models shall be developed to reduce the
effects of this unwanted behaviour; to the best of our knowledge, this work is the first having quantitatively
23
discussed and detailed this issue. Instead, coordinated approach such as the CO configurations should be
promoted.
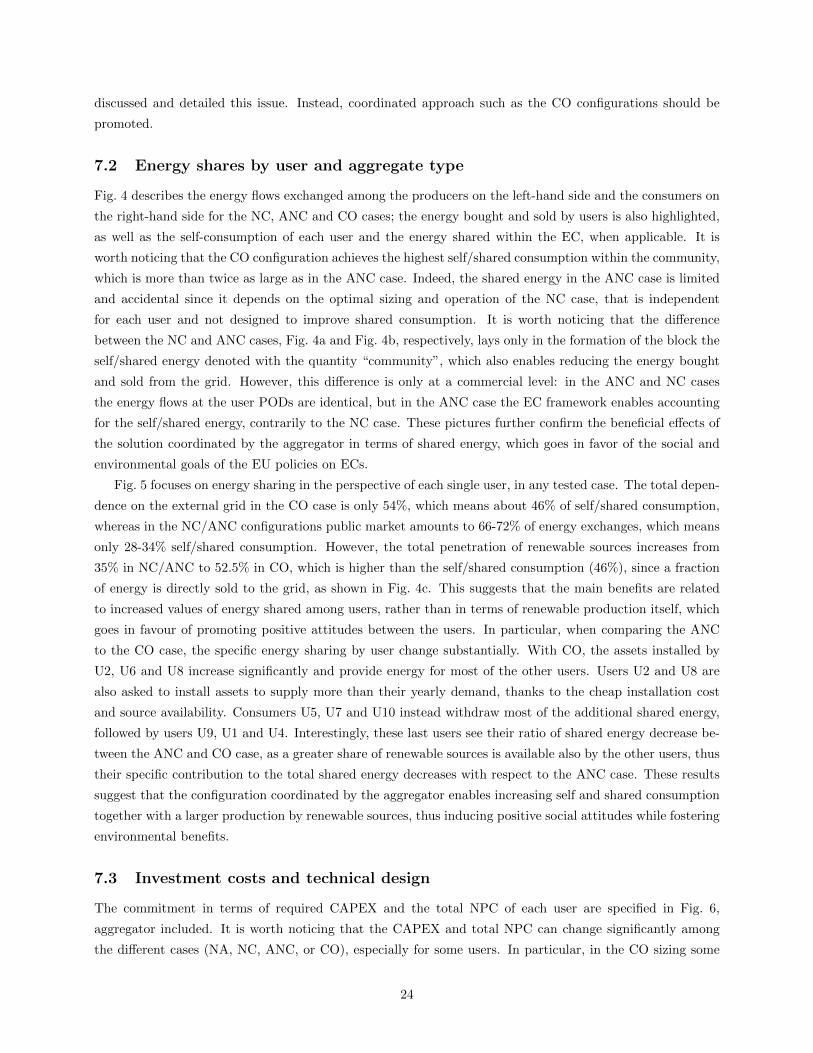
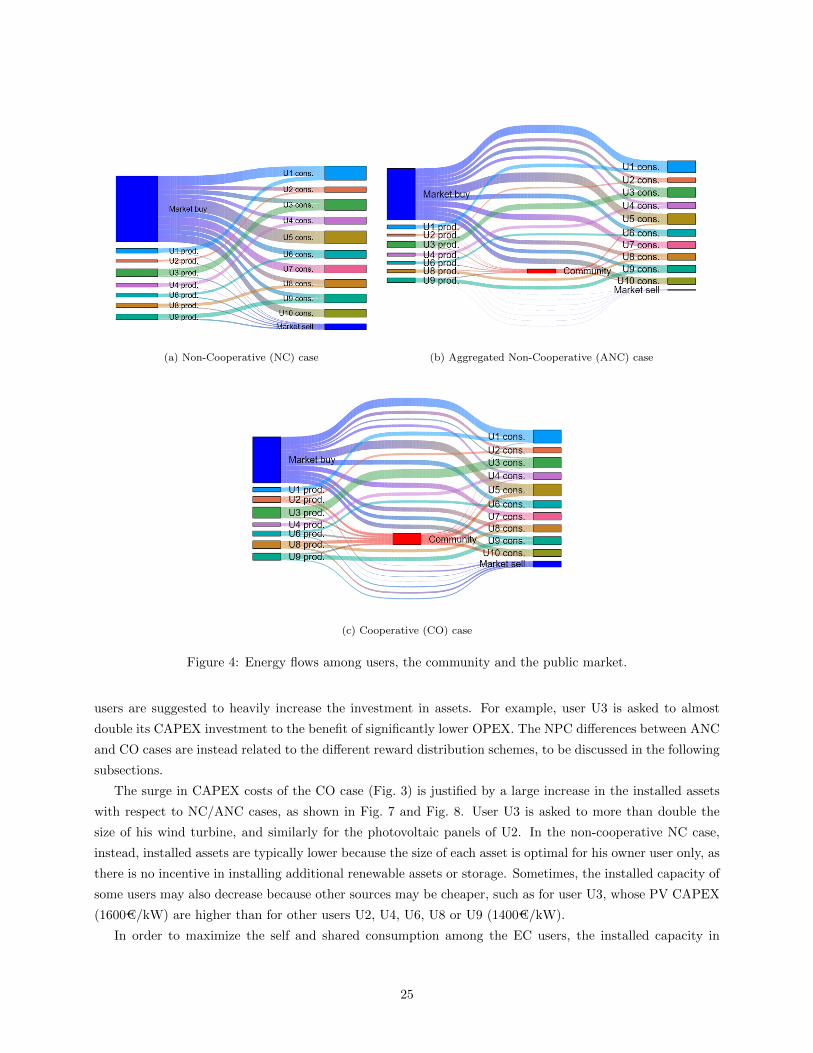
7.2 Energy shares by user and aggregate type
Fig. 4 describes the energy flows exchanged among the producers on the left-hand side and the consumers on
the right-hand side for the NC, ANC and CO cases; the energy bought and sold by users is also highlighted,
as well as the self-consumption of each user and the energy shared within the EC, when applicable. It is
worth noticing that the CO configuration achieves the highest self/shared consumption within the community,
which is more than twice as large as in the ANC case. Indeed, the shared energy in the ANC case is limited
and accidental since it depends on the optimal sizing and operation of the NC case, that is independent
for each user and not designed to improve shared consumption. It is worth noticing that the difference
between the NC and ANC cases, Fig. 4a and Fig. 4b, respectively, lays only in the formation of the block the
self/shared energy denoted with the quantity “community”, which also enables reducing the energy bought
and sold from the grid. However, this difference is only at a commercial level: in the ANC and NC cases
the energy flows at the user PODs are identical, but in the ANC case the EC framework enables accounting
for the self/shared energy, contrarily to the NC case. These pictures further confirm the beneficial effects of
the solution coordinated by the aggregator in terms of shared energy, which goes in favor of the social and
environmental goals of the EU policies on ECs.
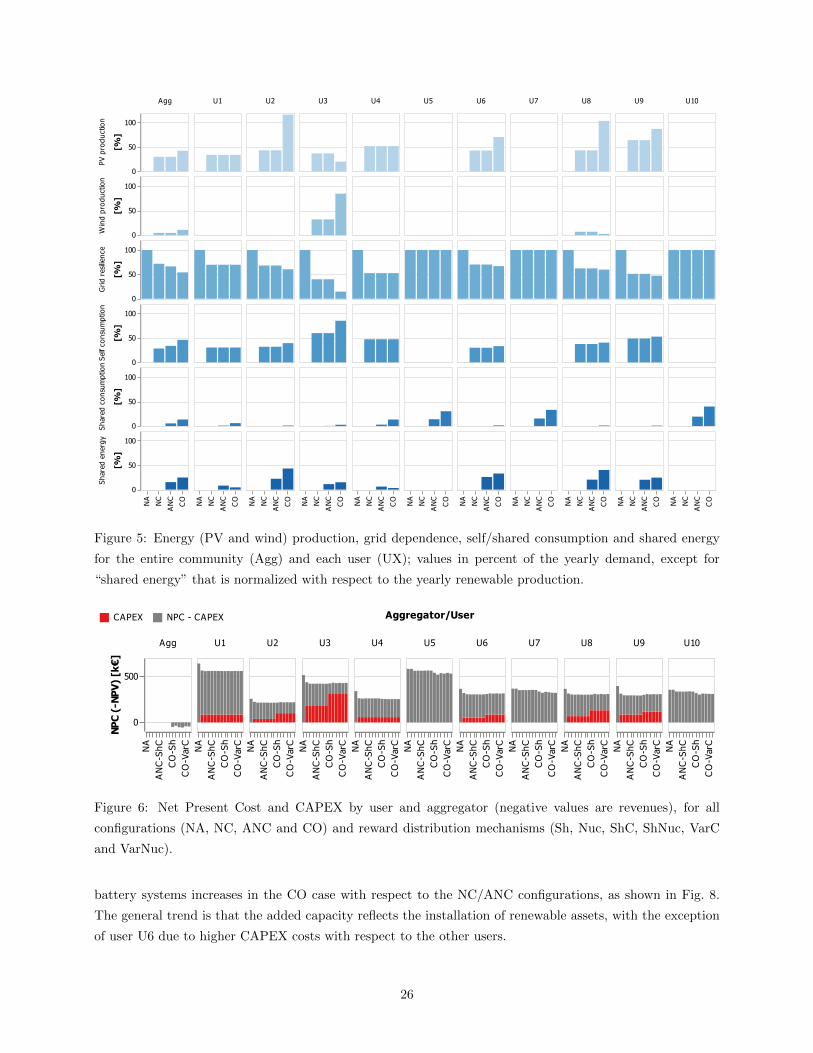
Fig. 5 focuses on energy sharing in the perspective of each single user, in any tested case. The total depen-
dence on the external grid in the CO case is only 54%, which means about 46% of self/shared consumption,
whereas in the NC/ANC configurations public market amounts to 66-72% of energy exchanges, which means
only 28-34% self/shared consumption. However, the total penetration of renewable sources increases from
35% in NC/ANC to 52.5% in CO, which is higher than the self/shared consumption (46%), since a fraction
of energy is directly sold to the grid, as shown in Fig. 4c. This suggests that the main benefits are related
to increased values of energy shared among users, rather than in terms of renewable production itself, which
goes in favour of promoting positive attitudes between the users. In particular, when comparing the ANC
to the CO case, the specific energy sharing by user change substantially. With CO, the assets installed by
U2, U6 and U8 increase significantly and provide energy for most of the other users. Users U2 and U8 are
also asked to install assets to supply more than their yearly demand, thanks to the cheap installation cost
and source availability. Consumers U5, U7 and U10 instead withdraw most of the additional shared energy,
followed by users U9, U1 and U4. Interestingly, these last users see their ratio of shared energy decrease be-
tween the ANC and CO case, as a greater share of renewable sources is available also by the other users, thus
their specific contribution to the total shared energy decreases with respect to the ANC case. These results
suggest that the configuration coordinated by the aggregator enables increasing self and shared consumption
together with a larger production by renewable sources, thus inducing positive social attitudes while fostering
environmental benefits.
7.3 Investment costs and technical design
The commitment in terms of required CAPEX and the total NPC of each user are specified in Fig. 6,
aggregator included. It is worth noticing that the CAPEX and total NPC can change significantly among
the different cases (NA, NC, ANC, or CO), especially for some users. In particular, in the CO sizing some
24
(a) Non-Cooperative (NC) case (b) Aggregated Non-Cooperative (ANC) case
(c) Cooperative (CO) case
Figure 4: Energy flows among users, the community and the public market.
users are suggested to heavily increase the investment in assets. For example, user U3 is asked to almost
double its CAPEX investment to the benefit of significantly lower OPEX. The NPC differences between ANC
and CO cases are instead related to the different reward distribution schemes, to be discussed in the following
subsections.
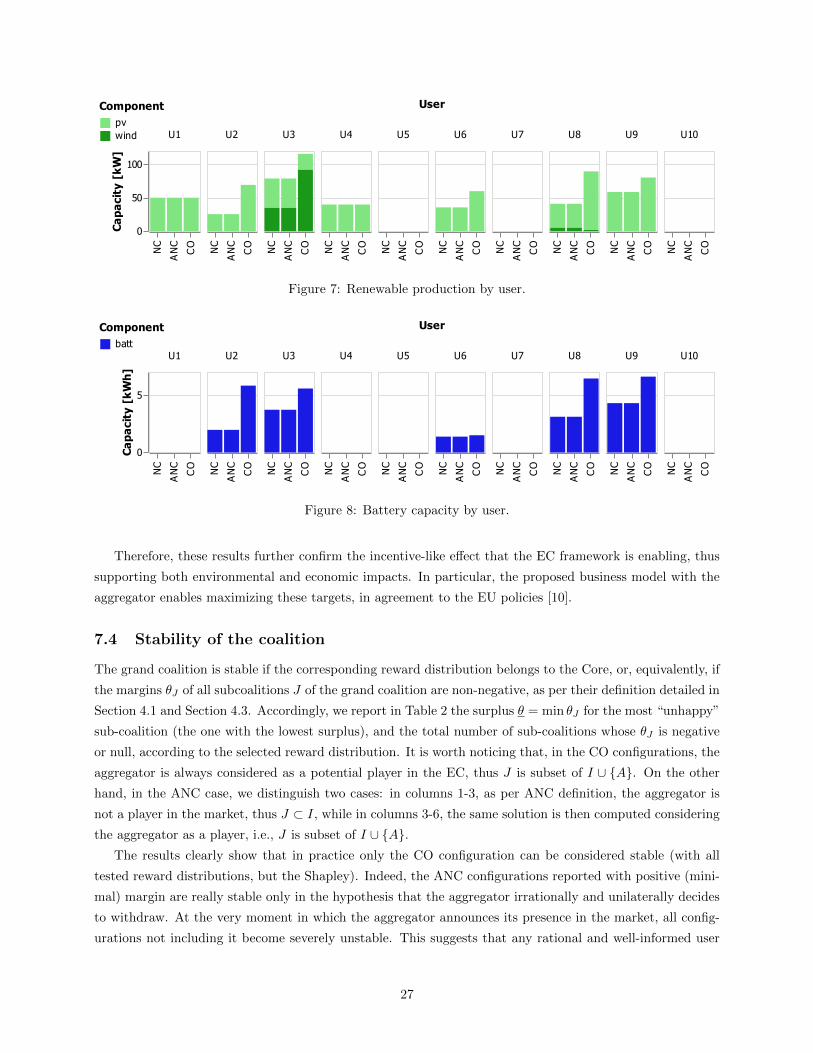
The surge in CAPEX costs of the CO case (Fig. 3) is justified by a large increase in the installed assets
with respect to NC/ANC cases, as shown in Fig. 7 and Fig. 8. User U3 is asked to more than double the
size of his wind turbine, and similarly for the photovoltaic panels of U2. In the non-cooperative NC case,
instead, installed assets are typically lower because the size of each asset is optimal for his owner user only, as
there is no incentive in installing additional renewable assets or storage. Sometimes, the installed capacity of
some users may also decrease because other sources may be cheaper, such as for user U3, whose PV CAPEX
(1600€/kW) are higher than for other users U2, U4, U6, U8 or U9 (1400€/kW).
In order to maximize the self and shared consumption among the EC users, the installed capacity in
25
0
50
100[%]
PV p
rodu
ctio
n
0
50
100
[%]
Win
d pr
oduc
tion
0
50
100
[%]
Grid
res
ilienc
e
0
50
100
[%]
Self
cons
umpt
ion
0
50
100
[%]
Shar
ed c
onsu
mpt
ion
0
50
100
[%]
Shar
ed e
nerg
yAgg U1 U2 U3 U4 U5 U6 U7 U8 U9 U10
NA
NC
AN
C
CO NA
NC
AN
C
CO NA
NC
AN
C
CO NA
NC
AN
C
CO NA
NC
AN
C
CO NA
NC
AN
C
CO NA
NC
AN
C
CO NA
NC
AN
C
CO NA
NC
AN
C
CO NA
NC
AN
C
CO NA
NC
AN
C
CO
Figure 5: Energy (PV and wind) production, grid dependence, self/shared consumption and shared energy
for the entire community (Agg) and each user (UX); values in percent of the yearly demand, except for
“shared energy” that is normalized with respect to the yearly renewable production.
Aggregator/User
0
500
NP
C (
-NP
V)
[k€
]
Agg U1 U2 U3 U4 U5 U6 U7 U8 U9 U10
NA
AN
C-S
hCC
O-S
hC
O-V
arC
NA
AN
C-S
hCC
O-S
hC
O-V
arC
NA
AN
C-S
hCC
O-S
hC
O-V
arC
NA
AN
C-S
hCC
O-S
hC
O-V
arC
NA
AN
C-S
hCC
O-S
hC
O-V
arC
NA
AN
C-S
hCC
O-S
hC
O-V
arC
NA
AN
C-S
hCC
O-S
hC
O-V
arC
NA
AN
C-S
hCC
O-S
hC
O-V
arC
NA
AN
C-S
hCC
O-S
hC
O-V
arC
NA
AN
C-S
hCC
O-S
hC
O-V
arC
NA
AN
C-S
hCC
O-S
hC
O-V
arC
CAPEX NPC - CAPEX
Figure 6: Net Present Cost and CAPEX by user and aggregator (negative values are revenues), for all
configurations (NA, NC, ANC and CO) and reward distribution mechanisms (Sh, Nuc, ShC, ShNuc, VarC
and VarNuc).
battery systems increases in the CO case with respect to the NC/ANC configurations, as shown in Fig. 8.
The general trend is that the added capacity reflects the installation of renewable assets, with the exception
of user U6 due to higher CAPEX costs with respect to the other users.
26
User
0
50
100
Ca
pa
city
[k
W]
U1 U2 U3 U4 U5 U6 U7 U8 U9 U10
NC
ANC
CO NC
ANC
CO NC
ANC
CO NC
ANC
CO NC
ANC
CO NC
ANC
CO NC
ANC
CO NC
ANC
CO NC
ANC
CO NC
ANC
CO
pvwind
Component
Figure 7: Renewable production by user.
User
0
5
Ca
pa
city
[k
Wh
]
U1 U2 U3 U4 U5 U6 U7 U8 U9 U10
NC
ANC
CO NC
ANC
CO NC
ANC
CO NC
ANC
CO NC
ANC
CO NC
ANC
CO NC
ANC
CO NC
ANC
CO NC
ANC
CO NC
ANC
CO
batt
Component
Figure 8: Battery capacity by user.
Therefore, these results further confirm the incentive-like effect that the EC framework is enabling, thus
supporting both environmental and economic impacts. In particular, the proposed business model with the
aggregator enables maximizing these targets, in agreement to the EU policies [10].
7.4 Stability of the coalition
The grand coalition is stable if the corresponding reward distribution belongs to the Core, or, equivalently, if
the margins θJ of all subcoalitions J of the grand coalition are non-negative, as per their definition detailed in
Section 4.1 and Section 4.3. Accordingly, we report in Table 2 the surplus θ = min θJ for the most “unhappy”
sub-coalition (the one with the lowest surplus), and the total number of sub-coalitions whose θJ is negative
or null, according to the selected reward distribution. It is worth noticing that, in the CO configurations, the
aggregator is always considered as a potential player in the EC, thus J is subset of I ∪ {A}. On the other
hand, in the ANC case, we distinguish two cases: in columns 1-3, as per ANC definition, the aggregator is
not a player in the market, thus J ⊂ I, while in columns 3-6, the same solution is then computed considering
the aggregator as a player, i.e., J is subset of I ∪ {A}.The results clearly show that in practice only the CO configuration can be considered stable (with all
tested reward distributions, but the Shapley). Indeed, the ANC configurations reported with positive (mini-
mal) margin are really stable only in the hypothesis that the aggregator irrationally and unilaterally decides
to withdraw. At the very moment in which the aggregator announces its presence in the market, all config-
urations not including it become severely unstable. This suggests that any rational and well-informed user
27
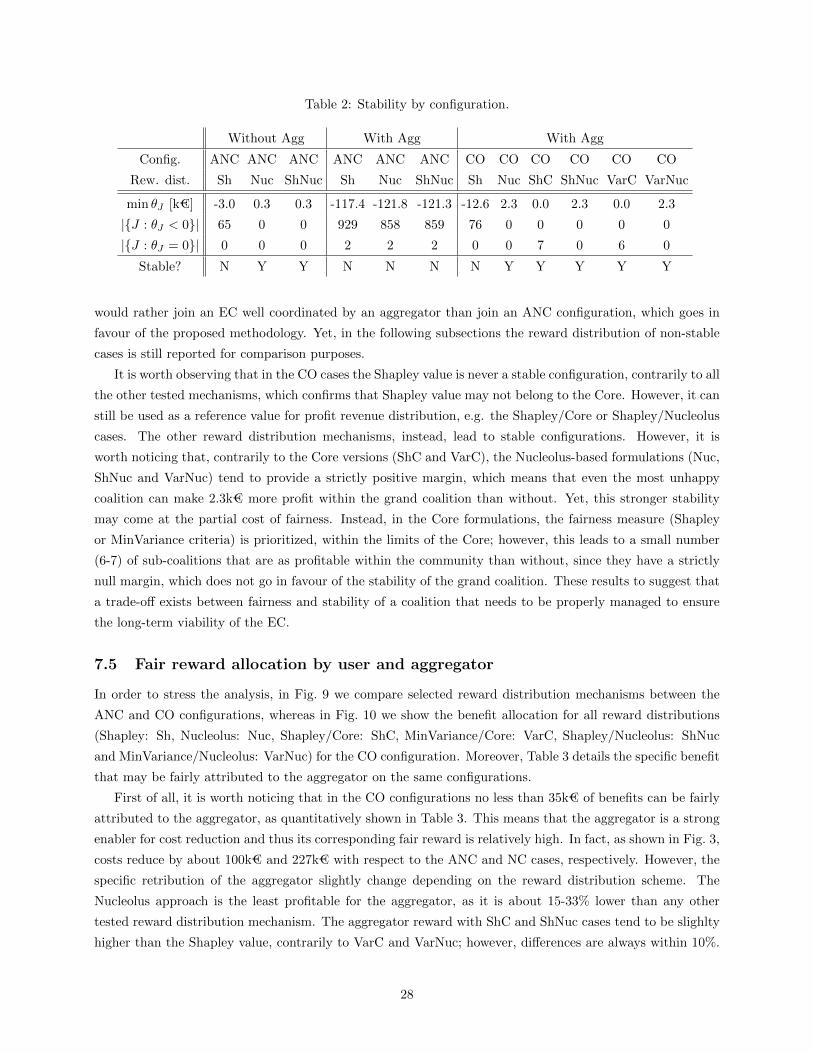
Table 2: Stability by configuration.
Without Agg With Agg With Agg
Config. ANC ANC ANC ANC ANC ANC CO CO CO CO CO CO
Rew. dist. Sh Nuc ShNuc Sh Nuc ShNuc Sh Nuc ShC ShNuc VarC VarNuc
min θJ [k€] -3.0 0.3 0.3 -117.4 -121.8 -121.3 -12.6 2.3 0.0 2.3 0.0 2.3
|{J : θJ < 0}| 65 0 0 929 858 859 76 0 0 0 0 0
|{J : θJ = 0}| 0 0 0 2 2 2 0 0 7 0 6 0
Stable? N Y Y N N N N Y Y Y Y Y
would rather join an EC well coordinated by an aggregator than join an ANC configuration, which goes in
favour of the proposed methodology. Yet, in the following subsections the reward distribution of non-stable
cases is still reported for comparison purposes.
It is worth observing that in the CO cases the Shapley value is never a stable configuration, contrarily to all
the other tested mechanisms, which confirms that Shapley value may not belong to the Core. However, it can
still be used as a reference value for profit revenue distribution, e.g. the Shapley/Core or Shapley/Nucleolus
cases. The other reward distribution mechanisms, instead, lead to stable configurations. However, it is
worth noticing that, contrarily to the Core versions (ShC and VarC), the Nucleolus-based formulations (Nuc,
ShNuc and VarNuc) tend to provide a strictly positive margin, which means that even the most unhappy
coalition can make 2.3k€ more profit within the grand coalition than without. Yet, this stronger stability
may come at the partial cost of fairness. Instead, in the Core formulations, the fairness measure (Shapley
or MinVariance criteria) is prioritized, within the limits of the Core; however, this leads to a small number
(6-7) of sub-coalitions that are as profitable within the community than without, since they have a strictly
null margin, which does not go in favour of the stability of the grand coalition. These results to suggest that
a trade-off exists between fairness and stability of a coalition that needs to be properly managed to ensure
the long-term viability of the EC.
7.5 Fair reward allocation by user and aggregator
In order to stress the analysis, in Fig. 9 we compare selected reward distribution mechanisms between the
ANC and CO configurations, whereas in Fig. 10 we show the benefit allocation for all reward distributions
(Shapley: Sh, Nucleolus: Nuc, Shapley/Core: ShC, MinVariance/Core: VarC, Shapley/Nucleolus: ShNuc
and MinVariance/Nucleolus: VarNuc) for the CO configuration. Moreover, Table 3 details the specific benefit
that may be fairly attributed to the aggregator on the same configurations.
First of all, it is worth noticing that in the CO configurations no less than 35k€ of benefits can be fairly
attributed to the aggregator, as quantitatively shown in Table 3. This means that the aggregator is a strong
enabler for cost reduction and thus its corresponding fair reward is relatively high. In fact, as shown in Fig. 3,
costs reduce by about 100k€ and 227k€ with respect to the ANC and NC cases, respectively. However, the
specific retribution of the aggregator slightly change depending on the reward distribution scheme. The
Nucleolus approach is the least profitable for the aggregator, as it is about 15-33% lower than any other
tested reward distribution mechanism. The aggregator reward with ShC and ShNuc cases tend to be slighlty
higher than the Shapley value, contrarily to VarC and VarNuc; however, differences are always within 10%.
28
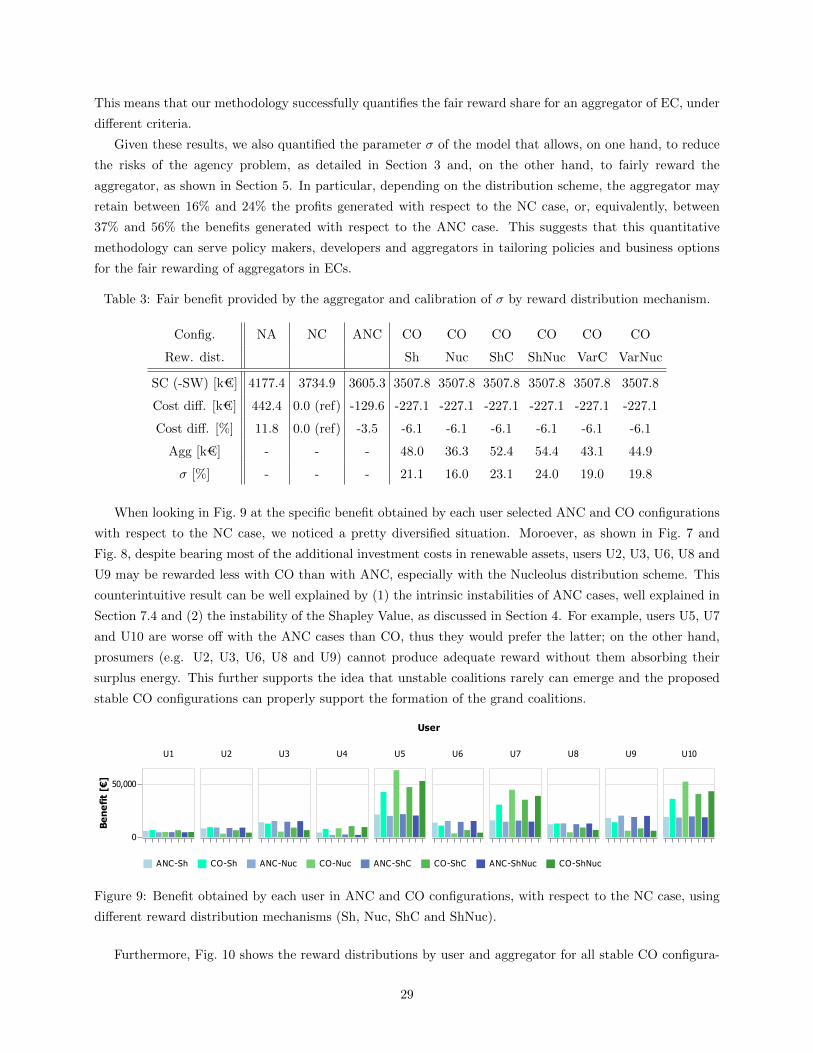
This means that our methodology successfully quantifies the fair reward share for an aggregator of EC, under
different criteria.
Given these results, we also quantified the parameter σ of the model that allows, on one hand, to reduce
the risks of the agency problem, as detailed in Section 3 and, on the other hand, to fairly reward the
aggregator, as shown in Section 5. In particular, depending on the distribution scheme, the aggregator may
retain between 16% and 24% the profits generated with respect to the NC case, or, equivalently, between
37% and 56% the benefits generated with respect to the ANC case. This suggests that this quantitative
methodology can serve policy makers, developers and aggregators in tailoring policies and business options
for the fair rewarding of aggregators in ECs.
Table 3: Fair benefit provided by the aggregator and calibration of σ by reward distribution mechanism.
Config. NA NC ANC CO CO CO CO CO CO
Rew. dist. Sh Nuc ShC ShNuc VarC VarNuc
SC (-SW) [k€] 4177.4 3734.9 3605.3 3507.8 3507.8 3507.8 3507.8 3507.8 3507.8
Cost diff. [k€] 442.4 0.0 (ref) -129.6 -227.1 -227.1 -227.1 -227.1 -227.1 -227.1
Cost diff. [%] 11.8 0.0 (ref) -3.5 -6.1 -6.1 -6.1 -6.1 -6.1 -6.1
Agg [k€] - - - 48.0 36.3 52.4 54.4 43.1 44.9
σ [%] - - - 21.1 16.0 23.1 24.0 19.0 19.8
When looking in Fig. 9 at the specific benefit obtained by each user selected ANC and CO configurations
with respect to the NC case, we noticed a pretty diversified situation. Moroever, as shown in Fig. 7 and
Fig. 8, despite bearing most of the additional investment costs in renewable assets, users U2, U3, U6, U8 and
U9 may be rewarded less with CO than with ANC, especially with the Nucleolus distribution scheme. This
counterintuitive result can be well explained by (1) the intrinsic instabilities of ANC cases, well explained in
Section 7.4 and (2) the instability of the Shapley Value, as discussed in Section 4. For example, users U5, U7
and U10 are worse off with the ANC cases than CO, thus they would prefer the latter; on the other hand,
prosumers (e.g. U2, U3, U6, U8 and U9) cannot produce adequate reward without them absorbing their
surplus energy. This further supports the idea that unstable coalitions rarely can emerge and the proposed
stable CO configurations can properly support the formation of the grand coalitions.
User
0
50,000
Be
ne
fit
[€]
U1 U2 U3 U4 U5 U6 U7 U8 U9 U10
ANC-Sh CO-Sh ANC-Nuc CO-Nuc ANC-ShC CO-ShC ANC-ShNuc CO-ShNuc
Figure 9: Benefit obtained by each user in ANC and CO configurations, with respect to the NC case, using
different reward distribution mechanisms (Sh, Nuc, ShC and ShNuc).
Furthermore, Fig. 10 shows the reward distributions by user and aggregator for all stable CO configura-
29
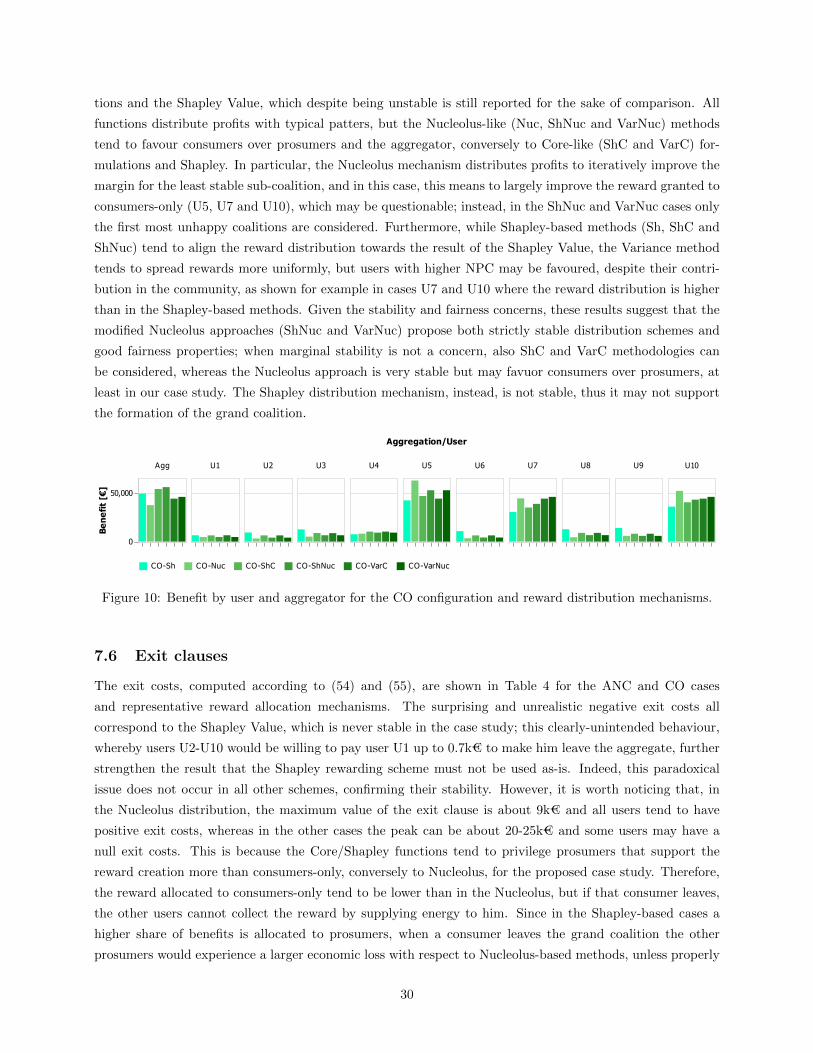
tions and the Shapley Value, which despite being unstable is still reported for the sake of comparison. All
functions distribute profits with typical patters, but the Nucleolus-like (Nuc, ShNuc and VarNuc) methods
tend to favour consumers over prosumers and the aggregator, conversely to Core-like (ShC and VarC) for-
mulations and Shapley. In particular, the Nucleolus mechanism distributes profits to iteratively improve the
margin for the least stable sub-coalition, and in this case, this means to largely improve the reward granted to
consumers-only (U5, U7 and U10), which may be questionable; instead, in the ShNuc and VarNuc cases only
the first most unhappy coalitions are considered. Furthermore, while Shapley-based methods (Sh, ShC and
ShNuc) tend to align the reward distribution towards the result of the Shapley Value, the Variance method
tends to spread rewards more uniformly, but users with higher NPC may be favoured, despite their contri-
bution in the community, as shown for example in cases U7 and U10 where the reward distribution is higher
than in the Shapley-based methods. Given the stability and fairness concerns, these results suggest that the
modified Nucleolus approaches (ShNuc and VarNuc) propose both strictly stable distribution schemes and
good fairness properties; when marginal stability is not a concern, also ShC and VarC methodologies can
be considered, whereas the Nucleolus approach is very stable but may favuor consumers over prosumers, at
least in our case study. The Shapley distribution mechanism, instead, is not stable, thus it may not support
the formation of the grand coalition.
Aggregation/User
0
50,000
Be
ne
fit
[€]
Agg U1 U2 U3 U4 U5 U6 U7 U8 U9 U10
CO-Sh CO-Nuc CO-ShC CO-ShNuc CO-VarC CO-VarNuc
Figure 10: Benefit by user and aggregator for the CO configuration and reward distribution mechanisms.
7.6 Exit clauses
The exit costs, computed according to (54) and (55), are shown in Table 4 for the ANC and CO cases
and representative reward allocation mechanisms. The surprising and unrealistic negative exit costs all
correspond to the Shapley Value, which is never stable in the case study; this clearly-unintended behaviour,
whereby users U2-U10 would be willing to pay user U1 up to 0.7k€ to make him leave the aggregate, further
strengthen the result that the Shapley rewarding scheme must not be used as-is. Indeed, this paradoxical
issue does not occur in all other schemes, confirming their stability. However, it is worth noticing that, in
the Nucleolus distribution, the maximum value of the exit clause is about 9k€ and all users tend to have
positive exit costs, whereas in the other cases the peak can be about 20-25k€ and some users may have a
null exit costs. This is because the Core/Shapley functions tend to privilege prosumers that support the
reward creation more than consumers-only, conversely to Nucleolus, for the proposed case study. Therefore,
the reward allocated to consumers-only tend to be lower than in the Nucleolus, but if that consumer leaves,
the other users cannot collect the reward by supplying energy to him. Since in the Shapley-based cases a
higher share of benefits is allocated to prosumers, when a consumer leaves the grand coalition the other
prosumers would experience a larger economic loss with respect to Nucleolus-based methods, unless properly
30
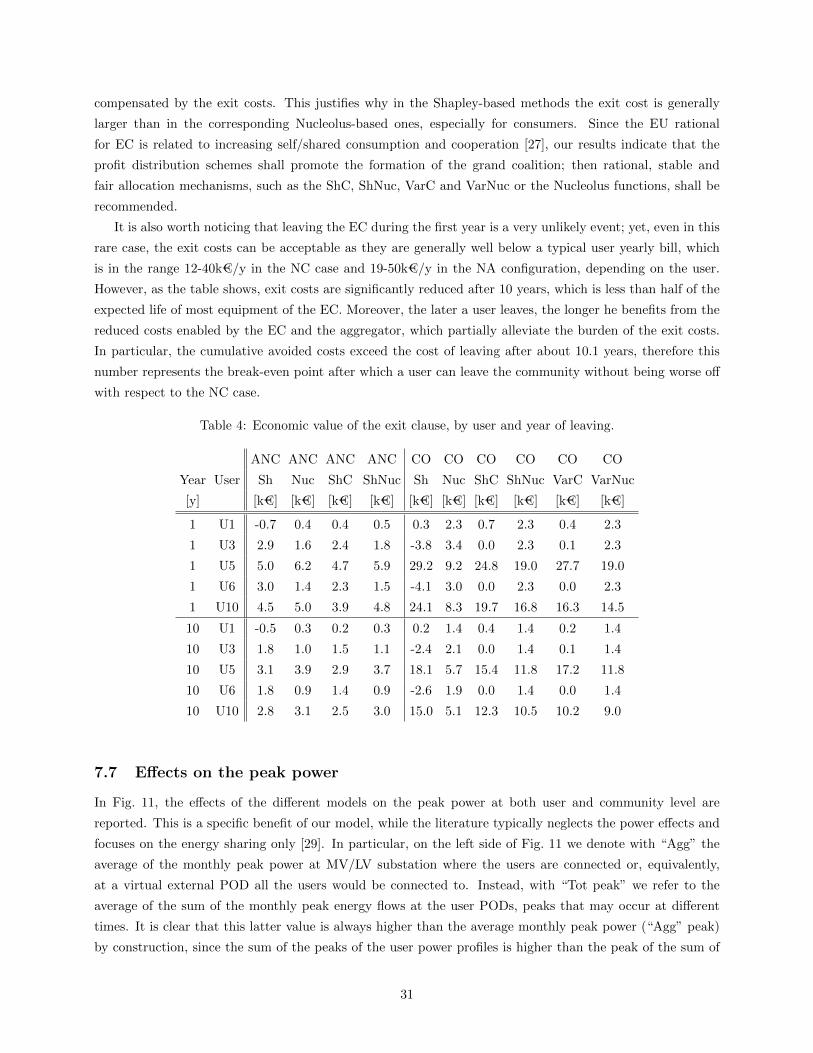
compensated by the exit costs. This justifies why in the Shapley-based methods the exit cost is generally
larger than in the corresponding Nucleolus-based ones, especially for consumers. Since the EU rational
for EC is related to increasing self/shared consumption and cooperation [27], our results indicate that the
profit distribution schemes shall promote the formation of the grand coalition; then rational, stable and
fair allocation mechanisms, such as the ShC, ShNuc, VarC and VarNuc or the Nucleolus functions, shall be
recommended.
It is also worth noticing that leaving the EC during the first year is a very unlikely event; yet, even in this
rare case, the exit costs can be acceptable as they are generally well below a typical user yearly bill, which
is in the range 12-40k€/y in the NC case and 19-50k€/y in the NA configuration, depending on the user.
However, as the table shows, exit costs are significantly reduced after 10 years, which is less than half of the
expected life of most equipment of the EC. Moreover, the later a user leaves, the longer he benefits from the
reduced costs enabled by the EC and the aggregator, which partially alleviate the burden of the exit costs.
In particular, the cumulative avoided costs exceed the cost of leaving after about 10.1 years, therefore this
number represents the break-even point after which a user can leave the community without being worse off
with respect to the NC case.
Table 4: Economic value of the exit clause, by user and year of leaving.
ANC ANC ANC ANC CO CO CO CO CO CO
Year User Sh Nuc ShC ShNuc Sh Nuc ShC ShNuc VarC VarNuc
[y] [k€] [k€] [k€] [k€] [k€] [k€] [k€] [k€] [k€] [k€]
1 U1 -0.7 0.4 0.4 0.5 0.3 2.3 0.7 2.3 0.4 2.3
1 U3 2.9 1.6 2.4 1.8 -3.8 3.4 0.0 2.3 0.1 2.3
1 U5 5.0 6.2 4.7 5.9 29.2 9.2 24.8 19.0 27.7 19.0
1 U6 3.0 1.4 2.3 1.5 -4.1 3.0 0.0 2.3 0.0 2.3
1 U10 4.5 5.0 3.9 4.8 24.1 8.3 19.7 16.8 16.3 14.5
10 U1 -0.5 0.3 0.2 0.3 0.2 1.4 0.4 1.4 0.2 1.4
10 U3 1.8 1.0 1.5 1.1 -2.4 2.1 0.0 1.4 0.1 1.4
10 U5 3.1 3.9 2.9 3.7 18.1 5.7 15.4 11.8 17.2 11.8
10 U6 1.8 0.9 1.4 0.9 -2.6 1.9 0.0 1.4 0.0 1.4
10 U10 2.8 3.1 2.5 3.0 15.0 5.1 12.3 10.5 10.2 9.0
7.7 Effects on the peak power
In Fig. 11, the effects of the different models on the peak power at both user and community level are
reported. This is a specific benefit of our model, while the literature typically neglects the power effects and
focuses on the energy sharing only [29]. In particular, on the left side of Fig. 11 we denote with “Agg” the
average of the monthly peak power at MV/LV substation where the users are connected or, equivalently,
at a virtual external POD all the users would be connected to. Instead, with “Tot peak” we refer to the
average of the sum of the monthly peak energy flows at the user PODs, peaks that may occur at different
times. It is clear that this latter value is always higher than the average monthly peak power (“Agg” peak)
by construction, since the sum of the peaks of the user power profiles is higher than the peak of the sum of
31
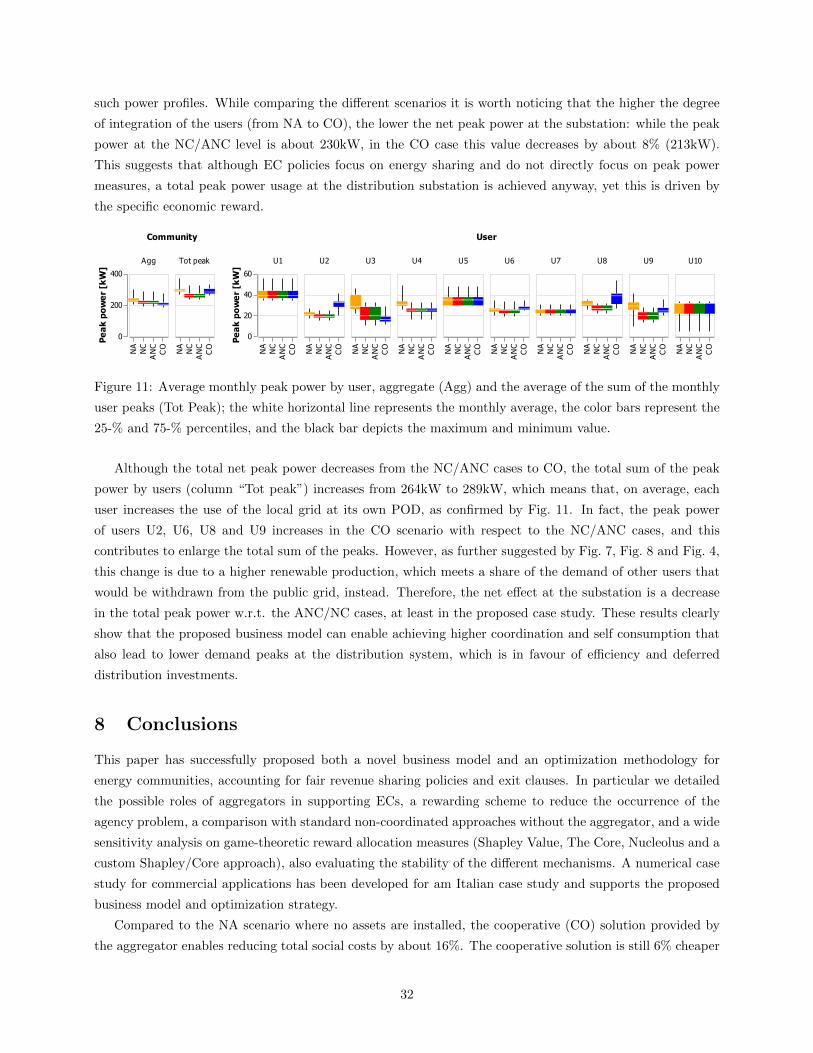
such power profiles. While comparing the different scenarios it is worth noticing that the higher the degree
of integration of the users (from NA to CO), the lower the net peak power at the substation: while the peak
power at the NC/ANC level is about 230kW, in the CO case this value decreases by about 8% (213kW).
This suggests that although EC policies focus on energy sharing and do not directly focus on peak power
measures, a total peak power usage at the distribution substation is achieved anyway, yet this is driven by
the specific economic reward.
Community
0
200
400
Pe
ak
po
we
r [k
W]
Agg Tot peak
NA
NC
AN
CC
O NA
NC
AN
CC
O
User
0
20
40
60
Pe
ak
po
we
r [k
W]
U1 U2 U3 U4 U5 U6 U7 U8 U9 U10N
AN
CA
NC
CO NA
NC
AN
CC
O NA
NC
AN
CC
O NA
NC
AN
CC
O NA
NC
AN
CC
O NA
NC
AN
CC
O NA
NC
AN
CC
O NA
NC
AN
CC
O NA
NC
AN
CC
O NA
NC
AN
CC
O
Figure 11: Average monthly peak power by user, aggregate (Agg) and the average of the sum of the monthly
user peaks (Tot Peak); the white horizontal line represents the monthly average, the color bars represent the
25-% and 75-% percentiles, and the black bar depicts the maximum and minimum value.
Although the total net peak power decreases from the NC/ANC cases to CO, the total sum of the peak
power by users (column “Tot peak”) increases from 264kW to 289kW, which means that, on average, each
user increases the use of the local grid at its own POD, as confirmed by Fig. 11. In fact, the peak power
of users U2, U6, U8 and U9 increases in the CO scenario with respect to the NC/ANC cases, and this
contributes to enlarge the total sum of the peaks. However, as further suggested by Fig. 7, Fig. 8 and Fig. 4,
this change is due to a higher renewable production, which meets a share of the demand of other users that
would be withdrawn from the public grid, instead. Therefore, the net effect at the substation is a decrease
in the total peak power w.r.t. the ANC/NC cases, at least in the proposed case study. These results clearly
show that the proposed business model can enable achieving higher coordination and self consumption that
also lead to lower demand peaks at the distribution system, which is in favour of efficiency and deferred
distribution investments.
8 Conclusions
This paper has successfully proposed both a novel business model and an optimization methodology for
energy communities, accounting for fair revenue sharing policies and exit clauses. In particular we detailed
the possible roles of aggregators in supporting ECs, a rewarding scheme to reduce the occurrence of the
agency problem, a comparison with standard non-coordinated approaches without the aggregator, and a wide
sensitivity analysis on game-theoretic reward allocation measures (Shapley Value, The Core, Nucleolus and a
custom Shapley/Core approach), also evaluating the stability of the different mechanisms. A numerical case
study for commercial applications has been developed for am Italian case study and supports the proposed
business model and optimization strategy.
Compared to the NA scenario where no assets are installed, the cooperative (CO) solution provided by
the aggregator enables reducing total social costs by about 16%. The cooperative solution is still 6% cheaper
32
than the NC case where each user installs assets on his own. All this suggests that the aggregator supports
value creation in ECs and for this reason it is recommended enabling aggregators to operate ECs, with a fair
remuneration.
A sensitivity on the fair game-theoretic reward distribution schemes proves that Shapley value is not
generally stable, conversely to Nucleolus function and to the proposed Shapley/Core, Shapley/Nucleolus,
MinVariance/Core and Min/Variance Nucleolus. Results suggest that Nucleolus distribution scheme fosters
stability by progressively maximizing the benefit of the most unhappy coalition, but tends to privilege passive
members that do not install any assets. Conversely, Shapley Value, despite not being stable, distributes
profits more evenly depending on each user contribution, thus privileging prosumers more than the Nucleolus.
Instead, the proposed Shapley/Core and Shapley/Nucleolus successfully find a balance between these two
positions, thus enabling strong stability and fairness. The MinVariance-based mechanisms behave similarly
to the Shapley-based ones, yet the latter appeared to be slightly more fair.
Moreover, our results highlight that the fair remuneration of an aggregator can be about 16-23% the
savings generated with respect to the base case (NC). This value is regarded as a reasonable amount, also
considering that users are awarded with the majority of the surplus, which is in the range 77-84%, depending
on the rewarding scheme. In particular, the Nucleolus is the least convenient for the aggregator, as it tends
to favour consumers, whereas the proposed Shapley/Core is more rewarding for the aggregator. This result
and the proposed methodology lay the foundation for fair rewarding schemes for aggregators of ECs and can
support the activity of policy makers and business developers.
Furthermore, we also pointed out that the proposed business model and the aggregator can promote
social, technical and environmental benefits, aligned to the EU policies: improved renewable penetration,
from 35% (NC case) up to 52.5% (CO case), and improved self-consumption, from 28/34% (NC/ANC cases)
to 46% (CO case), among others. Interestingly, despite no direct economic benefit for the EC, we highlighted
that the coordination promoted by an aggregator enables reducing also the peak power at the distribution
substation (about -8% with respect to the NC/ANC cases).
These results confirm the positive effects enabled by ECs operated by aggregators, thus suggesting their
important role and value for the development of EC policies and business applications. We also highlighted
that the current EC framework can promote increased renewable penetration, but incentives may create
distortions. In fact, while the coordinated solution leads to improved environmental, economic and social
benefits, the users reap undeserved benefits also in non-coordinated solutions, such as in the ANC case. This
study, revealing and quantifying this unintended effect, lays the foundation to research studies to tackle this
issue.
All in all, we believe that our methodology can support policy makers and researchers in developing policy
and technical recommendations for the development and tailoring of new measures and projects; furthermore,
the proposed business model can also guide the development of commercial solutions.
Acknowledgments
Work carried out in the framework of the project ”AUTENS” (Sustainable Energy Autarky), funded by the
University of Pisa (PRA 2020 program).
33
References
[1] Ibrahim Abada, Andreas Ehrenmann, and Xavier Lambin. On the viability of energy communities.
Energy Journal, 2020.
[2] Ibrahim Abada, Andreas Ehrenmann, and Xavier Lambin. Unintended consequences: The snowball
effect of energy communities. Energy Policy, 143(March):111597, 2020.
[3] Uzma Amin, Jahangir Hossain, Wayes Tushar, and Khizir Mahmud. Energy Trading in Local Elec-
tricity Markets with Renewables- A Contract Theoretic Approach. IEEE Transactions on Industrial
Informatics, 17(6):1–1, 2020.
[4] ARERA. Obiettivi Strategici e linee di intervento 2019-2021: Area Energia.
[5] Edward Barbour, David Parra, Zeyad Awwad, and Marta C. Gonzalez. Community energy storage: A
smart choice for the smart grid? Applied Energy, 2018.
[6] Gerald W. Braun. State policies for collaborative local renewable integration. Electricity Journal,
33(1):106691, 2020.
[7] Vasco Brummer. Community energy – benefits and barriers: A comparative literature review of Com-
munity Energy in the UK, Germany and the USA, the benefits it provides for society and the barriers
it faces. Renewable and Sustainable Energy Reviews, 94(June):187–196, 2018.
[8] Scott Burger, Jose Pablo Chaves-Avila, Carlos Batlle, and Ignacio J Perez-Arriaga. A review of the value
of aggregators in electricity systems. Renewable and Sustainable Energy Reviews, 77:395–405, 2017.
[9] Pedro Calleja and Francesc Llerena. Consistency, weak fairness, and the Shapley value. Mathematical
Social Sciences, 105:28–33, 2020.
[10] Aura Caramizaru and Andreas Uihlein. Energy communities : an overview of energy and social innova-
tion. Technical report, JRC, 2019.
[11] Pratyush Chakraborty, Enrique Baeyens, Kameshwar Poolla, Pramod P. Khargonekar, and Pravin
Varaiya. Sharing Storage in a Smart Grid: A Coalitional Game Approach. IEEE Transactions on
Smart Grid, 10(4):4379–4390, 2019.
[12] Georgios Chalkiadakis, Edith Elkind, and Michael Wooldridge. Cooperative game theory: Basic concepts
and computational challenges. IEEE Intelligent Systems, 27(3):86–90, 2012.
[13] Bo Chen, Jianhui Wang, Xiaonan Lu, Chen Chen, and Shijia Zhao. Networked Microgrids for Grid
Resilience, Robustness, and Efficiency: A Review. IEEE Transactions on Smart Grid, 12(1):18–32,
2021.
[14] Adriana Chis and Visa Koivunen. Coalitional game-based cost optimization of energy portfolio in smart
grid communities. IEEE Transactions on Smart Grid, 2019.
[15] Bertrand Cornelusse, Iacopo Savelli, Simone Paoletti, Antonio Giannitrapani, and Antonio Vicino. A
community microgrid architecture with an internal local market. Applied Energy, 242(April):547–560,
2019.
34
[16] Pablo Cortes, Paloma Auladell-Leon, Jesus Munuzuri, and Luis Onieva. Near-optimal operation of the
distributed energy resources in a smart microgrid district. Journal of Cleaner Production, 252:119772,
2020.
[17] Saeed Rahmani Dabbagh and Mohammad Kazem Sheikh-El-Eslami. Risk-based profit allocation to
DERs integrated with a virtual power plant using cooperative Game theory. Electric Power Systems
Research, 121:368–378, 2015.
[18] Yan Du, Zhiwei Wang, Guangyi Liu, Xi Chen, Haoyu Yuan, Yanli Wei, and Fangxing Li. A cooperative
game approach for coordinating multi-microgrid operation within distribution systems. Applied Energy,
222(December 2017):383–395, 2018.
[19] R. Giglioli and D. Poli. Small-scale biomass-fired cogeneration, pellet production or district heating: New
criteria for selecting the most profitable solution. International Review on Modelling and Simulations,
6(3), 2013.
[20] M. Giuntoli and D. Poli. Optimized Thermal and Electrical Scheduling of a Large Scale Virtual Power
Plant in the Presence of Energy Storages. IEEE Trans. Smart Grid, 4(2):942 – 955, 2013.
[21] Vladimir Z. Gjorgievski, Snezana Cundeva, and George E. Georghiou. Social arrangements, technical
designs and impacts of energy communities: A review. Renewable Energy, 169:1138–1156, 2021.
[22] Liyang Han, Thomas Morstyn, and Malcolm McCulloch. Incentivizing Prosumer Coalitions With Energy
Management Using Cooperative Game Theory. IEEE Transactions on Power Systems, 34(1):303–313,
2019.
[23] Christina E. Hoicka and Julie L. MacArthur. From tip to toes: Mapping community energy models in
Canada and New Zealand. Energy Policy, 121(June):162–174, 2018.
[24] Binod Prasad Koirala, Elta Koliou, Jonas Friege, Rudi A. Hakvoort, and Paulien M. Herder. Energetic
communities for community energy: A review of key issues and trends shaping integrated community
energy systems. Renewable and Sustainable Energy Reviews, 56:722–744, 2016.
[25] Despina Koraki and Kai Strunz. Wind and solar power integration in electricity markets and distribution
networks through service-centric virtual power plants. IEEE Transactions on Power Systems, 33(1):473–
485, 2018.
[26] Junkai Liang, Ashwin Shirsat, and Wenyuan Tang. Sustainable community based PV-storage planning
using the Nash bargaining solution. International Journal of Electrical Power and Energy Systems,
118(November 2019):105759, 2020.
[27] J. Lowitzsch, C. E. Hoicka, and F. J. van Tulder. Renewable energy communities under the 2019
European Clean Energy Package – Governance model for the energy clusters of the future? Renewable
and Sustainable Energy Reviews, 122:109489, apr 2020.
[28] Tomasz P. Michalak, Karthik V. Aadithya, Piotr L. Szczepanski, Balaraman Ravindran, and Nicholas R.
Jennings. Efficient computation of the shapley value for game-theoretic network centrality. Journal of
Artificial Intelligence Research, 46:607–650, 2013.
35
[29] Matteo Moncecchi, Stefano Meneghello, and Marco Merlo. A game theoretic approach for energy sharing
in the italian renewable energy communities. Applied Sciences (Switzerland), 10(22):1–25, 2020.
[30] Mahdi Motalleb and Reza Ghorbani. Non-cooperative game-theoretic model of demand response aggre-
gator competition for selling stored energy in storage devices. Applied Energy, 202:581–596, 2017.
[31] Noemı Navarro and Andres Perea. A simple bargaining procedure for the myerson value. B.E. Journal
of Theoretical Economics, 2013.
[32] H T Nguyen and L B Le. Sharing Profit from Joint Offering of a Group of Wind Power Producers in
Day Ahead Markets. IEEE Transactions on Sustainable Energy, 9(4):1921–1934, 2018.
[33] Hung Khanh Nguyen, Hamed Mohsenian-Rad, Amin Khodaei, and Zhu Han. Decentralized Reactive
Power Compensation Using Nash Bargaining Solution. IEEE Transactions on Smart Grid, 8(4):1679–
1688, 2017.
[34] C. Nolden, J. Barnes, and J. Nicholls. Community energy business model evolution: A review of
solar photovoltaic developments in England. Renewable and Sustainable Energy Reviews, 122(May
2019):109722, 2020.
[35] Gearoid O’Brien, Abbas El Gamal, and Ram Rajagopal. Shapley Value Estimation for Compensation of
Participants in Demand Response Programs. IEEE Transactions on Smart Grid, 6(6):2837–2844, 2015.
[36] Guillermo Owen. On the core of linear production games. Mathematical Programming, 9(1):358–370,
1975.
[37] A. T.D. Perera, Z. Wang, Vahid M. Nik, and Jean Louis Scartezzini. Towards realization of an En-
ergy Internet: Designing distributed energy systems using game-theoretic approach. Applied Energy,
283(November 2020):116349, 2021.
[38] Stefan Pfenninger and Iain Staffell. Long-term patterns of European PV output using 30 years of
validated hourly reanalysis and satellite data. Energy, 114:1251–1265, 2016.
[39] Kris Poncelet, Hanspeter Hoschle, Erik Delarue, Ana Virag, and William Drhaeseleer. Selecting represen-
tative days for capturing the implications of integrating intermittent renewables in generation expansion
planning problems. IEEE Transactions on Power Systems, 32(3):1936–1948, 2017.
[40] Matthew Rabin. Incorporating fairness into game theory and economics. In Advances in Behavioral
Economics. 2011.
[41] M Rayati, M Bozorg, and R Cherkaoui. Coordinating strategic aggregators in an active distribution
network for providing operational flexibility. Electric Power Systems Research, 189, 2020.
[42] David Schmeidler. The Nucleolus of a Characteristic Function Game. SIAM J. on Applied Mathematics,
1969.
[43] Lloyd S. Shapley. The value of an n-Person Game, 1953.
[44] Chester S. Spatt. Conflicts of Interest in Asset Management and Advising, 2020.
36
[45] Jan Stede, Karin Arnold, Christa Dufter, Georg Holtz, Serafin von Roon, and Jorn C Richstein. The
role of aggregators in facilitating industrial demand response: Evidence from Germany. Energy Policy,
147:111893, 2020.
[46] Jeongmeen Suh and Sung-Guk Yoon. Profit-Sharing Rule for Networked Microgrids Based on Myerson
Value in Cooperative Game. IEEE Access, 9:5585–5597, 2020.
[47] M A Tajeddini, H Kebriaei, and L Glielmo. Decentralized Hierarchical Planning of PEVs Based on
Mean-Field Reverse Stackelberg Game. IEEE Transactions on Automation Science and Engineering,
17(4):2014–2024, 2020.
[48] Mao Tan, Yuqing Zhou, Ling Wang, Yongxin Su, Bin Duan, and Rui Wang. Fair-efficient energy
trading for microgrid cluster in an active distribution network. Sustainable Energy, Grids and Networks,
26:100453, 2021.
[49] Artur Trindade. Electricity Load Diagrams, 2015.
[50] Niklas Vespermann, Thomas Hamacher, and Jalal Kazempour. Access Economy for Storage in Energy
Communities. IEEE Transactions on Power Systems, 8950(c):1–1, 2020.
[51] Hao Wang and Jianwei Huang. Cooperative Planning of Renewable Generations for Interconnected
Microgrids. IEEE Transactions on Smart Grid, 7(5):2486–2496, 2016.
[52] Lu Wang, Wei Gu, Zhi Wu, Haifeng Qiu, and Guangsheng Pan. Non-cooperative game-based multilateral
contract transactions in power-heating integrated systems. Applied Energy, 268(October 2019):114930,
2020.
[53] Yahui Wang, Xiaorui Wu, Yong Li, Ruifeng Yan, Yi Tan, Xuebo Qiao, and Yijia Cao. Autonomous energy
community based on energy contract. IET Generation, Transmission and Distribution, 14(4):682–689,
2020.
[54] Juan M. Zolezzi and Hugh Rudnick. Transmission cost allocation by cooperative games and coalition
formation. IEEE Transactions on Power Systems, 17(4):1008–1015, 2002.
37