bay-delta water quality control plan update and ... · pdf filebay-delta water quality control...
TRANSCRIPT
Bay-Delta Water Quality
Control Plan Update
and Recirculated Draft Substitute
Environmental Document
November 29, December 16, 19, 20, 2016
January 3, 2017 Hearing
January 3, 2017 Staff Presentation
State Water Resources Control Board
Major Comments / Concerns
1. Carryover storage
2. Importance of June flows
3. Multiple dry years
4. More than just averages
5. Economics
6. Groundwater effects / SGMA
7. Salinity objective
8. SalSim
9. Merced River SAFE Plan
10.Tuolumne fish studies
11.Unimpaired flow (UF)
and block of water
12.Flow Recommendations
13.Predation
14.Disadvantaged
Communities
2

1. Carryover Storage
Carryover requirements are part of the project:
“When implementing the LSJR flow objectives, the
State Water Board will include minimum reservoir
carryover storage targets or other requirements to
help ensure that providing flows to meet the flow
objectives will not have adverse temperature or
other impacts on fish and wildlife or, if feasible, on
other beneficial uses.”
(Appendix K, page 29)
3

Minimum September Carryover
Guideline (in TAF) for the
Three Tributaries
* Not analyzed in the SED because not included within the project alternatives
TAF = thousand acre-feet
4
Stanislaus Tuolumne Merced
Baseline 85 800 115
40% Flow Objective 700 800 300
40% Flow Objective
with lower carryover
(Modified 40 %)*
85 400 115

Exceedance Plot of Diversion
Delivery For the Three Tributaries
5
maf = million acre-feet

Average Annual Diversion on the
Three Tributaries by Year Type
6
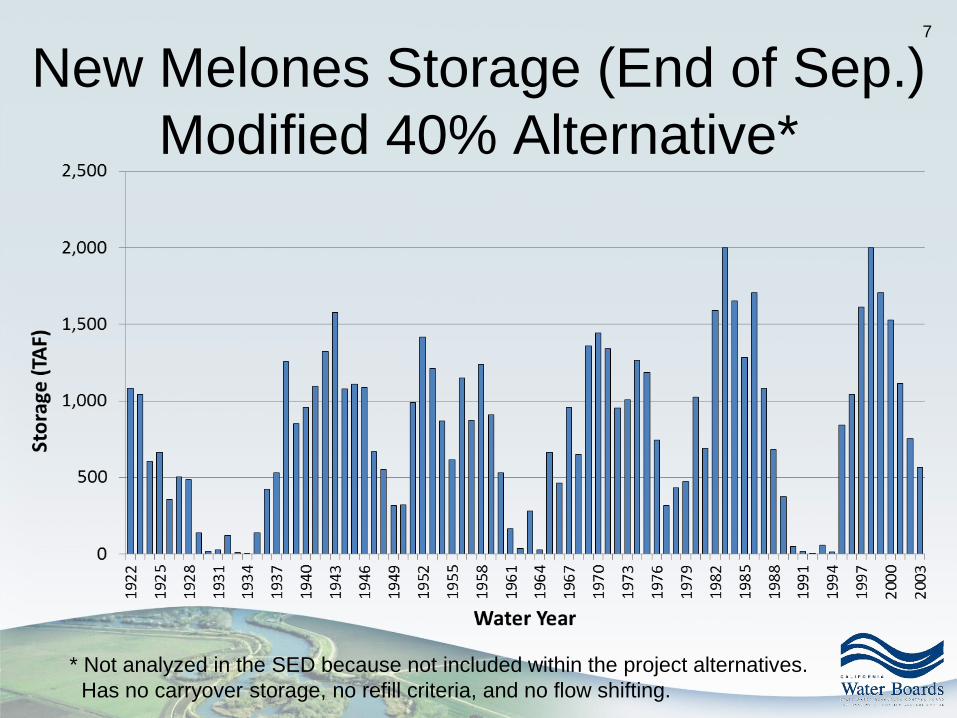
New Melones Storage (End of Sep.)
Modified 40% Alternative*
7
* Not analyzed in the SED because not included within the project alternatives.
Has no carryover storage, no refill criteria, and no flow shifting.
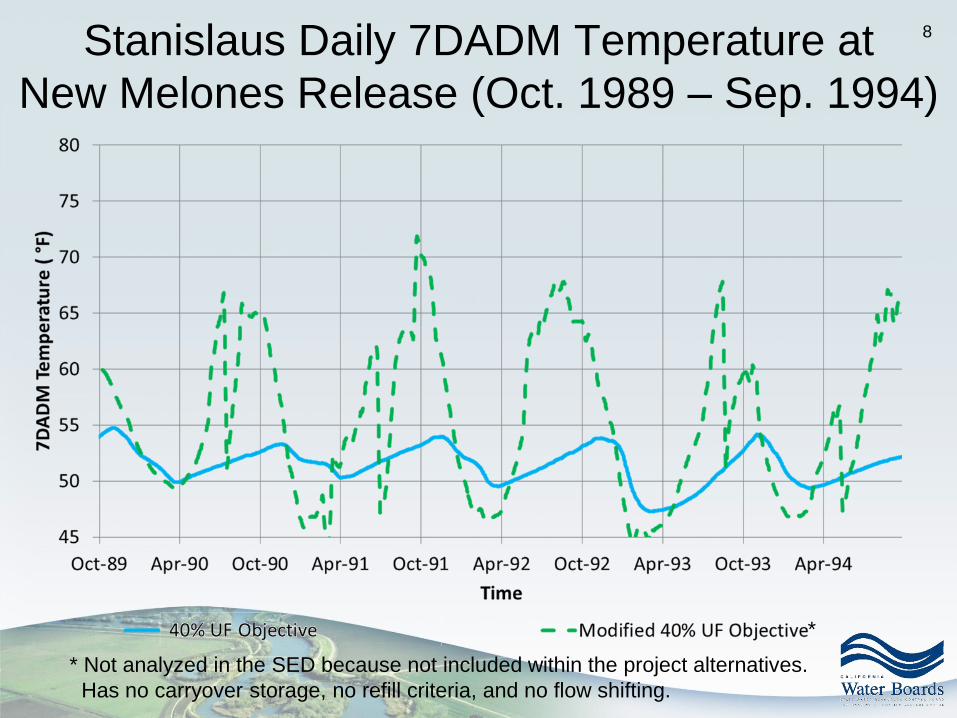
Stanislaus Daily 7DADM Temperature at
New Melones Release (Oct. 1989 – Sep. 1994)
8
* Not analyzed in the SED because not included within the project alternatives.
Has no carryover storage, no refill criteria, and no flow shifting.
*

Stanislaus River Longitudinal
Temperature Profile for October (1991)
9
* Not analyzed in the SED because not included within the project alternatives.
Has no carryover storage, no refill criteria, and no flow shifting.
*

2. Importance of June Flows
• Salmon and steelhead growth and migration period
• Spawning period for sturgeon and splittail
• Higher flows can disrupt and displace non-native
species, including predatory fish and water hyacinth
• June extends the window of opportunity available to
native fish, and allows for additional life history diversity
• Flows are important for migration through the San
Joaquin River and Delta
10
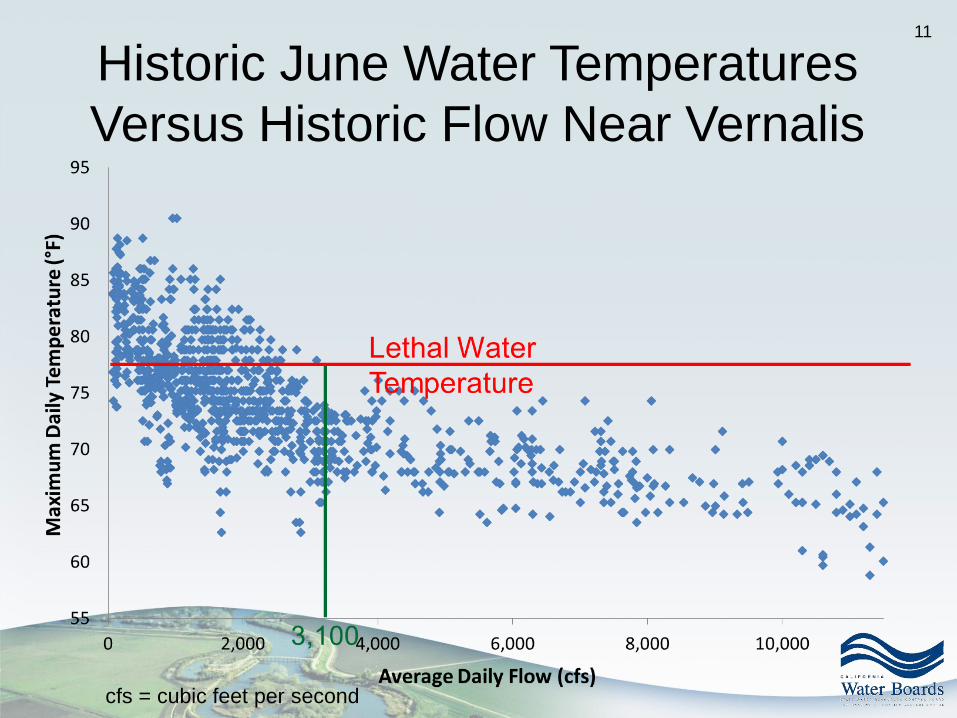
Historic June Water Temperatures
Versus Historic Flow Near Vernalis
11
cfs = cubic feet per second

3,100 cfs is achieved approximately 30% more often
under the 40% unimpaired flow alternative at Vernalis
SED Table 19-27
cfs = cubic feet per second
12

From Ford and Kirihara 2010
13Juvenile Steelhead Captured at the Oakdale
Screw Trap on the Stanislaus River (1995-2009)

Tuolumne River from Fuller et al. 2007
Figure 10. Daily estimated passage of unmarked Chinook salmon
at Grayson and river flow at Modesto (MOD) during 2006.
Chinook Salmon Passage
on Tuolumne River (2006)
14

15
Tuolumne River Median
Monthly Flow (1984-2009)

Monthly Contributions to February
through June Flow Requirement
16

June Contribution to Flow
Requirement by Year Type
17
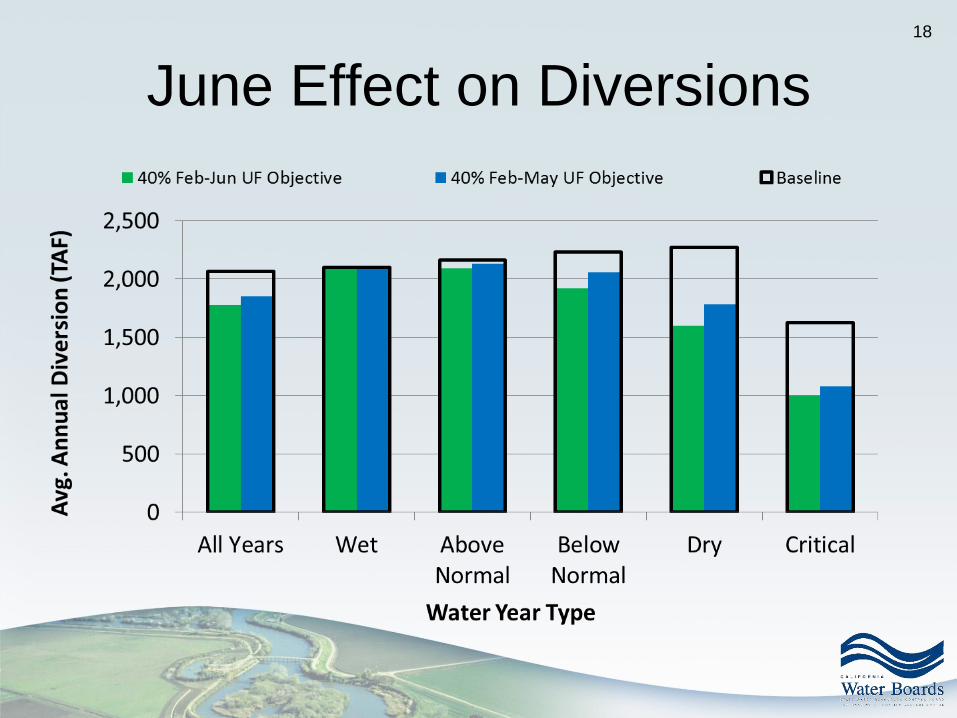
June Effect on Diversions18

3. Multiple Dry Years
• Drought years are represented by
summary statistics for critically dry and
dry years, and exceedance plots
19

Estimated Effect on Average Annual Surface
Water Diversion – Baseline and 40% Unimpaired Flow
* Based on data from WSE surface water diversions– “WSE SW
Diversions” tab in on-line spreadsheet “GW and SW use analysis
09142016
TAF = thousand acre-feet per year
20

4. SED Has More Than Averages
• The SED presents much more than simple
averages
• The SED provides summary statistics for
different year types, as well as exceedance
plots and tables for:
– River flows
– Reservoir storage
– Surface water supply reductions
– Cropping
21

Cumulative Distribution of Surface
Water Diversions (Table F.1-69)
22

Cumulative Distribution of Surface
Water Diversions (Table F.1-69) – Detail 1
23

Cumulative Distribution of Surface
Water Diversions (Table F.1-69) – Detail 2
24

Tuolumne River Diversion Exceedence
in WSE Alternatives (Figure F.1.3-4c)
25

Tuolumne River (Figure F.1.3-4)Slide 102 (December 5, 2016 Workshop)
26

5. Economics
• To illustrate Statewide Agricultural Production
Model (SWAP) results, the full range of
results (82 years) is shown using exceedance
curves for individual crops and total irrigated
acres for each irrigation district in Chapter 11
• This information is also combined for all crops
to determine effects on total economic output
27

What are the Impacts of the Flow Proposal?
Implementing the 40% flow proposal could result in:
• 14% reduction (293 TAF) in water available for surface
water diversion (7% to 23% reduction for 30% to 50%
range of unimpaired flow)
• Increase groundwater pumping by an average of 105
thousand acre-feet per year (TAF/yr)
• Increase unmet agricultural water demand by 69 TAF/yr
(2014 baseline GW pumping) to 137 TAF/yr (2009
baseline GW pumping) in the plan area
• An average annual decrease in economic output of $64
million (2.5% reduction from baseline annual average
agricultural economic sector output of $2.6 billion)
28

Example Exceedance Curve:
Irrigated Acreage in SSJID for Small Acreage
under Alternative 3 (Figure 11-11-15c)
29
SSJID = South San Joaquin Irrigation District

Figure G.5-1. Exceedance Plot of Total Economic Output Related
to Agricultural Production in the Irrigation Districts for the LSJR
Alternatives and Baseline across 82 Years of Simulation
$2.0
$2.1
$2.2
$2.3
$2.4
$2.5
$2.6
$2.7
0% 10% 20% 30% 40% 50% 60% 70% 80% 90% 100%
Tota
l An
nu
al E
con
om
ic O
up
tut
($ B
illi
on
, 20
08
)
Percent of Time Equaled or Exceeded
Baseline LSJR Alternative 2 LSJR Alternative 3 LSJR Alternative 4
30

Table G.5-5. Baseline Statistics for Total Economic Output
Related to Agricultural Production in the Irrigation Districts and
the Change in those Statistics for each of the LSJR Alternatives
Baseline
LSJR Alternative 2
(20% Unimpaired)
Difference from
Baseline
LSJR Alternative 3
(40% Unimpaired)
Difference from
Baseline
LSJR Alternative 4
(60% Unimpaired)
Difference from
Baseline
($2008
Million/yr)
($2008
Million/yr)
%
Change
($2008
Million/yr)
%
Change
($2008
Million/yr)
%
Change
Avg $2,586 -$17 -0.6% -$64 -2.5% -$206 -8.0%
Min $2,379 -$195 -8.2% -$228 -9.6% -$408 -17.1%
90th Percentile $2,555 -$64 -2.5% -$235 -9.2% -$506 -19.8%
80th Percentile $2,604 -$11 -0.4% -$158 -6.1% -$510 -19.6%
70th Percentile $2,604 $0 0.0% -$103 -3.9% -$351 -13.5%
60th Percentile $2,604 $0 0.0% -$29 -1.1% -$238 -9.1%
50th Percentile $2,604 $0 0.0% -$2 -0.1% -$179 -6.9%
40th Percentile $2,604 $0 0.0% $0 0.0% -$68 -2.6%
30th Percentile $2,604 $0 0.0% $0 0.0% -$26 -1.0%
20 Percentile $2,604 $0 0.0% $0 0.0% $0 0.0%
10th Percentile $2,604 $0 0.0% $0 0.0% $0 0.0%
Max $2,604 $0 0.0% $0 0.0% $0 0.0%
31

6. Groundwater Effects / SGMA
• Information provided by irrigation districts
used to determine groundwater pumping
• SGMA and groundwater sustainability
– Long-term response to reduced surface water
availability and changes in recharge are speculative
– Implementation of SGMA on groundwater supply
considered in cumulative impacts in general
discussion– considered in cumulative impacts
32

7. Salinity Objective
• Reasonable protection of agricultural uses
• Policy and legal reasons for reevaluation
– City of Tracy v. State Water Resources Control
Board -- municipal dischargers
33

Salt Tolerance of Crops (Hoffman
Report) – Main Conclusions• Salinity in southern Delta surface waters
appears suitable for all agricultural crops
• Salinity could be increased up to 0.9 to 1.1
deciSiemens per meter (dS/m) and be
protective of all crops normally grown in the
southern Delta (based on modeling in report
and other model studies)
– Might lead to yield loss of about 5% during low
rainfall years
34

Salinity Objective
• Board must evaluate Water Code section 13241
factors with respect to the current or any revised
objectives, and must also adopt a program of
implementation
– Past, present, and future beneficial uses of water
– Consider economics
– Water quality conditions that could reasonably be
achieved through control of all factors that affect water
quality
– Need for developing housing
– Need to develop and use recycled water
35

8. SalSim
• Board staff did not rely on SalSim for analysis of
fish benefits
• Chapter 19 Introduction to SalSim (page 19-74):
“During the exploration and use of this model State Water
Board staff discovered that the treatment of two of the most
important salmon habitat attributes related to flow in the
project area, water temperature and floodplain inundation,
are not represented by the model in a manner that is
consistent with current scientific information…
…SalSim appears to underrepresent the benefit of habitat
improvements related to floodplain and water temperature
conditions during the spring time period that result from
different flow scenarios which were evaluated for this project.”
36

Limitations of SalSim
• First 4 years are “priming years”
• Includes an ocean crash which affects adult
returns during 2005-2009
• Data used to construct the model has many
uncertainties
37

Adapted from Figure 19-14
SalSim only has 7 years that reflect comparative
production; first 4 years are “priming years”
38

Average Salmon Production Using SalSim(Total Adult Chinook Salmon Production)
Adapted from Table 19-32
39

Why is SalSim not useful for SED?
• Conditions proposed in the SED are different
than conditions used to construct SalSim
• SalSim is inaccurate with regard to temperature:
• Oversensitive relative to egg mortality during egg
incubation
• Juvenile mortality is under sensitive relative to lethal
temperatures in SalSim
• SalSim underestimates the benefits of floodplain
inundation during the spring time period
40

SED Quantified Benefits
• Temperature habitat to evaluate temperature
benefits
• Floodplain habitat to evaluate floodplain
benefits
41

9. Merced River SAFE Plan
• Limited details
• Flow element of plan is only one bar chart of
flows by year type at Shaffer Bridge
– Amount and timing of flows unclear
42

Feb-June Flow Volume Comparison for Proposed
Merced River Minimum Flow Alternatives
43

10. Tuolumne Fish Studies
• Temperature Study - Farrell et al. 2015. Thermal
Performance of Wild Juvenile Oncorhynchus mykiss in
the Lower Tuolumne River: A Case for Local Adjustment
to High River Temperature. Prepared for TID and MID,
California.
• Predation Study - FISHBIO. 2013. Predation Study
Report. Don Pedro Project. FERC No. 2299. Prepared
for TID/MID, California.
• Chinook Salmon Population Model Study - Stillwater
Sciences. 2013. Chinook Salmon Population Model
Study Report. Don Pedro Project. FERC No. 2299.
Prepared for TID and MID, California.
44

Tuolumne Fish Studies• Temperature Study
– Recommendation did not evaluate temperature effects on:
• Growth
• Disease vulnerability
• Predation vulnerability
• Behavioral responses
• Predation Study
– Did not consider effects over a full range of conditions and year types
(wet to dry years)
– Site selection was limited to specific habitat types, so should not be
basis for river wide estimates
• Salmon Population Model
– Did not account for: mortality due to high water temperatures;
increased productivity resulting from floodplain; or predator effects
45

11. Unimpaired Flow and
Block of Water• Unimpaired flow is a simple way of quantifying a
volume of water that varies seasonally and annually
• It is reflective of the frequency, timing, magnitude,
and duration of flows to which the species being
protected adapted
• If information is available to support it, flow shifting,
using a block of water, allows a limited quantity of
water to be shaped to achieve optimal functional
benefits
46

12. Flow Recommendations
• Board received many flow recommendations,
including:
– Contra Costa County Department of Conservation and
Development
– California Department of Fish and Wildlife
– California Water Impact Network and California
Sportfishing Protection Alliance
– The Bay Institute and Natural Resources Defense Council
– The American Rivers and Natural Heritage Institute
– Department of Interior based on Central Valley Project
Improvement Act Anadromous Fish Restoration Project
Report
47

48

13. Predation
• Underlying conditions favor non-native
predatory fish in San Joaquin Basin
– Less seasonality – variable conditions gone
– Temperatures more constant and warmer
– Flows more constant and lower
• Rearing and juvenile migrating salmon
exposed to poor temperature and habitat
conditions are more prone to predation
49

Predation
• The conditions that salmon use to deal with
predators are no longer available to them
– Safety in numbers -- not enough fish to satiate
predators
– Juvenile migration -- high turbidity / high velocity /
high volume pulses of water have been
dramatically reduced
50

* TID/MID Table 5.4-2 showed flows at La Grange release. We are showing flows
through the actual study reach.
Based on Table 5.4-2. Summary of fate determination for
acoustic tagged Chinook salmon in Tuolumne River.
Predation study by FISHBIO (2013)
shows very little survival at low flows
51

14. Disadvantaged Communities• Chapter 22 recognizes:
– There is a long-standing legacy issue in the San Joaquin
Valley of a lack of access to clean safe drinking water for
many disadvantaged communities
– Requiring additional instream flow to reasonably protect
fish and wildlife could exacerbate this ongoing problem
• The State Water Board is implementing programs to
help disadvantaged communities with funding,
technical assistance and also directing consolidations,
where appropriate
• Addressing serious and ongoing impacts to
disadvantaged communities is, and will be,
a crucial local issue in SGMA plans
52

Phase 1 Next Steps
• Draft SED & Plan Comments due: by 12:00 noon
on March 17, 2017
– Send comments to:
[email protected] with
“Comment Letter – 2016 Bay-Delta Plan Amendment
& SED” in the subject line.
• Anticipated Final SED & Plan Release: July 2017
• Anticipated Board meeting to adopt: Sept. 2017
53
For more information visit: http://waterboards.ca.gov/DeltaWQCP-Phase1