bd q4 fy21 presentation
TRANSCRIPT
Creating value by fulfilling our purpose
Advancing the World of Health™November 4, 2021

2
This presentation contains certain estimates and other forward-looking statements (as defined under Federal securities laws) regarding BD’s future prospects and performance, including, but not limited to,
future revenues, margins, earnings per share, leverage targets, capital deployment, and the proposed spinoff of the diabetes business, including strategies of BD and the independent company following the
proposed spinoff, the anticipated benefits of the spinoff, and the expected timing of completion of the spinoff. All such statements are based upon current expectations of BD and involve a number of business
risks and uncertainties. Actual results could vary materially from anticipated results described, implied or projected in any forward-looking statement. With respect to forward-looking statements contained
herein, a number of factors could cause actual results to vary materially. These factors include, but are not limited to, risks relating to any impact of the current disruptions in the global supply chain on our
operations, including our ability to source raw materials and components needed to manufacture our products and inflationary pressures, the impact of the COVID-19 pandemic on our business (including
decreases in the demand for our products, any disruptions to our operations and our supply chain, and factors such as vaccine utilization rates and competitive factors that could impact the demand and
pricing for our COVID-19 diagnostics testing); product efficacy or safety concerns resulting in product recalls or actions being taken with respect to our products; new or changing laws and regulations impacting
our business (including the imposition of tariffs, changes in tax laws, new environmental laws and regulations, or changes in laws impacting international trade) or changes in enforcement practices with
respect to such laws; fluctuations in costs and availability of raw materials, labor shortages or increased labor costs and BD’s ability to maintain favorable supplier arrangements and relationships; legislative or
regulatory changes to the U.S. or foreign healthcare systems, potential cuts in governmental healthcare spending (including China’s volume-based procurement tender process), or governmental or private
measures to contain healthcare costs, including changes in pricing and reimbursement policies, each of which could result in reduced demand for our products or downward pricing pressure; changes in interest
or foreign currency exchange rates; adverse changes in regional, national or foreign economic conditions, including inflation, deflation and fluctuations in interest rates, particularly in emerging markets,
including any impact on our ability to access credit markets and finance our operations; the demand for our products and services, or our suppliers' ability to provide products needed for our operations; the
adverse impact of cyber-attacks on our information systems or products; competitive factors including technological advances and new products introduced by competitors; risks related to our overall
indebtedness; interruptions in our supply chain, manufacturing or sterilization processes; pricing and market pressures; difficulties inherent in product development, delays in product introductions and
uncertainty of market acceptance of new products; adverse changes in geopolitical conditions; increases in energy costs and their effect on, among other things, the cost of producing BD’s products; the
remediation of our infusion pump business (including risks relating to our ability to obtain regulatory clearance and market acceptance of the BD Alaris™ System); our ability to achieve our projected level or mix
of product sales; our ability to successfully integrate any businesses we acquire; uncertainties of litigation and/or investigations and/or subpoenas (as described in BD’s filings with the Securities and Exchange
Commission); issuance of new or revised accounting standards; risks associated with the proposed spin-off of our Diabetes Care business, including factors that could delay, prevent or otherwise adversely affect
the completion, timing or terms of the spin-off, our ability to realize the expected benefits of the spin-off, or the qualifications of the spin-off as a tax-free transaction for U.S. federal income tax purposes, as
well as other factors discussed in BD’s filings with the Securities and Exchange Commission. There can be no assurance that BD’s spinoff will in fact be completed in the manner described or at all. In addition,
we have made certain assumptions in making these forward-looking statements, particularly regarding the COVID-19 pandemic. If any of these assumptions are incorrect, BD's actual results could differ
materially from those described in these forward-looking statements. We do not intend to update any forward-looking statements to reflect events or circumstances after the date hereof except as required by
applicable laws or regulations.
The guidance in this presentation is only effective as of the date given, November 4, 2021, and will not be updated or affirmed unless and until we publicly announce updated or affirmed guidance.
Caution Concerning Forward-Looking Statements

3
These non-GAAP financial measures are not in accordance with generally accepted accounting principles in the United States. BD management believes that the
use of non-GAAP measures to adjust for items that are considered by management to be outside of BD’s underlying operational results or that affect period to
period comparability helps investors to gain a better understanding of our performance year-over-year, to analyze underlying trends in our businesses, to analyze
our base operating results, and understand future prospects. Management uses these non-GAAP financial measures to measure and forecast the company’s
performance, especially when comparing such results to previous periods or forecasts. We believe presenting such adjusted metrics provides investors with greater
transparency to the information used by BD management for its operational decision-making and for comparison for other companies within the medical
technology industry. Although BD’s management believes non-GAAP results are useful in evaluating the performance of its business, its reliance on these
measures is limited since items excluded from such measures may have a material impact on BD’s net income, earnings per share or cash flows calculated in
accordance with GAAP. Therefore, management typically uses non-GAAP results in conjunction with GAAP results to address these limitations. BD strongly
encourages investors to review its consolidated financial statements and publicly filed reports in their entirety and cautions investors that the non-GAAP measures
used by BD may differ from similar measures used by other companies, even when similar terms are used to identify such measures. Non-GAAP measures should
not be considered replacements for, and should be read together with, the most comparable GAAP financial measures.
Reconciliations of these and other non-GAAP measures to the comparable GAAP measures are included in the financial tables at the end of this presentation.
Within these financial tables, certain columns and rows may not add due to the use of rounded numbers. Percentages and earnings per share amounts presented
are calculated from the underlying amounts. Current, prior-quarter and prior-year adjusted diluted earnings per share results exclude, among other things, the
impact of purchase accounting adjustments, integration and restructuring costs, spin-off related charges, certain transaction gains, certain legal defense and
product remediation costs, certain regulatory costs, certain investment gains and asset impairments and the impact of the extinguishment of debt.
We also provide these measures, as well as revenues, on a currency-neutral basis after eliminating the effect of foreign currency translation, where applicable. We
calculate foreign currency-neutral percentages by converting our current-period local currency financial results using the prior period foreign currency exchange
rates and comparing these adjusted amounts to our current-period results. Reconciliations of these amounts to the most directly comparable GAAP measures are
included in the financial tables at the end of this presentation and in our November 4, 2021, earnings press release.
Caution Concerning Non-GAAP Financial Measures

BD is an innovative medtech leader with global reach and scale addressing healthcare’s most pressing challenges
4
54%
United States
22%
EuropeChina
7%
18%
Rest of World
FY21 Revenues by region
46% International Revenue14% Emerging Markets
FY21 Revenues by segment
$20.2billion
MDS20%
MMS12%
PS9%DC
6%
IDS26%
BDB6%
PI9%
UCC6%
SURG6%
#1 in nearly all major served categories
Note: BD financial information presented is for fiscal 2021. Share information and rank based on internal estimates and publicly available information.
29,000 +active patents
$1B +annual R&D spending
190 +countries served
70,000 +BD associates
45B +devices made annually
Percentages may not add due to rounding

BD is helping reinvent healthcare, driven by our purpose of advancing the world of healthTM to improve diagnosis, medication delivery and treatment
5
Discovery and diagnosis Medication delivery Interventional treatment
Tom Polen
Chairman, CEO, and President
Executive overview

Strong base business momentum
7
Revenue
$20.2B+15.6% FXN growth
Base business(1) +8.1% FXN growth
Covid Dx revenue of ~$2B
Adjusted EPS
$13.08+28.2% growth
Operating cash flow
$4.6BUp over $1.1B vs. prior year
Full-year revenues, adjusted EPS and cash flows ahead of our expectations
(1) See Basis of Presentation on slide 29. Please see Appendix for non-GAAP reconciliations
✓ Base business momentum drove outperformance versus initial expectations
✓ Proud of our impact helping the world diagnose, treat and prevent COVID-19

Our strategy expands our leadership position in our core, while purposefully shifting into higher-growth spaces transforming the future of healthcare
8
Smart connected care New care settings Chronic disease outcomes
AI, informatics, and robotics will transform healthcare processes, tools and treatments
Shift into new settingscreates major
opportunities to improve patient
outcomes and costs
Medical technology will have a growing role in
improving outcomes in chronic diseases
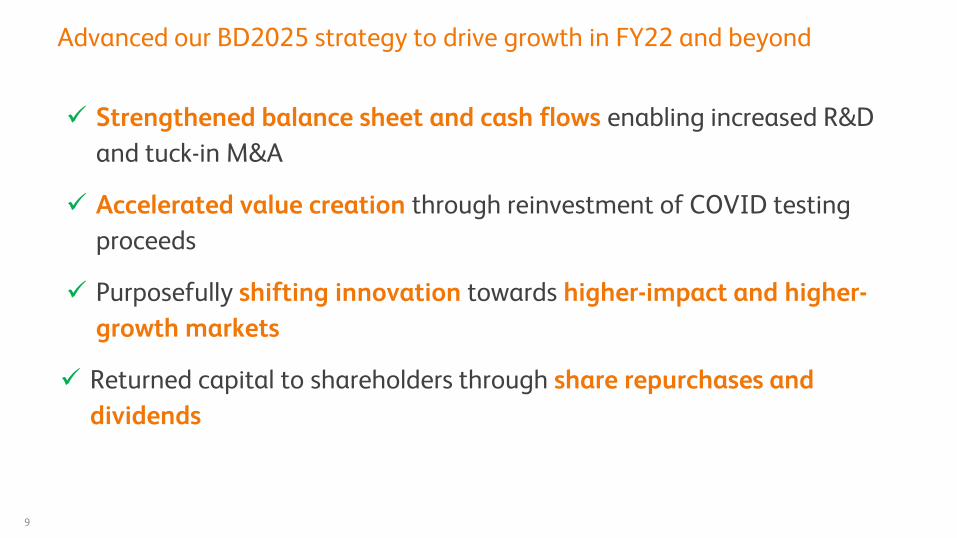
✓ Strengthened balance sheet and cash flows enabling increased R&D
and tuck-in M&A
✓ Accelerated value creation through reinvestment of COVID testing
proceeds
✓ Purposefully shifting innovation towards higher-impact and higher-
growth markets
✓ Returned capital to shareholders through share repurchases and
dividends
Advanced our BD2025 strategy to drive growth in FY22 and beyond
9
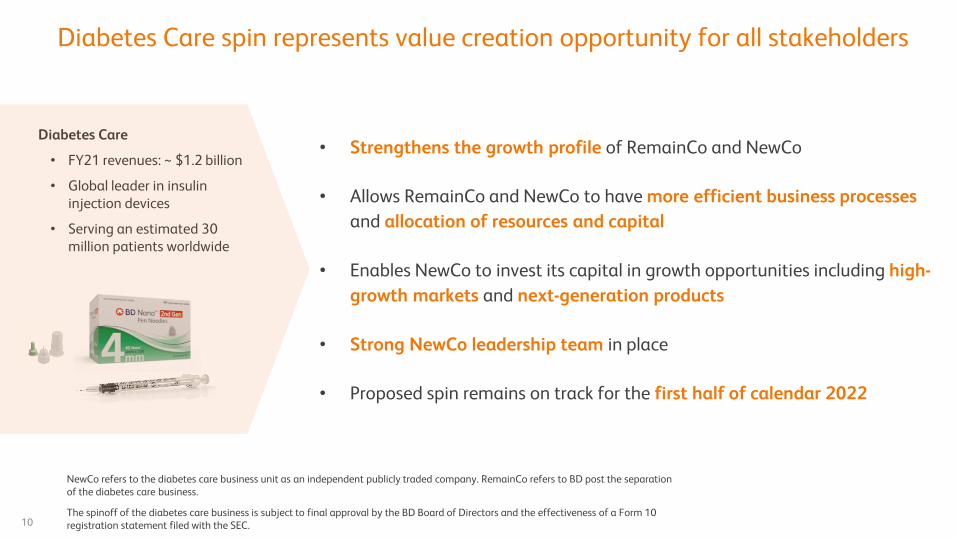
• Strengthens the growth profile of RemainCo and NewCo
• Allows RemainCo and NewCo to have more efficient business processes
and allocation of resources and capital
• Enables NewCo to invest its capital in growth opportunities including high-
growth markets and next-generation products
• Strong NewCo leadership team in place
• Proposed spin remains on track for the first half of calendar 2022
Diabetes Care spin represents value creation opportunity for all stakeholders
10
Diabetes Care
• FY21 revenues: ~ $1.2 billion
• Global leader in insulin injection devices
• Serving an estimated 30 million patients worldwide
NewCo refers to the diabetes care business unit as an independent publicly traded company. RemainCo refers to BD post the separation of the diabetes care business.
The spinoff of the diabetes care business is subject to final approval by the BD Board of Directors and the effectiveness of a Form 10 registration statement filed with the SEC.
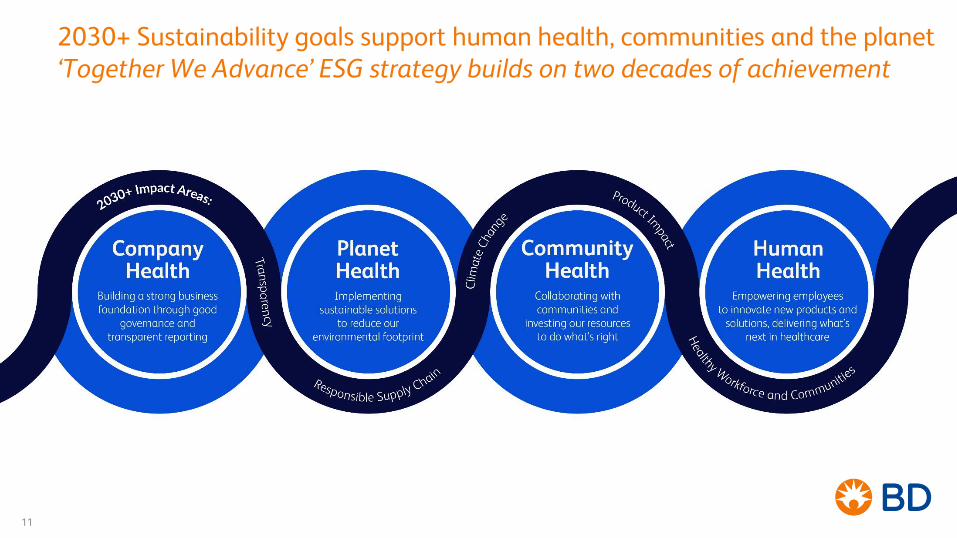
2030+ Sustainability goals support human health, communities and the planet ‘Together We Advance’ ESG strategy builds on two decades of achievement
11

Christopher DelOrefice
EVP & CFO
Financial performance

Fourth quarter results driven by strong base recovery
13
$ in millions Q4 FY21 Y/Y % ∆ FY21 Y/Y % ∆
BD Medical $2,532FXN: +7.7%
Rptd: +9.2%$9,479
FXN: +6.8%
Rptd: +9.2%
BD Life Sciences $1,532FXN: +1.5%
Rptd: +2.9%$6,530
FXN: +36.1%
Rptd: +39.7%
ex-COVID only testing(1)FXN: +15.8%
Rptd: +17.4%
FXN: +8.4%
Rptd: +11.2%
BD Interventional $1,071FXN: +8.3%
Rptd: +9.5%$4,239
FXN: +10.7%
Rptd: +12.7%
Total BD $5,135FXN: +5.9%
Rptd: +7.3%$20,248
FXN: +15.6%
Rptd: +18.3%
COVID only testing (1) $316FXN: (31.2%)
Rptd: (30.2%)$1,956
FXN: +238.7%
Rptd: +248.2%
Base Revenues (1) $4,819FXN: +9.8%
Rptd: +11.3%$18,292
FXN: +8.1%
Rptd: +10.5%
US Revenues $2,803 Rptd: +1.9% $10,969 Rptd: +12.9%
OUS Revenues $2,331FXN: +11.3%
Rptd: +14.7%$9,279
FXN: +19.2%
Rptd: +25.4%
Q4 FY21 Revenue Highlights (Commentary refers to FXN Y/Y basis unless specified)
Q4 and Full-year Revenues and Year-over-Year Percent Change
(1) See Basis of Presentation on slide 29
• Strong base business performance across all three segments
• Higher acuity, continued improvement in overall healthcare utilization, routine testing and lab utilization
• Increased demand for our broad portfolio of products more than offset the impact on elective procedures from the Delta variant
Please see Appendix for non-GAAP reconciliations

Business Unit Q4 FY21 FY21 BD Management Q4 Commentary
Medication Delivery Solutions
$1,043
+11.3%
$4,057
+11.7%
• Higher acuity and increased utilization in the U.S. and Europe
• Continued strength in the core, especially catheters and vascular care devices driven by competitive gains
Medication Management Solutions
$639
+0.1%
$2,432
(2.3%)
• Solid growth in US, aided by COVID-19 demand for infusion sets
• As expected, international revenues declined due to high COVID-related demand for infusion pumps in Europe in prior year
Diabetes Care $297
+5.4%
$1,160
+4.8%
• Growth in the quarter aided by the timing of sales and slightly better than expected market demand
Pharmaceutical Systems
$553
+12.3%
$1,829
+11.1%
• Strong growth of pre-fillable syringes driven by continued demand and enabled by capacity expansion
BD Medical $2,532
+7.7%
$9,479
+6.8%
Please see Basis of Presentation on slide 29 and Appendix for non-GAAP reconciliations
14
BD Medical: Continued strength in Medication Delivery Solutions & Pharmaceutical Systems

BD Life Sciences: Strong base business performance with additional benefit from COVID diagnostic testing
Business Unit Q4 FY21 FY21 BD Management Q4 Commentary
Integrated Diagnostic Solutions
$1,180
(1.9%)
+16.2%(ex-COVID only testing)
$5,225
+44.1%
+7.4% (ex-COVID only testing)
• Base business growth driven by specimen management and microbiology as lab utilization improves
• Increased demand for both core products and products used during the care of COVID patients
• COVID-19 diagnostic revenues of $316 million (vs. $452 million Q4 FY20)
• BD Veritor™ Plus System: $206 million
• BD Max™, specimen collection & transport: $110 million
Biosciences $352
+14.6%
$1,305
+11.1%
• Continuing to see strong demand for research reagents and instruments as a result of lab utilization returning to normal levels
• Recently launched e-commerce channel well received and seeing improved traffic
BD Life Sciences
$1,532
+1.5%
+15.8%(ex-COVID only testing)
$6,530
+36.1%
+8.4%(ex-COVID only testing)
Please see Basis of Presentation on slide 29 and Appendix for non-GAAP reconciliations
15

BD Interventional: Year-over-year recovery in elective procedures despite some resurgence impact
16
Business Unit Q4 FY21 FY21 BD Management Q4 Commentary
Surgery $336
+16.8%
$1,296
+14.4%
• Double-digit growth in Infection Prevention driven by recovery of elective procedures and continued market adoption of sterile BD ChloraPrepTM
• Solid Hernia performance and double-digit growth in Biosurgery were driven by recovery of elective procedures, despite COVID resurgences
Peripheral Intervention
$429
+5.5%
$1,711
+10.2%
• Solid growth in oncology as more people completed cancer screenings compared to the prior year
• Continued strong performance in atherectomy (Straub), leveraging PI sales force
• Growth partially offset by a product recall
Urology and Critical Care
$306
+3.8%
$1,232
+7.6%
• Continued strong demand in Acute Urology driven by PureWick™
• Double digit growth in Targeted Temperature Management driven by continued adoption of recently launched Arctic Sun
• UCC growth partially offset by temporary supply disruption which has since been remediated
BD Interventional
$1,071
+8.3%
$4,239
+10.7%
Please see Basis of Presentation on slide 29 and Appendix for non-GAAP reconciliations

Solid growth of our base business, with continued COVID recovery; Q4 COVID diagnostic testing revenues declined Y/Y but were ahead of expectations
(Adjusted)$ in millions Q4 FY21 Q4 FY20
ReportedY/Y ∆
FXN Y/Y ∆ FY21 FY20
ReportedY/Y ∆
FXN Y/Y ∆
Revenues $5,135 $4,784 +7.3% +5.9% $20,248 $17,117 +18.3% +15.6%
Gross Profit $2,671 $2,621 +1.9% +1.2% $10,930 $9,328 +17.2% +16.1%
Gross margin 52.0% 54.8% (280 bps) (240 bps) 54.0% 54.5% (50bps) +20bps
SSG&A $1,331 $1,199 +11.0% +9.3% $4,855 $4,327 +12.2% +9.9%
% of revenues 25.9% 25.1% +80 bps +80 bps 24.0% 25.3% (130bps) (130bps)
R&D $356 $279 +27.6% +26.9% $1,239 $1,021 +21.4% +20.3%
% of revenues 6.9% 5.8% +110 bps +120 bps 6.1% 6.0% +10bps +20bps
Operating Income $985 $1,143 (13.8%) (13.7%) $4,835 $3,980 +21.5% +21.8%
Operating margin 19.2% 23.9% (470 bps) (440bps) 23.9% 23.3% +60bps +120bps
Interest Income (exp), net ($109) ($123) (11.7%) (11.4%) ($460) ($527) (12.6%) (13.0%)
Other Income (exp), net ($18) $13 (233.5%) (207.1%) $37 $41 (9.5%) (18.0%)
Tax Rate 10.4% 18.7% (830bps) N/A 11.4% 14.5% (310bps) N/A
Net Income $770 $841 (8.5%) (7.8%) $3,909 $2,988 +30.8% +31.2%
Preferred Dividend $23 $23 $90 $107
Net Income Applicable to Common Shareholders
$747 $818 $3,820 $2,881
Avg diluted common shares 289 293 292 282
Adjusted EPS $2.59 $2.79 (7.2%) (6.5%) $13.08 $10.20 +28.2% +28.6%
Please see Appendix for non-GAAP reconciliations17

• Deployed significant capital while maintaining
our strong balance sheet in FY21
• Net leverage of 2.6x is consistent with our
long-term target of ~2.5x and commitment to
full investment grade credit ratings
Disciplined capital allocation positions BD to execute our growth strategy and continuous value creation opportunities
Note: capital deployment is subject to company and market conditionsNet leverage is on an adjusted basis, please see Appendix for non-GAAP reconciliations
Internal Investments• R&D of $1.2B and Capex of $1.2B in FY21• Established BD Growth & Innovation Fund
Tuck-In M&A• Accelerating acquisition pipeline• Deployed ~$500 million on tuck-in M&A
Dividends • Announced 50th consecutive annual increase• S&P500 Dividend Aristocrat
Share Repurchases• Resumed share repurchase program• Repurchased $0.75B in Q4 and $1.75B in total
$2.9 $3.3 $3.5
$4.6
FY18 FY20FY19 FY21
Operating cash flows ($ billions)
18

Christopher DelOrefice
EVP & CFO
Guidance

FY22 assumptions and considerations
20
• Continued easing of COVID-19 restrictions
• No further significant disruptions to elective procedures
• Not anticipating supply chain constraints and inflationary pressures to worsen or for conditions to return to normal levels
• Assumes ~$200M COVID only Dx testing revenues
• Alaris capital revenue generally in-line with FY21
• Base business revenue includes our combination flu/COVID assays at levels comparable to a “normal” flu season of~$75M to $100M
• No incremental revenue from BD Alaris system; does not assume 510k clearance
• Does not assume legislation changes that would impact the broader market
Medical Life Sciences Interventional
• Continue to extend our leadership position with competitive gains in vascular access and care and pre-filled injectables
• Investing in solutions transforming healthcare through smart connected care and new care settings
• FY22 BD Medical revenue growth expected to be slightly below BDX guidance1
• Leadership positions in attractive and growing categories
• Investing in higher growth spaces by enabling smart automated laboratory workflows, improving chronic disease treatment with clinically differentiated assays, research tools and companion diagnostics, and migrating point of care to new care settings
• FY22 BD Life Sciences revenue growth expected to be in-line with BDX guidance1
• Continuing strategy to evolve from product to category leadership in chronic disease treatment while continuing to invest in accretive high-growth spaces
• Investing in organic and inorganic portfolio offerings, expanded labeling and increasing non-acute care presence
• FY22 BD Interventional revenue growth expected to be slightly above BDX guidance1
1 Compared to BDX base revenue growth guidance of 5% to 6% (see slide 21). Please see Basis of Presentation on slide 29.

November Comments
Base revenue growth (FXN) 5% to 6%• Compared to $18.3B(1) in FY21 revenue which excludes ‘COVID
only testing’ revenue
COVID only testing(2) revenue ~$200M • Compared to $2B in FY21
Estimated currency impact ~(50 bps) • Based on current spot rates and currency mix
Estimated total company reported revenue
$19.3B to $19.5B • Compared to $20.2B in FY21
Base operating margin ~200 bps improvement• Compared to base operating margin in FY21 of 21.7% (3)
• Covid only testing operating margin expected to be modestly above base BDX average
Interest / Other ~$50M improvement• Primarily driven by debt refinancing activities completed in Q4
FY21
Effective tax rate 12.5% to 13.5% • Compared to 11.4% in FY21
Adjusted EPS $12.30 to $12.50• Compared to $13.08 adjusted EPS in FY21• Implied EPS ex-COVID only testing is above $12.00 floor provided
on August 5, 2021
(1) Please see slide 33 for a reconciliation of total revenues to base revenues (2) Please see Basis of Presentation on slide 29(3) Please see slide 34 for a reconciliation of adjusted operating margin to base operating marginNote: This guidance is only effective as of the date given, November 4, 2021, and will not be updated or affirmed unless and until we publicly announce updated or affirmed guidance.Please see Appendix for non-GAAP reconciliations
21
FY22 guidance summary

Above normal inflation (COGS and Shipping)
FY21 Adjusted Base Operating Margin
Estimated FX ImpactVolume utilization (incl. COVID recovery)
FY22 Adjusted Base Operating Margin
Continuous Improvement / Price/Mix / Expense Leverage
21.7%
~100 bps
~50 bps
~50 bps
FY22 operating margins are on the path to recovery
~200 bps
(1) Please see slide 34 for a reconciliation of adjusted operating margin to base operating margin.
(1)
22

Y/Y change COVID only testing profit
net of reinvestment
FY21 Adjusted EPS Base business revenue Base business margins FY22 adjusted EPS
~(19%)
Base business operational EPS growth(1)
~14%
$12.30 – $12.50$13.08
23
(1) Base business operational growth also includes the net impact of the benefit of improvement in Interest / Other offset by the unfavorable Y/Y increase in our effective tax rate (2) Please see Basis of Presentation on slide 29Note: This guidance is only effective as of the date given, November 4, 2021, and will not be updated or affirmed unless and until we publicly announce updated or affirmed guidance.Please see Appendix for non-GAAP reconciliations
(2) (2)
FY22 adjusted EPS guidance

NewCo refers to the diabetes care business unit as an independent publicly traded company. RemainCo refers to BD post the separation of the diabetes care business.
The spinoff of the diabetes care business is subject to final approval by the BD Board of Directors and the effectiveness of a Form 10 registration statement filed with the SEC.
NewCo Considerations
• One of the largest pure-play Diabetes companies in
existence today, with an ability to drive strong cash flow
• Anticipated capital structure designed to support investment
in growth
• Growth acceleration opportunities through high-growth
markets and next-generation products
• Further opportunity to pursue acquisitions aligned with
growth strategy
• Experienced executive team and enhanced ability to attract
and retain top talent
RemainCo considerations
• RemainCo revenue and adjusted EPS growth profile enhanced as the Diabetes Care growth rate is dilutive
• Diabetes Care margin profile, above corporate average, but declining. Margins will be restated to adjust for the spin-off.
• Proposed spin-off creates value through an upfront cash infusion equal to multiple years of cash generated from Diabetes Care unit. (details to be provided at a later date)
• Increasing Dividend payout on a proforma basis post spin
• Intended to be tax-free for U.S. federal income tax purposes
• Transition Service Agreement mitigates stranded costs
Diabetes Care spin represents significant value creation opportunity for all stakeholders
24

FY22 Quarterly phasing considerations
25
P&L Line item Quarterly phasing considerations
Revenue
• Revenue growth expected to be normalized across quarters with exception of Q2
• Q2 growth expected to be higher due to easier comparison from prior year COVID resurgence
• COVID testing revenue expected to be more weighted to 1H
Gross margin
• 1H expected to be lower
• Increased inflation began earlier in FY21 while benefits of cost improvement initiatives will be on a lag as they flow through inventory
• Inflation flow through to inventory expected to be most prominent in Q2 and improve across balance of the fiscal year
Operating expenses
• Operating expenses expected to be fairly ratable by quarter as we move past COVID variability
Effective Tax Rate
• Full-year ETR includes assumptions around jurisdictional mix of income and certain potential discrete items.
• Timing of realization of discrete items could result in variability which could potentially include a lower Q1 rate.

Appendix

27
BD
Med
ica
lB
D L
ife
Sci
ence
sB
D I
nte
rven
tio
na
l
Note: Not all products are available in all countries/regions. Products that appear on this page are in development unless otherwise noted
Denotes product has received relevant regulatory clearance/approval and/or commercially launched
BD Cathena™ IV Safety Catheter with BD
Multiguard™ Technology
BD PhaSeal™ Optima Locking Injector
N40-O
BD Securis™Stabilization Device
BD Pyxis™ Inventory Connect 1.0
BD Hylok™for IV
BD NeXus (MedCaptain)
BD BodyGuard™DUO Barcode
BD Pyxis™ ES 1.7 BD HealthSight™Infusion Diversion,
MedSafety
BD MAX™FLU + COVID-19
Assay
BD Veritor™Connectivity
Module
BD Veritor™FLU + COVID-19 POC Antigen Test
BD Kiestra™ReadA
Compact
BD FACSDuet™ (US)
BD FACSymphony™
A1
BD FACSymphony™
A5.2 SEBD Veritor™
At-Home
BD MAX™CTGCTV2
Assay
BD COR™System with
Onclarity™ (US)
Proxis™11/13
Global Intermittent Self Cath - Economy
Sensica™ Automated Urine Output
PeritX™ Pristine™ SureStep™ 1.1 Glidepath™ Retro Glidepath™ LE Crosser™ IQ
We have launched a series of innovative products and solutions in FY21

Impact area Our ambition Key highlights
Climate Change
• Minimize our contribution to global emissions and utilize our capabilities to address unmet health needs for climate vulnerable populations
• BD has committed to set science-based emissions reduction targets —across the entire value chain— that are consistent with keeping global warming to 1.5°C above pre-industrial levels. We will set verifiable science-based targets through the Science Based Targets initiative (SBTi), which independently assesses corporate emissions reduction targets in line with what climate science says is needed to meet the goals of the Paris Agreement.
Product Impacts
• Reduce the environmental impact of our portfolio and address the sustainability needs of our customers
• BD’s Jessica Gemmell has been selected by DiversityPlus Magazine as one of the 2021 Top 15 Women in Power Impacting Diversity in recognition of her efforts to drive measurable results in the Supplier Diversity, Equity & Inclusion (SDEI) space. A successful supplier diversity program not only supports sustainable procurement efforts, but it is integral in how we support the economic empowerment of underutilized and underserved communities.
Responsible Supply Chain
• Create a supply chain adaptable to disruption and able to contribute to strong environmental and social performance
Healthy Workforce and Communities
• Maintain a healthy and thriving workforce that cultivates our culture of inclusion, safety, well-being and contributes to community health
• Six grants totaling $900,000 – provided through the BD Helping Build Healthy Communities™ initiative – were awarded to help community health centers to address health equity and expand healthcare access in underserved U.S. communities. Implemented in partnership with Direct Relief and the National Association of Community Health Centers (NACHC), BD and the BD Foundation have committed $22.6 million to this initiative through 2023.
Transparency• Invite trust across stakeholder groups through transparent
performance reporting on ESG issues relevant to our business
• We launched the BD Cybersecurity Trust Center to give customers access to timely, actionable cybersecurity information. In addition, BD became the first medical technology company authorized as a Common Vulnerability and Exposures (CVE®) Numbering Authority by the CVE Program, making it easier for customers to manage vulnerabilities affecting BD products.
1
2
3
5
4
28
We are already making progress against our 2030+ sustainability goals

29
All dollar amounts presented are USD ($) in millions, unless otherwise indicated, except per share figures.
Certain financial information, described as FXN (defined below), excludes the impact of foreign currency translation.
Revenue year-over-year change comparisons are on a FXN basis unless otherwise noted.
Base revenue denotes total revenues less estimated revenues for COVID-19 only diagnostic testing.
COVID only diagnostic testing includes COVID only assays on our BD Veritor™ and BD Max ™ and related collection, transport,
and swabs.
Base business margins adjusts for the net impact of estimated COVID only diagnostic testing profitability and the related
profit reinvestments back into our business.(1)
FXN denotes currency neutral basis. We calculate foreign currency-neutral percentages by converting our current-period local
currency financial results using the prior period foreign currency exchange rates and comparing these adjusted amounts to our
current-period results.
NewCo refers to the diabetes care business as an independent publicly traded company.
RemainCo refers to BD post the separation of the diabetes care business.
(1) See the financial tables in the Appendix for a reconciliation to the most comparable GAAP measure
Basis of presentation

(Unaudited; $ in millions) A B C D=A-B E=A-C-B F=(A-B)/B G=(A-B-C)/B
2021 2020 FX Impact Rptd Change FXN Change
% Change
Reported
% Change FX-
Neutral
TOTAL REVENUES $5,135 $4,784 $69 $351 $282 7.3% 5.9%
Less: COVID only diagnostics 316 452 5 (137) (141) N/A N/A
Base Revenues $4,819 $4,331 $64 $488 $423 11.3% 9.8%
impact of COVID only diagnostics 1 (2.9%) (3.0%)
BD LIFE SCIENCES $1,532 $1,488 $22 $44 $22 2.9% 1.5%
Less: COVID only diagnostics 316 452 5 (137) (141) N/A N/A
BDLS ex-COVID only Dx $1,216 $1,035 $17 $181 $163 17.4% 15.8%
impact of COVID only diagnostics 1 (9.2%) (9.5%)
IDS $1,180 $1,185 $17 ($5) ($22) -0.4% -1.9%
Less: COVID only diagnostics 316 452 5 (137) (141) N/A N/A
IDS ex-COVID only Dx $864 $732 $13 $132 $119 18.0% 16.2%
impact of COVID only diagnostics 1 (11.5%) (11.9%)
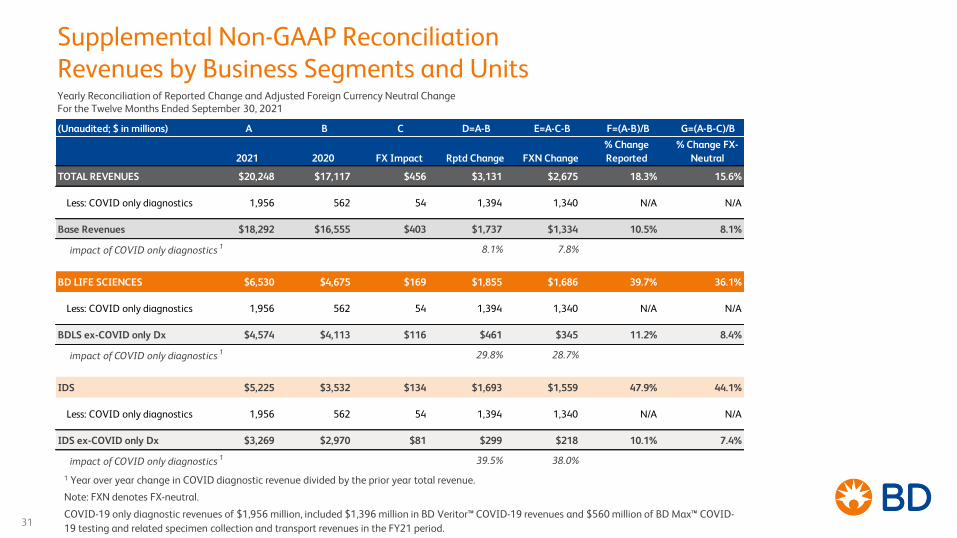
Supplemental Non-GAAP ReconciliationRevenues by Business Segments and Units
30
Quarterly Reconciliation of Reported Change and Adjusted Foreign Currency Neutral ChangeFor the Three Months Ended September 30, 2021
1 Year over year change in COVID only diagnostic revenue divided by the prior year total revenue.
Note: FXN denotes FX-neutral.
COVID-19 only diagnostic revenues of $316 million, included $206 million in BD Veritor™ COVID-19 revenues and $110 million of BD Max™ COVID-19
testing and related specimen collection and transport revenues in the FY21 period.
(Unaudited; $ in millions) A B C D=A-B E=A-C-B F=(A-B)/B G=(A-B-C)/B
2021 2020 FX Impact Rptd Change FXN Change
% Change
Reported
% Change FX-
Neutral
TOTAL REVENUES $20,248 $17,117 $456 $3,131 $2,675 18.3% 15.6%
Less: COVID only diagnostics 1,956 562 54 1,394 1,340 N/A N/A
Base Revenues $18,292 $16,555 $403 $1,737 $1,334 10.5% 8.1%
impact of COVID only diagnostics 1 8.1% 7.8%
BD LIFE SCIENCES $6,530 $4,675 $169 $1,855 $1,686 39.7% 36.1%
Less: COVID only diagnostics 1,956 562 54 1,394 1,340 N/A N/A
BDLS ex-COVID only Dx $4,574 $4,113 $116 $461 $345 11.2% 8.4%
impact of COVID only diagnostics 1 29.8% 28.7%
IDS $5,225 $3,532 $134 $1,693 $1,559 47.9% 44.1%
Less: COVID only diagnostics 1,956 562 54 1,394 1,340 N/A N/A
IDS ex-COVID only Dx $3,269 $2,970 $81 $299 $218 10.1% 7.4%
impact of COVID only diagnostics 1 39.5% 38.0%
1 Year over year change in COVID diagnostic revenue divided by the prior year total revenue.
Note: FXN denotes FX-neutral.
COVID-19 only diagnostic revenues of $1,956 million, included $1,396 million in BD Veritor™ COVID-19 revenues and $560 million of BD Max™ COVID-
19 testing and related specimen collection and transport revenues in the FY21 period.
Supplemental Non-GAAP ReconciliationRevenues by Business Segments and Units
31
Yearly Reconciliation of Reported Change and Adjusted Foreign Currency Neutral ChangeFor the Twelve Months Ended September 30, 2021

(Unaudited; $ in millions) A B C D E F=(D-E-B)/B G=(B-C)*(1+F) H=(G-A)/A
2019 2020 2020 FX
Impact 2021
2021 FX
Impact
FY21 vs FY20 %
Change FX-Neutral2021 at 2019 Rates
FY21 vs FY19 % Change FX-
Neutral
BDX ex-COVID only Dx 4,584 4,331 (2) 4,819 64 9.8% 4,756 3.8%
includes (280 bps) impact from
MMS US infusion
BDX ex-COVID only Dx, ex-US MMS Infusion 4,272 4,154 (2) 4,616 65 9.6% 4,553 6.6%
BD Medical 2,437 2,318 1 2,532 35 7.7% 2,496 2.4%
includes (550 bps) impact from
MMS US infusion
BD Medical ex-US MMS Infusion 2,125 2,140 1 2,329 35 7.2% 2,292 7.9%
Medication Delivery Solutions (MDS) 984 921 (8) 1,043 18 11.3% 1,034 5.1%
Medication Management Solutions (MMS) 737 634 3 639 5 0.1% 631 -14.5%
includes (1,500 bps) impact
from MMS US infusion
MMS ex-US Infusion 426 456 3 436 5 -5.6% 428 0.5%
Diabetes Care (DC) 292 277 (2) 297 4 5.4% 294 0.9%
Pharmaceutical Systems (PS) 425 485 7 553 8 12.3% 537 26.5%
BD Life Sciences ex-COVID only Dx 1,134 1,035 (3) 1,216 17 15.8% 1,203 6.1%
Integrated Diagnostic Solutions (IDS) ex-COVID only Dx 802 732 (5) 864 13 16.2% 857 6.8%
Biosciences (BDB) 332 303 2 352 4 14.6% 346 4.3%
BD Interventional 1,013 978 1 1,071 12 8.3% 1,058 4.5%
Peripheral Intervention (PI) 409 399 0 429 7 5.5% 421 3.0%
Surgery (Surg) 315 286 0 336 2 16.8% 334 6.2%
Urological and Critical Care (UCC) 289 293 1 306 2 3.8% 303 4.8%
32
Quarterly Reconciliation of Reported Change and Adjusted Foreign Currency Neutral ChangeFor the Three Months Ended September 30, 2021
Refer to the “Revenues by Business Segments and Units” on slide 31 for a reconciliation of “base revenue” items.
Supplemental Non-GAAP ReconciliationWorldwide Revenues by Business Segment and Unit

33
Yearly Reconciliation of Reported Change and Adjusted Foreign Currency Neutral ChangeFor the Twelve Months Ended September 30, 2021
Refer to the “Revenues by Business Segments and Units” on slide 32 for a reconciliation of “base revenue” items.
Supplemental Non-GAAP ReconciliationWorldwide Revenues by Business Segment and Unit
(Unaudited; $ in millions) A B C D E F=(D-E-B)/B G=(B-C)*(1+F) H=(G-A)/A
2019 2020 2020 FX
Impact 2021
2021 FX
Impact
FY21 vs FY20 %
Change FX-Neutral2021 at 2019 Rates
FY21 vs FY19 % Change FX-
Neutral
BDX ex-COVID only Dx 17,290 16,555 (167) 18,292 403 8.1% 18,070 4.5%
includes (230 bps) impact from
MMS US infusion
BDX ex-COVID only Dx, ex-US MMS Infusion 16,173 15,721 (167) 17,493 403 8.7% 17,272 6.8%
BD Medical 9,064 8,680 (96) 9,479 211 6.8% 9,370 3.4%
includes (450 bps) impact from
MMS US infusion
BD Medical ex-US MMS Infusion 7,947 7,846 (96) 8,860 211 7.9% 8,573 7.9%
Medication Delivery Solutions (MDS) 3,848 3,555 (54) 4,057 86 11.7% 4,032 4.8%
Medication Management Solutions (MMS) 2,640 2,454 (12) 2,432 35 -2.3% 2409 -8.9%
includes (1,440 bps) impact
from MMS US infusion
MMS ex-US Infusion 1,526 1,619 (12) 1,634 35 -1.3% 1610 5.5%
Diabetes Care (DC) 1,110 1,084 (15) 1,160 24 4.8% 1152 3.7%
Pharmaceutical Systems (PS) 1,465 1,588 (15) 1,829 66 11.1% 1780 21.5%
BD Life Sciences ex-COVID only Dx 4,300 4,113 (51) 4,574 116 8.4% 4,513 5.0%
Integrated Diagnostic Solutions (IDS) ex-COVID only Dx 3,106 2,970 (41) 3,269 81 7.4% 3233 4.1%
Biosciences (BDB) 1,194 1,143 (9) 1,305 35 11.1% 1280 7.2%
BD Interventional 3,926 3,762 (20) 4,239 75 10.7% 4,186 6.6%
Peripheral Intervention (PI) 1,574 1,511 (13) 1,711 45 10.2% 1681 6.8%
Surgery (Surg) 1,242 1,121 (4) 1,296 14 14.4% 1287 3.6%
Urological and Critical Care (UCC) 1,110 1,130 (2) 1,232 16 7.6% 1218 9.7%

Reconciliation of non-GAAP adjusted margins to non-GAAP base business margins
(1) Please see slide 35 in the Q1 FY21 earnings presentation posted on February 4, 2021 at investors.bd.com for a reconciliation of GAAP to non-GAAP gross and operating margins
(2) Please see slide 39 in the Q2 FY21 earnings presentation posted on May 6, 2021 at investors.bd.com for a reconciliation of GAAP to non-GAAP gross and operating margins
(3) Please see slide 34 in the Q3 FY21 earnings presentation posted on August 5, 2021 at investors.bd.com for a reconciliation of GAAP to non-GAAP gross and operating margins
(4) Please see slide 35 for a reconciliation of GAAP to non-GAAP gross and operating margins
(5) Please see slide 38 for a reconciliation of GAAP to non-GAAP gross and operating margins
(A) (B)(C) = (A) –
(B)(D) (E)
(F) = (D)-
(E)
All-in
Adjusted
COVID-19 Dx Test
and Reinvestment
Impact
Base
Business
All-in
Adjusted
COVID-19 Dx Test
and Reinvestment
Impact
Base
Q1 FY21(1) 58.2% ~270 bps 55.5% 31.6% ~660 bps 25.0%
Q2 FY21(2) 53.8% ~10 bps 53.7% 24.5% ~230 bps 22.2%
Q3 FY21(3) 51.5% ~(90 bps) 52.4% 19.8% ~(10 bps) 19.9%
Q4 FY21(4) 52.0% ~(80 bps) 52.8% 19.2% ~(80 bps) 20.0%
FY21(5) 54.0% ~40 bps 53.6% 23.9% ~220 bps 21.7%
Adjusted Gross Margin Adjusted Operating Margin
34
35
Quarterly Reconciliation of Adjusted Change and Adjusted Foreign Currency Neutral Change
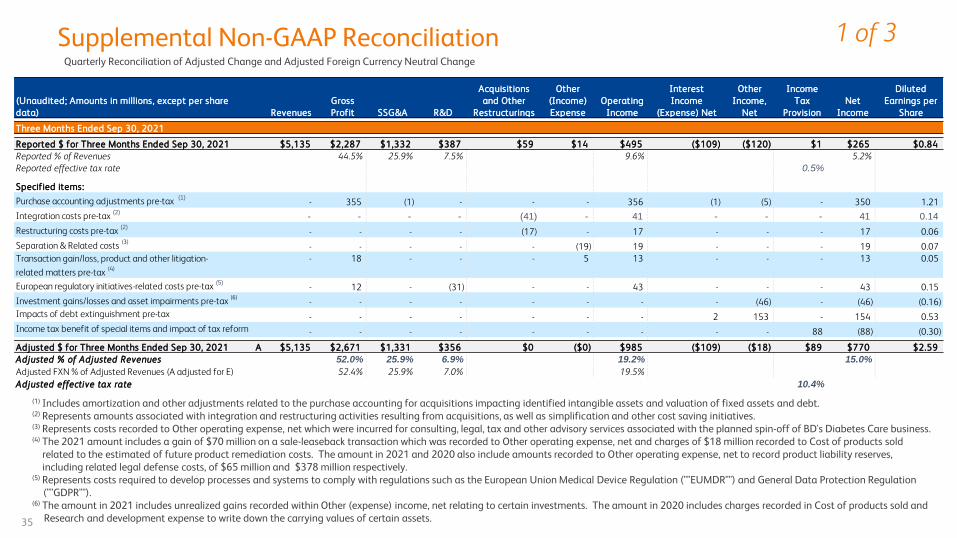
1 of 3Supplemental Non-GAAP Reconciliation
(Unaudited; Amounts in millions, except per share data) Revenues
Gross Profit SSG&A R&D
Acquisitions and Other
Restructurings
Other (Income) Expense
Operating Income
Interest Income
(Expense) Net
Other Income,
Net
Income Tax
ProvisionNet
Income
Diluted Earnings per
Share
Three Months Ended Sep 30, 2021
Reported $ for Three Months Ended Sep 30, 2021 $5,135 $2,287 $1,332 $387 $59 $14 $495 ($109) ($120) $1 $265 $0.84Reported % of Revenues 44.5% 25.9% 7.5% 9.6% 5.2% Reported effective tax rate 0.5%
Specified items:
Purchase accounting adjustments pre-tax (1)
- 355 (1) - - - 356 (1) (5) - 350 1.21
Integration costs pre-tax (2)
- - - - (41) - 41 - - - 41 0.14
Restructuring costs pre-tax (2)- - - - (17) - 17 - - - 17 0.06
Separation & Related costs (3)- - - - - (19) 19 - - - 19 0.07
Transaction gain/loss, product and other litigation-
related matters pre-tax (4)
- 18 - - - 5 13 - - - 13 0.05
European regulatory initiatives-related costs pre-tax (5)- 12 - (31) - - 43 - - - 43 0.15
Investment gains/losses and asset impairments pre-tax (6)- - - - - - - - (46) - (46) (0.16)
Impacts of debt extinguishment pre-tax - - - - - - - 2 153 - 154 0.53 Income tax benefit of special items and impact of tax reform - - - - - - - - - 88 (88) (0.30)
Adjusted $ for Three Months Ended Sep 30, 2021 A $5,135 $2,671 $1,331 $356 $0 ($0) $985 ($109) ($18) $89 $770 $2.59Adjusted % of Adjusted Revenues 52.0% 25.9% 6.9% 19.2% 15.0%
Adjusted FXN % of Adjusted Revenues (A adjusted for E) 52.4% 25.9% 7.0% 19.5%
Adjusted effective tax rate 10.4%
(1) Includes amortization and other adjustments related to the purchase accounting for acquisitions impacting identified intangible assets and valuation of fixed assets and debt.(2) Represents amounts associated with integration and restructuring activities resulting from acquisitions, as well as simplification and other cost saving initiatives. (3) Represents costs recorded to Other operating expense, net which were incurred for consulting, legal, tax and other advisory services associated with the planned spin-off of BD's Diabetes Care business.(4) The 2021 amount includes a gain of $70 million on a sale-leaseback transaction which was recorded to Other operating expense, net and charges of $18 million recorded to Cost of products sold
related to the estimated of future product remediation costs. The amount in 2021 and 2020 also include amounts recorded to Other operating expense, net to record product liability reserves, including related legal defense costs, of $65 million and $378 million respectively.
(5) Represents costs required to develop processes and systems to comply with regulations such as the European Union Medical Device Regulation (""EUMDR"") and General Data Protection Regulation (""GDPR"").
(6) The amount in 2021 includes unrealized gains recorded within Other (expense) income, net relating to certain investments. The amount in 2020 includes charges recorded in Cost of products sold and Research and development expense to write down the carrying values of certain assets.
36
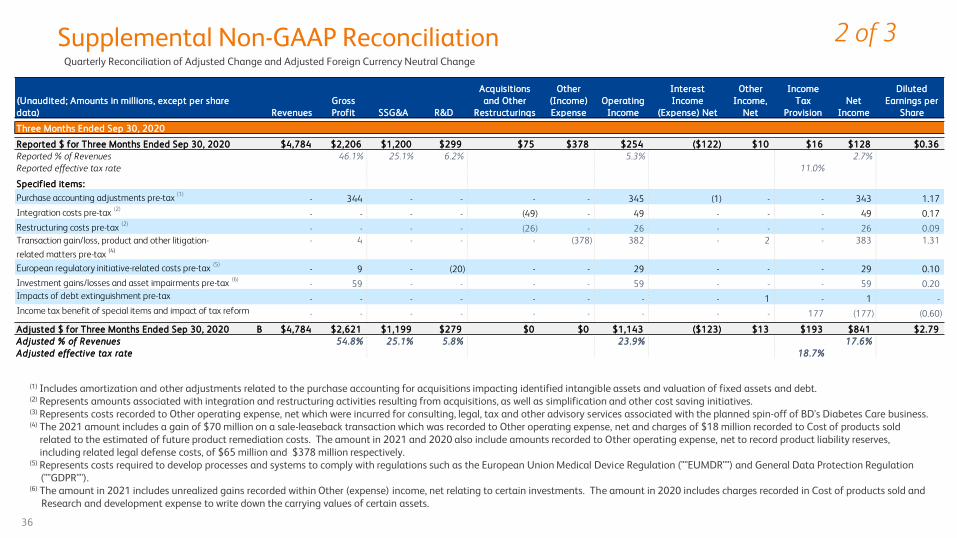
2 of 3Supplemental Non-GAAP ReconciliationQuarterly Reconciliation of Adjusted Change and Adjusted Foreign Currency Neutral Change
(1) Includes amortization and other adjustments related to the purchase accounting for acquisitions impacting identified intangible assets and valuation of fixed assets and debt.(2) Represents amounts associated with integration and restructuring activities resulting from acquisitions, as well as simplification and other cost saving initiatives. (3) Represents costs recorded to Other operating expense, net which were incurred for consulting, legal, tax and other advisory services associated with the planned spin-off of BD's Diabetes Care business.(4) The 2021 amount includes a gain of $70 million on a sale-leaseback transaction which was recorded to Other operating expense, net and charges of $18 million recorded to Cost of products sold
related to the estimated of future product remediation costs. The amount in 2021 and 2020 also include amounts recorded to Other operating expense, net to record product liability reserves, including related legal defense costs, of $65 million and $378 million respectively.
(5) Represents costs required to develop processes and systems to comply with regulations such as the European Union Medical Device Regulation (""EUMDR"") and General Data Protection Regulation (""GDPR"").
(6) The amount in 2021 includes unrealized gains recorded within Other (expense) income, net relating to certain investments. The amount in 2020 includes charges recorded in Cost of products sold and Research and development expense to write down the carrying values of certain assets.
(Unaudited; Amounts in millions, except per share data) Revenues
Gross Profit SSG&A R&D
Acquisitions and Other
Restructurings
Other (Income) Expense
Operating Income
Interest Income
(Expense) Net
Other Income,
Net
Income Tax
ProvisionNet
Income
Diluted Earnings per
Share Three Months Ended Sep 30, 2020
Reported $ for Three Months Ended Sep 30, 2020 $4,784 $2,206 $1,200 $299 $75 $378 $254 ($122) $10 $16 $128 $0.36Reported % of Revenues 46.1% 25.1% 6.2% 5.3% 2.7% Reported effective tax rate 11.0% Specified items:
Purchase accounting adjustments pre-tax (1)- 344 - - - - 345 (1) - - 343 1.17
Integration costs pre-tax (2)
- - - - (49) - 49 - - - 49 0.17
Restructuring costs pre-tax (2)
- - - - (26) - 26 - - - 26 0.09 Transaction gain/loss, product and other litigation-
related matters pre-tax (4)
- 4 - - - (378) 382 - 2 - 383 1.31
European regulatory initiative-related costs pre-tax (5)- 9 - (20) - - 29 - - - 29 0.10
Investment gains/losses and asset impairments pre-tax (6)- 59 - - - - 59 - - - 59 0.20
Impacts of debt extinguishment pre-tax - - - - - - - - 1 - 1 - Income tax benefit of special items and impact of tax reform - - - - - - - - - 177 (177) (0.60)
Adjusted $ for Three Months Ended Sep 30, 2020 B $4,784 $2,621 $1,199 $279 $0 $0 $1,143 ($123) $13 $193 $841 $2.79Adjusted % of Revenues 54.8% 25.1% 5.8% 23.9% 17.6%Adjusted effective tax rate 18.7%

Supplemental Non-GAAP Reconciliation
37
3 of 3Quarterly Reconciliation of Adjusted Change and Adjusted Foreign Currency Neutral Change
Please note: A refers to the adjusted figures for the three-month period ending September 30, 2021 from slide 37B refers to the adjusted figures for the three-month period ending September 30, 2020 from slide 38
(Unaudited; Amounts in millions, except per share data) Revenues
Gross Profit SSG&A R&D
Acquisitions
and Other Restructurings
Other
(Income) Expense
Operating Income
Interest
Income (Expense) Net
Other
Income, Net
Income
Tax Provision
Net Income
Diluted
Earnings per Share
Three Months Ended Sep 30, 2021 versus Sep 30, 2020
Adjusted $ change C=A-B $351 $50 ($132) ($77) $0 $0 ($158) $14 ($31) $104 ($71) ($0.20)
Adjusted % change D=C/B 7.3% 1.9% (11.0%) (27.6%) - - (13.8%) 11.7% (233.5%) 53.8% (8.5%) (7.2%)
Foreign currency translation impact E $69 $19 ($20) ($2) $0 $0 ($2) $0 ($3) $0 ($5) ($0.02)
Adjusted foreign currency neutral $ change F=C-E $282 $31 ($112) ($75) $0 $0 ($156) $14 ($27) $104 ($66) ($0.18)
Adjusted foreign currency neutral % change G=F/B 5.9% 1.2% (9.3%) (26.9%) - - (13.7%) 11.4% (207.1%) 53.7% (7.8%) (6.5%)

RevenuesGross Profit SSG&A R&D
Acquisitions and Other
Restructurings
Other (Income) Expense
Operating Income
Interest Income
(Expense) Net
Other Income,
Net
Income Tax
ProvisionNet
Income
Diluted Earnings per
Share
Twelve Months Ended Sep 30, 2021
Reported $ for Twelve Months Ended Sep 30, 2021 $20,248 $9,427 $4,867 $1,339 $185 $238 $2,799 ($460) ($97) $150 $2,092 $6.85Reported % of Revenues 46.6% 24.0% 6.6% 13.8% 10.3% Reported effective tax rate 6.7% Specified items:
Purchase accounting adjustments pre-tax (1)- 1,399 (11) (7) - - 1,417 (7) (5) - 1,406 4.82
Integration costs pre-tax (2)- - - - (135) - 135 - - - 135 0.46
Restructuring costs pre-tax (2)- - - - (50) - 50 - - - 50 0.17
Separation & Related costs (3)- - - - - (35) 35 - - - 35 0.12
Transaction gain/loss, product and other litigation-related
matters pre-tax (4)
- 63 - - - (203) 265 - 6 - 272 0.93
European regulatory initiatives-related costs pre-tax (5)
- 41 (1) (93) - - 135 - - - 135 0.46
Investment gains/losses and asset impairments pre-tax (6)- - - - - - - - (46) - (46) (0.16)
Impacts of debt extinguishment pre-tax - - - - - - - 6 178 - 185 0.63 Income tax benefit of special items and impact of tax reform - - - - - - - - - 353 (353) (1.21)
Adjusted $ for Twelve Months Ended Sep 30, 2021 A $20,248 $10,930 $4,855 $1,239 $0 $0 $4,835 ($460) $37 $503 $3,909 $13.08Adjusted % of Adjusted Revenues 54.0% 24.0% 6.1% 23.9% 19.3%Adjusted FXN % of Adjusted Revenues (A adjusted for E) 54.7% 24.0% 6.2% 24.5%Adjusted effective tax rate 11.4%
38
Yearly Reconciliation of Adjusted Change and Adjusted Foreign Currency Neutral Change
1 of 3Supplemental Non-GAAP Reconciliation
(1) Includes amortization and other adjustments related to the purchase accounting for acquisitions impacting identified intangible assets and valuation of fixed assets and debt.(2) Represents amounts associated with integration and restructuring activities resulting from acquisitions, as well as simplification and other cost saving initiatives.(3) Represents costs recorded to Other operating expense, net which were incurred for consulting, legal, tax and other advisory services associated with the planned spin-off of BD's Diabetes Care business.(4) The 2021 amount includes gains of $158 million on sale-leaseback transactions. The amounts in 2021 and 2020 include charges to record product liability reserves, including related legal defense
costs, of $361 million and $378 million, respectively. The sale-leaseback gains and product liability-related charges were recorded to Other operating expense, net. The amounts in 2021 and 2020 also include charges of $56 million and $244 million, respectively, recorded to Cost of products sold related to the estimate of future product remediation costs.
(5) Represents costs required to develop processes and systems to comply with regulations such as the EUMDR and GDPR. (6) The amount in 2021 includes unrealized gains recorded within Other (expense) income, net relating to certain investments. The prior-period amount includes charges recorded in Cost of products sold
and Research and development expense to write down the carrying values of certain assets.

RevenuesGross Profit SSG&A R&D
Acquisitions and Other
Restructurings
Other (Income) Expense
Operating Income
Interest Income
(Expense) Net
Other Income,
Net
Income Tax
ProvisionNet
Income
Diluted Earnings per
Share Twelve Months Ended Sep 30, 2020
Reported $ for Twelve Months Ended Sep 30, 2020 $17,117 $7,577 $4,325 $1,096 $309 $363 $1,484 ($521) $23 $111 $874 $2.71Reported % of Revenues 44.3% 25.3% 6.4% 8.7% 5.1% Reported effective tax rate 11.3% Specified items:
Purchase accounting adjustments pre-tax (1)
- 1,378 2 (0) - 15 1,361 (5) - - 1,356 4.80
Integration costs pre-tax (2)- - - - (214) - 214 - - - 214 0.76
Restructuring costs pre-tax (2)- - - - (95) - 95 - - - 95 0.33
Transaction costs pre-tax (2)- - - - (1) - 1 - - - 1 -
Transaction gain/loss, product and other litigation-related
matters pre-tax (4)
- 244 - - - (378) 622 - 9 - 631 2.24
European regulatory initiatives-related costs pre-tax (5)- 31 (1) (75) - - 106 - - - 106 0.38
Investment gains/losses and asset impairments pre-tax (6)
- 98 - - - - 98 - 1 - 100 0.35 Impacts of debt extinguishment pre-tax - - - - - - - - 8 - 8 0.03 Income tax benefit of special items and impact of tax reform - - - - - - - - - 395 (395) (1.40)
Adjusted $ for Twelve Months Ended Sep 30, 2020 B $17,117 $9,328 $4,327 $1,021 $0 $0 $3,980 ($527) $41 $507 $2,988 $10.20Adjusted % of Revenues 54.5% 25.3% 6.0% 23.3% 17.5%Adjusted effective tax rate 14.5%
39
2 of 3Supplemental Non-GAAP ReconciliationYearly Reconciliation of Adjusted Change and Adjusted Foreign Currency Neutral Change
(1) Includes amortization and other adjustments related to the purchase accounting for acquisitions impacting identified intangible assets and valuation of fixed assets and debt.(2) Represents amounts associated with integration and restructuring activities resulting from acquisitions, as well as simplification and other cost saving initiatives.(3) Represents costs recorded to Other operating expense, net which were incurred for consulting, legal, tax and other advisory services associated with the planned spin-off of BD's Diabetes Care business.(4) The 2021 amount includes gains of $158 million on sale-leaseback transactions. The amounts in 2021 and 2020 include charges to record product liability reserves, including related legal defense
costs, of $361 million and $378 million, respectively. The sale-leaseback gains and product liability-related charges were recorded to Other operating expense, net. The amounts in 2021 and 2020 also include charges of $56 million and $244 million, respectively, recorded to Cost of products sold related to the estimate of future product remediation costs.
(5) Represents costs required to develop processes and systems to comply with regulations such as the EUMDR and GDPR. (6) The amount in 2021 includes unrealized gains recorded within Other (expense) income, net relating to certain investments. The prior-period amount includes charges recorded in Cost of products sold
and Research and development expense to write down the carrying values of certain assets.

RevenuesGross Profit SSG&A R&D
Acquisitions
and Other Restructurings
Other
(Income) Expense
Operating Income
Interest
Income (Expense) Net
Other
Income, Net
Income
Tax Provision
Net Income
Diluted
Earnings per Share
Twelve Months Ended Sep 30, 2021 versus Sep 30, 2020
Adjusted $ change C=A-B $3,131 $1,602 ($529) ($219) ($0) ($0) $855 $66 ($4) $4 $921 $2.88
Adjusted % change D=C/B 18.3% 17.2% (12.2%) (21.4%) - - 21.5% 12.6% (9.5%) 0.7% 30.8% 28.2%
Foreign currency translation impact E $456 $99 ($101) ($12) $0 $0 ($14) ($2) $3 $1 ($11) ($0.04)
Adjusted foreign currency neutral $ change F=C-E $2,675 $1,503 ($427) ($207) ($0) ($0) $869 $68 ($7) $2 $932 $2.92
Adjusted foreign currency neutral % change G=F/B 15.6% 16.1% (9.9%) (20.3%) - - 21.8% 13.0% (18.0%) 0.5% 31.2% 28.6%
Supplemental Non-GAAP Reconciliation
40
3 of 3Yearly Reconciliation of Adjusted Change and Adjusted Foreign Currency Neutral Change
Please note: A refers to the adjusted figures for the three-month period ending September 30, 2021 from slide 40B refers to the adjusted figures for the three-month period ending September 30, 2020 from slide 41

41
Quarterly Reconciliation of Reported Change and Adjusted Foreign Currency Neutral ChangeFor the Three Months Ended September 30, 2021
(1) Includes amortization and other adjustments related to the purchase accounting for acquisitions impacting identified intangible assets and valuation of fixed assets and debt.(2) Represents amounts associated with integration and restructuring activities resulting from acquisitions, as well as simplification and other cost saving initiatives.(3) Represents costs recorded to Other operating expense, net which were incurred for consulting, legal, tax and other advisory services associated with the planned spin-off of BD's Diabetes
Care business. (4) The 2021 amount includes a gain of $70 million on a sale-leaseback transaction which was recorded to Other operating expense, net and charges of $18 million recorded to Cost of
products sold related to the estimate of future product remediation costs. The amounts in 2021 and 2020 also include amounts recorded to Other operating expense, net to record product liability reserves, including related legal defense costs, of $65 million and $378 million, respectively.
(5) Represents costs required to develop processes and systems to comply with regulations such as the European Union Medical Device Regulation ("EUMDR") and General Data Protection Regulation ("GDPR").
(6) The amount in 2021 includes unrealized gains recorded within Other (expense) income, net relating to certain investments. The amount in 2020 includes charges recorded in Cost of products sold and Research and development expense to write down the carrying values of certain assets.
Supplemental Non-GAAP ReconciliationReported Diluted EPS to Adjusted Diluted EPS
(Unaudited) 2021 2020 Growth
Foreign
Currency
Translation
Foreign
Currency
Neutral
Growth Growth %
Foreign
Currency
Neutral
Growth %
Reported Diluted Earnings per Share $0.84 $0.36 $0.48 ($0.02) $0.50 133.3% 138.9%
Purchase accounting adjustments ($350 million and $343 million pre-tax, respectively) (1) 1.21 1.17 -
Integration costs ($41 million and $49 million pre-tax, respectively) (2) 0.14 0.17 -
Restructuring costs ($17 million and $26 million pre-tax, respectively) (2) 0.06 0.09 -
Separation and related costs ($19 million pre-tax) (3) 0.07 - -
Transaction gain/loss, product and other litigation-related matters ($13 million and $383
million pre-tax, respectively) (4)
0.05 1.31 -
European regulatory initiative-related costs ($43 million and $29 million pre-tax,
respectively) (5)
0.15 0.10 -
Investment gains/losses and asset impairments ($(46) million and $59 million pre-tax,
respectively) (6)
(0.16) 0.20 -
Impacts of debt extinguishment ($154 million and $1 million pre-tax, respectively) 0.53 - -
Income tax benefit of special items ($(88) million and $(177) million, respectively) (0.30) (0.60) -
Adjusted Diluted Earnings per Share $2.59 $2.79 ($0.20) ($0.02) ($0.18) (7.2%) (6.5%)
42
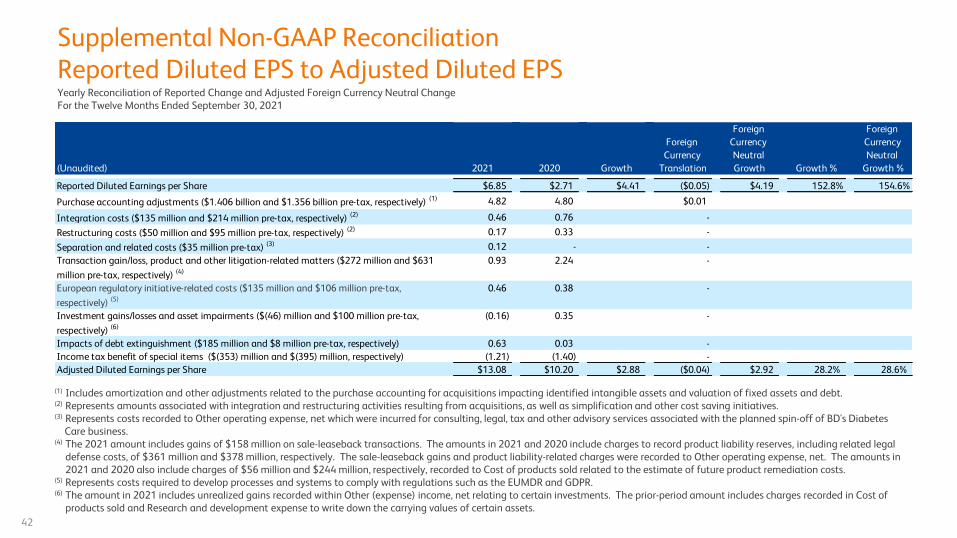
Yearly Reconciliation of Reported Change and Adjusted Foreign Currency Neutral ChangeFor the Twelve Months Ended September 30, 2021
(1) Includes amortization and other adjustments related to the purchase accounting for acquisitions impacting identified intangible assets and valuation of fixed assets and debt.(2) Represents amounts associated with integration and restructuring activities resulting from acquisitions, as well as simplification and other cost saving initiatives.(3) Represents costs recorded to Other operating expense, net which were incurred for consulting, legal, tax and other advisory services associated with the planned spin-off of BD's Diabetes
Care business. (4) The 2021 amount includes gains of $158 million on sale-leaseback transactions. The amounts in 2021 and 2020 include charges to record product liability reserves, including related legal
defense costs, of $361 million and $378 million, respectively. The sale-leaseback gains and product liability-related charges were recorded to Other operating expense, net. The amounts in 2021 and 2020 also include charges of $56 million and $244 million, respectively, recorded to Cost of products sold related to the estimate of future product remediation costs.
(5) Represents costs required to develop processes and systems to comply with regulations such as the EUMDR and GDPR.(6) The amount in 2021 includes unrealized gains recorded within Other (expense) income, net relating to certain investments. The prior-period amount includes charges recorded in Cost of
products sold and Research and development expense to write down the carrying values of certain assets.
Supplemental Non-GAAP ReconciliationReported Diluted EPS to Adjusted Diluted EPS
(Unaudited) 2021 2020 Growth
Foreign
Currency
Translation
Foreign
Currency
Neutral
Growth Growth %
Foreign
Currency
Neutral
Growth %
Reported Diluted Earnings per Share $6.85 $2.71 $4.41 ($0.05) $4.19 152.8% 154.6%
Purchase accounting adjustments ($1.406 billion and $1.356 billion pre-tax, respectively) (1) 4.82 4.80 $0.01
Integration costs ($135 million and $214 million pre-tax, respectively) (2) 0.46 0.76 -
Restructuring costs ($50 million and $95 million pre-tax, respectively) (2) 0.17 0.33 -
Separation and related costs ($35 million pre-tax) (3) 0.12 - -
Transaction gain/loss, product and other litigation-related matters ($272 million and $631
million pre-tax, respectively) (4)
0.93 2.24 -
European regulatory initiative-related costs ($135 million and $106 million pre-tax,
respectively) (5)
0.46 0.38 -
Investment gains/losses and asset impairments ($(46) million and $100 million pre-tax,
respectively) (6)
(0.16) 0.35 -
Impacts of debt extinguishment ($185 million and $8 million pre-tax, respectively) 0.63 0.03 -
Income tax benefit of special items ($(353) million and $(395) million, respectively) (1.21) (1.40) -
Adjusted Diluted Earnings per Share $13.08 $10.20 $2.88 ($0.04) $2.92 28.2% 28.6%
43
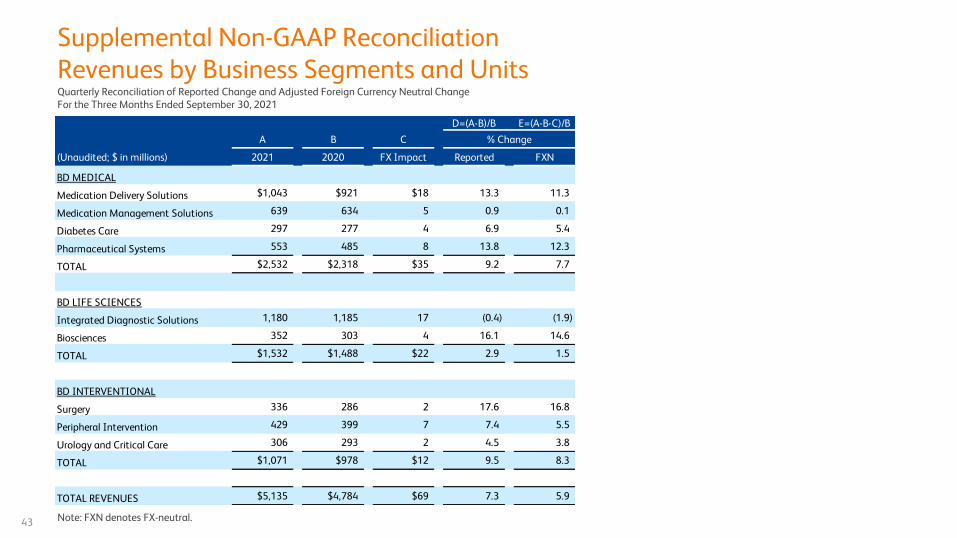
Quarterly Reconciliation of Reported Change and Adjusted Foreign Currency Neutral ChangeFor the Three Months Ended September 30, 2021
Note: FXN denotes FX-neutral.
Supplemental Non-GAAP ReconciliationRevenues by Business Segments and Units
D=(A-B)/B E=(A-B-C)/B
A B C % Change
(Unaudited; $ in millions) 2021 2020 FX Impact Reported FXN
BD MEDICAL
Medication Delivery Solutions $1,043 $921 $18 13.3 11.3
Medication Management Solutions 639 634 5 0.9 0.1
Diabetes Care 297 277 4 6.9 5.4
Pharmaceutical Systems 553 485 8 13.8 12.3
TOTAL $2,532 $2,318 $35 9.2 7.7
BD LIFE SCIENCES
Integrated Diagnostic Solutions 1,180 1,185 17 (0.4) (1.9)
Biosciences 352 303 4 16.1 14.6
TOTAL $1,532 $1,488 $22 2.9 1.5
BD INTERVENTIONAL
Surgery 336 286 2 17.6 16.8
Peripheral Intervention 429 399 7 7.4 5.5
Urology and Critical Care 306 293 2 4.5 3.8
TOTAL $1,071 $978 $12 9.5 8.3
TOTAL REVENUES $5,135 $4,784 $69 7.3 5.9
44
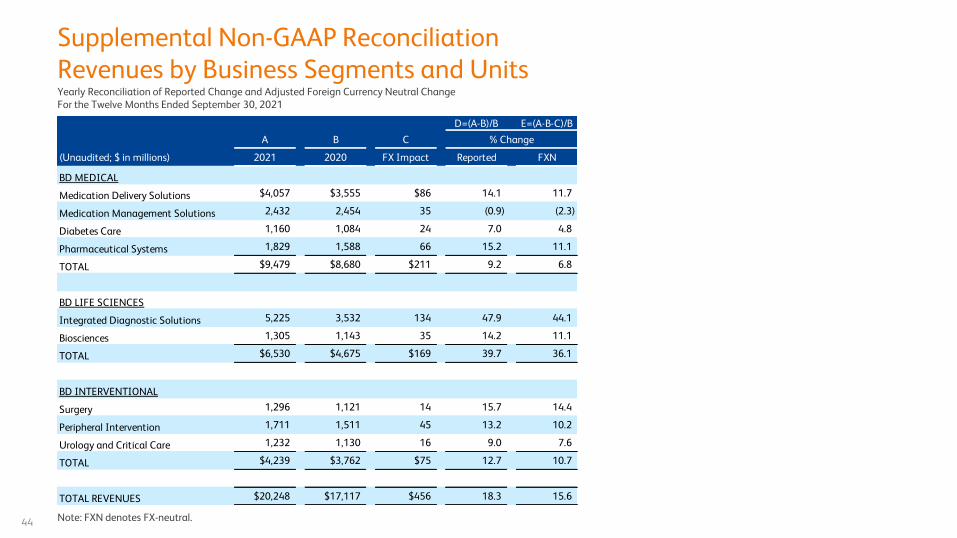
Yearly Reconciliation of Reported Change and Adjusted Foreign Currency Neutral ChangeFor the Twelve Months Ended September 30, 2021
Note: FXN denotes FX-neutral.
Supplemental Non-GAAP ReconciliationRevenues by Business Segments and Units
D=(A-B)/B E=(A-B-C)/B
A B C % Change
(Unaudited; $ in millions) 2021 2020 FX Impact Reported FXN
BD MEDICAL
Medication Delivery Solutions $4,057 $3,555 $86 14.1 11.7
Medication Management Solutions 2,432 2,454 35 (0.9) (2.3)
Diabetes Care 1,160 1,084 24 7.0 4.8
Pharmaceutical Systems 1,829 1,588 66 15.2 11.1
TOTAL $9,479 $8,680 $211 9.2 6.8
BD LIFE SCIENCES
Integrated Diagnostic Solutions 5,225 3,532 134 47.9 44.1
Biosciences 1,305 1,143 35 14.2 11.1
TOTAL $6,530 $4,675 $169 39.7 36.1
BD INTERVENTIONAL
Surgery 1,296 1,121 14 15.7 14.4
Peripheral Intervention 1,711 1,511 45 13.2 10.2
Urology and Critical Care 1,232 1,130 16 9.0 7.6
TOTAL $4,239 $3,762 $75 12.7 10.7
TOTAL REVENUES $20,248 $17,117 $456 18.3 15.6
45
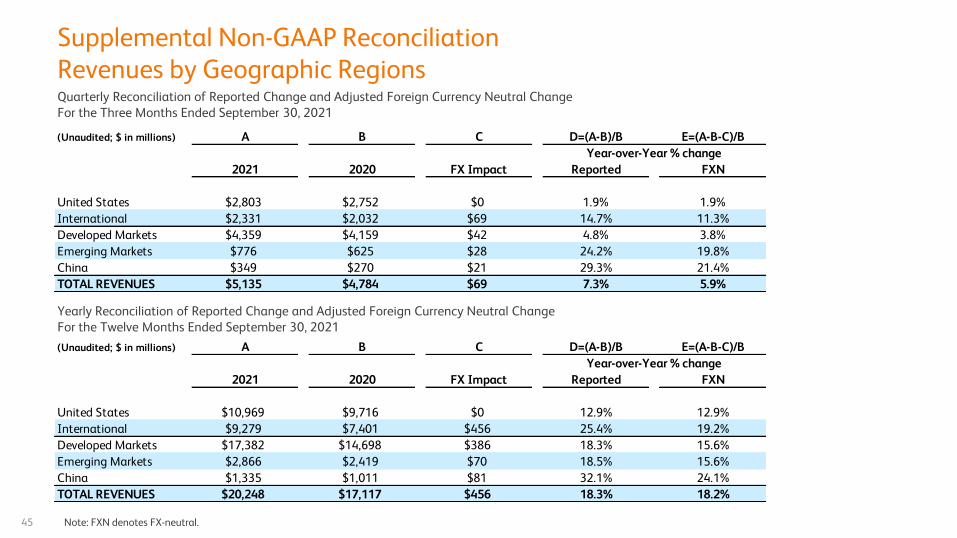
Quarterly Reconciliation of Reported Change and Adjusted Foreign Currency Neutral ChangeFor the Three Months Ended September 30, 2021
Note: FXN denotes FX-neutral.
Yearly Reconciliation of Reported Change and Adjusted Foreign Currency Neutral ChangeFor the Twelve Months Ended September 30, 2021
Supplemental Non-GAAP ReconciliationRevenues by Geographic Regions
(Unaudited; $ in millions) A B C D=(A-B)/B E=(A-B-C)/B
Year-over-Year % change
2021 2020 FX Impact Reported FXN
United States $2,803 $2,752 $0 1.9% 1.9%
International $2,331 $2,032 $69 14.7% 11.3%
Developed Markets $4,359 $4,159 $42 4.8% 3.8%
Emerging Markets $776 $625 $28 24.2% 19.8%
China $349 $270 $21 29.3% 21.4%
TOTAL REVENUES $5,135 $4,784 $69 7.3% 5.9%
(Unaudited; $ in millions) A B C D=(A-B)/B E=(A-B-C)/B
Year-over-Year % change
2021 2020 FX Impact Reported FXN
United States $10,969 $9,716 $0 12.9% 12.9%
International $9,279 $7,401 $456 25.4% 19.2%
Developed Markets $17,382 $14,698 $386 18.3% 15.6%
Emerging Markets $2,866 $2,419 $70 18.5% 15.6%
China $1,335 $1,011 $81 32.1% 24.1%
TOTAL REVENUES $20,248 $17,117 $456 18.3% 18.2%

46
Last Twelve Months Ending September 30, 2021(Unaudited; Amounts in millions)
(1) Primarily represents integration, restructuring and transaction costs associated with acquisitions, as well as simplification and other cost saving initiatives.(2) Represents costs incurred for consulting, legal, tax and other advisory services associated with the planned spinoff of BD's Diabetes Care business.(3) Includes amounts recorded for product liability reserves, including related legal defense costs. It also includes net charges related to the estimate of probable
future product remediation costs and sale-leaseback transactions.(4) Represents costs required to develop processes and systems to comply with emerging regulations such as the EUMDR and GDPR.(5) Represents unrealized gains relating to certain investments.(6) Net Leverage is calculated by dividing Net Debt by Adjusted EBITDA.Amounts may not add due to rounding
Supplemental Non-GAAP ReconciliationNet Income to Adjusted EBITDA and Net Leverage
Reported GAAP net income $2,092
Adjusted for:
Depreciation and amortization expense 2,273
Interest expense 469
Income taxes 150
Share-based compensation 237
Transaction and integration costs pre-tax (1) 135
Restructuring and other costs pre-tax (1)
45
Separation and related costs pre-tax (2) 35
Transaction (gain)/loss, product and other litigation-related matters pre-tax (3)
272
European regulatory initiative-related costs pre-tax (4) 135
Investment (gains)/losses and asset impairments pre-tax (5)
(46)
Impacts of debt extinguishment pre-tax 178
Adjusted EBITDA $5,975
Short-Term Debt 500
Long-Term Debt 17,110
Less: Cash, Cash Equivalents and Short Term Investments (2,295)
Net Debt $15,315
Net Leverage (6)
2.6x
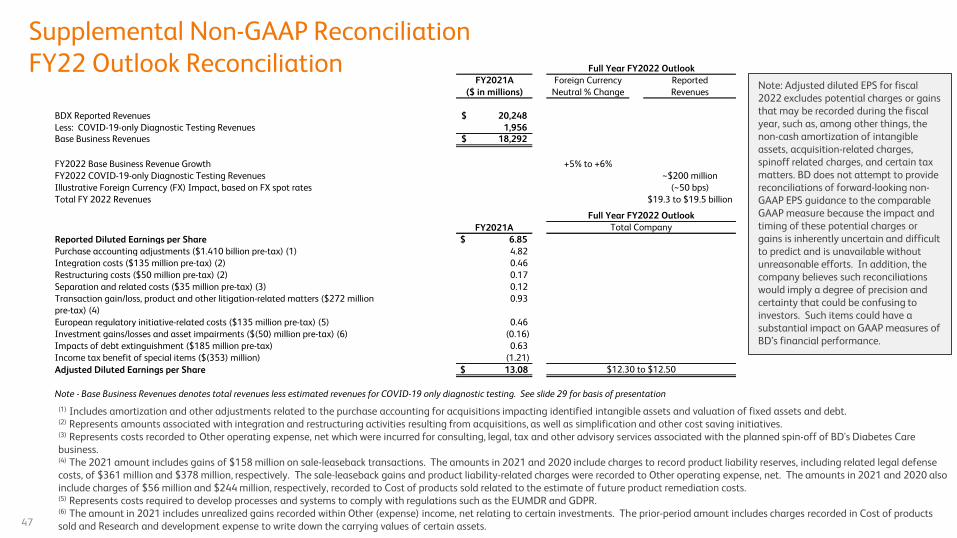
Supplemental Non-GAAP ReconciliationFY22 Outlook Reconciliation
47
Note: Adjusted diluted EPS for fiscal 2022 excludes potential charges or gains that may be recorded during the fiscal year, such as, among other things, the non-cash amortization of intangible assets, acquisition-related charges, spinoff related charges, and certain tax matters. BD does not attempt to provide reconciliations of forward-looking non-GAAP EPS guidance to the comparable GAAP measure because the impact and timing of these potential charges or gains is inherently uncertain and difficult to predict and is unavailable without unreasonable efforts. In addition, the company believes such reconciliations would imply a degree of precision and certainty that could be confusing to investors. Such items could have a substantial impact on GAAP measures of BD’s financial performance.
(1) Includes amortization and other adjustments related to the purchase accounting for acquisitions impacting identified intangible assets and valuation of fixed assets and debt.(2) Represents amounts associated with integration and restructuring activities resulting from acquisitions, as well as simplification and other cost saving initiatives.(3) Represents costs recorded to Other operating expense, net which were incurred for consulting, legal, tax and other advisory services associated with the planned spin-off of BD's Diabetes Care business. (4) The 2021 amount includes gains of $158 million on sale-leaseback transactions. The amounts in 2021 and 2020 include charges to record product liability reserves, including related legal defense costs, of $361 million and $378 million, respectively. The sale-leaseback gains and product liability-related charges were recorded to Other operating expense, net. The amounts in 2021 and 2020 also include charges of $56 million and $244 million, respectively, recorded to Cost of products sold related to the estimate of future product remediation costs.(5) Represents costs required to develop processes and systems to comply with regulations such as the EUMDR and GDPR.(6) The amount in 2021 includes unrealized gains recorded within Other (expense) income, net relating to certain investments. The prior-period amount includes charges recorded in Cost of products sold and Research and development expense to write down the carrying values of certain assets.
FY2021A Foreign Currency Reported($ in millions) Neutral % Change Revenues
BDX Reported Revenues 20,248$ Less: COVID-19-only Diagnostic Testing Revenues 1,956 Base Business Revenues 18,292$
FY2022 Base Business Revenue Growth +5% to +6%FY2022 COVID-19-only Diagnostic Testing Revenues ~$200 millionIllustrative Foreign Currency (FX) Impact, based on FX spot rates (~50 bps)Total FY 2022 Revenues $19.3 to $19.5 billion
FY2021AReported Diluted Earnings per Share $ 6.85 Purchase accounting adjustments ($1.410 billion pre-tax) (1) 4.82 Integration costs ($135 million pre-tax) (2) 0.46 Restructuring costs ($50 million pre-tax) (2) 0.17 Separation and related costs ($35 million pre-tax) (3) 0.12 Transaction gain/loss, product and other litigation-related matters ($272 million pre-tax) (4)
0.93
European regulatory initiative-related costs ($135 million pre-tax) (5) 0.46 Investment gains/losses and asset impairments ($(50) million pre-tax) (6) (0.16)Impacts of debt extinguishment ($185 million pre-tax) 0.63 Income tax benefit of special items ($(353) million) (1.21)
Adjusted Diluted Earnings per Share $ 13.08
Note - Base Business Revenues denotes total revenues less estimated revenues for COVID-19 only diagnostic testing. See slide 29 for basis of presentation
Full Year FY2022 Outlook
Full Year FY2022 Outlook
Total Company
$12.30 to $12.50