tata power financial results q4 fy21
TRANSCRIPT
…Message Box ( Arial, Font size 18 Bold) 1
Tata Power Financial Results
Q4 FY21
12th May 2021

…Message Box ( Arial, Font size 18 Bold) 2
Disclaimer
This document does not constitute or form part of and should not be construed as a prospectus, offering circular or offering memorandum or an offer to sell or issue or the solicitation of an offer to buy or
acquire securities of the Company or any of its subsidiaries or affiliates in any jurisdiction or as an inducement to enter into investment activity. No part of this document, nor the fact of its distribution,
should form the basis of, or be relied on in connection with, any contract or commitment or investment decision whatsoever. This document is not financial, legal, tax or other product advice.
This presentation should not be considered as a recommendation to any investor to subscribe for, or purchase, any securities of the Company and should not be used as a basis for any investment
decision. This document has been prepared by the Company based on information available to them for selected recipients for information purposes only and does not constitute a recommendation
regarding any securities of the Company. The information contained herein has not been independently verified. No representation, warranty or undertaking, express or implied, is made as to, and no
reliance should be placed on, the fairness, accuracy, completeness or correctness of the information or the opinions contained herein. None of the Company or any of its affiliates, advisors or
representatives shall have any liability whatsoever (in negligence or otherwise) for any loss howsoever arising from any use of this document or its contents or otherwise arising in connection with the
document. Furthermore, no person is authorized to give any information or make any representation, which is not contained in, or is inconsistent with, this presentation. Any such extraneous or
inconsistent information or representation, if given or made, should not be relied upon as having been authorized by or on behalf of the Company.
The Company may alter, modify or otherwise change in any manner the contents of this presentation, without obligation to notify any person of such revision or changes. This document is given solely for
your information and for your use and may not be retained by you nor may this document, or any portion thereof, be shared, copied, reproduced or redistributed to any other person in any manner. The
distribution of this presentation in certain jurisdictions may be restricted by law. Accordingly, any person in possession of this presentation should inform themselves about and observe any such
restrictions. By accessing this presentation you acknowledge that you will be solely responsible for your own assessment of the market and the market position of the Company and that you will conduct
your own analysis and be solely responsible for forming your own view of the potential future performance of the business of the Company.
The statements contained in this document speak only as at the date as of which they are made, and the Company expressly disclaims any obligation or undertaking to supplement, amend or disseminate
any updates or revisions to any statements contained herein to reflect any change in events, conditions or circumstances on which any such statements are based. By preparing this presentation, none of
the Company, its management, and their respective advisers undertakes any obligation to provide the recipient with access to any additional information or to update this presentation or any additional
information or to correct any inaccuracies in any such information which may become apparent.
This document has not been and will not be reviewed or approved by a regulatory authority in India or by any stock exchange in India. This document and its contents should not be forwarded, delivered or
transmitted in any manner to any person other than its intended recipient and should not be reproduced in any manner whatsoever.
This presentation is not an offer of securities for sale in the United States. Securities may not be offered or sold in the United States absent registration, or an exemption from registration, under the U.S.
Securities Act of 1933, as amended. Any public offering in the United States may be made only by means of an offering circular that may be obtained from the Company and that will contain detailed
information about the Company and management, as well as financial statements.
This presentation contains forward-looking statements based on the currently held beliefs and assumptions of the management of the Company, which are expressed in good faith and, in their opinion,
reasonable. Forward-looking statements involve known and unknown risks, uncertainties and other factors, which may cause the actual results, financial condition, performance, or achievements of the
Company or industry results, to differ materially from the results, financial condition, performance or achievements expressed or implied by such forward-looking statements. Actual results may differ
materially from these forward-looking statements due to a number of factors, including future changes or developments in the Company’s business, its competitive environment, information, technology
and political, economic, legal and social conditions in India. Given these risks, uncertainties and other factors, recipients of this document are cautioned not to place undue reliance on these forward-
looking statements. In addition to statements which are forward looking by reason of context, the words ‘anticipates’, ‘believes’, ‘estimates’, ‘may’, ‘expects’, ‘plans’, ‘intends’, ‘predicts’, or ‘continue’ and
similar expressions identify forward looking statements.

…Message Box ( Arial, Font size 18 Bold) 3
Content
ESG at Tata
Power
1 32 4
Q4 Highlights
FY 21 Business
Highlights
Financial
Results

…Message Box ( Arial, Font size 18 Bold)
Our ESG Journey
…Message Box ( Arial, Font size 18 Bold)
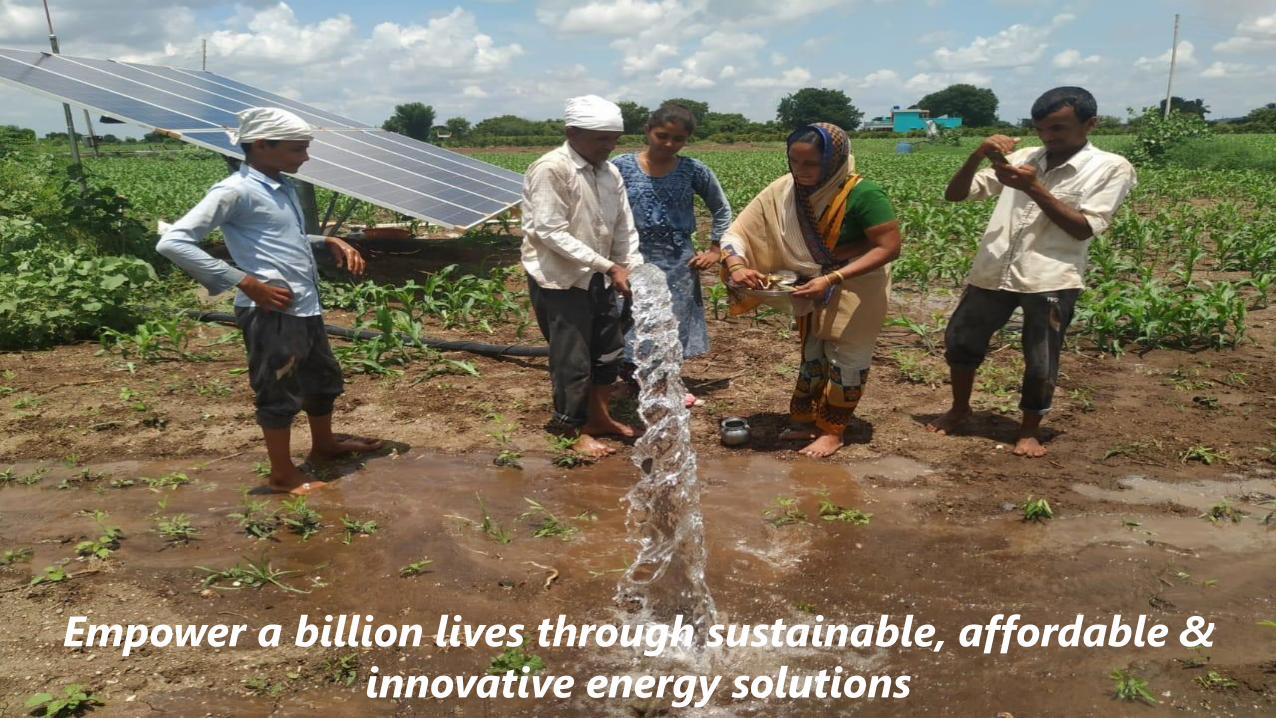
Our ESG JourneyEmpower a billion lives through sustainable, affordable &
innovative energy solutions

…Message Box ( Arial, Font size 18 Bold) 6
Tata Power ESG Aspiration
Carbon Neutrality before 2050
Clean Capacity – 80% by 2030
Customer centric businesses
Utility Benchmark in Water Mgt
Zero Waste to Landfill
Impact directly 30 million lives by 2026
• No new coal based capacity; phase out of existing capacities
• Pursue 2 GW of solar and hybrid capacities annually to grow from 4
GW to 15 GW by 2025 & >25 GW by FY 30
Clean Capacity – Includes wind, solar, hydro and waste heat gas based capacity
• Promote mass adoption of rooftop solar & solar pumps, microgrids,
& home automation
• Lead EV charging infrastructure to spur ecosystem
• Adopt practices to become 100% water neutral by 2026
• New age tech & policies to target 100% water positivity by 2050
• Benchmark waste & fly-ash management (100% utilization)
• Zero waste to landfill – biodegradable waste by 2026
• Train 10,000 trainers to deliver blended training to 4 lac+ youths
• Build capabilities of 25,000+SHGs
• 30% of outreach to affirmative action-based disadvantaged groups

…Message Box ( Arial, Font size 18 Bold) 7
FY 21 ESG Highlights
• Tata Power, has committed to set emission reduction targets in alignment with the SBTi well below 2⁰C
scenario (Published under the Companies taking action category on SBTi website)
India’s Most
Sustainable
Companies 2020
• Published on 15th Mar 2021 - First SDG Roadmap for Power Utilities published by World Business Council
for Sustainable Development (WBCSD)
• Tata Power, the only Indian utility, to co-create the roadmap with 10 other global power companies.
• ‘Best ESG Disclosure’ Award under the ESG Category - Midcap at the IR Society – Investor Relations Awards
2020 held jointly with BSE & KPMG
• GOLD award from Institute of Chartered Accountants of India for “Best Financial Reporting” for FY20
• Tata Power initiated its participation in annual water disclosure campaign of CDP from 2021
• Ranked C (Awareness) with identified action plans to address gaps
• Tata Power ranked 13 out of 200 largest Indian companies by Sustain Labs Paris, France
• Rated A+ on 31 diverse parameters like resource efficiency, social entrepreneurship, financial management,
employee well-being, clean revenue and inclusive supply chains
• Exited Defense business in Oct 2020

8
Title (Myriad Pro, Font size 24)
8
ESG Profile launched: Dedicated ESG information portal
Key Results from dedicated ESG Profile
Identification and prioritization
of ESG factors from the
stakeholder lens
Preparation of ESG profile to
assess company’s current
positioning
Identification of top quick win
ESG communication initiatives
Publishing of ESG profile on
company website providing
easier access to investors
…Message Box ( Arial, Font size 18 Bold) 9
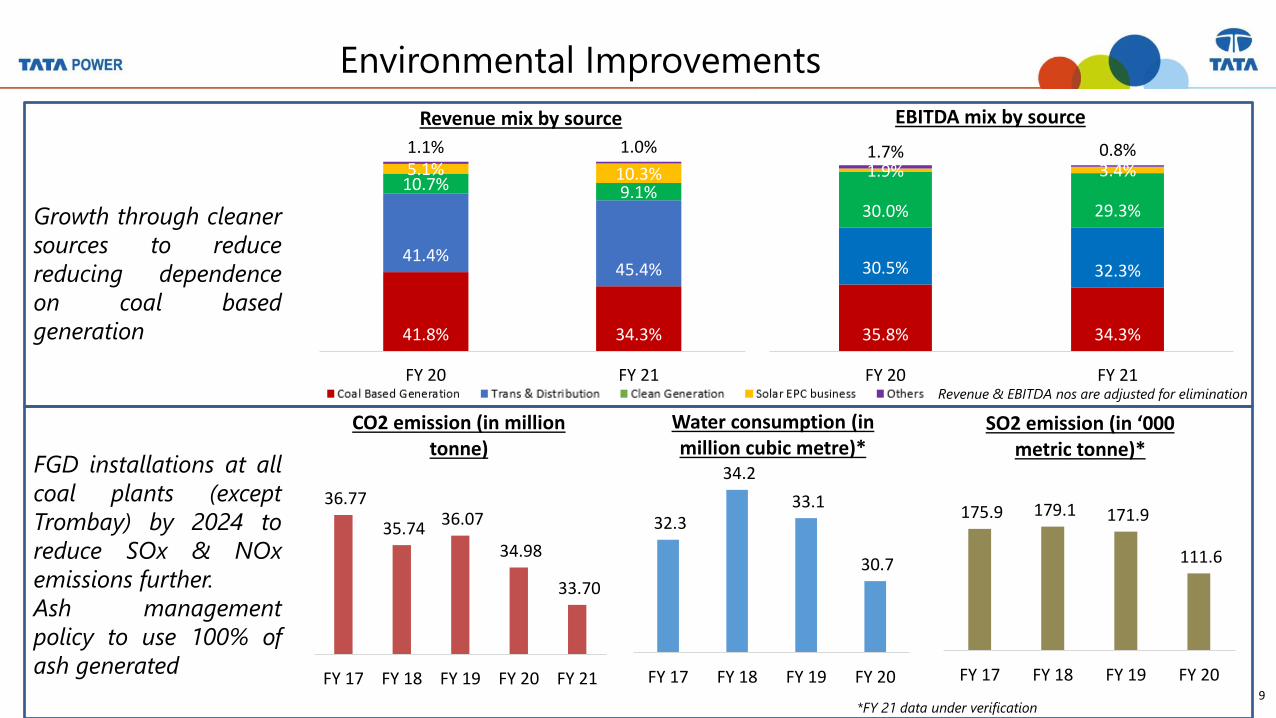
35.8% 34.3%
30.5% 32.3%
30.0% 29.3%
1.9% 3.4%1.7% 0.8%
FY 20 FY 21
EBITDA mix by source
41.8% 34.3%
41.4%45.4%
10.7% 9.1%5.1% 10.3%
1.1% 1.0%
FY 20 FY 21
Revenue mix by source
Environmental Improvements
175.9 179.1 171.9
111.6
FY 17 FY 18 FY 19 FY 20
SO2 emission (in ‘000 metric tonne)*
36.77
35.74 36.07
34.98
33.70
FY 17 FY 18 FY 19 FY 20 FY 21
CO2 emission (in million tonne)
Growth through cleaner
sources to reduce
reducing dependence
on coal based
generation
FGD installations at all
coal plants (except
Trombay) by 2024 to
reduce SOx & NOx
emissions further.
Ash management
policy to use 100% of
ash generated
*FY 21 data under verification
32.3
34.2
33.1
30.7
FY 17 FY 18 FY 19 FY 20
Water consumption (in million cubic metre)*
Revenue & EBITDA nos are adjusted for elimination

…Message Box ( Arial, Font size 18 Bold) 10
CSR Focus Areas & Highlights – FY21
8%4%
39%27%
15%
6%
FY 21 CSR SPEND MIX
Education Livelihood & Skill Building WaterHealth & Sanitation Financial Inclusivity Affirmative Action & Others
Community Welfare
Education | Health & Nutrition
Financial Inclusivity
Community Empowerment
Skills | Livelihoods | Income Generation
Water Security
Water Conservation and Accessibility
13,20,710
16,85,043
30,05,199
Men Benefiaries covered Women Beneficiaries covered Total Beneficiaries
TARGETED OUTREACH TO WOMEN ACROSS ALL CSR INITIATIVES - FY21

Focus on Empowering Women1
05
0
84
1
99
80
11
70
13
41
42
0
12
47
0
15
00
17
66
10
00
14
32
5
DHAAGA ABHA BIJLI DIDI SHG MEMBERS
WOMEN EMPOWERMENT THRU CSR PROGRAMS
FY19 FY20 FY21
IMPROVE EMPLOYEE GENDER DIVERSITY THROUGH
ENABLING, SUPPORTIVE POLICIESWOMEN EMPOWERMENT THRU CSR PROGRAMS
7.6%7.2% 7.0%
7.8%
9.1%
FY 17 FY 18 FY 19 FY 20 FY 21
Gender Diversity - Female Employees as % of total employees
10.0% 9.1%
16.0%
19.7%
22.9%
FY 17 FY 18 FY 19 FY 20 FY 21
Gender Diversity - New Female Joinees as % of total New Employees
Women represent 31% of selected candidates in Campus
Recruitment

…Message Box ( Arial, Font size 18 Bold)
Volunteering FY 21 at a Glance
Inauguration of Smart Class rooms at Delhi
Seed balls making at Mumbai Education Excellence support at MavalVaccination Drive at WREL,Gujarat site
57,257 Volunteering Hrs;
covering 1,380 Activities
Contributed in FY21

…Message Box ( Arial, Font size 18 Bold) 13
COVID-19 Response & Initiatives
Oxygen Support
•Support of 50 Oxygen cylinders provided in Mulshi and Mangaon
•30 OCs to District Administration, Maithon, 5 at Pratapgarh, 6 at Neemuch, 3 at Prayagraj
•1000+ OCs applied for Odisha
•150 - 200 OC WIP procurement via ACT (other locations)
Resilience Kits
•63 Kits with essential aids, including PPE kits, Herbal immunity boosters, filter-based BSM masks for local Public Health Institutions
•525 Home Support Kits Distributed in Maithon and Jojobera kits
•50 Kits donated with sanitizers and masks in Noida
COVID Isolation Centers
•Supported Govt. COVID isolation centre with 100 beds facility in Maharashtra
•20 Isolation beds and medical facility provided through OHC in Prayagraj
•Support provided to arrange beds for COVID positive patients in Mundra
Other Allied Support
• Village sanitization, Awareness drives, vaccination camps in Maithon, Mundra and Ahmednagar
•10000+ Reusable Maskdistribution in Delhi, Trombay, Jojobera
•100+ volunteers supporting tele help lines in Delhi & Odisha
Response Efforts ongoing across states of Maharashtra, Delhi, Gujarat, Madhya Pradesh, Odisha, West
Bengal, Jharkhand, Telangana, Andhra Pradesh, Tamil Nadu, Karnataka, Bihar, Uttar Pradesh, Rajasthan
and Punjab; with support being extended to Public Health Facilities across 63 locations
…Message Box ( Arial, Font size 18 Bold)
FY 21 Business Highlights

…Message Box ( Arial, Font size 18 Bold)
Tata Power – India’s Largest Private Power Distribution
Company

…Message Box ( Arial, Font size 18 Bold) 16
~4x growth in Distribution customers in a year
REACHED 11.7 MLN CUSTOMER BASE WITH ACQUISITION OF 4 LICENSE AREAS IN ODISHA
2.82.6
FY 20 A
4.3 2.0 11.7
WESCO & SOUTHCO
CESU NESCO
CURRENT CUSTOMER
BASE
VISIBILITY OF ₹ 9,500 CRORE CAPEX THRU REGULATORY
ORDERS₹ 10,500 CRORE REVENUE FROM ODISHA LICENSE AREAS
Note: While all capex nos are as approved for 5 year period, TPDDL number is extrapolated
from its FY 21 tariff order and as such the actual regulatory approved capex may changeNote: Revenue of 4 Odisha license is taken for FY 20. Current FY 21 revenue includes
CESU, WESCO & SouthCo for part of the year
11,976
27,000
3,5993,310 1,279
2,469
4,367
FY 20 Actual CESU WESCO SOUTHCO NESCO Balance FY 25 Target
1,336
15,000
844 1,572
5,640
5,607
MO-T MO-D TPDDL 4 Odisha LA Balance 5 Yr Target

…Message Box ( Arial, Font size 18 Bold) 17
TPCODL (CESU) – Green shoots of operational
turnaround
32.50% 30.44%
40.00%
29.54%20%
30%
40%
50%
FY 19 FY 20 Takeover FY 21
AT&C Losses
AT&C LOSSES REDUCED DESPITE COVID 19 FINANCIAL HIGHLIGHTS
FAST TRACK OPERATIONAL RAMP UP & TECHNOLOGY ADOPTION
• 2.32 lac defective meters replaced
• Change management program on safety for employees started
• 24 * 7 Call Centre and 5 Customer Care Centres launched
• Customers connected digitally thru Connect Consumer App
• Sales channel for Energy efficient appliances launched
• Rooftop Solar Portal launched for subsidized installations
Drastic reduction in 33 KV feeder and Power Transformer (PTR) interruptions
3500
980836
Jun'20 Dec'20 Mar'20
33kV Feeder Tripping
388
11
12
Jun'20 Dec'20 Mar'20
33kV PTR Tripping
• ₹ 132 crore capex in FY21; ramp up targeted in FY 22
• Collection efficiency improved to 99% through dedicated
collection programs such as “Gaon Chalo” for on spot
complaint redressal & collections and digital payments
• Collected ₹ 177 crore of past recovery thru above
programs earning incentives of ₹ 18 crore
Note: AT&C Losses for Jun 20 – Mar 21 (under Tata Power operations) is 25.54%

…Message Box ( Arial, Font size 18 Bold)Tata Power Solar – Largest integrated solar EPC company
Tata Power Solar – Largest integrated Solar EPC company
300 MW Pavagada Project

…Message Box ( Arial, Font size 18 Bold) 19
Utility Scale EPC business order book grows with
₹ 2,294 crore new orders in Q4
Solar EPC – Focused business areas showing traction
3,175 2,141 5,119
90
123
208
0
50
100
150
200
1000
2000
3000
4000
5000
6000
7000
FY 19 FY 20 FY 21PA
T (i
n ₹
cr)
Rev
enu
e (i
n ₹
cr)
Revenue PAT
2.4x REVENUE JUMP IN 1 YEAR FUELLED BY ALL
SEGMENTS REGISTERING GROWTH
1
Q4 one of the best quarters for Rooftop with revenue
crossing ₹ 300 crore, order book of ₹ 620 crore as on date2
Revenue in ₹ crs
6,432 solar pumps sold in Q4 – 12,928 pumps
sold in FY 213
2,614 1,337 4,069
FY 19 FY 20 FY 21
307 404 629
FY 19 FY 20 FY 21
Note: Solar Pump revenue includes module sales which is a very small share of above revenue
152 285 367
FY 19 FY 20 FY 21

…Message Box ( Arial, Font size 18 Bold) 20
Healthy Large EPC order win during Q4
LARGE SOLAR EPC ORDER BOOK ORDERING AS WELL AS EXECUTION PICKS UP MOMENTUM
• Ramped up manufacturing of cell from 300
to 530 MW & module from 400 to 580 MW.
• 550 MW EPC orders worth ₹ 2,000 crore with
domestic module requirement
• Module supply tightened due to Chinese
suppliers seeking renegotiations – alternative
supply being evaluated
• Order book expected to be realized over
next 12-18 monthsAbove numbers are excluding GST. With GST order book at ₹ 9,520 crore
CustomerCapacity
(MW)
TPREL 1,314
NTPC 1,100
GIPCL 100
SJVNL 100
GSECL 160
THDC 50
Total Capacity as on 31st Mar 21 2,824
Order Book as on 31st Mar 21
(₹ crore) 8,742

…Message Box ( Arial, Font size 18 Bold) 21
Solar Rooftop – one stop solution for energy & allied
needs
Rooftop Business YoY Growth Installations (MW)
6586
114
175
FY18 FY 19 FY 20 FY 21
Key Achievements
30,000+ total & 15,000+ residential customers
500+ MW installed, ~40% CAGR (FY18-21)
Pan India network of 250+ Channel Partners
Ranked No 1 Solar EPC Player for 7 years in a row
• Pan-India campaign titled ‘SOLAROOF’ “Kamai Badhaye
Dildar Banaye” launched to promote rooftop solar to
conserve energy, save power costs and protect environment
• Customizable solutions created for residentials, MSMEs,
SMEs, Commercial and Industrial
41 KTotal Leads
₹43 croreOrder Value
5 croreDigital Impressions
1.8 LWebsite Visits

…Message Box ( Arial, Font size 18 Bold) 22
Solar Pumps – Consolidating market share
Annual Sales (No of Pumps)
2,2424,506
12,896 12,928
FY18 FY 19 FY 20 FY21
Key Achievements
Key Capabilities & Differentiators
Digital in Rural
TAT reduced by around 50-70%
Over 30,000 Pumps across India
One of the leading players in Solar Pumps
➢ Trusted Brand ➢ Over 30+ years of Manufacturing
➢ Strategic tie-ups with OEMs
➢ Extensive network of 143 trained Channel Partners
➢ Established Supply Chain & Standardized Design
➢ Superior customer service with on-site warranty
➢ Digitization for Operational Excellence
➢ Rural Marketing with Innovative Campaigns
Integrated I&C and BOS modelLocalized SCM with JIT Inventory
Remote app-based InterfaceLowest response and resolution TATs
Rural FairsChaupal MeetsNukkad NataksMarketing Van

…Message Box ( Arial, Font size 18 Bold) 23
India’s largest Microgrid player
Transforming India’s Rural Landscape

…Message Box ( Arial, Font size 18 Bold) 24
Installed - 161 (4.8 MW)Under construction – 40 (1.2 MW)
200 villages covered; 3,887 customers connected
Value added service rolled out for Rural Consumers
(EMI scheme, Energy Efficient Appliances, MFI linkage for C&I consumers)
Mobile App for Consumers of TPRMG & fully automated payment
collection to meter activation system
Before After
Before After
Lighting up Villages
Converting Diesel operated machines to
Electrical operated Machines
Microgrid - Lighting up Lives of Rural Consumers

…Message Box ( Arial, Font size 18 Bold)Tata Power Solar – Largest integrated solar EPC company
Tata Power Solar – At
forefront of the EV wave

…Message Box ( Arial, Font size 18 Bold) 26
Electric Vehicles – The future is here
456 Public Charging Points
102 Cities
27 city pairs on Nat Highways
3,000 Home Chargers
UPTICK IN EV PASSENGER VEHICLE SALES – DRIVEN
BY UTILITY VEHICLES
AROUND 10 NEW LAUNCHES OVER NEXT 2 YEAR TO
SPUR DEMAND
Jaguar I-Pace Tata Altroz EV
Mahindra eKUV100
Volvo XC40 Recharge
Audi e-tron Tesla
80 Ultra High Capacity Bus
Charges in Mumbai & Ahmedabad
Under installation in Jaipur
Prestigious Golden award for
Best Innovation at India Smart
Grid Forum 2021
BEYOND JUST EV CHARGING – GRID TO VEHICLE
2,814 4W PV in FY 20 5,905 4W PV in FY 21
…Message Box ( Arial, Font size 18 Bold)
Q4 Highlights

…Message Box ( Arial, Font size 18 Bold) 28
Covid 19 – Operational impact largely recovered
RENEWABLES – DEVELOPMENT & EPC BUSINESS
➢ Lower availability in CGPL as planned
➢ Prayagraj debtors of ₹ 2,118 crore liquidated thru
PFC/REC disbursals (not included below)
➢ ₹ 77 crore realized from TANGEDCO
➢ AP Discoms cleared 6 months payment @ ₹ 2.44 in April
➢ Solar EPC execution picks up sharply after easing in lockdown
CONVENTIONAL GENERATION (EXCLUDING PRAYAGRAJ)
DISTRIBUTION (EXCLUDING ODISHA)
Operational parameters have been compared to Q4 FY20 and financial parameters have been compared to Q3FY21
➢ Sales (in Mus) has crossed pre-COVID levels with increased industrial activities in large quarter; limited impact seen in April
➢ Regulated nature of business has largely protected returns though Regulatory Assets have marginally gone up due to tariff order impact in TPDDL
➢ Overdue reduced with increased collection of arrears through various schemes and offers in license areas
➢ Distribution capex projects continue to pick up after lockdown was eased
73 72
Q4 FY20 Q4 FY21
Thermal PLF (%)451 390
Q3 FY21 Q4 FY21
Overdue (₹ cr)
341
2,246
Q4 FY20 Q4 FY21
TPSSL EPC Revenue (₹ cr)
931 954
Q3 FY21 Q4 FY21
Discom Overdue (₹ cr)
2,700 3,027
Q4 FY20 Q4 FY21
Sales (MUs)
597 438
Q3 FY21 Q4 FY21
Overdue (₹ cr)
5,937 6,085
Q3 FY21 Q4 FY21
Regulatory Assets (₹ cr)
129 204
Q3 FY21 Q4 FY21
Capex (₹ cr)
…Message Box ( Arial, Font size 18 Bold) 29
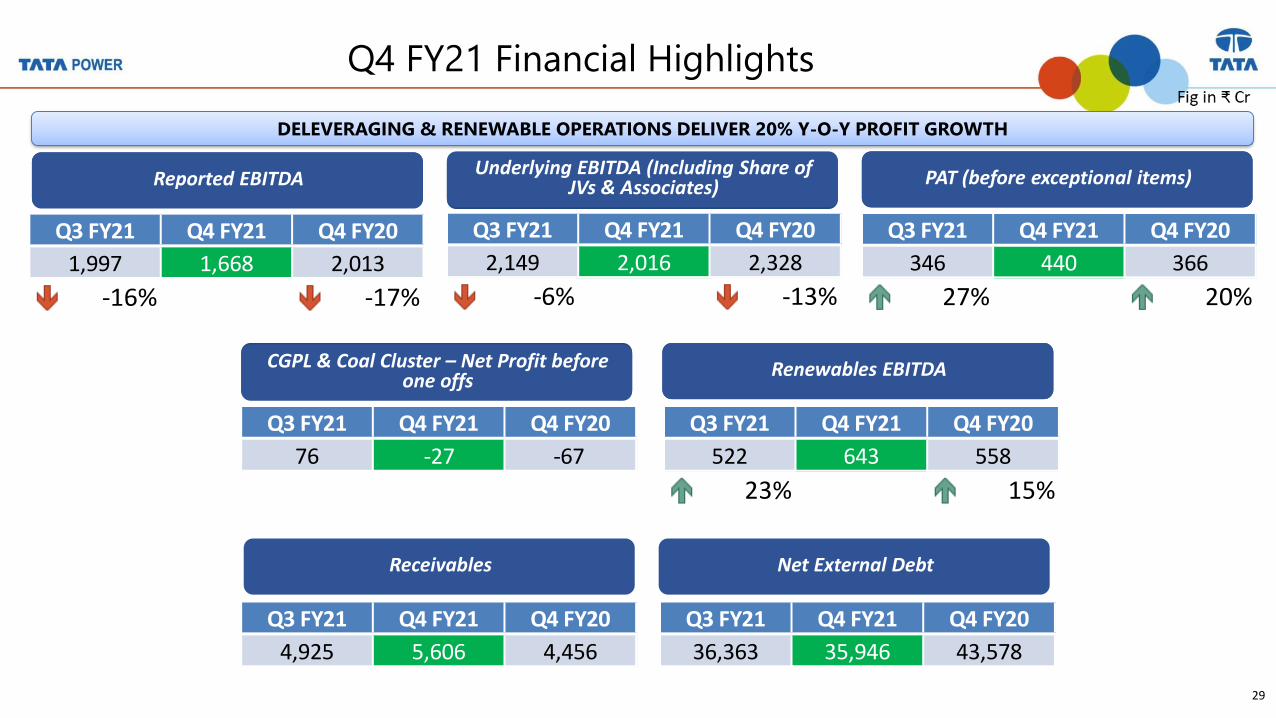
Q4 FY21 Financial Highlights
REPORTED EBITDA Underlying EBITDA (Including Share of JVs & Associated)
Reported PAT (before Discontinued and exceptional items)
Receivables Net External Debt
CGPL & Coal Cluster – Net Profit Renewables EBITDA
DELEVERAGING & RENEWABLE OPERATIONS DELIVER 20% Y-O-Y PROFIT GROWTH
Reported EBITDAUnderlying EBITDA (Including Share of
JVs & Associates) PAT (before exceptional items)
CGPL & Coal Cluster – Net Profit before one offs
Renewables EBITDA
Q3 FY21 Q4 FY21 Q4 FY20
1,997 1,668 2,013
-16% -17%
Q3 FY21 Q4 FY21 Q4 FY20
2,149 2,016 2,328
-6% -13%
Q3 FY21 Q4 FY21 Q4 FY20
346 440 366
27% 20%
Q3 FY21 Q4 FY21 Q4 FY20
76 -27 -67
Q3 FY21 Q4 FY21 Q4 FY20
522 643 558
23% 15%
Q3 FY21 Q4 FY21 Q4 FY20
36,363 35,946 43,578
Q3 FY21 Q4 FY21 Q4 FY20
4,925 5,606 4,456

…Message Box ( Arial, Font size 18 Bold) 30
43,578 36,363 35,946
Q4 FY 20 Q3 FY 21 Q4 FY 21
Net Debt
Balance Sheet made stronger through deleveraging
IMPROVING DEBT PROFILE
Net Debt to Equity 1.42
v 1.99 in Q4 20
Net Debt to Underlying EBITDA
(on rolling 12 month basis)
4.06
v 4.70 in Q4 20
Wtd Avg Finance Costs 7.4%
v 8.3% in Q4 20
EQUITY & DIVESTMENT AIDS DEBT REDUCTION STRONG CASH ACCRUALS FROM BUSINESSES SUSTAIN DEBT
18% reduction in last 1 year

…Message Box ( Arial, Font size 18 Bold) 31
Installed Capacity and Pipeline
CURRENT T&D PORTFOLIO
GENERATION PORTFOLIO ~ 31% CLEAN & GREEN
LARGE SOLAR PROJECT DEVELOPMENT PIPELINE
Hydro
Waste Heat
Recovery /
BFG
Wind Solar
Captive 429 174 255 - 255 - -
Merchant 246 - 246 126 120 - -
PPA/ Fixed Tariff (Bid/ Others) 4,645 4,338 307 307 - - -
PPA/ Fixed Tariff (Renewables) 2,693 - 2,693 - - 932 1,762
Regulated tariff 2,775 2,328 447 447 - - -
Tolling/Fixed Tariff 40 40 -
Total Capacity w/o Platform 10,828 6,880 3,948 880 375 932 1,762
Thermal under Platform - PPA based 1,980 1,980 -
Total Capacity incl Platform 12,808 8,860 3,948 880 375 932 1,762
Business Model Thermal
Clean &
Green
Total
Clean and Green Break-up
MW
Transmission Business Model CKM
Mumbai Transmission Regulated 1,211
Powerlinks (JV) Regulated 2,325
3,536
Distribution Business ModelConsumers
in Million
Mumbai Dist License 0.7
Tata Power Delhi Dist Ltd Dist License 1.8
TP Central Odisha Dist Ltd Dist License 2.8
TP Southern Odisha Dist Ltd Dist License 2.0
TP Western Odisha Dist Ltd Dist License 2.3
TP Northern Odisha Dist Ltd Dist License 2.0
Ajmer Dist Franchisee 0.2
11.7Total
Total
Customer State Capacity (MW)
UPNEDA UP 100
Dholera (GUVNL) Guj 250
Raghanesda (GUVNL) Guj 100
Dholera - II Guj 50
TPC - D Raj 150
GUVNL 500 MW Guj 120
MSEDCL Maha 100
TPC - D (Hybrid) Raj 225
KSEB Raj 110
Solapur - IHCL Maha 10
Solapur - Anand Group Maha 12
Tata Steel Jhar 15
GUVNL Guj 60
Netmagic Maha 13
1,314 Total

…Message Box ( Arial, Font size 18 Bold) 32
Operational Highlights
86.0 87.8
96.6 99.9
69.8
78.1
96.9 98.0 99.9
85.2 85.7
97.9 97.5 99.8
91.6
Thermal (ExPPGCL)
MO - Hydro Wind Solar Prayagraj
Availability
Q4 FY20 Q4 FY21 Q3 FY21
72.7
34.2
13.3
24.2
55.1
72.0
42.5
12.5
23.9
66.0 72.7
31.4
12.9 20.0
65.9
Thermal (ExPPGCL)
MO - Hydro Wind Solar Prayagraj
Plant Load or Capacity Utilization factor
Q4 FY20 Q4 FY21 Q3 FY21
99.9
100.0
99.8
100.0
99.8
100.0
MO -Transmission
Powerlinks
Transmission - Availability
Q4 FY20 Q4 FY21 Q3 FY21
10.1
7.4
3.1
10.2
6.5
0.7
10.0
7.9
1.9
TPADL
TPDDL
MO -Distribution
AT&C Losses - Distribution
Q4 FY20 Q4 FY21 Q3 FY21

…Message Box ( Arial, Font size 18 Bold) 33
Financial Results – Q4 FY21

…Message Box ( Arial, Font size 18 Bold) 34
Consolidated Performance – Q4 FY21
Q4 FY21 Q4 FY20 Q4 FY21 Q4 FY20 Q4 FY21 Q4 FY20
Consolidated before exceptional items 10,255 6,881 1,668 2,013 440 366
Standalone & Key Subsidiaries
Tata Power (Standalone) 1,703 1,653 723 587 115 8
CGPL (Mundra UMPP) 1,653 1,727 38 208 (277) (218)
MPL (Maithon Power)* 561 660 160 188 115 69
TPDDL (Delhi Discom)** 1,896 1,949 252 334 121 104
TPTCL (Power Trading) 31 32 11 12 7 6
Tata Power Solar (Solar Mfg) 2,777 579 185 81 136 51
TPREL Standalone (Renewable Power) 245 245 205 216 5 (8)
WREL (Renewable Power) 313 309 277 269 88 60
Coal SPVs (Investment Companies) 0 0 (1) 105 (49) 41
TERPL (Shipping Co) 193 288 66 102 34 47
TP Central Odisha Dist Ltd (CESU)** 749 - (37) - (30) -
TP Southern Odisha Dist Ltd (SouthCo)** 310 - 25 - 22 -
TP Western Odisha Dist Ltd (WESCO)** 823 - 26 - (1) -
TPIPL (Overseas Investment Co) - - (11) (2) (12) (5)
Others 192 168 39 24 (2) (9)
TOTAL - A 11,446 7,612 1,958 2,123 273 148
Joint Venture and Associates - - - - 348 315
TOTAL - B 11,446 7,612 1,958 2,123 622 462
Eliminations# (1,191) (731) (290) (110) (182) (85)
Exceptional Items - - - - 42 109
Discontinued operations - - - - - (11) TOTAL - C 10,255 6,881 1,668 2,013 481 475
Op Income EBITDA^^ PAT
*TPCL stake-74%; **TPCL stake-51%; ^Tata Projects has been declassified as Asset Held for Sale from Q4FY 20 and PYQ numbers have
therefore been restated# Eliminations include inter-company transactions
^^ including other income
Particulars

…Message Box ( Arial, Font size 18 Bold) 35
Consolidated Performance – FY21
FY 21 FY 20 FY 21 FY 20 FY 21 FY 20
Consolidated before exceptional items 33,079 28,948 7,978 8,317 1,424 1,231
Standalone & Key Subsidiaries
Tata Power (Standalone) 6,480 7,075 3,366 2,853 927 528
CGPL (Mundra UMPP) 6,990 7,018 922 810 (637) (891)
MPL (Maithon Power)* 2,503 2,741 699 893 311 338
TPDDL (Delhi Discom)** 7,627 8,570 1,255 1,324 428 414
TPTCL (Power Trading) 265 192 53 63 33 41
Tata Power Solar (Solar Mfg) 5,119 2,141 330 214 208 123
TPREL Standalone (Renewable Power) 960 917 849 821 21 1
WREL (Renewable Power) 1,189 1,198 1,093 1,092 320 292
Coal SPVs (Investment Companies) 0 0 11 192 (199) (325)
TERPL (Shipping Co) 1,003 1,086 413 395 287 185
TP Central Odisha Dist Ltd (CESU)** 2,886 - 118 - 7 -
TP Southern Odisha Dist Ltd (SouthCo)** 310 - 25 - 22 -
TP Western Odisha Dist Ltd (WESCO)** 823 - 26 - (1) -
TPIPL (Overseas Investment Co) - - 9 25 0 17
Others 768 750 130 170 (31) 8
TOTAL - A 36,923 31,688 9,299 8,854 1,697 732
Joint Venture and Associates - - - - 873 953
TOTAL - B 36,923 31,688 9,299 8,854 2,570 1,684
Eliminations# (3,844) (2,740) (1,321) (537) (1,126) (404)
Exceptional Items - - - - 14 86
Discontinued operations - - - - (20) (49) TOTAL - C 33,079 28,948 7,978 8,317 1,439 1,316
Particulars Op Income EBITDA^^ PAT

…Message Box ( Arial, Font size 18 Bold) 36
Share of JV and Associates
Particulars % Share
Q4
FY21
Q4
FY20
Q4
FY21
Q4
FY20
Q4
FY21
Q4
FY20 FY 21 FY 20 FY 21 FY 20 FY 21 FY 20
Coal Companies (KPC,
BSSR, AGM)
30% /
26% 2,019 1,965 484 377 175 98 7,212 8,152 1,405 1,154 330 434
Coal Infrastructure
Companies (NTP)30% 54 77 87 76 48 29 280 319 286 315 196 192
Powerlinks Trans Ltd 51% 15 16 14 16 15 13 60 47 58 43 52 62
Industrial Energy Ltd 74% 55 58 36 34 21 51 222 223 149 147 83 110
Resurgent Power 26% 243 281 58 65 27 (8) 1,005 281 302 58 100 (20)
Tata Projects ** 48% 2,304 1,432 162 123 46 122 5,823 5,106 427 409 60 146
Others JVs (including
adjustments) 49 14 64 18 17 9 144 80 147 89 53 29
Total- Joint Ventures 4,738 3,843 906 708 348 315 14,746 14,208 2,774 2,215 873 953
** Tata Projects has been declassfied as Asset held for Sale and all previous period numbers have been restated
Op Income EBITDA PAT Op Income EBITDA PAT

…Message Box ( Arial, Font size 18 Bold) 37
Underlying Consolidated EBITDA
Particulars Q4 FY21 Q4 FY20 Qtr Var FY21 FY20 YTD Var
Reported EBITDA 1,668 2,013 (345) 7,978 8,317 (339)
Less: PAT of JV Companies 348 315 34 873 953 (79)
KPC 158 79 79 273 362 (90)
BSSR 17 20 (2) 57 72 (15)
Coal Infra 48 29 19 196 192 4
Powerlinks 15 13 2 52 62 (10)
IEL 21 51 (30) 83 110 (27)
Tata Projects 46 122 (76) 60 146 (86)
Resurgent 27 (8) 35 100 (20) 119
Others 16 9 7 53 28 25
Adjusted Business EBITDA 2,016 2,328 (311) 8,851 9,269 (418)

…Message Box ( Arial, Font size 18 Bold) 38
Tata Power (Consolidated) Financial Performance
Particulars Q4 FY21 Q4 FY20 Qtr Var FY21 FY20 YTD Var Quarter Variance Remarks
Operating Income 10,255 6,881 3,374 33,079 28,948 4,131 Increased project execution in TPSSL and Odisha results included post
acquisition
Operating Expenses 8,682 5,041 (3,641) 25,540 21,194 (4,347) Increase in material cost for TPSSL and Odisha results included
Operating Profit 1,573 1,840 (267) 7,539 7,754 (215)
Other Income 95 173 (78) 439 563 (123) PYQ included gain from hedging of Cennergi receivables
EBITDA 1,668 2,013 (345) 7,978 8,317 (339)
Interest cost 890 1,091 200 4,010 4,494 483 Debt repayments in CGPL and interest rate benefits
Depreciation 663 687 24 2,745 2,634 (111)
PBT before share of JV 114 235 (121) 1,223 1,189 33
Share of profit of Associates
and JV348 315 34 873 953 (79)
Higher Profit in coal companies due to increased coal prices offset by reversal of
deferred tax liabilities on dividend due to change in tax rules in PYQ
PBT after share of JV 463 550 (87) 2,096 2,142 (46)
Tax Expenses 23 173 150 652 862 210 Reversal of deferred tax liabilities created earlier
Net profit before exceptional
& discontinued ops440 377 63 1,444 1,280 164
Discontinued operations
(Defence) Results- (11) 11 (20) (49) 29
Net Profit for the Period
before exceptional 440 366 74 1,424 1,231 193
Exceptional item (net of tax) 42 109 (67) 14 86 (71)
PYQ included gain on sale of Cennergi offset by SED impairment & MAT credit
reversal due to change in tax regime, CYQ includes deferred tax assets created
offset by impairment of SED receivables
Net Profit for the Period * 481 475 7 1,439 1,316 122 * As per line item 13 in the SEBI Advt
…Message Box ( Arial, Font size 18 Bold) 39
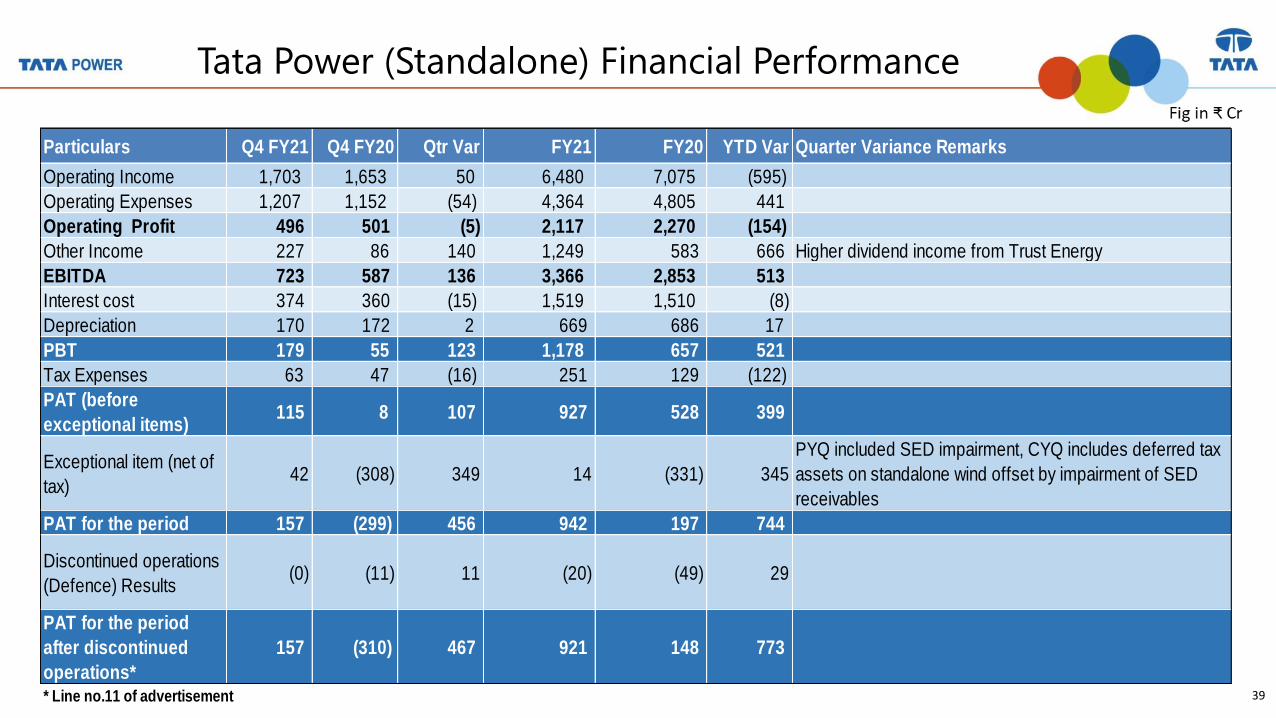
Tata Power (Standalone) Financial Performance
Particulars Q4 FY21 Q4 FY20 Qtr Var FY21 FY20 YTD Var Quarter Variance Remarks
Operating Income 1,703 1,653 50 6,480 7,075 (595)
Operating Expenses 1,207 1,152 (54) 4,364 4,805 441
Operating Profit 496 501 (5) 2,117 2,270 (154)
Other Income 227 86 140 1,249 583 666 Higher dividend income from Trust Energy
EBITDA 723 587 136 3,366 2,853 513
Interest cost 374 360 (15) 1,519 1,510 (8)
Depreciation 170 172 2 669 686 17
PBT 179 55 123 1,178 657 521
Tax Expenses 63 47 (16) 251 129 (122)
PAT (before
exceptional items) 115 8 107 927 528 399
Exceptional item (net of
tax) 42 (308) 349 14 (331) 345
PYQ included SED impairment, CYQ includes deferred tax
assets on standalone wind offset by impairment of SED
receivables
PAT for the period 157 (299) 456 942 197 744
Discontinued operations
(Defence) Results(0) (11) 11 (20) (49) 29
PAT for the period
after discontinued
operations*
157 (310) 467 921 148 773
* Line no.11 of advertisement

…Message Box ( Arial, Font size 18 Bold) 40
CGPL : Key Highlights
Particulars Q4 FY21 Q4 FY20 Variance FY21 FY20 Variance Quarter Variance Remark
Generation (MUs) 6,635 6,566 69 26,572 26,495 76
Sales (MU) 6,134 6,067 67 24,536 24,463 73.1
Availability (%) 79% 81% -3% 80% 80% 0%
PLF (%) 74% 72% 2% 73% 73% 0%
HBA Coal Index 82.7 64.8 (17.9) 62.2 71.7 9.5
FOB price of coal (USD/T) 55.2 46.5 (8.7) 47.6 50.3 2.7
Average GCV of Coal (kcal/kg) 5,477 5,074 404 5,458 5,094 364
Revenue (₹ /Unit) 2.70 2.85 (0.15) 2.85 2.87 (0.02)
FOB Fuel under recovery (₹ /Unit) (0.74) (0.45) (0.28) (0.45) (0.46) 0.01 Increase in coal cost without corresponding
increase in fuel revenue due to time lag in
escalation index setting; to be bridged with the
half-yearly tariff resetting announced from May
Financials
Operating Income 1,653 1,727 (73) 6,990 7,018 (28) Fuel revenue reduced adjusted for prior period
coal price fall
Fuel Expenses 1,509 1,406 (103) 5,656 5,728 72 Increase in coal cost
Other Operating Expenses 117 114 (3) 429 496 67
Operating Profit 27 206 (179) 905 794 111
Other Income 11 2 9 17 16 1
EBITDA 38 208 (170) 922 810 112
Interest & Finance Cost 181 295 113 991 1,179 189 Repayment of long term loans
Depreciation 133 132 (2) 569 521 (48)
PAT (277) (218) (58) (637) (891) 253

…Message Box ( Arial, Font size 18 Bold) 41
Coal Business (KPC): Key highlights
• Due to some of the sale tied up on forward contract basis, there is a lag in increase of FOB prices
compared to HBA price increase which will catch up in coming quarters.
Coal Company - KPC Q4 FY 21 Q3 FY21 Q2 FY21 Q1 FY21 Q4 FY20
Coal Mined (MT) 14.3 15.3 15.0 14.5 14.9
Coal Sold (MT) 14.1 16.0 14.8 14.3 15.0
HBA 82.7 55.5 50.6 58.0 66.6
FOB Revenue (USD/T)* 59.4 43.8 43.8 49.1 53.8
Royalty (USD/T) 8.8 6.1 5.9 6.9 7.5
Net Revenue after royalty (USD/T) 50.7 37.7 37.9 42.1 46.3
Cost of Production (USD/T) 35.6 28.4 31.3 31.9 35.6
COGS ($/T) - Including Inv Movement 34.0 30.6 30.7 32.3 36.3
Gross Profit (USD/T) 16.6 7.1 7.2 9.9 10.0

…Message Box ( Arial, Font size 18 Bold) 42
CGPL and Coal companies – Integrated performance
One-offs: Q4 FY20 – Hedging gain on Cennergi sale proceeds and taxes on dividend
CGPL Q4 FY21 Q4 FY20 Qtr Var FY 21 FY 20 YTD Var
Revenue 1,653 1,727 (74) 6,990 7,018 (28)
EBITDA 38 208 (169) 922 810 112
PAT (277) (218) (58) (637) (891) 253
Coal & Infrastructure Business Q4 FY21 Q4 FY20 Qtr Var FY 21 FY 20 YTD Var
Revenue 2,115 2,156 (41) 7,693 8,877 (1,184)
EBITDA 688 674 14 2,180 2,115 65
PAT 249 227 22 638 505 133
Net PAT (27) 9 (36) 1 (385) 386
Net PAT (w/o one-offs) (27) (67) 40 107 (204) 311

…Message Box ( Arial, Font size 18 Bold) 43
Maithon Power Limited - Highlights
Particulars Q4 FY21 Q4 FY20 Variance FY21 FY20 Variance Quarter Variance Remarks
Generation (MUs) 1,491 1,669 (178) 6,383 6,488 (105)
Sales (MUs) 1,404 1,551 (147) 5,819 6,348 (529)
Availability (%) (Plant) 70% 89% -19% 90% 88% 2% Lower availability due to planned overhauling of 1 unit
PLF % 66% 73% -7% 69% 70% -1%
Financials
Operating Income 561 660 (99) 2,503 2,741 (238) Lower generation due to overhauling
Fuel Costs 304 400 96 1,500 1,576 75
Other Operating expenses 103 76 (27) 322 300 (21) Overhauling costs
Operating profit 154 184 (30) 682 866 (184)
Other Income 6 4 2 17 28 (10)
EBITDA 160 188 (28) 699 893 (195)
Interest cost 28 44 17 136 193 57 Prepayment of loans and lower working capital borrowings
Depreciation 62 61 (1) 246 244 (2)
PBT 71 83 (12) 316 456 (140)
Tax (44) 13 (58) 5 119 (113) Deferred tax liabilities reversal
PAT 115 69 46 311 338 (26)

…Message Box ( Arial, Font size 18 Bold) 44
Tata Power Delhi Distribution Ltd - Highlights
Particulars Q4 FY21 Q4 FY20 Variance FY21 FY20 Variance Quarter Variance Remarks
Purchase (Mus) 1,959 1,793 (166) 8,950 9,752 802
Sales (Mus) 1,847 1,634 213 8,347 9,052 (705)
Revenue Per Unit 9.05 11.31 (2.26) 8.62 9.09 (0.47)
PPC 6.35 7.56 1.21 5.93 6.46 0.53
AT&C losses (%) 6.48% 7.88% 1.39% 6.48% 7.88% 1.39%
Financials
Income from Operation 1,698 1,875 (177) 7,297 8,331 (1,034) Lower power purchase cost, deferred tax recoverable
& tariff order impact
Power Purchase 1,244 1,355 111 5,306 6,300 993
Other Operating Exp. 229 221 (8) 851 832 (19)
Operating Exp. 1,473 1,576 103 6,158 7,132 974
Operating Profit 225 300 (75) 1,139 1,199 (60)
Other Income 27 34 (7) 116 125 (9)
EBITDA 252 334 (82) 1,255 1,324 (69)
Interest/Finance Charge 81 85 4 344 345 1
Depreciation 90 86 (3) 354 333 (21)
PBT 81 162 (81) 558 646 (89)
Tax (40) 58 98 129 232 103 Deferred Tax Asset (reflected in reduction in revenue)
PAT 121 104 17 428 414 14

…Message Box ( Arial, Font size 18 Bold) 45
TP Central Odisha Distribution Ltd (CESU) - Highlights
Key Indicators Jun-20 Q2 FY 21 Q3 FY 21 Q4 FY 21 FY 21
Purchase (Mus) 776 2,437 1,883 1,866 6,961
Sales (Mus) 580 1,750 1,491 1,405 5,226
Revenue per unit 5.01 5.37 5.48 5.10 5.29
Power Cost per unit 2.86 2.85 2.95 3.01 2.92
YTD AT&C losses (%) 41.0% 38.7% 33.9% 29.5% 29.5%
Financials
Income from Operation 268 1,022 846 749 2,886
Power Purchase 222 695 555 562 2,034
Other Operating Exp. 90 255 225 210 780
Operating Exp. 312 951 780 772 2,814
Operating Profit (43) 72 66 (23) 72
Other Income 7 37 16 (14) 46
EBITDA (36) 109 82 (37) 118
Interest/Finance Charge 4 20 21 (12) 33
Depreciation 2 50 46 (23) 76
PBT (43) 39 15 (2) 9
Tax (11) 5 (18) 27 2
PAT (32) 34 34 (30) 7
AS 103 has been discontinued with resultant impact of AT&C losses now being directly reflected in the P&L. All prior period
reversals have been effected in Q4

…Message Box ( Arial, Font size 18 Bold) 46
TP Southern Odisha Dist Ltd (SouthCo) / TP Western
Odisha Dist Ltd (WESCO) – Q4FY 21 Highlights
Key Indicators TPSODL TPWODL
Purchase (Mus) 902 2,013
Sales (Mus) 686 1,562
Revenue per unit 5.03 5.52
Power Cost per unit 2.22 3.48
YTD AT&C losses (%) 32.2% 27.0%
Financials
Income from Operation 310 823
Power Purchase 199 692
Other Operating Exp. 110 134
Operating Exp. 309 826
Operating Profit 1 (3)
Other Income 24 29
EBITDA 25 26
Interest/Finance Charge 5 11
Depreciation 7 16
PBT 13 (1)
Tax (9) (0)
PAT 22 (1)

…Message Box ( Arial, Font size 18 Bold) 47
Tata Power Renewable Energy Ltd (Standalone) –
Highlights
Particulars Q4 FY21 Q4 FY20 Variance FY21 FY20 Variance Quarter Variance Remarks
Capacity - Total (MW) 1,146 1,136 10 1,146 1,136 10
Capacity - Wind (MW) 354 354 - 354 354 -
Capacity - Solar (MW) 791 781 10 791 781 10
Generation (MUs) 569 585 (16) 2,210 2,088 122
Sales (MUs) 561 579 (18) 2,175 2,056 119
Avg PLF (%) - Solar 27% 28% -1% 24% 22% 3%
Avg PLF (%) - Wind 15% 15% 0% 17% 19% -2%
Financials
Operating Income 245 245 (0) 960 917 42
Operating expenses 47 37 (9) 161 133 (28)
Operating profit 198 208 (10) 799 784 14
Other income 7 8 (1) 50 37 14
EBITDA 205 216 (11) 849 821 28
Interest cost 109 126 17 466 479 13 Lower interest rate on borrowings
Depreciation 89 102 13 354 340 (15)
PBT 7 (13) 19 28 2 26
Tax 2 (5) (7) 7 1 (6)
PAT 5 (8) 13 21 1 20
Exceptional Items - (48) 48 - (48) 48 PYQ - MAT Credit reversal on change in tax regime
PAT after Exceptional
Items 5 (56) 61 21 (47) 68
…Message Box ( Arial, Font size 18 Bold) 48
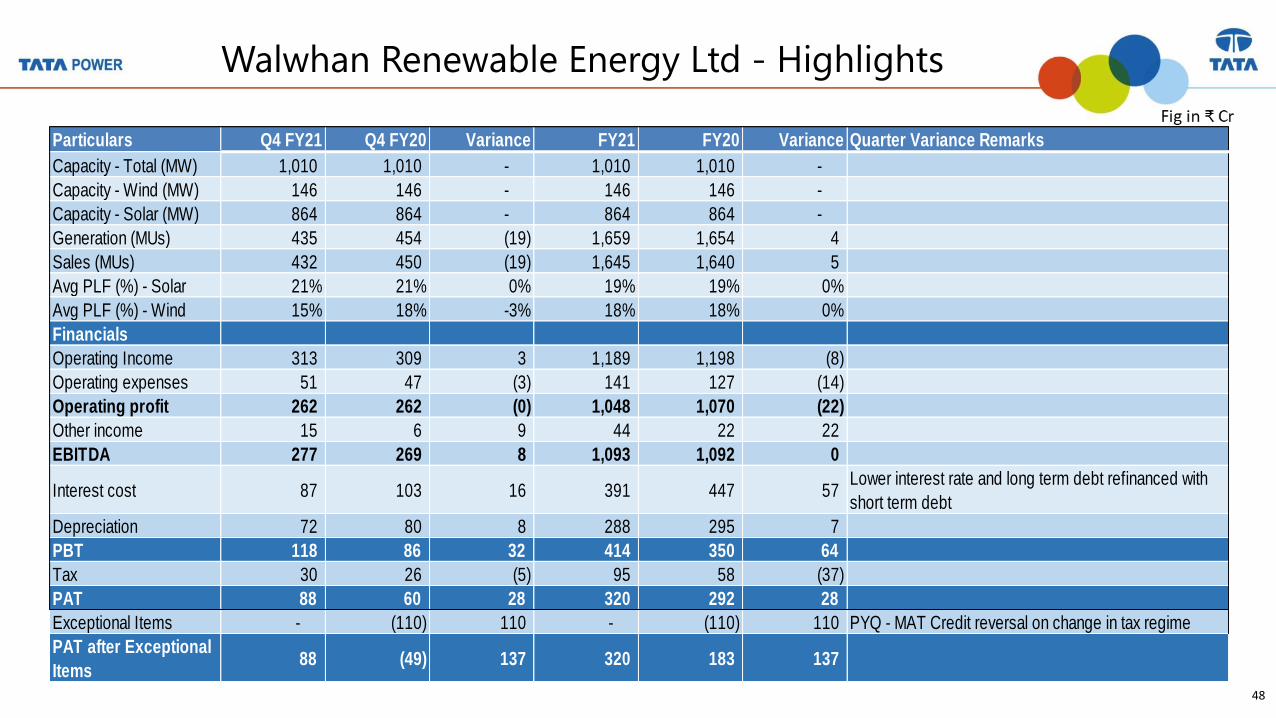
Walwhan Renewable Energy Ltd - Highlights
Particulars Q4 FY21 Q4 FY20 Variance FY21 FY20 Variance Quarter Variance Remarks
Capacity - Total (MW) 1,010 1,010 - 1,010 1,010 -
Capacity - Wind (MW) 146 146 - 146 146 -
Capacity - Solar (MW) 864 864 - 864 864 -
Generation (MUs) 435 454 (19) 1,659 1,654 4
Sales (MUs) 432 450 (19) 1,645 1,640 5
Avg PLF (%) - Solar 21% 21% 0% 19% 19% 0%
Avg PLF (%) - Wind 15% 18% -3% 18% 18% 0%
Financials
Operating Income 313 309 3 1,189 1,198 (8)
Operating expenses 51 47 (3) 141 127 (14)
Operating profit 262 262 (0) 1,048 1,070 (22)
Other income 15 6 9 44 22 22
EBITDA 277 269 8 1,093 1,092 0
Interest cost 87 103 16 391 447 57 Lower interest rate and long term debt refinanced with
short term debt
Depreciation 72 80 8 288 295 7
PBT 118 86 32 414 350 64
Tax 30 26 (5) 95 58 (37)
PAT 88 60 28 320 292 28
Exceptional Items - (110) 110 - (110) 110 PYQ - MAT Credit reversal on change in tax regime
PAT after Exceptional
Items 88 (49) 137 320 183 137

…Message Box ( Arial, Font size 18 Bold) 49
Tata Power Solar Limited – Highlights
Particulars Q4 FY21 Q4 FY20 Variance FY21 FY20 Variance Quarter Variance Remarks
Operating Income 2,777 579 2,198 5,119 2,141 2,978
Operating expenses 2,605 516 (2,089) 4,813 1,952 (2,861)
Operating profit 172 63 109 306 189 117
Other income 13 18 (5) 24 25 (1)
EBITDA 185 81 104 330 214 116
Interest cost 29 7 (22) 81 40 (41) Higher working capital and forex loss due to
rupee depreciation
Depreciation 11 5 (6) 25 18 (7) Additional capitalization from enhancement of
manufacturing capacity
PBT 145 69 76 225 157 68
Tax 8 17 9 16 34 18 Lower taxes due to deferred tax asset creation
PAT 136 51 85 208 123 86

…Message Box ( Arial, Font size 18 Bold) 50
Renewables – Consolidated View for Q4 FY21
Key indicators TPREL^ WRELTPC Wind & Solar
Assets*Others#
Conso Renewables
(without EPC) TPSSL
Conso Renewables
(with EPC) Eliminations
Conso Renewables
(with EPC)
After Elimination
Capacity (MW) 1,146 1,010 379 158 2,693 - 2,693 - 2,693
Revenue 245 313 46 29 633 2,777 3,410 (718) 2,692
EBITDA 205 277 22 18 522 185 707 (64) 643
PAT 5 88 (5) (9) 78 136 215 (40) 175
Net Worth 5,051 2,600 215 179 8,045 623 8,669 (2,110) 6,558
Gross Debt 6,016 4,600 379 813 11,807 974 12,781 (702) 12,079
Net Debt 5,975 4,437 379 783 11,574 834 12,408 (702) 11,706
TPREL standalone *Tata Power standalone # Tata Power Solar (Chirasthayee Solar Ltd), Indorama, Vagarai & Poolavadi
Q4 FY21
Note: Inter company transactions within the Renewables Cluster is adjusted through Eliminations. However, transactions with other Companies in
Tata Power group are not adjusted in the above Elimination but reflected in the Elimination in Consolidated P&L

…Message Box ( Arial, Font size 18 Bold) 51
Renewables – Consolidated View for FY21
Key indicatorsConso Renewables
(without EPC)
Conso Renewables
(with EPC)
After Elimination
Conso Renewables
(without EPC)
Conso Renewables
(with EPC)
After Elimination
Conso Renewables
(without EPC)
Conso Renewables
(with EPC)
After Elimination
Conso Renewables
(without EPC)
Conso Renewables
(with EPC)
After Elimination
Capacity (MW)
Revenue 633 2,692 615 968 2,494 5,888 2,514 3,977
EBITDA 522 643 511 558 2,151 2,352 2,238 2,368
PAT 78 175 21 88 312 447 331 441
Net Worth 8,045 6,558 7,678 6,523 8,045 6,558 7,678 6,523
Gross Debt 11,807 12,079 11,181 11,101 11,807 12,079 11,181 11,101
Net Debt 11,574 11,706 10,860 10,662 11,574 11,706 10,860 10,662
FY21 FY 20Q4 FY 21
2,693 2,6932,630
Q4 FY20
2,630

…Message Box ( Arial, Font size 18 Bold) 52
Regulated - Equity and Assets
Particulars Q4 FY 21 Q3 FY 21 Q2 FY 21 Q1 FY 21 Q4 FY20
Regulated Equity
Mumbai Operation 4,204 4,042 4,023 4,018 3,952
Jojobera 522 522 522 522 522
Tata Power Delhi Distribution (100%) 1,679 1,633 1,624 1,617 1,541
TP Central Odisha Dist Ltd (100%) 300 300 300 300 -
TP Southern Odisha Dist Ltd (100%) 200 - - - -
TP Western Odisha Dist Ltd (100%) 300 - - - -
Maithon Power Limited (100%) 1,440 1,440 1,440 1,440 1,440
Industrial Energy Limited (100%) 716 716 716 716 716
Powerlinks Transmission (100%) 468 468 467 467 467
Total 9,828 9,120 9,091 9,079 8,638
Regulated Assets (As per financial books)
Mumbai Operation 1,738 1,504 1,528 1,434 1,383
Tata Power Delhi Distribution (100%) 5,512 5,515 5,406 5,423 5,222
TP Central Odisha Dist Ltd (100%) 345 155 77 (22) -
TP Southern Odisha Dist Ltd (100%) 48 - - - -
TP Western Odisha Dist Ltd (100%) (61) - - - -
Maithon Power Limited (100%) (227) (209) (181) (155) (135)
Total 7,354 6,966 6,830 6,680 6,470

…Message Box ( Arial, Font size 18 Bold) 53
Leverage Management - Debt Profile
Q3 FY 21 Q4 FY 20
Rupee Forex Total Total
Long term 26,988 3,057 30,045 29,240 32,695
Short term 7,823 613 8,436 9,361 11,844
Current Maturity of LT 4,690 - 4,690 3,853 3,836
Total Debt 39,501 3,670 43,171 42,454 48,376
Less: Cash 6,612 4,498 2,775
Less: Debt against
dividend in Coal SPVs 613 1,593 2,023
Net External Debt 35,946 36,363 43,578
Equity 25,250 24,445 21,898
Net Debt to Equity 1.42 1.49 1.99
Q4 FY 21
CONSOLIDATEDPARTICULARS

…Message Box ( Arial, Font size 18 Bold) 54
Debt Profile
31st March
2021
31st Dec
2020
Mar / (Inc) -
3 months
31st March
2020
Mar / (Inc) -
12 months
CGPL 4,055 4,079 24 8,797 4,742
Coal SPVs 3,670 3,982 312 5,162 1,492
TPDDL 3,326 3,154 (172) 3,451 124
WREL 4,600 4,478 (122) 5,119 519 Working capital loans
TPREL 5,229 4,551 (678) 5,291 62 Loan drawndown for capex
TPSSL 464 299 (165) 0 (464) Working capital loans
Maithon 1,778 2,230 452 2,074 295 Repayment of long term loans
Odisha DISCOMs 343 90 (253) - (343) New License areas taken over
TATA Power 19,630 19,480 (150) 17,696 (1,933)
Others 75 111 35 787 712
Total Debt 43,171 42,454 (717) 48,376 5,205
Total Gross Debt (LT + ST)
Company Quarterly movement Remarks

…Message Box ( Arial, Font size 18 Bold) 55
Latest Tata Power resources uploaded on website
55
Sr. No. Resources Link
1. Tata Power ESG Profile https://esg.churchgatepartners.com/login/CompanyProfile?id=310038003100240024004100530048004F004B0041004E0041004E00590041004100560041004E004900410053004800570049004E00490024002400
2. Sustainability disclosure page https://www.tatapower.com/sustainability/disclosures/iirc-alignment.aspx
3. IIFL- Fireside chat- Tata Power Solar EPC
https://youtu.be/tillBD5HtFE
4. DAM capital EV conference video https://www.youtube.com/embed/23Loh8RO-uA?rel=0
5. DAM capital EV conference PPT https://www.tatapower.com/pdf/investor-relations/dam-capital-ev-conference-mar2021.pdf
6. Edelweiss ESG CXO e series PPT https://www.tatapower.com/pdf/investor-relations/edelweiss-esg-conference-mar2021.pdf
7. Edelweiss ESG CXO e series Video https://www.youtube.com/watch?v=m1Qplxtw8E4

…Message Box ( Arial, Font size 18 Bold) 56
Thank You!Website: www.tatapower.com
Investor Relations Team:
Mr. Soundararajan Kasturi
Chief – Treasury & Investor Relations
Email: [email protected]
M: +91 82912 04022
Mr. Rahul Shah
Head – Investor Relations
Email: [email protected]
M: +91 91370 34304