beaumont middle school name: 8th grade, 2015-2016 advanced algebra...
TRANSCRIPT
Name: ________________________
Beaumont Middle School 8th Grade, 2015-2016 Advanced Algebra I
I can model a life situation with a graph.
I can distinguish between a function and a relation.
I can represent ordered pairs as a list, a map, a table, and a graph.
I can identify the domain and range.
I can evaluate an equation utilizing function notation.
~~ Unit 3a, Page 2 ~~
Graphs to Model Real-Life Situations
This assignment will be completed in class as an activity for more than one day.
A. CHOOSE THE CORRECT GRAPH THAT DEPICTS THE SITUATION.
1. _____ Train Station 2. ______ Ferris Wheel 3. ______ Hill Climbing
4. _____ Child Swinging 5. _____ Child on Slide
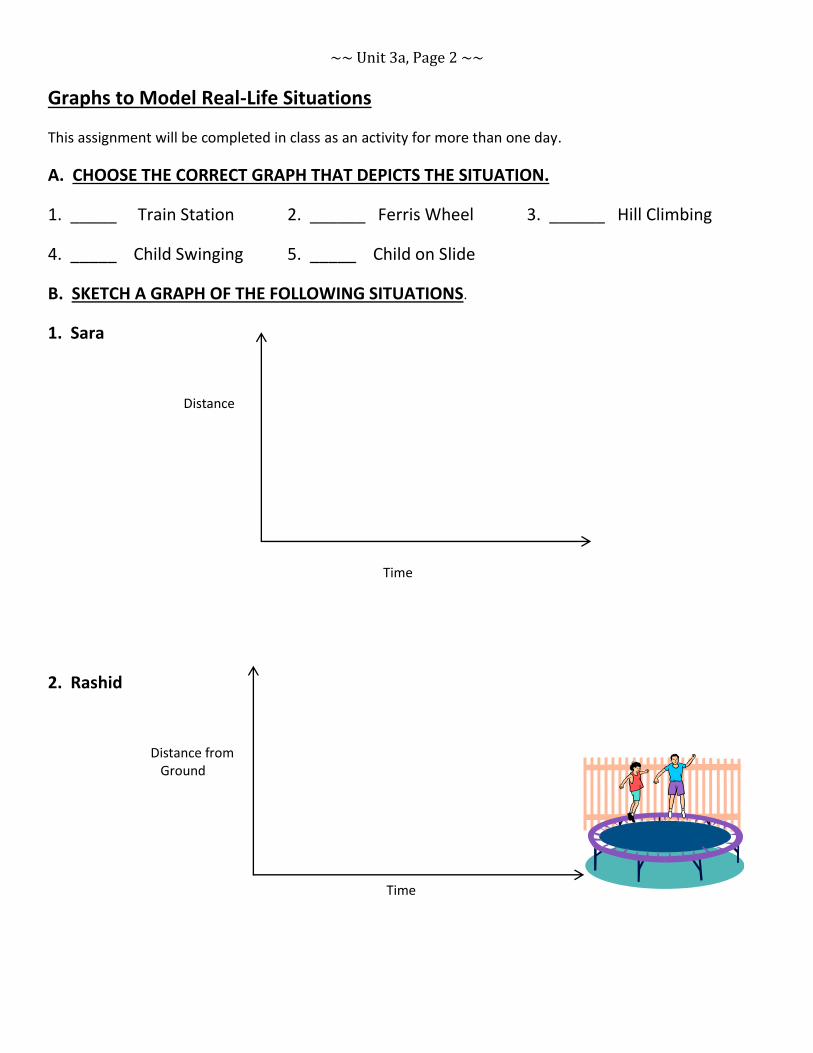
B. SKETCH A GRAPH OF THE FOLLOWING SITUATIONS.
1. Sara
Distance
Time
2. Rashid
Distance from Ground
Time
~~ Unit 3a, Page 3 ~~
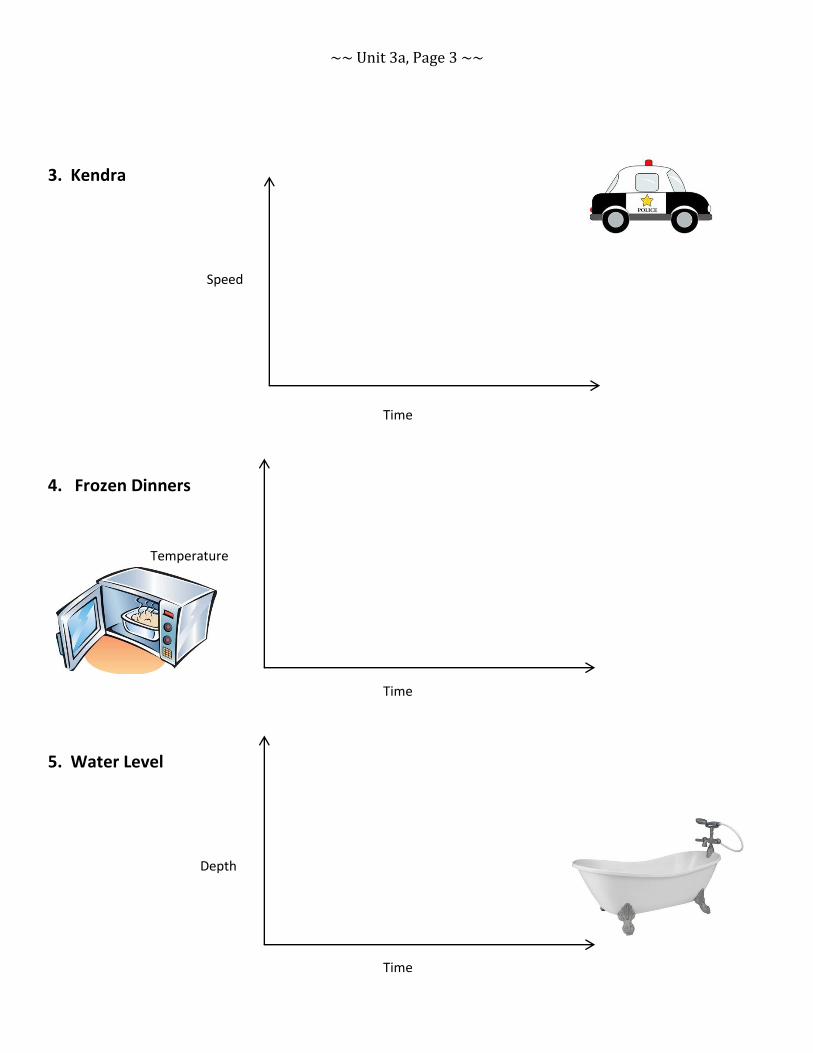
3. Kendra
Speed
Time
4. Frozen Dinners
Temperature
Time
5. Water Level
Depth
Time

~~ Unit 3a, Page 4 ~~
C. SKETCH A GRAPH OF THE ACTION IN EACH MOVIE CLIP.
1. Sully
Distance from door Time
2. Dash Speed Time
3. Wesley Height of Wesley’s feet from the ground Time
~~ Unit 3a, Page 5 ~~
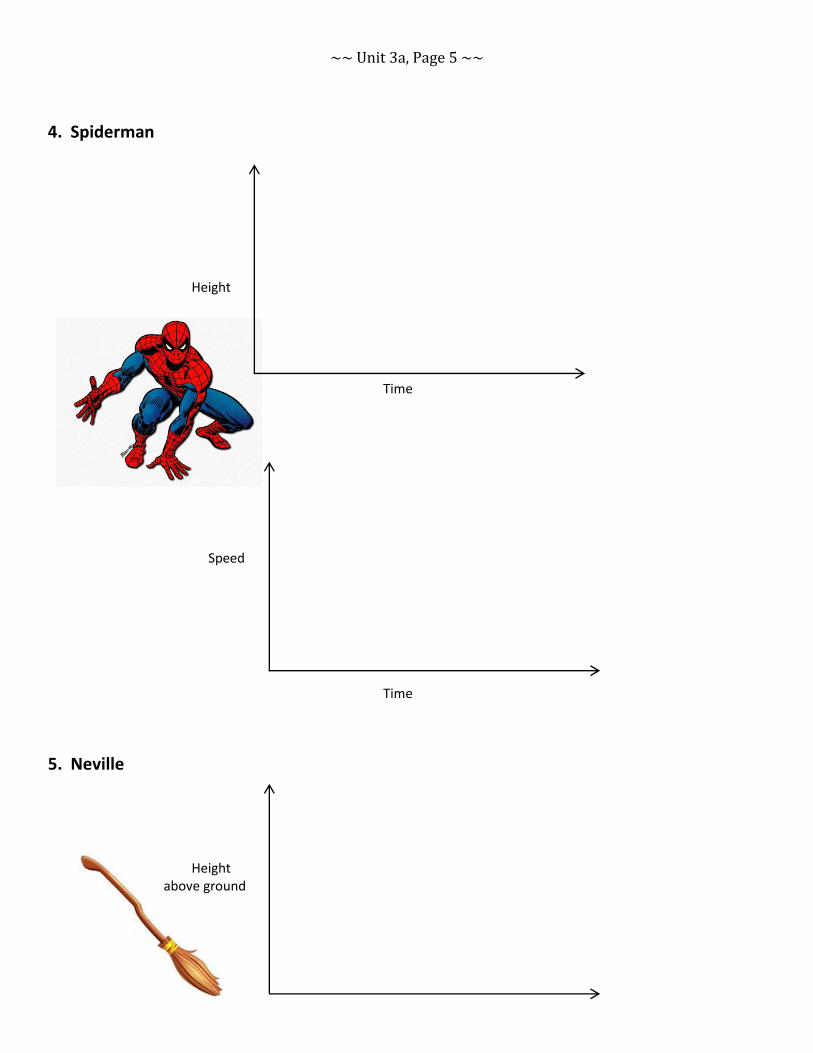
4. Spiderman
Height
Time
Speed
Time
5. Neville
Height above ground
~~ Unit 3a, Page 6 ~~ Time
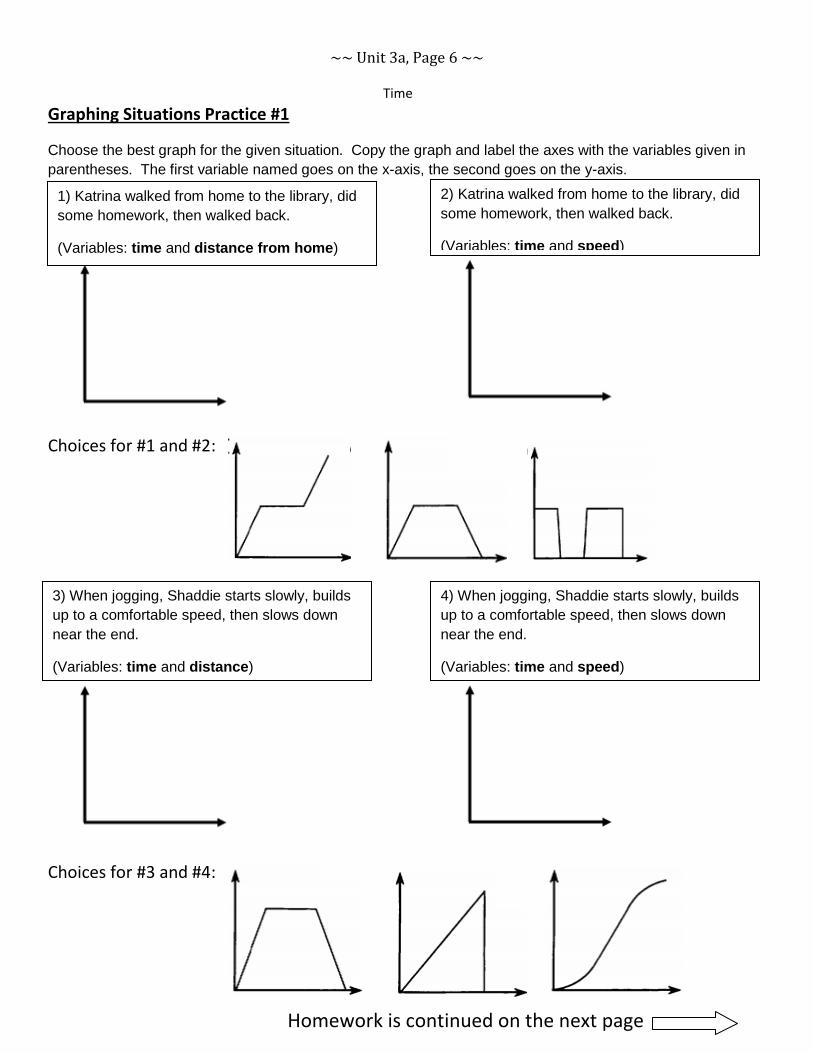
Graphing Situations Practice #1
Choose the best graph for the given situation. Copy the graph and label the axes with the variables given in
parentheses. The first variable named goes on the x-axis, the second goes on the y-axis.
Choices for #1 and #2:
Choices for #3 and #4:
1) Katrina walked from home to the library, did
some homework, then walked back.
(Variables: time and distance from home)
2) Katrina walked from home to the library, did
some homework, then walked back.
(Variables: time and speed)
3) When jogging, Shaddie starts slowly, builds
up to a comfortable speed, then slows down
near the end.
(Variables: time and distance)
4) When jogging, Shaddie starts slowly, builds
up to a comfortable speed, then slows down
near the end.
(Variables: time and speed)
Homework is continued on the next page
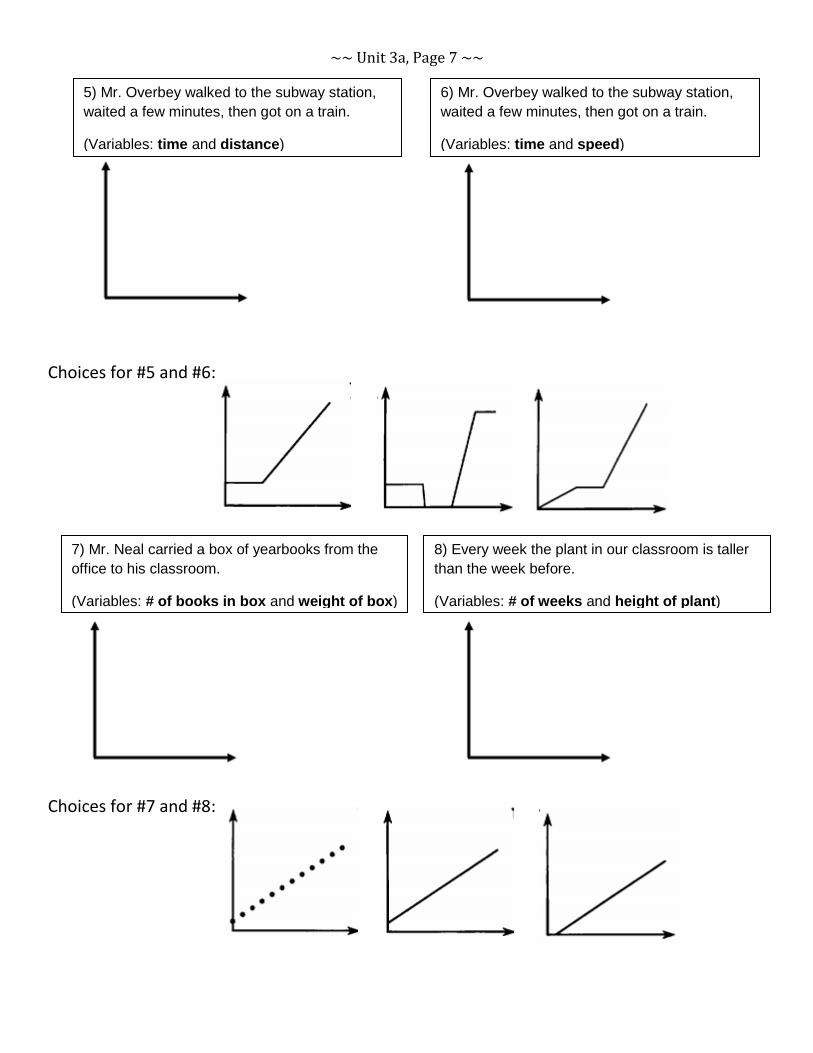
~~ Unit 3a, Page 7 ~~
Choices for #5 and #6:
Choices for #7 and #8:
5) Mr. Overbey walked to the subway station,
waited a few minutes, then got on a train.
(Variables: time and distance)
6) Mr. Overbey walked to the subway station,
waited a few minutes, then got on a train.
(Variables: time and speed)
7) Mr. Neal carried a box of yearbooks from the
office to his classroom.
(Variables: # of books in box and weight of box)
8) Every week the plant in our classroom is taller
than the week before.
(Variables: # of weeks and height of plant)

~~ Unit 3a, Page 8 ~~
Graphing Situations Practice #2
Choose the best graph for the given situation. Copy the graph and label the axes with the variables given in
parentheses. The first variable named goes on the x-axis, the second goes on the y-axis.
Choices for #1 and #2:
Choices for #3 and #4:
1) Each month the baby hippo weighed twice
as much as it had weighed the month before.
(Variables: time and weight)
2) Each hour there was half as much medication in
the blood as there had been an hour before.
(Variables: time and medication)
3) Erica walked from home to a friend's house,
watched TV for a while, then walked back home.
(Variables: time and Erica's distance from
home)
4) Erica walked from home to a friend's house,
watched TV for a while, then walked back home.
(Variables: time and Erica's speed)
Homework is continued on the next page

~~ Unit 3a, Page 9 ~~
Choices for #5 and #6:
Choices for #7 and #8:
5) As our subway train leaves Station A, it
accelerates to top speed, then maintains this
speed until it begins to slow down and finally
stops at Station B.
(Variables: time and distance from Station A)
6) As our subway train leaves Station A, it
accelerates to top speed, then maintains this
speed until it begins to slow down and finally
stops at Station B.
(Variables: time and speed from Station A)
Homework is continued on the next page
7) A backpacker hikes toward a campsite at a
steady rate until he stops for a while to rest.
Then he continues at the original rate until he
stops at the campsite.
(Variables: time and distance from campsite)
8) A backpacker hikes toward a campsite at a
steady rate until he stops for a while to rest.
Then he continues at the original rate until he
stops at the campsite.
(Variables: time and speed)
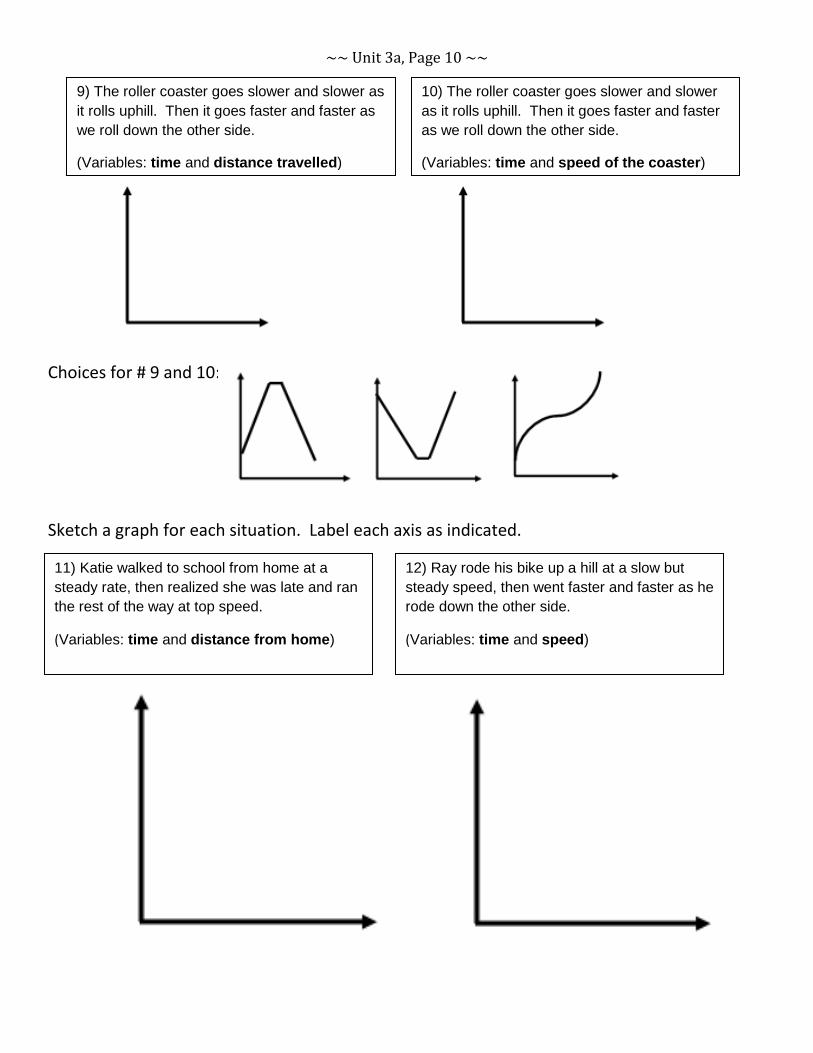
~~ Unit 3a, Page 10 ~~
Choices for # 9 and 10:
Sketch a graph for each situation. Label each axis as indicated.
9) The roller coaster goes slower and slower as
it rolls uphill. Then it goes faster and faster as
we roll down the other side.
(Variables: time and distance travelled)
10) The roller coaster goes slower and slower
as it rolls uphill. Then it goes faster and faster
as we roll down the other side.
(Variables: time and speed of the coaster)
11) Katie walked to school from home at a
steady rate, then realized she was late and ran
the rest of the way at top speed.
(Variables: time and distance from home)
12) Ray rode his bike up a hill at a slow but
steady speed, then went faster and faster as he
rode down the other side.
(Variables: time and speed)
~~ Unit 3a, Page 11 ~~
~~ Unit 3a, Page 12 ~~
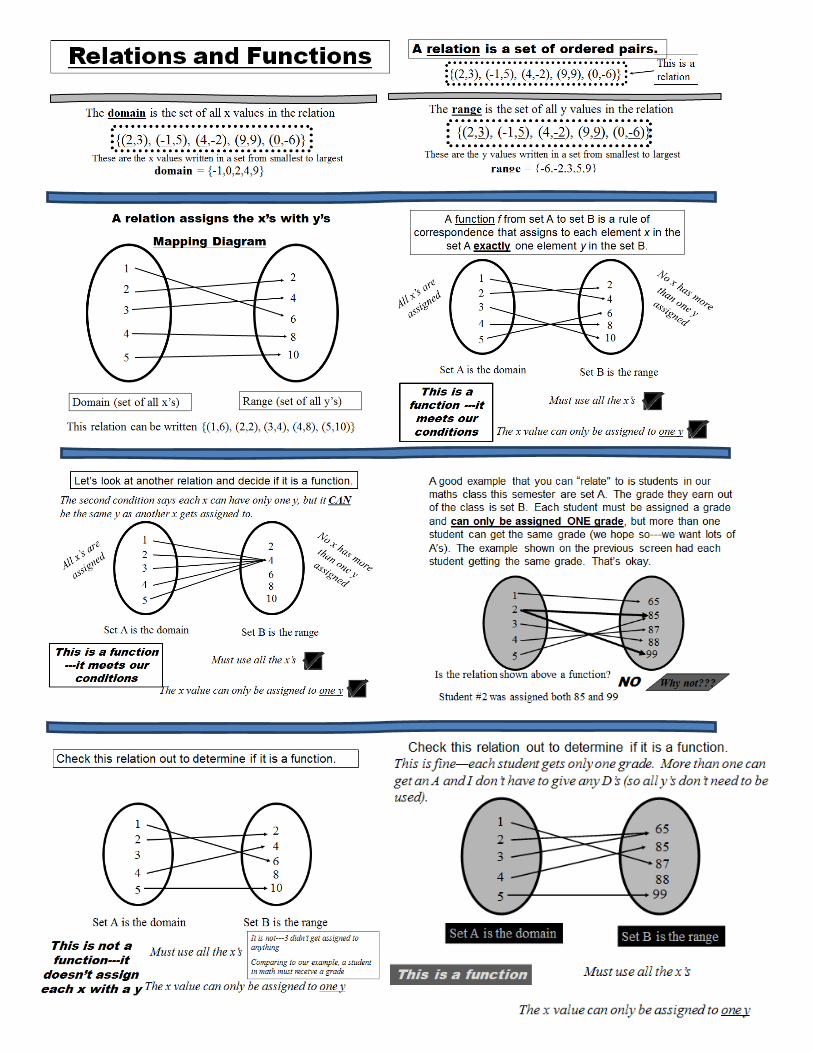
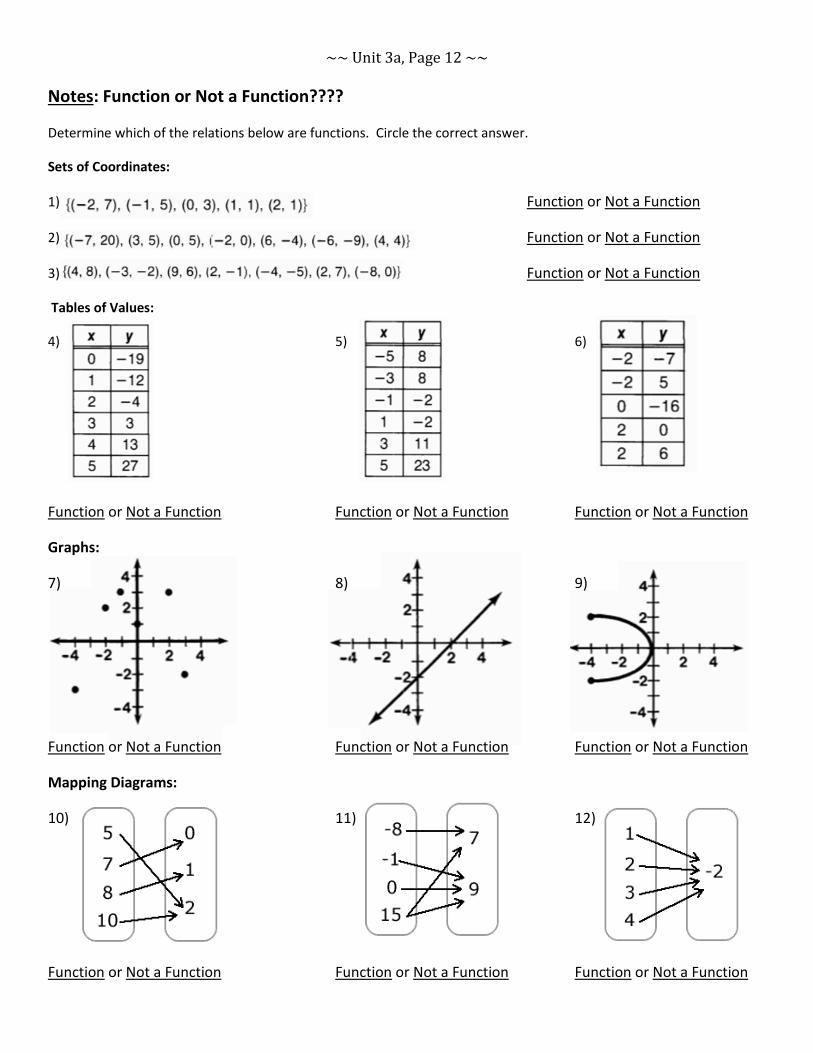
Notes: Function or Not a Function????
Determine which of the relations below are functions. Circle the correct answer.
Sets of Coordinates:
1) Function or Not a Function
2) Function or Not a Function
3) Function or Not a Function
Tables of Values:
4) 5) 6)
Function or Not a Function Function or Not a Function Function or Not a Function
Graphs:
7) 8) 9)
Function or Not a Function Function or Not a Function Function or Not a Function
Mapping Diagrams:
10) 11) 12)
Function or Not a Function Function or Not a Function Function or Not a Function
~~ Unit 3a, Page 13 ~~
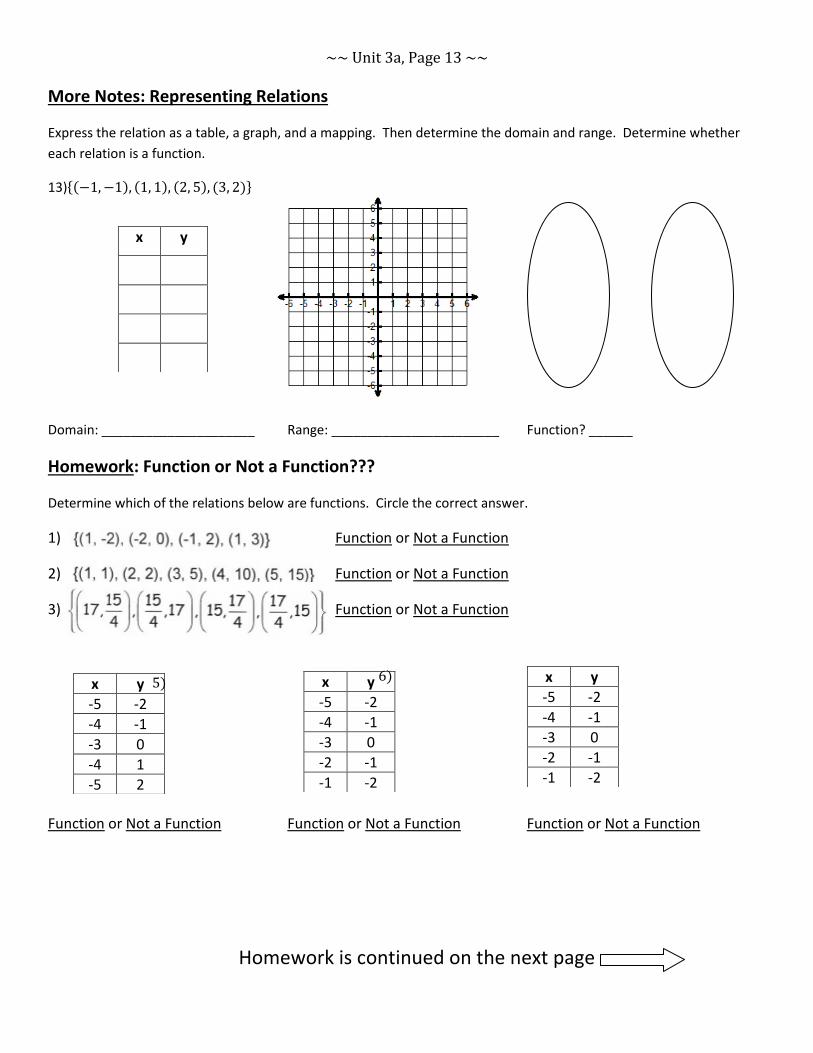
More Notes: Representing Relations
Express the relation as a table, a graph, and a mapping. Then determine the domain and range. Determine whether
each relation is a function.
13)
Domain: _____________________ Range: _______________________ Function? ______
Homework: Function or Not a Function???
Determine which of the relations below are functions. Circle the correct answer.
1) Function or Not a Function
2) Function or Not a Function
3) Function or Not a Function
Function or Not a Function Function or Not a Function Function or Not a Function
x y
x y
-5 -2
-4 -1
-3 0
-2 -1
-1 -2
x y
-5 -2
-4 -1
-3 0
-4 1
-5 2
x y
-5 -2
-4 -1
-3 0
-2 -1
-1 -2
6) 4) 5)
Homework is continued on the next page
~~ Unit 3a, Page 14 ~~
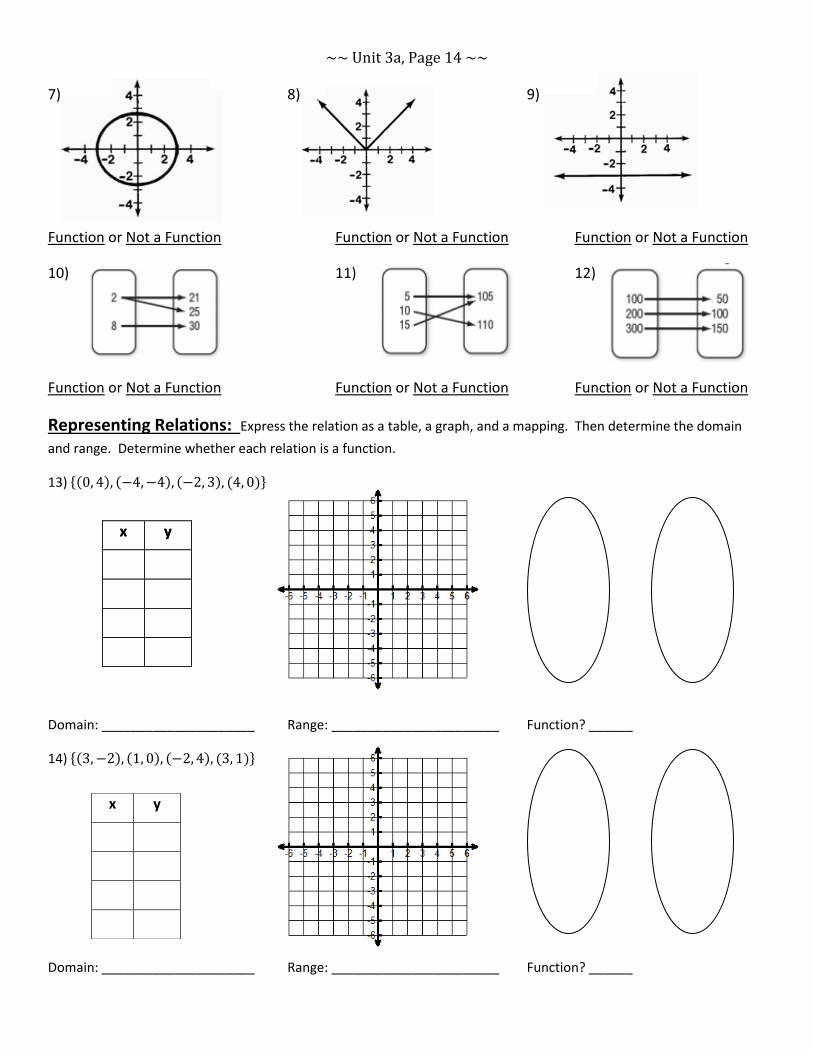
7) 8) 9)
Function or Not a Function Function or Not a Function Function or Not a Function
10) 11) 12)
Function or Not a Function Function or Not a Function Function or Not a Function
Representing Relations: Express the relation as a table, a graph, and a mapping. Then determine the domain
and range. Determine whether each relation is a function.
13)
Domain: _____________________ Range: _______________________ Function? ______
14)
Domain: _____________________ Range: _______________________ Function? ______
x y
x y
x y
~~ Unit 3a, Page 15 ~~
~~ Unit 3a, Page 16 ~~
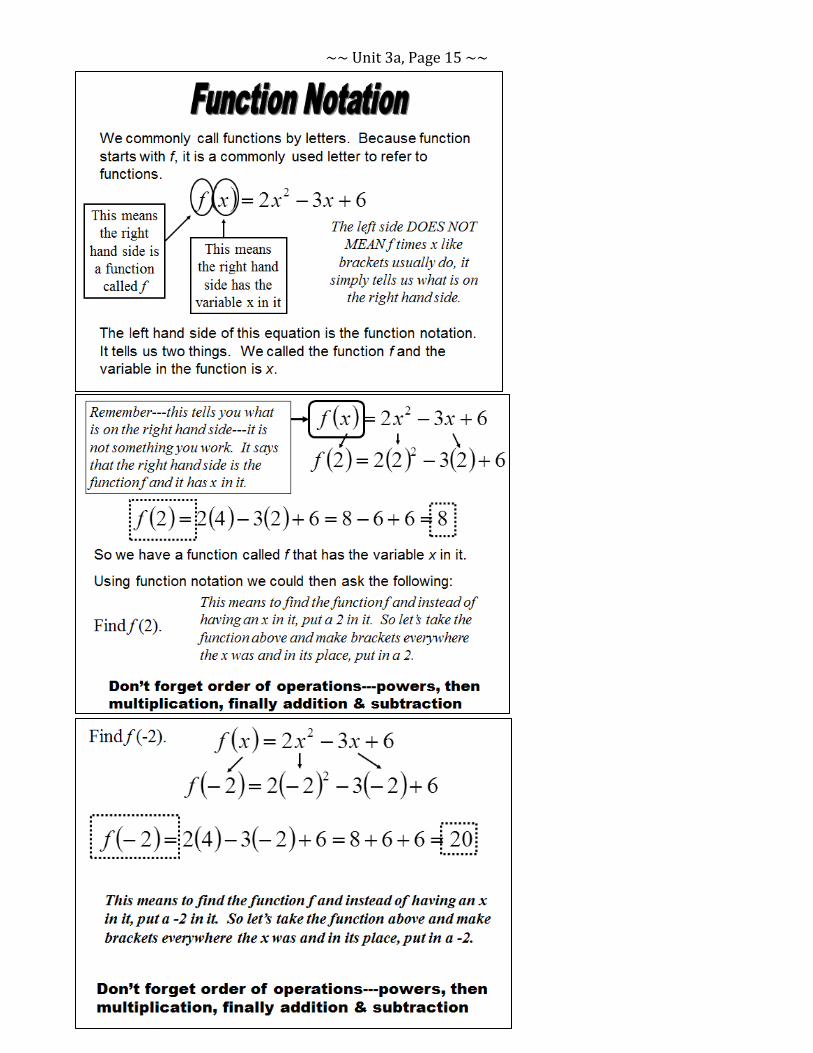
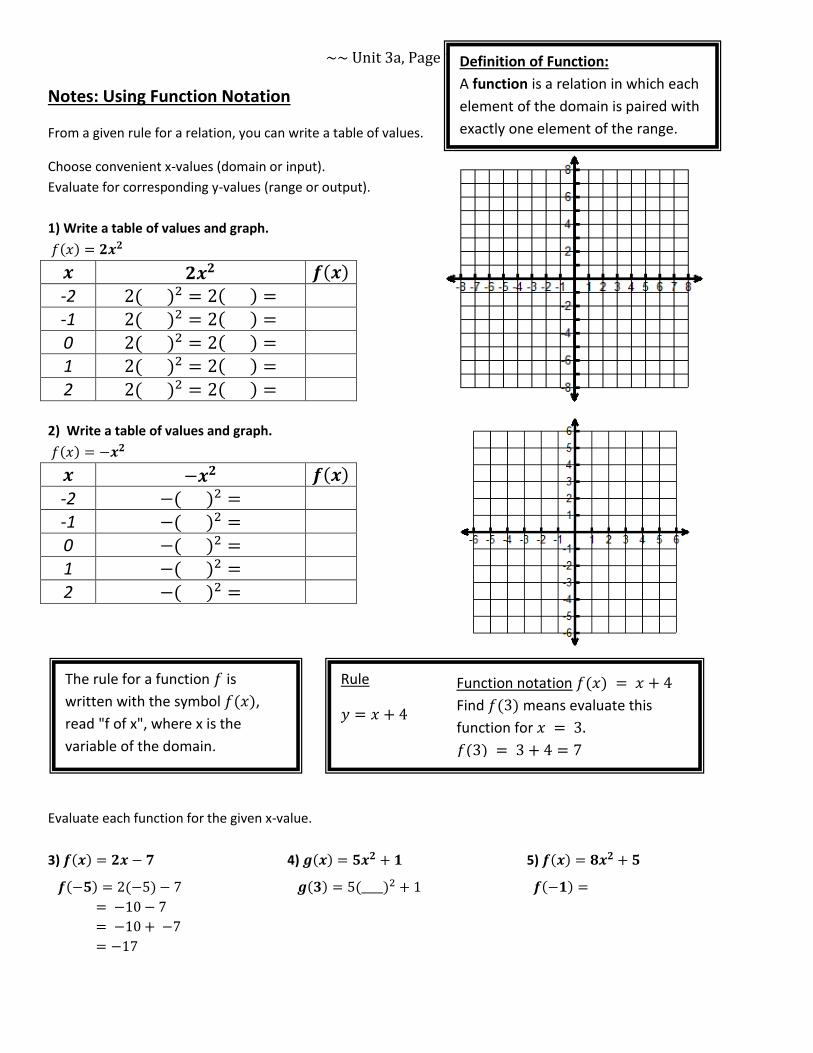
Notes: Using Function Notation
From a given rule for a relation, you can write a table of values.
Choose convenient x-values (domain or input).
Evaluate for corresponding y-values (range or output).
1) Write a table of values and graph.
-2 -1
0 1
2
2) Write a table of values and graph.
-2 -1
0 1
2
Evaluate each function for the given x-value.
3) 4) 5)
The rule for a function is
written with the symbol ,
read "f of x", where x is the
variable of the domain.
Rule
Function notation
Find means evaluate this
function for
Definition of Function:
A function is a relation in which each
element of the domain is paired with
exactly one element of the range.
~~ Unit 3a, Page 17 ~~
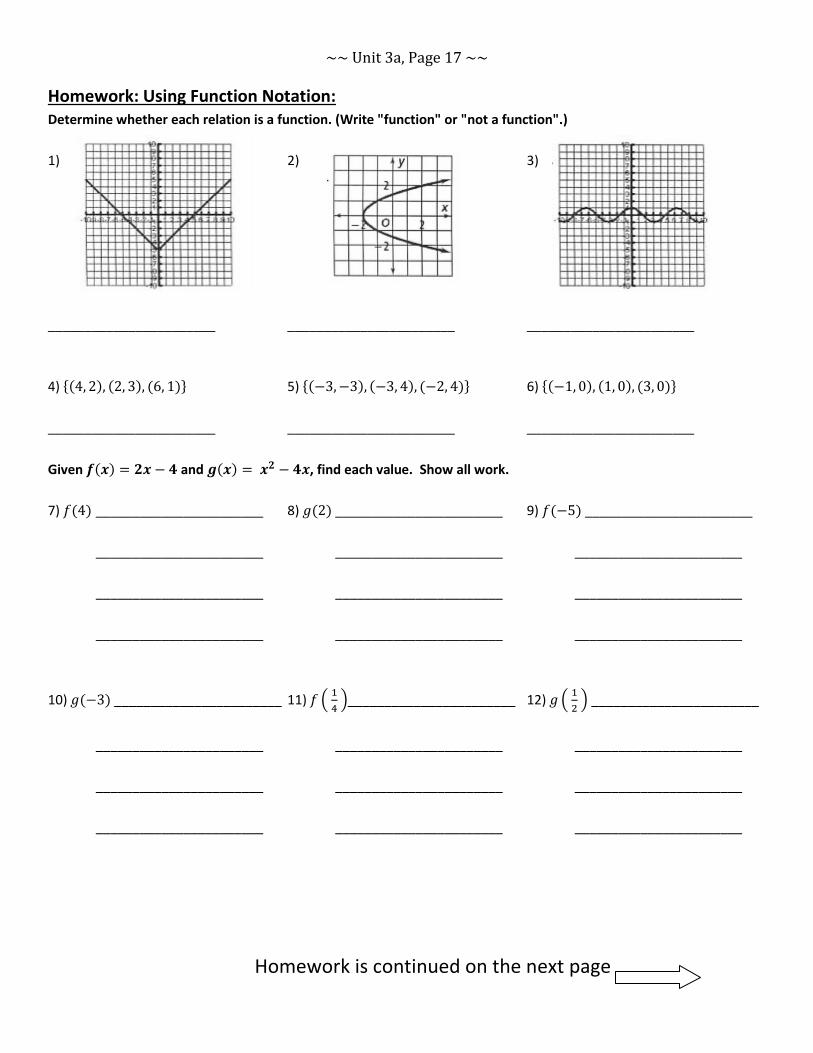
Homework: Using Function Notation: Determine whether each relation is a function. (Write "function" or "not a function".)
1) 2) 3)
_______________________ _______________________ _______________________
4) 5) 6)
_______________________ _______________________ _______________________
Given and , find each value. Show all work.
7) _______________________ 8) _______________________ 9) _______________________
_______________________ _______________________ _______________________
_______________________ _______________________ _______________________
_______________________ _______________________ _______________________
10) _______________________ 11)
_______________________ 12)
_______________________
_______________________ _______________________ _______________________
_______________________ _______________________ _______________________
_______________________ _______________________ _______________________
Homework is continued on the next page
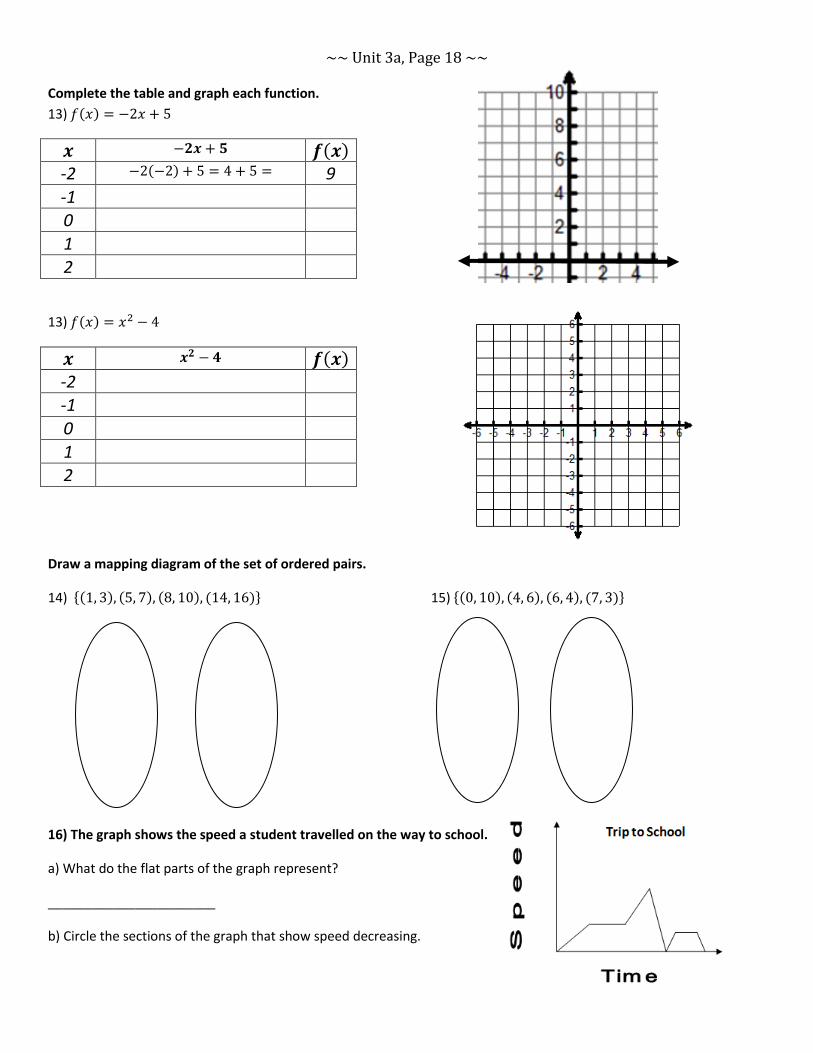
~~ Unit 3a, Page 18 ~~ Complete the table and graph each function.
13)
-2 9
-1 0
1 2
13)
-2 -1
0
1 2
Draw a mapping diagram of the set of ordered pairs.
14) 15)
16) The graph shows the speed a student travelled on the way to school.
a) What do the flat parts of the graph represent?
_______________________
b) Circle the sections of the graph that show speed decreasing.
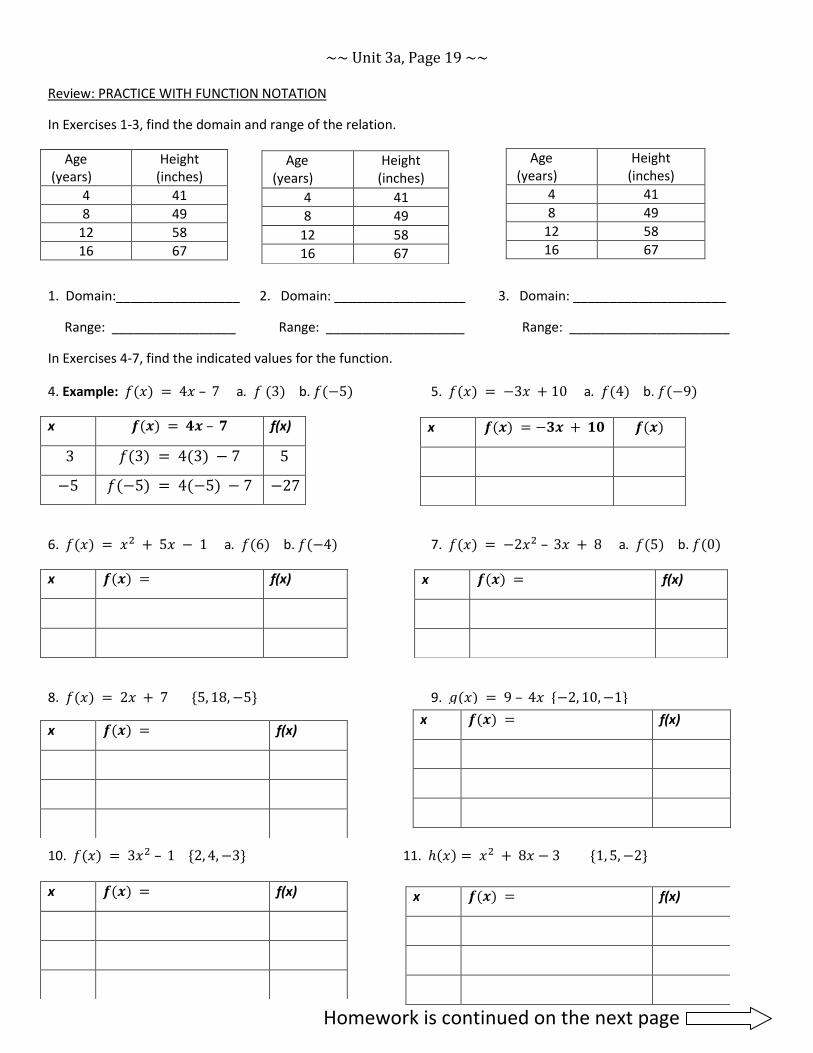
~~ Unit 3a, Page 19 ~~ Review: PRACTICE WITH FUNCTION NOTATION
In Exercises 1-3, find the domain and range of the relation.
Age (years)
Height (inches)
4 41
8 49
12 58
16 67
1. Domain:_________________ 2. Domain: __________________ 3. Domain: _____________________
Range: _________________ Range: ___________________ Range: ______________________
In Exercises 4-7, find the indicated values for the function.
4. Example: – a. b. 5. a. b.
x – f(x)
6. a. b. 7. – a. b.
x f(x)
8. 9. –
10. – 11.
Age (years)
Height (inches)
4 41
8 49
12 58
16 67
x
x f(x)
x f(x)
x f(x)
Age (years)
Height (inches)
4 41
8 49
12 58
16 67
x f(x)
x f(x)
Homework is continued on the next page
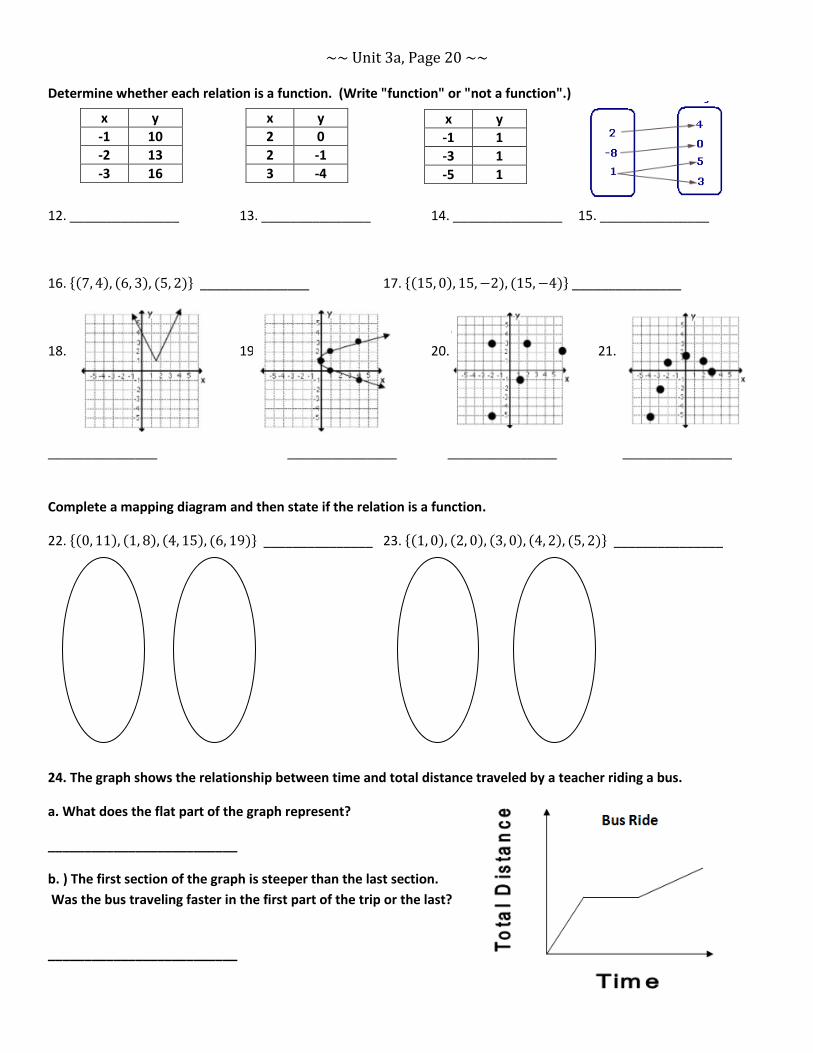
~~ Unit 3a, Page 20 ~~ Determine whether each relation is a function. (Write "function" or "not a function".)
12. _______________ 13. _______________ 14. _______________ 15. _______________
16. _______________ 17. _______________
18. 19. 20. 21.
_______________ _______________ _______________ _______________
Complete a mapping diagram and then state if the relation is a function.
22. _______________ 23. _______________
24. The graph shows the relationship between time and total distance traveled by a teacher riding a bus.
a. What does the flat part of the graph represent?
__________________________
b. ) The first section of the graph is steeper than the last section.
Was the bus traveling faster in the first part of the trip or the last?
__________________________
x y
-1 10
-2 13
-3 16
x y
2 0
2 -1
3 -4
x y
-1 1
-3 1
-5 1