belgium’s foreign trade 2011 - belgian foreign trade …s foreign... · belgium’s foreign trade...
TRANSCRIPT
Belgium’sforeign
trade 2011
Belgium’sforeign
trade 2011
3
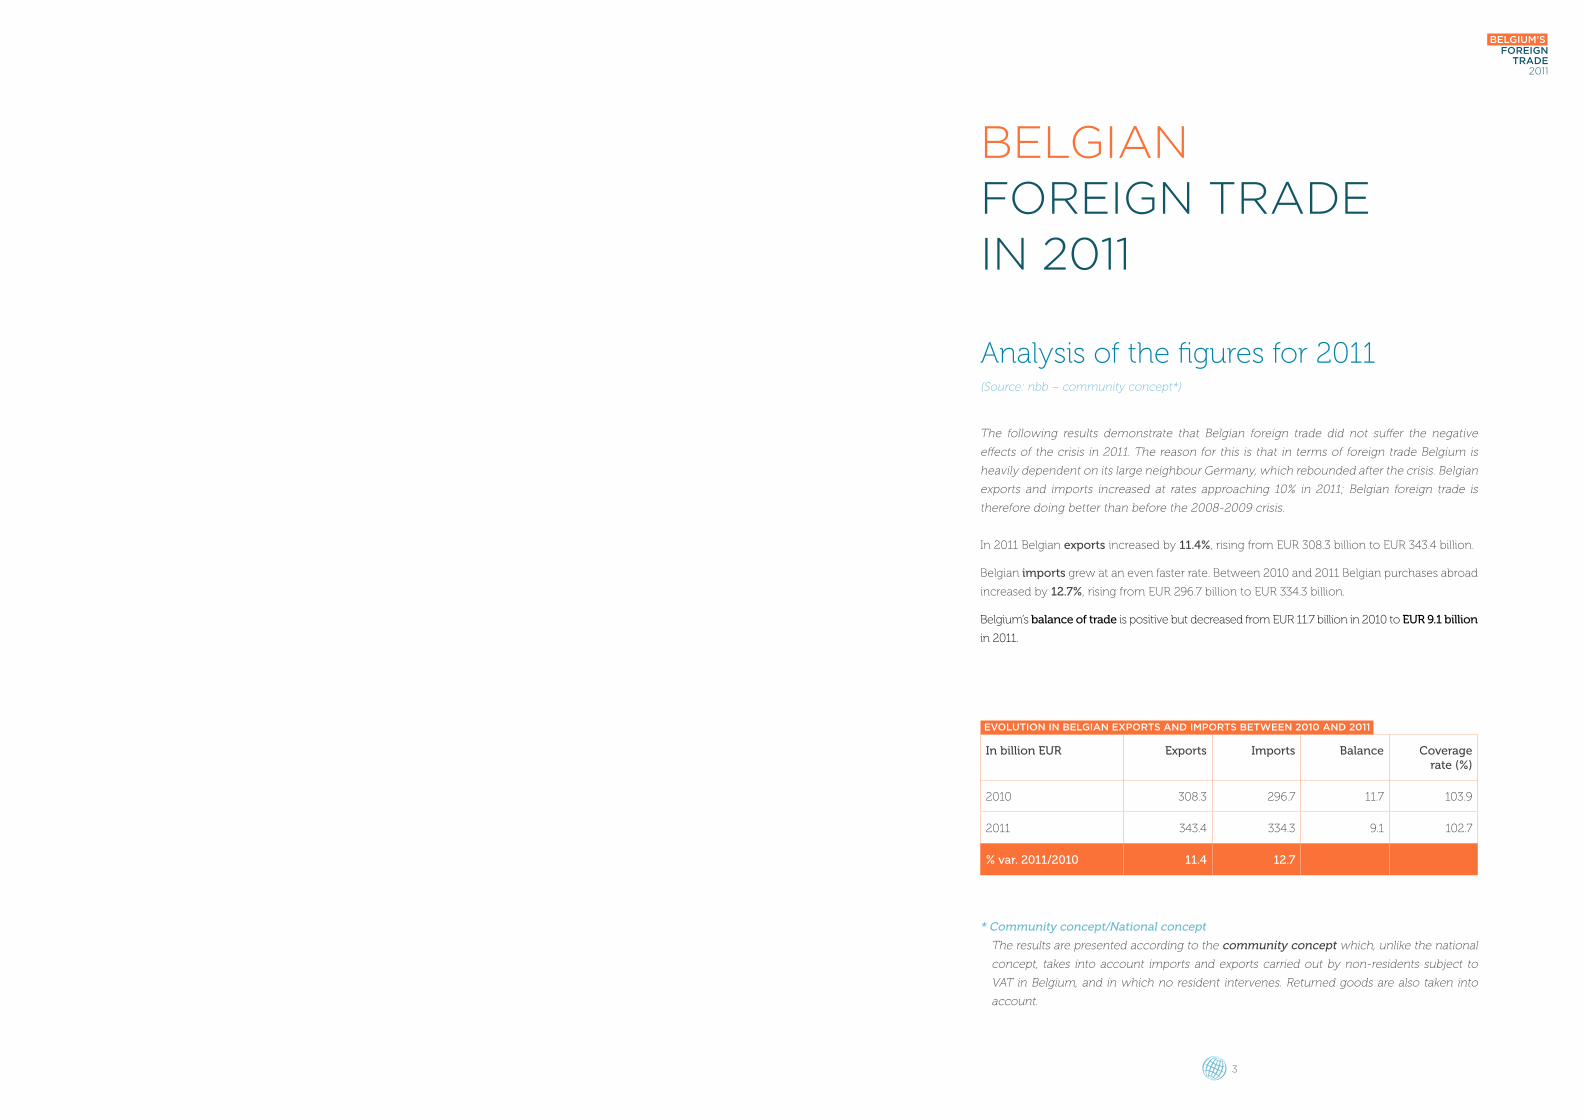
Analysis of the figures for 2011(Source: nbb – community concept*)
Belgian foreign trade in 2011
The following results demonstrate that Belgian foreign trade did not suffer the negative
effects of the crisis in 2011. The reason for this is that in terms of foreign trade Belgium is
heavily dependent on its large neighbour Germany, which rebounded after the crisis. Belgian
exports and imports increased at rates approaching 10% in 2011; Belgian foreign trade is
therefore doing better than before the 2008-2009 crisis.
In 2011 Belgian exports increased by 11.4%, rising from EUR 308.3 billion to EUR 343.4 billion.
Belgian imports grew at an even faster rate. Between 2010 and 2011 Belgian purchases abroad
increased by 12.7%, rising from EUR 296.7 billion to EUR 334.3 billion.
Belgium’s balance of trade is positive but decreased from EUR 11.7 billion in 2010 to EUR 9.1 billion
in 2011.
* Community concept/National concept
The results are presented according to the community concept which, unlike the national
concept, takes into account imports and exports carried out by non-residents subject to
VAT in Belgium, and in which no resident intervenes. Returned goods are also taken into
account.
In billion EUR Exports Imports Balance Coverage rate (%)
2010 308.3 296.7 11.7 103.9
2011 343.4 334.3 9.1 102.7
% var. 2011/2010 11.4 12.7
evolution in Belgian exports and imports Between 2010 and 2011
Belgium’sforeign
trade 2011
4 5
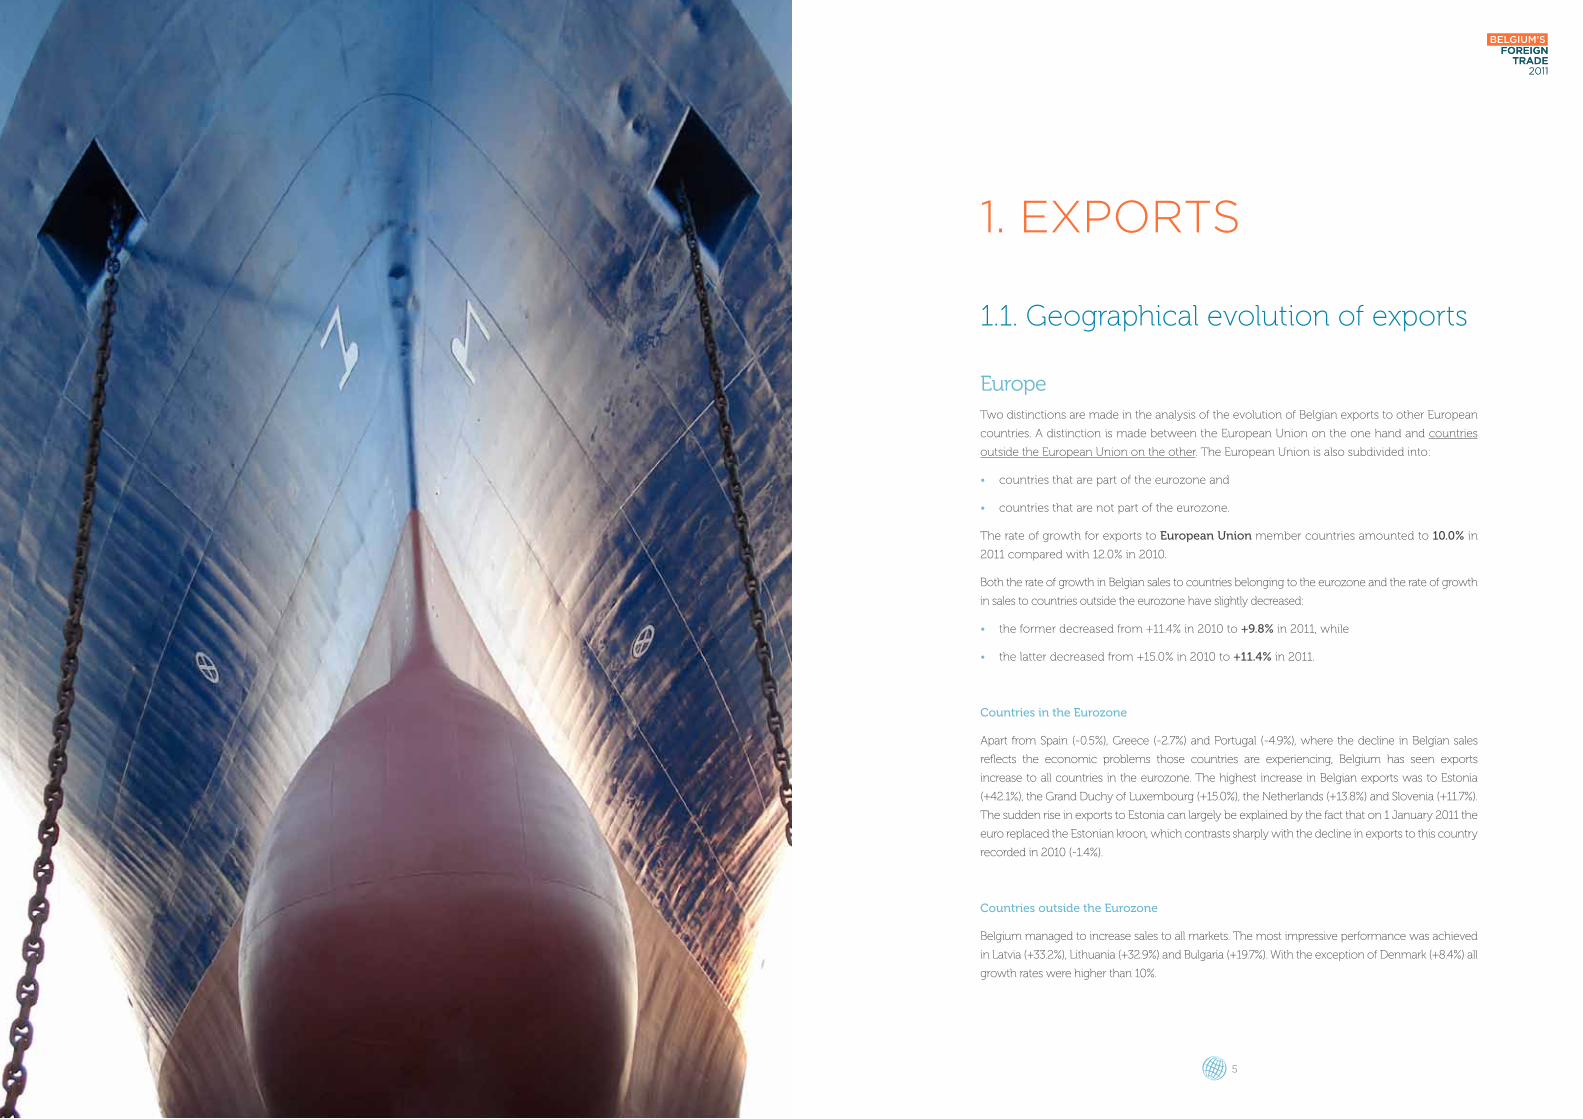
1. eXPorts
1.1. Geographical evolution of exports
EuropeTwo distinctions are made in the analysis of the evolution of Belgian exports to other European
countries. A distinction is made between the European Union on the one hand and countries
outside the European Union on the other. The European Union is also subdivided into:
• countries that are part of the eurozone and
• countries that are not part of the eurozone.
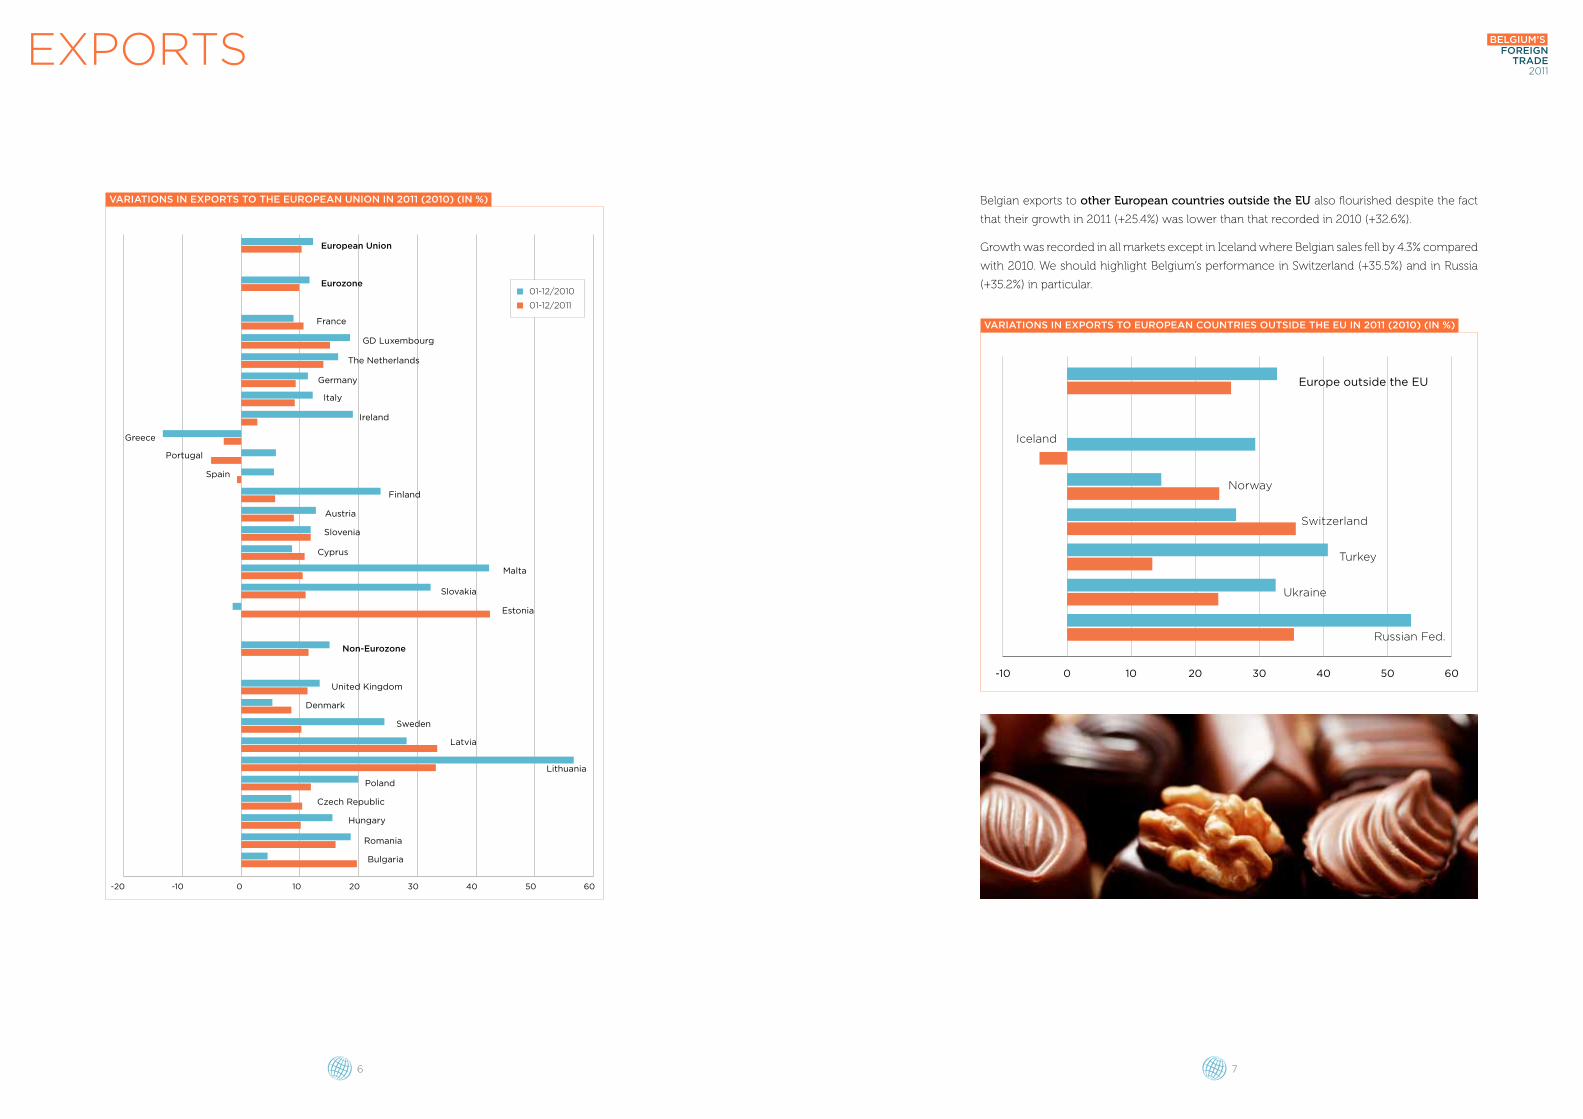
The rate of growth for exports to European Union member countries amounted to 10.0% in
2011 compared with 12.0% in 2010.
Both the rate of growth in Belgian sales to countries belonging to the eurozone and the rate of growth
in sales to countries outside the eurozone have slightly decreased:
• the former decreased from +11.4% in 2010 to +9.8% in 2011, while
• the latter decreased from +15.0% in 2010 to +11.4% in 2011.
Countries in the Eurozone
Apart from Spain (-0.5%), Greece (-2.7%) and Portugal (-4.9%), where the decline in Belgian sales
reflects the economic problems those countries are experiencing, Belgium has seen exports
increase to all countries in the eurozone. The highest increase in Belgian exports was to Estonia
(+42.1%), the Grand Duchy of Luxembourg (+15.0%), the Netherlands (+13.8%) and Slovenia (+11.7%).
The sudden rise in exports to Estonia can largely be explained by the fact that on 1 January 2011 the
euro replaced the Estonian kroon, which contrasts sharply with the decline in exports to this country
recorded in 2010 (-1.4%).
Countries outside the Eurozone
Belgium managed to increase sales to all markets. The most impressive performance was achieved
in Latvia (+33.2%), Lithuania (+32.9%) and Bulgaria (+19.7%). With the exception of Denmark (+8.4%) all
growth rates were higher than 10%.
Belgium’sforeign
trade 2011
Belgium’sforeign
trade 2011
6 7
variations in exports to the european union in 2011 (2010) (in %)
-20 -10 0 10 20 30 40 50 60
European Union
Eurozone
France
GD Luxembourg
The Netherlands
Germany
Italy
Ireland
Spain
Finland
Cyprus
Malta
Slovakia
Estonia
Non-Eurozone
United Kingdom
Denmark
Sweden
Latvia
Lithuania
Poland
Czech Republic
Hungary
Bulgaria
Romania
Austria
Slovenia
Greece
Portugal
01-12/2010
01-12/2011
eXPorts
Belgian exports to other European countries outside the EU also flourished despite the fact
that their growth in 2011 (+25.4%) was lower than that recorded in 2010 (+32.6%).
Growth was recorded in all markets except in Iceland where Belgian sales fell by 4.3% compared
with 2010. We should highlight Belgium’s performance in Switzerland (+35.5%) and in Russia
(+35.2%) in particular.
01-12/2010 01-12/2011
-10 0 10 20 30 40 50 60
Europe outside the EU
Norway
Switzerland
Turkey
Ukraine
Russian Fed.
Iceland
variations in exports to european Countries outside the eu in 2011 (2010) (in %)
Belgium’sforeign
trade 2011
8 9
eXPorts
Intercontinental exports
Developments recorded in intercontinental exports vary considerably. Nonetheless, Belgian
sales to all continents increased in 2011.
This is shown below:
Africa: +24.4% in 2011 compared with +13.2% in 2010;
America: +1.0% in 2011 compared with +24.4% in 2010;
Asia: +19.4% in 2011 compared with +31.0% in 2010 and
Oceania: +5.2% in 2011 compared with +33.6% in 2010.
In Africa exports particularly decreased to Libya (-61.0%), the Ivory Coast (-28.2%), Algeria
(-9.3%), Angola (-8.7%) and Tunisia (-8.3%). Despite these considerable decreases the rate of
growth for Belgian exports to the African continent as a whole increased from +13.2% in
2010 to +24.4% in 2011, as a result of the impressive performance of our exporters to Nigeria
(+109.7%), Kenya (+45.3%), Egypt (+33.4%) and South Africa (+29.7%).
In America Belgian exporters saw their sales slightly increase overall despite falling Belgian
sales to Canada (-8.7%) and the United States (-1.6%). However great success was achieved
in Argentina (+40.0%), Colombia (+29.6%), Peru (+27.9%), Cuba (+27.8%), Venezuela (+19.5%),
Chile (+14.1%) and Mexico (+11.5%). The substantial increase in exports to these countries
compensated for the decline in exports to the United States and Canada. Consequently
Belgian sales to the American market as a whole grew by +1.0% (compared with an increase
of +24.4% in 2010).
In Asia Belgian sales increased to Saudi Arabia (+50.0%), China (+35.6%), the United Arab
Emirates (+35.6%), Singapore (+35.0%), Taiwan (+28.3%), South Korea (+25.5%) and Jordan
(+23.6%). With regard to other countries Belgian exports fell to Kuwait (-19.0%), Syria (-9.5%)
and Pakistan (-6.5%). Although Asia continues to be the driving force the overall rate of growth
in exports to the Asian continent slumped from +31.0% in 2010 to +19.4% in 2011.
In Oceania results were positive but not as good as in 2010. Sales to this continent saw their
rate of growth recede from +33.6% in 2010 to +5.2% in 2011. After an increase of 31.5% in 2010
sales to Australia ‘only’ grew by 5.2% in 2011. Exports to New Zealand increased by 6.7%.
1.2. Market shares
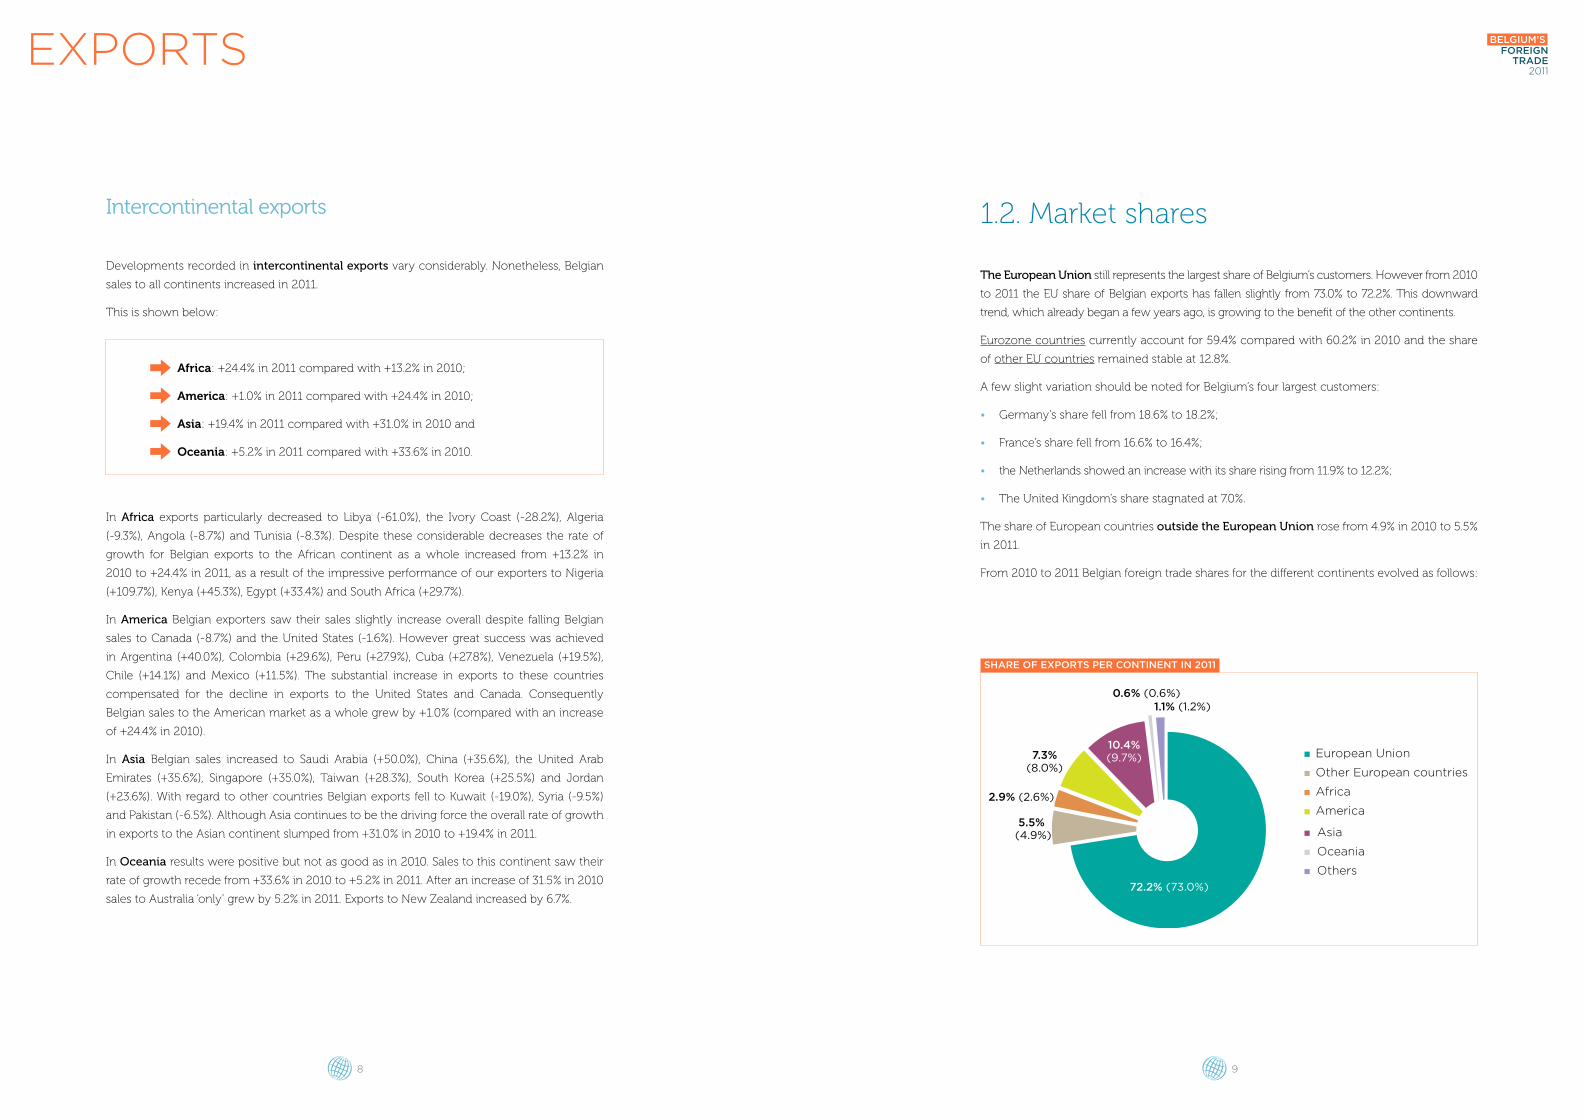
The European Union still represents the largest share of Belgium’s customers. However from 2010
to 2011 the EU share of Belgian exports has fallen slightly from 73.0% to 72.2%. This downward
trend, which already began a few years ago, is growing to the benefit of the other continents.
Eurozone countries currently account for 59.4% compared with 60.2% in 2010 and the share
of other EU countries remained stable at 12.8%.
A few slight variation should be noted for Belgium’s four largest customers:
• Germany’s share fell from 18.6% to 18.2%;
• France’s share fell from 16.6% to 16.4%;
• the Netherlands showed an increase with its share rising from 11.9% to 12.2%;
• The United Kingdom’s share stagnated at 7.0%.
The share of European countries outside the European Union rose from 4.9% in 2010 to 5.5%
in 2011.
From 2010 to 2011 Belgian foreign trade shares for the different continents evolved as follows:
European Union
Other European countries
Africa
America
Asia
Oceania
Others
72.2% (73.0%)
10.4%(9.7%)
5.5% (4.9%)
2.9% (2.6%)
1.1% (1.2%)0.6% (0.6%)
7.3%(8.0%)
share of exports per Continent in 2011
Belgium’sforeign
trade 2011
10 11
eXPorts
0
10,000
20,000
30,000
40,000
50,000
60,000
70,000
01-12/2010
01-12/2011
Germ
any
Franc
e
The
Nethe
rland
s
Unite
d Kin
gdomUSA Ita
ly
SpainIn
dia
China
GD Lux
embour
g
Poland
Switz
erlan
d
Swed
en
Turk
ey
Russia
n Fed
.
Japan
Austri
a
Czech
Rep
ublic
Brazil
Hong K
ong
Belgium’s top 20 Customers (in million eur)
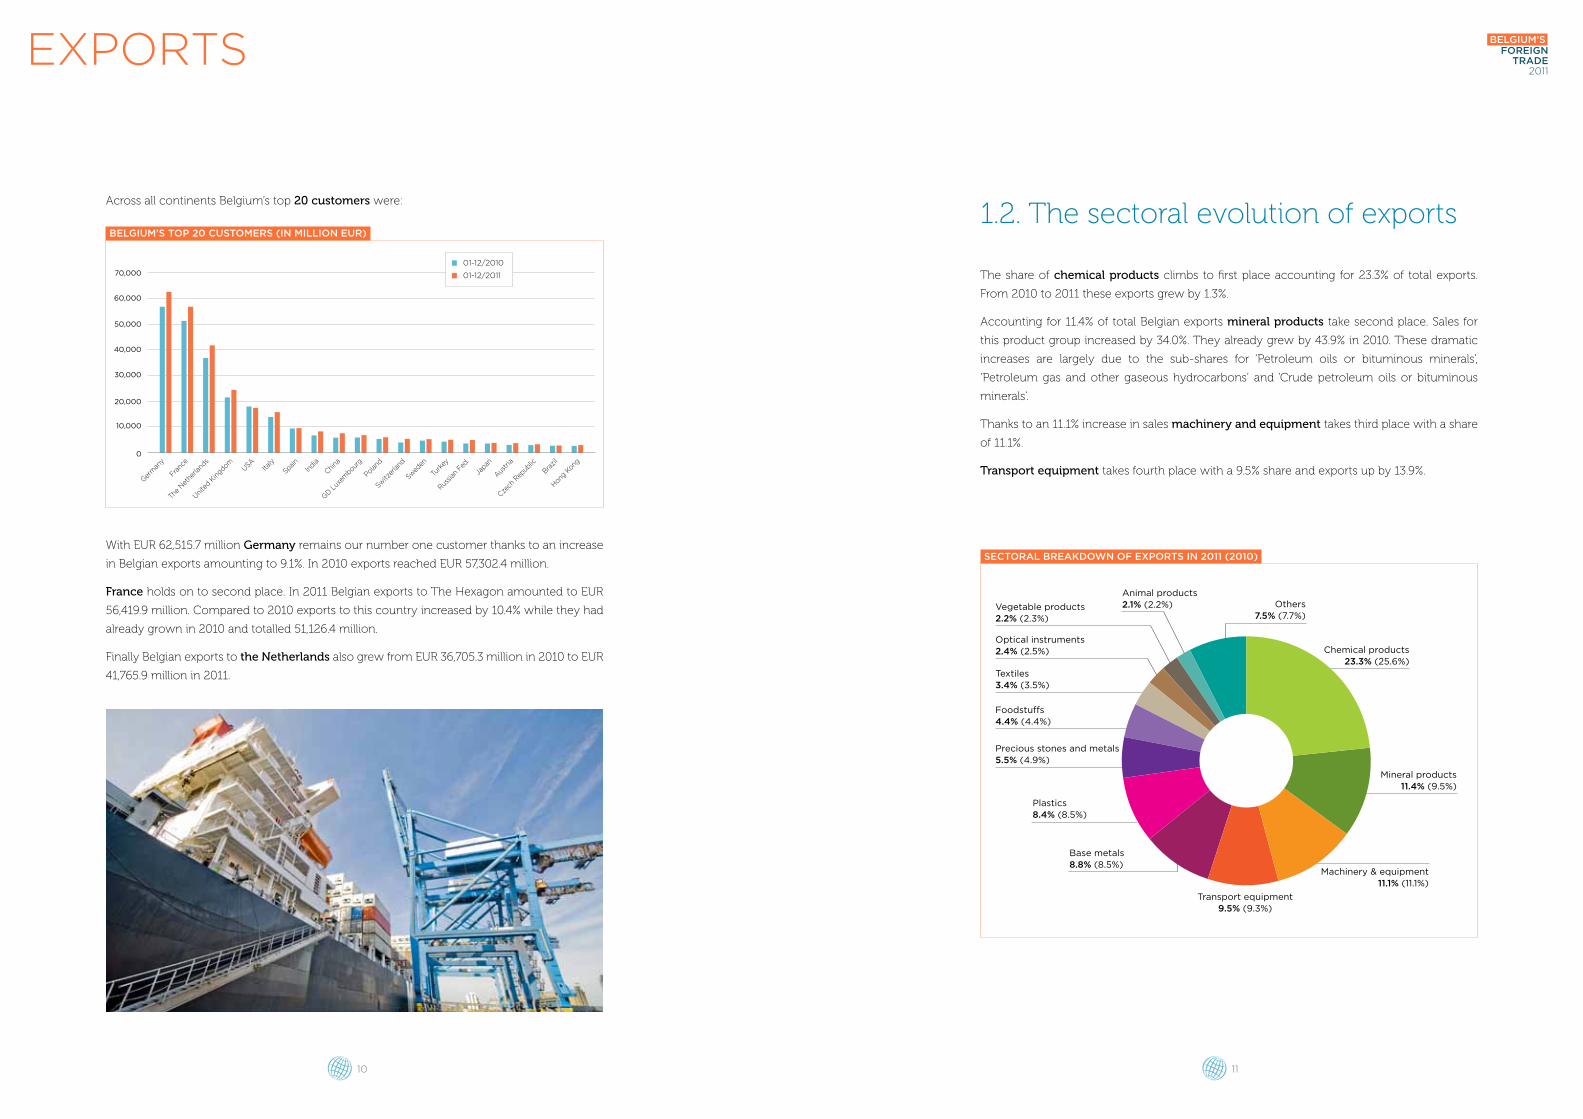
Across all continents Belgium’s top 20 customers were:
With EUR 62,515.7 million Germany remains our number one customer thanks to an increase
in Belgian exports amounting to 9.1%. In 2010 exports reached EUR 57,302.4 million.
France holds on to second place. In 2011 Belgian exports to The Hexagon amounted to EUR
56,419.9 million. Compared to 2010 exports to this country increased by 10.4% while they had
already grown in 2010 and totalled 51,126.4 million.
Finally Belgian exports to the Netherlands also grew from EUR 36,705.3 million in 2010 to EUR
41,765.9 million in 2011.
1.2. The sectoral evolution of exports
The share of chemical products climbs to first place accounting for 23.3% of total exports.
From 2010 to 2011 these exports grew by 1.3%.
Accounting for 11.4% of total Belgian exports mineral products take second place. Sales for
this product group increased by 34.0%. They already grew by 43.9% in 2010. These dramatic
increases are largely due to the sub-shares for ‘Petroleum oils or bituminous minerals’,
‘Petroleum gas and other gaseous hydrocarbons’ and ‘Crude petroleum oils or bituminous
minerals’.
Thanks to an 11.1% increase in sales machinery and equipment takes third place with a share
of 11.1%.
Transport equipment takes fourth place with a 9.5% share and exports up by 13.9%.
Chemical products23.3% (25.6%)
Others7.5% (7.7%)
Mineral products11.4% (9.5%)
Machinery & equipment11.1% (11.1%)
Transport equipment9.5% (9.3%)
Foodstuffs4.4% (4.4%)
Textiles3.4% (3.5%)
Optical instruments2.4% (2.5%)
Vegetable products2.2% (2.3%)
Animal products2.1% (2.2%)
Precious stones and metals5.5% (4.9%)
Plastics8.4% (8.5%)
Base metals8.8% (8.5%)
seCtoral Breakdown of exports in 2011 (2010)
Belgium’sforeign
trade 2011
12 13
Belgium’sforeign
trade 2011
2. imPorts
2.1. Geographical evolution of imports
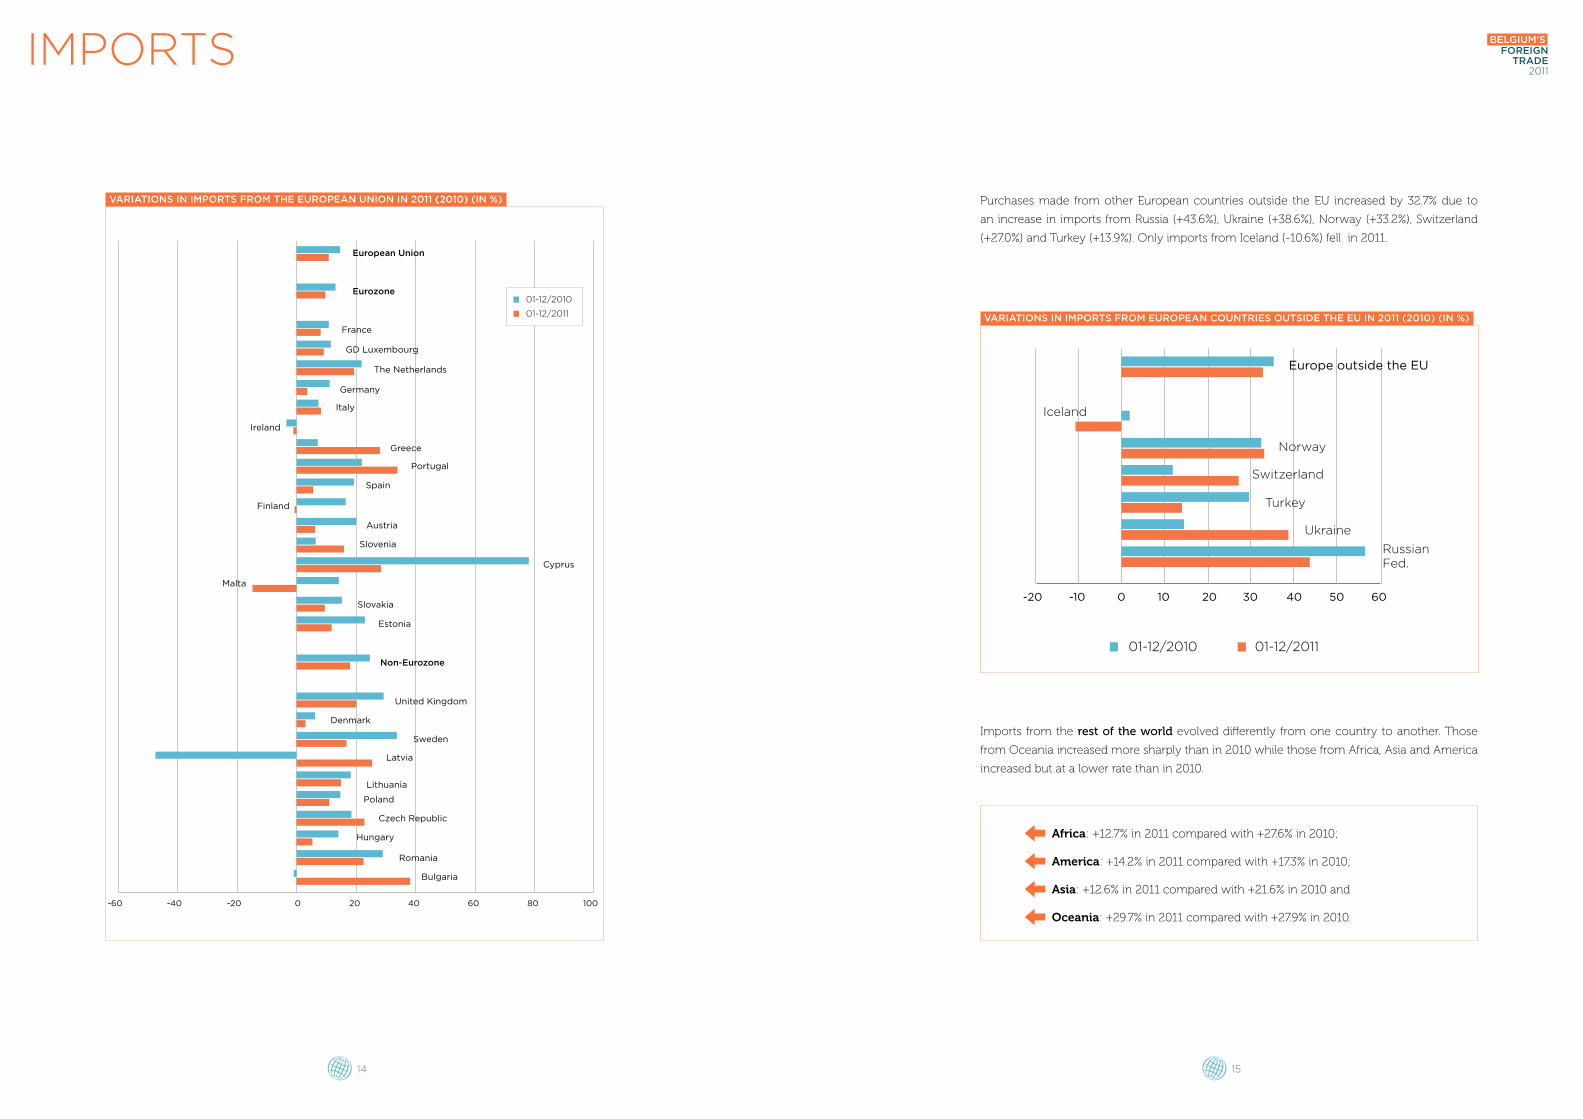
Belgian imports from European Union countries showed an increase of 10.9% in 2011 compared
with an increase of 14.6% in 2010. The rate of growth for purchases made by Belgium in the
eurozone decreased from +13.0% to +9.6%. Similarly the growth rate for Belgian imports from
other EU countries not belonging to the eurozone fell from +24.7% in 2010 to +18.0% in 2011.
In the Eurozone Belgium saw among others an increase in imports from Portugal (+33.9%),
Cyprus (+28.5%), Greece (+28.0%) and the Netherlands (+19.2%). Only imports from Malta
(-14.6%), Ireland (-1.2%) and Finland (-0.6%) decreased in 2011.
Imports from each of the EU countries that have not adopted the euro increased in 2011.
We should point out the increase in imports from Bulgaria (+38.0%), Latvia (+25.1%), the Czech
Republic (+22.5%), Romania (+22.2%), the United Kingdom (+19.9%) and Sweden (+16.5%).
Belgium’sforeign
trade 2011
14 15
variations in imports from the european union in 2011 (2010) (in %)
variations in imports from european Countries outside the eu in 2011 (2010) (in %)
-60 -40 -20 0 20 40 60 80 100
01-12/2010
01-12/2011
European Union
Eurozone
France
GD Luxembourg
The Netherlands
Germany
Italy
Ireland
Spain
Finland
Cyprus
Malta
Slovakia
Estonia
Non-Eurozone
United Kingdom
Denmark
Sweden
Latvia
Lithuania
Poland
Czech Republic
Hungary
Bulgaria
Romania
Austria
Slovenia
Greece
Portugal
-10-20 0 10 3020 40 50 60
01-12/2010 01-12/2011
Europe outside the EU
Norway
Switzerland
Turkey
Ukraine
RussianFed.
Iceland
Purchases made from other European countries outside the EU increased by 32.7% due to
an increase in imports from Russia (+43.6%), Ukraine (+38.6%), Norway (+33.2%), Switzerland
(+27.0%) and Turkey (+13.9%). Only imports from Iceland (-10.6%) fell in 2011.
Imports from the rest of the world evolved differently from one country to another. Those
from Oceania increased more sharply than in 2010 while those from Africa, Asia and America
increased but at a lower rate than in 2010.
Africa: +12.7% in 2011 compared with +27.6% in 2010;
America: +14.2% in 2011 compared with +17.3% in 2010;
Asia: +12.6% in 2011 compared with +21.6% in 2010 and
Oceania: +29.7% in 2011 compared with +27.9% in 2010.
imPorts
Belgium’sforeign
trade 2011
16 17
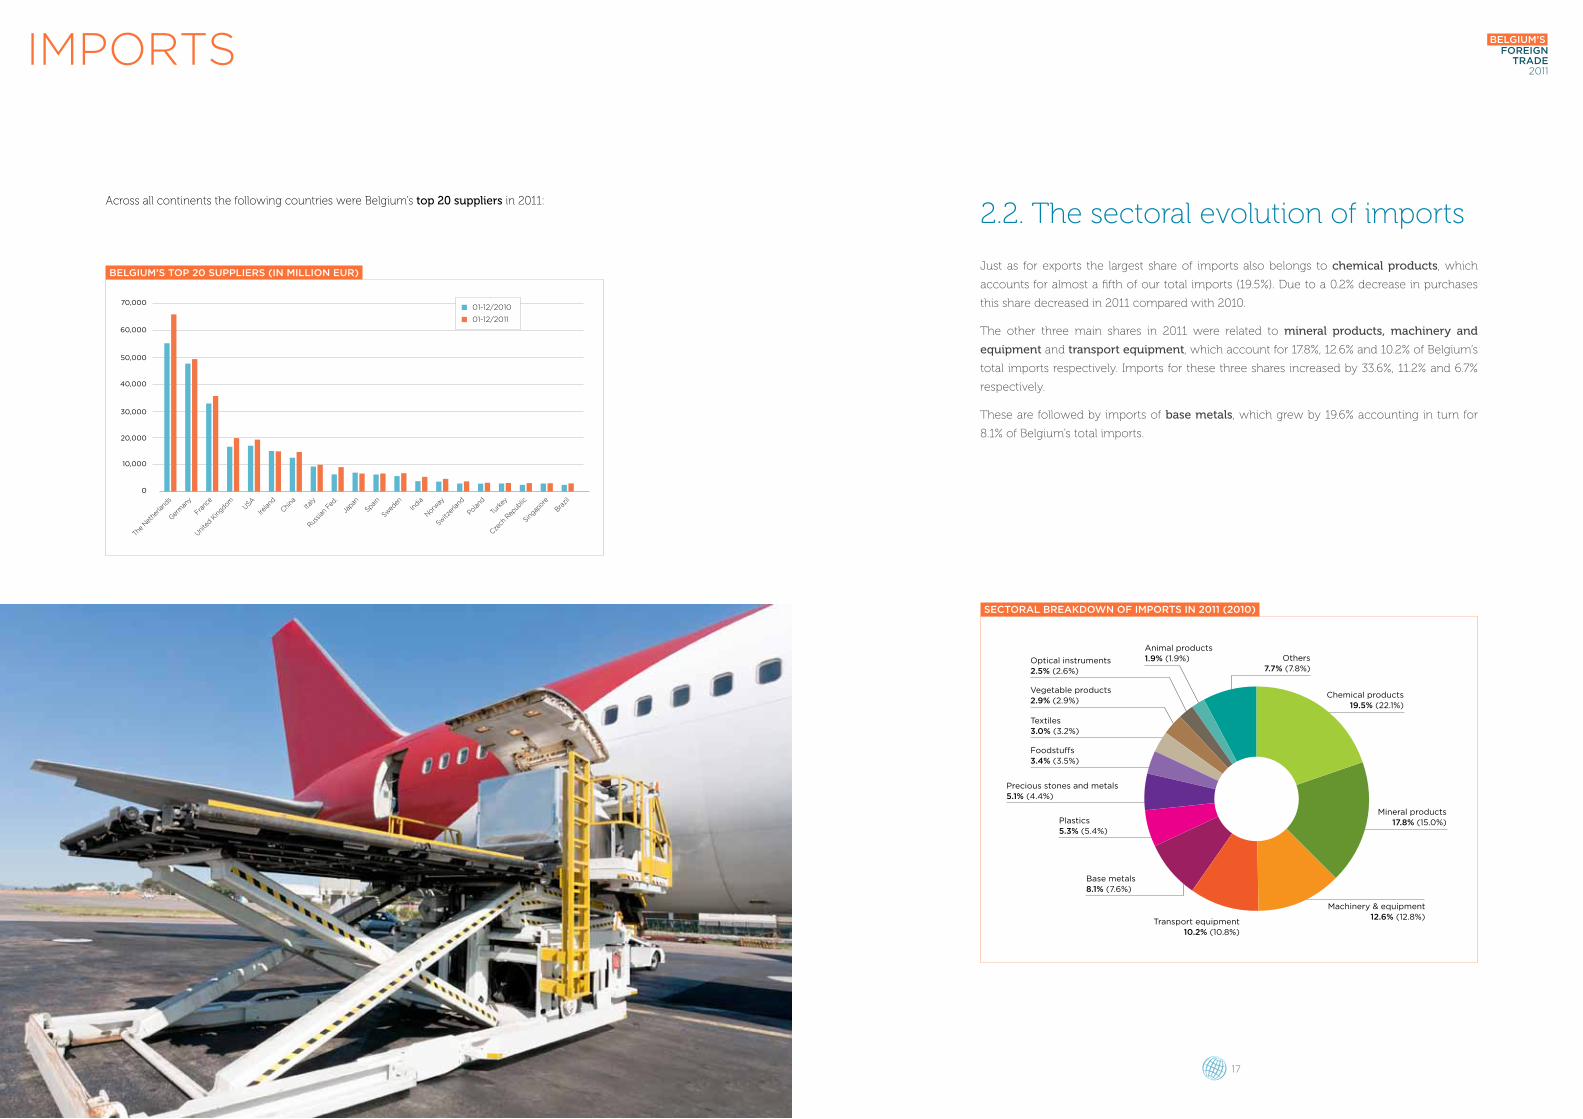
Across all continents the following countries were Belgium’s top 20 suppliers in 2011:
Belgium’s top 20 suppliers (in million eur)
imPorts
Germ
any
Franc
e
The
Nethe
rland
s
Unite
d Kin
gdomUSA
Irelan
dIta
ly
SpainIn
dia
Norway
China
Poland
Switz
erlan
d
Swed
en
Turk
ey
Russia
n Fed
.
Japan
Czech
Rep
ublic
Singap
ore
Brazil
0
10,000
20,000
30,000
40,000
50,000
60,000
70,00001-12/2010
01-12/2011
seCtoral Breakdown of imports in 2011 (2010)
Chemical products19.5% (22.1%)
Others7.7% (7.8%)
Mineral products17.8% (15.0%)
Machinery & equipment12.6% (12.8%)
Transport equipment10.2% (10.8%)
Foodstuffs3.4% (3.5%)
Textiles3.0% (3.2%)
Vegetable products2.9% (2.9%)
Optical instruments2.5% (2.6%)
Animal products1.9% (1.9%)
Precious stones and metals5.1% (4.4%)
Plastics5.3% (5.4%)
Base metals8.1% (7.6%)
2.2. The sectoral evolution of imports
Just as for exports the largest share of imports also belongs to chemical products, which
accounts for almost a fifth of our total imports (19.5%). Due to a 0.2% decrease in purchases
this share decreased in 2011 compared with 2010.
The other three main shares in 2011 were related to mineral products, machinery and
equipment and transport equipment, which account for 17.8%, 12.6% and 10.2% of Belgium’s
total imports respectively. Imports for these three shares increased by 33.6%, 11.2% and 6.7%
respectively.
These are followed by imports of base metals, which grew by 19.6% accounting in turn for
8.1% of Belgium’s total imports.
Belgium’sforeign
trade 2011
18 19
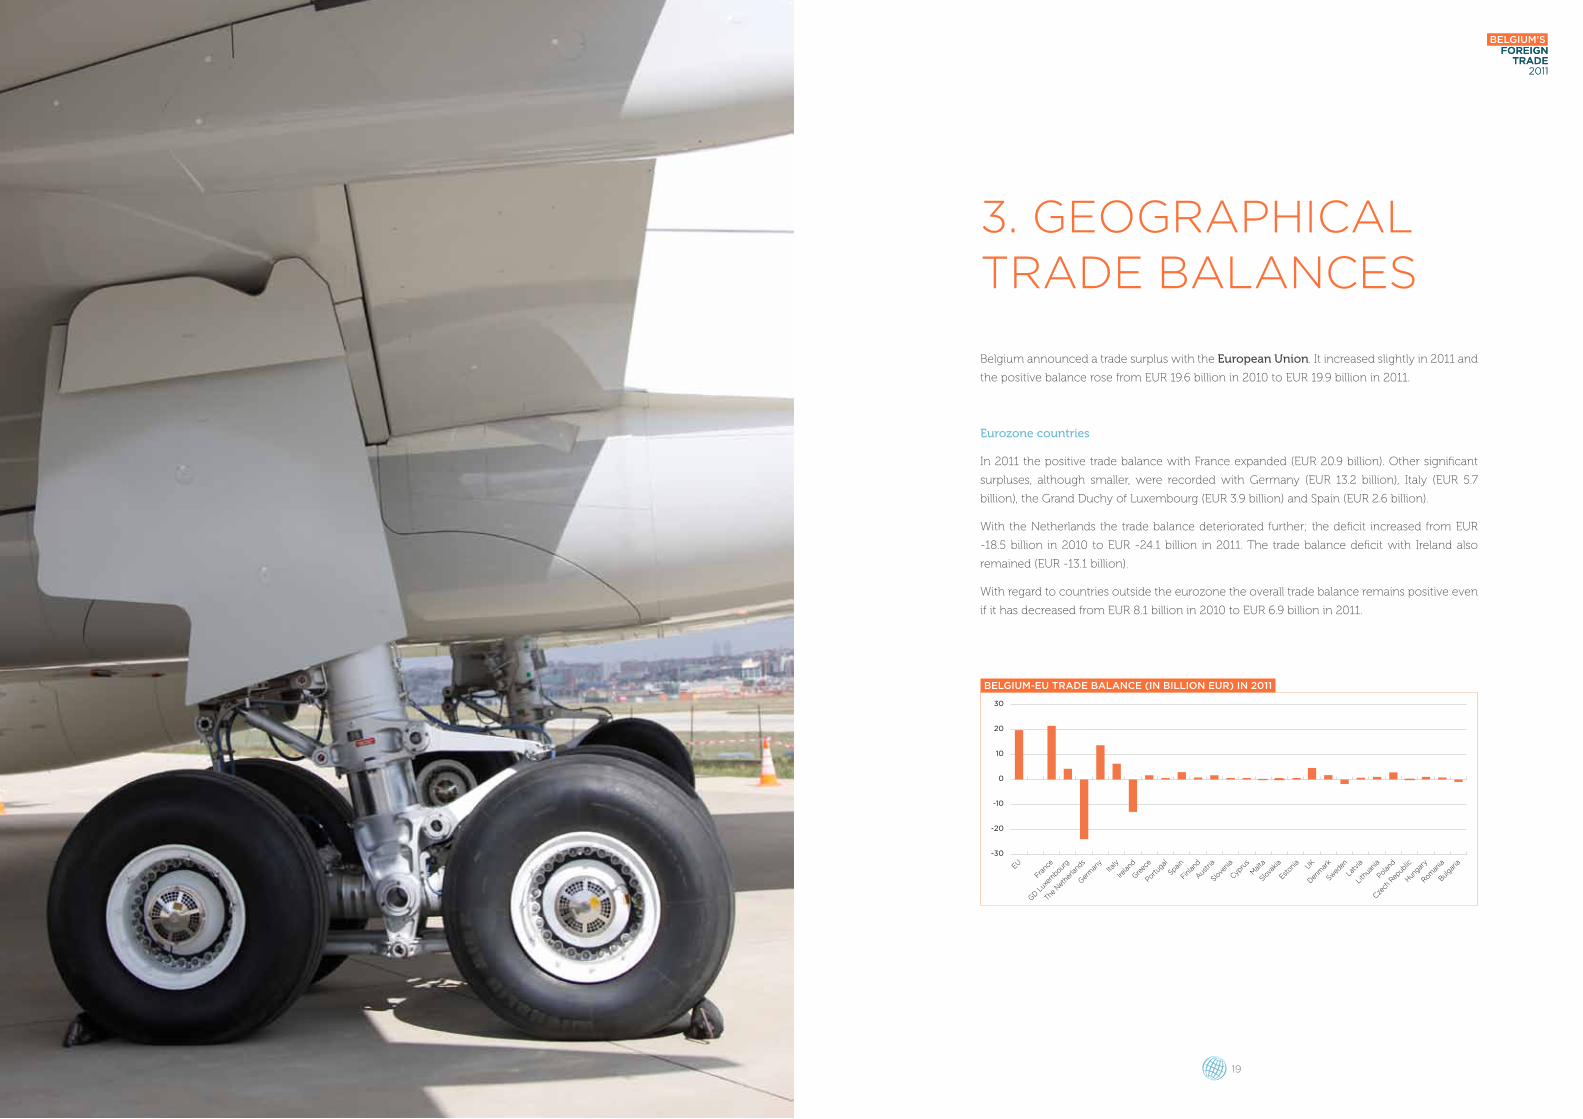
3. geograPHiCal trade BalanCes
Belgium announced a trade surplus with the European Union. It increased slightly in 2011 and
the positive balance rose from EUR 19.6 billion in 2010 to EUR 19.9 billion in 2011.
Eurozone countries
In 2011 the positive trade balance with France expanded (EUR 20.9 billion). Other significant
surpluses, although smaller, were recorded with Germany (EUR 13.2 billion), Italy (EUR 5.7
billion), the Grand Duchy of Luxembourg (EUR 3.9 billion) and Spain (EUR 2.6 billion).
With the Netherlands the trade balance deteriorated further; the deficit increased from EUR
-18.5 billion in 2010 to EUR -24.1 billion in 2011. The trade balance deficit with Ireland also
remained (EUR -13.1 billion).
With regard to countries outside the eurozone the overall trade balance remains positive even
if it has decreased from EUR 8.1 billion in 2010 to EUR 6.9 billion in 2011.
Belgium’sforeign
trade 2011
Belgium-eu trade BalanCe (in Billion eur) in 2011
EU
Germ
any
Franc
e
The
Nethe
rland
s
Greec
e
Irelan
dIta
ly
Spain
Finlan
d
Austri
a
Slove
nia
Cypru
s
Malt
a
Slova
kia
Estoni
aUK
Denm
ark
Swed
en
Latv
ia
Lith
uani
a
Poland
Czech
Rep
ublic
Hungar
y
Roman
ia
Bulgar
ia
Portugal
GD Lux
embour
g
-30
-20
-10
0
10
20
30
Belgium’sforeign
trade 2011
20 21
geograPHiCal trade BalanCes
The trade balance deteriorated with other European countries outside the EU. The trade deficit in
fact increased from EUR -1,015.1 million to EUR -2,429.4 million. Belgium’s negative balance with Russia
increased to EUR -4,227.1 million and with Norway it also deteriorated increasing to EUR -2,656.2 million.
With regard to the other continents it should be noted that Belgium’s trade balance with
America worsened. A trade deficit amounting to EUR -1,177.1 million recorded in 2010
increased and ran to EUR -4,632.6 million in 2011.
With Asia the deficit amounting to EUR -10,745.3 million in 2010 reduced to EUR -10,072.4 million in 2011.
Belgium’s trade balance with Africa showed a surplus of EUR 1,782.3 million in 2011 which is
more than double the surplus for 2010 (EUR 765.7 million).
With regard to Oceania the trade balance was closed in 2011 with a surplus of EUR 185.1
million while the surplus amounted to EUR 498.9 million in 2010.

22
Editor: F. L’Hoost
CopyrigHt © rEproduCtion oF tHE tExt is autHorizEdprovidEd tHE sourCE is aCknowLEdgEd.
datE oF pubLiCation: May 2012
printEd on FsC-LabELEd papEr
tHis pubLiCation is aLso avaiLabLE on tHE wEbsitE oF tHE bELgian ForEign tradE agEnCy: www.abH-aCE.bE
Studies and Statistics
Christelle CharlierDeputy Director Studies, Statistics and Communicationt +32 2 206 35 [email protected]
Dennis Gijsbrechtst +32 2 206 35 [email protected]
Sammy Sioent +32 2 206 35 [email protected]
Cathy MarquegniesAssistantt +32 2 206 35 [email protected]
Despite the fact that everything has been done to deliver accurate and up-to-date information, the Belgian Foreign Trade Agency and its partners (Brussels Invest & Export, Flanders Investment and Trade and Wallonia Trade & Investment Agency) cannot be held accountable for mistakes, omissions or deceitful declarations. They can also not be held responsible for the use or the interpretation of the information in this publication. This publication has not the intention to give advice.
Further information:
www.abh-ace.beBelgian Foreign Trade AgencyRue Montoyer 3, 1000 Brussels
Belgium’sforeign
trade 2011