belguerras, lamia and arellano-padilla, jesus and arumugam
TRANSCRIPT
Belguerras, Lamia and Arellano-Padilla, Jesus and Arumugam, Puvaneswaran and Hamiti, Tahar and Mezani, Smail and Gerada, C. (2016) Non-linear circuit based model of PMSM under inter-turn fault: a simple approach based on healthy machine data. IET Electric Power Applications, 10 (6). pp. 560-570. ISSN 1751-8679
Access from the University of Nottingham repository: http://eprints.nottingham.ac.uk/35916/1/Non-linear%20circuit%20based%20model%20of%20permanent%20magnet%20synchronous%20machine%20under%20interturn%20fault%20A%20simple%20approach%20based%20on%20healthy%20machine%20data.pdf
Copyright and reuse:
The Nottingham ePrints service makes this work by researchers of the University of Nottingham available open access under the following conditions.
This article is made available under the University of Nottingham End User licence and may be reused according to the conditions of the licence. For more details see: http://eprints.nottingham.ac.uk/end_user_agreement.pdf
A note on versions:
The version presented here may differ from the published version or from the version of record. If you wish to cite this item you are advised to consult the publisher’s version. Please see the repository url above for details on accessing the published version and note that access may require a subscription.
For more information, please contact [email protected]
brought to you by COREView metadata, citation and similar papers at core.ac.uk
provided by Nottingham ePrints
Non-linear circuit based model of PMSM under inter-
turn fault: a simple approach based on healthy
machine data
L. Belguerras1, J. Arellano-Padilla1, P. Arumugam1, T. Hamiti1, S. Mezani1 and C. Gerada1
1 University of Nottingham, Faculty of Engineering, PEMC group, Nottingham, NG7 2RD, UK
Abstract The paper proposes a fast dynamic mathematical model to evaluate the performances of saturated permanent magnet
synchronous machines (PMSM) under stator winding’s inter turn fault. The parameters of the model can be determined using only
manufacturer’s data of the healthy machine. Two surface mounted PMSM have been considered to investigate the validity of the
proposed approach; with distributed and concentrated winding. It has been shown that the proposed model predicts the fault
current with a reasonable accuracy compared to the non-linear Finite Elements analyses and to the experimental results. This
model can be incorporated in a global simulation environment of power electronic of electrical device since the computation time
is very short.
Index Terms— Inter-turn fault, finite elements methods, dynamic models, magnetic saturation.
I. INTRODUCTION
Inter turn fault in the stator winding is the consequence of insulation failures between two turns in the same phase and it is one of
the most common fault in electrical machines. This fault results in a very large short circuit current which could lead to the
machine breakdown if this current is not quickly detected and eliminated [1, 2]. Furthermore, from a pure modelling aspect, a
high short-circuit current causes magnetic saturation of stator yoke. In the literature, many authors have proposed linear circuit
models coupled with equivalent magnetic circuits in which the faulty machine is represented by a set of constant inductances and
resistances [3, 4]. Unfortunately, these models fail to give satisfactory results in the saturated case. In this case, finite element
(FE) analyses of the faulty machine lead to the most precise results. However, FE analyses are very costly in terms of
computation time. Furthermore, the machine geometry and the ferromagnetic materials have to be specified.
To reduce the computation time, circuit models extended to the non-linear case, are the preferred methods of analysis of saturated
faulty machines. The basic idea is to use a set of inductances which vary with the instantaneous current value as to deal with the
saturated case. Obviously, these current-dependent inductances, known as “saturated, incremental or dynamic inductances” need
to be determined [5]. When the machine geometry is available, FE methods or permeance networks [6, 7, 8] allow the
computation of these inductances under faulty conditions. Another approach consists of representing the faulty machine by a set
of non-linear differential equations where a map of the machine’s fluxes and their derivatives vs. the different currents are
introduced ; their computation being performed by FE, permeance network or winding function theory [9, 10, 11]. However, the
use of these approaches requires, again, the knowledge of the machine geometry and the B-H curves of the ferromagnetic
materials but the computation time is lower than the full FE analyses. All these works on saturated PM machines under inter-turn
faults conditions allow a good prediction of the machine performances as well as the current in the faulty turns. Researchers in
this area and experienced engineers are familiar with these approaches which require detailed data of the machine. These details
are of course not available for the machine end-user who needs much simple mathematical models with only few data generally
given by the manufacturer for the healthy machine.
In the healthy case, many authors [12, 13, 14, 15] have proposed models taking into account the saturation effect by using the d-
axis and q-axis machine magnetizing curves which can be given by the manufacturer [16]. By using theses curves, we propose in
this paper a fast dynamic mathematical model of PMSM under inter turn fault. The presented model is the extension, to the
saturated case, of the simple linear model of PMSM under inter-turn fault condition. This model whose parameters are obtained
from manufacturer’s data allows an evaluation of the saturated PMSM performances under inter-turn fault.
II. CLASSICAL LINEAR MODEL OF PMSM UNDER INTER-TURN FAULT
In linear conditions, the classical dynamic model of PMSM under inter turn short circuit can be developed in abc or dq frame.
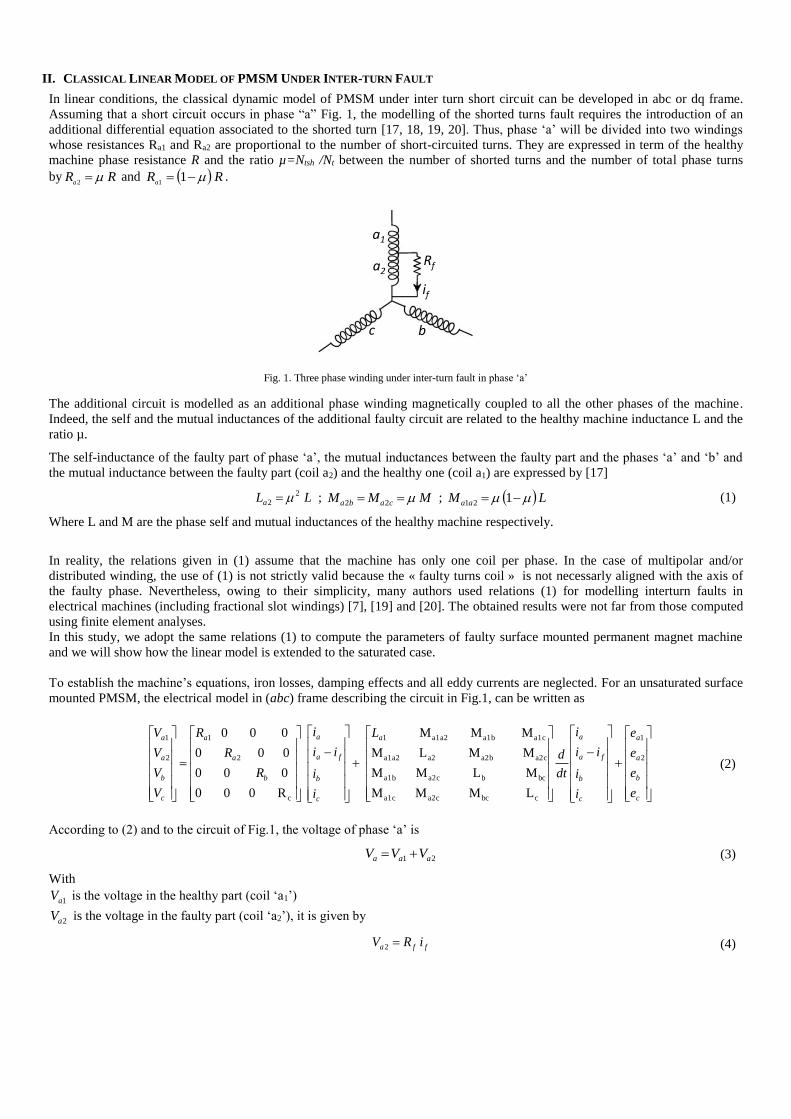
Assuming that a short circuit occurs in phase “a” Fig. 1, the modelling of the shorted turns fault requires the introduction of an
additional differential equation associated to the shorted turn [17, 18, 19, 20]. Thus, phase ‘a’ will be divided into two windings
whose resistances Ra1 and Ra2 are proportional to the number of short-circuited turns. They are expressed in term of the healthy
machine phase resistance R and the ratio µ=Ntsh /Nt between the number of shorted turns and the number of total phase turns
by RRa
2
and RRa
11
.
The additional circuit is modelled as an additional phase winding magnetically coupled to all the other phases of the machine.
Indeed, the self and the mutual inductances of the additional faulty circuit are related to the healthy machine inductance L and the
ratio µ.
The self-inductance of the faulty part of phase ‘a’, the mutual inductances between the faulty part and the phases ‘a’ and ‘b’ and
the mutual inductance between the faulty part (coil a2) and the healthy one (coil a1) are expressed by [17]
LLa
2
2 ; MMM caba 22 ; LM aa 121 (1)
Where L and M are the phase self and mutual inductances of the healthy machine respectively.
In reality, the relations given in (1) assume that the machine has only one coil per phase. In the case of multipolar and/or
distributed winding, the use of (1) is not strictly valid because the « faulty turns coil » is not necessarly aligned with the axis of
the faulty phase. Nevertheless, owing to their simplicity, many authors used relations (1) for modelling interturn faults in
electrical machines (including fractional slot windings) [7], [19] and [20]. The obtained results were not far from those computed
using finite element analyses.
In this study, we adopt the same relations (1) to compute the parameters of faulty surface mounted permanent magnet machine
and we will show how the linear model is extended to the saturated case.
To establish the machine’s equations, iron losses, damping effects and all eddy currents are neglected. For an unsaturated surface
mounted PMSM, the electrical model in (abc) frame describing the circuit in Fig.1, can be written as
c
b
a
a
c
b
fa
aa
c
b
fa
a
b
a
a
c
b
a
a
e
e
e
e
i
i
ii
i
dt
d
L
i
i
ii
i
R
R
R
V
V
V
V
2
1
cbca2ca1c
bcba2ca1b
a2ca2ba2a1a2
a1ca1ba1a21
c
2
1
2
1
L M M M
M L M M
M M L M
M M M
R 0 0 0
0 0 0
0 0 0
0 0 0
(2)
According to (2) and to the circuit of Fig.1, the voltage of phase ‘a’ is
21 aaa VVV (3)
With
1aV is the voltage in the healthy part (coil ‘a1’)
2aV is the voltage in the faulty part (coil ‘a2’), it is given by
ffa iRV 2 (4)
Rf
if
a1
a2
bc
Fig. 1. Three phase winding under inter-turn fault in phase ‘a’
fi is the fault current through the insulation fault resistance Rf which depends on the failure severity. Rf is very high in the
healthy case (several Mega Ohms).
The fault current if is a new state variable. Indeed, the modelling requires the introduction of an additional differential equation
associated to the shorted turn. From the circuit presented in Fig.1, the equation of the fault loop is given by
222222122 ...0 a
f
affac
cab
baa
aaaaa edt
diLiRR
dt
diM
dt
diM
dt
diMLiR (5)
For the balanced healthy PMSM, we have
RRRRR cba a21 (6)
LLLL cba a1a2a21 2ML (7)
MMMM bccaba 2a1c2a1b MM (8)
cbaaa eeeee 21 (9)
By considering these last equations, (2) can be rewritten as
abcf
abcf
abcfabcfabcfabcf edt
diLiRV (10)
Where the inductance matrix is
L M- M- ML-
M- L 0 0
M- 0 L 0
ML- 0 0
a2a2ca2ba1a2a2
a2cs
a2bs
a1a2a2s
abcf
L
L (11)
MLLs is the cyclical inductance.
abcfV , abcfi and abcfe are the stator voltage, current and back-EMF vectors, respectively. They are expressed by
Taabcf VV 0 V V cb ; Taabcf ii fcb i i i ; Tfcbaabcf e eeee (12)
The resistance matrix abcfR is
R R 0 0 R-
0 R 0 0
0 0 R 0
R- 0 0 R
R
fa2a2
a2
abcf (13)
fe is the back-EMF of the faulty turns (coil a2). It is expressed in term of the ratio µ by
af ee (14)
The back-EMFs in the three phases eabcf can be expressed as
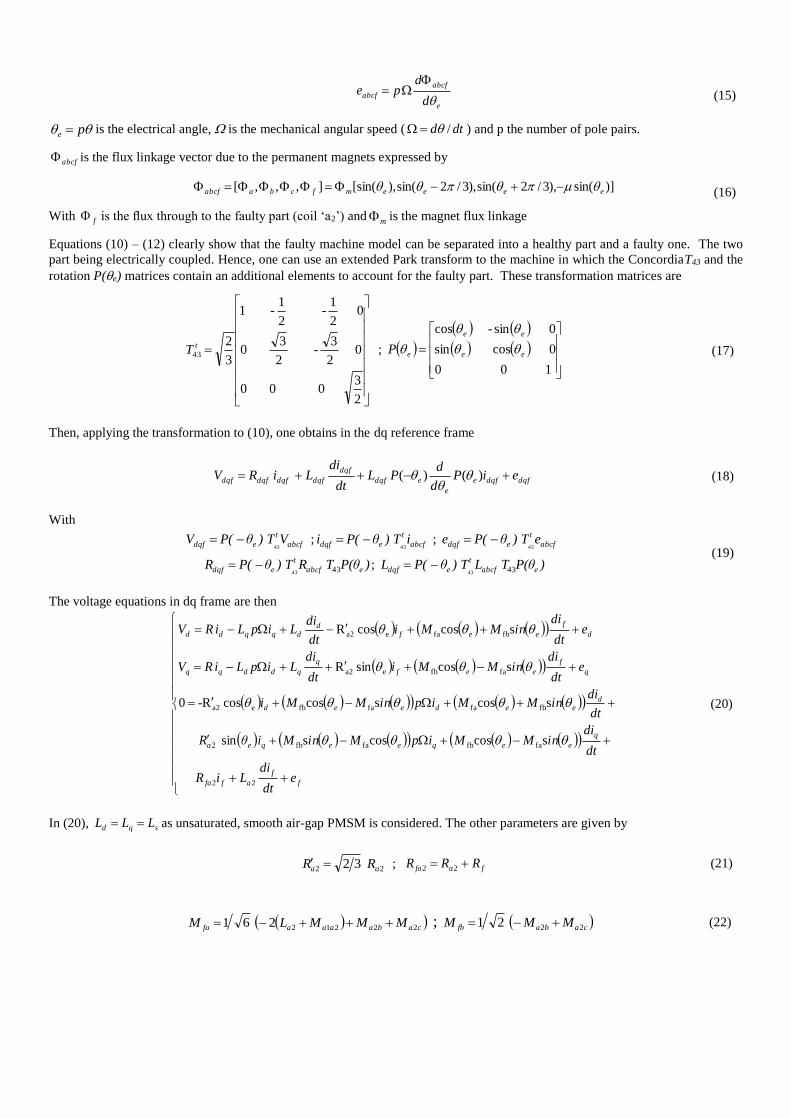
e
abcf
abcfd
dpe
(15)
pe is the electrical angle, is the mechanical angular speed ( dtd / ) and p the number of pole pairs.
abcf is the flux linkage vector due to the permanent magnets expressed by
)]sin(),3/2sin(),3/2sin(),[sin(],,,[ eeeemfcbaabcf (16)
With f is the flux through to the faulty part (coil ‘a2’) and m is the magnet flux linkage
Equations (10) – (12) clearly show that the faulty machine model can be separated into a healthy part and a faulty one. The two
part being electrically coupled. Hence, one can use an extended Park transform to the machine in which the ConcordiaT43 and the
rotation P(e) matrices contain an additional elements to account for the faulty part. These transformation matrices are
2
3 0 0 0
0 2
3-
2
3 0
0 2
1-
2
1- 1
3
243
tT ;
1 0 0
0 cos sin
0 sin- cos
ee
ee
eP
(17)
Then, applying the transformation to (10), one obtains in the dq reference frame
dqfdqfe
e
edqf
dqf
dqfdqfdqfdqf eiPd
dPL
dt
diLiRV )()(
(18)
With
43 abcf
t
edqf V) TθP(V ; 43 abcf
t
edqf i) TθP(i ; e) TθP(e abcf
t
edqf 43
)P(θ TR) TθP(R eabcf
t
edqf 4343 ; )P(θ TL) TθP(L eabcf
t
edqf 4343
(19)
The voltage equations in dq frame are then
f
f
affa
q
eeqeeqea
deedeed
q
f
eef
q
qddqq
d
f
eefd
dqqdd
edt
diLiR
dt
diinMMipMinMiθ R
dt
diinMMipinMMi
edt
diinMMi
dt
diLipLiRV
edt
diinMMi
dt
diLipLiRV
22
fafbfafb2
fbfafafbea2
fafbea2
fbfaea2
scoscosssin
scosscoscos R-0
scossin R
scoscos R
(20)
In (20), sqd LLL as unsaturated, smooth air-gap PMSM is considered. The other parameters are given by
22 32 aa RR ; fafa RRR 22 (21)
cabaaaafa MMMLM 222122 61 ; cabafb MMM 22 21 (22)
The stator winding of the PMSM under inter-turn fault is composed of two balanced parts in dq frame supplied by the phase currents (id and iq) and a faulty winding supplied by the fault current if. The electromagnetic torque is expressed as
ffqqdd
e
ieieie (23)
III. SATURATED DYNAMIC MATHEMATICAL MODEL UNDER INTER-TURN FAULT
In the voltage equations (20) under linear conditions, the inductances along the d and the q axes are constant ( sqd LLL ). This
is not anymore the case under saturated conditions. One approach commonly used to consider the saturation effect is to introduce
dynamic inductances noted ( dL
, qL
) instead of (dL , qL ) respectively. These inductances are obtained from the time derivatives of
the dq components of the flux linkage as follows
dt
diiL
dt
di
di
idi
dt
d ddd
d
d
dddd
.
(24)
dt
diiL
dt
di
di
idi
dt
d q
q
q
.
(25)
Regarding the faulty turns circuit, its self and mutual inductances are related, as shown by (1), to the self-inductance L of the
healthy machine. The simple approach introduced here is to use, in (1), an equivalent differential inductance L
instead of the
healthy phase inductance L.
The mutual inductance in PMSM with a concentrated winding can be neglected, so the phase inductance is the same as the d-axis
inductance which can be determined from the d-axis flux.
For distributed winding PMSM, the phase inductance can be calculated by assuming a constant flux leakage coefficient between
two stator phases. Hence, we introduce the following constant coefficient
L
Mk (26)
The phase inductance of the healthy machine is then
Notice that the current ia is obtained by inverse Park transformation from id and iq.
To summarize, one can say that the saturation effect is considered by simply substituting the linear inductances given above in (1)
by the dynamic ones calculated from the Ψd(id) and Ψq(iq) curves of the healthy machine. These curves can be given by the
manufacturer according to the IEEE standard [16], so an end-user does not need to use any numerical calculations. Alternatively,
these curves can be obtained from a simple experimental procedure. This will be described later. It is also important to note that
this non-linear model does not consider the cross saturation effect.
To implement the method in simulation, one can use a look-up table to compute the measured Ψd(id) and Ψq(iq) curves. In our
case, we used the following approximation of the flux-current curves
iaiaai 321 arctan (28)
From (28), we can derive the dynamic inductance expression as
322
2
21
1a
ia
aa
di
idiL
(29)
Where
i represents either di or qi
21 ,aa and 3a are unknown coefficients identified, as shown later, using least squares.
ada iLk
iL
1
1 (27)
IV. MODEL VALIDATION
To investigate the validity of the proposed approach, two surface mounted permanent magnet synchronous machines (PMSM) are
considered; with distributed winding and with concentrated (fractional-slot) winding.
For the PMSM with distributed winding, the geometry is known. In this case, the d-axis and q-axis magnetization curves are
computed for different d-axis and q-axis currents.
For the PMSM with concentrated winding, the geometry is unknown. In order to overcome this problem, the Ψd(id) and Ψq(iq)
curves are obtained by using a simple experiment which will be described later.
The main parameters of this machine in healthy condition and at rated operation are presented in Table I.
Table I Parameters of the studied machines
Parameter PMSM with
concentrated
winding
PMSM with
distributed
winding
Pole pairs, p 14 4
Number of slots, Ns 24 24
Phase inductance (linear case), L (mH) 2.3 3.1
Mutual inductance, M (mH) -0.05 -0.35
Phase resistance, R (Ω) 0.8 0.44
Series turns per phase, Nt 64 40
Magnets flux linkage, Ψm (Wb) 0.0821 0.081
Moment of inertia, J (kg.m2) 0.0019 0.018
Rated speed, N (rpm) 5000 1000
Rated torque, Γ (Nm) 15 11
A. Finite elements validation (PMSM with distributed winding)
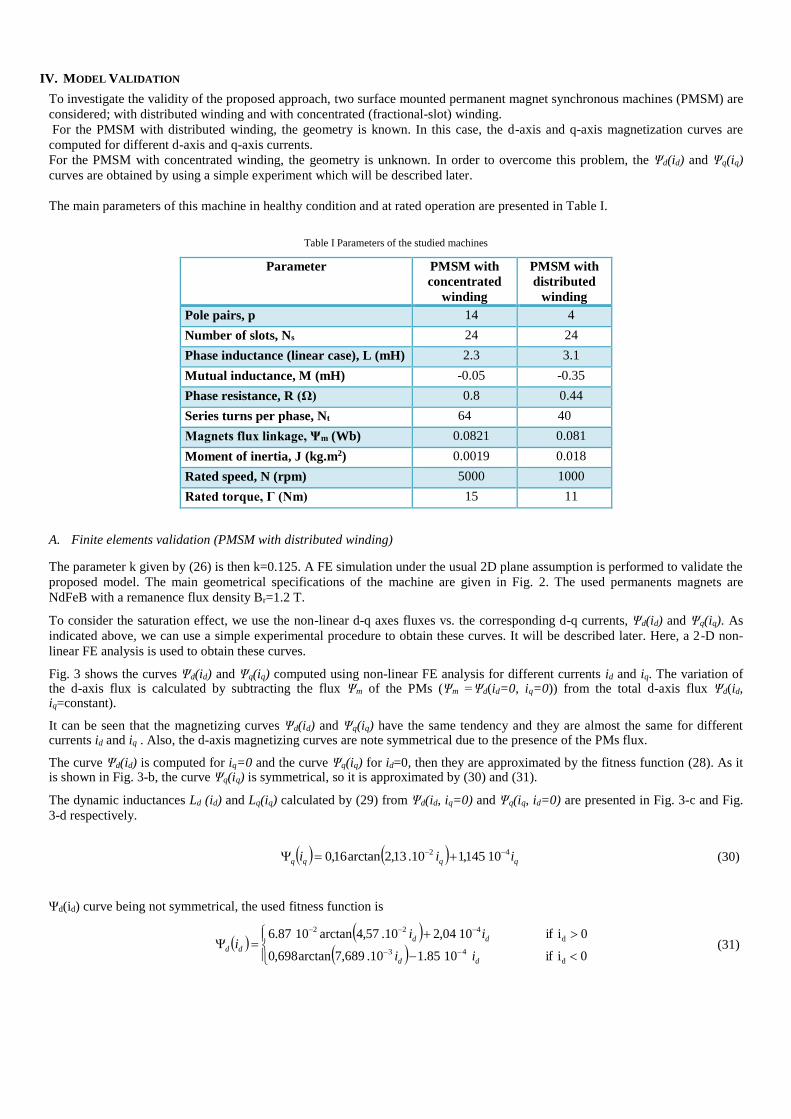
The parameter k given by (26) is then k=0.125. A FE simulation under the usual 2D plane assumption is performed to validate the
proposed model. The main geometrical specifications of the machine are given in Fig. 2. The used permanents magnets are
NdFeB with a remanence flux density Br=1.2 T.
To consider the saturation effect, we use the non-linear d-q axes fluxes vs. the corresponding d-q currents, Ψd(id) and Ψq(iq). As
indicated above, we can use a simple experimental procedure to obtain these curves. It will be described later. Here, a 2-D non-
linear FE analysis is used to obtain these curves.
Fig. 3 shows the curves Ψd(id) and Ψq(iq) computed using non-linear FE analysis for different currents id and iq. The variation of the d-axis flux is calculated by subtracting the flux Ψm of the PMs (Ψm =Ψd(id=0, iq=0)) from the total d-axis flux Ψd(id, iq=constant).
It can be seen that the magnetizing curves Ψd(id) and Ψq(iq) have the same tendency and they are almost the same for different currents id and iq . Also, the d-axis magnetizing curves are note symmetrical due to the presence of the PMs flux.
The curve Ψd(id) is computed for iq=0 and the curve Ψq(iq) for id=0, then they are approximated by the fitness function (28). As it is shown in Fig. 3-b, the curve Ψq(iq) is symmetrical, so it is approximated by (30) and (31).
The dynamic inductances Ld (id) and Lq(iq) calculated by (29) from Ψd(id, iq=0) and Ψq(iq, id=0) are presented in Fig. 3-c and Fig.
3-d respectively.
10145,110.13,2arctan16,0 42
qqqq iii (30)
Ψd(id) curve being not symmetrical, the used fitness function is
0i if 1085.110.689,7arctan698,0
0i if 1004,210.57,4arctan1087.6
d
43
d
422
dd
dd
ddii
iii (31)
Ø3,3
Ø4
Ø164,6
Ø73,6
Ø74,6
Ø56,6
Ø70,6
Fig. 2. Cross section view and geometrical parameters of the studied machine
-150 -100 -50 0 50 100 150-0.4
-0.3
-0.2
-0.1
0
0.1
0.2
id (A)
d (
Wb
)
iq=-10 A
iq=0 A
iq=30 A
iq=50 A
-150 -100 -50 0 50 100 150
-0.2
-0.1
0
0.1
0.2
0.3
iq (A)
q (
Wb
)
id=-20 A
id=0 A
id=70 A
id=100 A
(a) (b)
-150 -100 -50 0 50 100 1500
1
2
3
4
id (A)
Ld (m
H)
-150 -100 -50 0 50 100 1500
1
2
3
4
iq (A)
Lq (m
H)
(c) (d)
Fig. 3.Flux-current magnetization and dynamic inductances curves of the studied PMSM (a) Ψd(id, iq constant) (b) Ψq(iq, id constant) (c) Ld(id) (d) Lq(iq)
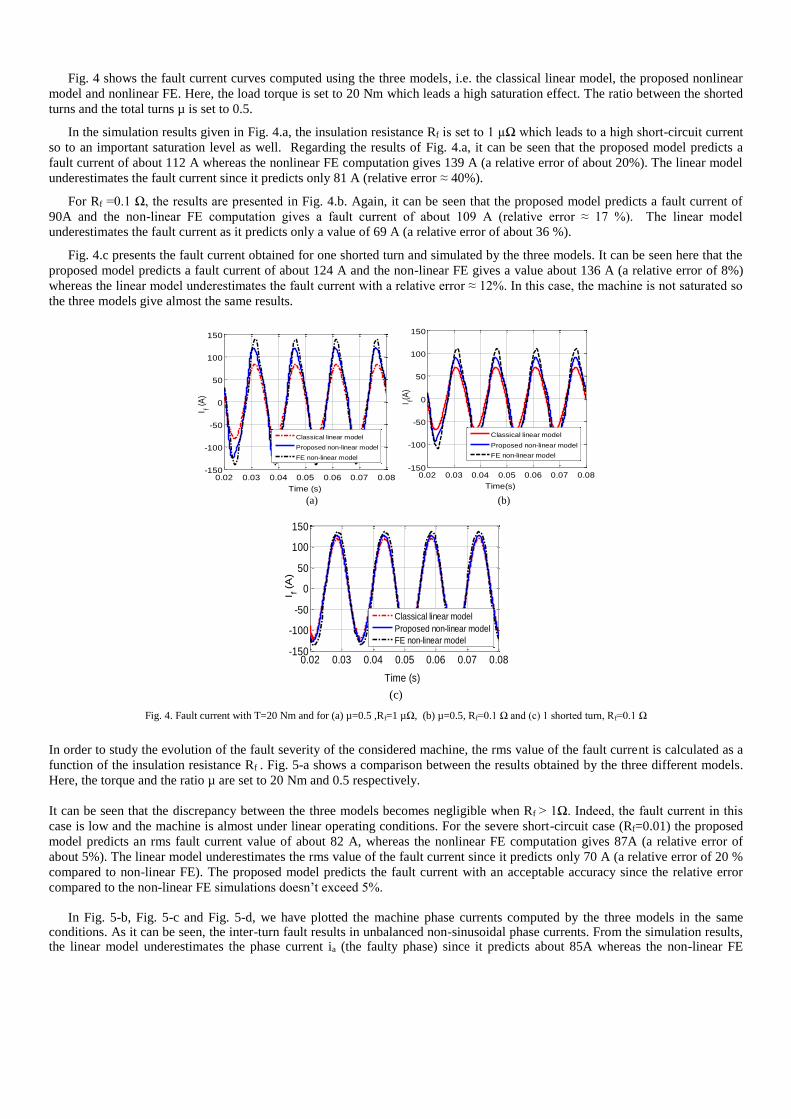
Fig. 4 shows the fault current curves computed using the three models, i.e. the classical linear model, the proposed nonlinear
model and nonlinear FE. Here, the load torque is set to 20 Nm which leads a high saturation effect. The ratio between the shorted
turns and the total turns µ is set to 0.5.
In the simulation results given in Fig. 4.a, the insulation resistance Rf is set to 1 µΩ which leads to a high short-circuit current
so to an important saturation level as well. Regarding the results of Fig. 4.a, it can be seen that the proposed model predicts a
fault current of about 112 A whereas the nonlinear FE computation gives 139 A (a relative error of about 20%). The linear model
underestimates the fault current since it predicts only 81 A (relative error ≈ 40%).
For Rf =0.1 Ω, the results are presented in Fig. 4.b. Again, it can be seen that the proposed model predicts a fault current of
90A and the non-linear FE computation gives a fault current of about 109 A (relative error ≈ 17 %). The linear model
underestimates the fault current as it predicts only a value of 69 A (a relative error of about 36 %).
Fig. 4.c presents the fault current obtained for one shorted turn and simulated by the three models. It can be seen here that the
proposed model predicts a fault current of about 124 A and the non-linear FE gives a value about 136 A (a relative error of 8%)
whereas the linear model underestimates the fault current with a relative error ≈ 12%. In this case, the machine is not saturated so
the three models give almost the same results.
0.02 0.03 0.04 0.05 0.06 0.07 0.08-150
-100
-50
0
50
100
150
Time (s)
I f (A
)
Classical linear model
Proposed non-linear model
FE non-linear model
0.02 0.03 0.04 0.05 0.06 0.07 0.08-150
-100
-50
0
50
100
150
Time(s)
I f(A)
Classical linear model
Proposed non-linear model
FE non-linear model
(a) (b)
0.02 0.03 0.04 0.05 0.06 0.07 0.08-150
-100
-50
0
50
100
150
Time (s)
I f (A
)
Classical linear model
Proposed non-linear model
FE non-linear model
(c)
Fig. 4. Fault current with T=20 Nm and for (a) µ=0.5 ,Rf=1 µΩ, (b) µ=0.5, Rf=0.1 Ω and (c) 1 shorted turn, Rf=0.1 Ω
In order to study the evolution of the fault severity of the considered machine, the rms value of the fault current is calculated as a
function of the insulation resistance Rf . Fig. 5-a shows a comparison between the results obtained by the three different models.
Here, the torque and the ratio µ are set to 20 Nm and 0.5 respectively.
It can be seen that the discrepancy between the three models becomes negligible when Rf > 1Ω. Indeed, the fault current in this
case is low and the machine is almost under linear operating conditions. For the severe short-circuit case (Rf=0.01) the proposed
model predicts an rms fault current value of about 82 A, whereas the nonlinear FE computation gives 87A (a relative error of
about 5%). The linear model underestimates the rms value of the fault current since it predicts only 70 A (a relative error of 20 %
compared to non-linear FE). The proposed model predicts the fault current with an acceptable accuracy since the relative error
compared to the non-linear FE simulations doesn’t exceed 5%.
In Fig. 5-b, Fig. 5-c and Fig. 5-d, we have plotted the machine phase currents computed by the three models in the same
conditions. As it can be seen, the inter-turn fault results in unbalanced non-sinusoidal phase currents. From the simulation results, the linear model underestimates the phase current ia (the faulty phase) since it predicts about 85A whereas the non-linear FE
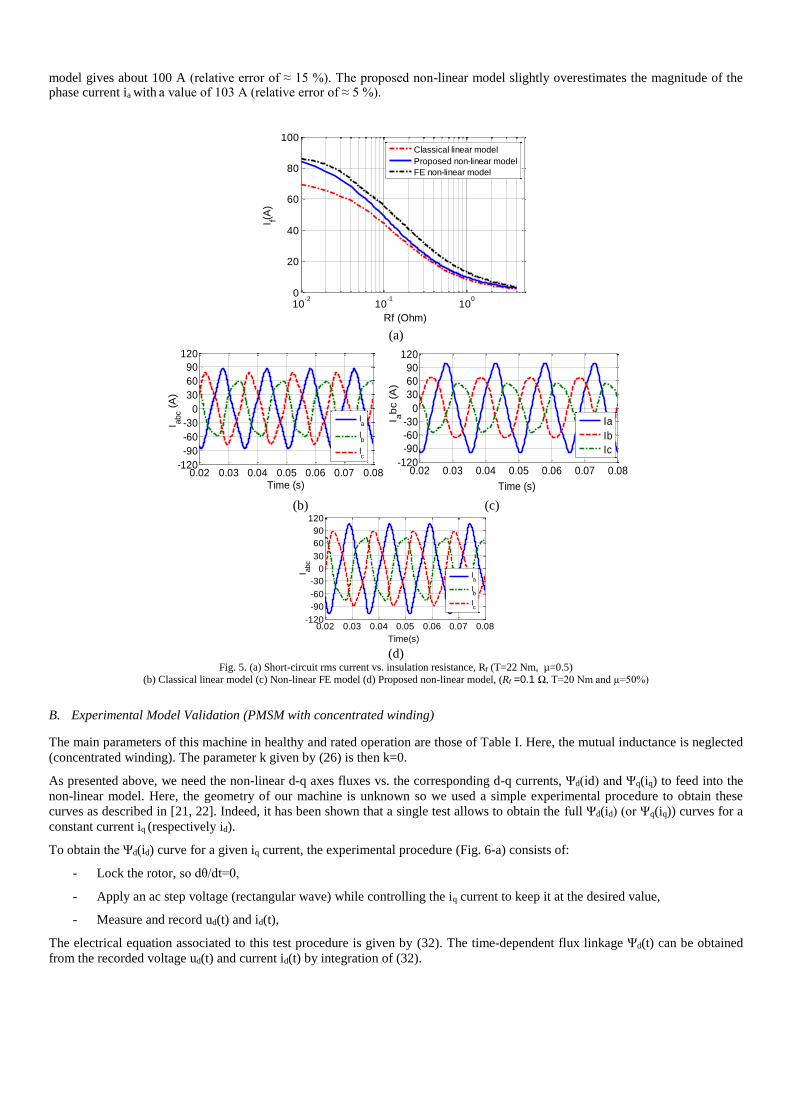
model gives about 100 A (relative error of ≈ 15 %). The proposed non-linear model slightly overestimates the magnitude of the phase current ia with a value of 103 A (relative error of ≈ 5 %).
10-2
10-1
100
0
20
40
60
80
100
Rf (Ohm)
I f(A)
Classical linear model
Proposed non-linear model
FE non-linear model
(a)
0.02 0.03 0.04 0.05 0.06 0.07 0.08-120
-90
-60
-30
0
30
60
90
120
Time (s)
I abc (
A)
Ia
Ib
Ic
0.02 0.03 0.04 0.05 0.06 0.07 0.08-120
-90
-60
-30
0
30
60
90
120
Time (s)
I ab
c (
A)
Ia
Ib
Ic
(b) (c)
0.02 0.03 0.04 0.05 0.06 0.07 0.08-120
-90
-60
-30
0
30
60
90
120
Time(s)
I abc
Ia
Ib
Ic
(d)
Fig. 5. (a) Short-circuit rms current vs. insulation resistance, Rf (T=22 Nm, µ=0.5)
(b) Classical linear model (c) Non-linear FE model (d) Proposed non-linear model, (Rf =0.1 Ω, T=20 Nm and µ=50%)
B. Experimental Model Validation (PMSM with concentrated winding)
The main parameters of this machine in healthy and rated operation are those of Table I. Here, the mutual inductance is neglected
(concentrated winding). The parameter k given by (26) is then k=0.
As presented above, we need the non-linear d-q axes fluxes vs. the corresponding d-q currents, Ψd(id) and Ψq(iq) to feed into the
non-linear model. Here, the geometry of our machine is unknown so we used a simple experimental procedure to obtain these
curves as described in [21, 22]. Indeed, it has been shown that a single test allows to obtain the full Ψd(id) (or Ψq(iq)) curves for a
constant current iq (respectively id).
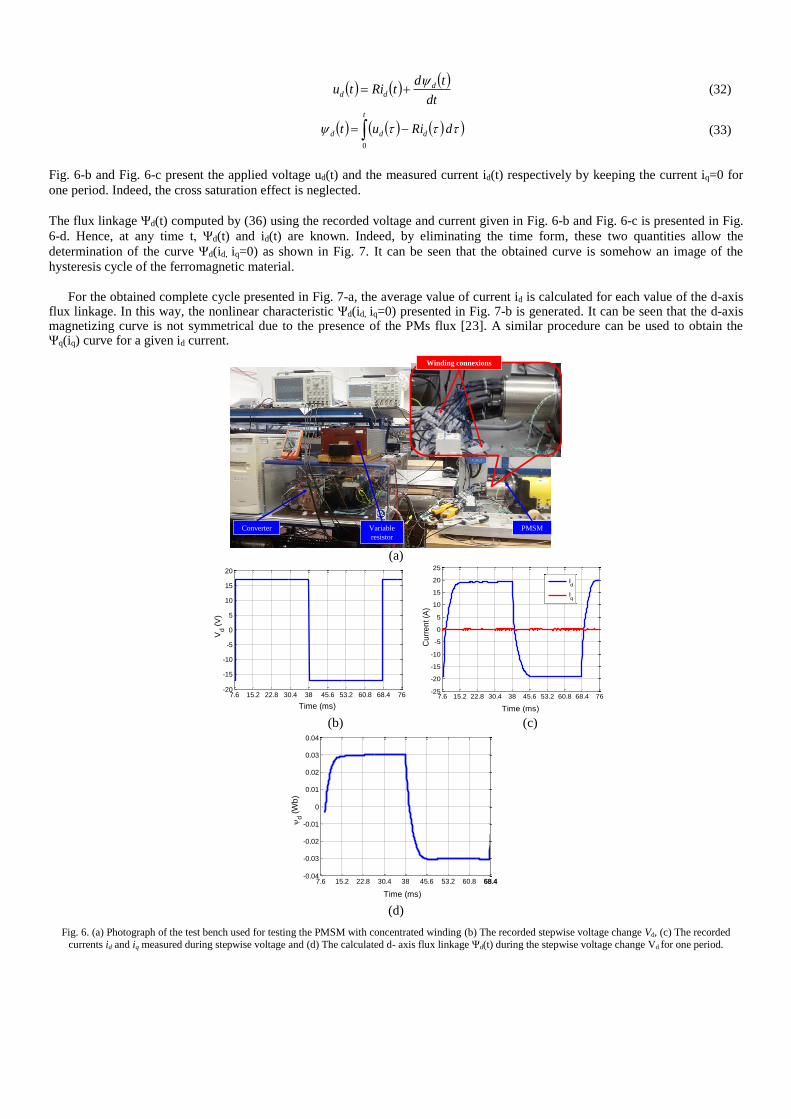
To obtain the Ψd(id) curve for a given iq current, the experimental procedure (Fig. 6-a) consists of:
- Lock the rotor, so dθ/dt=0,
- Apply an ac step voltage (rectangular wave) while controlling the iq current to keep it at the desired value,
- Measure and record ud(t) and id(t),
The electrical equation associated to this test procedure is given by (32). The time-dependent flux linkage Ψd(t) can be obtained
from the recorded voltage ud(t) and current id(t) by integration of (32).
dt
tdtRitu d
dd
(32)
t
ddd dRiut
0
(33)
Fig. 6-b and Fig. 6-c present the applied voltage ud(t) and the measured current id(t) respectively by keeping the current iq=0 for
one period. Indeed, the cross saturation effect is neglected.
The flux linkage Ψd(t) computed by (36) using the recorded voltage and current given in Fig. 6-b and Fig. 6-c is presented in Fig.
6-d. Hence, at any time t, Ψd(t) and id(t) are known. Indeed, by eliminating the time form, these two quantities allow the
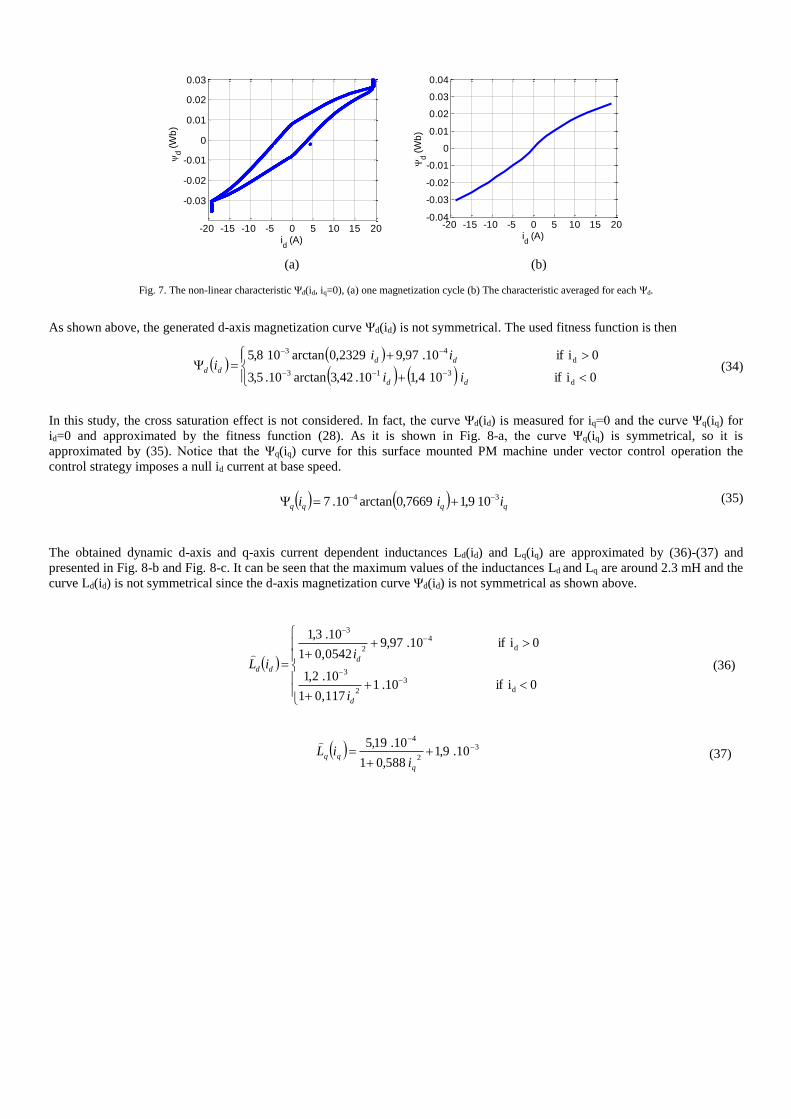
determination of the curve Ψd(id, iq=0) as shown in Fig. 7. It can be seen that the obtained curve is somehow an image of the
hysteresis cycle of the ferromagnetic material.
For the obtained complete cycle presented in Fig. 7-a, the average value of current id is calculated for each value of the d-axis
flux linkage. In this way, the nonlinear characteristic Ψd(id, iq=0) presented in Fig. 7-b is generated. It can be seen that the d-axis magnetizing curve is not symmetrical due to the presence of the PMs flux [23]. A similar procedure can be used to obtain the Ψq(iq) curve for a given id current.
Converter PMSMVariable
resistor
Winding connexions
(a)
7.6 15.2 22.8 30.4 38 45.6 53.2 60.8 68.4 76-20
-15
-10
-5
0
5
10
15
20
Time (ms)
Vd (
V)
7.6 15.2 22.8 30.4 38 45.6 53.2 60.8 68.4 76-25
-20
-15
-10
-5
0
5
10
15
20
25
Time (ms)
Cu
rre
nt (A
)
Id
Iq
(b) (c)
7.6 15.2 22.8 30.4 38 45.6 53.2 60.8 68.468.4-0.04
-0.03
-0.02
-0.01
0
0.01
0.02
0.03
0.04
Time (ms)
d (
Wb
)
(d)
Fig. 6. (a) Photograph of the test bench used for testing the PMSM with concentrated winding (b) The recorded stepwise voltage change Vd, (c) The recorded
currents id and iq measured during stepwise voltage and (d) The calculated d- axis flux linkage Ψd(t) during the stepwise voltage change Vd for one period.
-20 -15 -10 -5 0 5 10 15 20
-0.03
-0.02
-0.01
0
0.01
0.02
0.03
id (A)
d (
Wb
)
-20 -15 -10 -5 0 5 10 15 20-0.04
-0.03
-0.02
-0.01
0
0.01
0.02
0.03
0.04
id (A)
d (
Wb
)
(a) (b)
Fig. 7. The non-linear characteristic Ψd(id, iq=0), (a) one magnetization cycle (b) The characteristic averaged for each Ψd.
As shown above, the generated d-axis magnetization curve Ψd(id) is not symmetrical. The used fitness function is then
0i if 104,110.42,3arctan10.5,3
0i if 10.97,92329,0arctan108,5
d
313
d
43
dd
dd
ddii
iii (34)
In this study, the cross saturation effect is not considered. In fact, the curve Ψd(id) is measured for iq=0 and the curve Ψq(iq) for
id=0 and approximated by the fitness function (28). As it is shown in Fig. 8-a, the curve Ψq(iq) is symmetrical, so it is
approximated by (35). Notice that the Ψq(iq) curve for this surface mounted PM machine under vector control operation the
control strategy imposes a null id current at base speed.
109,17669,0arctan10.7 34
qqqq iii (35)
The obtained dynamic d-axis and q-axis current dependent inductances Ld(id) and Lq(iq) are approximated by (36)-(37) and
presented in Fig. 8-b and Fig. 8-c. It can be seen that the maximum values of the inductances Ld and Lq are around 2.3 mH and the
curve Ld(id) is not symmetrical since the d-axis magnetization curve Ψd(id) is not symmetrical as shown above.
0i if 10.1 0,1171
10.2,1
0i if 10.97,9 0,05421
10.3,1
d
3
2
3
d
4
2
3
d
d
dd
i
iiL
(36)
3
2
4
10.9,1588,01
10.19,5
q
qqi
iL
(37)
-20 -15 -10 -5 0 5 10 15 20-0.04
-0.03
-0.02
-0.01
0
0.01
0.02
0.03
0.04
Current (A)F
lux (W
b)
d (i
d, i
q=0) measured
d (i
d, i
q=0) fitted
q (i
q, i
d=0) measured
q (i
q, i
d=0) fitted
(a)
-20 -15 -10 -5 0 5 10 15 200
0.4
0.8
1.2
1.6
2
2.4
id (A)
Ld (
mH
)
-20 -15 -10 -5 0 5 10 15 200
0.4
0.8
1.2
1.6
2
2.4
Iq (A)
Lq (
mH
)
(b) (c)
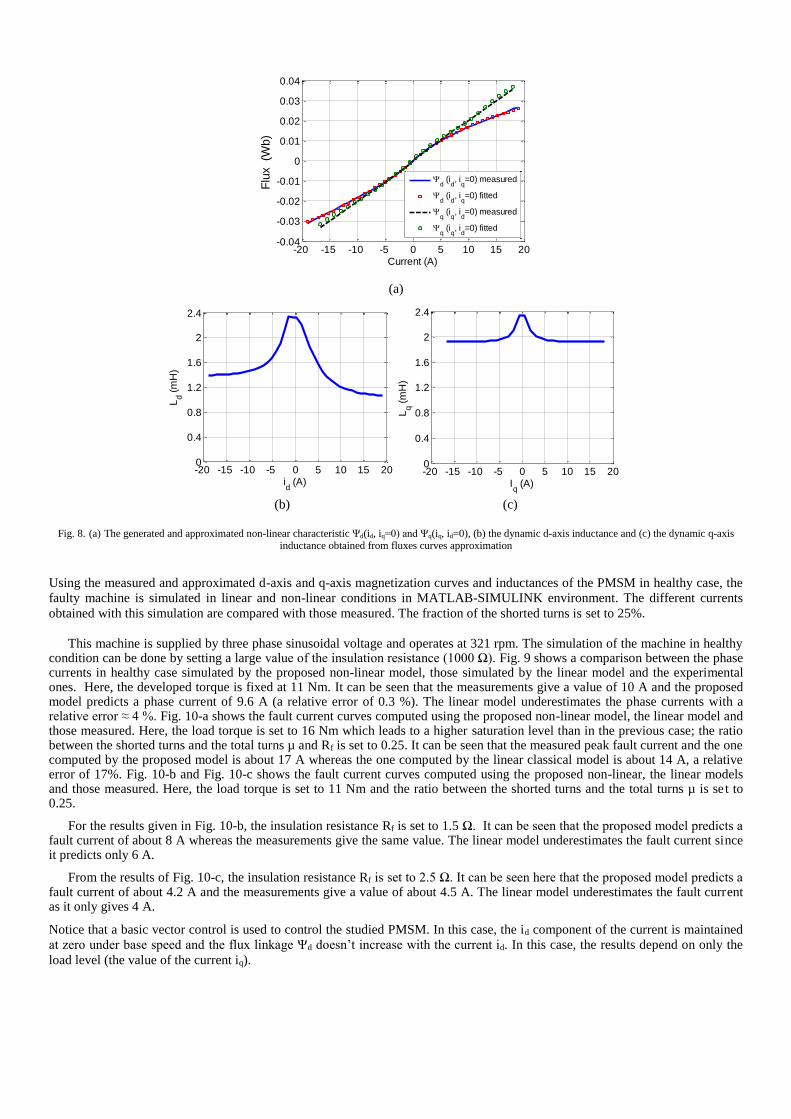
Fig. 8. (a) The generated and approximated non-linear characteristic Ψd(id, iq=0) and Ψq(iq, id=0), (b) the dynamic d-axis inductance and (c) the dynamic q-axis
inductance obtained from fluxes curves approximation
Using the measured and approximated d-axis and q-axis magnetization curves and inductances of the PMSM in healthy case, the
faulty machine is simulated in linear and non-linear conditions in MATLAB-SIMULINK environment. The different currents
obtained with this simulation are compared with those measured. The fraction of the shorted turns is set to 25%.
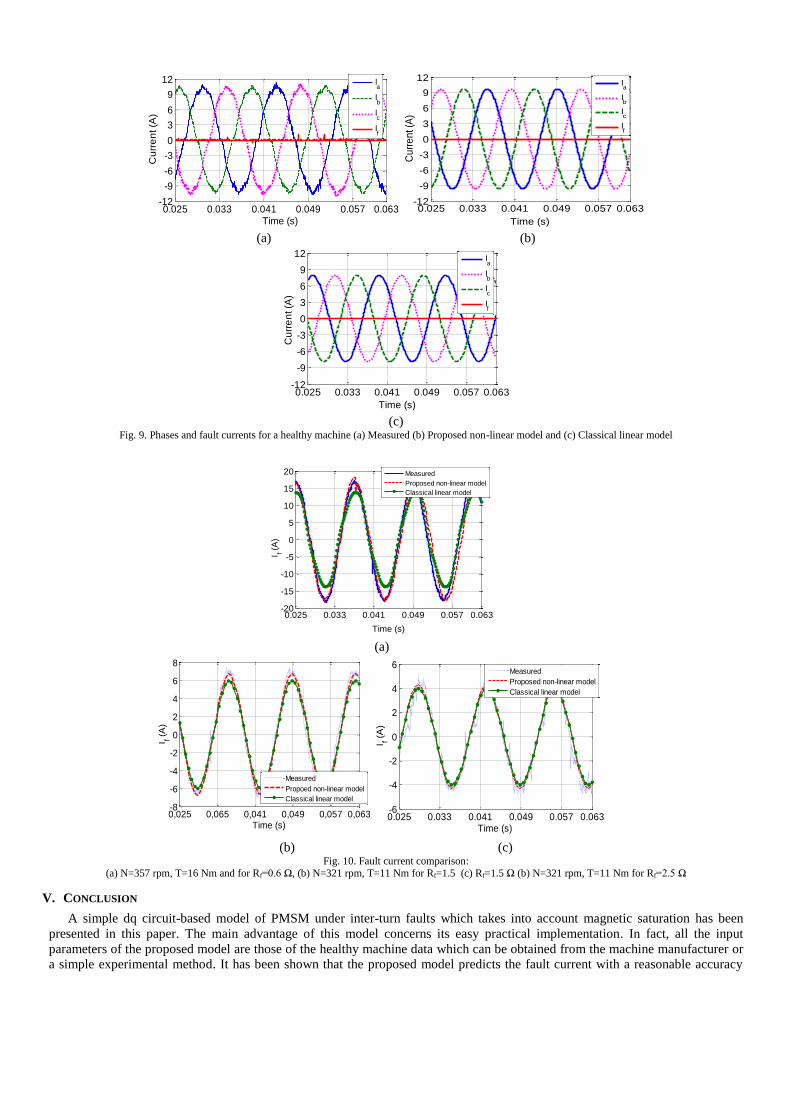
This machine is supplied by three phase sinusoidal voltage and operates at 321 rpm. The simulation of the machine in healthy
condition can be done by setting a large value of the insulation resistance (1000 Ω). Fig. 9 shows a comparison between the phase currents in healthy case simulated by the proposed non-linear model, those simulated by the linear model and the experimental ones. Here, the developed torque is fixed at 11 Nm. It can be seen that the measurements give a value of 10 A and the proposed model predicts a phase current of 9.6 A (a relative error of 0.3 %). The linear model underestimates the phase currents with a relative error ≈ 4 %. Fig. 10-a shows the fault current curves computed using the proposed non-linear model, the linear model and those measured. Here, the load torque is set to 16 Nm which leads to a higher saturation level than in the previous case; the ratio between the shorted turns and the total turns µ and Rf is set to 0.25. It can be seen that the measured peak fault current and the one computed by the proposed model is about 17 A whereas the one computed by the linear classical model is about 14 A, a relative error of 17%. Fig. 10-b and Fig. 10-c shows the fault current curves computed using the proposed non-linear, the linear models and those measured. Here, the load torque is set to 11 Nm and the ratio between the shorted turns and the total turns µ is set to 0.25.
For the results given in Fig. 10-b, the insulation resistance Rf is set to 1.5 Ω. It can be seen that the proposed model predicts a fault current of about 8 A whereas the measurements give the same value. The linear model underestimates the fault current since it predicts only 6 A.
From the results of Fig. 10-c, the insulation resistance Rf is set to 2.5 Ω. It can be seen here that the proposed model predicts a fault current of about 4.2 A and the measurements give a value of about 4.5 A. The linear model underestimates the fault current as it only gives 4 A.
Notice that a basic vector control is used to control the studied PMSM. In this case, the id component of the current is maintained
at zero under base speed and the flux linkage Ψd doesn’t increase with the current id. In this case, the results depend on only the
load level (the value of the current iq).
0.025 0.033 0.041 0.049 0.057 0.063-12
-9
-6
-3
0
3
6
9
12
Time (s)
Cu
rre
nt (A
)
Ia
Ib
Ic
If
0.025 0.033 0.041 0.049 0.057 0.063-12
-9
-6
-3
0
3
6
9
12
Time (s)
Cu
rre
nt (
A)
Ia
Ib
Ic
If
(a) (b)
0.025 0.033 0.041 0.049 0.057 0.063-12
-9
-6
-3
0
3
6
9
12
Time (s)
Cu
rre
nt (A
)
Ia
Ib
Ic
If
(c)
Fig. 9. Phases and fault currents for a healthy machine (a) Measured (b) Proposed non-linear model and (c) Classical linear model
0.025 0.033 0.041 0.049 0.057 0.063-20
-15
-10
-5
0
5
10
15
20
Time (s)
I f (A
)
Measured
Proposed non-linear model
Classical linear model
(a)
0,025 0,065 0,041 0,049 0,057 0,063-8
-6
-4
-2
0
2
4
6
8
Time (s)
I f (A
)
Measured
Propoed non-linear model
Classical linear model
0.025 0.033 0.041 0.049 0.057 0.063-6
-4
-2
0
2
4
6
Time (s)
I f (A
)
Measured
Proposed non-linear model
Classical linear model
(b) (c)
Fig. 10. Fault current comparison: (a) N=357 rpm, T=16 Nm and for Rf=0.6 Ω, (b) N=321 rpm, T=11 Nm for Rf=1.5 (c) Rf=1.5 Ω (b) N=321 rpm, T=11 Nm for Rf=2.5 Ω
V. CONCLUSION
A simple dq circuit-based model of PMSM under inter-turn faults which takes into account magnetic saturation has been
presented in this paper. The main advantage of this model concerns its easy practical implementation. In fact, all the input
parameters of the proposed model are those of the healthy machine data which can be obtained from the machine manufacturer or
a simple experimental method. It has been shown that the proposed model predicts the fault current with a reasonable accuracy
compared to the FE analyses and to the experimental results. The computation time is very short which makes the model suitable
to be incorporated in a global simulation environment of power systems which include electromechanical drives.
REFERENCES
[1] S. B. Lee, R. M. Tallam, and T. G. Habetler, "A robust, on-line turn-fault detection technique for induction machines based on monitoring the sequence component impedance matrix," IEEE Trans. Power Electronics, vol. 18, no. 3, pp. 865-872, May 2003.
[2] D. Diallo, M. E. H. Benbouzid, D. Hamad, and X. Pierre, "Fault Detection and Diagnosis in an Induction Machine Drive: A Pattern Recognition Approach Based on Concordia Stator Mean Current Vector," IEEE Transactions on Energy Conversion, vol. 20, no. 3, pp. 512-519, Sep. 2005.
[3] B. Vaseghi, B. Nahid-Mobarakeh, N. Takorabet, and F. Meibody-Tabar, "Inductance identification and study of PM motor with winding turn short circuit fault," IEEE Trans. Magn., vol. 47, no. 5, pp. 978–981, May. 2011.
[4] N. Leboeuf, T. Boileau, B. Nahid-Mobarakeh, N. Takorabet, F. Meibody-Tabar, and G. CLerc, "Inductance Calculations in PM Motors Under Fault Conditions, " IEEE Trans. Magn, vol. PP, no. 99, p. 1, 2012.
[5] L.Yue, P. Yulong, Y. Yanjun, S. Yanwen, C. Feng, "Increasing the saliency ratio of fractional slot concentrated winding interior permanent magnet synchronous motors," IET Electr. Power Appl., Vol. 9, Iss. 7, pp. 439–448, 2015
[6] O.A. Mohammad, Z. liu, S. Liu, and N. Y. Abed, "Internal Short Circuit Fault Diagnosis for PM Machines Using FE-Based Phase Variable Model and
Wavelets Analysis," IEEE Trans. Magn, vol.33, No.4, 2007.
[7] N. Leboeuf, Th. Boileau, B. Nahid-Mobarakeh, N. Takorabet, F. Meibody-Tabar, and G. Clerc, " Estimating Permanent-Magnet Motor Parameters Under Inter-Turn Fault Conditions," IEEE Trans. Magn., vol. 48, no. 2, pp. 963-966, Feb 2012.
[8] A. Mahyob, P. Reghem, G. Barakat, " Permeance Network Modeling of the Stator Winding Faults in Electrical Machines," IEEE Trans. Magn., vol. 45, no. 3, pp. 1820 - 1823, 2009.
[9] B. Sen, J. Wang and P. Lazari, "A Detailed Transient Model of Interior Permanent Magnet Motor Accounting For Saturation under Stator Turn Fault, " IEEE
conference on Energy Conversion Congress and Exposition (ECCE), pp. 3548 – 3555, 15-19 Sept 2013.
[10] L. Quéval and H. Ohsaki, "Nonlinear abc-Model for Electrical Machines Using N-D Lookup Table," IEEE Trans. Energy Convers., vol. 99, no. 99, pp. 1–7, 09 Oct 2014.
[11] S. Hemmati, S. S. Kojoori, S. Saied, T. A. Lipo, "Modelling and experimental validation of internal short-circuit fault in salient-pole synchronous machines using numerical gap function including stator and rotor core saturation," IET Electr. Power, Vol. 7, Iss. 5, pp. 391–399, Appl, 2013
[12] P. Ponomarev, I. Petrov, and J. Pyrhönen, "Influence of Travelling Current Linkage Harmonics on Inductance Variation, Torque Ripple and Sensorless
Capability of Tooth-Coil Permanent-Magnet Synchronous Machines," IEEE Trans. Magn., vol. 50, no. 1, pp. 8200108, Jan. 2014.
[13] F.P. De Mello, and L.N. Hannett, "Representation of saturation in synchronous machines," IEEE Trans. on Power Systems, Vol. PWRS-1, No. 4, pp. 8-18,
Nov. 1986.
[14] N. Bianchi, S. Bolognani, "Magnetic Models of Saturated Interior Permanent Magent Motors based on Finite Element Analysis," 33rd Annual Meeting of
the IEEE Industrial Applications Conference, Vol.1., pp.27-34, 12.-15. Oct 1998.
[15] M. Kazerooni, S. Hamidifar, N. C. Kar, "Analytical modelling and parametric sensitivity analysis for the PMSM steady-state performance prediction," IET
Electr. Power Appl., Vol. 7, Iss. 7, pp. 586–596, 2013.
[16] IEEE Std 115-1995, Guide: Test Procedures for Synchronous Machines, in IEEE Standards Collection Electric Machinery, Published by IEEE, 1997.
[17] B. Vaseghi, N. Takorabet, and F. Meibody-Tabar, "Fault Analysis and Parameter Identification of Permanent-Magnet Motors by the Finite-Element
Method," IEEE Trans. Magn., vol. 45, no. 9, pp. 3290 - 3295, 2009.
[18] S. Williamson and P. Mirzoian, "Analysis of cage induction motcr with stator winding turn faults," IEEE Transactions on Power Apparatus and Systems, vol. 104, no. 7, pp. 1838-1842, 1985.
[19] J. A. Farooq, T. Raminosoa, A. Djerdir, and A. Miraoui, "Modeling and simulation of stator inter-turns faults in permanent magnet synchronous motors,"
Compel J., vol. 27, no. 4, pp. 887–896, 2008.
[20] R. M. Tallam, T. G. Habetler, and R. G. Harley, "Transient Model for Induction Machines With Stator Winding Turn Faults," IEEE Trans. Ind. Appl, vol. 38, no. 2, pp. 632-637, May 2002.
[21] G. Stumberger, B. Stumberger, D. Dolinar, A. Hamler, M. Trlep, "Evaluation of saturation and cross-magnetization effects in interior permanent magnet synchronous motor," 36th IAS Annual Meeting, IEEE Industry Applications Conference, Vol. 4, pp. 2557 – 2562, 2001.
[22] G. Stumberger, B. Stumberger, D. Dolinarm, "Identification of linear synchronous reluctance motor parameters," IEEE Industry Applications Conference, Vol. 1, pp. 7 – 14, 2000.
[23] W.L.Soong, "Inductactance Measurments for Synchronous Machine, " PEBN#2, May 2008.
Available online http://www.eleceng.adelaide.edu.au/research/power/pebn/