beliefs, attitudes and intentions to use technology- enabled
TRANSCRIPT

Chapter 9
BELIEFS, ATTITUDES AND INTENTIONS TO USE TECHNOLOGY-ENABLED BANKING SELF-SERVICES
9.1 Introduction
This chapter explores the relationships among bank customers’
antecedent beliefs, their attitudes toward electronic banking self-services,
intentions to use and their usage of them. Two electronic banking self-services
are used to explore these relationships one being ATM which is widely adopted
and the other being internet banking, which is yet to be extensively adopted.
The constructs from SST attitude/intention model by Curren and Meuter (2005)
and Technology Acceptance Model (TAM) by Davis (1989) are utilized to
develop the research models proposed in this chapter.
9.2 Beliefs, Attitudes and Intention to use Technology-Enabled Banking Self-Services (TEBSS)
The different constructs used in the study are explained in this section.
These constructs are related to the beliefs, attitudes and intention to use TEBSS.
9.2.1Antecedent Beliefs proposed as predictors of Attitudes towards TEBSS Antecedent beliefs used as predictors of attitude towards TEBSS were
proposed after an extensive literature review of the literature (Curran and
Meuter, 2005; Davis et al.,1989; Igabria, 1996; Walker and Johnson, 2006; and
Dabholkar, 1994). The ‘ease of use’ and ‘usefulness’ which have been

Chapter-9
244
extensively explored in the Technology Acceptance model (TAM) of Davis et
al (1989) are used as antecedent beliefs both in the case of models for ATMs
and internet banking.
Ease of use as explained earlier in the literature review is the extent to
which a user finds the usage of a technology-enabled service free of effort as
propounded by Davis et al. (1989). This construct which is the key construct of
Technology Acceptance Model (Davis et al 1989) has been used in several
subsequent studies such as those done by Adams et al. (1992), Dabohlkar,
(1994), Igabria et al. (1995) and Taylor and Todd (1995).
Usefulness as explained in detail in chapter 3 is the perception with
regard to what extent the usage of a technology enabled service would help
improve a user’s performance of a given task. Usefulness is the second key
construct of Technology Acceptance Model of Davis et al. (1989). This
construct has also been used in the earlier mentioned studies done by Adams et
al. (1992), Dabohlkar (1994), Igabria et al. (1995) and Taylor and Todd
(1995).
Separate belief constructs have been considered depending on the
individual characteristics of ATMs and internet banking for explanation of the
models.
9.2.1.1 Additional ATM belief constructs
‘Security of usage’ involved has been adopted from the study by Curran
and Meuter (2005), even though the name given in Curran and Meuter’s (2005)
was risk. A separate construct ‘security of usage’ which actually is related to
the risk perception had been developed because unlike in the case of internet
banking wherein the risk is the unauthorized access to the bank customers’ bank
accounts, the security or risk perception in case of usage of ATMs lies more in

Beliefs, Attitudes and Intentions to Use Technology-Enabled Banking Self-Services
245
relation to the aspects such as physical security, safety and convenience of
location. Security of usage had not been that widely studied. This new construct
was expected to open new avenues in the research based on technology
acceptance model (TAM), thus improve our understanding of the self service
usage and adoption of services like those provided through ATMs.
9.2.1.2 Additional belief constructs for Internet banking
Compatibility is a construct adopted from the original work of Rogers
(1995) Diffusion of Innovation. It is defined as the degree to which an
innovation is perceived as being consistent with the existing values, past
experiences and the needs of potential adopters. From the literature it is found
that those customers who were having prior experience with computers (Mattila
et al., 2001; Karjaluoto H et al., 2002), high P C proficiency (Jayawardhena and
Foley, 2000) and who were comfortable with internet usage (Black et. al., 2001)
would take to internet banking faster.
The construct security concerns is a variable by Suganthi et al. (2001)
which denotes the risk associated with the usage of internet banking services
along with the trust in the services and the privacy aspects associated with its
usage. The security concerns also cover the risk of unauthorized access to the
customer’s bank accounts, which is popularly referred to as phising. Tan and
Teo (2000) have described a similar construct which they had termed as risk.
9.2.2 Relationship between attitudes towards TEBSS and behavioural intentions Consumers can have identifiable attitudes towards self-service
technologies as found out by Curran et al (2003). It is further proposed in this
study that the antecedent beliefs are instrumental in predicting the attitude
towards TEBSS. The idea that the attitudes influence behavioural intentions

Chapter-9
246
had been proposed by Ajzen and Fishbein (1980). The behavioural intention
towards a TEBSS in turn influences the actual usage of it.
9.3 Relationship between antecedent Beliefs and Attitude towards ATM and Intention to Use ATMs The model showing the relationship between the three antecedent beliefs to
the attitude formation towards ATM is shown in figure 9.1 along with the relation
of attitude towards ATM and intention to use ATM services. The figure also shows
the relationship between the behavioural intention to use ATM and the actual
usage of ATM expressed as percentage of transaction done through it.
Figure 9.1: Model showing the relationship between antecedent Beliefs and Attitude towards ATM and Intention to Use ATMs
The multi-item scale with which the three antecedent beliefs were
measured is given with the items adapted from the studies shown and modified
suitably to fit the present study context. From table 9.1 it is found that the
reliability coefficients are all above 0.7 which is the acceptable range according
to Nunally & Bernstein (1994).
Five point Likert scale with 1 being strongly disagree and 5 being
strongly agree has been used to measure the above items.

Beliefs, Attitudes and Intentions to Use Technology-Enabled Banking Self-Services
247
Attitude has been defined as “a psychological tendency that is expressed
by evaluating a particular entity with some degree of favour or disfavour”
(Eagly and Chaiken, 1993). Curran et al. (2003) have shown that consumers
have distinguishable attitudes towards self-service technologies such as ATMs
and these attitudes determine their intention to use that particular self-service
technology. In this study attitude towards ATMs had been measured using a 3-
item five point Likert type scale as shown below with 1 being totally disagree
and 5 being totally agree.
Table 9.1: Multi-item scale for measuring the antecedent Beliefs Ease of Use, Usefulness and Safety of Usage
Dimension Statements Modified &Adapted from Cronbach’s
Alpha
Ease of use
Easuse1 1. Learning to use ATM was easy for me
Curran & Meuter (2005), Dabholkar (1994), Davis et al
(1989)
0.816
Easuse2 2. It was easy for me to become skillful at using ATM
Easuse3 3. I Find ATM difficult to useR
Usefulness Useful1 1.Using ATM improves the way in which I do my banking
Curran & Meuter (2005), Igabria et al (1996),
Davis et al (1989), Walker& Johnson58 (2006)
0.818
Useful2 2.Functions provided by the ATM of my bank are very useful for doing my banking
Useful3 3. ATM machine is easy to use and operate
Useful4 4. ATM provides a convenient way of doing banking
Useful5 5. I know that ATM will handle my business correctly
Security of usage
Secure1 1.I feel secure in conducting my banking business through ATMs Curran & Meuter (2005),
Dabholkar (1996)
0.708
Secure2 2. ATM is located in safe locations
Secure3 3. There is no danger of my card getting stuck in the machine
R- indicates an item reverse coded for analysis
Refer Appendix-2; section A2.7, table A 2.15
Chapter-9
248
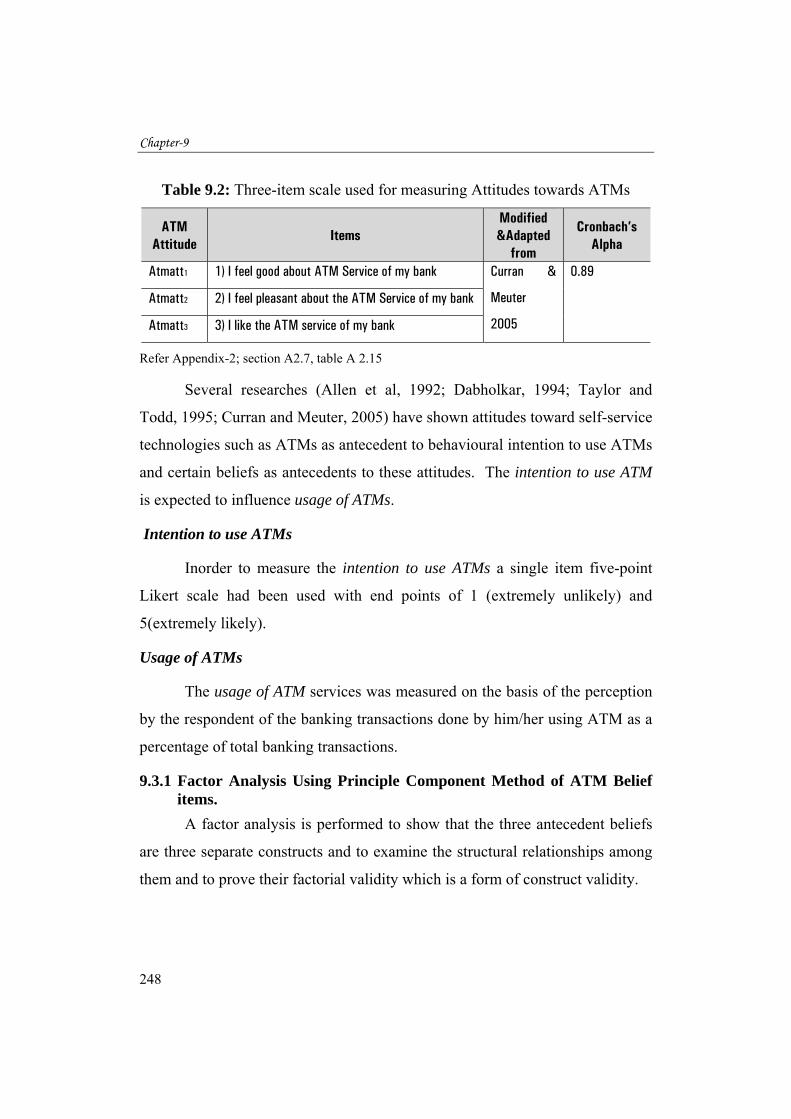
Table 9.2: Three-item scale used for measuring Attitudes towards ATMs
ATM Attitude
Items Modified &Adapted
from
Cronbach’s Alpha
Atmatt1 1) I feel good about ATM Service of my bank Curran &
Meuter
2005
0.89
Atmatt2 2) I feel pleasant about the ATM Service of my bank
Atmatt3 3) I like the ATM service of my bank
Refer Appendix-2; section A2.7, table A 2.15
Several researches (Allen et al, 1992; Dabholkar, 1994; Taylor and
Todd, 1995; Curran and Meuter, 2005) have shown attitudes toward self-service
technologies such as ATMs as antecedent to behavioural intention to use ATMs
and certain beliefs as antecedents to these attitudes. The intention to use ATM
is expected to influence usage of ATMs.
Intention to use ATMs
Inorder to measure the intention to use ATMs a single item five-point
Likert scale had been used with end points of 1 (extremely unlikely) and
5(extremely likely).
Usage of ATMs
The usage of ATM services was measured on the basis of the perception
by the respondent of the banking transactions done by him/her using ATM as a
percentage of total banking transactions.
9.3.1 Factor Analysis Using Principle Component Method of ATM Belief items. A factor analysis is performed to show that the three antecedent beliefs
are three separate constructs and to examine the structural relationships among
them and to prove their factorial validity which is a form of construct validity.
Beliefs, Attitudes and Intentions to Use Technology-Enabled Banking Self-Services
249
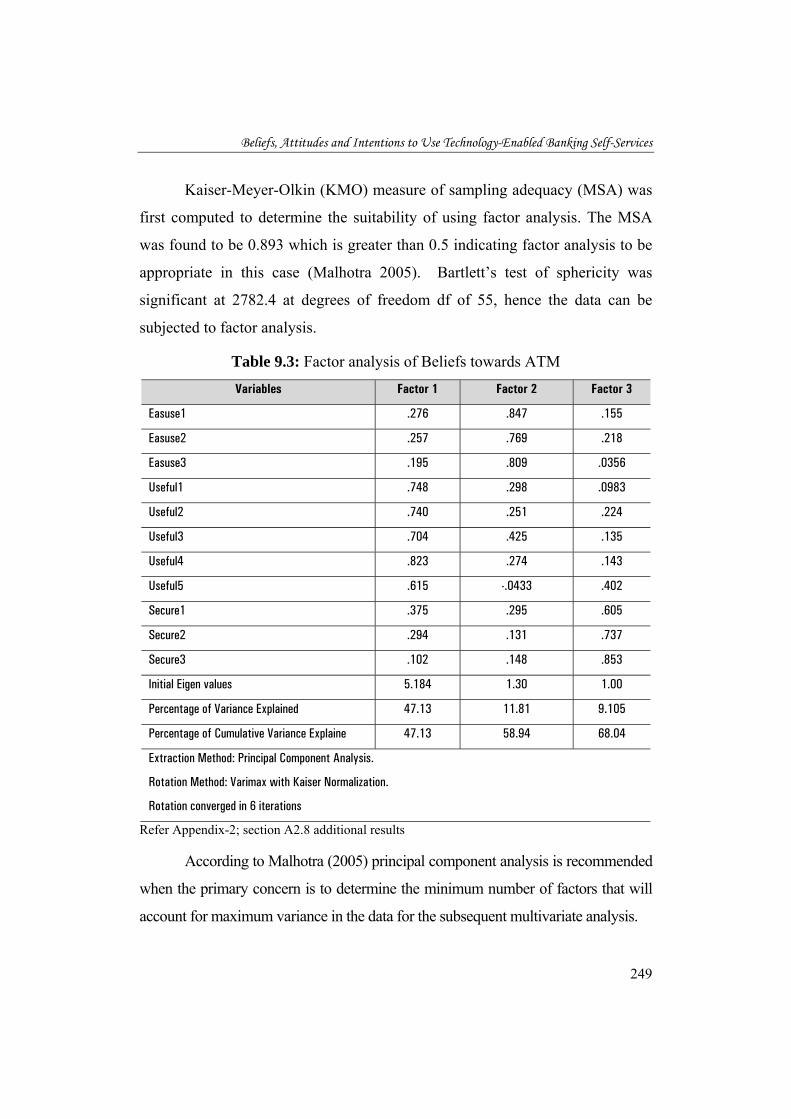
Kaiser-Meyer-Olkin (KMO) measure of sampling adequacy (MSA) was
first computed to determine the suitability of using factor analysis. The MSA
was found to be 0.893 which is greater than 0.5 indicating factor analysis to be
appropriate in this case (Malhotra 2005). Bartlett’s test of sphericity was
significant at 2782.4 at degrees of freedom df of 55, hence the data can be
subjected to factor analysis.
Table 9.3: Factor analysis of Beliefs towards ATM
Variables Factor 1 Factor 2 Factor 3
Easuse1 .276 .847 .155
Easuse2 .257 .769 .218
Easuse3 .195 .809 .0356
Useful1 .748 .298 .0983
Useful2 .740 .251 .224
Useful3 .704 .425 .135
Useful4 .823 .274 .143
Useful5 .615 -.0433 .402
Secure1 .375 .295 .605
Secure2 .294 .131 .737
Secure3 .102 .148 .853
Initial Eigen values 5.184 1.30 1.00
Percentage of Variance Explained 47.13 11.81 9.105
Percentage of Cumulative Variance Explaine 47.13 58.94 68.04
Extraction Method: Principal Component Analysis.
Rotation Method: Varimax with Kaiser Normalization.
Rotation converged in 6 iterations
Refer Appendix-2; section A2.8 additional results
According to Malhotra (2005) principal component analysis is recommended
when the primary concern is to determine the minimum number of factors that will
account for maximum variance in the data for the subsequent multivariate analysis.

Chapter-9
250
To determine the minimum loading required to include an item in its
respective constructs Hair et al. (1998) suggested that variables with loadings greater
than 0.3 were considered significant; loadings greater than 0.4, more important; and
loadings 0.5 or greater very significant. In this study the criteria used was to accept
items with loadings greater than 0.5.
After the factor analysis using principal component method with varimax
rotation, it is found that items are loading on to three factors as described earlier
factor1 being usefulness, factor 2 being ease of use and factor 3 being security/safety
of usage The total variance explained by these three factors were found to be
68.04%..
The reliability of the constructs is proved using Cronbach’s Alpha co
efficients in tables 9.1 and 9.2 which are above 0.7 and so are within the acceptable
level as per Nunally & Bernstein (1994).
9.3.2 Relationships among antecedent Beliefs and Attitude towards ATM and Intentions to use ATM using Structural Equation Modeling (SEM) The proposed ATM attitude and intentions model is analysed using Structural
Equation Modeling (SEM), which can be described as a combination of both factor
analysis and path analysis.
9.3.2.1 Structural Equation Modeling
Byrne (2001) defines “structural equation modeling (SEM) as a statistical
technique that takes a confirmatory approach to the analysis of a structural theory
bearing on some phenomenon”. SEM conveys two important aspects of the
procedures: a) causal process under study is represented by a series of structural
(regression) equations, and b) these structural relationships can be modeled to
facilitate a clearer conceptualization of the theory under study. The hypothesized
Beliefs, Attitudes and Intentions to Use Technology-Enabled Banking Self-Services
251
model is statistically tested simultaneously to examine its consistency with the data
through goodness of fit measures.
It allows the examination of a series of dependence relationships between
exogenous (independent) and endogenous (dependent) variables simultaneously
(Robert Ho, 2006). An exogenous variable is one whose variability is assumed to be
determined by causes outside causal model and an endogenous variable, is the one
whose variation is explained by exogenous and other endogenous variables in the
causal model.
SEM techniques are distinguished by two characteristics (Hair et al., 1998):
1. estimation of multiple and interrelated dependence relationships
2. the ability to represent unobserved concepts in these relationships and
account for estimation error in the estimation process
Another classification of variables is latent variables and manifest variables
(observed). Latent is a hypothesized and unobserved concept that can only be
approximated by observable or measurable variables which are called manifest
variables.
SEM consists of two parts: measurement model and the structural equation
model.
Measurement model specifies how the latent variables are represented
through observed variables and its measurement properties. The structural equation
model is a comprehensive model that depicts the pattern of relationships among
independent and dependent variables. It incorporates the strengths of multiple
regression analysis, factor analysis and multivariate ANOVA.
The structural equation modeling is done using the two-stage analysis in
which the measurement model is first estimated and then the measurement model is
kept fixed in the next step in which the structural model is estimated. The rationale
for this approach is that accurate representation of the reliability of the indicators is

Chapter-9
252
best accomplished in two steps to avoid interaction of structural and measurement
models (Bryne, 2001)
9.3.2.2 Evaluation of the measurement model for ATM Attitude and Intentions model using Confirmatory Factor Analysis (CFA) The confirmatory factor analysis (CFA) is performed to check whether the 14
observed variables taken for measuring the 4 unobserved constructs do so in a
reliable manner. The overall fit of the measurement model is determined by
confirmatory factor analysis.
Table 9.4: Measurement model with Confirmatory Factor Analysis (CFA) results
Sl No.
Factors/ Latent
Variables Indicators
Standardised Regression
Weights (factor
loadings)
C. R (Critical Ratio)
P ((sig. level)
Average Variance Extracted
(AVE)
Composite Reliability coefficient
Cronbach Alpha
coefficient
1 Ease of Use
Easuse1 0.909 ----* *** 0.62 0.82 0.816 Easuse2 0.707 18.26 *** Easuse3 0.698 16.30 ***
2
Usefulness
Useful1 0.756 12.18 *** 0.56 0.86 0.818 Useful2 0.761 12.30 *** Useful3 0.816 12.60 *** Useful4 0.837 12.94 *** Useful5 0.536 -----* ***
3 Security of
Usage
Secure1 0.724 11.73 *** 0.45 0.706 0.708 Secure2 0.640 11.48 *** Secure3 0.638 ------* ***
4 Attitude towards ATMs
Atmatt1 0.819 24.2 *** 0.74 0.89 0.89 Atmatt2 0.862 25.85 *** Atmatt3 0.893 ------* ***
*Unstandardised regression Weights assumed as 1 *** Significant at P < 0.01 level Fit Indexes Chi-Square = 242.42, p < 0.001, Degrees of Freedom = 71, Sample Size = 553 Root mean square error of approximation (RMSEA) = 0.066, Normed fit index (NFI) = 0.941, Incremental index of fit (IFI) = 0.957, Comparitive fit index (CFI) = 0.957, Tucker-Lewis index (TLI) = 0.945 Root mean square residual (RMR) = 0.029
Refer Appendix-2; section A2.10 for additional results and table A 2.24 Composite reliability coefficient = (Sum of standardized loadings)2 ÷ {(Sum of standardized loadings)2 + Sum of indicator measurement error}, (Hair et al., 1998) Average Variance Extracted = Sum of squared standard loadings ÷ (Sum of squared standard loadings + Sum of indicator measurement error), (Hair et al., 1998)

Beliefs, Attitudes and Intentions to Use Technology-Enabled Banking Self-Services
253
From the chi-square goodness-of-fit test (χ 2 = 242.42, degrees of
freedom = 71, p < 0.001) since p-value is less than 0.05 it is found that the
model did not fit the data well, but according to Byrne (2001), in structural
equation modeling as the χ 2 values are sensitive to sample sizes other model
fit measures are to be relied upon.
For instance a root mean square error of approximation (RMSEA) value
equal to 0.08 is an indicator of reasonably good fit between the sample data and
the proposed model (Byrne, 2001) and from the table the same is found to be
0.066, indicating appropriate fit. Other fit indexes such as NFI, CFI, IFI and
TLI which are together called baseline fit indexes are all having values greater
than 0.9 which again shows goodness of fit of the model with the sample data.
From table 9.4 it is found that the constructs (latent) are having
unidimensionality with the measurements variables loading significantly on the
underlying latent constructs. The factors loading (standardized regression
weights) are close to or above 0.7 except for one (useful5) item, indicating that
the items are good enough to measure the intended factors (Byrne, 2001). But
all of them are found to be above the threshold of 0.50 as used by
Thamaraiselvan and Raja (2007) in their study. The unstandardised regression
weights (table 9.4) are significant from the critical ratio test (C.R > ± 1.96, p <
0.01).
The convergent validity of the measurement model was examined by
calculating the composite reliability and average variance extracted (AVE) as
recommended by Fornell and Larcker (1981). All the reliabilities are greater
than the recommended 0.7 (Nunnally and Bernstein, 1994). The Cronbach
alpha values for the constructs are also above 0.7, further proving the reliability
of the constructs. The AVE represents the amount of variance captured by the
construct measures relative to measurement error and correlations by the latent

Chapter-9
254
variables. AVEs of all the constructs are above 0.50 which shows that the
indicators are truly representative of the latent constructs.
The discriminant validity of the constructs were proved as seen in table
9.3 in which each of the indicator variables loading higher on the construct of
interest than any other variable (Chen et al., 1998).
There are two single-item latent constructs used in the model which are
intention to use ATMs and usage of ATMs. As far as single-item scales are
concerned it is not possible to empirically estimate reliability, so the researcher
has to make some estimate of the reliability, one way is to fix the reliability at
1.0, assuming there is no measurement error (Byrne, 2001). Since the
measurement of the intention to use ATMs has been adopted from study by
Curran and Meuter (2005) where they have used it to measure the same
construct and had used it in their SEM model, it was deemed fit for this study.
The usage of ATMs was measured as the perceived use percentage of ATMs as
a percentage of the total transactions done by bank customers. Experts agreed
to the adequacy of such measure for representing the usage of ATM.
To sum up from the results, it is found that the items or indicators
corresponding to each constructs are truly representing the respective latent
constructs with relabilities and validities proved along with their
unidimensionality of the constructs.
9.3.2.3 Structural Equation Model (SEM) showing relationships among antecendent Beliefs, Attitudes and Behavioural Intentions of ATMs
In this section the results of the Structural Equation Modeling (SEM) are
shown. First task is to examine the goodness of fit of the model with the data.
The chi-square was statistically significant (χ 2 = 309.1, Degrees of Freedom =
98, p < 0.001). So other measures of fit were examined, root mean square error
of approximation (RMSEA) value is found to be 0.062 which is below limit of

Beliefs, Attitudes and Intentions to Use Technology-Enabled Banking Self-Services
255
0.08 as recommended by Bryne (2001) showing a reasonably good fit. The
comparative fit index (CFI) as seen from the table is 0.951 which is above 0.95
indicating good fit (Byrne, 2001). Other fit indexes such as NFI, CFI, IFI and
TLI which are all having values greater than 0.9 which again shows goodness
of fit of the model with the sample data (Robert Ho, 2006).
Next an examination of the regression paths are carried out to check the
strength and the significance of the relationships between the various
constructs. Table 9.5 shows that the exogenous (independent) variables,
usefulness and security of usage are having significant effect on the endogenous
(dependent) variable attitude towards ATMs since the p values are significant at
99% confidence levels. Another method to check for significance is the critical
ratio (C. R.) test, critical ratio which is more extreme than ± 1.96 indicates a
significant path (p < 0.05). An examination of C. R.s of the above independent
variables (from table 9.6) is seen to pass this test as the values are more extreme
than ± 1.96. But the exogenous variable ease of use is not having a significant
impact on the dependent variable attitude towards ATMs since the
corresponding C.R. value -1.17 is within the ± 1.96 range.
When values of the standardized regression (equivalent to standardized
beta coefficient in regression analysis) of the two independent variables
usefulness and security of usage which are having significant influence on the
dependent variable are examined, it is found that usefulness with a standardised
regression value of 0.43 is having a greater impact on attitude towards ATMs
than security of usage with a standardized regression value of 0.295. Since the
corresponding R2 value is 0.39 it can be inferred that the proportion of variance
explained is 39%.
When the path between attitude toward ATMs and intention to use ATMs
is examined it is found that the path is significant since the corresponding p

Chapter-9
256
value is significant at 99% confidence level (C.R. = 16.84, p < 0.001). The
standardized regression weight corresponding to this path is 0.644 and that the
corresponding R2 value is 0.415, which means that the proportion of variance
explained is 41.5%. The implication is that the attitude towards ATMs is
effecting intention to use ATMs, significantly with the relationship explaining
41.5% of variance in the dependent variable.
Table 9.5: SEM results of the Beliefs, Attitude and Intention model of ATMs
Path Standardised Regression
path
S.E (Standard
Error)
C.R (Critical Ratio)
P (sig. level)
Proportion of variance explained
(R2) Ease of Use Attitude towards ATMs
-0.071 0.076 -1.17 0.245
0.39
Usefulness Attitude towards ATMs
0.43 0.144 5.06 ***
Security of Attitude Usage towards ATMs
0.295 0.086 3.90 ***
Attitude Intention towards to use ATMs 0.644 0.040 16.84 *** 0.415
Intention ATM Usage to use ATMs
0.157 1.264 3.66 *** 0.025
*** P value < 0.01, significant at 99%
Fit Indexes
Chi-Square = 309.1, p < 0.001, Degrees of Freedom = 98, Sample Size = 553
Root mean square error of approximation (RMSEA) = 0.062,
Normed fit index (NFI) = 0.930,
Incremental index of fit (IFI) = 0.951,
Comparitive fit index (CFI) = 0.951,
Tucker-Lewis index (TLI) = 0.932
Refer Appendix-2; section A2.11 for additional results

Figur
Beliefs, A
re 9.2: SEMAT
Attitudes and I
M results oTMs
Intentions to U
of Beliefs,
Use Technology-
Attitudes a
-Enabled Bank
and Intentio
king Self-Servic
25
ons of
ces
57

Chapter-9
258
The path between intention to use ATMs and ATM usage (use
percentage) is also found to be significant, with the standardized regression
weight equaling 0.157, as the corresponding p-value is significant at 99%
confidence level (C.R.= 3.6, p < 0.001). The percentage of variance explained
is only 2.5%, thus even though the path is significant, the strength of
relationship between intention to use and ATM usage is minimal.
The reason for this could be that ATMs are widely adopted and their
usage frequency and duration was found to be the highest among all the
banking channels. This shows that the usage of ATMs has become habitual and
due to the repeated previous experiences and less of cognitive processing is
involved while using them. According to Triandis model (1980), when the
behaviour becomes habitual, the habit is a more important influencer of the
actual usage rather than intentions.
9.4 Beliefs, Attitudes and Intention to use Internet Banking Services Similar to the model developed for ATMs showing antecedent beliefs,
attitudes, intention to use and its usage another model is proposed for these
factors of internet banking to depict the relationships among them based on SST
attitude/intention model by Curren and Meuter (2005) and TAM by Davis
(1989).
It is proposed through this model that the four antecedent beliefs which
are explained in the beginning of the chapter as being instrumental in predicting
the attitude towards internet banking services and the attitude impacts the
behavioural intention which determines the usage of internet banking services.

Beliefs, Attitudes and Intentions to Use Technology-Enabled Banking Self-Services
259
Fig 9.3: Model showing the relationship among antecedent Beliefs
and Attitude towards Internet banking services and Intention to use the Internet banking services
The model showing the relationship of the four antecedent beliefs to the
attitude formation towards internet banking services is shown in figure 9.2
along with the relation of attitude towards internet banking and intention to use
internet banking services. It also shows how the intention to use internet
banking services impacts the actual usage of it. The antecedent belief
constructs are ease of use, compatibility, usefulness and security concerns
whose explanations are given in the earlier part of the chapter.
The multi-item scale with which the four antecedent beliefs were
measured is shown along with the studies from which they were adapted and
modified suitably to fit the present study context.
From table 9.6 it is found that the Cronbach alpha coefficients are all
above the accepted limit 0.7 (Nunally & Bernstein, 1994) except for the
Cronbach alpha co efficient 0.68 for security concerns which is very close to
0.7 and hence considered adequate.
Five point Likert scale with 1 being strongly disagree and 5 being
strongly agree had been used to measure the above items. The multi-item scale

Chapter-9
260
was assessed for its reliability and construct validity. Cronbach’s alpha was
computed for each dimension to test reliability, and the values were ranging
from 0.68 to 0.895 (table 9.6) which is in the acceptable range (Nunnally &
Bernstein, 1994).
Table 9.6: Multi-item scale for measuring the antecedent Beliefs - ease of use, compatibility, usefulness and security concerns in case of internet banking
Dimension Code Statements Modified &Adapted
from Cronbach’s
Alpha IB Usefulness
IB Useful1 1.Internet banking makes transactions easier.
Tan and Teo (2000), Moore and Benbasat
(1991) 0.895
IB Useful2 2.Internet banking can help to manage my finances more effectively.
IB Useful3 3 Internet banking useful for managing my finances.
IB Useful4 4. Internet banking saves time
IB Useful5 5. Internet banking is a convenient way to mange my finances.
IB Compatibility
IB Compat1 1. Internet banking is compatible with my lifestyle.
Tan & Teo (2000), Moore and Benbasat
(1991) 0.88
IB Compat2 2. Using Internet banking fits well with the way I like to manage my finances.
IB Compat3 3.Using the Internet to conduct banking transactions fits into my working style.
IB Ease of use
IB Easuse1 1. It is/ will be easy for me to become skillful in using internet banking. Curran & Meuter
(2005), Dabholkar (1994), Davis et al (1989), Tan & Teo
(2000)
0.804 IB Easuse2 2. Using Internet banking doesn’t require a lot of mental effort.
IB Easuse3 3. I find Internet banking difficult to use (R)
IB Security Concerns
IB Secure1 1. Information concerning my Internet banking transactions will be known to others. Tan & Teo (2000),
Curran & Meuter (2005),
Dabholkar (1996)
0.68 IB Secure2 2. I am concerned about the security of internet banking services. (R)
IB Secure3 3. I don’t trust internet banking services. (R)
R- indicates an item reverse coded for analysis
Refer Appendix-2; section A2.7, table A 2.16

Beliefs, Attitudes and Intentions to Use Technology-Enabled Banking Self-Services
261
A factor analysis was performed to show that the four antecedent
beliefs are four separate constructs and to examine the structural
relationships to prove their factorial validities which is a form of construct
validity.
9.4.1 Factor Analysis – Using Principal Component analysis of Internet banking antecedent Belief items
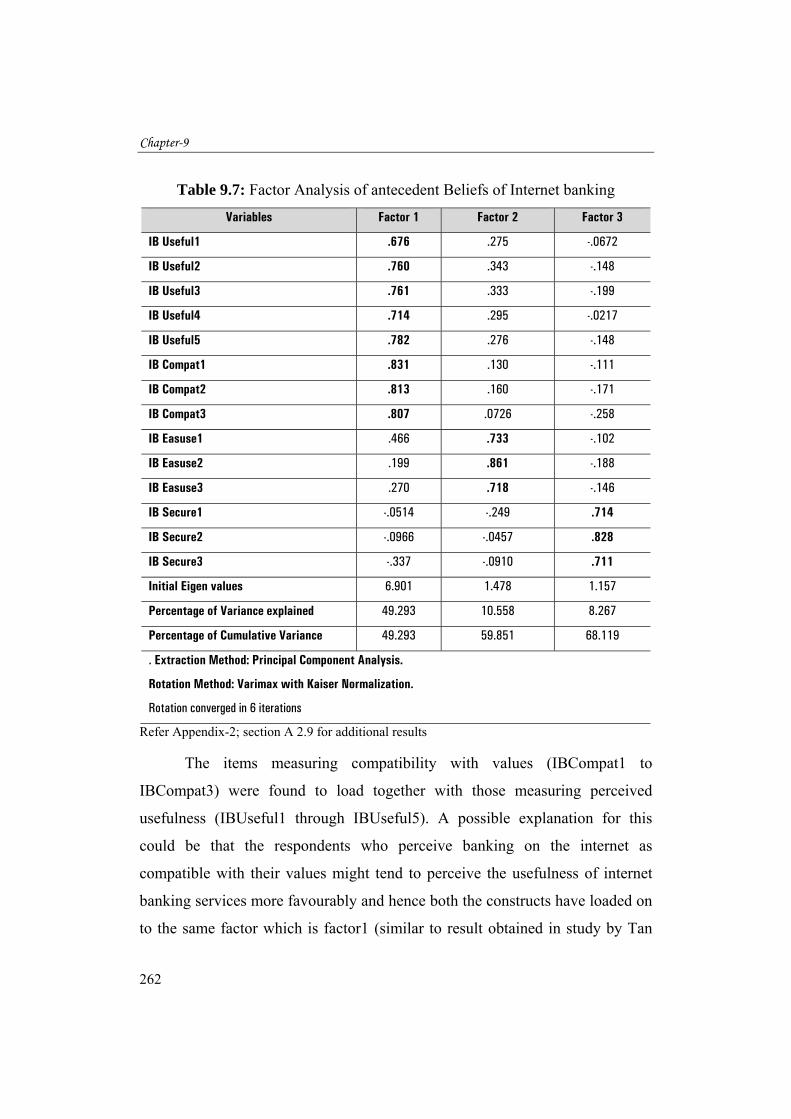
Kaiser-Meyer-Olkin (KMO) measure of sampling adequacy (MSA)
was first computed to determine the suitability of using factor analysis.
The MSA was found to be 0.916 which is greater than 0.5 so the factor
analysis is appropriate in this case (Malhotra, 2005) and Bartlett’s test of
sphericity was significant at 4568.54 at degrees of freedom df of 91, hence
the data can be subjected to factor analysis.
To determine the minimum loading required to include an item in its
respective constructs Hair et al suggested that variables with loadings
greater than 0.3 were considered significant; loadings greater than 0.4,
more important; and loadings 0.5 or greater, very significant. In this study
the criteria used was to accept items with loadings greater than 0.5.
After factor analysis using principal component method with
Varimax rotation it was found that the items loaded on to three factors as
shown with total variance explained as 68 per cent.
Chapter-9
262
Table 9.7: Factor Analysis of antecedent Beliefs of Internet banking
Variables Factor 1 Factor 2 Factor 3
IB Useful1 .676 .275 -.0672
IB Useful2 .760 .343 -.148
IB Useful3 .761 .333 -.199
IB Useful4 .714 .295 -.0217
IB Useful5 .782 .276 -.148
IB Compat1 .831 .130 -.111
IB Compat2 .813 .160 -.171
IB Compat3 .807 .0726 -.258
IB Easuse1 .466 .733 -.102
IB Easuse2 .199 .861 -.188
IB Easuse3 .270 .718 -.146
IB Secure1 -.0514 -.249 .714
IB Secure2 -.0966 -.0457 .828
IB Secure3 -.337 -.0910 .711
Initial Eigen values 6.901 1.478 1.157
Percentage of Variance explained 49.293 10.558 8.267
Percentage of Cumulative Variance 49.293 59.851 68.119
. Extraction Method: Principal Component Analysis.
Rotation Method: Varimax with Kaiser Normalization.
Rotation converged in 6 iterations
Refer Appendix-2; section A 2.9 for additional results
The items measuring compatibility with values (IBCompat1 to
IBCompat3) were found to load together with those measuring perceived
usefulness (IBUseful1 through IBUseful5). A possible explanation for this
could be that the respondents who perceive banking on the internet as
compatible with their values might tend to perceive the usefulness of internet
banking services more favourably and hence both the constructs have loaded on
to the same factor which is factor1 (similar to result obtained in study by Tan

Beliefs, Attitudes and Intentions to Use Technology-Enabled Banking Self-Services
263
and Teo, 2000) that explains 49.3% variance with an eigen value of 6.551.
While the next two factors factor2 and factor3 are explaining only 11.4% and
8.58% variance respectively with eigen values of 1.6 and 1.2.
9.4.2 Attitude towards Internet banking services
As mentioned in the case of ATM services the attitude towards internet
banking services was also measured using a 3-item Likert type scale as shown
below with 1 being totally disagree and 5 being totally agree.
Table 9.8: Three-item scale used for measuring Attitudes towards Internet banking
Internet banking Attitude
Items Modified &Adapted
from
Cronbach’s Alpha
IBatt1 1) I feel good about internet Banking services of my bank
Curran &
Meuter
2005
0.928
IBatt2 2) I feel pleasant about internet Banking services of my bank
IBatt3 3) I like the internet banking services of my bank
Refer Appendix-2; section A2.7, table A 2.16
Inter item consistency Cronbach’s Alpha 0.928 (table 9.8) shows a good
reliability according to Nunally& Bernstein (1994).
The intention to use internet banking services was measured using a
single item five point scale adapted from Curran and Meuter (2005) in which 5
denoted extremely likely to use and 1 denoted extremely unlikely to use.
The usage of internet banking services was measured on the basis of the
perception of the banking transactions done by the respondent using internet
banking as a percentage of total banking transactions done by him/her.

Chapter-9
264
9.4.3 Relationships among antecedent Beliefs, Attitude towards Internet banking and Intention to Use Internet Banking- an SEM analysis As in the case of the Structural Equation Modeling for ATM usage, a
two stage analysis is done in the case of internet banking usage also. First the
measurement model is analysed to check for unidimensionality, reliability and
validity after which in the second stage structural equation model is developed
and analysed to show the relationships between the constructs under
consideration (Byrne, 2001).
9.4.3.1 Evaluation of the measurement model for ATM attitude and intentions model using Confirmatory factor analysis
A total of 17 observed or manifest variables were used to measure 4
latent constructs, in the measurement model it is checked whether these
observed variables are truly representing the latent constructs.
The exploratory factor analysis results shown in table 9.7 prove the
factorial validity and shows that the items are loading reasonably well on the
intended factors. Confirmatory factor analysis further vindicates the
unidimensionality, reliabilities and validities of the items used to operationalise
the constructs involved in the model.
Chi-square test for the model gave a value of 399.82, 71 being the
degrees of freedom and p < 0.001. From the chi-square goodness-of-fit test
since p-value is less than 0.001 it is found that the model did not fit the data
well, but according to Byrne, (2001), in structural equation modeling as the χ 2
values are sensitive to large sample sizes and hence other model fit measures
are to be relied upon.
Therefore, an examination of the results obtained on other fit indexes we
find that the root mean square error of approximation (RMSEA) value is 0.07
which is greater than 0.08 which is the limit given for reasonable errors of

Beliefs, Attitudes and Intentions to Use Technology-Enabled Banking Self-Services
265
approximation in the population (Byrne, 2001). The comparative fit index
(CFI) is 0.953 which is above the recommended value of 0.95 indicating a well
fitting model (Byrne, 2001). The other baseline comparison fit indices NFI, IFI
and TLI are showing values of 0.937, 0.954 and 0.935 respectively, with all the
values above the threshold of 0.9 as recommended by Robert Ho (2006).
Table 9.9: Measurement model of ATM Beliefs and Attitudes, with Confirmatory Factor Analysis (CFA) results
Sl No
Factors/ Latent
Variables Indicators
Standardised Regression
Weights (factor
loadings)
C. R (Critical Ratio)
P (Sig. level
Average Variance Extracted
(AVE)
Composite Reliability Coefficient
Cronbach Alpha
coefficient
1. Usefulness IB Useful1 0.715 15.35 ***
0.649 0.901 0.895 IB Useful2 0.877 18.42 *** IB Useful3 0.883 18.52 *** IB Useful4 0.682 -----* IB Useful5 0.847 17.87 ***
2. Compat- ibility
IB Compat1 0.843 24.31 *** 0.735 0.893 0.88 IB Compat2 0.868 25.45 ***
IB Compat3 0.861 -----* *** 3. Ease of Use IB Easuse1 0.890 15.45 ***
0.604 0.818 0.804 IB Easuse2 0.784 14.65 ***
IB Easuse3 0.637 -----* ***
4. Security concerns
IB Secure1 0.523 9.60 *** 0.43 0.68 0.68 IB Secure2 0.603 10.54 ***
IB Secure3 0.794 -----* 5. Attitude
Towards Internet banking
IB att1 0.873 29.04 ***
0.81 0.928 0.928 IB att2 0.934 33.17 ***
IB att3 0.893 -----*
*Unstandardised regression Weights assumed as 1 *** Significant at P < 0.01 level
Fit Indexes
Chi-Square = 399.82, Degrees of Freedom = 71, p < 0.001, , Sample Size = 553 Root mean square error of approximation (RMSEA) = 0.07, Normed fit index (NFI) = 0.937, Incremental index of fit (IFI) = 0.957, Comparitive fit index (CFI) = 0.953, Tucker-Lewis index (TLI) = 0.935
Refer Appendix-2; section A 2.12 for addition results Composite reliability coefficient = (Sum of standardized loadings)2 ÷ {(Sum of standardized loadings)2 + Sum of indicator measurement error}, (Hair et al., 1998) Average Variance Extracted = Sum of squared standard loadings ÷ (Sum of squared standard loadings + Sum of indicator measurement error), (Hair et al., 1998)

Chapter-9
266
After having established the fitness of the sample data with
measurement model the next step is to look for the unidimensionality of
the constructs used and to establish their reliabilities and validities from
the results obtained.
The constructs (latent) are having unidimensionality with the
measurement variables loading significantly on the underlying latent
constructs (table 9.9). The factor loadings (standardized regression
weights) are close to or above 0.7 except for two items (corresponding to
IB secure1, IB secure2) indicating that the items are good enough to
measure the intended factors according to Bryne (2001). But all of them
are found to be above the threshold of 0.50 as used by Thamaraiselvan and
Raja (2007) in their study and the unstandardised regression weights are
significant from the critical ratio test (C.R > ± 1.96, p < 0.05).
The convergent validity of the measurement model was examined by
calculating the composite reliability and Average Variance Extracted
(AVE), (Fornell and Larcker, 1981). All the reliabilities are greater than
the recommended 0.7 (Nunnally and Bernstein, 1994) except for the
reliability associated with the construct security concerns. The security
concerns which is showing a composite reliability of 0.68 being very close
to the recommended value of 0.7 was accepted. The Cronbach alpha
values which also is another measure of reliability is also showing similar
trend. The AVE represents the amount of variance captured by the
construct measures, relative to measurement error and the correlations
among the latent variables. The AVEs of all the constructs were calculated
and the values were above the recommended 0.50 (Bagozzi and Yi, 1988)
except in case of the construct security concerns (AVE = 0.43). The lower
level of the variance extracted for the construct security concerns indicates

Beliefs, Attitudes and Intentions to Use Technology-Enabled Banking Self-Services
267
that more than half the variance for the specified items is not accounted for
by the construct, these could be because of the additional loadings of these
items on the other constructs (Byrne, 2001). Since 0.43 is somewhat close
to 0.50 for this study this construct was deemed valid.
The discriminant validity of the constructs was proved (table 9.7) in
which each of the indicator variables loading higher on the construct of
interest than any other variable (Chen et al., 1998).
There are two single-item latent constructs used in the model which
are intention to use internet banking and usage of internet banking. The
treatment of these constructs were similar to what have been told earlier
pertaining to the treatment of intention to use ATMs and usage of ATMs, as
recommended by Byrne (2001) their respective errors equated to zero.
To sum up from the results it is found that the items or indicators
corresponding to the constructs are truly representing the respective latent
constructs with reliabilities and validities proved along with their
unidimensionality.
9.4.3.2 Structural Equation Model (SEM) showing relationships among antecendent Beliefs, Attitudes and Behavioural Intentions of Internet banking
In this section the results of the Structural Equation Modeling
(SEM) are shown. First task is to examine the goodness of fit of the model
with the data. The chi-square was statistically significant (χ 2 = 578.42,
Degrees of Freedom = 142, p < 0.001). So other measures of fit were
examined and it was found that the root mean square error of
approximation (RMSEA) value is found to be 0.075 which is lesser than
0.08 as recommended by Bryne (2001) for a reasonable good fit of the data
with the model. The comparative fit index as seen from the table is 0.937

Chapter-9
268
which is close to 0.95 indicating reasonably good fit. Other baseline fit
indexes such as NFI, CFI, IFI and TLI are having values greater than 0.9
which again shows goodness of fit of the model with the sample data
(Robert Ho, 2006).
Next an examination of the regression paths are carried out to check
the strength and the significance of the relationships between the various
constructs. From table 9.10 it is found that the exogenous (independent)
variables usefulness, compatibility and security concerns are having
significant effect at 95% confidence level on the endogenous (dependent)
variable attitude towards internet banking by the critical ratio test (> ±
1.96, p < 0.05). Their critical ratios (C.R) are more extreme than ± 1.96.
But the exogenous variable ease of use is having a critical ratio (C.R) of
0.02 which is within the range of ± 1.96 and which proves that it is not
having a significant impact on the dependent variable attitude towards
internet banking.
Absolute values of the standardized regression (equivalent to
standardized beta coefficient in regression analysis) of the three
independent variables usefulness, compatibility and security concerns
which are having significant effect on the dependent variable are
examined.

Beliefs, Attitudes and Intentions to Use Technology-Enabled Banking Self-Services
269
Table 9.10: SEM results of the beliefs, attitude and intention model of internet banking
Path Standardised
Regression path
S.E (Standard
(Error) C.R
(Critical Ratio) P
(Sig. level)
Proportion of variance
explained (R2)
IB Usefulness Attitude
towards
internet
banking
0.484 0.121 5.554 ***
0.620
IBCompatibility Attitude
towards
internet
banking
0.167 0.063 2.350 0.019*
IB Ease of Attitude
Use towards
internet
banking
0.056 0.062 1.016 0.310
IBSecurity Attitude
concerns towards
internet
banking
-0.184 0.047 -3.889 ***
Attitude Intention
towards to use
internet internet
banking banking
0.683 0.053 18.896 *** 0.467
Intention Internet
to use banking
internet usage
banking
0.581 0.510 16.656 *** 0.338
*** P value < 0.01, significant at 99%, * P value < 0.05, significant at 95%
Fit Indexes
Chi-Square = 578.422, Degrees of Freedom = 142, p < 0.001, Sample Size = 553
Root mean square error of approximation (RMSEA) = 0.075,
Normed fit index (NFI) = 0.918,
Incremental index of fit (IFI) = 0.937,
Comparitive fit index (CFI) = 0.937,
Tucker-Lewis index (TLI) = 0.915 Refer Appendix-2; section A 2.13 for addition results

Chapter-9
270
Of all the three independent variables, usefulness is having the
maximum impact (0.484) on the dependent variable attitude towards
internet banking followed by security concerns with a standardized
regression value of 0.184 and compatibility with a standardized regression
value of 0.167. The construct security concerns are having a negative
impact on the dependent variable attitude towards internet banking since
its standardized regression value is negative while the other two
independent variables are having a positive impact. From table 9.10 it is
found that the proportion of variance explained (R2) in case of the
dependent variable attitude towards internet banking is 0.62 by the
corresponding independent variables.
Examination of path between attitude towards internet banking and
intention to use internet banking shows that the path is significant as the
corresponding critical ratio value is considerably greater than the C R of
1.96 (at 95% confidence level). The proportion of the variance explained
(R2) is 0.467 (table 9.12).
The path between intention to use internet banking and internet
banking usage (use percentage) is also found to be significant, with the
standardized regression weight equaling 0.581, as the corresponding p-
value is significant at 99% confidence level. The proportion of variance
explained is 0.338, which shows that the intention to use internet banking
is having a significant influence on the perceived actual usage of internet
banking.

Figur
Beliefs, A
re 9.4: SEMint
Attitudes and I
M results ternet banki
Intentions to U
of beliefs, ing
Use Technology-
attitudes a
-Enabled Bank
and intentio
king Self-Servic
27
ons of
ces
71

Chapter-9
272
9.5 Conclusion
Antecedent beliefs considered are different except for the TAM
constructs of perceived ease of use and perceived usefulness. The security
issues in case of ATMs is different from those of internet banking, as
mentioned earlier the security issues for ATMs has got more to do with
physical security, while it is concerned with aspects like phising (hacking) and
the resultant financial loses in the case of internet banking. The additional
construct compatibility has been included in the case of internet banking
because it involves the usage of computers and internet so the user has to have
certain proficiency in using them. Ease of use is not found to be a statistically
significant factor for ATMs as well as internet banking. This might be due to
the fact that the sample of respondents selected is found to be proficient in the
usage of technology products such as computers and internet; therefore the
operation of either ATM or internet banking per se may not be difficult for
them. All the other antecedent beliefs are having significant impact on the
attitude formation towards ATM as well as internet banking. The linkages
between attitudes and intentions to use are significant in both cases.
The intention to use internet banking is having significant influence on
the internet banking usage by the respondents, while the impact of intention to
use ATM is found to have only relatively weak impact on the ATM usage. This
is because the internet banking adoption is only catching up with the adoption
cycle being in relatively initial stages, so the usage of internet banking is
involving more of cognitive processing. The adoption of ATM is in its maturity
stage and thanks to more frequent usage for longer duration the usage of ATM
has become habitual, so its usage is more automatic, thus involving lesser of
cognitive processing (Limayan et al. 2001; Triandis, 1980). Therefore the
linkage between the behaviour intention and usage in case of ATMs is weak.

Beliefs, Attitudes and Intentions to Use Technology-Enabled Banking Self-Services
273
From the above it can be concluded that efforts are required to promote
internet banking usage through proper design, easy navigability and creating
awareness about the benefits of its usage. For ATM services efforts are
required to promote its value added services as the basic services are well in
use.

Chapter-9
274