ben c. cox, john f. rushing, and web floyd june 2017 ... · geotechnical and structures laboratory...
TRANSCRIPT
ERD
C/G
SL T
R-17
-10
Rutting Performance of Cold-Applied Asphalt Repair Materials for Airfield Pavements
Geo
tech
nica
l and
Str
uctu
res
Labo
rato
ry
Ben C. Cox, John F. Rushing, and Web Floyd June 2017
Approved for public release; distribution is unlimited.

The U.S. Army Engineer Research and Development Center (ERDC) solves the nation’s toughest engineering and environmental challenges. ERDC develops innovative solutions in civil and military engineering, geospatial sciences, water resources, and environmental sciences for the Army, the Department of Defense, civilian agencies, and our nation’s public good. Find out more at www.erdc.usace.army.mil.
To search for other technical reports published by ERDC, visit the ERDC online library at http://acwc.sdp.sirsi.net/client/default.

ERDC/GSL TR-17-10 June 2017
Rutting Performance of Cold-Applied Asphalt Repair Materials for Airfield Pavements
Ben C. Cox, John F. Rushing, and Web Floyd Geotechnical and Structures Laboratory U.S. Army Engineer Research and Development Center 3909 Halls Ferry Road Vicksburg, MS 39180-6199
Final report Approved for public release; distribution is unlimited.
Prepared for Headquarters, Air Force Civil Engineer Center 139 Barnes Avenue, Suite 1 Tyndall AFB, FL 32403-5319
Under Project 448464; Airfield Damage Repair (ADR) Modernization Program

ERDC/GSL TR-17-10 ii
Abstract
Cold-applied asphalt mixtures are often used for pavement repair, primarily because of the small quantities involved and/or the unavailability of hot-mixed asphalt. These cold-applied mixtures have poorer rutting resistance than hot mix asphalt because additives, often solvent, are required to provide adequate workability for them to be placed at ambient tempera-tures. This study primarily evaluated the rutting performance of nine commercial cold mix asphalt repair materials. Both laboratory wheel tracking data and field rutting performance were used in the evaluation with the focus on identifying suitable materials for repairing airfield pavements subjected to high-tire-pressure aircraft traffic. The commercial products included traditional cutback cold mixes as well as water-activated repair materials. Results from both laboratory and field rutting measurements showed that the water-activated materials outperform the products containing solvent. However, none of the commercial products achieved the target threshold of less than 1 in. rutting after 100 passes of simulated F-15E aircraft traffic. The laboratory wheel-tracking measurements proved to be a good indicator of field performance.
DISCLAIMER: The contents of this report are not to be used for advertising, publication, or promotional purposes. Citation of trade names does not constitute an official endorsement or approval of the use of such commercial products. All product names and trademarks cited are the property of their respective owners. The findings of this report are not to be construed as an official Department of the Army position unless so designated by other authorized documents. DESTROY THIS REPORT WHEN NO LONGER NEEDED. DO NOT RETURN IT TO THE ORIGINATOR.

ERDC/GSL TR-17-10 iii
Contents Abstract .......................................................................................................................................................... ii
Figures and Tables ........................................................................................................................................ iv
Preface ............................................................................................................................................................. v
Unit Conversion Factors .............................................................................................................................. vi
Executive Summary .....................................................................................................................................vii
1 Introduction ............................................................................................................................................ 1 1.1 Background .................................................................................................................... 1 1.2 Objectives ....................................................................................................................... 2 1.3 Scope ............................................................................................................................. 2 1.4 Layout of report ............................................................................................................. 2
2 Experimental Program ......................................................................................................................... 3 2.1 Materials tested ............................................................................................................. 3
2.1.1 Cold mix asphalt materials ......................................................................................... 3 2.1.2 Hot mix asphalt materials........................................................................................... 5
2.2 Laboratory test methods ............................................................................................... 7 2.2.1 Mixing and compaction .............................................................................................. 7 2.2.2 Curing........................................................................................................................... 7 2.2.3 Density measurement................................................................................................. 8 2.2.4 Laboratory rut testing ................................................................................................. 9 2.2.5 Indirect tensile strength testing ............................................................................... 11
2.3 Field test methods ....................................................................................................... 12 2.3.1 Phase 1 field testing ................................................................................................. 12 2.3.2 Phase 2 field testing ................................................................................................. 14
3 Laboratory Test Results ..................................................................................................................... 15 3.1 Density and air voids ................................................................................................... 15 3.2 APA rutting .................................................................................................................... 16 3.3 Indirect tensile strength .............................................................................................. 20
4 Field Test Results ................................................................................................................................ 21 4.1 Phase 1 field testing .................................................................................................... 21 4.2 Phase 2 field testing .................................................................................................... 22
5 Discussion of Results ......................................................................................................................... 25
6 Conclusions and Recommendations .............................................................................................. 27
References ................................................................................................................................................... 29
Report Documentation Page
ERDC/GSL TR-17-10 iv
Figures and Tables
Figures
Figure 2.1. Cold mix asphalt gradations. .................................................................................................... 4 Figure 2.2. CM-L-NJ gradation. ..................................................................................................................... 6 Figure 2.3. CM-F gradation. .......................................................................................................................... 6 Figure 2.4. Photographs of laboratory mixing and compaction: (a) automatic Marshall compactor, (b) HMA bucket mixer, (c) Marshall mold filled with mix, (d) specimens on lab bench. .............................................................................................................................................................. 8 Figure 2.5. Typical cold mix specimen deformed by CoreLok bag. ......................................................... 9 Figure 2.6. Asphalt pavement analyzer: (a) overall, (b) inside of cabin. ............................................... 10 Figure 2.7. Typical tested APA specimen. .................................................................................................. 11 Figure 2.8. Example field patch (IA shown): (a) before trafficking, (b) after trafficking. ..................... 13 Figure 2.9. Heatwurx infrared heater. ....................................................................................................... 13 Figure 2.10. F-15E load cart. ...................................................................................................................... 14 Figure 3.1. Cold mix 1-day APA results. ..................................................................................................... 17 Figure 3.2. Cold mix 1 and 3 day APA results. .......................................................................................... 18 Figure 3.3. Cold mix 1, 3, and 5 day APA results. .................................................................................... 18 Figure 3.4. HMA control mixture APA results. ........................................................................................... 19 Figure 4.1. Phase 1 field rutting results by pass level. ............................................................................ 21 Figure 4.2. Phase 2 field rutting results by pass level. ........................................................................... 23 Figure 4.3. CR and PC comparison using straightedge rut measurements. ....................................... 23 Figure 4.4. Comparison of survey and straightedge rut measurements.............................................. 24
Tables
Table 2.1. Cold mix asphalt products evaluated. ....................................................................................... 3 Table 2.2. Cold mix asphalt gradations by material. ................................................................................. 4 Table 2.3. CM-L-NJ design properties. ......................................................................................................... 5 Table 2.4. APA test plan for cold mixes. .................................................................................................... 11 Table 3.1. Laboratory density and air void results. .................................................................................. 15 Table 3.2. AQ IDT St Results. ....................................................................................................................... 20
ERDC/GSL TR-17-10 v
Preface
This study was conducted for the U.S. Air Force Civil Engineer Center (AFCEC), Tyndall Air Force Base, Florida. The technical manager for this project was Dr. Craig Rutland of AFCEC.
The work was performed by the Airfields and Pavements Branch (GMA) of the Engineering Systems and Materials Division (GM), U.S. Army Engineer Research and Development Center, Geotechnical and Structures Laboratory (ERDC-GSL).
At the time of publication, Dr. Timothy W. Rushing was Chief, CEERD-GMA; Dr. Gordon W. McMahon was Chief, CEERD-GM; Dr. William P. Grogan was Deputy Director, ERDC-GSL; and Mr. Bartley P. Durst was Director.
COL Bryan S. Green was the Commander of ERDC, and Dr. David W. Pittman was the Director.

ERDC/GSL TR-17-10 vi
Unit Conversion Factors
Multiply By To Obtain
degrees Fahrenheit (F-32)/1.8 degrees Celsius
feet 0.3048 meters
gallons (U.S. liquid) 3.785412 E-03 cubic meters
inches 0.0254 meters
miles per hour 0.44704 meters per second
pounds (mass) 0.45359237 kilograms
square feet 0.09290304 square meters
square yards 0.8361274 square meters
yards 0.9144 meters

ERDC/GSL TR-17-10 vii
Executive Summary
The U.S. Army Engineer Research and Development Center began a research project to study the performance of cold-applied asphalt mixtures for repairing airfield pavement. Laboratory air void, rutting, and indirect tensile strength data is presented in this report alongside field rutting data with simulated F-15E traffic for nine cold mix asphalt repair products and four conventional hot mix asphalt (HMA) control mixtures. Key observations from this study are as follows:
• In-place air void content levels of cold-applied mixtures were on the order of 2-3 times greater than typical target air void levels for HMA during construction. Inability to densify cold-applied asphalt mixtures is a major factor in poor rutting performance.
• Water-reactive cold mix products exhibited significantly more favorable rutting behaviors than traditional cutback materials used in previous investigations. The use of this category of materials has not been documented on airfield pavements.
• In field testing, rutting resistance of the HMA control mixture was on the order of 2-5 times greater than water-reactive cold mixes Aquaphalt™ 6.0 and Instant Asphalt™ 6.0 (the only two products directly compared to HMA).
• The Asphalt Pavement Analyzer proved to be a useful tool in ranking product rutting performance on a laboratory-scale. Trends from laboratory testing matched field performance.
• Curing time meaningfully improved rutting results for cold-applied mixtures, particularly for the water-reactive products.
Based on findings in this study, key recommendations are as follows:
• Cure time should be investigated further for implementation into Tactics, Techniques, and Procedures (TTPs) to better optimize overall process expediency and rutting performance simultaneously.
• Lower-temperature testing should be conducted, particularly for the water-reactive products, to evaluate durability and cracking properties to ensure these materials are not prone to producing foreign object debris (FOD).

ERDC/GSL TR-17-10 viii
• Further testing is recommended to determine if water-activated products could replace Instant Road Repair®, the current recommended product, to provide improved early rutting performance.

ERDC/GSL TR-17-10 1
1 Introduction
1.1 Background
Cold-applied asphalt repair materials, commonly referred to as cold mixes, are often used for the rapid repair of airfield pavements, highway pavements, and municipal roads. Typically, these materials are utilized when plant-mixed hot mix asphalt (HMA) is not readily available or practical for use and because they can be placed with relative ease and speed. Speed of repair, specifically, is almost always a major concern for a typical rehabilitation project since it requires closure of the pavement to traffic for some period of time.
Logistical advantages such as material availability and speed of repair are usually accompanied with performance disadvantages. Cold mixes often exhibit rutting issues, and these could be significant when aircraft loadings are applied. With severe rutting, increased potential for foreign object debris (FOD) production is possible, posing a major risk to aircraft on airfield pavements.
In attempts to mitigate performance issues to the extent possible, Mejías-Santiago et al. (2010) tested seven commercial-off-the-shelf (COTS) cold mix products to develop laboratory criteria to facilitate material selection in practice. All materials tested performed poorly, and, ultimately, cold mix repair products were not recommended for airfield pavement repairs subjected to high-tire-pressure aircraft such as the F-15E. Additionally, the suite of tests considered did not include any type of laboratory wheel-tracking test.
This report builds off work conducted by Mejías-Santiago et al. (2010) in two notable ways. First, nine COTS cold mix products were tested in this study. Three of them were manufactured with water-reactive binder formulations, which were not considered in Mejías-Santiago et al. (2010). Second, laboratory wheel tracking of each material was assessed as an indicator of field rutting performance.

ERDC/GSL TR-17-10 2
1.2 Objectives
The main objectives of this study were as follows:
• Conduct laboratory testing on commercially available cold mix materials to characterize, among other properties, material rutting behavior,
• Conduct full-scale field repairs and subject them to simulated aircraft traffic,
• Evaluate results and relative merits of each cold mix product, particularly with respect to rutting performance.
1.3 Scope
This project consisted of a selection of nine available COTS cold patch asphalt repair materials identified by the research team under the guidance of the U.S. Air Force Civil Engineer Center. The selected materials were evaluated through laboratory tests and under controlled traffic conditions in the field to determine the ability of the repair materials to support F-15E aircraft traffic. Assessment of rutting performance was the focus of this report. Properties, such as air voids, were measured in some cases while others (e.g., durability, cracking, raveling) were not considered.
1.4 Layout of report
Chapter 2 details the experimental program including materials tested, laboratory testing, and field testing. Chapter 3 presents laboratory testing results, and Chapter 4 presents field testing results. Chapter 5 provides a discussion of the results, and Chapter 6 lists the conclusions and recommendations.

ERDC/GSL TR-17-10 3
2 Experimental Program
2.1 Materials tested
2.1.1 Cold mix asphalt materials
Table 2.1 lists the nine COTS cold mix asphalt materials tested in this study. Cold mix asphalt materials, further denoted cold mixes, were selected to reasonably represent available products on the market and were either cutback asphalt formulations or water-reactive formulations. Cutback asphalts generally refer to a combination of asphalt binder and petroleum solvent (e.g., diesel, kerosene). The primary function of the petroleum solvent in the system is to reduce viscosity and increase workability at “cold” (i.e., ambient) temperatures. Cutback formulations cure by volatilization of the solvent. Water-reactive formulations typically contain plant-based oils and a reaction-assisting material. When mixed with water, the materials chemically react and promote strength development.
Table 2.1. Cold mix asphalt products evaluated.
ID Product Type Manufacturer
AP AQUA PATCH H2O Reactive Aqua Patch Road Materials, LLC
AQ Aquaphalt™ 6.0 H2O Reactive Roadstone Production, LLC
CCO ChemCo Asphalt Repair Cutback ChemCo Systems
EZ EZ Street® Cutback The EZ Street Company
IA Instant Asphalt™ 6.0 H2O Reactive Pavemend
IRR Instant Road Repair® Cutback International Roadway Research
PP Perma-Patch® Cutback Perma-Patch, Inc.
QR QUIKRETE® High Performance Blacktop Repair Cutback QUIKRETE®
3R Ready Road Repair® Cutback Gardner-Gibson®
Table 2.2 and Figure 2.1 provide gradations measured on solvent-extracted aggregate for all cold mixes except AP and EZ. The AP gradation was not attainable because aggregate could not be extracted from the mixture in traditional manners (e.g., ignition oven, solvent extraction) due to the water-reactive binder. Gradations are provided for AQ and IA, also water-reactive formulations, because a gradation band was provided in the manufacturers’ technical data sheets; the median gradation for each band was identical for AQ and IA and is reported in Table 2.2 and Figure 2.1. The EZ gradation was not performed due to laboratory logistical issues.

ERDC/GSL TR-17-10 4
Table 2.2. Cold mix asphalt gradations by material.
Property AQ CCO IA IRR PP QR 3R NMAS 4.75 9.5 4.75 9.5 9.5 12.5 9.5
Perc
ent P
assi
ng b
y Si
eve
Size
(mm
)
50.0 100 100 100 100 100 100 100 37.5 100 100 100 100 100 100 100 25.0 100 100 100 100 100 100 100 19.0 100 100 100 100 100 100 100 12.5 100 100 100 100 100 100 100 9.5 100.0 100 100.0 99.7 100 88.3 100
4.75 92.5 83.1 92.5 81.6 86.8 37.0 69.6 2.36 37.5 18.1 37.5 46.7 26.0 10.4 15.2 1.18 22.0 5.3 22.0 31.1 7.6 5.4 5.7 0.60 --- 3.7 --- 23.2 4.9 4.3 4.0 0.30 --- 3.3 --- 16.9 3.9 3.6 3.4 0.15 --- 3.1 --- 11.6 3.4 3.1 3.1
0.075 4.5 2.8 4.5 7.7 2.9 2.7 2.6 -- Gradations for AQ and IA were obtained from manufacturers’ technical data sheets since as-received
gradations could not be attained. Percent passing values were not provided between 1.18 and 0.075 mm.
Figure 2.1. Cold mix asphalt gradations.
The maximum density line for a 12.5 mm nominal maximum aggregate size (NMAS) gradation is shown in Figure 2.1 since 12.5 mm is the largest NMAS tested. Individual plots for 4.75, 9.5, and 12.5 mm NMAS gradations were omitted for brevity as Figure 2.1 provides a depiction of each gradation for comparison. Most cold mixes are gap-graded and predominantly fall on the
19.012.59.54.752.361.18
0.60
0.30
0.15
0.07
5
0
10
20
30
40
50
60
70
80
90
100
Perc
ent P
assi
ng (%
)
Sieve Size0.45 (mm)
Airfield Band #212.5 mm Max Density LineAQ & IACCOIRRPPQR3R CCO and IRR
gradations selected for hot mix experiment
Note: AP and EZ gradations werenot available

ERDC/GSL TR-17-10 5
coarse side of their corresponding maximum density line. IRR, plotting mostly along the 9.5 mm NMAS max density line, was the key exception to this trend. Two 9.5 mm NMAS gradations, CCO and IRR, were selected for later evaluation in a hot mix asphalt experiment. IRR was selected because it was a finer gradation, while CCO was selected because it was representative of the gapped gradations.
2.1.2 Hot mix asphalt materials
Two HMA materials were used in this study as control mixtures for cold mixes. One material was produced and tested in the laboratory, while the other was produced and tested in the field. These two materials were designated as either CM-L or CM-F for laboratory or field control mixture, respectively.
CM-L consisted of raw materials (i.e., aggregates and asphalt binder) sampled during paving work at the Federal Aviation Administration (FAA) National Airport Pavement Test Facility (NAPTF) in Atlantic City, New Jersey. These raw materials were used to create three laboratory-produced, laboratory-compacted mixtures at various gradations denoted NJ, CCO, and IRR. Each CM-L mixture was identified by its gradation (e.g., CM-L-NJ, CM-L-CCO). CM-L-NJ was the original mixture used at the FAA facility in New Jersey and was a 75-blow Marshall-designed mixture. CM-L-NJ and CM-L-IRR were produced with 5.0% asphalt content (Pb), while CM-L-CCO was produced with 3.0% Pb. The design Pb was used for CM-L-NJ, while the asphalt contents for the CCO and IRR gradations were selected based on engineering judgment. Table 2.3 provides design properties for CM-L-NJ, while Figure 2.2 provides its gradation. CM-L materials were used as a control for cold mixes during the laboratory component of this study.
Table 2.3. CM-L-NJ design properties.
Property Value
Mix Temp (°F) 325
Compaction Temp (°F) 305
Binder PG 76-22
Pb (%) 5.0
Gmm (g/cm3) 2.622
Va (%) 3.4
VMA (%) 15.7
Stability (lbs) 3,950
Flow (0.1 in) 12
ERDC/GSL TR-17-10 6
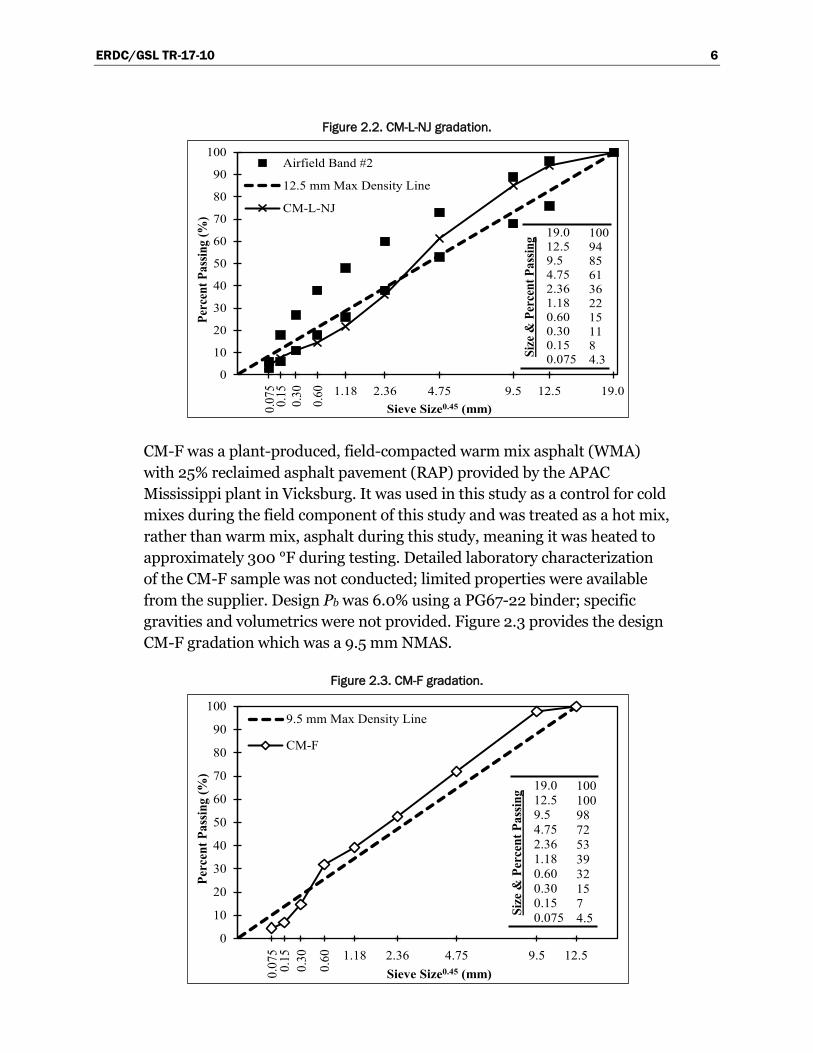
Figure 2.2. CM-L-NJ gradation.
CM-F was a plant-produced, field-compacted warm mix asphalt (WMA) with 25% reclaimed asphalt pavement (RAP) provided by the APAC Mississippi plant in Vicksburg. It was used in this study as a control for cold mixes during the field component of this study and was treated as a hot mix, rather than warm mix, asphalt during this study, meaning it was heated to approximately 300 °F during testing. Detailed laboratory characterization of the CM-F sample was not conducted; limited properties were available from the supplier. Design Pb was 6.0% using a PG67-22 binder; specific gravities and volumetrics were not provided. Figure 2.3 provides the design CM-F gradation which was a 9.5 mm NMAS.
Figure 2.3. CM-F gradation.
19.012.59.54.752.361.18
0.60
0.30
0.15
0.07
5
0
10
20
30
40
50
60
70
80
90
100
Perc
ent P
assin
g (%
)
Sieve Size0.45 (mm)
Airfield Band #2
12.5 mm Max Density Line
CM-L-NJ
19.012.59.54.752.361.180.600.300.150.075Si
ze &
Per
cent
Pas
sing 100
9485613622151184.3
12.59.54.752.361.18
0.60
0.30
0.15
0.07
5
0
10
20
30
40
50
60
70
80
90
100
Perc
ent P
assin
g (%
)
Sieve Size0.45 (mm)
9.5 mm Max Density Line
CM-F
19.012.59.54.752.361.180.600.300.150.075Si
ze &
Per
cent
Pas
sing 100
10098725339321574.5

ERDC/GSL TR-17-10 7
2.2 Laboratory test methods
2.2.1 Mixing and compaction
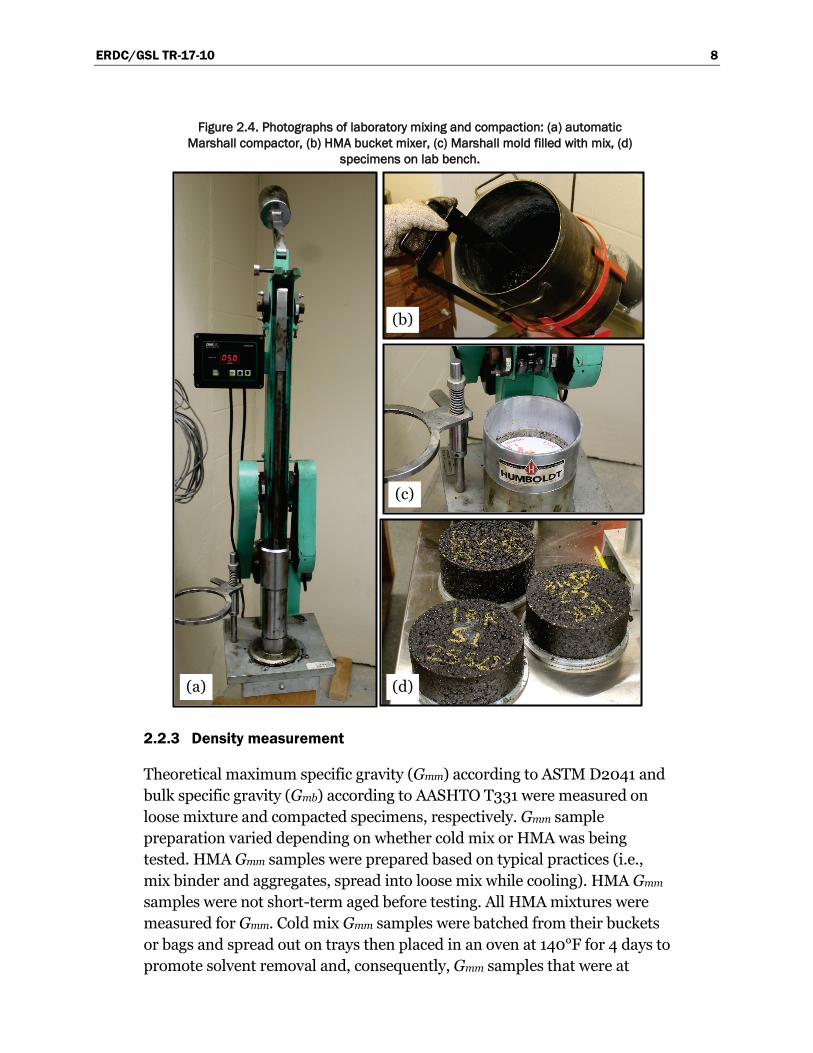
Cold mixes were stored in sealed buckets or bags indoors until used and were mixed, if necessary, according to manufacturer directions (e.g., water-activated mixtures). Preliminary testing was conducted to adjust target mix masses in order to produce 150 mm diameter specimens with target heights of either 75 mm or 115 mm. Compaction was performed with 50 blows per side of an automatic Marshall hammer. Specimens were compacted at ambient temperature, immediately extruded from molds, and placed on mold base plates on a lab bench to cure.
CM-L mixes were batched from four bulk aggregate sources to the NJ gradation. In order to create batches for the CCO or IRR gradations, material batched to the NJ gradation was sieved into nine size fractions from 12.5 mm to finer than 0.075 mm and then batched to the CCO or IRR gradation. Aggregate was heated to 310 °F, mixed with PG 64-22 asphalt binder to the corresponding mixture’s Pb, then compacted with 50 blows per side in the automatic Marshall hammer. Note that compaction effort, at 50 blows per side, was consistent for all mixtures even though CM-L-NJ was designed using a manual hammer at 75 blows per side. Similarly, PG 64-22 binder was substituted for the PG 76-22 binder used in CM-L-NJ design. Specimens were immediately extruded from molds and placed on base plates on a lab bench under a fan to cool. Figure 2.4 illustrates mixing and compaction equipment as well as the items typical of the mixing and compaction procedure.
2.2.2 Curing
Cold mix specimens were cured on a lab bench at ambient conditions for various cure times. Most commonly, specimens were cured overnight and then tested. Specific timing for curing of overnight specimens was not maintained, and actual cure times varied from approximately 18 to 28 hr. For purposes of this report, specimens cured overnight are nominally referred to as 1-day specimens. Additionally, some specimens were also cured for 3 and 5 days.
ERDC/GSL TR-17-10 8
Figure 2.4. Photographs of laboratory mixing and compaction: (a) automatic Marshall compactor, (b) HMA bucket mixer, (c) Marshall mold filled with mix, (d)
specimens on lab bench.
2.2.3 Density measurement
Theoretical maximum specific gravity (Gmm) according to ASTM D2041 and bulk specific gravity (Gmb) according to AASHTO T331 were measured on loose mixture and compacted specimens, respectively. Gmm sample preparation varied depending on whether cold mix or HMA was being tested. HMA Gmm samples were prepared based on typical practices (i.e., mix binder and aggregates, spread into loose mix while cooling). HMA Gmm samples were not short-term aged before testing. All HMA mixtures were measured for Gmm. Cold mix Gmm samples were batched from their buckets or bags and spread out on trays then placed in an oven at 140°F for 4 days to promote solvent removal and, consequently, Gmm samples that were at
(a)
(b)
(c)
(d)

ERDC/GSL TR-17-10 9
constant mass. As with the gradations discussed in Section 2.1.1, Gmm was not measured on water-reactive cold mixes or on EZ due to laboratory logistical issues.
Gmb, using the CoreLok® device, was measured on specimens for which Gmm was also measured. Cold mix specimens, in particular, were measured for Gmb after either one day of curing or on the final day of their curing protocol (e.g., at 5 days). Difficulties in vacuum sealing were sometimes encountered with cold mix specimens because the mixtures were relatively soft and easily deformed by the CoreLok bag as it sealed around a specimen (Figure 2.5). Care was taken to alleviate this problem to the extent possible by aligning the bag and specimen such that folds in the bag were less likely to occur.
Figure 2.5. Typical cold mix specimen deformed by CoreLok bag.
Air voids (Va) were calculated from Gmm and Gmb for a general under-standing of mixture compactibility under a fixed compaction effort. Given the concerns presented, especially for CoreLok Gmb of cold mix specimens, Va values should be interpreted loosely. However, while not expected to be nearly as precise as for HMA, cold mix Va values can still be useful for general comparisons.
2.2.4 Laboratory rut testing
Mixtures evaluated in this study were tested for rutting behaviors in the Asphalt Pavement Analyzer (APA) shown in Figure 2.6. Tests were run in general accordance with AASHTO T340 to 8,000 cycles (16,000 passes). Test parameters were as follows: 100 lb vertical load, 100 psi hose pressure, and 43 °C (110 °F) test temperature. T340 requires specimens to be

ERDC/GSL TR-17-10 10
conditioned at the test temperature for 6 to 24 hr; in this study, specimens were generally placed in an oven or in the APA overnight at the test temperature and tested the following morning.
Figure 2.6. Asphalt pavement analyzer: (a) overall, (b) inside of cabin.
Note that APA molds were modified so that each mold’s inside diameter was slightly enlarged. This could meaningfully affect results relative to typical T 340 procedures because specimens were not confined (i.e., mold diameters were larger than specimen diameters even after mold halves were com-pletely tightened). Consequently, the modified molds permitted specimens to deform outward under load, meaning rutting could occur via two mechanisms – mixture shear failure (typical rutting mechanism) and out-ward deformation. This should be considered when evaluating results relative to other APA data outside of this report. Additionally, data collec-tion points were improperly configured relative to default APA spacing. While this would have minimal impact on data comparisons within this report, care must be taken when comparing with APA data outside this report, as results may vary slightly. Improper configuration of the data collection points was not observed until after all testing for this report was complete.
Figure 2.7 provides a typical photograph of a tested APA specimen in an APA mold. A type of screening process was used when determining the APA test plan. All cold mixes were tested after one day of curing. For 3-day and 5-day APA testing, only select mixes were tested based on both 1-day APA results and a more subjective assessment after handling the mixtures in the laboratory, as discussed in the laboratory results chapter.
(a) (b)

ERDC/GSL TR-17-10 11
Figure 2.7. Typical tested APA specimen.
Table 2.4 summarizes the APA test plan for cold mixes. After 1-day testing, CCO and QR were removed from consideration, while all other mixtures were tested further to determine if additional curing could meaningfully impact rutting characteristics. After 3-day testing, EZ, PP, and 3R were removed from consideration, while AP, AQ, IA, and IRR were again further tested after five days of curing. Six replicate specimens were tested for each mixture at each cure time yielding a total of 120 cold mix specimens (20 APA tests) tested in this study.
Table 2.4. APA test plan for cold mixes.
ID 1-day Cure 3-day Cure 5-day Cure
AP
AQ
CCO --- ---
EZ ---
IA
IRR
PP ---
QR --- ---
3R ---
For HMA mixtures, six replicates were also tested at the same test parameters as cold mix specimens. Curing time was not a variable for HMA mixtures; therefore, one set of six specimens was tested per mixture. Collectively for CM-L-NJ, CM-L-CCO, and CM-L-IRR, this yielded 18 total HMA specimens (3 APA tests) tested in this study.
2.2.5 Indirect tensile strength testing
Indirect tensile strength (IDT) testing was conducted in general accordance with ASTM D6931. IDT testing comprised a small amount of the overall
ERDC/GSL TR-17-10 12
project’s testing effort as only one cold mix, AQ, was tested for IDT strength (St). AQ specimens were cured for 1, 3, and 5 days; three replicates were tested at each cure time.
2.3 Field test methods
2.3.1 Phase 1 field testing
One HMA and three cold mix materials were tested during Phase 1 field testing beginning July 1, 2015: CM-F, AQ, IA, and IRR. CM-F was tested as the HMA control. AQ and IA were tested based on favorable laboratory APA results. Note that AP performed very favorably according to APA testing but was unable to be field tested in Phase 1 since the additional quantities needed for field testing were not provided in time by the material supplier. Lastly, IRR was included in Phase 1 field testing since it is a currently approved product. The mean daily temperature during Phase 1 field testing ranged from 80 to 84 °F, the minimum daily temperature ranged from 71 to 78 °F, and the maximum daily temperature was 89 °F.
Field testing was conducted within ERDC facilities in an existing asphalt test section that had been in place for several years. Areas for patching were created by saw cutting 2-ft squares to a depth of 4 in. Patch locations were situated in a three-by-four grid pattern so that three curing protocols could be investigated for the four materials tested (12 patches total). Each set of four materials is further referred to as a series. The grid pattern was spaced such that trafficking of an entire series could occur simultaneously.
Patches were placed with hand tools in two approximately equal lifts of material. For the water-activated cold mixes, AQ and IA, water was added according to manufacturer recommendations. Cold mix compaction was achieved via a hand tamp and a Northern Industrial Equipment JPC-80 vibratory plate compactor (PC). HMA compaction was achieved via a CAT walk-behind steel wheel roller (CR). Figure 2.8a shows an example of a compacted field patch. In-place densities were not obtained.
Each series of four patches was subjected to one of three curing protocols prior to trafficking. These protocols are referred to as Conditions 1, 2, and 3, and are denoted C1, C2, and C3 in this report. Condition 1 called for a 2-hr ambient-temperature cure time. Condition 2 utilized a 2-hr cure time that included 20 min of infrared heating per patch, not including the CM-F patch, and 100 min at ambient temperature. A skid steer-mounted

ERDC/GSL TR-17-10 13
Heatwurx HWX-30 heater (Figure 2.9) was outfitted with a thermostat to maintain a relatively constant temperature of 375 °F. Infrared heating increased patch surface temperatures to approximately 155 °F after 20 min. Infrared heat was applied to the first patch beginning immediately after compaction so that the fourth patch had time to cool to approximately ambient pavement temperatures. Condition 3 utilized a 72-hr ambient-temperature cure time.
Figure 2.8. Example field patch (IA shown): (a) before trafficking, (b) after trafficking.
Figure 2.9. Heatwurx infrared heater.
Trafficking was conducted with a load cart outfitted with an F-15E tire as shown in Figure 2.10. The load cart was designed to simulate the maximum single-wheel F-15E gross loading of 35,235 lb at a tire pressure of 325 psi. A channelized traffic pattern was used in this project. During trafficking, deterioration of the repair was monitored, and rutting measurements were recorded periodically based on the rate of deterioration. Rut measurements were taken as shown in Figure 2.8b by placing a straightedge across the rut and measuring the maximum rut depth. Trafficking was conducted to either failure, which was established as 1 in. (25.4 mm) of rutting, or 100 passes.
(a) (b)

ERDC/GSL TR-17-10 14
Figure 2.10. F-15E load cart.
2.3.2 Phase 2 field testing
Three cold mix materials were tested during Phase 2 field testing beginning August 20, 2015: AP, AQ, and IA. Phase 2 field testing was conducted primarily to evaluate AP since it was not able to be included in Phase 1. AQ and IA were tested again for comparison of results; however, CM-F and IRR were not tested a second time. The mean daily temperature during Phase 2 field testing ranged from 78 to 81 °F, the minimum daily temperature ranged from 73 to 78 °F, and the maximum daily temperature ranged from 84 to 89 °F. Field testing procedures were generally similar between Phases 1 and 2 with only a few notable differences; for this reason, only procedures unique to Phase 2 are discussed in this section.
Two compaction methods were considered in Phase 2. Patches were compacted with either the PC as in Phase 1 or the CR, which was used in Phase 1 for CM-F only. A fourth curing condition (C4), 24 hr ambient curing, was utilized. In all, six patches were tested (3 materials, 2 compaction methods, 1 curing condition).
Rut measurements were recorded periodically throughout trafficking with the F-15E load cart. Max rut depth measurements were obtained using the straightedge method described in Phase 1. Cross-section profiles were also obtained using a surveying rod and level. As in Phase 1, patches were trafficked until failure (25.4 mm of rutting) or 100 passes, whichever came first.

ERDC/GSL TR-17-10 15
3 Laboratory Test Results
This chapter presents results of laboratory-compacted specimens and is divided into three sections that provide density and air void results, APA rutting results, and IDT St results.
3.1 Density and air voids
Table 3.1 presents average 50-blow density results for available cold mixes and all CM-L mixtures. Cold mix Va values range from approximately 17% to 32% depending on the material. Concerns exist regarding the validity of cold mix Gmm and Gmb values. In addition to normal testing variability, a measured Gmm value of a cold mix is also dependent on the level of curing the sample has undergone, a variable that was not tightly controlled in this project. Residual solvent was routinely observed in the pycnometer during testing. Residual solvent in both Gmm and Gmb specimens is likely to affect the accuracy of the Va calculations. Similarly, the issues encountered with CoreLok measurements described in Section 2.2.3 could have meaningfully affected Gmb measurements, though there is no means of quantifying these effects. For these reasons, Va results are not intended to be used to directly compare one cold mix to another. The purpose of showing cold mix Va results is primarily to demonstrate the difference in the range of cold mix Va values relative to conventional HMA with design-level Va’s around 4% and construction-target-level Va’s around 7 to 8%. From this perspective, the difference between cold mix and typical HMA Va values is significant.
Table 3.1. Laboratory density and air void results.
ID Gmm (g/cm3) Gmb (g/cm3) Va (%)
CCO 2.676 1.879 29.8
IRR 2.448 2.020 17.5
PP 2.671 1.830 31.5
QR 2.439 1.907 21.8
3R 2.607 1.769 32.1
CM-L-CCO 2.691 2.017 25.0
CM-L-NJ 2.620 2.383 9.0
CM-L-IRR 2.573 2.401 6.7
-- Recall that Gmm was not obtained for AP, AQ, EZ, and IA.

ERDC/GSL TR-17-10 16
HMA Va values ranged from 6.7% to 25.0%. Of the three CM-L mixtures, CM-L-NJ is the only designed mixture (others were laboratory-fabricated and did not follow any formal design procedure). Even still, CM-L-NJ was compacted with 50 blows per side in a 6-in. mold with a mechanical hammer instead of the 75 blows per side in a 4-in. mold with a manual hammer for which it was designed, which could partially explain its high 9.0% Va value. Considering the mixture’s design Va’s average 3.4% (Table 2.3), it is not likely that decreasing compaction effort to 50 blows would fully account for the 5.6% Va increase. Gmm, at 2.620 is reasonable compared to the Table 2.3 design Gmm of 2.622, which suggests the mixture itself is correct. Gmb is low relative to Gmm, most likely suggesting either compaction issues (i.e., Gmb is in fact correct) or Gmb measurement issues (i.e., specimens had lower Va and Gmb is incorrect). Overall, CM-L-NJ Va values appear questionable.
CM-L-IRR is the finest gradation tested of the CM-L mixtures. To be a laboratory-fabricated mixture in which its Pb was not based on a design procedure, its Va of 6.7% appears reasonable. Given that CM-L-IRR utilized a finer gradation (more aggregate surface area), asphalt binder demand would be greater than it was for CM-L-NJ, all other factors being equal. While binder demand would be greater, CM-L-IRR was not provided any additional binder to satisfy this demand. Instead it was maintained at 5.0% Pb, which would increase Va (relative to the 4% design Va target); therefore, CM-L-IRR Va’s appear reasonable.
CM-L-CCO is the coarsest gradation tested of the CM-L mixtures; thus, it would be expected to have the highest Va. While it does, 25.0% Va is unreasonably high. In this case, Gmm appears that it could be too high, and Gmb appears that it could be too low. As with the aforementioned explanations, a number of factors could have affected either measurement. Overall, CM-L-CCO Va values appear questionable. In either case, the creation of hot asphalt mixtures using replicated gradations from the cold mixes shows that aggregate gradation is a major factor influencing the compacted Va and the mix’s ability to densify. Lack of adequate densification during compaction is a major factor in rutting behavior.
3.2 APA rutting
Figure 3.1 presents APA results for 1-day cured cold mix specimens. Cold mixes can be easily grouped into two general categories: 1) those that reached the maximum APA rut depth in less than 2,000 cycles, and 2) those

ERDC/GSL TR-17-10 17
that lasted 8,000 cycles. These two categories are further referred to as Group B and Group A products, respectively. Recall that APA testing in this report was conducted at 43 °C rather than the traditional 64 °C test temperature. Behaviors of these materials would likely worsen at 64 °C; this should be considered when discussing results (e.g., a 6 mm rut depth at 8,000 cycles and 43 °C would be greater with respect to standard 64 °C testing).
Figure 3.1. Cold mix 1-day APA results.
From a material selection perspective where rutting is the primary point of interest, there is little motivation to recommend a product failing at less than 2,000 cycles (Group B) for anything other than extreme emergency situations when there are products that exhibit significantly better rut characteristics (Group A). In normal operations, the group of products including AQ, IA, and AP would be preferred. It is of interest to note that IRR, the currently used cold mix material, is located in the less desirable group, suggesting that revisions to approved-product lists may be worth considering.
While early rutting performance is often of primary interest for airfield applications, understanding material behavior over time as the cold mixes cure is beneficial. Figure 3.2 presents 3-day results for comparison to 1-day results for select Group B cold mixes. Figure 3.3 presents 1-, 3-, and 5-day results for Group A cold mixes as well as IRR for comparison since IRR is the current recommended product.
0
2
4
6
8
10
12
0 1000 2000 3000 4000 5000 6000 7000 8000
Rut
Dep
th (m
m)
Cycles
PP CCO EZ3R IRR QRAQ IA AP

ERDC/GSL TR-17-10 18
Figure 3.2. Cold mix 1 and 3 day APA results.
Figure 3.3. Cold mix 1, 3, and 5 day APA results.
Figure 3.2 plots rut data to 2,000 cycles and illustrates that additional curing time did not meaningfully improve rutting characteristics for any of the Group B products. EZ’s cycles to failure approximately doubled between 1 and 3 days of curing; however, increasing from 500 to 1,000 cycles is not meaningful considering the product, even at 3 days, only withstood one-eighth of a standard APA test at a reduced temperature. Other improve-ments with curing time were less noticeable than that of EZ or effectively nonexistent.
0
2
4
6
8
10
12
0 200 400 600 800 1000 1200 1400 1600 1800 2000
Rut
Dep
th (m
m)
Cycles
3R (1d) 3R (3d)
EZ (1d) EZ (3d)
IRR (1d) IRR (3d)
PP (1d) PP (3d)
0
2
4
6
8
10
12
0 1000 2000 3000 4000 5000 6000 7000 8000
Rut
Dep
th (m
m)
Cycles
AQ (1 day) AQ (3 day) AQ (5 day)AP (1 day) AP (3 day) AP (5 day)IA (1 day) IA (3 day) IA (5 day)IRR (1 day) IRR (3 day) IRR (5 day)

ERDC/GSL TR-17-10 19
Figure 3.3 demonstrates that additional curing time could have moderate effects on Group A products. IRR results were included for completeness. As with Figure 3.2, IRR 5-day results were not improved relative to 1- or 3-day results and were likely within the variability of the material and test.
Group A rutting improvements were more noticeable between 1 and 3 days than between 3 and 5 days, which is intuitive. Improvements were fairly significant in some cases, as with AQ where rut depth decreased from approximately 9 to 4 mm from 1 to 3 days. For all Group A products, rut depths decreased 35 to 52% from 1 to 3 days and 2 to 32% from 3 to 5 days. Overall, Group A products ranked in order of AP, IA, and then AQ with respect to APA rutting performance.
Figure 3.4 provides APA results for the HMA control mixtures. The most informative result in terms of comparison with cold mixes is that of the fully-designed CM-L-NJ mixture. Its rut depth is approximately 4 mm, and it assists in further assessing performance within Group A mixtures. From Figure 3.3 Group A mixtures, only AQ and IA 1-day results exceeded 4 mm; all others exhibited rut depths of approximately 4 mm or less.
Figure 3.4. HMA control mixture APA results.
CM-L-CCO and CM-L-IRR results were presented to examine the effect of gradation on rutting performance with the intent of better understanding the performance of Group B products. Gradation can affect the overall stability of a mixture and its subsequent resistance to rutting. However,
0
2
4
6
8
10
12
0 1000 2000 3000 4000 5000 6000 7000 8000
Rut
Dep
th (m
m)
Cycles
CM-L-CCO
CM-L-IRR
CM-L-NJ

ERDC/GSL TR-17-10 20
because of the potential issues with the laboratory-fabricated control mixtures, APA results of CM-L-CCO and CM-L-IRR should be considered questionable as actual Va values in addition to specimen integrity are not truly known for these mixtures.
3.3 Indirect tensile strength
Table 3.2 presents IDT St data for AQ for a general understanding of cold mix St relative to conventional asphalt. AQ, while not the most rut-resistant material tested, was one of the Group A products, which is why it was selected. St ranged from 8 to 12 psi and increased very slightly with cure time, though the trend is not strong.
Table 3.2. AQ IDT St Results.
Cure Time (days) Avg St (psi)
1 8
3 12
5 10
For comparison, Rushing et al. (2013) presents St data for multiple WMA mixes evaluated for use on heavy traffic airfields. For laboratory-produced WMA, St values from 275 to 390 psi were reported. Similarly, for plant-produced WMA, St values from 300 to 350 psi were reported. This illustrates the drastic difference in tensile strength behaviors between cold mixes tested in this project and conventional asphalt (WMA or HMA).
ERDC/GSL TR-17-10 21
4 Field Test Results
4.1 Phase 1 field testing
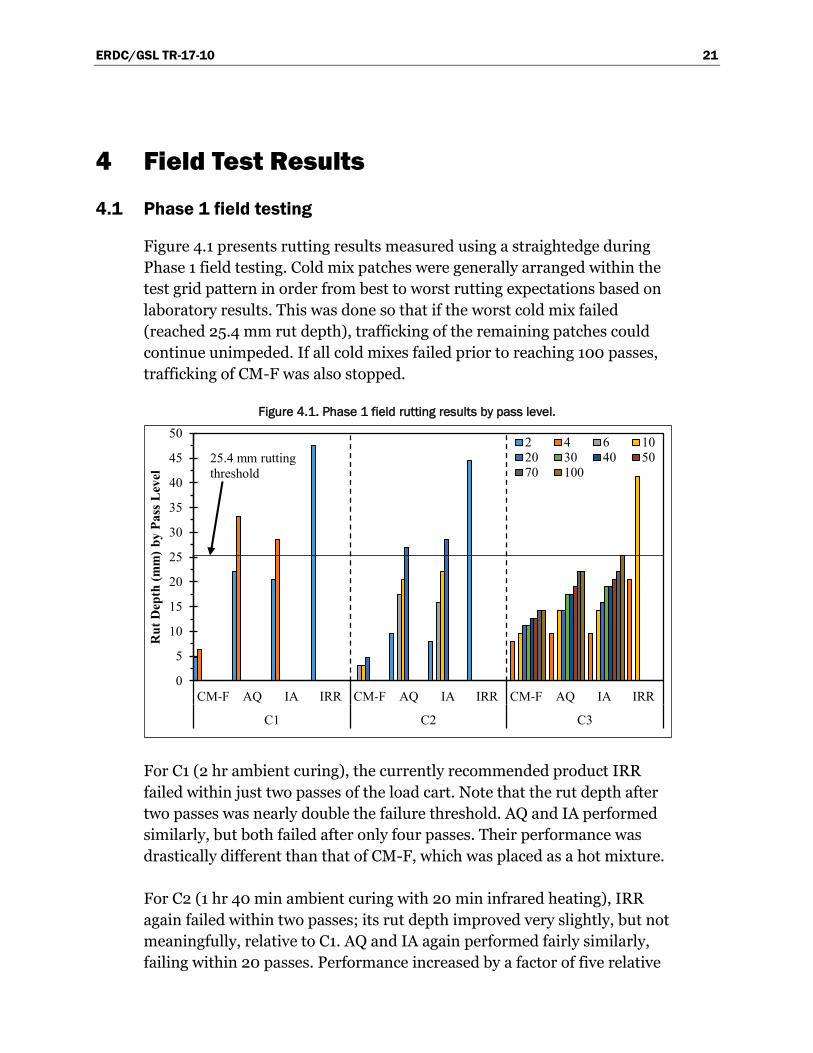
Figure 4.1 presents rutting results measured using a straightedge during Phase 1 field testing. Cold mix patches were generally arranged within the test grid pattern in order from best to worst rutting expectations based on laboratory results. This was done so that if the worst cold mix failed (reached 25.4 mm rut depth), trafficking of the remaining patches could continue unimpeded. If all cold mixes failed prior to reaching 100 passes, trafficking of CM-F was also stopped.
Figure 4.1. Phase 1 field rutting results by pass level.
For C1 (2 hr ambient curing), the currently recommended product IRR failed within just two passes of the load cart. Note that the rut depth after two passes was nearly double the failure threshold. AQ and IA performed similarly, but both failed after only four passes. Their performance was drastically different than that of CM-F, which was placed as a hot mixture.
For C2 (1 hr 40 min ambient curing with 20 min infrared heating), IRR again failed within two passes; its rut depth improved very slightly, but not meaningfully, relative to C1. AQ and IA again performed fairly similarly, failing within 20 passes. Performance increased by a factor of five relative
0
5
10
15
20
25
30
35
40
45
50
CM-F AQ IA IRR CM-F AQ IA IRR CM-F AQ IA IRR
C1 C2 C3
Rut
Dep
th (m
m) b
y Pa
ss L
evel
2 4 6 1020 30 40 5070 100
25.4 mm rutting threshold
ERDC/GSL TR-17-10 22
to C1; however, the number of passes to failure was still relatively low. By contrast, CM-F rut depths were less than 5 mm and were also lower than in C1. Recall that CM-F was not conditioned with infrared heating in C2 like cold mixes; therefore, CM-F conditions were identical between C1 and C2. The slight differences in rut depth between C1 and C2 could be a result of in-place density differences from one patch to another or an increased pavement temperature at the time of C2 testing.
For C3 (72 hr ambient curing), IRR failed within 10 passes, which, while slightly better than performance in C1 or C2, was not a practically meaningful increase. AQ and IA performed closely and withstood 100 passes, meeting the objective pass level. Rut depths were greater with CM-F relative to C1 and C2, perhaps partly due to lower densities or an increased pavement temperature at testing relative to C1, and would not have necessarily benefited from the additional curing time since HMA, unlike cold mixes, would be almost unaffected by ambient conditioning times in the 2 to 72 hr range.
Overall, the beneficial effect of additional curing time on cold mixes, especially AQ and IA, is evident from Figure 4.1. AQ and IA outperformed IRR, particularly after a longer curing time. AQ and IA demonstrate a better curing efficiency in that the increase in rutting resistance with curing time is significantly greater than for IRR. While AQ rutted slightly less than IA after C3 conditioning and 100 passes, this difference is of little significance without additional replication.
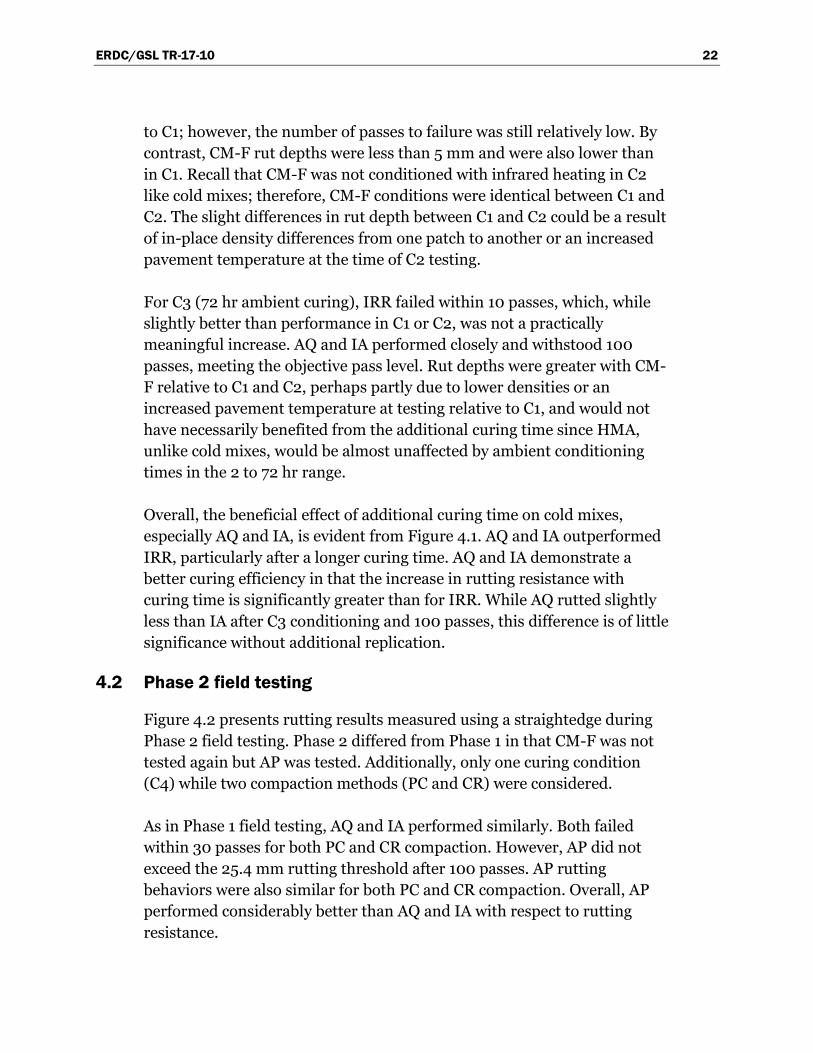
4.2 Phase 2 field testing
Figure 4.2 presents rutting results measured using a straightedge during Phase 2 field testing. Phase 2 differed from Phase 1 in that CM-F was not tested again but AP was tested. Additionally, only one curing condition (C4) while two compaction methods (PC and CR) were considered.
As in Phase 1 field testing, AQ and IA performed similarly. Both failed within 30 passes for both PC and CR compaction. However, AP did not exceed the 25.4 mm rutting threshold after 100 passes. AP rutting behaviors were also similar for both PC and CR compaction. Overall, AP performed considerably better than AQ and IA with respect to rutting resistance.

ERDC/GSL TR-17-10 23
Figure 4.2. Phase 2 field rutting results by pass level.
Figure 4.3 is an equality plot comparing CR and PC compaction methods where direct pairs of data were available (i.e., rut measurements for both PC and CR at the same pass level). Figure 4.3 was constructed using straight-edge rut measurements from Figure 4.2. In general, patches compacted with the CAT roller tended to yield higher rut depths than those compacted with the plate compactor. Considerable variability is present, however. Regression through the origin illustrates that, on average, a 25.4 mm rut depth for PC-compacted patches was equivalent to a 26.9 mm rut depth for CR-compacted patches. Given the limited and variable data available, this is not a meaningful finding. Overall, rutting resistance was not meaningfully impacted by one compaction method over another.
Figure 4.3. CR and PC comparison using straightedge rut measurements.
0
5
10
15
20
25
30
35
40
PC CR PC CR PC CR
AP AQ IA
Rut
Dep
th (m
m)
10 20 3050 10025.4 mm rutting
threshold
y = 1.06xR² = 0.61
5
10
15
20
25
30
35
5 15 25 35
CA
T R
olle
r R
ut D
epth
(mm
)
Plate Compactor Rut Depth (mm)
n = 5

ERDC/GSL TR-17-10 24
Figure 4.4 provides an equality plot comparing rut measurements obtained via surveys (rod and level) or a straightedge. Data points were either on the equality line or below it, indicating that survey and straightedge measurements were identical in some cases and, where they were not, straightedge measurements produced greater rut depths. Cases in which survey and straightedge measurements were not equal occurred when upheaval was present on either side of the wheel path. This increased the elevation of the straightedge relative to surrounding pavement since it was resting on this upheaved material when measurements were taken. Conversely, survey measurements used the surrounding pavement as the reference for rut measurements.
Figure 4.4. Comparison of survey and straightedge rut measurements.
y = 0.90xR² = 0.75
5
10
15
20
25
30
35
5 15 25 35
Rod
and
Lev
el R
ut D
epth
(mm
)
Straightedge Rut Depth (mm)
n = 14
ERDC/GSL TR-17-10 25
5 Discussion of Results
This chapter provides a joint discussion of laboratory and field results presented in Chapters 3 and 4. Discussion focuses primarily on rutting behaviors since rutting characterization was the primary focus of the project.
Laboratory rut testing of all nine cold mix products tested produced results that could be neatly grouped into one of two performance categories. Those that failed APA testing at 2,000 cycles or less (referred to as Group B products in Chapter 3) all utilized traditional cutback asphalt formulations. Note that this group included the current recommended material, IRR. Conversely, all products that withstood 8,000 cycles during APA testing (Group A products) utilized water-reactive binder formulations. This is notable given the considerable performance gap between the two groups.
Field rut testing of the current recommended material, IRR, and the three Group A cold mix products further illustrated the benefits of the water-reactive cold mix products in the context of rutting performance. Though all products were not tested at the same time due to AP unavailability in Phase 1 field testing, AQ and IA stood out from IRR with relative ease. In Phase 2 where AP was tested, AP withstood approximately three times as many load cart passes as AQ and IA. Therefore, where rutting performance is of primary interest, both laboratory and field indicators suggest water-reactive cold mix products should be considered over IRR or any other traditional cutback cold mix product.
While the water-reactive cold mix products tested ranked noticeably higher than cutback products in rutting resistance, it should be acknowledged that there are also other factors to consider. Given the temperature-dependent nature of asphalt materials, increasing performance on one end of the temperature spectrum (e.g., rutting, which is typically associated with higher temperatures) generally implies decreasing performance at the other end of the temperature spectrum (e.g., cracking and durability, which are typically associated with intermediate and low temperatures). One major distress likely associated with lower-temperature durability and potentially of concern would be FOD production. Because this project focused on

ERDC/GSL TR-17-10 26
rutting behaviors (which is one of the primary concerns with cold mix products because of the solvent and high air voids), it did not evaluate in any meaningful way other properties where issues with the water-reactive mixes could be encountered.
Durability and cracking behaviors of the water-reactive cold mixes could be an area for further study. It could be useful to compare lower-temperature performance of water-reactive cold mixes to conventional cutback cold mixes since lower-temperature properties of any cold mix product do not appear to have been studied in any great detail. It is, however, possible that the high air voids typical of cold mix products could mask any durability-related benefits, if any, of conventional cutback products. In that case, differences between lower-temperature properties of water-reactive and cutback products may not be nearly as apparent as the differences in rutting performance were in this report.
Curing time for a given product contributed considerably to observed rutting behaviors, which is a reasonable trend. Laboratory rutting data shows that rutting resistance improved slightly from 1 to 5 days of curing, with improvements tapering with cure time. This is expected and also demonstrates that more strength gain occurs early on (1 day or less) rather than later (5 days). Field data supports this behavior, showing significant improvement between C1 (2 hr) and C3 (3 days) (no 1-day testing was conducted in the field). Rutting resistance at 2 hr was almost negligible in all cases, while it was adequate (met the 100-pass objective at less than 25.4 mm rut depth) for AQ and IA at 3 days.
C1 does not appear to be sufficient because, though it meets the time requirement for expedient repairs, it does not perform adequately under traffic. Conversely, a 3-day curing time may not be practical depending on the application (e.g. expedient base recovery after attack). None of the COTS cold patch products evaluated during this effort met or exceeded the threshold values of 100 F-15E passes at 2 hr cure time.
It is worth noting that in extreme scenarios where minimal passes are required of a cold patch repair, such as base evacuation, C2 yielded considerably better rutting performance than C1. Both conditioning protocols required a total of 2 hr to conduct with the only difference being that patches were also heated for 20 min at some point during the 2-hr period using the infrared heater. If an equivalent heating mechanism was available, it does appear that it would be advantageous to use to accelerate curing to some degree and, ultimately, obtain longer life from the patch.

ERDC/GSL TR-17-10 27
6 Conclusions and Recommendations
Laboratory air void, rutting, and IDT data was presented in this report alongside field rutting data with simulated F-15E traffic for nine cold mix asphalt repair products and four conventional HMA control mixtures. Key observations from this study are as follows:
• Cold mix Va levels were on the order of 2-3 times greater than typical target Va levels for HMA during construction,
• Water-reactive cold mix products, withstanding a full 8,000-cycle APA test, exhibited significantly more favorable rutting behaviors than traditional cutback products that withstood 2,000 cycles or less,
• Within water-reactive cold mix products, AQUA PATCH (AP) yielded the highest rut resistance in both laboratory and field testing. Aquaphalt™ 6.0 (AQ) and Instant Asphalt™ 6.0 (IA) demonstrated similar behaviors to one another,
• In field testing, rutting resistance of the HMA control mixture, CM-F, was on the order of 2-5 times greater than water-reactive cold mixes AQ and IA (the only two products directly compared to HMA),
• Trends were relatively consistent between laboratory and field rut testing in that AP ranked most favorably, followed closely by AQ and IA, and trailed considerably by cutback products. This supports other findings that the APA can be a useful tool in ranking materials on a laboratory-scale,
• Curing time meaningfully improved rutting results with effects tapering with time. Laboratory rut depths for water-reactive products decreased 35 to 52% (44% average) from 1 to 3 days of curing and 2 to 32% (19% average) from 3 to 5 days. Field load cart passes to failure for water-reactive products increased from 4 to 100 from 2 hr to 3 days of curing.
Based on findings in this study, key recommendations are as follows:
• Lower-temperature testing should be conducted, particularly for the water-reactive products, to evaluate durability and cracking properties. From a materials perspective, this is important to consider for the water-reactive products since it is possible that the increased rutting resistance comes at a cost with regard to lower-temperature durability.

ERDC/GSL TR-17-10 28
This should also be considered from a base operations perspective. Generally, cold mixes are used to provide temporary patches only. In this case, long-term durability of the patch may be of less concern than the immediate ability to apply traffic and not rut. However, FOD potential should also be considered as it is a possible byproduct of increased rutting resistance,
• Depending on lower-temperature durability as well as situational priorities, replacement of Instant Road Repair®, the current recommended product, with a water-reactive product should be considered, especially if the primary interest is rutting resistance of temporary patches. Of the three water-reactive products tested, AQUA PATCH (AP) would be the most favorable product in terms of rut resistance, though Aquaphalt™ 6.0 (AQ) and Instant Asphalt™ 6.0 (IA) would also be suitable (and extremely preferable relative to cutback products) options. Logistical issues such as product acquisition and distribution would also be important considerations in addition to performance. Further, the shelf life of this category of product should be studied to better understand their ability to be pre-positioned for use as a repair material,
• When possible, an HMA material should be used for patching purposes as HMA typically provides greater overall performance than cold mix. One the greatest logistical issues associated with HMA in a base operations context is whether or not HMA can be produced and transported to the base while maintaining compaction temperatures until placement of the patch. HMA produced in advance and cooled to form loose mix could be utilized if a method for rapidly heating the loose mix was available. Development of such a method may be worth further investigation.

ERDC/GSL TR-17-10 29
References American Association of State Highway and Transportation Officials (AASHTO). 2010.
Standard method of test for determining the rutting susceptibility of hot mix asphalt (HMA) using the asphalt pavement analyzer (APA). Designation T340-10. Washington, DC: American Association of State Highway and Transportation Officials.
_____. 2013. Standard method of test for bulk specific gravity (Gmb) and density of compacted hot mix asphalt (HMA) using automatic vacuum sealing method. Designation T331-13. Washington, DC: American Association of State Highway and Transportation Officials.
American Society for Testing and Materials (ASTM). 2003. Standard test method for theoretical maximum specific gravity and density of bituminous paving mixtures. Designation D2041-03a. West Conshohocken, PA: American Society for Testing and Materials.
_____. 2012. Standard test method for indirect tensile (IDT) strength of bituminous mixtures. Designation D6931-12. West Conshohocken, PA: American Society for Testing and Materials.
Mejías-Santiago, M., F. Valle-Roldán, and L. P. Priddy. 2010. Certification tests on cold patch asphalt repair materials for use in airfield pavements. ERDC/GSL TR-10-14. Vicksburg, MS: U.S. Army Engineering Research and Development Center.
Rushing, J. F., M. Mejías-Santiago, and J. D. Doyle. 2013. Assessment of warm-mix asphalt for heavy traffic airfields. Transportation Research Record No. 2371. Washington, DC: Transportation Research Board.
REPORT DOCUMENTATION PAGE Form Approved
OMB No. 0704-0188 Public reporting burden for this collection of information is estimated to average 1 hour per response, including the time for reviewing instructions, searching existing data sources, gathering and maintaining the data needed, and completing and reviewing this collection of information. Send comments regarding this burden estimate or any other aspect of this collection of information, including suggestions for reducing this burden to Department of Defense, Washington Headquarters Services, Directorate for Information Operations and Reports (0704-0188), 1215 Jefferson Davis Highway, Suite 1204, Arlington, VA 22202-4302. Respondents should be aware that notwithstanding any other provision of law, no person shall be subject to any penalty for failing to comply with a collection of information if it does not display a currently valid OMB control number. PLEASE DO NOT RETURN YOUR FORM TO THE ABOVE ADDRESS. 1. REPORT DATE (DD-MM-YYYY)
June 2017 2. REPORT TYPE
Final 3. DATES COVERED (From - To)
4. TITLE AND SUBTITLE
Rutting Performance of Cold-Applied Asphalt Repair Materials for Airfield Pavements
5a. CONTRACT NUMBER
5b. GRANT NUMBER
5c. PROGRAM ELEMENT NUMBER
6. AUTHOR(S)
Ben C. Cox, John F. Rushing, and Web Floyd
5d. PROJECT NUMBER 448464
5e. TASK NUMBER
5f. WORK UNIT NUMBER
7. PERFORMING ORGANIZATION NAME(S) AND ADDRESS(ES) 8. PERFORMING ORGANIZATION REPORT NUMBER
Geotechnical and Structures Laboratory U.S. Army Engineer Research and Development Center 3909 Halls Ferry Road Vicksburg, MS 39180-6199
ERDC/GSL TR-17-10
9. SPONSORING / MONITORING AGENCY NAME(S) AND ADDRESS(ES) 10. SPONSOR/MONITOR’S ACRONYM(S) Headquarters, Air Force Civil Engineer Center 139 Barnes Avenue, Suite 1 Tyndall AFB, FL 32403-5319
HQ-AFCEC 11. SPONSOR/MONITOR’S REPORT NUMBER(S)
12. DISTRIBUTION / AVAILABILITY STATEMENT Approved for public release; distribution is unlimited.
13. SUPPLEMENTARY NOTES
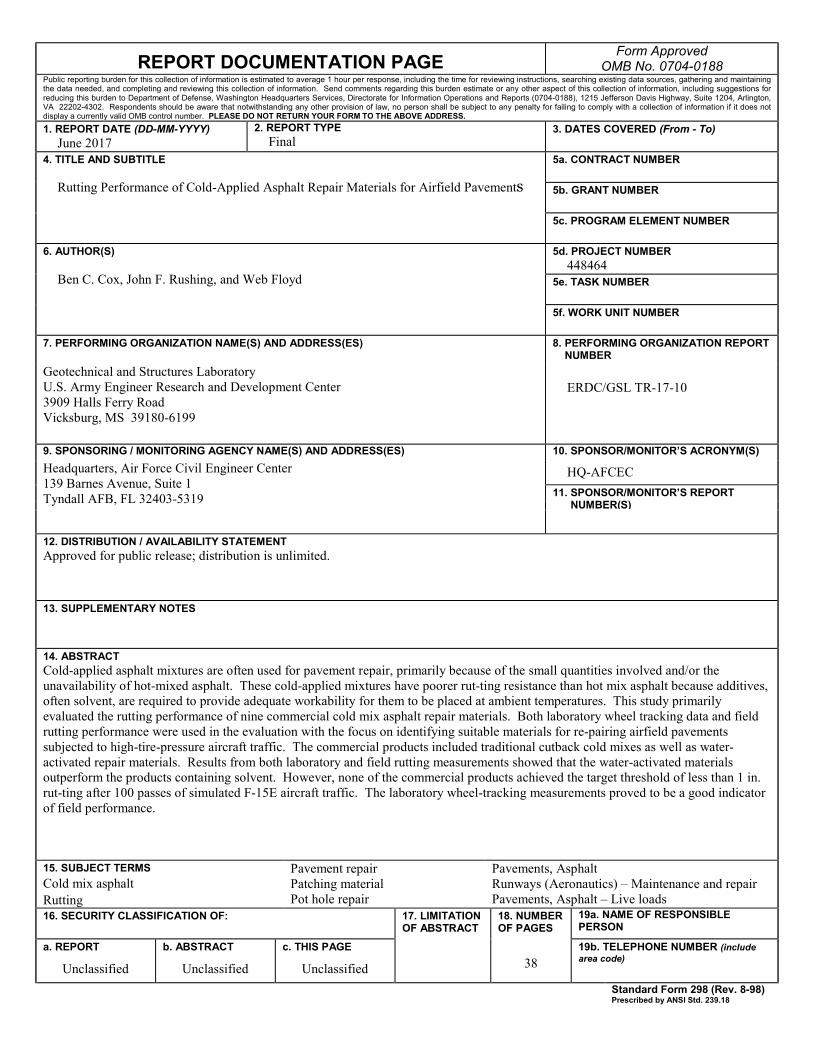
14. ABSTRACT Cold-applied asphalt mixtures are often used for pavement repair, primarily because of the small quantities involved and/or the unavailability of hot-mixed asphalt. These cold-applied mixtures have poorer rut-ting resistance than hot mix asphalt because additives, often solvent, are required to provide adequate workability for them to be placed at ambient temperatures. This study primarily evaluated the rutting performance of nine commercial cold mix asphalt repair materials. Both laboratory wheel tracking data and field rutting performance were used in the evaluation with the focus on identifying suitable materials for re-pairing airfield pavements subjected to high-tire-pressure aircraft traffic. The commercial products included traditional cutback cold mixes as well as water-activated repair materials. Results from both laboratory and field rutting measurements showed that the water-activated materials outperform the products containing solvent. However, none of the commercial products achieved the target threshold of less than 1 in. rut-ting after 100 passes of simulated F-15E aircraft traffic. The laboratory wheel-tracking measurements proved to be a good indicator of field performance.
15. SUBJECT TERMS Cold mix asphalt Rutting
Pavement repair Patching material Pot hole repair
Pavements, Asphalt Runways (Aeronautics) – Maintenance and repair Pavements, Asphalt – Live loads
16. SECURITY CLASSIFICATION OF: 17. LIMITATION OF ABSTRACT
18. NUMBER OF PAGES
19a. NAME OF RESPONSIBLE PERSON
a. REPORT
Unclassified
b. ABSTRACT
Unclassified
c. THIS PAGE
Unclassified 38 19b. TELEPHONE NUMBER (include area code)
Standard Form 298 (Rev. 8-98) Prescribed by ANSI Std. 239.18