benchmark 5: infrastructure financing feasibility...
TRANSCRIPT

Salton Sea Funding and Feasibility Action Plan
Benchmark 5: Infrastructure Financing Feasibility Analysis Volume 2: Appendix, May 2016
Prepared by:
Prepared for:

Benchmark 5: Infrastructure Financing Feasibility AnalysisVolume 2: Appendices
Table of ContentsMay 13, 2016
Appendix Title Page
1 Financial Feasibility Analysis 1
2.1 Tourist Demand Forecast Salton Sea Lake - North 24
2.2 Tourist Demand Forecast Salton Sea Lake - South 74
2.3 TOT & Sales Tax Estimates - Salton Sea Project 106
3 Salton Sea Recreation Opportunities 133
4Market Study and Land Use Analysis to Assess the Real Estate Impact of Restoring the Salton Sea to a Viable Recreational Resource 158
May 2016

BENCHMARK 5:
INFRASTRUCTURE FINANCING
FEASIBILITY ANALYSIS
Appendix 1: Financial Feasibility Analysis
Page 1 of 332

APPENDIX 1: FINANCIAL FEASIBILITY
ANALYSIS
FOR
MAY 12, 2016
Prepared By:
Page 2 of 332

Salton Sea AuthorityFinancial Feasibility Analysis
Table of ContentsMay 13, 2016
Chart/ Exhibit Title Page
1 Total Cumulative IFD Tax Increment (50 Year Buildout) 4
2 Total Cumulative Funding Sources 5
3 IFD Bond Interest Rate, TOT and Sales Tax Summary of Tradeoffs 6
A Salton Sea IFD Sources and Uses Summary 7
B Gap Model 5 Year Summary 8
C Gap Model 9
D Bond Sizing - Riverside & Imperial 10
E - Riv Projected Infrastructure Finance District Revenues - Riverside 13
E - Imp Projected Infrastructure Finance District Revenues - Imperial 14
F New Additions to Value 15
G New Construction - Residential 16
H New Construction - Non Residential 17
I - Riv TCG Development Projections - Riverside 18
I - Imp TCG Development Projections - Imperial 19
J Calculation of Sales Tax Revenues 20
K Calculation of Transient Occupancy Tax Revenues 21
L CFD Capacity Analysis 22
M IRFD vs. EIFD Memorandum 23
\\192.168.1.12\data files\RCL\SSA\TI Model\Financial Feasibility Analysis 2016-05-13 - v1.0

Chart 1Salton Sea AuthorityTotal Cumulative IFD Tax Increment (50 Year Buildout)Scenario 1A (3.0% Loan Interest; 50.0% TI to IFD)May 13, 2016
Cumulative Imperial TI $418.9
$‐
$200
$400
$600
$800
$1,000
$1,200
1 3 5 7 9 11 13 15 17 19 21 23 25 27 29 31 33 35 37 39 41 43 45 47 49
Landside Development(Years)
Imperial TI
Riverside TI
$ in Millions
Cumulative Riverside TI $702.2
Cumulative Riverside TI $702.2
Cumulative Riverside TI $702.2
Cumulative Riverside TI $702.2
• Assumes 50.0% Available IFD Allocation
• See Notes and Supporting Exhibits
\\192.168.1.12\data files\RCL\SSA\TI Model\Financial Feasibility Analysis 2016-05-13 - v1.0 Page 4 of 332

Chart 2Salton Sea AuthorityTotal Cumulative Funding Sources Scenario 1A (3.0% Loan Interest; 50.0% TI to IFD)May 13, 2016
$0
$500
$1,000
$1,500
$2,000
$2,500
0 1 3 5 7 9 11 13 15 17 19 21 23 25 27 29 31 33 35 37 39 41 43 45 47 49 51
Bond Sale TOT Revenue Sales Tax Pay Go
$ in Millions
Landside Development
• Assumes 50.0% Available IFD Allocation
• See Notes and Supporting Exhibits
\\192.168.1.12\data files\RCL\SSA\TI Model\Financial Feasibility Analysis 2016-05-13 - v1.0 Page 5 of 332

Chart 3Salton Sea AuthoritySalton Sea IFD Bond Interest Rate, TOT and Sales Tax Summary of TradeoffsScenario 1A (3.0% Loan Interest; 50.0% TI to IFD)May 13, 2016
AssumptionsA. Value Additions $21.6 BillionB. Residential Units 73,750 C. Annual Residential Absorption:
Riverside County 1,035 Imperial County 440
Impact of Adjusted TOT, Sales Tax, and IFD bond Interest Rate($ Millions)
% of TOT and Sales Tax Total Revenue SourcesAvailable for Seaside IFD Bond Interest Rate
Improvements 7% 6% 5%
100% $ 2,161.7 $ 2,224.2 $ 2,298.3 75% $ 1,833.3 $ 1,895.8 $ 1,969.9 50% $ 1,504.8 $ 1,567.3 $ 1,641.5 25% $ 1,176.4 $ 1,238.9 $ 1,313.0
\\192.168.1.12\data files\RCL\SSA\TI Model\Financial Feasibility Analysis 2016-05-13 - v1.0 Page 6 of 332

Exhibit ASalton Sea AuthoritySalton Sea IFD Sources and Uses SummaryScenario 1A (3.0% Loan Interest; 50.0% TI to IFD)May 13, 2016
($ Millions)Scenario Ref 1A 1B 2A 2B
IFD % Available 2.2.1 50% 50% 25% 25%Interest Rate-State/Fed/Other 2.4 3% 0% 3% 0%
Sources: IFD Net Bond Proceeds 2.2.2 570.05$ 570.05$ 276.21$ 276.21$
Pay Go 2.2.3 340.41$ 340.41$ 170.20$ 170.20$ TOT Revenues 2.2.4 920.38$ 920.38$ 920.38$ 920.38$ Sales Tax Revenue 2.2.5 393.37$ 393.37$ 393.37$ 393.37$
Total Sources 2,224.21$ 2,224.21$ 1,760.17$ 1,760.17$ Uses:
Seaside Improvements 2.4 904.45$ 2,221.72$ 715.79$ 1,757.67$ Interest 2.4 1,317.26$ -$ 1,041.88$ -$
Total Uses 2,221.71$ 2,221.72$ 1,757.67$ 1,757.67$
Excess/(Deficit) [Cashflow After Debt] 2.50$ 2.50$ 2.50$ 2.50$
\\192.168.1.12\data files\RCL\SSA\TI Model\Financial Feasibility Analysis 2016-05-13 - v1.0 Page 7 of 332
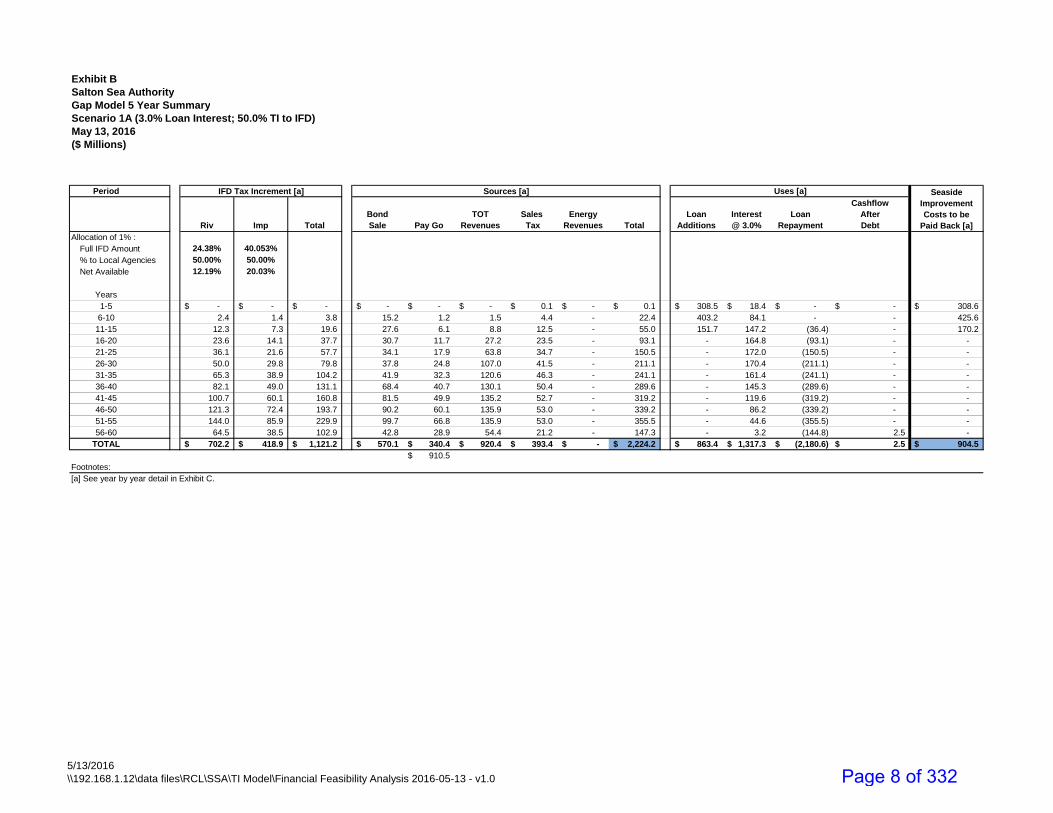
Exhibit B Salton Sea AuthorityGap Model 5 Year SummaryScenario 1A (3.0% Loan Interest; 50.0% TI to IFD)May 13, 2016($ Millions)
Period IFD Tax Increment [a] Sources [a] Uses [a]
Riv Imp TotalBond Sale Pay Go
TOT Revenues
Sales Tax
Energy Revenues Total
Loan Additions
Interest @ 3.0%
Loan Repayment
CashflowAfterDebt
Allocation of 1% :Full IFD Amount 24.38% 40.053%
% to Local Agencies 50.00% 50.00%
Net Available 12.19% 20.03%
Years1-5 -$ -$ -$ -$ -$ -$ 0.1$ -$ 0.1$ 308.5$ 18.4$ -$ -$ 308.6$ 6-10 2.4 1.4 3.8 15.2 1.2 1.5 4.4 - 22.4 403.2 84.1 - - 425.6
11-15 12.3 7.3 19.6 27.6 6.1 8.8 12.5 - 55.0 151.7 147.2 (36.4) - 170.2 16-20 23.6 14.1 37.7 30.7 11.7 27.2 23.5 - 93.1 - 164.8 (93.1) - - 21-25 36.1 21.6 57.7 34.1 17.9 63.8 34.7 - 150.5 - 172.0 (150.5) - - 26-30 50.0 29.8 79.8 37.8 24.8 107.0 41.5 - 211.1 - 170.4 (211.1) - - 31-35 65.3 38.9 104.2 41.9 32.3 120.6 46.3 - 241.1 - 161.4 (241.1) - - 36-40 82.1 49.0 131.1 68.4 40.7 130.1 50.4 - 289.6 - 145.3 (289.6) - - 41-45 100.7 60.1 160.8 81.5 49.9 135.2 52.7 - 319.2 - 119.6 (319.2) - - 46-50 121.3 72.4 193.7 90.2 60.1 135.9 53.0 - 339.2 - 86.2 (339.2) - - 51-55 144.0 85.9 229.9 99.7 66.8 135.9 53.0 - 355.5 - 44.6 (355.5) - - 56-60 64.5 38.5 102.9 42.8 28.9 54.4 21.2 - 147.3 - 3.2 (144.8) 2.5 -
TOTAL 702.2$ 418.9$ 1,121.2$ 570.1$ 340.4$ 920.4$ 393.4$ -$ 2,224.2$ 863.4$ 1,317.3$ (2,180.6)$ 2.5$ 904.5$ 910.5$
Footnotes:[a] See year by year detail in Exhibit C.
Seaside Improvement Costs to be
Paid Back [a]
5/13/2016\\192.168.1.12\data files\RCL\SSA\TI Model\Financial Feasibility Analysis 2016-05-13 - v1.0 Page 8 of 332
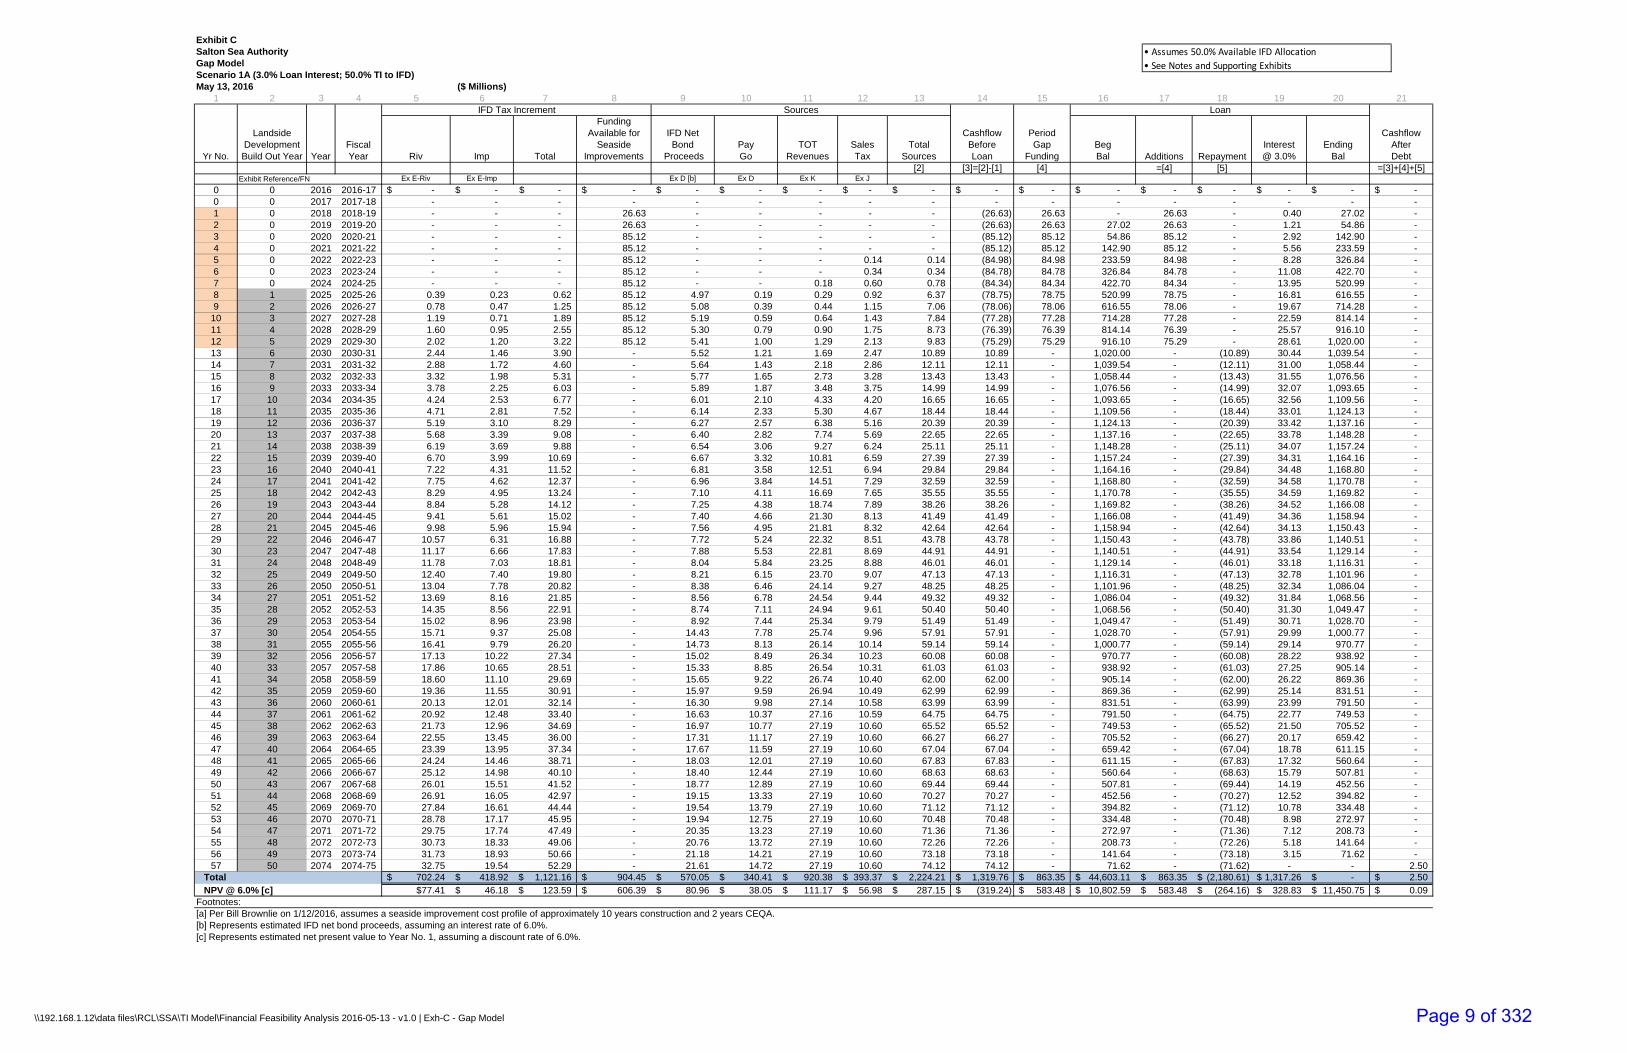
Exhibit C Salton Sea AuthorityGap ModelScenario 1A (3.0% Loan Interest; 50.0% TI to IFD)May 13, 2016 ($ Millions)
1 2 3 4 5 6 7 8 9 10 11 12 13 14 15 16 17 18 19 20 21IFD Tax Increment Sources Loan
Yr No.
Landside DevelopmentBuild Out Year Year
Fiscal Year Riv Imp Total
Funding Available for
Seaside Improvements
IFD Net Bond
ProceedsPay Go
TOT Revenues
Sales Tax
TotalSources
CashflowBeforeLoan
PeriodGap
FundingBeg Bal Additions Repayment
Interest @ 3.0%
Ending Bal
CashflowAfterDebt
[2] [3]=[2]-[1] [4] =[4] [5] =[3]+[4]+[5]Exhibit Reference/FN Ex E-Riv Ex E-Imp Ex D [b] Ex D Ex K Ex J
0 0 2016 2016-17 -$ -$ -$ -$ -$ -$ -$ -$ -$ -$ -$ -$ -$ -$ -$ -$ -$ 0 0 2017 2017-18 - - - - - - - - - - - - - - - - - 1 0 2018 2018-19 - - - 26.63 - - - - - (26.63) 26.63 - 26.63 - 0.40 27.02 - 2 0 2019 2019-20 - - - 26.63 - - - - - (26.63) 26.63 27.02 26.63 - 1.21 54.86 - 3 0 2020 2020-21 - - - 85.12 - - - - - (85.12) 85.12 54.86 85.12 - 2.92 142.90 - 4 0 2021 2021-22 - - - 85.12 - - - - - (85.12) 85.12 142.90 85.12 - 5.56 233.59 - 5 0 2022 2022-23 - - - 85.12 - - - 0.14 0.14 (84.98) 84.98 233.59 84.98 - 8.28 326.84 - 6 0 2023 2023-24 - - - 85.12 - - - 0.34 0.34 (84.78) 84.78 326.84 84.78 - 11.08 422.70 - 7 0 2024 2024-25 - - - 85.12 - - 0.18 0.60 0.78 (84.34) 84.34 422.70 84.34 - 13.95 520.99 - 8 1 2025 2025-26 0.39 0.23 0.62 85.12 4.97 0.19 0.29 0.92 6.37 (78.75) 78.75 520.99 78.75 - 16.81 616.55 - 9 2 2026 2026-27 0.78 0.47 1.25 85.12 5.08 0.39 0.44 1.15 7.06 (78.06) 78.06 616.55 78.06 - 19.67 714.28 -
10 3 2027 2027-28 1.19 0.71 1.89 85.12 5.19 0.59 0.64 1.43 7.84 (77.28) 77.28 714.28 77.28 - 22.59 814.14 - 11 4 2028 2028-29 1.60 0.95 2.55 85.12 5.30 0.79 0.90 1.75 8.73 (76.39) 76.39 814.14 76.39 - 25.57 916.10 - 12 5 2029 2029-30 2.02 1.20 3.22 85.12 5.41 1.00 1.29 2.13 9.83 (75.29) 75.29 916.10 75.29 - 28.61 1,020.00 - 13 6 2030 2030-31 2.44 1.46 3.90 - 5.52 1.21 1.69 2.47 10.89 10.89 - 1,020.00 - (10.89) 30.44 1,039.54 - 14 7 2031 2031-32 2.88 1.72 4.60 - 5.64 1.43 2.18 2.86 12.11 12.11 - 1,039.54 - (12.11) 31.00 1,058.44 - 15 8 2032 2032-33 3.32 1.98 5.31 - 5.77 1.65 2.73 3.28 13.43 13.43 - 1,058.44 - (13.43) 31.55 1,076.56 - 16 9 2033 2033-34 3.78 2.25 6.03 - 5.89 1.87 3.48 3.75 14.99 14.99 - 1,076.56 - (14.99) 32.07 1,093.65 - 17 10 2034 2034-35 4.24 2.53 6.77 - 6.01 2.10 4.33 4.20 16.65 16.65 - 1,093.65 - (16.65) 32.56 1,109.56 - 18 11 2035 2035-36 4.71 2.81 7.52 - 6.14 2.33 5.30 4.67 18.44 18.44 - 1,109.56 - (18.44) 33.01 1,124.13 - 19 12 2036 2036-37 5.19 3.10 8.29 - 6.27 2.57 6.38 5.16 20.39 20.39 - 1,124.13 - (20.39) 33.42 1,137.16 - 20 13 2037 2037-38 5.68 3.39 9.08 - 6.40 2.82 7.74 5.69 22.65 22.65 - 1,137.16 - (22.65) 33.78 1,148.28 - 21 14 2038 2038-39 6.19 3.69 9.88 - 6.54 3.06 9.27 6.24 25.11 25.11 - 1,148.28 - (25.11) 34.07 1,157.24 - 22 15 2039 2039-40 6.70 3.99 10.69 - 6.67 3.32 10.81 6.59 27.39 27.39 - 1,157.24 - (27.39) 34.31 1,164.16 - 23 16 2040 2040-41 7.22 4.31 11.52 - 6.81 3.58 12.51 6.94 29.84 29.84 - 1,164.16 - (29.84) 34.48 1,168.80 - 24 17 2041 2041-42 7.75 4.62 12.37 - 6.96 3.84 14.51 7.29 32.59 32.59 - 1,168.80 - (32.59) 34.58 1,170.78 - 25 18 2042 2042-43 8.29 4.95 13.24 - 7.10 4.11 16.69 7.65 35.55 35.55 - 1,170.78 - (35.55) 34.59 1,169.82 - 26 19 2043 2043-44 8.84 5.28 14.12 - 7.25 4.38 18.74 7.89 38.26 38.26 - 1,169.82 - (38.26) 34.52 1,166.08 - 27 20 2044 2044-45 9.41 5.61 15.02 - 7.40 4.66 21.30 8.13 41.49 41.49 - 1,166.08 - (41.49) 34.36 1,158.94 - 28 21 2045 2045-46 9.98 5.96 15.94 - 7.56 4.95 21.81 8.32 42.64 42.64 - 1,158.94 - (42.64) 34.13 1,150.43 - 29 22 2046 2046-47 10.57 6.31 16.88 - 7.72 5.24 22.32 8.51 43.78 43.78 - 1,150.43 - (43.78) 33.86 1,140.51 - 30 23 2047 2047-48 11.17 6.66 17.83 - 7.88 5.53 22.81 8.69 44.91 44.91 - 1,140.51 - (44.91) 33.54 1,129.14 - 31 24 2048 2048-49 11.78 7.03 18.81 - 8.04 5.84 23.25 8.88 46.01 46.01 - 1,129.14 - (46.01) 33.18 1,116.31 - 32 25 2049 2049-50 12.40 7.40 19.80 - 8.21 6.15 23.70 9.07 47.13 47.13 - 1,116.31 - (47.13) 32.78 1,101.96 - 33 26 2050 2050-51 13.04 7.78 20.82 - 8.38 6.46 24.14 9.27 48.25 48.25 - 1,101.96 - (48.25) 32.34 1,086.04 - 34 27 2051 2051-52 13.69 8.16 21.85 - 8.56 6.78 24.54 9.44 49.32 49.32 - 1,086.04 - (49.32) 31.84 1,068.56 - 35 28 2052 2052-53 14.35 8.56 22.91 - 8.74 7.11 24.94 9.61 50.40 50.40 - 1,068.56 - (50.40) 31.30 1,049.47 - 36 29 2053 2053-54 15.02 8.96 23.98 - 8.92 7.44 25.34 9.79 51.49 51.49 - 1,049.47 - (51.49) 30.71 1,028.70 - 37 30 2054 2054-55 15.71 9.37 25.08 - 14.43 7.78 25.74 9.96 57.91 57.91 - 1,028.70 - (57.91) 29.99 1,000.77 - 38 31 2055 2055-56 16.41 9.79 26.20 - 14.73 8.13 26.14 10.14 59.14 59.14 - 1,000.77 - (59.14) 29.14 970.77 - 39 32 2056 2056-57 17.13 10.22 27.34 - 15.02 8.49 26.34 10.23 60.08 60.08 - 970.77 - (60.08) 28.22 938.92 - 40 33 2057 2057-58 17.86 10.65 28.51 - 15.33 8.85 26.54 10.31 61.03 61.03 - 938.92 - (61.03) 27.25 905.14 - 41 34 2058 2058-59 18.60 11.10 29.69 - 15.65 9.22 26.74 10.40 62.00 62.00 - 905.14 - (62.00) 26.22 869.36 - 42 35 2059 2059-60 19.36 11.55 30.91 - 15.97 9.59 26.94 10.49 62.99 62.99 - 869.36 - (62.99) 25.14 831.51 - 43 36 2060 2060-61 20.13 12.01 32.14 - 16.30 9.98 27.14 10.58 63.99 63.99 - 831.51 - (63.99) 23.99 791.50 - 44 37 2061 2061-62 20.92 12.48 33.40 - 16.63 10.37 27.16 10.59 64.75 64.75 - 791.50 - (64.75) 22.77 749.53 - 45 38 2062 2062-63 21.73 12.96 34.69 - 16.97 10.77 27.19 10.60 65.52 65.52 - 749.53 - (65.52) 21.50 705.52 - 46 39 2063 2063-64 22.55 13.45 36.00 - 17.31 11.17 27.19 10.60 66.27 66.27 - 705.52 - (66.27) 20.17 659.42 - 47 40 2064 2064-65 23.39 13.95 37.34 - 17.67 11.59 27.19 10.60 67.04 67.04 - 659.42 - (67.04) 18.78 611.15 - 48 41 2065 2065-66 24.24 14.46 38.71 - 18.03 12.01 27.19 10.60 67.83 67.83 - 611.15 - (67.83) 17.32 560.64 - 49 42 2066 2066-67 25.12 14.98 40.10 - 18.40 12.44 27.19 10.60 68.63 68.63 - 560.64 - (68.63) 15.79 507.81 - 50 43 2067 2067-68 26.01 15.51 41.52 - 18.77 12.89 27.19 10.60 69.44 69.44 - 507.81 - (69.44) 14.19 452.56 - 51 44 2068 2068-69 26.91 16.05 42.97 - 19.15 13.33 27.19 10.60 70.27 70.27 - 452.56 - (70.27) 12.52 394.82 - 52 45 2069 2069-70 27.84 16.61 44.44 - 19.54 13.79 27.19 10.60 71.12 71.12 - 394.82 - (71.12) 10.78 334.48 - 53 46 2070 2070-71 28.78 17.17 45.95 - 19.94 12.75 27.19 10.60 70.48 70.48 - 334.48 - (70.48) 8.98 272.97 - 54 47 2071 2071-72 29.75 17.74 47.49 - 20.35 13.23 27.19 10.60 71.36 71.36 - 272.97 - (71.36) 7.12 208.73 - 55 48 2072 2072-73 30.73 18.33 49.06 - 20.76 13.72 27.19 10.60 72.26 72.26 - 208.73 - (72.26) 5.18 141.64 - 56 49 2073 2073-74 31.73 18.93 50.66 - 21.18 14.21 27.19 10.60 73.18 73.18 - 141.64 - (73.18) 3.15 71.62 - 57 50 2074 2074-75 32.75 19.54 52.29 - 21.61 14.72 27.19 10.60 74.12 74.12 - 71.62 - (71.62) - - 2.50
Total 702.24$ 418.92$ 1,121.16$ 904.45$ 570.05$ 340.41$ 920.38$ 393.37$ 2,224.21$ 1,319.76$ 863.35$ 44,603.11$ 863.35$ (2,180.61)$ 1,317.26$ -$ 2.50$ NPV @ 6.0% [c] $77.41 46.18$ 123.59$ 606.39$ 80.96$ 38.05$ 111.17$ 56.98$ 287.15$ (319.24)$ 583.48$ 10,802.59$ 583.48$ (264.16)$ 328.83$ 11,450.75$ 0.09$
Footnotes:[a] Per Bill Brownlie on 1/12/2016, assumes a seaside improvement cost profile of approximately 10 years construction and 2 years CEQA.[b] Represents estimated IFD net bond proceeds, assuming an interest rate of 6.0%.[c] Represents estimated net present value to Year No. 1, assuming a discount rate of 6.0%.
• Assumes 50.0% Available IFD Allocation
• See Notes and Supporting Exhibits
\\192.168.1.12\data files\RCL\SSA\TI Model\Financial Feasibility Analysis 2016-05-13 - v1.0 | Exh-C - Gap Model Page 9 of 332

Exhibit D - Riverside & ImperialSalton Sea AuthorityBond Sizing - Riverside & ImperialScenario 1A (3.0% Loan Interest; 50.0% TI to IFD)May 13, 2016Bond Sale Date 11/1/XXXX 2025 2026 2027 2028 2029 2030 2031 2032 2033 2034 2035 2036 2037 2038 2039 2040 2041 2042 2043
Total Series 1 Series 2 Series 3 Series 4 Series 5 Series 6 Series 7 Series 8 Series 9 Series 10 Series 11 Series 12 Series 13 Series 14 Series 15 Series 16 Series 17 Series 18 Series 19
Final Year of IFD [a] 2075 2075 2076 2077 2078 2079 2080 2081 2082 2083 2084 2085 2086 2087 2088 2089 2090 2091 2092
Final Bond Year 2054 2055 2056 2057 2058 2059 2060 2061 2062 2063 2064 2065 2066 2067 2068 2069 2070 2071 2072Bond Amortization Term (Years) 30 30 30 30 30 30 30 30 30 30 30 30 30 30 30 30 30 30 30 30Bond Interest Rate [b] 6.00% 6.00% 6.00% 6.00% 6.00% 6.00% 6.00% 6.00% 6.00% 6.00% 6.00% 6.00% 6.00% 6.00% 6.00% 6.00% 6.00% 6.00% 6.00%Revenue 68,227,379$ 618,210$ 630,575$ 643,186$ 656,050$ 669,171$ 682,554$ 696,205$ 710,129$ 724,332$ 738,819$ 753,595$ 768,667$ 784,040$ 799,721$ 815,715$ 832,030$ 848,670$ 865,644$ 882,957$ Net Revenue Available for Debt Service 68,227,379$ 618,210$ 630,575$ 643,186$ 656,050$ 669,171$ 682,554$ 696,205$ 710,129$ 724,332$ 738,819$ 753,595$ 768,667$ 784,040$ 799,721$ 815,715$ 832,030$ 848,670$ 865,644$ 882,957$ Coverage [c] 145% 145.00% 145.00% 145.00% 145.00% 145.00% 145.00% 145.00% 145.00% 145.00% 145.00% 145.00% 145.00% 145.00% 145.00% 145.00% 145.00% 145.00% 145.00% 145.00%Debt Service 47,053,365$ 426,352$ 434,879$ 443,577$ 452,448$ 461,497$ 470,727$ 480,142$ 489,744$ 499,539$ 509,530$ 519,721$ 530,115$ 540,717$ 551,532$ 562,562$ 573,814$ 585,290$ 596,996$ 608,936$
Bond Amount 647,555,000$ 5,865,000$ 5,985,000$ 6,105,000$ 6,225,000$ 6,350,000$ 6,475,000$ 6,605,000$ 6,740,000$ 6,875,000$ 7,010,000$ 7,150,000$ 7,295,000$ 7,440,000$ 7,590,000$ 7,740,000$ 7,895,000$ 8,055,000$ 8,215,000$ 8,380,000$ Reserve Fund 47,053,365 426,352 434,879 443,577 452,448 461,497 470,727 480,142 489,744 499,539 509,530 519,721 530,115 540,717 551,532 562,562 573,814 585,290 596,996 608,936 Capitalized Interest (0 months) - - - - - - - - - - - - - - - - - - - - Underwriter Discount @ 2.00% [d] 12,951,100 117,300 119,700 122,100 124,500 127,000 129,500 132,100 134,800 137,500 140,200 143,000 145,900 148,800 151,800 154,800 157,900 161,100 164,300 167,600 Bond Insurance Premium @ 0% - - - - - - - - - - - - - - - - - - - - Cost of Issuance @ $350,000 [d] 17,500,000 350,000 350,000 350,000 350,000 350,000 350,000 350,000 350,000 350,000 350,000 350,000 350,000 350,000 350,000 350,000 350,000 350,000 350,000 350,000
Net Bond Proceeds 570,050,535$ 4,971,348$ 5,080,421$ 5,189,323$ 5,298,052$ 5,411,503$ 5,524,773$ 5,642,758$ 5,765,456$ 5,887,961$ 6,010,270$ 6,137,279$ 6,268,985$ 6,400,483$ 6,536,668$ 6,672,638$ 6,813,286$ 6,958,610$ 7,103,704$ 7,253,464$ (1)
Build Net Revenues Net Revenues Net Revenues
Out Fiscal for Riv IFD for Imp IFD for IFD Revenue Pledged to Debt Service [f]
Yr [a] Year Year (Ex E-Riverside) (Ex E-Imperial) Total Total Series 1 Series 2 Series 3 Series 4 Series 5 Series 6 Series 7 Series 8 Series 9 Series 10 Series 11 Series 12 Series 13 Series 14 Series 15 Series 16 Series 17 Series 18 Series 19
1 2025 2025-26 387,218$ 230,992$ 618,210$ 618,210$ 618,210$ 2 2026 2026-27 782,181 466,604 1,248,785 1,248,785 618,210 630,575 3 2027 2027-28 1,185,043 706,928 1,891,971 1,891,971 618,210 630,575 643,186 4 2028 2028-29 1,595,962 952,058 2,548,021 2,548,021 618,210 630,575 643,186 656,050 5 2029 2029-30 2,015,100 1,202,092 3,217,192 3,217,192 618,210 630,575 643,186 656,050 669,171 6 2030 2030-31 2,442,621 1,457,125 3,899,746 3,899,746 618,210 630,575 643,186 656,050 669,171 682,554 7 2031 2031-32 2,878,691 1,717,260 4,595,951 4,595,951 618,210 630,575 643,186 656,050 669,171 682,554 696,205 8 2032 2032-33 3,323,484 1,982,597 5,306,081 5,306,081 618,210 630,575 643,186 656,050 669,171 682,554 696,205 710,129 9 2033 2033-34 3,777,172 2,253,241 6,030,413 6,030,413 618,210 630,575 643,186 656,050 669,171 682,554 696,205 710,129 724,332
10 2034 2034-35 4,239,934 2,529,298 6,769,231 6,769,231 618,210 630,575 643,186 656,050 669,171 682,554 696,205 710,129 724,332 738,819 11 2035 2035-36 4,711,951 2,810,876 7,522,826 7,522,826 618,210 630,575 643,186 656,050 669,171 682,554 696,205 710,129 724,332 738,819 753,595 12 2036 2036-37 5,193,408 3,098,085 8,291,493 8,291,493 618,210 630,575 643,186 656,050 669,171 682,554 696,205 710,129 724,332 738,819 753,595 768,667 13 2037 2037-38 5,684,495 3,391,039 9,075,533 9,075,533 618,210 630,575 643,186 656,050 669,171 682,554 696,205 710,129 724,332 738,819 753,595 768,667 784,040 14 2038 2038-39 6,185,403 3,689,852 9,875,255 9,875,255 618,210 630,575 643,186 656,050 669,171 682,554 696,205 710,129 724,332 738,819 753,595 768,667 784,040 799,721 15 2039 2039-40 6,696,329 3,994,641 10,690,970 10,690,970 618,210 630,575 643,186 656,050 669,171 682,554 696,205 710,129 724,332 738,819 753,595 768,667 784,040 799,721 815,715 16 2040 2040-41 7,217,474 4,305,525 11,523,000 11,523,000 618,210 630,575 643,186 656,050 669,171 682,554 696,205 710,129 724,332 738,819 753,595 768,667 784,040 799,721 815,715 832,030 17 2041 2041-42 7,749,042 4,622,628 12,371,670 12,371,670 618,210 630,575 643,186 656,050 669,171 682,554 696,205 710,129 724,332 738,819 753,595 768,667 784,040 799,721 815,715 832,030 848,670 18 2042 2042-43 8,291,242 4,946,072 13,237,314 13,237,314 618,210 630,575 643,186 656,050 669,171 682,554 696,205 710,129 724,332 738,819 753,595 768,667 784,040 799,721 815,715 832,030 848,670 865,644 19 2043 2043-44 8,844,285 5,275,986 14,120,271 14,120,271 618,210 630,575 643,186 656,050 669,171 682,554 696,205 710,129 724,332 738,819 753,595 768,667 784,040 799,721 815,715 832,030 848,670 865,644 882,957 20 2044 2044-45 9,408,389 5,612,498 15,020,886 15,020,886 618,210 630,575 643,186 656,050 669,171 682,554 696,205 710,129 724,332 738,819 753,595 768,667 784,040 799,721 815,715 832,030 848,670 865,644 882,957 21 2045 2045-46 9,983,775 5,955,740 15,939,515 15,939,515 618,210 630,575 643,186 656,050 669,171 682,554 696,205 710,129 724,332 738,819 753,595 768,667 784,040 799,721 815,715 832,030 848,670 865,644 882,957 22 2046 2046-47 10,570,669 6,305,846 16,876,515 16,876,515 618,210 630,575 643,186 656,050 669,171 682,554 696,205 710,129 724,332 738,819 753,595 768,667 784,040 799,721 815,715 832,030 848,670 865,644 882,957 23 2047 2047-48 11,169,301 6,662,955 17,832,256 17,832,256 618,210 630,575 643,186 656,050 669,171 682,554 696,205 710,129 724,332 738,819 753,595 768,667 784,040 799,721 815,715 832,030 848,670 865,644 882,957 24 2048 2048-49 11,779,905 7,027,206 18,807,111 18,807,111 618,210 630,575 643,186 656,050 669,171 682,554 696,205 710,129 724,332 738,819 753,595 768,667 784,040 799,721 815,715 832,030 848,670 865,644 882,957 25 2049 2049-50 12,402,722 7,398,742 19,801,464 19,801,464 618,210 630,575 643,186 656,050 669,171 682,554 696,205 710,129 724,332 738,819 753,595 768,667 784,040 799,721 815,715 832,030 848,670 865,644 882,957 26 2050 2050-51 13,037,995 7,777,709 20,815,704 20,815,704 618,210 630,575 643,186 656,050 669,171 682,554 696,205 710,129 724,332 738,819 753,595 768,667 784,040 799,721 815,715 832,030 848,670 865,644 882,957 27 2051 2051-52 13,685,973 8,164,255 21,850,228 21,850,228 618,210 630,575 643,186 656,050 669,171 682,554 696,205 710,129 724,332 738,819 753,595 768,667 784,040 799,721 815,715 832,030 848,670 865,644 882,957 28 2052 2052-53 14,346,911 8,558,532 22,905,443 22,905,443 618,210 630,575 643,186 656,050 669,171 682,554 696,205 710,129 724,332 738,819 753,595 768,667 784,040 799,721 815,715 832,030 848,670 865,644 882,957 29 2053 2053-54 15,021,067 8,960,695 23,981,762 23,981,762 618,210 630,575 643,186 656,050 669,171 682,554 696,205 710,129 724,332 738,819 753,595 768,667 784,040 799,721 815,715 832,030 848,670 865,644 882,957 30 2054 2054-55 15,708,707 9,370,901 25,079,608 25,079,608 - 630,575 643,186 656,050 669,171 682,554 696,205 710,129 724,332 738,819 753,595 768,667 784,040 799,721 815,715 832,030 848,670 865,644 882,957 31 2055 2055-56 16,410,100 9,789,311 26,199,411 26,199,411 - - 643,186 656,050 669,171 682,554 696,205 710,129 724,332 738,819 753,595 768,667 784,040 799,721 815,715 832,030 848,670 865,644 882,957 32 2056 2056-57 17,125,520 10,216,089 27,341,609 27,341,609 - - - 656,050 669,171 682,554 696,205 710,129 724,332 738,819 753,595 768,667 784,040 799,721 815,715 832,030 848,670 865,644 882,957 33 2057 2057-58 17,855,249 10,651,403 28,506,652 28,506,652 - - - - 669,171 682,554 696,205 710,129 724,332 738,819 753,595 768,667 784,040 799,721 815,715 832,030 848,670 865,644 882,957 34 2058 2058-59 18,599,572 11,095,423 29,694,995 29,694,995 - - - - - 682,554 696,205 710,129 724,332 738,819 753,595 768,667 784,040 799,721 815,715 832,030 848,670 865,644 882,957 35 2059 2059-60 19,358,782 11,548,323 30,907,105 30,907,105 - - - - - - 696,205 710,129 724,332 738,819 753,595 768,667 784,040 799,721 815,715 832,030 848,670 865,644 882,957 36 2060 2060-61 20,133,176 12,010,282 32,143,458 32,143,458 - - - - - - - 710,129 724,332 738,819 753,595 768,667 784,040 799,721 815,715 832,030 848,670 865,644 882,957 37 2061 2061-62 20,923,058 12,481,479 33,404,537 33,404,537 - - - - - - - - 724,332 738,819 753,595 768,667 784,040 799,721 815,715 832,030 848,670 865,644 882,957 38 2062 2062-63 21,728,738 12,962,101 34,690,839 34,690,839 - - - - - - - - - 738,819 753,595 768,667 784,040 799,721 815,715 832,030 848,670 865,644 882,957 39 2063 2063-64 22,550,531 13,452,335 36,002,866 36,002,866 - - - - - - - - - - 753,595 768,667 784,040 799,721 815,715 832,030 848,670 865,644 882,957 40 2064 2064-65 23,388,760 13,952,374 37,341,133 37,341,133 - - - - - - - - - - - 768,667 784,040 799,721 815,715 832,030 848,670 865,644 882,957 41 2065 2065-66 24,243,753 14,462,413 38,706,167 38,706,167 - - - - - - - - - - - - 784,040 799,721 815,715 832,030 848,670 865,644 882,957 42 2066 2066-67 25,115,847 14,982,653 40,098,500 40,098,500 - - - - - - - - - - - - - 799,721 815,715 832,030 848,670 865,644 882,957 43 2067 2067-68 26,005,382 15,513,298 41,518,681 41,518,681 - - - - - - - - - - - - - - 815,715 832,030 848,670 865,644 882,957 44 2068 2068-69 26,912,708 16,054,556 42,967,265 42,967,265 - - - - - - - - - - - - - - - 832,030 848,670 865,644 882,957 45 2069 2069-70 27,838,181 16,606,640 44,444,820 44,444,820 - - - - - - - - - - - - - - - - 848,670 865,644 882,957 46 2070 2070-71 28,782,163 17,169,764 45,951,927 45,951,927 - - - - - - - - - - - - - - - - - 865,644 882,957 47 2071 2071-72 29,745,024 17,744,152 47,489,176 47,489,176 - - - - - - - - - - - - - - - - - - 882,957 48 2072 2072-73 30,727,143 18,330,027 49,057,170 49,057,170 - - - - - - - - - - - - - - - - - - - 49 2073 2073-74 31,728,905 18,927,619 50,656,524 50,656,524 - - - - - - - - - - - - - - - - - - - 50 2074 2074-75 32,750,701 19,537,163 52,287,865 52,287,865 - - - - - - - - - - - - - - - - - - -
702,239,740$ 418,915,385$ 1,121,155,125$ 1,978,593,996$ 17,928,101$ 18,286,663$ 18,652,397$ 19,025,444$ 19,405,953$ 19,794,072$ 20,189,954$ 20,593,753$ 21,005,628$ 21,425,741$ 21,854,255$ 22,291,341$ 22,737,167$ 23,191,911$ 23,655,749$ 24,128,864$ 24,611,441$ 25,103,670$ 25,605,743$
NPV @ 6.0% [e] 116,398,450$ 69,436,545$ 123,590,885$ $141,582,786.81 8,401,925$ 8,569,963$ 8,741,363$ 8,916,190$ 9,094,514$ 9,276,404$ 9,461,932$ 9,651,171$ 9,844,194$ 10,041,078$ 10,241,900$ 10,446,738$ 10,655,672$ 10,868,786$ 11,086,162$ 11,307,885$ 11,534,042$ 11,764,723$ 12,000,018$
Footnotes:[a] For purposes of this analysis, assumes a build-out period of 50 years. Tax increment term may vary depending on the type of IFD used for the financing.[b] For illustration purposes only, assumes an interest rate of 6.0%.[c] For illustration purposes only, assumes debt service coverage of 145.0%. Actual amount may vary.[d] For illustration purposes only.[e] Represents estimated net present value to IFD Plan Year 1, assuming a discount rate of 6.0%.[f] For purposes of this analysis, assumes the first series of bonds are issued once tax increment has been generated from new construction value additions.
• Assumes 50.0% Available IFD Allocation
• See Notes and Supporting Exhibits
\\192.168.1.12\data files\RCL\SSA\TI Model\Financial Feasibility Analysis 2016-05-13 - v1.0Page 10 of 332

Exhibit D - Riverside & ImperialSalton Sea AuthorityBond Sizing - Riverside & ImperialScenario 1A (3.0% Loan Interest; 50.0% TI to IFD)May 13, 2016Bond Sale Date 11/1/XXXX
Total
Final Year of IFD [a]
Final Bond YearBond Amortization Term (Years) 30Bond Interest Rate [b]Revenue 68,227,379$ Net Revenue Available for Debt Service 68,227,379$ Coverage [c] 145%Debt Service 47,053,365$
Bond Amount 647,555,000$ Reserve Fund 47,053,365 Capitalized Interest (0 months) - Underwriter Discount @ 2.00% [d] 12,951,100 Bond Insurance Premium @ 0% - Cost of Issuance @ $350,000 [d] 17,500,000
Net Bond Proceeds 570,050,535$ (1)
Build Net Revenues Net Revenues Net Revenues
Out Fiscal for Riv IFD for Imp IFD for IFD
Yr [a] Year Year (Ex E-Riverside) (Ex E-Imperial) Total Total
1 2025 2025-26 387,218$ 230,992$ 618,210$ 618,210$ 2 2026 2026-27 782,181 466,604 1,248,785 1,248,785 3 2027 2027-28 1,185,043 706,928 1,891,971 1,891,971 4 2028 2028-29 1,595,962 952,058 2,548,021 2,548,021 5 2029 2029-30 2,015,100 1,202,092 3,217,192 3,217,192 6 2030 2030-31 2,442,621 1,457,125 3,899,746 3,899,746 7 2031 2031-32 2,878,691 1,717,260 4,595,951 4,595,951 8 2032 2032-33 3,323,484 1,982,597 5,306,081 5,306,081 9 2033 2033-34 3,777,172 2,253,241 6,030,413 6,030,413 10 2034 2034-35 4,239,934 2,529,298 6,769,231 6,769,231 11 2035 2035-36 4,711,951 2,810,876 7,522,826 7,522,826 12 2036 2036-37 5,193,408 3,098,085 8,291,493 8,291,493 13 2037 2037-38 5,684,495 3,391,039 9,075,533 9,075,533 14 2038 2038-39 6,185,403 3,689,852 9,875,255 9,875,255 15 2039 2039-40 6,696,329 3,994,641 10,690,970 10,690,970 16 2040 2040-41 7,217,474 4,305,525 11,523,000 11,523,000 17 2041 2041-42 7,749,042 4,622,628 12,371,670 12,371,670 18 2042 2042-43 8,291,242 4,946,072 13,237,314 13,237,314 19 2043 2043-44 8,844,285 5,275,986 14,120,271 14,120,271 20 2044 2044-45 9,408,389 5,612,498 15,020,886 15,020,886 21 2045 2045-46 9,983,775 5,955,740 15,939,515 15,939,515 22 2046 2046-47 10,570,669 6,305,846 16,876,515 16,876,515 23 2047 2047-48 11,169,301 6,662,955 17,832,256 17,832,256 24 2048 2048-49 11,779,905 7,027,206 18,807,111 18,807,111 25 2049 2049-50 12,402,722 7,398,742 19,801,464 19,801,464 26 2050 2050-51 13,037,995 7,777,709 20,815,704 20,815,704 27 2051 2051-52 13,685,973 8,164,255 21,850,228 21,850,228 28 2052 2052-53 14,346,911 8,558,532 22,905,443 22,905,443 29 2053 2053-54 15,021,067 8,960,695 23,981,762 23,981,762 30 2054 2054-55 15,708,707 9,370,901 25,079,608 25,079,608 31 2055 2055-56 16,410,100 9,789,311 26,199,411 26,199,411 32 2056 2056-57 17,125,520 10,216,089 27,341,609 27,341,609 33 2057 2057-58 17,855,249 10,651,403 28,506,652 28,506,652 34 2058 2058-59 18,599,572 11,095,423 29,694,995 29,694,995 35 2059 2059-60 19,358,782 11,548,323 30,907,105 30,907,105 36 2060 2060-61 20,133,176 12,010,282 32,143,458 32,143,458 37 2061 2061-62 20,923,058 12,481,479 33,404,537 33,404,537 38 2062 2062-63 21,728,738 12,962,101 34,690,839 34,690,839 39 2063 2063-64 22,550,531 13,452,335 36,002,866 36,002,866 40 2064 2064-65 23,388,760 13,952,374 37,341,133 37,341,133 41 2065 2065-66 24,243,753 14,462,413 38,706,167 38,706,167 42 2066 2066-67 25,115,847 14,982,653 40,098,500 40,098,500 43 2067 2067-68 26,005,382 15,513,298 41,518,681 41,518,681 44 2068 2068-69 26,912,708 16,054,556 42,967,265 42,967,265 45 2069 2069-70 27,838,181 16,606,640 44,444,820 44,444,820 46 2070 2070-71 28,782,163 17,169,764 45,951,927 45,951,927 47 2071 2071-72 29,745,024 17,744,152 47,489,176 47,489,176 48 2072 2072-73 30,727,143 18,330,027 49,057,170 49,057,170 49 2073 2073-74 31,728,905 18,927,619 50,656,524 50,656,524 50 2074 2074-75 32,750,701 19,537,163 52,287,865 52,287,865
702,239,740$ 418,915,385$ 1,121,155,125$ 1,978,593,996$
NPV @ 6.0% [e] 116,398,450$ 69,436,545$ 123,590,885$ $141,582,786.81
Footnotes:[a] For purposes of this analysis, assumes a build-out period of 50 years. Tax increment term may vary depend[b] For illustration purposes only, assumes an interest rate of 6.0%.[c] For illustration purposes only, assumes debt service coverage of 145.0%. Actual amount may vary.[d] For illustration purposes only.[e] Represents estimated net present value to IFD Plan Year 1, assuming a discount rate of 6.0%.[f] For purposes of this analysis, assumes the first series of bonds are issued once tax increment has been gen
2044 2045 2046 2047 2048 2049 2050 2051 2052 2053 2054 2055 2056 2057 2058 2059 2060 2061 2062
Series 20 Series 21 Series 22 Series 23 Series 24 Series 25 Series 26 Series 27 Series 28 Series 29 Series 30 Series 31 Series 32 Series 33 Series 34 Series 35 Series 36 Series 37 Series 38
2093 2094 2095 2096 2097 2098 2099 2100 2101 2102 2103 2104 2105 2106 2107 2108 2109 2110 2111
2073 2074 2075 2076 2077 2078 2079 2080 2081 2082 2083 2084 2085 2086 2087 2088 2089 2090 209130 30 30 30 30 30 30 30 30 30 30 30 30 30 30 30 30 30 30
6.00% 6.00% 6.00% 6.00% 6.00% 6.00% 6.00% 6.00% 6.00% 6.00% 6.00% 6.00% 6.00% 6.00% 6.00% 6.00% 6.00% 6.00% 6.00%900,616$ 918,628$ 937,001$ 955,741$ 974,856$ 994,353$ 1,014,240$ 1,034,524$ 1,055,215$ 1,076,319$ 1,716,056$ 1,750,377$ 1,785,385$ 1,821,092$ 1,857,514$ 1,894,665$ 1,932,558$ 1,971,209$ 2,010,633$ 900,616$ 918,628$ 937,001$ 955,741$ 974,856$ 994,353$ 1,014,240$ 1,034,524$ 1,055,215$ 1,076,319$ 1,716,056$ 1,750,377$ 1,785,385$ 1,821,092$ 1,857,514$ 1,894,665$ 1,932,558$ 1,971,209$ 2,010,633$ 145.00% 145.00% 145.00% 145.00% 145.00% 145.00% 145.00% 145.00% 145.00% 145.00% 145.00% 145.00% 145.00% 145.00% 145.00% 145.00% 145.00% 145.00% 145.00%621,114$ 633,537$ 646,207$ 659,132$ 672,314$ 685,760$ 699,476$ 713,465$ 727,734$ 742,289$ 1,183,487$ 1,207,157$ 1,231,300$ 1,255,926$ 1,281,044$ 1,306,665$ 1,332,798$ 1,359,454$ 1,386,644$
8,545,000$ 8,720,000$ 8,890,000$ 9,070,000$ 9,250,000$ 9,435,000$ 9,625,000$ 9,820,000$ 10,015,000$ 10,215,000$ 16,290,000$ 16,615,000$ 16,945,000$ 17,285,000$ 17,630,000$ 17,985,000$ 18,345,000$ 18,710,000$ 19,085,000$ 621,114 633,537 646,207 659,132 672,314 685,760 699,476 713,465 727,734 742,289 1,183,487 1,207,157 1,231,300 1,255,926 1,281,044 1,306,665 1,332,798 1,359,454 1,386,644
- - - - - - - - - - - - - - - - - - - 170,900 174,400 177,800 181,400 185,000 188,700 192,500 196,400 200,300 204,300 325,800 332,300 338,900 345,700 352,600 359,700 366,900 374,200 381,700
- - - - - - - - - - - - - - - - - - - 350,000 350,000 350,000 350,000 350,000 350,000 350,000 350,000 350,000 350,000 350,000 350,000 350,000 350,000 350,000 350,000 350,000 350,000 350,000
7,402,986$ 7,562,063$ 7,715,993$ 7,879,468$ 8,042,686$ 8,210,540$ 8,383,024$ 8,560,135$ 8,736,966$ 8,918,411$ 14,430,713$ 14,725,543$ 15,024,800$ 15,333,374$ 15,646,356$ 15,968,635$ 16,295,302$ 16,626,346$ 16,966,656$
Revenue Pledged to Debt Service [f]
Series 20 Series 21 Series 22 Series 23 Series 24 Series 25 Series 26 Series 27 Series 28 Series 29 Series 30 Series 31 Series 32 Series 33 Series 34 Series 35 Series 36 Series 37 Series 38
900,616 900,616 918,628 900,616 918,628 937,001 900,616 918,628 937,001 955,741 900,616 918,628 937,001 955,741 974,856 900,616 918,628 937,001 955,741 974,856 994,353 900,616 918,628 937,001 955,741 974,856 994,353 1,014,240 900,616 918,628 937,001 955,741 974,856 994,353 1,014,240 1,034,524 900,616 918,628 937,001 955,741 974,856 994,353 1,014,240 1,034,524 1,055,215 900,616 918,628 937,001 955,741 974,856 994,353 1,014,240 1,034,524 1,055,215 1,076,319 900,616 918,628 937,001 955,741 974,856 994,353 1,014,240 1,034,524 1,055,215 1,076,319 1,716,056 900,616 918,628 937,001 955,741 974,856 994,353 1,014,240 1,034,524 1,055,215 1,076,319 1,716,056 1,750,377 900,616 918,628 937,001 955,741 974,856 994,353 1,014,240 1,034,524 1,055,215 1,076,319 1,716,056 1,750,377 1,785,385 900,616 918,628 937,001 955,741 974,856 994,353 1,014,240 1,034,524 1,055,215 1,076,319 1,716,056 1,750,377 1,785,385 1,821,092 900,616 918,628 937,001 955,741 974,856 994,353 1,014,240 1,034,524 1,055,215 1,076,319 1,716,056 1,750,377 1,785,385 1,821,092 1,857,514 900,616 918,628 937,001 955,741 974,856 994,353 1,014,240 1,034,524 1,055,215 1,076,319 1,716,056 1,750,377 1,785,385 1,821,092 1,857,514 1,894,665 900,616 918,628 937,001 955,741 974,856 994,353 1,014,240 1,034,524 1,055,215 1,076,319 1,716,056 1,750,377 1,785,385 1,821,092 1,857,514 1,894,665 1,932,558 900,616 918,628 937,001 955,741 974,856 994,353 1,014,240 1,034,524 1,055,215 1,076,319 1,716,056 1,750,377 1,785,385 1,821,092 1,857,514 1,894,665 1,932,558 1,971,209 900,616 918,628 937,001 955,741 974,856 994,353 1,014,240 1,034,524 1,055,215 1,076,319 1,716,056 1,750,377 1,785,385 1,821,092 1,857,514 1,894,665 1,932,558 1,971,209 2,010,633 900,616 918,628 937,001 955,741 974,856 994,353 1,014,240 1,034,524 1,055,215 1,076,319 1,716,056 1,750,377 1,785,385 1,821,092 1,857,514 1,894,665 1,932,558 1,971,209 2,010,633 900,616 918,628 937,001 955,741 974,856 994,353 1,014,240 1,034,524 1,055,215 1,076,319 1,716,056 1,750,377 1,785,385 1,821,092 1,857,514 1,894,665 1,932,558 1,971,209 2,010,633 900,616 918,628 937,001 955,741 974,856 994,353 1,014,240 1,034,524 1,055,215 1,076,319 1,716,056 1,750,377 1,785,385 1,821,092 1,857,514 1,894,665 1,932,558 1,971,209 2,010,633 900,616 918,628 937,001 955,741 974,856 994,353 1,014,240 1,034,524 1,055,215 1,076,319 1,716,056 1,750,377 1,785,385 1,821,092 1,857,514 1,894,665 1,932,558 1,971,209 2,010,633 900,616 918,628 937,001 955,741 974,856 994,353 1,014,240 1,034,524 1,055,215 1,076,319 1,716,056 1,750,377 1,785,385 1,821,092 1,857,514 1,894,665 1,932,558 1,971,209 2,010,633 900,616 918,628 937,001 955,741 974,856 994,353 1,014,240 1,034,524 1,055,215 1,076,319 1,716,056 1,750,377 1,785,385 1,821,092 1,857,514 1,894,665 1,932,558 1,971,209 2,010,633 900,616 918,628 937,001 955,741 974,856 994,353 1,014,240 1,034,524 1,055,215 1,076,319 1,716,056 1,750,377 1,785,385 1,821,092 1,857,514 1,894,665 1,932,558 1,971,209 2,010,633 900,616 918,628 937,001 955,741 974,856 994,353 1,014,240 1,034,524 1,055,215 1,076,319 1,716,056 1,750,377 1,785,385 1,821,092 1,857,514 1,894,665 1,932,558 1,971,209 2,010,633 900,616 918,628 937,001 955,741 974,856 994,353 1,014,240 1,034,524 1,055,215 1,076,319 1,716,056 1,750,377 1,785,385 1,821,092 1,857,514 1,894,665 1,932,558 1,971,209 2,010,633 900,616 918,628 937,001 955,741 974,856 994,353 1,014,240 1,034,524 1,055,215 1,076,319 1,716,056 1,750,377 1,785,385 1,821,092 1,857,514 1,894,665 1,932,558 1,971,209 2,010,633
- 918,628 937,001 955,741 974,856 994,353 1,014,240 1,034,524 1,055,215 1,076,319 1,716,056 1,750,377 1,785,385 1,821,092 1,857,514 1,894,665 1,932,558 1,971,209 2,010,633 - - 937,001 955,741 974,856 994,353 1,014,240 1,034,524 1,055,215 1,076,319 1,716,056 1,750,377 1,785,385 1,821,092 1,857,514 1,894,665 1,932,558 1,971,209 2,010,633
26,117,858$ 26,640,215$ 27,173,020$ 27,716,480$ 28,270,810$ 28,836,226$ 29,412,950$ 30,001,209$ 30,601,234$ 31,213,258$ 49,765,625$ 50,760,937$ 51,776,156$ 52,811,679$ 53,867,913$ 54,945,271$ 56,044,176$ 57,165,060$ 58,308,361$
12,240,018$ 12,484,818$ 12,734,515$ 12,989,205$ 13,248,989$ 13,513,969$ 13,784,248$ 14,059,933$ 14,341,132$ 14,627,955$ 23,322,439$ 23,788,887$ 24,264,665$ 24,749,959$ 25,244,958$ 25,749,857$ 26,264,854$ 26,790,151$ 27,325,954$
• Assumes 50.0% Available IFD Allocation
• See Notes and Supporting Exhibits
\\192.168.1.12\data files\RCL\SSA\TI Model\Financial Feasibility Analysis 2016-05-13 - v1.0Page 11 of 332
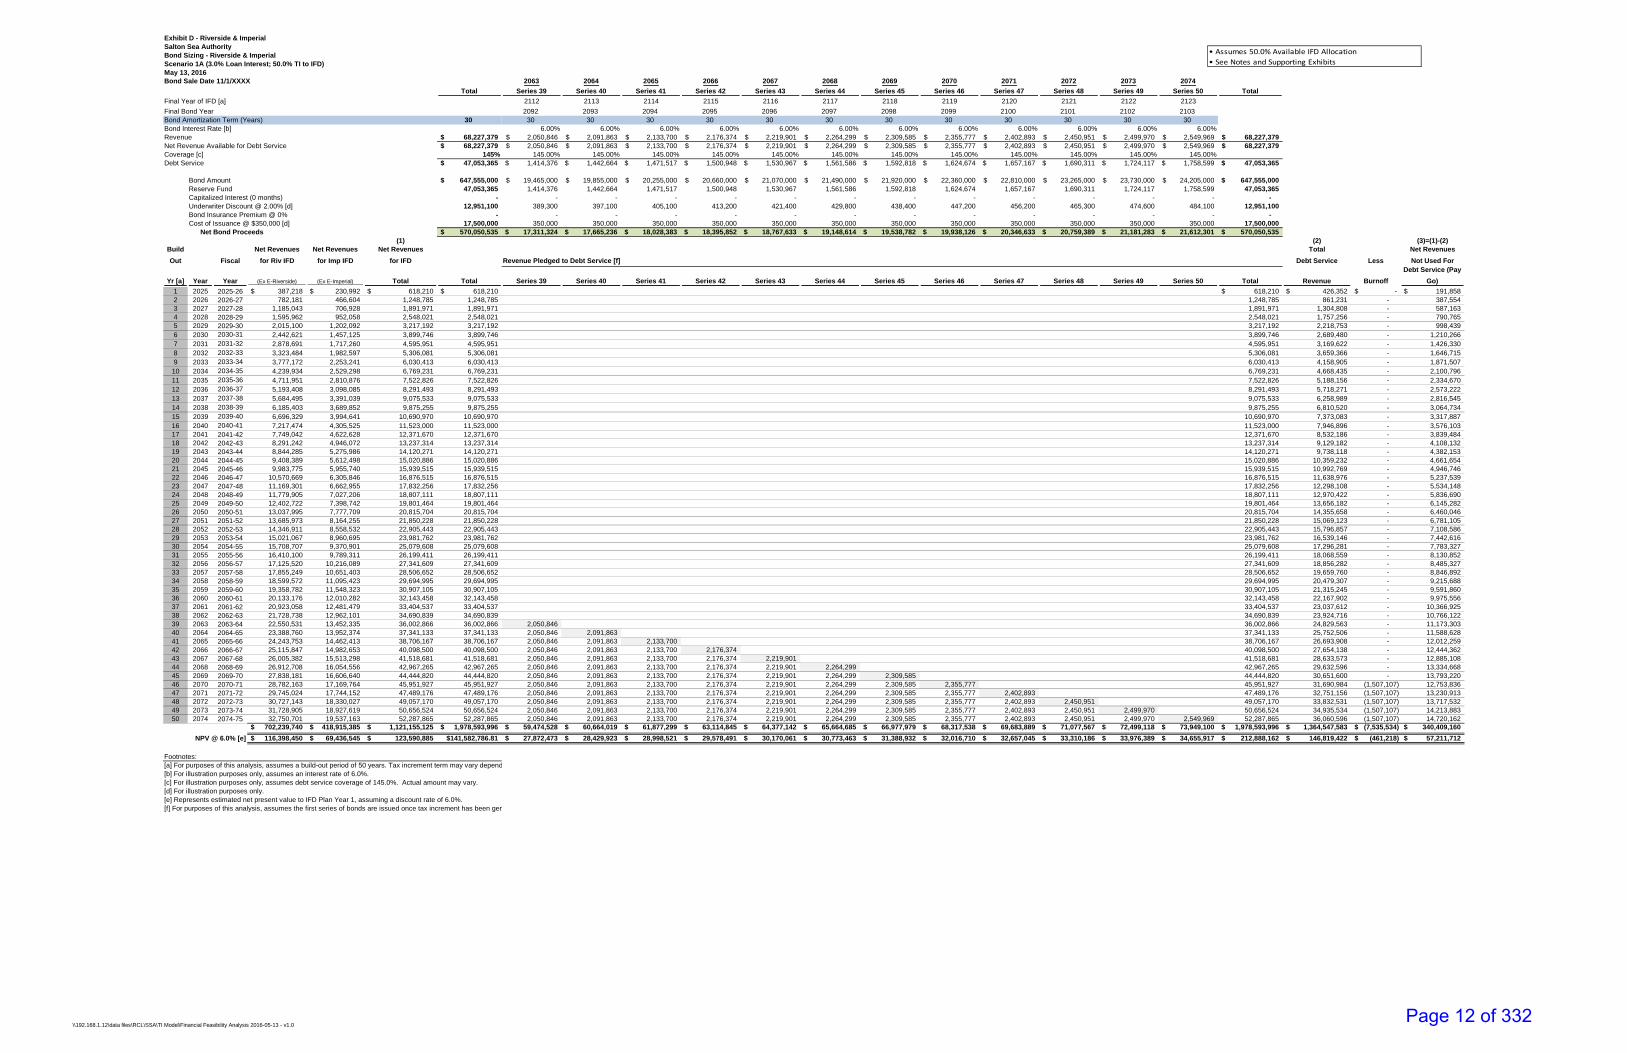
Exhibit D - Riverside & ImperialSalton Sea AuthorityBond Sizing - Riverside & ImperialScenario 1A (3.0% Loan Interest; 50.0% TI to IFD)May 13, 2016Bond Sale Date 11/1/XXXX
Total
Final Year of IFD [a]
Final Bond YearBond Amortization Term (Years) 30Bond Interest Rate [b]Revenue 68,227,379$ Net Revenue Available for Debt Service 68,227,379$ Coverage [c] 145%Debt Service 47,053,365$
Bond Amount 647,555,000$ Reserve Fund 47,053,365 Capitalized Interest (0 months) - Underwriter Discount @ 2.00% [d] 12,951,100 Bond Insurance Premium @ 0% - Cost of Issuance @ $350,000 [d] 17,500,000
Net Bond Proceeds 570,050,535$ (1)
Build Net Revenues Net Revenues Net Revenues
Out Fiscal for Riv IFD for Imp IFD for IFD
Yr [a] Year Year (Ex E-Riverside) (Ex E-Imperial) Total Total
1 2025 2025-26 387,218$ 230,992$ 618,210$ 618,210$ 2 2026 2026-27 782,181 466,604 1,248,785 1,248,785 3 2027 2027-28 1,185,043 706,928 1,891,971 1,891,971 4 2028 2028-29 1,595,962 952,058 2,548,021 2,548,021 5 2029 2029-30 2,015,100 1,202,092 3,217,192 3,217,192 6 2030 2030-31 2,442,621 1,457,125 3,899,746 3,899,746 7 2031 2031-32 2,878,691 1,717,260 4,595,951 4,595,951 8 2032 2032-33 3,323,484 1,982,597 5,306,081 5,306,081 9 2033 2033-34 3,777,172 2,253,241 6,030,413 6,030,413 10 2034 2034-35 4,239,934 2,529,298 6,769,231 6,769,231 11 2035 2035-36 4,711,951 2,810,876 7,522,826 7,522,826 12 2036 2036-37 5,193,408 3,098,085 8,291,493 8,291,493 13 2037 2037-38 5,684,495 3,391,039 9,075,533 9,075,533 14 2038 2038-39 6,185,403 3,689,852 9,875,255 9,875,255 15 2039 2039-40 6,696,329 3,994,641 10,690,970 10,690,970 16 2040 2040-41 7,217,474 4,305,525 11,523,000 11,523,000 17 2041 2041-42 7,749,042 4,622,628 12,371,670 12,371,670 18 2042 2042-43 8,291,242 4,946,072 13,237,314 13,237,314 19 2043 2043-44 8,844,285 5,275,986 14,120,271 14,120,271 20 2044 2044-45 9,408,389 5,612,498 15,020,886 15,020,886 21 2045 2045-46 9,983,775 5,955,740 15,939,515 15,939,515 22 2046 2046-47 10,570,669 6,305,846 16,876,515 16,876,515 23 2047 2047-48 11,169,301 6,662,955 17,832,256 17,832,256 24 2048 2048-49 11,779,905 7,027,206 18,807,111 18,807,111 25 2049 2049-50 12,402,722 7,398,742 19,801,464 19,801,464 26 2050 2050-51 13,037,995 7,777,709 20,815,704 20,815,704 27 2051 2051-52 13,685,973 8,164,255 21,850,228 21,850,228 28 2052 2052-53 14,346,911 8,558,532 22,905,443 22,905,443 29 2053 2053-54 15,021,067 8,960,695 23,981,762 23,981,762 30 2054 2054-55 15,708,707 9,370,901 25,079,608 25,079,608 31 2055 2055-56 16,410,100 9,789,311 26,199,411 26,199,411 32 2056 2056-57 17,125,520 10,216,089 27,341,609 27,341,609 33 2057 2057-58 17,855,249 10,651,403 28,506,652 28,506,652 34 2058 2058-59 18,599,572 11,095,423 29,694,995 29,694,995 35 2059 2059-60 19,358,782 11,548,323 30,907,105 30,907,105 36 2060 2060-61 20,133,176 12,010,282 32,143,458 32,143,458 37 2061 2061-62 20,923,058 12,481,479 33,404,537 33,404,537 38 2062 2062-63 21,728,738 12,962,101 34,690,839 34,690,839 39 2063 2063-64 22,550,531 13,452,335 36,002,866 36,002,866 40 2064 2064-65 23,388,760 13,952,374 37,341,133 37,341,133 41 2065 2065-66 24,243,753 14,462,413 38,706,167 38,706,167 42 2066 2066-67 25,115,847 14,982,653 40,098,500 40,098,500 43 2067 2067-68 26,005,382 15,513,298 41,518,681 41,518,681 44 2068 2068-69 26,912,708 16,054,556 42,967,265 42,967,265 45 2069 2069-70 27,838,181 16,606,640 44,444,820 44,444,820 46 2070 2070-71 28,782,163 17,169,764 45,951,927 45,951,927 47 2071 2071-72 29,745,024 17,744,152 47,489,176 47,489,176 48 2072 2072-73 30,727,143 18,330,027 49,057,170 49,057,170 49 2073 2073-74 31,728,905 18,927,619 50,656,524 50,656,524 50 2074 2074-75 32,750,701 19,537,163 52,287,865 52,287,865
702,239,740$ 418,915,385$ 1,121,155,125$ 1,978,593,996$
NPV @ 6.0% [e] 116,398,450$ 69,436,545$ 123,590,885$ $141,582,786.81
Footnotes:[a] For purposes of this analysis, assumes a build-out period of 50 years. Tax increment term may vary depend[b] For illustration purposes only, assumes an interest rate of 6.0%.[c] For illustration purposes only, assumes debt service coverage of 145.0%. Actual amount may vary.[d] For illustration purposes only.[e] Represents estimated net present value to IFD Plan Year 1, assuming a discount rate of 6.0%.[f] For purposes of this analysis, assumes the first series of bonds are issued once tax increment has been gen
2063 2064 2065 2066 2067 2068 2069 2070 2071 2072 2073 2074
Series 39 Series 40 Series 41 Series 42 Series 43 Series 44 Series 45 Series 46 Series 47 Series 48 Series 49 Series 50 Total
2112 2113 2114 2115 2116 2117 2118 2119 2120 2121 2122 2123
2092 2093 2094 2095 2096 2097 2098 2099 2100 2101 2102 210330 30 30 30 30 30 30 30 30 30 30 30
6.00% 6.00% 6.00% 6.00% 6.00% 6.00% 6.00% 6.00% 6.00% 6.00% 6.00% 6.00%2,050,846$ 2,091,863$ 2,133,700$ 2,176,374$ 2,219,901$ 2,264,299$ 2,309,585$ 2,355,777$ 2,402,893$ 2,450,951$ 2,499,970$ 2,549,969$ 68,227,379$ 2,050,846$ 2,091,863$ 2,133,700$ 2,176,374$ 2,219,901$ 2,264,299$ 2,309,585$ 2,355,777$ 2,402,893$ 2,450,951$ 2,499,970$ 2,549,969$ 68,227,379$
145.00% 145.00% 145.00% 145.00% 145.00% 145.00% 145.00% 145.00% 145.00% 145.00% 145.00% 145.00%1,414,376$ 1,442,664$ 1,471,517$ 1,500,948$ 1,530,967$ 1,561,586$ 1,592,818$ 1,624,674$ 1,657,167$ 1,690,311$ 1,724,117$ 1,758,599$ 47,053,365$
19,465,000$ 19,855,000$ 20,255,000$ 20,660,000$ 21,070,000$ 21,490,000$ 21,920,000$ 22,360,000$ 22,810,000$ 23,265,000$ 23,730,000$ 24,205,000$ 647,555,000$ 1,414,376 1,442,664 1,471,517 1,500,948 1,530,967 1,561,586 1,592,818 1,624,674 1,657,167 1,690,311 1,724,117 1,758,599 47,053,365
- - - - - - - - - - - - - 389,300 397,100 405,100 413,200 421,400 429,800 438,400 447,200 456,200 465,300 474,600 484,100 12,951,100
- - - - - - - - - - - - - 350,000 350,000 350,000 350,000 350,000 350,000 350,000 350,000 350,000 350,000 350,000 350,000 17,500,000
17,311,324$ 17,665,236$ 18,028,383$ 18,395,852$ 18,767,633$ 19,148,614$ 19,538,782$ 19,938,126$ 20,346,633$ 20,759,389$ 21,181,283$ 21,612,301$ 570,050,535$ (2) (3)=(1)-(2)
Total Net Revenues
Revenue Pledged to Debt Service [f] Debt Service Less Not Used For
Series 39 Series 40 Series 41 Series 42 Series 43 Series 44 Series 45 Series 46 Series 47 Series 48 Series 49 Series 50 Total Revenue Burnoff
Debt Service (Pay
Go)
618,210$ 426,352$ -$ 191,858$ 1,248,785 861,231 - 387,554 1,891,971 1,304,808 - 587,163 2,548,021 1,757,256 - 790,765 3,217,192 2,218,753 - 998,439 3,899,746 2,689,480 - 1,210,266 4,595,951 3,169,622 - 1,426,330 5,306,081 3,659,366 - 1,646,715 6,030,413 4,158,905 - 1,871,507 6,769,231 4,668,435 - 2,100,796 7,522,826 5,188,156 - 2,334,670 8,291,493 5,718,271 - 2,573,222 9,075,533 6,258,989 - 2,816,545 9,875,255 6,810,520 - 3,064,734
10,690,970 7,373,083 - 3,317,887 11,523,000 7,946,896 - 3,576,103 12,371,670 8,532,186 - 3,839,484 13,237,314 9,129,182 - 4,108,132 14,120,271 9,738,118 - 4,382,153 15,020,886 10,359,232 - 4,661,654 15,939,515 10,992,769 - 4,946,746 16,876,515 11,638,976 - 5,237,539 17,832,256 12,298,108 - 5,534,148 18,807,111 12,970,422 - 5,836,690 19,801,464 13,656,182 - 6,145,282 20,815,704 14,355,658 - 6,460,046 21,850,228 15,069,123 - 6,781,105 22,905,443 15,796,857 - 7,108,586 23,981,762 16,539,146 - 7,442,616 25,079,608 17,296,281 - 7,783,327 26,199,411 18,068,559 - 8,130,852 27,341,609 18,856,282 - 8,485,327 28,506,652 19,659,760 - 8,846,892 29,694,995 20,479,307 - 9,215,688 30,907,105 21,315,245 - 9,591,860 32,143,458 22,167,902 - 9,975,556 33,404,537 23,037,612 - 10,366,925 34,690,839 23,924,716 - 10,766,122
2,050,846 36,002,866 24,829,563 - 11,173,303 2,050,846 2,091,863 37,341,133 25,752,506 - 11,588,628 2,050,846 2,091,863 2,133,700 38,706,167 26,693,908 - 12,012,259 2,050,846 2,091,863 2,133,700 2,176,374 40,098,500 27,654,138 - 12,444,362 2,050,846 2,091,863 2,133,700 2,176,374 2,219,901 41,518,681 28,633,573 - 12,885,108 2,050,846 2,091,863 2,133,700 2,176,374 2,219,901 2,264,299 42,967,265 29,632,596 - 13,334,668 2,050,846 2,091,863 2,133,700 2,176,374 2,219,901 2,264,299 2,309,585 44,444,820 30,651,600 - 13,793,220 2,050,846 2,091,863 2,133,700 2,176,374 2,219,901 2,264,299 2,309,585 2,355,777 45,951,927 31,690,984 (1,507,107) 12,753,836 2,050,846 2,091,863 2,133,700 2,176,374 2,219,901 2,264,299 2,309,585 2,355,777 2,402,893 47,489,176 32,751,156 (1,507,107) 13,230,913 2,050,846 2,091,863 2,133,700 2,176,374 2,219,901 2,264,299 2,309,585 2,355,777 2,402,893 2,450,951 49,057,170 33,832,531 (1,507,107) 13,717,532 2,050,846 2,091,863 2,133,700 2,176,374 2,219,901 2,264,299 2,309,585 2,355,777 2,402,893 2,450,951 2,499,970 50,656,524 34,935,534 (1,507,107) 14,213,883 2,050,846 2,091,863 2,133,700 2,176,374 2,219,901 2,264,299 2,309,585 2,355,777 2,402,893 2,450,951 2,499,970 2,549,969 52,287,865 36,060,596 (1,507,107) 14,720,162
59,474,528$ 60,664,019$ 61,877,299$ 63,114,845$ 64,377,142$ 65,664,685$ 66,977,979$ 68,317,538$ 69,683,889$ 71,077,567$ 72,499,118$ 73,949,100$ 1,978,593,996$ 1,364,547,583$ (7,535,534)$ 340,409,160$
27,872,473$ 28,429,923$ 28,998,521$ 29,578,491$ 30,170,061$ 30,773,463$ 31,388,932$ 32,016,710$ 32,657,045$ 33,310,186$ 33,976,389$ 34,655,917$ 212,888,162$ 146,819,422$ (461,218)$ 57,211,712$
• Assumes 50.0% Available IFD Allocation
• See Notes and Supporting Exhibits
\\192.168.1.12\data files\RCL\SSA\TI Model\Financial Feasibility Analysis 2016-05-13 - v1.0Page 12 of 332

Exhibit E - Riverside
Salton Sea Infrastructure Finance DistrictProjected Infrastructure Finance District Revenues - RiversideScenario 1A (3.0% Loan Interest; 50.0% TI to IFD)May 13, 2016
Landside Secured New Gross Tax Tax RevenueDevelopment New Assessed Landside Total Tax Cumulative Housing Increment Taxing Entities Net of
Build Out Fiscal New Values Development Assessed Incremental Collections Tax Fund Net of Payment @ Taxing EntitiesYear Year Year 2.00% Construction Value Value 0.2438% Collections 0.00% Housing 50% Payment
Exhibit Reference/FN [a] (Ex F) [c] [b]
0 2016 2016-17 -$ - -$ 0 2017 2017-18 -$ -$ -$ -$ -$ 0 2018 2018-19 -$ -$ -$ -$ -$ -$ -$ -$ -$ -$ 0 2019 2019-20 - - - - - - - - - - 0 2020 2020-21 - - - - - - - - - - 0 2021 2021-22 - - - - - - - - - - 0 2022 2022-23 - - - - - - - - - - 0 2023 2023-24 - - - - - - - - - - 0 2024 2024-25 - - - - - - - - - - 1 2025 2025-26 317,602,979 317,602,979 317,602,979 317,602,979 774,437 774,437 - 774,437 387,218 387,218 2 2026 2026-27 641,558,018 317,602,979 641,558,018 641,558,018 1,564,362 2,338,799 - 1,564,362 782,181 782,181 3 2027 2027-28 971,992,157 317,602,979 971,992,157 971,992,157 2,370,086 4,708,886 - 2,370,086 1,185,043 1,185,043 4 2028 2028-29 1,309,034,979 317,602,979 1,309,034,979 1,309,034,979 3,191,925 7,900,811 - 3,191,925 1,595,962 1,595,962 5 2029 2029-30 1,652,818,658 317,602,979 1,652,818,658 1,652,818,658 4,030,200 11,931,011 - 4,030,200 2,015,100 2,015,100 6 2030 2030-31 2,003,478,010 317,602,979 2,003,478,010 2,003,478,010 4,885,241 16,816,252 - 4,885,241 2,442,621 2,442,621 7 2031 2031-32 2,361,150,549 317,602,979 2,361,150,549 2,361,150,549 5,757,383 22,573,635 - 5,757,383 2,878,691 2,878,691 8 2032 2032-33 2,725,976,539 317,602,979 2,725,976,539 2,725,976,539 6,646,967 29,220,602 - 6,646,967 3,323,484 3,323,484 9 2033 2033-34 3,098,099,049 317,602,979 3,098,099,049 3,098,099,049 7,554,343 36,774,945 - 7,554,343 3,777,172 3,777,172
10 2034 2034-35 3,477,664,009 317,602,979 3,477,664,009 3,477,664,009 8,479,867 45,254,812 - 8,479,867 4,239,934 4,239,934 11 2035 2035-36 3,864,820,268 317,602,979 3,864,820,268 3,864,820,268 9,423,901 54,678,714 - 9,423,901 4,711,951 4,711,951 12 2036 2036-37 4,259,719,653 317,602,979 4,259,719,653 4,259,719,653 10,386,816 65,065,530 - 10,386,816 5,193,408 5,193,408 13 2037 2037-38 4,662,517,025 317,602,979 4,662,517,025 4,662,517,025 11,368,989 76,434,519 - 11,368,989 5,684,495 5,684,495 14 2038 2038-39 5,073,370,344 317,602,979 5,073,370,344 5,073,370,344 12,370,806 88,805,325 - 12,370,806 6,185,403 6,185,403 15 2039 2039-40 5,492,440,730 317,602,979 5,492,440,730 5,492,440,730 13,392,659 102,197,983 - 13,392,659 6,696,329 6,696,329 16 2040 2040-41 5,919,892,524 317,602,979 5,919,892,524 5,919,892,524 14,434,949 116,632,932 - 14,434,949 7,217,474 7,217,474 17 2041 2041-42 6,355,893,354 317,602,979 6,355,893,354 6,355,893,354 15,498,085 132,131,017 - 15,498,085 7,749,042 7,749,042 18 2042 2042-43 6,800,614,200 317,602,979 6,800,614,200 6,800,614,200 16,582,483 148,713,500 - 16,582,483 8,291,242 8,291,242 19 2043 2043-44 7,254,229,463 317,602,979 7,254,229,463 7,254,229,463 17,688,569 166,402,069 - 17,688,569 8,844,285 8,844,285 20 2044 2044-45 7,716,917,031 317,602,979 7,716,917,031 7,716,917,031 18,816,778 185,218,847 - 18,816,778 9,408,389 9,408,389 21 2045 2045-46 8,188,858,351 317,602,979 8,188,858,351 8,188,858,351 19,967,550 205,186,397 - 19,967,550 9,983,775 9,983,775 22 2046 2046-47 8,670,238,497 317,602,979 8,670,238,497 8,670,238,497 21,141,338 226,327,735 - 21,141,338 10,570,669 10,570,669 23 2047 2047-48 9,161,246,246 317,602,979 9,161,246,246 9,161,246,246 22,338,601 248,666,336 - 22,338,601 11,169,301 11,169,301 24 2048 2048-49 9,662,074,150 317,602,979 9,662,074,150 9,662,074,150 23,559,810 272,226,147 - 23,559,810 11,779,905 11,779,905 25 2049 2049-50 10,172,918,612 317,602,979 10,172,918,612 10,172,918,612 24,805,443 297,031,590 - 24,805,443 12,402,722 12,402,722 26 2050 2050-51 10,693,979,963 317,602,979 10,693,979,963 10,693,979,963 26,075,989 323,107,579 - 26,075,989 13,037,995 13,037,995 27 2051 2051-52 11,225,462,541 317,602,979 11,225,462,541 11,225,462,541 27,371,946 350,479,524 - 27,371,946 13,685,973 13,685,973 28 2052 2052-53 11,767,574,771 317,602,979 11,767,574,771 11,767,574,771 28,693,821 379,173,346 - 28,693,821 14,346,911 14,346,911 29 2053 2053-54 12,320,529,245 317,602,979 12,320,529,245 12,320,529,245 30,042,135 409,215,480 - 30,042,135 15,021,067 15,021,067 30 2054 2054-55 12,884,542,809 317,602,979 12,884,542,809 12,884,542,809 31,417,414 440,632,894 - 31,417,414 15,708,707 15,708,707 31 2055 2055-56 13,459,836,645 317,602,979 13,459,836,645 13,459,836,645 32,820,199 473,453,094 - 32,820,199 16,410,100 16,410,100 32 2056 2056-57 14,046,636,357 317,602,979 14,046,636,357 14,046,636,357 34,251,040 507,704,134 - 34,251,040 17,125,520 17,125,520 33 2057 2057-58 14,645,172,063 317,602,979 14,645,172,063 14,645,172,063 35,710,498 543,414,631 - 35,710,498 17,855,249 17,855,249 34 2058 2058-59 15,255,678,483 317,602,979 15,255,678,483 15,255,678,483 37,199,144 580,613,775 - 37,199,144 18,599,572 18,599,572 35 2059 2059-60 15,878,395,032 317,602,979 15,878,395,032 15,878,395,032 38,717,564 619,331,340 - 38,717,564 19,358,782 19,358,782 36 2060 2060-61 16,513,565,911 317,602,979 16,513,565,911 16,513,565,911 40,266,352 659,597,692 - 40,266,352 20,133,176 20,133,176 37 2061 2061-62 17,161,440,209 317,602,979 17,161,440,209 17,161,440,209 41,846,116 701,443,808 - 41,846,116 20,923,058 20,923,058 38 2062 2062-63 17,822,271,992 317,602,979 17,822,271,992 17,822,271,992 43,457,475 744,901,283 - 43,457,475 21,728,738 21,728,738 39 2063 2063-64 18,496,320,411 317,602,979 18,496,320,411 18,496,320,411 45,101,061 790,002,344 - 45,101,061 22,550,531 22,550,531 40 2064 2064-65 19,183,849,798 317,602,979 19,183,849,798 19,183,849,798 46,777,520 836,779,864 - 46,777,520 23,388,760 23,388,760 41 2065 2065-66 19,885,129,773 317,602,979 19,885,129,773 19,885,129,773 48,487,507 885,267,370 - 48,487,507 24,243,753 24,243,753 42 2066 2066-67 20,600,435,348 317,602,979 20,600,435,348 20,600,435,348 50,231,694 935,499,064 - 50,231,694 25,115,847 25,115,847 43 2067 2067-68 21,330,047,034 317,602,979 21,330,047,034 21,330,047,034 52,010,764 987,509,829 - 52,010,764 26,005,382 26,005,382 44 2068 2068-69 22,074,250,953 317,602,979 22,074,250,953 22,074,250,953 53,825,416 1,041,335,245 - 53,825,416 26,912,708 26,912,708 45 2069 2069-70 22,833,338,951 317,602,979 22,833,338,951 22,833,338,951 55,676,362 1,097,011,607 - 55,676,362 27,838,181 27,838,181 46 2070 2070-71 23,607,608,709 317,602,979 23,607,608,709 23,607,608,709 57,564,326 1,154,575,932 - 57,564,326 28,782,163 28,782,163 47 2071 2071-72 24,397,363,863 317,602,979 24,397,363,863 24,397,363,863 59,490,049 1,214,065,981 - 59,490,049 29,745,024 29,745,024 48 2072 2072-73 25,202,914,119 317,602,979 25,202,914,119 25,202,914,119 61,454,287 1,275,520,268 - 61,454,287 30,727,143 30,727,143 49 2073 2073-74 26,024,575,380 317,602,979 26,024,575,380 26,024,575,380 63,457,809 1,338,978,077 - 63,457,809 31,728,905 31,728,905 50 2074 2074-75 26,862,669,867 317,602,979 26,862,669,867 26,862,669,867 65,501,402 1,404,479,480 - 65,501,402 32,750,701 32,750,701
Total 15,880,148,952$ 575,988,715,620$ 1,404,479,480$ -$ 1,404,479,480$ 702,239,740$ 702,239,740$ NPV @ 6.0% 77,411,617$
Footnotes:[a] For purposes of this analysis, assumes assessed value for new landside development construction only.[b] For purposes of this analysis, no housing set-aside has been assumed.[c] Reviewed the allocation of the 1.0% for tax rate areas 058-002 and 058-011, and used the highest Coachella Valley USD amount of the studied areas.
• Assumes 50.0% Available IFD Allocation
• See Notes and Supporting Exhibits
Financial Feasibility Analysis 2016-05-13 - v1.0; Exh-E - RSG Live-Riv; WDL Page 13 of 332

Exhibit E - Imperial
Salton Sea Infrastructure Finance DistrictProjected Infrastructure Finance District Revenues - ImperialScenario 1A (3.0% Loan Interest; 50.0% TI to IFD)May 13, 2016
Landside Secured New Gross Tax Tax RevenueDevelopment New Assessed Landside Total Tax Cumulative Housing Increment Taxing Entities Net of
Build Out Fiscal New Values Development Assessed Incremental Collections Tax Fund Net of Payment @ Taxing EntitiesYear Year Year 2.00% Construction Value Value 0.4005% Collections [a] 0% Housing 50% Payment
Exhibit Reference/FN [a] (Ex F) [c] [b]
0 2016 2016-17 -$ - 0 2017 2017-18 -$ -$ -$ -$ -$ -$ 0 2018 2018-19 -$ -$ -$ -$ -$ -$ -$ -$ - -$ 0 2019 2019-20 - - - - - - - - - - 0 2020 2020-21 - - - - - - - - - - 0 2021 2021-22 - - - - - - - - - - 0 2022 2022-23 - - - - - - - - - - 0 2023 2023-24 - - - - - - - - - - 0 2024 2024-25 - - - - - - - - - - 1 2025 2025-26 115,343,351 115,343,351 115,343,351 115,343,351 461,984 461,984 - 461,984 230,992 230,992 2 2026 2026-27 232,993,569 115,343,351 232,993,569 232,993,569 933,208 1,395,192 - 933,208 466,604 466,604 3 2027 2027-28 352,996,791 115,343,351 352,996,791 352,996,791 1,413,856 2,809,047 - 1,413,856 706,928 706,928 4 2028 2028-29 475,400,078 115,343,351 475,400,078 475,400,078 1,904,117 4,713,164 - 1,904,117 952,058 952,058 5 2029 2029-30 600,251,430 115,343,351 600,251,430 600,251,430 2,404,183 7,117,347 - 2,404,183 1,202,092 1,202,092 6 2030 2030-31 727,599,810 115,343,351 727,599,810 727,599,810 2,914,251 10,031,598 - 2,914,251 1,457,125 1,457,125 7 2031 2031-32 857,495,157 115,343,351 857,495,157 857,495,157 3,434,520 13,466,118 - 3,434,520 1,717,260 1,717,260 8 2032 2032-33 989,988,411 115,343,351 989,988,411 989,988,411 3,965,194 17,431,312 - 3,965,194 1,982,597 1,982,597 9 2033 2033-34 1,125,131,530 115,343,351 1,125,131,530 1,125,131,530 4,506,482 21,937,793 - 4,506,482 2,253,241 2,253,241
10 2034 2034-35 1,262,977,512 115,343,351 1,262,977,512 1,262,977,512 5,058,595 26,996,389 - 5,058,595 2,529,298 2,529,298 11 2035 2035-36 1,403,580,413 115,343,351 1,403,580,413 1,403,580,413 5,621,751 32,618,140 - 5,621,751 2,810,876 2,810,876 12 2036 2036-37 1,546,995,372 115,343,351 1,546,995,372 1,546,995,372 6,196,170 38,814,311 - 6,196,170 3,098,085 3,098,085 13 2037 2037-38 1,693,278,630 115,343,351 1,693,278,630 1,693,278,630 6,782,078 45,596,388 - 6,782,078 3,391,039 3,391,039 14 2038 2038-39 1,842,487,554 115,343,351 1,842,487,554 1,842,487,554 7,379,703 52,976,092 - 7,379,703 3,689,852 3,689,852 15 2039 2039-40 1,994,680,656 115,343,351 1,994,680,656 1,994,680,656 7,989,281 60,965,373 - 7,989,281 3,994,641 3,994,641 16 2040 2040-41 2,149,917,620 115,343,351 2,149,917,620 2,149,917,620 8,611,051 69,576,424 - 8,611,051 4,305,525 4,305,525 17 2041 2041-42 2,308,259,323 115,343,351 2,308,259,323 2,308,259,323 9,245,256 78,821,679 - 9,245,256 4,622,628 4,622,628 18 2042 2042-43 2,469,767,861 115,343,351 2,469,767,861 2,469,767,861 9,892,145 88,713,824 - 9,892,145 4,946,072 4,946,072 19 2043 2043-44 2,634,506,569 115,343,351 2,634,506,569 2,634,506,569 10,551,972 99,265,796 - 10,551,972 5,275,986 5,275,986 20 2044 2044-45 2,802,540,051 115,343,351 2,802,540,051 2,802,540,051 11,224,995 110,490,791 - 11,224,995 5,612,498 5,612,498 21 2045 2045-46 2,973,934,203 115,343,351 2,973,934,203 2,973,934,203 11,911,479 122,402,270 - 11,911,479 5,955,740 5,955,740 22 2046 2046-47 3,148,756,238 115,343,351 3,148,756,238 3,148,756,238 12,611,693 135,013,963 - 12,611,693 6,305,846 6,305,846 23 2047 2047-48 3,327,074,714 115,343,351 3,327,074,714 3,327,074,714 13,325,910 148,339,873 - 13,325,910 6,662,955 6,662,955 24 2048 2048-49 3,508,959,559 115,343,351 3,508,959,559 3,508,959,559 14,054,413 162,394,286 - 14,054,413 7,027,206 7,027,206 25 2049 2049-50 3,694,482,101 115,343,351 3,694,482,101 3,694,482,101 14,797,485 177,191,771 - 14,797,485 7,398,742 7,398,742 26 2050 2050-51 3,883,715,094 115,343,351 3,883,715,094 3,883,715,094 15,555,418 192,747,189 - 15,555,418 7,777,709 7,777,709 27 2051 2051-52 4,076,732,747 115,343,351 4,076,732,747 4,076,732,747 16,328,511 209,075,700 - 16,328,511 8,164,255 8,164,255 28 2052 2052-53 4,273,610,752 115,343,351 4,273,610,752 4,273,610,752 17,117,065 226,192,765 - 17,117,065 8,558,532 8,558,532 29 2053 2053-54 4,474,426,318 115,343,351 4,474,426,318 4,474,426,318 17,921,390 244,114,155 - 17,921,390 8,960,695 8,960,695 30 2054 2054-55 4,679,258,196 115,343,351 4,679,258,196 4,679,258,196 18,741,802 262,855,957 - 18,741,802 9,370,901 9,370,901 31 2055 2055-56 4,888,186,711 115,343,351 4,888,186,711 4,888,186,711 19,578,622 282,434,579 - 19,578,622 9,789,311 9,789,311 32 2056 2056-57 5,101,293,796 115,343,351 5,101,293,796 5,101,293,796 20,432,178 302,866,757 - 20,432,178 10,216,089 10,216,089 33 2057 2057-58 5,318,663,023 115,343,351 5,318,663,023 5,318,663,023 21,302,806 324,169,563 - 21,302,806 10,651,403 10,651,403 34 2058 2058-59 5,540,379,634 115,343,351 5,540,379,634 5,540,379,634 22,190,846 346,360,409 - 22,190,846 11,095,423 11,095,423 35 2059 2059-60 5,766,530,577 115,343,351 5,766,530,577 5,766,530,577 23,096,647 369,457,056 - 23,096,647 11,548,323 11,548,323 36 2060 2060-61 5,997,204,540 115,343,351 5,997,204,540 5,997,204,540 24,020,564 393,477,619 - 24,020,564 12,010,282 12,010,282 37 2061 2061-62 6,232,491,982 115,343,351 6,232,491,982 6,232,491,982 24,962,959 418,440,578 - 24,962,959 12,481,479 12,481,479 38 2062 2062-63 6,472,485,172 115,343,351 6,472,485,172 6,472,485,172 25,924,202 444,364,780 - 25,924,202 12,962,101 12,962,101 39 2063 2063-64 6,717,278,227 115,343,351 6,717,278,227 6,717,278,227 26,904,670 471,269,450 - 26,904,670 13,452,335 13,452,335 40 2064 2064-65 6,966,967,142 115,343,351 6,966,967,142 6,966,967,142 27,904,747 499,174,198 - 27,904,747 13,952,374 13,952,374 41 2065 2065-66 7,221,649,836 115,343,351 7,221,649,836 7,221,649,836 28,924,826 528,099,024 - 28,924,826 14,462,413 14,462,413 42 2066 2066-67 7,481,426,183 115,343,351 7,481,426,183 7,481,426,183 29,965,307 558,064,331 - 29,965,307 14,982,653 14,982,653 43 2067 2067-68 7,746,398,058 115,343,351 7,746,398,058 7,746,398,058 31,026,597 589,090,928 - 31,026,597 15,513,298 15,513,298 44 2068 2068-69 8,016,669,370 115,343,351 8,016,669,370 8,016,669,370 32,109,113 621,200,041 - 32,109,113 16,054,556 16,054,556 45 2069 2069-70 8,292,346,108 115,343,351 8,292,346,108 8,292,346,108 33,213,279 654,413,320 - 33,213,279 16,606,640 16,606,640 46 2070 2070-71 8,573,536,381 115,343,351 8,573,536,381 8,573,536,381 34,339,529 688,752,849 - 34,339,529 17,169,764 17,169,764 47 2071 2071-72 8,860,350,460 115,343,351 8,860,350,460 8,860,350,460 35,488,303 724,241,152 - 35,488,303 17,744,152 17,744,152 48 2072 2072-73 9,152,900,820 115,343,351 9,152,900,820 9,152,900,820 36,660,053 760,901,205 - 36,660,053 18,330,027 18,330,027 49 2073 2073-74 9,451,302,187 115,343,351 9,451,302,187 9,451,302,187 37,855,238 798,756,443 - 37,855,238 18,927,619 18,927,619 50 2074 2074-75 9,755,671,582 115,343,351 9,755,671,582 9,755,671,582 39,074,327 837,830,770 - 39,074,327 19,537,163 19,537,163
Total 5,767,167,546$ 209,180,873,399$ 837,830,770$ -$ 837,830,770$ 418,915,385$ 418,915,385$ NPV @ 6.0% 46,179,268$
Footnotes:[a] For purposes of this analysis, assumes assessed value for new construction only.[b] For purposes of this analysis, no housing set-aside has been assumed.[c] Per the Imperial County Auditor-Controller's Office. Represents a countywide average due to varying school district amounts.
• Assumes 50.0% Available IFD Allocation
• See Notes and Supporting Exhibits
Financial Feasibility Analysis 2016-05-13 - v1.0; Exh-E - RSG Live-Imp Page 14 of 332

Exhibit FSalton Sea AuthorityNew Additions to ValueScenario 1A (3.0% Loan Interest; 50.0% TI to IFD)May 13, 2016 1 2 3 4 5
Riverside County Imperial County Total Imperial CountyLandside Phase 1 Phase 2
Development Riverside andBuild Out New TCG TCG TCG TCG Imperial Counties
Year Year FY Opp Area 1, 2 & 2a Opp Area 3 Opp Area 4, 5 & 6 Opp Area 3,4,5&6 TotalExhibit Reference/FN (Ex I-15A&I-15B / Att 4) (Ex I-15A&I-15B / Att 4)
- 2016 2016-17 -$ -$ -$ -$ -$ - 2017 2017-18 - - - - - - 2018 2018-19 - - - - - - 2019 2019-20 - - - - - - 2020 2020-21 - - - - - - 2021 2021-22 - - - - - - 2022 2022-23 - - - - - - 2023 2023-24 - - - - - - 2024 2024-25 - - - - -
1 2025 2025-26 317,602,979 68,048,790 47,294,561 115,343,351 432,946,330 2 2026 2026-27 317,602,979 68,048,790 47,294,561 115,343,351 432,946,330 3 2027 2027-28 317,602,979 68,048,790 47,294,561 115,343,351 432,946,330 4 2028 2028-29 317,602,979 68,048,790 47,294,561 115,343,351 432,946,330 5 2029 2029-30 317,602,979 68,048,790 47,294,561 115,343,351 432,946,330 6 2030 2030-31 317,602,979 68,048,790 47,294,561 115,343,351 432,946,330 7 2031 2031-32 317,602,979 68,048,790 47,294,561 115,343,351 432,946,330 8 2032 2032-33 317,602,979 68,048,790 47,294,561 115,343,351 432,946,330 9 2033 2033-34 317,602,979 68,048,790 47,294,561 115,343,351 432,946,330
10 2034 2034-35 317,602,979 68,048,790 47,294,561 115,343,351 432,946,330 11 2035 2035-36 317,602,979 68,048,790 47,294,561 115,343,351 432,946,330 12 2036 2036-37 317,602,979 68,048,790 47,294,561 115,343,351 432,946,330 13 2037 2037-38 317,602,979 68,048,790 47,294,561 115,343,351 432,946,330 14 2038 2038-39 317,602,979 68,048,790 47,294,561 115,343,351 432,946,330 15 2039 2039-40 317,602,979 68,048,790 47,294,561 115,343,351 432,946,330 16 2040 2040-41 317,602,979 68,048,790 47,294,561 115,343,351 432,946,330 17 2041 2041-42 317,602,979 68,048,790 47,294,561 115,343,351 432,946,330 18 2042 2042-43 317,602,979 68,048,790 47,294,561 115,343,351 432,946,330 19 2043 2043-44 317,602,979 68,048,790 47,294,561 115,343,351 432,946,330 20 2044 2044-45 317,602,979 68,048,790 47,294,561 115,343,351 432,946,330 21 2045 2045-46 317,602,979 68,048,790 47,294,561 115,343,351 432,946,330 22 2046 2046-47 317,602,979 68,048,790 47,294,561 115,343,351 432,946,330 23 2047 2047-48 317,602,979 68,048,790 47,294,561 115,343,351 432,946,330 24 2048 2048-49 317,602,979 68,048,790 47,294,561 115,343,351 432,946,330 25 2049 2049-50 317,602,979 68,048,790 47,294,561 115,343,351 432,946,330 26 2050 2050-51 317,602,979 68,048,790 47,294,561 115,343,351 432,946,330 27 2051 2051-52 317,602,979 68,048,790 47,294,561 115,343,351 432,946,330 28 2052 2052-53 317,602,979 68,048,790 47,294,561 115,343,351 432,946,330 29 2053 2053-54 317,602,979 68,048,790 47,294,561 115,343,351 432,946,330 30 2054 2054-55 317,602,979 68,048,790 47,294,561 115,343,351 432,946,330 31 2055 2055-56 317,602,979 68,048,790 47,294,561 115,343,351 432,946,330 32 2056 2056-57 317,602,979 68,048,790 47,294,561 115,343,351 432,946,330 33 2057 2057-58 317,602,979 68,048,790 47,294,561 115,343,351 432,946,330 34 2058 2058-59 317,602,979 68,048,790 47,294,561 115,343,351 432,946,330 35 2059 2059-60 317,602,979 68,048,790 47,294,561 115,343,351 432,946,330 36 2060 2060-61 317,602,979 68,048,790 47,294,561 115,343,351 432,946,330 37 2061 2061-62 317,602,979 68,048,790 47,294,561 115,343,351 432,946,330 38 2062 2062-63 317,602,979 68,048,790 47,294,561 115,343,351 432,946,330 39 2063 2063-64 317,602,979 68,048,790 47,294,561 115,343,351 432,946,330 40 2064 2064-65 317,602,979 68,048,790 47,294,561 115,343,351 432,946,330 41 2065 2065-66 317,602,979 68,048,790 47,294,561 115,343,351 432,946,330 42 2066 2066-67 317,602,979 68,048,790 47,294,561 115,343,351 432,946,330 43 2067 2067-68 317,602,979 68,048,790 47,294,561 115,343,351 432,946,330 44 2068 2068-69 317,602,979 68,048,790 47,294,561 115,343,351 432,946,330 45 2069 2069-70 317,602,979 68,048,790 47,294,561 115,343,351 432,946,330 46 2070 2070-71 317,602,979 68,048,790 47,294,561 115,343,351 432,946,330 47 2071 2071-72 317,602,979 68,048,790 47,294,561 115,343,351 432,946,330 48 2072 2072-73 317,602,979 68,048,790 47,294,561 115,343,351 432,946,330 49 2073 2073-74 317,602,979 68,048,790 47,294,561 115,343,351 432,946,330 50 2074 2074-75 317,602,979 68,048,790 47,294,561 115,343,351 432,946,330
Total 15,880,148,952$ 3,402,439,500$ 2,364,728,046$ 5,767,167,546$ 21,647,316,498$ NPV @ 6.0% [c] 3,305,663,107$ 708,262,798$ 492,249,429$ 1,200,512,227$ 4,506,175,334$
Phase 3
\\192.168.1.12\data files\RCL\SSA\TI Model\Financial Feasibility Analysis 2016-05-13 - v1.0 | Exh F- New Constr Timing - AV Page 15 of 332

Exhibit GSalton Sea AuthorityNew Construction - ResidentialScenario 1A (3.0% Loan Interest; 50.0% TI to IFD)May 13, 2016 1 2 3 4 5
Riverside County Imperial County Total Imperial CountyLandside Phase 1 Phase 2 Phase 3
Development Riverside andBuild Out New TCG TCG TCG TCG Imperial Counties
Year Year FY Opp Area 1, 2 & 2A Opp Area 3 Opp Area 4,5 & 6 Opp Area 3,4,5 & 6 TotalExhibit Reference/FN (Ex I-15A&I-15B / Att 4) (Ex I-15A&I-15B / Att 4)
- 2016 2016-17 - - - - 2017 2017-18 - - - - 2018 2018-19 - - - - - - 2019 2019-20 - - - - - - 2020 2020-21 - - - - - - 2021 2021-22 - - - - - - 2022 2022-23 - - - - - - 2023 2023-24 - - - - - - 2024 2024-25 - - - - -
1 2025 2025-26 1,035 240 200 440 1,475 2 2026 2026-27 1,035 240 200 440 1,475 3 2027 2027-28 1,035 240 200 440 1,475 4 2028 2028-29 1,035 240 200 440 1,475 5 2029 2029-30 1,035 240 200 440 1,475 6 2030 2030-31 1,035 240 200 440 1,475 7 2031 2031-32 1,035 240 200 440 1,475 8 2032 2032-33 1,035 240 200 440 1,475 9 2033 2033-34 1,035 240 200 440 1,475
10 2034 2034-35 1,035 240 200 440 1,475 11 2035 2035-36 1,035 240 200 440 1,475 12 2036 2036-37 1,035 240 200 440 1,475 13 2037 2037-38 1,035 240 200 440 1,475 14 2038 2038-39 1,035 240 200 440 1,475 15 2039 2039-40 1,035 240 200 440 1,475 16 2040 2040-41 1,035 240 200 440 1,475 17 2041 2041-42 1,035 240 200 440 1,475 18 2042 2042-43 1,035 240 200 440 1,475 19 2043 2043-44 1,035 240 200 440 1,475 20 2044 2044-45 1,035 240 200 440 1,475 21 2045 2045-46 1,035 240 200 440 1,475 22 2046 2046-47 1,035 240 200 440 1,475 23 2047 2047-48 1,035 240 200 440 1,475 24 2048 2048-49 1,035 240 200 440 1,475 25 2049 2049-50 1,035 240 200 440 1,475 26 2050 2050-51 1,035 240 200 440 1,475 27 2051 2051-52 1,035 240 200 440 1,475 28 2052 2052-53 1,035 240 200 440 1,475 29 2053 2053-54 1,035 240 200 440 1,475 30 2054 2054-55 1,035 240 200 440 1,475 31 2055 2055-56 1,035 240 200 440 1,475 32 2056 2056-57 1,035 240 200 440 1,475 33 2057 2057-58 1,035 240 200 440 1,475 34 2058 2058-59 1,035 240 200 440 1,475 35 2059 2059-60 1,035 240 200 440 1,475 36 2060 2060-61 1,035 240 200 440 1,475 37 2061 2061-62 1,035 240 200 440 1,475 38 2062 2062-63 1,035 240 200 440 1,475 39 2063 2063-64 1,035 240 200 440 1,475 40 2064 2064-65 1,035 240 200 440 1,475 41 2065 2065-66 1,035 240 200 440 1,475 42 2066 2066-67 1,035 240 200 440 1,475 43 2067 2067-68 1,035 240 200 440 1,475 44 2068 2068-69 1,035 240 200 440 1,475 45 2069 2069-70 1,035 240 200 440 1,475 46 2070 2070-71 1,035 240 200 440 1,475 47 2071 2071-72 1,035 240 200 440 1,475 48 2072 2072-73 1,035 240 200 440 1,475 49 2073 2073-74 1,035 240 200 440 1,475 50 2074 2074-75 1,035 240 200 440 1,475
Subtotal 51,750 12,000 10,000 22,000 73,750 Remaining Supply 59,810 8,486 7,554 16,040 75,850 Total TCG 2016 Supply 111,560 20,486 17,554 38,040 149,600
\\192.168.1.12\data files\RCL\SSA\TI Model\Financial Feasibility Analysis 2016-05-13 - v1.0 | Exh G - New Constr Timing - Res Page 16 of 332

Exhibit HSalton Sea AuthorityNew Construction - Non ResidentialScenario 1A (3.0% Loan Interest; 50.0% TI to IFD)May 13, 2016 1 2 3 4 5
Riverside County Imperial County Total Imperial CountyLandside Phase 1 Phase 2
Development Riverside andBuild Out New TCG TCG TCG TCG Imperial County
Year Year FY Opp Area 1, 2 & 2A Opp Area 3 Opp Area 4 & 5 Opp Area 3,4,5 & 6 TotalExhibit Reference/FN (Ex I-15A&I-15B / Att 4) (Ex I-15A&I-15B / Att 4)
- 2016 2016-17 - - - - 2017 2017-18 - - - - 2018 2018-19 - - - - - - 2019 2019-20 - - - - - - 2020 2020-21 - - - - - - 2021 2021-22 - - - - - - 2022 2022-23 - - - - - - 2023 2023-24 - - - - - - 2024 2024-25 - - - - -
1 2025 2025-26 227,000 30,550 22,650 53,200 280,200 2 2026 2026-27 227,000 30,550 22,650 53,200 280,200 3 2027 2027-28 227,000 30,550 22,650 53,200 280,200 4 2028 2028-29 227,000 30,550 22,650 53,200 280,200 5 2029 2029-30 227,000 30,550 22,650 53,200 280,200 6 2030 2030-31 227,000 30,550 22,650 53,200 280,200 7 2031 2031-32 227,000 30,550 22,650 53,200 280,200 8 2032 2032-33 227,000 30,550 22,650 53,200 280,200 9 2033 2033-34 227,000 30,550 22,650 53,200 280,200
10 2034 2034-35 227,000 30,550 22,650 53,200 280,200 11 2035 2035-36 227,000 30,550 22,650 53,200 280,200 12 2036 2036-37 227,000 30,550 22,650 53,200 280,200 13 2037 2037-38 227,000 30,550 22,650 53,200 280,200 14 2038 2038-39 227,000 30,550 22,650 53,200 280,200 15 2039 2039-40 227,000 30,550 22,650 53,200 280,200 16 2040 2040-41 227,000 30,550 22,650 53,200 280,200 17 2041 2041-42 227,000 30,550 22,650 53,200 280,200 18 2042 2042-43 227,000 30,550 22,650 53,200 280,200 19 2043 2043-44 227,000 30,550 22,650 53,200 280,200 20 2044 2044-45 227,000 30,550 22,650 53,200 280,200 21 2045 2045-46 227,000 30,550 22,650 53,200 280,200 22 2046 2046-47 227,000 30,550 22,650 53,200 280,200 23 2047 2047-48 227,000 30,550 22,650 53,200 280,200 24 2048 2048-49 227,000 30,550 22,650 53,200 280,200 25 2049 2049-50 227,000 30,550 22,650 53,200 280,200 26 2050 2050-51 227,000 30,550 22,650 53,200 280,200 27 2051 2051-52 227,000 30,550 22,650 53,200 280,200 28 2052 2052-53 227,000 30,550 22,650 53,200 280,200 29 2053 2053-54 227,000 30,550 22,650 53,200 280,200 30 2054 2054-55 227,000 30,550 22,650 53,200 280,200 31 2055 2055-56 227,000 30,550 22,650 53,200 280,200 32 2056 2056-57 227,000 30,550 22,650 53,200 280,200 33 2057 2057-58 227,000 30,550 22,650 53,200 280,200 34 2058 2058-59 227,000 30,550 22,650 53,200 280,200 35 2059 2059-60 227,000 30,550 22,650 53,200 280,200 36 2060 2060-61 227,000 30,550 22,650 53,200 280,200 37 2061 2061-62 227,000 30,550 22,650 53,200 280,200 38 2062 2062-63 227,000 30,550 22,650 53,200 280,200 39 2063 2063-64 227,000 30,550 22,650 53,200 280,200 40 2064 2064-65 227,000 30,550 22,650 53,200 280,200 41 2065 2065-66 227,000 30,550 22,650 53,200 280,200 42 2066 2066-67 227,000 30,550 22,650 53,200 280,200 43 2067 2067-68 227,000 30,550 22,650 53,200 280,200 44 2068 2068-69 227,000 30,550 22,650 53,200 280,200 45 2069 2069-70 227,000 30,550 22,650 53,200 280,200 46 2070 2070-71 227,000 30,550 22,650 53,200 280,200 47 2071 2071-72 227,000 30,550 22,650 53,200 280,200 48 2072 2072-73 227,000 30,550 22,650 53,200 280,200 49 2073 2073-74 227,000 30,550 22,650 53,200 280,200 50 2074 2074-75 227,000 30,550 22,650 53,200 280,200
Subtotal 11,350,000 1,527,500 1,132,500 2,660,000 14,010,000 Remaining Supply 27,475,017 5,369,107 1,037,767 6,406,874 33,881,891 Total TCG 2016 Supply 38,825,017 6,896,607 2,170,267 9,066,874 47,891,891
Phase 3
\\192.168.1.12\data files\RCL\SSA\TI Model\Financial Feasibility Analysis 2016-05-13 - v1.0 | Ex H New Const Timing - Non Res Page 17 of 332

Exhibit I - RiversideSalton Sea AuthorityTCG Development Projections - RiversideScenario 1A (3.0% Loan Interest; 50.0% TI to IFD)May 13, 2016
Phase 1Landside New Construction - Opportunity Areas 1 & 2 New Construction - Opportunity Area 2a (Additional County Area)
Development Assessed Total Assessed Total Subtotal Assessed Total Assessed Total Subtotal TotalBuild Out New Non Res Value Non Res Residential Value Residential Res & Non Res Non Res Value Non Res Residential Value Residential Res & Non Res Res & Non Res
Year Year FY Sq.Ft per Sq.Ft. Assessed Value Units Per Unit Assessed Value Assessed Value Sq.Ft per Sq.Ft. Assessed Value Units Per Unit Assessed Value Assessed Value Assessed ValueExhibit Reference/FN Appendix 4 (Ex I-15A) Appendix 4 (Ex I-15A) Appendix 4 (Ex I-15A) Appendix 4 (Ex I-15A)
0 2016 2016-17 - 168$ -$ - 270,001$ -$ -$ - 168$ -$ - 270,001$ -$ -$ -$ 0 2017 2017-18 - 168 - - 270,001 - - - 168 - - 270,001 - - - 0 2018 2018-19 - 168 - - 270,001 - - - 168 - - 270,001 - - - 0 2019 2019-20 - 168 - - 270,001 - - - 168 - - 270,001 - - - 0 2020 2020-21 - 168 - - 270,001 - - - 168 - - 270,001 - - - 0 2021 2021-22 - 168 - - 270,001 - - - 168 - - 270,001 - - - 0 2022 2022-23 - 168 - - 270,001 - - - 168 - - 270,001 - - - 0 2023 2023-24 - 168 - - 270,001 - - - 168 - - 270,001 - - - 0 2024 2024-25 - 168 - - 270,001 - - - 168 - - 270,001 - - - 1 2025 2025-26 15,890 168 2,670,670 72 270,001 19,561,538 22,232,209 211,110 168 35,481,765 963 270,001 259,889,005 295,370,771 317,602,979 2 2026 2026-27 15,890 168 2,670,670 72 270,001 19,561,538 22,232,209 211,110 168 35,481,765 963 270,001 259,889,005 295,370,771 317,602,979 3 2027 2027-28 15,890 168 2,670,670 72 270,001 19,561,538 22,232,209 211,110 168 35,481,765 963 270,001 259,889,005 295,370,771 317,602,979 4 2028 2028-29 15,890 168 2,670,670 72 270,001 19,561,538 22,232,209 211,110 168 35,481,765 963 270,001 259,889,005 295,370,771 317,602,979 5 2029 2029-30 15,890 168 2,670,670 72 270,001 19,561,538 22,232,209 211,110 168 35,481,765 963 270,001 259,889,005 295,370,771 317,602,979 6 2030 2030-31 22,700 168 3,815,244 104 270,001 27,945,054 31,760,298 204,300 168 34,337,192 932 270,001 251,505,489 285,842,681 317,602,979 7 2031 2031-32 22,700 168 3,815,244 104 270,001 27,945,054 31,760,298 204,300 168 34,337,192 932 270,001 251,505,489 285,842,681 317,602,979 8 2032 2032-33 22,700 168 3,815,244 104 270,001 27,945,054 31,760,298 204,300 168 34,337,192 932 270,001 251,505,489 285,842,681 317,602,979 9 2033 2033-34 22,700 168 3,815,244 104 270,001 27,945,054 31,760,298 204,300 168 34,337,192 932 270,001 251,505,489 285,842,681 317,602,979
10 2034 2034-35 22,700 168 3,815,244 104 270,001 27,945,054 31,760,298 204,300 168 34,337,192 932 270,001 251,505,489 285,842,681 317,602,979 11 2035 2035-36 45,400 168 7,630,487 207 270,001 55,890,109 63,520,596 181,600 168 30,521,949 828 270,001 223,560,435 254,082,383 317,602,979 12 2036 2036-37 45,400 168 7,630,487 207 270,001 55,890,109 63,520,596 181,600 168 30,521,949 828 270,001 223,560,435 254,082,383 317,602,979 13 2037 2037-38 45,400 168 7,630,487 207 270,001 55,890,109 63,520,596 181,600 168 30,521,949 828 270,001 223,560,435 254,082,383 317,602,979 14 2038 2038-39 45,400 168 7,630,487 207 270,001 55,890,109 63,520,596 181,600 168 30,521,949 828 270,001 223,560,435 254,082,383 317,602,979 15 2039 2039-40 45,400 168 7,630,487 207 270,001 55,890,109 63,520,596 181,600 168 30,521,949 828 270,001 223,560,435 254,082,383 317,602,979 16 2040 2040-41 56,750 168 9,538,109 259 270,001 69,862,636 79,400,745 170,250 168 28,614,327 776 270,001 209,587,908 238,202,234 317,602,979 17 2041 2041-42 56,750 168 9,538,109 259 270,001 69,862,636 79,400,745 170,250 168 28,614,327 776 270,001 209,587,908 238,202,234 317,602,979 18 2042 2042-43 56,750 168 9,538,109 259 270,001 69,862,636 79,400,745 170,250 168 28,614,327 776 270,001 209,587,908 238,202,234 317,602,979 19 2043 2043-44 56,750 168 9,538,109 259 270,001 69,862,636 79,400,745 170,250 168 28,614,327 776 270,001 209,587,908 238,202,234 317,602,979 20 2044 2044-45 56,750 168 9,538,109 259 270,001 69,862,636 79,400,745 170,250 168 28,614,327 776 270,001 209,587,908 238,202,234 317,602,979 21 2045 2045-46 68,100 168 11,445,731 311 270,001 83,835,163 95,280,894 158,900 168 26,706,705 725 270,001 195,615,380 222,322,085 317,602,979 22 2046 2046-47 68,100 168 11,445,731 311 270,001 83,835,163 95,280,894 158,900 168 26,706,705 725 270,001 195,615,380 222,322,085 317,602,979 23 2047 2047-48 68,100 168 11,445,731 311 270,001 83,835,163 95,280,894 158,900 168 26,706,705 725 270,001 195,615,380 222,322,085 317,602,979 24 2048 2048-49 68,100 168 11,445,731 311 270,001 83,835,163 95,280,894 158,900 168 26,706,705 725 270,001 195,615,380 222,322,085 317,602,979 25 2049 2049-50 68,100 168 11,445,731 311 270,001 83,835,163 95,280,894 158,900 168 26,706,705 725 270,001 195,615,380 222,322,085 317,602,979 26 2050 2050-51 79,450 168 13,353,352 362 270,001 97,807,690 111,161,043 147,550 168 24,799,083 673 270,001 181,642,853 206,441,936 317,602,979 27 2051 2051-52 79,450 168 13,353,352 362 270,001 97,807,690 111,161,043 147,550 168 24,799,083 673 270,001 181,642,853 206,441,936 317,602,979 28 2052 2052-53 79,450 168 13,353,352 362 270,001 97,807,690 111,161,043 147,550 168 24,799,083 673 270,001 181,642,853 206,441,936 317,602,979 29 2053 2053-54 79,450 168 13,353,352 362 270,001 97,807,690 111,161,043 147,550 168 24,799,083 673 270,001 181,642,853 206,441,936 317,602,979 30 2054 2054-55 79,450 168 13,353,352 362 270,001 97,807,690 111,161,043 147,550 168 24,799,083 673 270,001 181,642,853 206,441,936 317,602,979 31 2055 2055-56 90,800 168 15,260,974 414 270,001 111,780,217 127,041,192 136,200 168 22,891,461 621 270,001 167,670,326 190,561,787 317,602,979 32 2056 2056-57 90,800 168 15,260,974 414 270,001 111,780,217 127,041,192 136,200 168 22,891,461 621 270,001 167,670,326 190,561,787 317,602,979 33 2057 2057-58 90,800 168 15,260,974 414 270,001 111,780,217 127,041,192 136,200 168 22,891,461 621 270,001 167,670,326 190,561,787 317,602,979 34 2058 2058-59 90,800 168 15,260,974 414 270,001 111,780,217 127,041,192 136,200 168 22,891,461 621 270,001 167,670,326 190,561,787 317,602,979 35 2059 2059-60 90,800 168 15,260,974 414 270,001 111,780,217 127,041,192 136,200 168 22,891,461 621 270,001 167,670,326 190,561,787 317,602,979 36 2060 2060-61 102,150 168 17,168,596 466 270,001 125,752,745 142,921,341 124,850 168 20,983,840 569 270,001 153,697,799 174,681,638 317,602,979 37 2061 2061-62 102,150 168 17,168,596 466 270,001 125,752,745 142,921,341 124,850 168 20,983,840 569 270,001 153,697,799 174,681,638 317,602,979 38 2062 2062-63 102,150 168 17,168,596 466 270,001 125,752,745 142,921,341 124,850 168 20,983,840 569 270,001 153,697,799 174,681,638 317,602,979 39 2063 2063-64 102,150 168 17,168,596 466 270,001 125,752,745 142,921,341 124,850 168 20,983,840 569 270,001 153,697,799 174,681,638 317,602,979 40 2064 2064-65 102,150 168 17,168,596 466 270,001 125,752,745 142,921,341 124,850 168 20,983,840 569 270,001 153,697,799 174,681,638 317,602,979 41 2065 2065-66 102,150 168 17,168,596 466 270,001 125,752,745 142,921,341 124,850 168 20,983,840 569 270,001 153,697,799 174,681,638 317,602,979 42 2066 2066-67 102,150 168 17,168,596 466 270,001 125,752,745 142,921,341 124,850 168 20,983,840 569 270,001 153,697,799 174,681,638 317,602,979 43 2067 2067-68 102,150 168 17,168,596 466 270,001 125,752,745 142,921,341 124,850 168 20,983,840 569 270,001 153,697,799 174,681,638 317,602,979 44 2068 2068-69 102,150 168 17,168,596 466 270,001 125,752,745 142,921,341 124,850 168 20,983,840 569 270,001 153,697,799 174,681,638 317,602,979 45 2069 2069-70 102,150 168 17,168,596 466 270,001 125,752,745 142,921,341 124,850 168 20,983,840 569 270,001 153,697,799 174,681,638 317,602,979 46 2070 2070-71 102,150 168 17,168,596 466 270,001 125,752,745 142,921,341 124,850 168 20,983,840 569 270,001 153,697,799 174,681,638 317,602,979 47 2071 2071-72 102,150 168 17,168,596 466 270,001 125,752,745 142,921,341 124,850 168 20,983,840 569 270,001 153,697,799 174,681,638 317,602,979 48 2072 2072-73 102,150 168 17,168,596 466 270,001 125,752,745 142,921,341 124,850 168 20,983,840 569 270,001 153,697,799 174,681,638 317,602,979 49 2073 2073-74 102,150 168 17,168,596 466 270,001 125,752,745 142,921,341 124,850 168 20,983,840 569 270,001 153,697,799 174,681,638 317,602,979 50 2074 2074-75 102,150 168 17,168,596 466 270,001 125,752,745 142,921,341 124,850 168 20,983,840 569 270,001 153,697,799 174,681,638 317,602,979
Subtotal/Wtd Avg. 3,427,700 168$ 576,101,779$ 15,629 270,001$ 4,219,703,205$ 4,795,804,983$ 7,922,300 168$ 1,331,520,005$ 36,122 270,001$ 9,752,823,963$ 11,084,343,968$ 15,880,148,952$ Remaining Supply 13,602,701 168 2,286,238,656 34,387 270,001 9,284,373,053 11,570,611,708 13,872,316 168 2,331,553,497 25,424 270,001 6,864,358,347 9,195,911,844 20,766,523,553 Total TCG 2016 Supply 17,030,401 168$ 2,862,340,435$ 50,015 270,001$ 13,504,076,257$ 16,366,416,692$ 21,794,616 168 3,663,073,502$ 61,545 270,001$ 16,617,182,311$ 20,280,255,813$ 36,646,672,505$
Financial Feasibility Analysis 2016-05-13 - v1.0; Exh I TCG Value Addts - Riv; WDL Page 18 of 332

Exhibit I - ImperialSalton Sea AuthorityTCG Development Projections - ImperialScenario 1A (3.0% Loan Interest; 50.0% TI to IFD)May 13, 2016
Phase 2 Phase 3Landside New Construction - Opportunity Areas 3 New Construction - Opportunity Areas 4, 5, & 6
Development Assessed Total Assessed Total Subtotal Assessed Total Assessed Total Subtotal TotalBuild Out New Non Res Value Non Res Residential Value Residential Res & Non Res Non Res Value Non Res Residential Value Residential Res & Non Res Res & Non Res
Year Year FY Sq.Ft per Sq.Ft. Assessed Value Units Per Unit Assessed Value Assessed Value Sq.Ft per Sq.Ft. Assessed Value Units Per Unit Assessed Value Assessed Value Assessed ValueExhibit Reference/FN Appendix 4 (Ex I-15B) Appendix 4 (Ex I-15B) Appendix 4 (Ex I-15B) Appendix 4 (Ex I-15B)
0 2016 2016-17 - 201$ -$ - 257,951$ -$ -$ - $165 -$ - $217,782 -$ -$ -$ 0 2017 2017-18 - 201 - - 257,951 - - - 165 - - 217,782 - - - 0 2018 2018-19 - 201 - - 257,951 - - - 165 - - 217,782 - - - 0 2019 2019-20 - 201 - - 257,951 - - - 165 - - 217,782 - - - 0 2020 2020-21 - 201 - - 257,951 - - - 165 - - 217,782 - - - 0 2021 2021-22 - 201 - - 257,951 - - - 165 - - 217,782 - - - 0 2022 2022-23 - 201 - - 257,951 - - - 165 - - 217,782 - - - 0 2023 2023-24 - 201 - - 257,951 - - - 165 - - 217,782 - - - 0 2024 2024-25 - 201 - - 257,951 - - - 165 - - 217,782 - - - 1 2025 2025-26 30,550 201 6,140,550 240 257,951 61,908,240 68,048,790 22,650 165 3,738,170 200 217,782 43,556,391 47,294,561 115,343,351 2 2026 2026-27 30,550 201 6,140,550 240 257,951 61,908,240 68,048,790 22,650 165 3,738,170 200 217,782 43,556,391 47,294,561 115,343,351 3 2027 2027-28 30,550 201 6,140,550 240 257,951 61,908,240 68,048,790 22,650 165 3,738,170 200 217,782 43,556,391 47,294,561 115,343,351 4 2028 2028-29 30,550 201 6,140,550 240 257,951 61,908,240 68,048,790 22,650 165 3,738,170 200 217,782 43,556,391 47,294,561 115,343,351 5 2029 2029-30 30,550 201 6,140,550 240 257,951 61,908,240 68,048,790 22,650 165 3,738,170 200 217,782 43,556,391 47,294,561 115,343,351 6 2030 2030-31 30,550 201 6,140,550 240 257,951 61,908,240 68,048,790 22,650 165 3,738,170 200 217,782 43,556,391 47,294,561 115,343,351 7 2031 2031-32 30,550 201 6,140,550 240 257,951 61,908,240 68,048,790 22,650 165 3,738,170 200 217,782 43,556,391 47,294,561 115,343,351 8 2032 2032-33 30,550 201 6,140,550 240 257,951 61,908,240 68,048,790 22,650 165 3,738,170 200 217,782 43,556,391 47,294,561 115,343,351 9 2033 2033-34 30,550 201 6,140,550 240 257,951 61,908,240 68,048,790 22,650 165 3,738,170 200 217,782 43,556,391 47,294,561 115,343,351
10 2034 2034-35 30,550 201 6,140,550 240 257,951 61,908,240 68,048,790 22,650 165 3,738,170 200 217,782 43,556,391 47,294,561 115,343,351 11 2035 2035-36 30,550 201 6,140,550 240 257,951 61,908,240 68,048,790 22,650 165 3,738,170 200 217,782 43,556,391 47,294,561 115,343,351 12 2036 2036-37 30,550 201 6,140,550 240 257,951 61,908,240 68,048,790 22,650 165 3,738,170 200 217,782 43,556,391 47,294,561 115,343,351 13 2037 2037-38 30,550 201 6,140,550 240 257,951 61,908,240 68,048,790 22,650 165 3,738,170 200 217,782 43,556,391 47,294,561 115,343,351 14 2038 2038-39 30,550 201 6,140,550 240 257,951 61,908,240 68,048,790 22,650 165 3,738,170 200 217,782 43,556,391 47,294,561 115,343,351 15 2039 2039-40 30,550 201 6,140,550 240 257,951 61,908,240 68,048,790 22,650 165 3,738,170 200 217,782 43,556,391 47,294,561 115,343,351 16 2040 2040-41 30,550 201 6,140,550 240 257,951 61,908,240 68,048,790 22,650 165 3,738,170 200 217,782 43,556,391 47,294,561 115,343,351 17 2041 2041-42 30,550 201 6,140,550 240 257,951 61,908,240 68,048,790 22,650 165 3,738,170 200 217,782 43,556,391 47,294,561 115,343,351 18 2042 2042-43 30,550 201 6,140,550 240 257,951 61,908,240 68,048,790 22,650 165 3,738,170 200 217,782 43,556,391 47,294,561 115,343,351 19 2043 2043-44 30,550 201 6,140,550 240 257,951 61,908,240 68,048,790 22,650 165 3,738,170 200 217,782 43,556,391 47,294,561 115,343,351 20 2044 2044-45 30,550 201 6,140,550 240 257,951 61,908,240 68,048,790 22,650 165 3,738,170 200 217,782 43,556,391 47,294,561 115,343,351 21 2045 2045-46 30,550 201 6,140,550 240 257,951 61,908,240 68,048,790 22,650 165 3,738,170 200 217,782 43,556,391 47,294,561 115,343,351 22 2046 2046-47 30,550 201 6,140,550 240 257,951 61,908,240 68,048,790 22,650 165 3,738,170 200 217,782 43,556,391 47,294,561 115,343,351 23 2047 2047-48 30,550 201 6,140,550 240 257,951 61,908,240 68,048,790 22,650 165 3,738,170 200 217,782 43,556,391 47,294,561 115,343,351 24 2048 2048-49 30,550 201 6,140,550 240 257,951 61,908,240 68,048,790 22,650 165 3,738,170 200 217,782 43,556,391 47,294,561 115,343,351 25 2049 2049-50 30,550 201 6,140,550 240 257,951 61,908,240 68,048,790 22,650 165 3,738,170 200 217,782 43,556,391 47,294,561 115,343,351 26 2050 2050-51 30,550 201 6,140,550 240 257,951 61,908,240 68,048,790 22,650 165 3,738,170 200 217,782 43,556,391 47,294,561 115,343,351 27 2051 2051-52 30,550 201 6,140,550 240 257,951 61,908,240 68,048,790 22,650 165 3,738,170 200 217,782 43,556,391 47,294,561 115,343,351 28 2052 2052-53 30,550 201 6,140,550 240 257,951 61,908,240 68,048,790 22,650 165 3,738,170 200 217,782 43,556,391 47,294,561 115,343,351 29 2053 2053-54 30,550 201 6,140,550 240 257,951 61,908,240 68,048,790 22,650 165 3,738,170 200 217,782 43,556,391 47,294,561 115,343,351 30 2054 2054-55 30,550 201 6,140,550 240 257,951 61,908,240 68,048,790 22,650 165 3,738,170 200 217,782 43,556,391 47,294,561 115,343,351 31 2055 2055-56 30,550 201 6,140,550 240 257,951 61,908,240 68,048,790 22,650 165 3,738,170 200 217,782 43,556,391 47,294,561 115,343,351 32 2056 2056-57 30,550 201 6,140,550 240 257,951 61,908,240 68,048,790 22,650 165 3,738,170 200 217,782 43,556,391 47,294,561 115,343,351 33 2057 2057-58 30,550 201 6,140,550 240 257,951 61,908,240 68,048,790 22,650 165 3,738,170 200 217,782 43,556,391 47,294,561 115,343,351 34 2058 2058-59 30,550 201 6,140,550 240 257,951 61,908,240 68,048,790 22,650 165 3,738,170 200 217,782 43,556,391 47,294,561 115,343,351 35 2059 2059-60 30,550 201 6,140,550 240 257,951 61,908,240 68,048,790 22,650 165 3,738,170 200 217,782 43,556,391 47,294,561 115,343,351 36 2060 2060-61 30,550 201 6,140,550 240 257,951 61,908,240 68,048,790 22,650 165 3,738,170 200 217,782 43,556,391 47,294,561 115,343,351 37 2061 2061-62 30,550 201 6,140,550 240 257,951 61,908,240 68,048,790 22,650 165 3,738,170 200 217,782 43,556,391 47,294,561 115,343,351 38 2062 2062-63 30,550 201 6,140,550 240 257,951 61,908,240 68,048,790 22,650 165 3,738,170 200 217,782 43,556,391 47,294,561 115,343,351 39 2063 2063-64 30,550 201 6,140,550 240 257,951 61,908,240 68,048,790 22,650 165 3,738,170 200 217,782 43,556,391 47,294,561 115,343,351 40 2064 2064-65 30,550 201 6,140,550 240 257,951 61,908,240 68,048,790 22,650 165 3,738,170 200 217,782 43,556,391 47,294,561 115,343,351 41 2065 2065-66 30,550 201 6,140,550 240 257,951 61,908,240 68,048,790 22,650 165 3,738,170 200 217,782 43,556,391 47,294,561 115,343,351 42 2066 2066-67 30,550 201 6,140,550 240 257,951 61,908,240 68,048,790 22,650 165 3,738,170 200 217,782 43,556,391 47,294,561 115,343,351 43 2067 2067-68 30,550 201 6,140,550 240 257,951 61,908,240 68,048,790 22,650 165 3,738,170 200 217,782 43,556,391 47,294,561 115,343,351 44 2068 2068-69 30,550 201 6,140,550 240 257,951 61,908,240 68,048,790 22,650 165 3,738,170 200 217,782 43,556,391 47,294,561 115,343,351 45 2069 2069-70 30,550 201 6,140,550 240 257,951 61,908,240 68,048,790 22,650 165 3,738,170 200 217,782 43,556,391 47,294,561 115,343,351 46 2070 2070-71 30,550 201 6,140,550 240 257,951 61,908,240 68,048,790 22,650 165 3,738,170 200 217,782 43,556,391 47,294,561 115,343,351 47 2071 2071-72 30,550 201 6,140,550 240 257,951 61,908,240 68,048,790 22,650 165 3,738,170 200 217,782 43,556,391 47,294,561 115,343,351 48 2072 2072-73 30,550 201 6,140,550 240 257,951 61,908,240 68,048,790 22,650 165 3,738,170 200 217,782 43,556,391 47,294,561 115,343,351 49 2073 2073-74 30,550 201 6,140,550 240 257,951 61,908,240 68,048,790 22,650 165 3,738,170 200 217,782 43,556,391 47,294,561 115,343,351 50 2074 2074-75 30,550 201 6,140,550 240 257,951 61,908,240 68,048,790 22,650 165 3,738,170 200 217,782 43,556,391 47,294,561 115,343,351
Subtotal/Wtd Avg. 1,527,500 201$ 307,027,500$ 12,000 257,951$ 3,095,412,000$ 3,402,439,500$ 1,132,500 165$ 186,908,497$ 10,000 217,782$ 2,177,819,549$ 2,364,728,046$ 5,767,167,546$ Remaining Supply 5,369,107 201 1,079,190,507 8,486 257,951 2,188,972,186 3,268,162,693 43,197,217 165 7,129,295,277 98,539 217,782 21,460,016,053 28,589,311,329 31,857,474,022 Total TCG 2016 Supply 6,896,607 201 1,386,218,007 20,486 257,951 5,284,384,186 6,670,602,193$ 44,329,717 165 7,316,203,774 108,539 217,782 23,637,835,602 30,954,039,375$ 37,624,641,568$
Financial Feasibility Analysis 2016-05-13 - v1.0; Exh I TCG Value Addts - Imp; WDL Page 19 of 332

Exhibit J Salton Sea AuthorityCalculation of Sales Tax RevenuesScenario 1A (3.0% Loan Interest; 50.0% TI to IFD)May 13, 2016
Landside Riverside County - Sales Imperial County - Sales Total
Development Sales
Build Out New Phase I Phase 2 & 3 Sales Tax Tax Alloc.
Year Year FY Opp Area 1, 2 & 2A Opp Area 3,4,5 & 6 Sales @ 1.00% @ 100.00%
Exhibit Reference/FN App. 2 (Ex 3A-3C) App. 2 (Ex 3A-3C)
29,400,600,078$ 9,936,508,406$ 39,337,108,484$ 393,371,085$ 393,371,085$
0 2016 2016-17 -$ -$ -$ -$ -$ 0 2017 2017-18 - - - - - 0 2018 2018-19 - - - - - 0 2019 2019-20 - - - - - 0 2020 2020-21 - - - - - 0 2021 2021-22 - - - - - 0 2022 2022-23 11,478,547 2,911,774 14,390,321 143,903 143,903 0 2023 2023-24 27,240,164 6,794,237 34,034,401 340,344 340,344 0 2024 2024-25 48,340,150 12,128,581 60,468,731 604,687 604,687 1 2025 2025-26 73,505,341 18,256,706 91,762,048 917,620 917,620 2 2026 2026-27 92,346,944 22,775,018 115,121,962 1,151,220 1,151,220 3 2027 2027-28 114,465,058 28,039,527 142,504,585 1,425,046 1,425,046 4 2028 2028-29 140,456,901 34,177,529 174,634,430 1,746,344 1,746,344 5 2029 2029-30 171,554,008 41,451,209 213,005,217 2,130,052 2,130,052 6 2030 2030-31 198,534,431 48,005,747 246,540,179 2,465,402 2,465,402 7 2031 2031-32 229,355,140 56,635,429 285,990,569 2,859,906 2,859,906 8 2032 2032-33 262,412,132 66,001,269 328,413,401 3,284,134 3,284,134 9 2033 2033-34 298,308,924 76,246,462 374,555,386 3,745,554 3,745,554
10 2034 2034-35 333,891,460 86,546,998 420,438,458 4,204,385 4,204,385 11 2035 2035-36 369,964,217 97,158,454 467,122,671 4,671,227 4,671,227 12 2036 2036-37 407,828,999 108,433,619 516,262,618 5,162,626 5,162,626 13 2037 2037-38 448,373,425 120,551,711 568,925,136 5,689,251 5,689,251 14 2038 2038-39 490,999,335 133,379,185 624,378,520 6,243,785 6,243,785 15 2039 2039-40 518,098,343 141,111,520 659,209,863 6,592,099 6,592,099 16 2040 2040-41 544,764,703 149,146,307 693,911,010 6,939,110 6,939,110 17 2041 2041-42 572,301,970 156,757,231 729,059,200 7,290,592 7,290,592 18 2042 2042-43 600,354,723 164,443,094 764,797,817 7,647,978 7,647,978 19 2043 2043-44 616,429,638 172,204,468 788,634,106 7,886,341 7,886,341 20 2044 2044-45 632,749,299 180,041,930 812,791,229 8,127,912 8,127,912 21 2045 2045-46 643,903,764 187,956,062 831,859,826 8,318,598 8,318,598 22 2046 2046-47 654,627,156 195,946,201 850,573,357 8,505,734 8,505,734 23 2047 2047-48 665,399,702 204,014,161 869,413,863 8,694,139 8,694,139 24 2048 2048-49 676,221,772 212,160,532 888,382,304 8,883,823 8,883,823 25 2049 2049-50 687,093,738 220,385,913 907,479,651 9,074,797 9,074,797 26 2050 2050-51 698,015,975 228,690,904 926,706,879 9,267,069 9,267,069 27 2051 2051-52 707,269,421 236,706,674 943,976,095 9,439,761 9,439,761 28 2052 2052-53 716,551,688 244,777,698 961,329,386 9,613,294 9,613,294 29 2053 2053-54 725,863,010 252,904,271 978,767,282 9,787,673 9,787,673 30 2054 2054-55 735,203,623 261,086,692 996,290,315 9,962,903 9,962,903 31 2055 2055-56 744,573,765 269,325,258 1,013,899,022 10,138,990 10,138,990 32 2056 2056-57 749,075,578 273,579,763 1,022,655,341 10,226,553 10,226,553 33 2057 2057-58 753,586,141 277,851,855 1,031,437,996 10,314,380 10,314,380 34 2058 2058-59 758,105,567 282,141,591 1,040,247,158 10,402,472 10,402,472 35 2059 2059-60 762,633,970 286,449,028 1,049,082,998 10,490,830 10,490,830 36 2060 2060-61 767,171,465 290,774,225 1,057,945,690 10,579,457 10,579,457 37 2061 2061-62 767,581,705 291,429,821 1,059,011,526 10,590,115 10,590,115 38 2062 2062-63 767,997,553 292,086,904 1,060,084,457 10,600,845 10,600,845 39 2063 2063-64 767,997,553 292,086,904 1,060,084,457 10,600,845 10,600,845 40 2064 2064-65 767,997,553 292,086,904 1,060,084,457 10,600,845 10,600,845 41 2065 2065-66 767,997,553 292,086,904 1,060,084,457 10,600,845 10,600,845 42 2066 2066-67 767,997,553 292,086,904 1,060,084,457 10,600,845 10,600,845 43 2067 2067-68 767,997,553 292,086,904 1,060,084,457 10,600,845 10,600,845 44 2068 2068-69 767,997,553 292,086,904 1,060,084,457 10,600,845 10,600,845 45 2069 2069-70 767,997,553 292,086,904 1,060,084,457 10,600,845 10,600,845 46 2070 2070-71 767,997,553 292,086,904 1,060,084,457 10,600,845 10,600,845 47 2071 2071-72 767,997,553 292,086,904 1,060,084,457 10,600,845 10,600,845 48 2072 2072-73 767,997,553 292,086,904 1,060,084,457 10,600,845 10,600,845 49 2073 2073-74 767,997,553 292,086,904 1,060,084,457 10,600,845 10,600,845 50 2074 2074-75 767,997,553 292,086,904 1,060,084,457 10,600,845 10,600,845
Total 29,400,600,078$ 9,936,508,406$ 39,337,108,484$ 393,371,085$ 393,371,085$
-Assumes Full Sales Tax Allocation-See Notes and Supporting Exhibits
\\192.168.1.12\data files\RCL\SSA\TI Model\Financial Feasibility Analysis 2016-05-13 - v1.0 | Exh J - Sales Tax Rev Page 20 of 332

Exhibit KSalton Sea AuthorityCalculation of Transient Occupancy Tax RevenuesScenario 1A (3.0% Loan Interest; 50.0% TI to IFD)May 13, 2016
Riverside County - Hotel Spending Imperial County - Hotel Spending Total
Landside Riverside Imperial
Development County County
Build Out New Phase 1 Phase 2 & 3 TOT Tax TOT Tax Tax Alloc
Year Year FY Opp Area 1, 2 & 2A Opp Area 3,4,5 & 6 @ 10.00% @ 8.00% @ 100.00%
Exhibit Reference/FN App. 2 (Ex 1&2) App. 2 (Ex 1&2) [a] [b]
Year Year FY 7,687,928,914$ 1,894,888,170$ 768,792,891$ 151,591,054$ 920,383,945$ 0 2016 2016-17 -$ -$ -$ -$ -$ 0 2017 2017-18 - - - - - 0 2018 2018-19 - - - - - 0 2019 2019-20 - - - - - 0 2020 2020-21 - - - - - 0 2021 2021-22 - - - - - 0 2022 2022-23 - - - - - 0 2023 2023-24 - - - - - 0 2024 2024-25 1,399,028 470,041 139,903 37,603 177,506 1 2025 2025-26 2,267,043 740,752 226,704 59,260 285,964 2 2026 2026-27 3,514,367 1,113,902 351,437 89,112 440,549 3 2027 2027-28 5,140,652 1,581,204 514,065 126,496 640,562 4 2028 2028-29 7,234,980 2,158,848 723,498 172,708 896,206 5 2029 2029-30 10,573,745 2,962,310 1,057,374 236,985 1,294,359 6 2030 2030-31 13,871,433 3,819,174 1,387,143 305,534 1,692,677 7 2031 2031-32 17,805,074 4,949,852 1,780,507 395,988 2,176,496 8 2032 2032-33 22,325,515 6,269,560 2,232,551 501,565 2,734,116 9 2033 2033-34 28,456,161 7,945,927 2,845,616 635,674 3,481,290
10 2034 2034-35 35,444,512 9,876,295 3,544,451 790,104 4,334,555 11 2035 2035-36 43,324,802 12,079,192 4,332,480 966,335 5,298,816 12 2036 2036-37 52,145,547 14,573,609 5,214,555 1,165,889 6,380,443 13 2037 2037-38 63,361,561 17,607,683 6,336,156 1,408,615 7,744,771 14 2038 2038-39 75,875,747 21,015,718 7,587,575 1,681,257 9,268,832 15 2039 2039-40 89,763,424 22,911,993 8,976,342 1,832,959 10,809,302 16 2040 2040-41 104,912,727 25,195,295 10,491,273 2,015,624 12,506,896 17 2041 2041-42 123,266,464 27,239,763 12,326,646 2,179,181 14,505,827 18 2042 2042-43 143,377,407 29,370,043 14,337,741 2,349,603 16,687,344 19 2043 2043-44 162,155,276 31,587,308 16,215,528 2,526,985 18,742,512 20 2044 2044-45 185,908,838 33,892,744 18,590,884 2,711,420 21,302,303 21 2045 2045-46 189,100,896 36,287,549 18,910,090 2,903,004 21,813,093 22 2046 2046-47 192,165,222 38,772,764 19,216,522 3,101,821 22,318,343 23 2047 2047-48 195,243,617 41,034,120 19,524,362 3,282,730 22,807,091 24 2048 2048-49 198,336,187 42,705,767 19,833,619 3,416,461 23,250,080 25 2049 2049-50 201,443,038 44,393,652 20,144,304 3,551,492 23,695,796 26 2050 2050-51 204,564,277 46,097,899 20,456,428 3,687,832 24,144,260 27 2051 2051-52 207,205,331 47,744,319 20,720,533 3,819,546 24,540,079 28 2052 2052-53 209,854,651 49,402,101 20,985,465 3,952,168 24,937,633 29 2053 2053-54 212,512,303 51,071,306 21,251,230 4,085,704 25,336,935 30 2054 2054-55 215,178,354 52,751,993 21,517,835 4,220,159 25,737,995 31 2055 2055-56 217,852,874 54,444,226 21,785,287 4,355,538 26,140,825 32 2056 2056-57 219,138,910 55,317,540 21,913,891 4,425,403 26,339,294 33 2057 2057-58 220,427,501 56,194,467 22,042,750 4,495,557 26,538,307 34 2058 2058-59 221,718,678 57,075,020 22,171,868 4,566,002 26,737,869 35 2059 2059-60 223,012,476 57,959,210 22,301,248 4,636,737 26,937,984 36 2060 2060-61 224,308,925 58,847,049 22,430,893 4,707,764 27,138,656 37 2061 2061-62 224,434,658 58,979,102 22,443,466 4,718,328 27,161,794 38 2062 2062-63 224,562,055 59,111,452 22,456,205 4,728,916 27,185,122 39 2063 2063-64 224,562,055 59,111,452 22,456,205 4,728,916 27,185,122 40 2064 2064-65 224,562,055 59,111,452 22,456,205 4,728,916 27,185,122 41 2065 2065-66 224,562,055 59,111,452 22,456,205 4,728,916 27,185,122 42 2066 2066-67 224,562,055 59,111,452 22,456,205 4,728,916 27,185,122 43 2067 2067-68 224,562,055 59,111,452 22,456,205 4,728,916 27,185,122 44 2068 2068-69 224,562,055 59,111,452 22,456,205 4,728,916 27,185,122 45 2069 2069-70 224,562,055 59,111,452 22,456,205 4,728,916 27,185,122 46 2070 2070-71 224,562,055 59,111,452 22,456,205 4,728,916 27,185,122 47 2071 2071-72 224,562,055 59,111,452 22,456,205 4,728,916 27,185,122 48 2072 2072-73 224,562,055 59,111,452 22,456,205 4,728,916 27,185,122 49 2073 2073-74 224,562,055 59,111,452 22,456,205 4,728,916 27,185,122 50 2074 2074-75 224,562,055 59,111,452 22,456,205 4,728,916 27,185,122
Total 7,687,928,914$ 1,894,888,170$ 768,792,891$ 151,591,054$ 920,383,945$ Footnotes:
[a] Per the County of Riverside Transient Occupancy Tax Return Form.[b] Per the County of Imperial Treasurer-Tax Collector website.
-Assumes Full TOT Allocation-See Notes and Supporting Exhibits
\\192.168.1.12\data files\RCL\SSA\TI Model\Financial Feasibility Analysis 2016-05-13 - v1.0 | Exh K - TOT Tax Rev Page 21 of 332

Exhibit LSalton Sea AuthorityCFD Capacity AnalysisScenario 1A (3.0% Loan Interest; 50.0% TI to IFD)May 13, 2016
Riverside County Imperial County
Opportunity Areas 1, 2, and 2a
Opportunity Area 3, 4, 5 and 6 All Phases
Total/Wtd Avg. Total/Wtd Avg. Total/Wtd Avg.
I. Home Prices and Combined Tax Rates:
Residential Units (a) 51,750 22,000 73,750
Estimated Home Size (square feet) (a) 2,260 2,389 2,298
Estimated Base Home Price (b) 270,001$ 257,972$ 266,413$
Estimated Tax at 1.10% (c) 2,970$ 2,838$ 2,931$
Estimated annual CFD Special Tax (d) 1,350 1,290 1,332
Estimated Total Tax 4,320$ 4,128$ 4,263$
Estimated Annual Prop. Tax Rates as % of Home Price 1.60% 1.60% 1.60%
Total Annual CFD Tax Collections [1] 69,862,732$ 28,376,891$ 98,239,623$
Estimated Annual Administrative Charges
Administrative Priority Cost per Community/CFD $25,000 $25,000 $25,000
Number of CFDs/ IAs 100 45 145
Total Annual Administrative Charges [2] 2,500,000$ 1,125,000$ 3,625,000$
Total Annual Special Taxes for Bonding 61,238,847$ 24,774,446$ 86,013,294$
(([1] - [2]) ÷ 110% coverage)
II. CFD Bond Sizing & Construction Proceeds:
Bond Term 30 30 30
Bond Amount (6.50% Interest, 29 Year Amortization) (e) $790,430,000 $319,770,000 $1,110,210,000
Reserve Fund (f) (61,238,847) (24,774,446) (86,013,294)
Capitalized Interest (12 mos.) (f) (51,377,950) (20,785,050) (72,163,650)
Underwriters Discount (3.00%) (f) (23,712,900) (9,593,100) (33,306,300)
Cost of Issuance (3.00%) (f) (23,712,900) (9,593,100) (33,306,300)
Total Net Construction Bond Proceeds 630,387,403$ 255,024,304$ 885,420,456$
Total Net Construction Bond Proceeds per Unit 12,181$ 11,592$ 12,006$
III. Footnotes:
(a) Per Exhibits I-15-A and I-15-B of the Draft Market Study and Land Use Analysis to Assess the Real Estate Impact of Restoring the Salton Sea
to a Viable Recreational Resource prepared by The Concord Group, dated 4/1/2016 ("Draft 4/1/2016 Concord Study").
(b) Represents the 2016 Base Price assuming Salton Sea Restoration, per Exhibits I-16-A and I-16-B of the Draft 3/18/2016 Concord Study.
(c) For illustration purposes, assumes estimated ad-valorem and other assessments of 1.10%.
(d) Represents estimated annual CFD special taxes assuming a total tax rate of 1.60%.
(e) For illustration purposes assumes a 30 year bond term, 29 year amortization, and 6.50% Interest.
(f) For illustration purposes only.
\\192.168.1.12\data files\RCL\SSA\TI Model\Financial Feasibility Analysis 2016-05-13 - v1.0 Page 22 of 332

\\192.168.1.12\data files\rcl\ssa\!final feasibility report\exhibit m_eifd vs irfd.docx
Exhibit M- IRFD vs. EIFD Memorandum To: SSA File From: Chris Lightburne, Patrick Bourne Date: May 13, 2016 Subject: IRFD vs. EIFD The following table has been prepared to summarize certain key differences between an IRFD and an EIFD based on current legislation.
Description
Infrastructure and Revitalization Financing District (“IRFD”)
AB 229
Enhanced Infrastructure Financing District (“EIFD”) SB 628
Code Government Code Section 53369 et seq. Government Code Section 53398.50 et seq. Agency Type City, County or Joint Powers Authority
Newly created Public Financing Authority (“PFA”)
Membership may include affected taxing agencies (“ATEs”)
Election Generally, the same as a CFD formation,
including ballot specifications, waivers of election formalities and timing, appropriations limit, 2/3 vote required, landowner versus registered voter elections, etc.
An election is required only for bond authorization; the bond authorization election is generally the same as a CFD formation. However, only 55% of the vote is required to approve the measures.
Bond Issuance Legislative body may, by a majority vote, initiate proceedings to issue bonds by adopting a resolution of issuance (“ROI”) to issue bonds.
Bonds may be issued if 55 percent of the voters voting on the proposition vote in favor of issuing the bonds.
(Note: District could be formed, but bonds could be voted down)
The PFA may, by a majority vote, initiate proceedings to issue bonds by adopting ROI to issue bonds.
Creation of Project Areas
May be divided into any number of project areas.
Project areas not permitted, meaning new EIFDs would need to be created to achieve similar distinct limitations.
Annexation of Property Permitted Not Permitted Tax Increment Limits 40 years from the date on which the
ordinance is adopted or a later date, if specified by the
ordinance, on which the allocation of tax increment will begin
45 years from the date on which the issuance of bonds is approved
Eligible Facilities Useful life of 15 years or longer facilities with community wide
significance Don't need to be located in boundaries of
IRFD
Useful life of 15 years or longer Public capital facilities with community
wide significance Don't need to be located in boundaries of
IRFD Maintenance May not finance routine maintenance,
repair work, or the costs of ongoing operation or providing services of any kind.
May not finance routine maintenance, repair work, or the costs of ongoing operation or providing services of any kind.
Affordable Housing If the IRFD constructs dwelling units, it shall set aside not less than 20% of such units to increase supply of low/moderate income housing at an affordable cost or at an affordable rent.
None
Motor Vehicle in-lieu Fees (“VLF”)
VLF revenue can’t be pledged, VLF revenues may be pledged
Page 23 of 332

BENCHMARK 5:
INFRASTRUCTURE FINANCING
FEASIBILITY ANALYSIS
Appendix 2.1: Tourist Demand Forecast Salton
Sea Lake – North, 2022-2062
Page 24 of 332

Recreational Demand Salton Sea Lake – North i
Economics & Politics, Inc. P.O. Box 8730
Redlands, CA 92375 (909) 307-9444 Phone
[email protected] www.johnhusing.com
Tourist Demand Forecast Salton Sea Lake – North, 2022-2062 Executive Summary
As part of the Phase 1 study of the ability to finance the development of a recreational system from the Salton Sea, Economics & Politics, Inc. the first step was to look at the economic impact of tourism in the Coachella Valley at the north end of the sea, referred here as Salton Sea Lake-North (SSL-N). This was measured from 2022 when it might open until 2062. An increase in potential tourism from two groups was analyzed:
Lake users captured from the six lakes most likely to currently be used by tourists from the Los Angeles, Orange, Riverside, San Bernardino counties.
Tourists independently going to the Salton Sea State Recreational Area.
This work concluded that the economic impact of these combined groups of tourists would be:
$280 million in 2022 when the SSL-N opened.
$1,825 million ($1.8 billion) in 2062 at the end of the forecast period.
The first 5 years of SSL-N (2022-2026), the cumulative impact would be $1.95 billion. That is more in the opposite direction than the -$1.7 billion loss forecasted in 5 years by a late 2014 study prepared for the Greater Palm Springs Convention & Visitors Bureau on the impact of the lake’s ecological decline.
This analysis started by studying the spending potential at a 100% capture rate of all tourists in 2015 moving from the four county area to the six lakes they are likely to use instead of SSL-N:
It identified the metrics for potential competitor lakes (Havasu, Mohave, Perris, Silverwood, Big Bear, Elsinore) including their distances from population centers in the four counties, the driving time to them from those population centers, their surface acreage and the most recent estimates of the number of visitors from Southern California using them (1,877,901).
It calculated the share of these 1,877,901 lake using tourists likely to have come from each county based upon each of their 2015 populations (17,743,546) and their shares of the registered watercraft in Southern California (217,192). These two percentage distributions were then weighted, treating the share owning watercraft as three times as important as the share of people in a county.
Next, the average days a user of the SSL-N would likely to stay during a visit were estimated based upon studies of the length of time users stayed at various lakes and their distance from population centers. These were reduced to be conservative. The averages used were 3.5 days for Los Angeles and Orange counties; 2.0 days from the inland counties.
Page 25 of 332

Recreational Demand Salton Sea Lake – North ii
Given the number of visitor days estimated for 2015 (5,611,799), the average economic impact per visitor per day was calculated. This was estimated using research by this economist on tourism impacts of the CV/Link project for the Coachella Valley Association of Governments (CVAG). The study’s direct tourist spending in the valley was based on annual data on valley tourist group spending in 2010 created as part of surveys performed annually for all major California tourist destinations by the CA Office of Tourism. Updating that work to 2015 meant direct spending was $976.06 per tourist party.
Once these dollars enter the SSL-N economy, they change hands locally as workers are hired, supplies and services are purchased by the firms initially receiving the money. The ratio is $0.435 in additional local spending per $1.00 coming to the market. The $976.06 from direct spending thus creates total local economic activity of $1,400.58 per tourist party.
Research on users of Lake Tahoe and the Sacramento-San Joaquin Delta found that a typical party as 3.0 members. Dividing by that figure resulted in an estimated $466.86 per lake using tourist per day.
o On page 6, the analysis shows why this figure differs from the 2003 figure of $92.50 used in a prior study of the Salton Sea. The essential elements are inflation from 2003-2015, the including of transportation and boating costs not in that study and the fact that it used average tourist spending in Riverside County not spending in the tourist rich Coachella Valley.
Combining the number of tourist days with the economic impact per day yielded a 2015 maximum lake tourist capture of $2.6 billion if 100% of users of other lakes were captured.
Forecasting
The work to this point obviously created an outside figure for a single year. Looking ahead, it requires a forecast of population, an estimate of potential tourist visitor days over time and potential tourist capture rates for the various lakes over time.
Population was forecasted from 2015-2062 based upon the based available data from the Southern California Association of governments (2015-2040), and the CA Department of Finance Demographic Research Unit (2040-2062). It takes the total to 22,004,146, up 4,260,000 or 24.0%.
Pleasure vessels were forecast to remain the same share of population as they did in 2015.
Combined, these data changed the mix of the share of total tourists likely to use the SSL-N from the four counties because the inland counties would be adding people and vessels faster than the coastal counties. The result was to raise the number of potential lake using tourists year by year from 1,877,901 in 2015 to 2,328,824 in 2062, up 450,924 or 24.0%,
Capture rates were estimated for each of the six competitor lakes based upon their distance from the four Southern California counties and their characteristics:
Page 26 of 332

Recreational Demand Salton Sea Lake – North iii
Capture does not begin until 2022 on the assumption that construction starts in 2017 and it takes five years to have a fresh water SSN-L. That year capture of 10% from all lakes was assumed given the assumed excitement from a new SSN-L.
Lake Havasu and Lake Mohave have the fastest assumed growth and longest increases in capture rates due to driving time that is over two hours more to them than SSL-N. Maximum capture is 75% achieved in 2060.
Lake Perris has a relatively rapid assumed increase in capture rate due to its cramped size and on-going crowding, safety and water quality problems. Maximum capture is 50% achieved in 2042.
Lake Elsinore has a modest assumed increase in capture rate due to its specialized range of skiing and racing activities. Maximum capture is 40% in 2050.
Big Bear Lake and Lake Silverwood have relatively slow assumed increases in capture rates due to their mountain locations. Maximum capture is 30% in 2042.
The result was for the SSL-N to begin with 196,016 lake using tourists in 2022 rising to 1,212,923 by 2062. The number of visitor days would increase year by year from 581,824 in 2022 to 3,491,441 in 2062. Put another way, the average daily estimated tourists using SSL-N in a 365 day year would go from a daily average of 1,594 in 2022 to 9,566 in 2062.
Using the $466.86 estimate of daily tourist economic impact shows that total spending at the SSL-N from capture of visitors from other lakes would vary from $271.6 million in 2022 to $1,630.0 million ($1.6 billion) in 2062.
Independent Tourists
Given its uniqueness, the Salton Sea State Recreational Area (SRA) has always lured tourists on its own. In the early 2000s, the number ranged from 200,000-300,000 per year, the equivalent of 1.289% of the four county population. That plunged to an average of 46,393 from FY 2012 to FY 2014 as the severity of the sea’s environmental issues increased. To look at the potential for this group to grow, it was assumed that this number remained constant until the SSL-N, SSL-South and connecting channel open in 2022. In 2021, that would represent the equivalent 0.209% of the four county area population. It is estimated that 82.9% of this represented 38,443 tourists based upon the share the four northern counties make up of the six total counties (including Imperial & San Diego) from which most tourist would come.
Once the environmental issue begins lessening, the flow of tourists choosing to come to the Salton Sea SRA should begin to normalize. It is assumed it takes eight years to go from 0.209% of four county population in 2021 back to the 1.289% by 2029 and remains there until 2062. The tourists coming from the SSL-N direction would mean 58,668 tourists by 2022, an added 10,165 visitors over 2021. By 2029, the number would reach 303,5314, up an added 212,487 from 2021. The gain would continue from there, moving upward with population growth.
Page 27 of 332

Recreational Demand Salton Sea Lake – North iv
With each independent tourist assumed to make a 2.0 day trip, the number of visitor days for these new tourists would rise from 20,330 in 2022 to 424,973 in 2029 and go on year by year to an extra 491,557 by 2062.
Each of these visitor days would add tourist spending into the SSL-N mix. The economic impact of them was lowered to $397.86 per person per day, based on removing the boating element from the spending array used with lake using tourists. The result would add SSL-N tourist impact spending year by year, going from $8.1 million in 2022 to $196 million in 2062.
Grand Total Impact
Adding together, the economic impact of captured lake tourists from competitor areas with the added tourists visiting the Salton Sea SRA for the own independent reasons yields the Grand Total Economic Impact of the SSL-N:
$280 million in 2022, rising year by year to $1,825 million ($1.8 billion) by 2062
In the five years from 2022-2026, the cumulative economic impact would be $1,952 million or $1.95 billion.
Page 28 of 332

Recreational Demand Salton Sea Lake – North 1
Demand Forecast Salton Sea Lake – North, 2022-2062
John E. Husing, Ph.D.
A key element of the ability to finance the development of a recreational system out of the Salton Sea will be the economic potential from tourists drawn to the facility. In the north, the first step was to measure impact of the Salton Sea Lake-North (SSL-N) on the Coachella Valley:
1. Potential Competitors. Determine potential demand at today’s competitor lakes.
Determine the geographic center of population in the four counties (Los Angeles, Orange, Riverside, San Bernardino) that would most be the likely source of demand for SSL-N. These data are available from the U.S. Census Bureau data for 2010 (Exhibit 1, Col. 1).
http://www2.census.gov/geo/docs/reference/cenpop2010/county/CenPop2010_Mean_CO06.txt
Exhibit 1.-Metrics of Potential Competitors to Salton Sea Lake – North County Location Miles Driving Time Acres Visitors
Los Angeles County
854 Figueroa Terrace Lake Havasu 298 04:33 19,300 383,452
Los Angeles Lake Mohave 280 04:29 28,000 199,800
Salton Sea - North 151 02:24 6,400 1,877,901
Big Bear Lake 98 02:00 2,649 93,511
Lake Silverwood 84 01:59 4,500 362,965
Lake Perris 72 01:20 2,250 684,173
Lake Elsinore 75 01:18 2,993 154,000
Orange County
440 East McFadden Ave Lake Havasu 296 04:32 19,300 383,452
Santa Ana Lake Mohave 279 04:25 28,000 199,800
Salton Sea - North 137 02:13 6,400 1,877,901
Big Bear Lake 90 02:00 2,649 93,511
Lake Silverwood 78 02:01 4,500 362,965
Lake Perris 57 01:07 2,250 684,173
Lake Elsinore 53 01:03 2,993 154,000
Riverside County
Perris Lake Havasu 253 03:59 19,300 383,452
Lake Mohave 261 04:01 28,000 199,800
Salton Sea - North 102 01:33 6,400 1,877,901
Big Bear Lake 58 01:23 2,649 93,511
Lake Silverwood 53 01:28 4,500 362,965
Lake Perris 8 00:12 2,250 684,173
Lake Elsinore 11 00:18 2,993 154,000
San Bernardino County
3086 Kendall Dr. Lake Havasu 245 03:39 19,300 383,452
San Bernardino Lake Mohave 229 03:36 28,000 199,800
Salton Sea - North 105 01:35 6,400 1,877,901
Big Bear Lake 44 01:06 2,649 93,511
Lake Silverwood 26 01:05 4,500 362,965
Lake Perris 33 00:38 2,250 684,173
Lake Elsinore 53 00:51 2,993 154,000
Page 29 of 332

Recreational Demand Salton Sea Lake – North 2
Determine the lakes by name to which residents of Los Angeles, Orange, Riverside and San Bernardino counties are likely to drive (Exhibit 1, Col. 2). These include Lake Mohave and Lake Havasu on the Colorado River; Lake Silverwood and Lake Perris from the CA State Park System; plus agency owned Big Bear Lake and Lake Elsinore.
Calculate driving miles and estimated time from four county population centers to each of these six lakes (Exhibit 1, Col. 3-4).
o Google Maps provides data on distances . The Colorado River lakes are 250-300 miles away from each county’s population center. The Inland Empire lakes are about 100 miles from Los Angeles County, 50-75 miles from Orange County, 30-45 miles from San Bernardino County and vary from nearby to 50 miles from Riverside County.
o Determine driving time using Global Feed.com a standard internet based driving tool. The Colorado River lakes are 3.5 to 4 hours away from each county. The Inland Empire lakes are about 1-2 hours from Los Angeles County and Orange County, ½ hour to an hour from San Bernardino County’s center and a few minutes to over an hour from Riverside County’s center.
http://distancecalculator.globefeed.com/US_Distance_Calculator.asp
Find the surface acres of the six lakes (Exhibit 1, Col. 5)
o Lake Havasu (19,300 acres) from “Lakes on Line” (http://havasu.lakesonline.com/) and several other sources
o Lake Mohave (28,000 acres) from the U.S. Park Service
o Lake Silverwood (2,649 acres) and Lake Perris (2,250 acres) from the CA Department of Parks and Recreation
o Big Bear Lake (2,649 acres) from Big Bear Lake Metropolitan Water District
o Lake Elsinore (2,993 acres) from the city’s Community Development Department
Determine the number of Southern California visitors to the six lakes (Exhibit 1, Col. 6):
o 2014 Lake Havasu City Benchmark Visitor Study Conducted for the Lake Havasu City Convention & Visitors Bureau, Prism Travel & Hospitality Consulting, 2015. Estimated that 41.6% of 931,629 = 383,452 visitors from Southern California.
o Water Based User Profile and Estimated Economic Contributions to the Laughlin and Bullhead City Regional Economy, University of Nevada, May 2003. Estimated that 33% of 600,000 = 199,800 visitors from Southern California.
o Lake Silverwood (362,965) and Lake Perris (684,173) visitor data was from the CA State Parks System, Statistical Report, FY 2013-2014.
o Big Bear Lake (93,511) from the BBL Metropolitan Water District, 2014.
Page 30 of 332

Recreational Demand Salton Sea Lake – North 3
o Lake Elsinore (154,000 ) from the city’s Community Development Department, 2014.
Grand total visitors estimated at all 6 lakes from the 4 counties was 1,877,901. That is the pool of potential visitors for which the SSL-N could compete.
2. Share of Potential Visitors From Each County. This is determined as follows:
Obtain the number of registered pleasure craft in the four counties from CA Department of Motor Vehicles, Total Vessel Registrations by County, December 31, 2014 (Exhibit 2. Col. 2-3) and calculate the shares of the total by county. The total was 217,192 vessels. By county, the shares were: Los Angeles (39.3%), Orange (23.3%), Riverside (19.1%) and San Bernardino (18.3%).
Obtain data on population shares in the four counties from the CA Department of Finance, Demographic Research Unit, E-5 Report, January 1, 2015 (Exhibit 2, Col. 4-5) and calculate the shares of the total by county. The total was 17,743,546. By county, the shares were: Los Angeles (57.3%), Orange (17.8%), Riverside (13.1%) and San Bernardino (11.9%).
Estimate the weighted average importance of each county to lake usage assuming pleasure craft shares are three times as important as population shares (Exhibit 2, Col. 5). By county, the shares were Los Angeles (43.8%), Orange (21.9%), Riverside (17.6%) and San Bernardino (16.8%). The weighting was used under the assumption that those with pleasure craft are more likely to use a new SSL-N.
Exhibit 2.-Share of Potential Visitors to Salton Sea North by County, 2014-2015 County Register Pleasure Craft Share (3) Populations Share (1) Weighted Share
Los Angeles 85,267 39.3% 10,158,776 57.3% 43.8%
Orange Co. 50,534 23.3% 3,157,074 17.8% 21.9%
Riverside 41,548 19.1% 2,316,438 13.1% 17.6%
San Bernardino 39,843 18.3% 2,111,258 11.9% 16.8%
Totals 217,192 100.0% 17,743,546 100.0% 100.0%
3. Average Days Stay at SSL-N per Trip from each County. Estimated as follows:
Estimate of average days stayed by visitors assuming that the longer the driving time, the more days a visitor would remain at the SSL-N. This assumption was based upon two sets of information (Exhibit 3):
o 2014 Lake Havasu City Benchmark Visitor Study, 2015 estimated average visitors stays at 4.3 days. That lake is 3:33 hours to 4:33 hours driving time from the four counties. That was reduced to 3.5 days to be conservative about time at the SSL-N.
o California State Parks: Economic Impact Of Visitor Expenditures, Katherine Litzky, CA State University, Sacramento, 2006 (Master’s Thesis). The study
Page 31 of 332

Recreational Demand Salton Sea Lake – North 4
found that the farther visitors traveled the more time and money they spent near CA State Park Lakes.
o The relevant distances and times from the county population centers to other lakes led to the assumptions that a trip from Los Angeles or Orange counties to the SSL-N would last 3.5 days on average. It would be 2.0 days for a trip from Riverside and San Bernardino counties to SSL-N.
Exhibit 3.-Drive Time & Average Days Per Visitor To Salton Sea Lake-NDrive Time Applies To Average Trip Days to SSL-N
Drive Over 2 Hours (Colorado River Lakes) Los Angeles, Orange counties 3.5
Driver 1.5-2.0 2.5
Drive 1.0-1.5 (Inland Empire Lakes) Riverside, San Bernardino counties 2.0
Drive 0.5- 1.0 1.5
Under 0.5 1.0
4. Average Economic Impact Per Day Per Visitor. This is estimated as follows:
Using 2010 data, this economist estimated the impact of tourism spending within the Coachella Valley as a result of tourist activities forecasted for the CV/Link by CVAG.1 This study’s 2010 direct tourist spending in the valley was estimated based upon annual survey data of valley tourist parties as part of survey work performed annually for all major California tourist destinations by the CA Office of Tourism.2 It is a more conservative look at the valley’s tourist spending than the data initially used to review the potential tourism impact of the SSL-N. Adapting the CV/Link study, the economic impact on the Coachella Valley of each visitor per day was calculated at $466.86, as follows (Exhibit 4):
o The spending for a visitor party in the Coachella Valley from the 2010 research was the starting point. The average daily boat cost figure for a visitor party of $133.20 was included as it was not part of the original research for the valley (Exhibit 4, Col. 2).
o The direct spending by category for a visitor party from the 2010 study was increased by the 8.3% increase in the Los Angeles-Anaheim-Riverside Consumer Price Index from 2010-2015 to yield 2015 levels. There was one exception:
The $149 average room in 2010 was replaced by the $195 average room rate from the Greater Palm Desert Convention and Visitors Bureau.3
o The total direct spending by a visitor party was $976.06 in 2015. This is assumed to apply to the SSL-N.
1 Economic Impact of CV/Link, John Husing, Ph.D., June 4, 2012 2 Average Expenditure in Palm Springs, by Household per Trip Source, 2010 Domestic Travel to California, TNS Travels
America for CA Tourism Industry, 2010 3 Coachella Valley Hotel Room Rates Continue Upward Climb, The Desert Sun, April 30, 2015
Page 32 of 332

Recreational Demand Salton Sea Lake – North 5
Exhibit 4.-Economic Impact Of Each Visitor Party Each Day Coachella Valley, 2010 & 2015
Direct Spending Category 2010 2015
Transportation (excl. parking/tolls) $21.90 $23.72
Other-Total dollar amount spent $124.50 $134.83
Gasoline $67.10 $72.67
Parking/Tolls-Total dollar amount spent $2.60 $2.82
Food/Beverage/Dining, excluding groceries $150.50 $162.99
Groceries $38.60 $41.80
Entertainment, excluding gaming/Admissions $30.30 $32.81
Casino / Gaming $62.30 $67.47
Shopping/Gifts/Souvenirs $70.50 $76.35
Amenities (spa, health club, tips, etc.) $19.70 $21.34
Boat Costs $133.20 $144.25
Hotel $149.00 $195.00
Total trip expenditures (Party) $870.20 $976.06
Secondary Sector Impact 1.435 1.435
Total Party Impact Per Day $1,248.68 $1,400.58
Average Party Size 3.00 3.00
Impact Per Visitor Day $416.23 $466.86
o Each dollar in direct spending that comes into the SSL-N area economy does not just vanish. Much of the money is re-spent by the initial recipients as they hire local workers. They, in turn, spend it locally supporting their families. A lot of the money goes to buying local supplies and paying local service providers. For every $1.00 coming in to the SSL-N area, another $0.435 in economic activity is set off through this process.4
o The $976.06 in new direct spending by a visitor party thus creates $1,400.58 in total economic impact including $424.52 in secondary spending with local businesses. Direct spending is thus 69.7% of the total economic impact; secondary spending is 30.3% of the impact.
o Analyses of fresh water related activities from swimming to personal watercraft, waterskiing, fishing and sailing at Lake Tahoe and the Sacramento Delta put the average party size in both cases at 3.0 persons.5 That figure was used here.
o Dividing the $1,400.58 total economic impact by 3.0 yielded the $466.86 impact per day per visitor. Direct spending is 69.7% of the total economic impact or $325.75 per day per visitor; indirect spending is 30.3% of the impact or $141.51 per day per visitor.
4 See IMPLAN model of the full economic impact of specific tourism sector spending in the CVAG study, p. 21-25 5 Visitor Profile Study, Lake Tahoe Visitors Authority, SMG Consulting, Summer 2015, p. 9 Sacramento.-San Joaquin Delta Boating Needs Assessment, 2000-2020, CA Department. of Boating &
Waterways, 2002, p. 4-8
Page 33 of 332

Recreational Demand Salton Sea Lake – North 6
Note: A 2005 estimate of the Salton Sea’s economic impact was $92.50 per visitor per day based upon 2003 tourist spending in all of Riverside County. That compares to the $446.86 found here.6 The relationship can be understood as follows:
o If the 2003 figure is increased for the 30.8% inflation from 2003-2015, the $92.50 estimate rises to $121.03.
o That figure omitted transportation costs which totaled $33.07 per visitor per day in 2015 using the CV/Link data (transportation, gasoline, parking).
o Also, the Riverside countywide figure would not have included a specific allowance for boating costs which were $48.08 in 2015 per visitor per day (fuel, maintenance, launch, rental, storage) bringing the total to $202.19.
o If the secondary impact of the spending had been calculated, it would have been 1.435 times that amount or $290.12 for total economic impact or 37.9% below the $446.86 estimate.
o The balance of the difference can be attributed to higher daily tourist spending in a major tourist center like the Coachella Valley than all of Riverside County.
5. Maximum Potential Estimated 2015 Tourist Spending at SSL-N. To determine how much tourist spending could reach the SSL-N if it captured 100% of visitor days and spending for each competitor lake, the following process was used (Exhibit 5):
There were 1,877,901 potential lake visitors that could be captured by SSL-N (Exhibit 1):
Multiply 1,877,901 times the weighted share of visitors from each county (16.8% to 43.8%) = potential visitors from each county (see Exhibit 2).
Multiply that times the average days per visitor based upon distance from county population center to SSL-N (2.0-3.5) = number of estimated visitor days from each county (see Exhibit 3).
Multiply that times the estimated economic impact per day per visitor ($466.86) = estimated economic impact at 100% capture rate in 2015 (see Exhibit 4).
Sum for the counties = 2015 maximum economic impact potential ($2.6 billion):
o Multiply by 69.7% for direct spending impact by sector ($1.8 billion).
o Multiply by 30.3% for secondary spending impact in other local stores and outlets ($553 million).
6 Recreation And Economic Opportunities Assessment For The Salton Sea, California, 2005, p. 102
Page 34 of 332

Recreational Demand Salton Sea Lake – North 7
Exhibit 5.-Estimate Economic Impact at 100% Lake Visitor Capture Rate, 2015 Shares 100.0% Direct Spending Secondary Spending
Los Angeles
Potential Visitors 1,877,901 44.0% 826,276
Days 3.5
Potential Visitor Days 2,891,967
Average Economic Impact Per Day $466.86 $466.86
Estimated Economic Impact $1,350,143,782 $940,907,817 $285,194,306
Orange
Potential Visitors 1,877,901 22.0% 412,203
Days 3.5
Potential Visitor Days 1,442,710
Average Economic Impact Per Day $466.86 $466.86
Estimated Economic Impact $673,543,433 $469,388,735 $142,274,293
Riverside
Potential Visitors 1,877,901 17.5% 328,373
Days 2.0
Potential Visitor Days 656,747
Average Economic Impact Per Day $466.86 $466.86
Estimated Economic Impact $306,608,750 $213,673,961 $64,765,746
San Bernardino
Potential Visitors 1,877,901 16.5% 310,188
Days 2.0
Potential Visitor Days 620,376
Average Economic Impact Per Day $466.86 $466.86
Estimated Economic Impact $289,628,663 $201,840,631 $61,178,999
GRAND TOTALs
Potential Visitors 1,877,901 100.0% 1,877,040
Days 3.0
Potential Visitor Days 5,611,799
Average Economic Impact Per Day $466.86 $466.86
Estimated Total Economic Impact $2,619,924,628 $1,825,811,144 $553,413,344
Page 35 of 332

Recreational Demand Salton Sea Lake – North 8
6. Maximum Estimated Spending By Sector in 2015
Using the 2015 shares of tourist spending from the updated CVAG study (from 13.9% for hotels to 0.2% for parking tolls) (Exhibit 6) and multiply them times the total estimated spending at a 100% capture level ($2.6 billion) = the maximum spending by sector that could be expected from the SSL-N in 2015 (Exhibit 5).
This method implicitly assumes the availability of facilities in the various sectors to permit these activities at comparable levels.
Exhibit 6.-Estimated Spending by Sector by Capture Rate, 2015 Sector Share 100.0% 69.7% 30.3%
Hotel 13.9% $364,767,836 $254,204,710 $77,050,838
Food/Beverage/Dining, excluding groceries 11.6% $304,892,599 $212,477,984 $64,403,239
Boat Costs 10.3% $269,835,015 $188,046,546 $56,997,937
Other-Total dollar amount spent 9.6% $252,220,123 $175,770,824 $53,277,098
Shopping/Gifts/Souvenirs 5.5% $142,823,443 $99,532,876 $30,168,959
Gasoline 5.2% $135,935,504 $94,732,709 $28,714,002
Casino / Gaming 4.8% $126,211,355 $87,956,003 $26,659,946
Groceries 3.0% $78,198,368 $54,496,015 $16,518,040
Entertainment, excluding gaming/Admissions 2.3% $61,383,693 $42,777,960 $12,966,234
Transportation (excl. parking/tolls) 1.7% $44,366,431 $30,918,723 $9,371,634
Amenities (spa, health club, tips, etc.) 1.5% $39,909,530 $27,812,733 $8,430,191
Parking/Tolls-Total dollar amount spent 0.2% $5,267,248 $3,670,716 $1,112,614
Total trip expenditures 69.7% $1,825,811,144 $1,272,397,800 $385,670,732
Secondary Sector Impact 30.3% $794,113,484 $553,413,344 $167,742,611
TOTAL 100.0% $2,619,924,628 $1,825,811,144 $553,413,344
Forecasting to 2062
Clearly, the SSL-N will not capture 100% of tourists currently using the six lakes discussed above. In addition, the 2015 population levels discussed will not stay constant though time nor will the distribution of the population between counties. There have also have been tourist visits to the Salton Sea that have had nothing to do with capturing visitors currently using other lakes. Allowance must be made for these considerations:
7. Population Growth. To forecast the population growth anticipated in the four major counties assumed responsible for the demand for lake visitation at the SSL-N, reliance was on two major sources of information:
The Southern California Association of Governments (SCAG) demographic forecast for the 2016 Regional Transportation Program (RTP) and Sustainable Communities Strategy shows population gains for the four counties from 2015-2040. As it was
Page 36 of 332

Recreational Demand Salton Sea Lake – North 9
built up by planning directors in each city and county plus SCAG staff, this forecast must be regard as the strongest available date for that 25 year period.7
Demographic Research Unit of the CA Department of Finance (DOF) forecasted the population of each county in five year increments from 2010-2060.8
Putting these two forecasts together, the following was done (Exhibit 7):
SCAG’s 2015 data by county was assumed accurate as were the 2040 forecasts including its estimates for 2020 and 2035.
After 2040, the DOF five year growth rates were assumed for each county.
Within each five year period in the 2040-2060 period, the compound annual average growth rates were applied to the population in the intervening years.
2061 and 2062 populations were estimated using the compound annual growth rates for the 2055-2060 period.
2062 was assumed to be the end point based upon 45 years of potential EIFD bond funding starting in 2017.
These processes resulted in the four county population going from 17,743,546 to 22,004,146, up 4,260,600 people or 24.0%. By county there were the following population changes:
o Los Angeles (10,158,776 to 11,705,830)
o Orange (3,157,074 to 3,473,019)
o Riverside (2,316,438 to 3,664,528)
o San Bernardino (2,111,258 to 3,180,768)
This allowed the calculation of the changing shares of population in each of the four counties (Exhibit 8).
o Los Angeles (57.3% to 53.2%)
o Orange (17.7% to 15.8%)
o Riverside (13.1% to 16.7%)
o San Bernardino (11.9% to 14.4%)
7 Draft 2016 RTP/SCS Growth Forecast by Jurisdictions, Southern California Association of Governments, 2016 http://www.scag.ca.gov/Documents/2016DraftGrowthForecastByJurisdiction.pdf
8 California Department of Finance, Demographic Research Unit Report P-1 (Total Population) State and County Population Projections July 1, 2010-2060 (5-year increments) http://www.dof.ca.gov/research/demographic/reports/projections/P-1/
Page 37 of 332

Recreational Demand Salton Sea Lake – North 10
8. Pleasure Vessels. The relationship between the number of pleasure craft on December 31, 2014 as a percentage of the non-institutionalized population in each of the four counties on January 1, 2015 was assumed to remain constant from 2015 to 2062 as there is no better information:
Los Angeles : 0.86% (85,267 ÷ 9,954,365)
Orange:: 1.63% (50,354 ÷ 3,096,813)
Riverside: 1.83% (41,548 ÷ 2,274,966)
San Bernardino 1.93% (39,843 ÷ 2,065,392)
These percent were applied to the population figures (Exhibit 7) to estimate the number of pleasure vessels for which owners might use the SSL-N from 2015 to 2062 (Exhibit 9) and the share of vessels by county for each period (Exhibit 10). The total increased from 221,568 to 284,842, up 63,274 or 28.6%. By county, the changes in shares were:
o Los Angeles (39.3% to 35.2%)
o Orange (23.3% to 19.9%)
o Riverside (19.1% to 23.5%)
o San Bernardino (18.4% to 21.4%)
9. Weighted Visitor Demand By County. Weighting pleasure craft shares (Exhibit 10) at three times as important as population shares (Exhibit 8) for each county allows an estimate of the share of visitor demand for SSL-N by county from 2015 to 2062 (Exhibit 11). The changes in the weighted share by county were:
o Los Angeles (43.8% to 39.7%)
o Orange (21.9% to 18.9%)
o Riverside (17.6% to 21.8%)
o San Bernardino (16.8% to 19.6%)
Page 38 of 332

Recreational Demand Salton Sea Lake – North 11
Exhibit 7.-Population Growth In Counties Relevant to Visitor Demand For Salton Sea Lake - North County 2015 2016 2017 2018 2019 2020 2021 2022 2023 2024
Los Angeles 10,158,776 10,192,134 10,225,601 10,259,178 10,292,866 10,326,664 10,379,494 10,432,593 10,485,965 10,539,609
Orange 3,157,074 3,178,361 3,199,792 3,221,367 3,243,088 3,264,955 3,275,989 3,287,061 3,298,170 3,309,316
Riverside 2,316,438 2,348,462 2,380,929 2,413,844 2,447,215 2,481,047 2,515,327 2,550,081 2,585,315 2,621,036
San Bernardino 2,111,258 2,128,163 2,145,204 2,162,382 2,179,697 2,197,150 2,223,918 2,251,011 2,278,435 2,306,193
TOTAL 17,743,546 17,847,121 17,951,526 18,056,772 18,162,865 18,269,816 18,394,728 18,520,747 18,647,885 18,776,155
Compound Rate 0.58% 0.59% 0.59% 0.59% 0.59% 0.68% 0.69% 0.69% 0.69%
County 2025 2026 2027 2028 2029 2030 2031 2032 2033 2034
Los Angeles 10,593,528 10,647,723 10,702,195 10,756,946 10,811,976 10,867,289 10,922,884 10,978,764 11,034,929 11,091,382
Orange 3,320,501 3,331,723 3,342,983 3,354,281 3,365,617 3,376,991 3,388,404 3,399,856 3,411,346 3,422,875
Riverside 2,657,251 2,693,966 2,731,188 2,768,924 2,807,182 2,845,969 2,885,291 2,925,157 2,965,573 3,006,548
San Bernardino 2,334,289 2,362,727 2,391,512 2,420,648 2,450,138 2,479,988 2,510,201 2,540,783 2,571,737 2,603,068
TOTAL 18,905,569 19,036,139 19,167,878 19,300,798 19,434,914 19,570,237 19,706,781 19,844,559 19,983,585 20,123,873
Compound Rate 0.69% 0.69% 0.69% 0.69% 0.69% 0.70% 0.70% 0.70% 0.70% 0.70%
County 2035 2036 2037 2038 2039 2040 2041 2042 2043 2044
Los Angeles 11,148,124 11,221,032 11,294,416 11,368,280 11,442,627 11,517,461 11,542,618 11,567,831 11,593,098 11,618,421
Orange 3,434,443 3,440,432 3,446,432 3,452,442 3,458,462 3,464,493 3,468,802 3,473,116 3,477,436 3,481,761
Riverside 3,048,089 3,072,328 3,096,760 3,121,386 3,146,208 3,171,227 3,198,022 3,225,044 3,252,295 3,279,775
San Bernardino 2,634,781 2,652,588 2,670,516 2,688,565 2,706,735 2,725,029 2,745,968 2,767,068 2,788,330 2,809,755
TOTAL 20,265,437 20,386,380 20,508,123 20,630,672 20,754,033 20,878,210 20,955,411 21,033,059 21,111,158 21,189,712
Compound Rate 11,148,124 11,221,032 11,294,416 11,368,280 11,442,627 11,517,461 11,542,618 11,567,831 11,593,098 11,618,421
County 2045 2046 2047 2048 2049 2050 2051 2052 2053 2054
Los Angeles 11,643,799 11,660,154 11,676,532 11,692,932 11,709,356 11,725,804 11,731,793 11,737,785 11,743,780 11,749,778
Orange 3,486,091 3,488,220 3,490,350 3,492,481 3,494,614 3,496,748 3,496,502 3,496,257 3,496,012 3,495,767
Riverside 3,307,488 3,332,271 3,357,240 3,382,396 3,407,740 3,433,275 3,454,039 3,474,929 3,495,945 3,517,089
San Bernardino 2,831,345 2,851,628 2,872,056 2,892,630 2,913,351 2,934,221 2,953,415 2,972,734 2,992,179 3,011,752
TOTAL 21,268,723 21,332,272 21,396,177 21,460,439 21,525,062 21,590,047 21,635,749 21,681,705 21,727,916 21,774,385
Compound Rate 0.37% 0.30% 0.30% 0.30% 0.30% 0.30% 0.21% 0.21% 0.21% 0.21%
County 2055 2056 2057 2058 2059 2060 2061 2062
Los Angeles 11,755,779 11,748,631 11,741,486 11,734,347 11,727,211 11,720,080 11,712,953 11,705,830
Orange 3,495,521 3,492,298 3,489,077 3,485,860 3,482,645 3,479,434 3,476,225 3,473,019
Riverside 3,538,360 3,556,114 3,573,958 3,591,891 3,609,914 3,628,028 3,646,232 3,664,528
San Bernardino 3,031,452 3,049,597 3,067,850 3,086,213 3,104,685 3,123,268 3,141,962 3,160,768
TOTAL 21,821,113 21,846,640 21,872,372 21,898,310 21,924,456 21,950,809 21,977,372 22,004,146
Compound Rate 0.21% 0.12% 0.12% 0.12% 0.12% 0.12% 0.12% 0.12%
Page 39 of 332

Recreational Demand Salton Sea Lake – North 12
Exhibit 8.-Share of Population by County Relevant to Visitor Demand For Salton Sea Lake - North County 2015 2016 2017 2018 2019 2020 2021 2022 2023 2024
Los Angeles 57.3% 57.1% 57.0% 56.8% 56.7% 56.5% 56.4% 56.3% 56.2% 56.1%
Orange 17.8% 17.8% 17.8% 17.8% 17.9% 17.9% 17.8% 17.7% 17.7% 17.6%
Riverside 13.1% 13.2% 13.3% 13.4% 13.5% 13.6% 13.7% 13.8% 13.9% 14.0%
San Bernardino 11.9% 11.9% 11.9% 12.0% 12.0% 12.0% 12.1% 12.2% 12.2% 12.3%
TOTAL 100.0% 100.0% 100.0% 100.0% 100.0% 100.0% 100.0% 100.0% 100.0% 100.0%
County 2025 2026 2027 2028 2029 2030 2031 2032 2033 2034
Los Angeles 56.0% 55.9% 55.8% 55.7% 55.6% 55.5% 55.4% 55.3% 55.2% 55.1%
Orange 17.6% 17.5% 17.4% 17.4% 17.3% 17.3% 17.2% 17.1% 17.1% 17.0%
Riverside 14.1% 14.2% 14.2% 14.3% 14.4% 14.5% 14.6% 14.7% 14.8% 14.9%
San Bernardino 12.3% 12.4% 12.5% 12.5% 12.6% 12.7% 12.7% 12.8% 12.9% 12.9%
TOTAL 100.0% 100.0% 100.0% 100.0% 100.0% 100.0% 100.0% 100.0% 100.0% 100.0%
County 2035 2036 2037 2038 2039 2040 2041 2042 2043 2044
Los Angeles 55.0% 55.0% 55.1% 55.1% 55.1% 55.2% 55.1% 55.0% 54.9% 54.8%
Orange 16.9% 16.9% 16.8% 16.7% 16.7% 16.6% 16.6% 16.5% 16.5% 16.4%
Riverside 15.0% 15.1% 15.1% 15.1% 15.2% 15.2% 15.3% 15.3% 15.4% 15.5%
San Bernardino 13.0% 13.0% 13.0% 13.0% 13.0% 13.1% 13.1% 13.2% 13.2% 13.3%
TOTAL 100.0% 100.0% 100.0% 100.0% 100.0% 100.0% 100.0% 100.0% 100.0% 100.0%
County 2045 2046 2047 2048 2049 2050 2051 2052 2053 2054
Los Angeles 54.7% 54.7% 54.6% 54.5% 54.4% 54.3% 54.2% 54.1% 54.0% 54.0%
Orange 16.4% 16.4% 16.3% 16.3% 16.2% 16.2% 16.2% 16.1% 16.1% 16.1%
Riverside 15.6% 15.6% 15.7% 15.8% 15.8% 15.9% 16.0% 16.0% 16.1% 16.2%
San Bernardino 13.3% 13.4% 13.4% 13.5% 13.5% 13.6% 13.7% 13.7% 13.8% 13.8%
TOTAL 100.0% 100.0% 100.0% 100.0% 100.0% 100.0% 100.0% 100.0% 100.0% 100.0%
County 2055 2056 2057 2058 2059 2060 2061 2062
Los Angeles 53.9% 53.8% 53.7% 53.6% 53.5% 53.4% 53.3% 53.2%
Orange 16.0% 16.0% 16.0% 15.9% 15.9% 15.9% 15.8% 15.8%
Riverside 16.2% 16.3% 16.3% 16.4% 16.5% 16.5% 16.6% 16.7%
San Bernardino 13.9% 14.0% 14.0% 14.1% 14.2% 14.2% 14.3% 14.4%
TOTAL 100.0% 100.0% 100.0% 100.0% 100.0% 100.0% 100.0% 100.0%
Page 40 of 332

Recreational Demand Salton Sea Lake – North 13
Exhibit 9.-Number of Pleasure Vessels by County Relevant to Visitor Demand for Salton Sea Lake - North County 2015 2016 2017 2018 2019 2020 2021 2022 2023 2024
Los Angeles 87,018 87,303 87,590 87,878 88,166 88,456 88,908 89,363 89,820 90,280
Orange 51,517 51,865 52,214 52,566 52,921 53,278 53,458 53,638 53,820 54,002
Riverside 42,305 42,890 43,483 44,084 44,694 45,312 45,938 46,572 47,216 47,868
San Bernardino 40,728 41,054 41,383 41,714 42,048 42,385 42,901 43,424 43,953 44,488
TOTAL 221,568 223,112 224,670 226,243 227,829 229,430 231,205 232,998 234,809 236,638
County 2025 2026 2027 2028 2029 2030 2031 2032 2033 2034
Los Angeles 90,742 91,206 91,672 92,141 92,613 93,087 93,563 94,042 94,523 95,006
Orange 54,184 54,367 54,551 54,735 54,920 55,106 55,292 55,479 55,667 55,855
Riverside 48,530 49,200 49,880 50,569 51,268 51,976 52,694 53,423 54,161 54,909
San Bernardino 45,030 45,579 46,134 46,696 47,265 47,841 48,424 49,014 49,611 50,215
TOTAL 238,486 240,352 242,238 244,142 246,066 248,010 249,973 251,957 253,961 255,985
County 2035 2036 2037 2038 2039 2040 2041 2042 2043 2044
Los Angeles 95,492 96,117 96,745 97,378 98,015 98,656 98,871 99,087 99,304 99,521
Orange 56,043 56,141 56,239 56,337 56,435 56,534 56,604 56,675 56,745 56,816
Riverside 55,668 56,110 56,557 57,006 57,460 57,917 58,406 58,899 59,397 59,899
San Bernardino 50,827 51,170 51,516 51,864 52,215 52,568 52,972 53,379 53,789 54,202
TOTAL 258,030 259,539 261,057 262,586 264,125 265,674 266,853 268,040 269,235 270,438
County 2045 2046 2047 2048 2049 2050 2051 2052 2053 2054
Los Angeles 99,738 99,878 100,018 100,159 100,300 100,440 100,492 100,543 100,594 100,646
Orange 56,886 56,921 56,956 56,991 57,025 57,060 57,056 57,052 57,048 57,044
Riverside 60,405 60,858 61,314 61,773 62,236 62,702 63,082 63,463 63,847 64,233
San Bernardino 54,619 55,010 55,404 55,801 56,201 56,603 56,974 57,346 57,721 58,099
TOTAL 271,648 272,667 273,692 274,724 275,762 276,806 277,603 278,405 279,211 280,022
County 2055 2056 2057 2058 2059 2060 2061 2062
Los Angeles 100,697 100,636 100,575 100,514 100,453 100,391 100,330 100,269
Orange 57,040 56,988 56,935 56,882 56,830 56,778 56,725 56,673
Riverside 64,622 64,946 65,272 65,599 65,928 66,259 66,592 66,926
San Bernardino 58,479 58,829 59,181 59,535 59,892 60,250 60,611 60,974
TOTAL 280,838 281,398 281,963 282,531 283,103 283,678 284,258 284,842
Page 41 of 332

Recreational Demand Salton Sea Lake – North 14
Exhibit 10.-Share of Pleasure Vessels by County Relevant to Visitor Demand for Salton Sea Lake - North County 2015 2016 2017 2018 2019 2020 2021 2022 2023 2024
Los Angeles 39.3% 39.1% 39.0% 38.8% 38.7% 38.6% 38.5% 38.4% 38.3% 38.2%
Orange 23.3% 23.2% 23.2% 23.2% 23.2% 23.2% 23.1% 23.0% 22.9% 22.8%
Riverside 19.1% 19.2% 19.4% 19.5% 19.6% 19.7% 19.9% 20.0% 20.1% 20.2%
San Bernardino 18.4% 18.4% 18.4% 18.4% 18.5% 18.5% 18.6% 18.6% 18.7% 18.8%
TOTAL 100.0% 100.0% 100.0% 100.0% 100.0% 100.0% 100.0% 100.0% 100.0% 100.0%
County 2025 2026 2027 2028 2029 2030 2031 2032 2033 2034
Los Angeles 38.0% 37.9% 37.8% 37.7% 37.6% 37.5% 37.4% 37.3% 37.2% 37.1%
Orange 22.7% 22.6% 22.5% 22.4% 22.3% 22.2% 22.1% 22.0% 21.9% 21.8%
Riverside 20.3% 20.5% 20.6% 20.7% 20.8% 21.0% 21.1% 21.2% 21.3% 21.5%
San Bernardino 18.9% 19.0% 19.0% 19.1% 19.2% 19.3% 19.4% 19.5% 19.5% 19.6%
TOTAL 100.0% 100.0% 100.0% 100.0% 100.0% 100.0% 100.0% 100.0% 100.0% 100.0%
County 2035 2036 2037 2038 2039 2040 2041 2042 2043 2044
Los Angeles 37.0% 37.0% 37.1% 37.1% 37.1% 37.1% 37.1% 37.0% 36.9% 36.8%
Orange 21.7% 21.6% 21.5% 21.5% 21.4% 21.3% 21.2% 21.1% 21.1% 21.0%
Riverside 21.6% 21.6% 21.7% 21.7% 21.8% 21.8% 21.9% 22.0% 22.1% 22.1%
San Bernardino 19.7% 19.7% 19.7% 19.8% 19.8% 19.8% 19.9% 19.9% 20.0% 20.0%
TOTAL 100.0% 100.0% 100.0% 100.0% 100.0% 100.0% 100.0% 100.0% 100.0% 100.0%
County 2045 2046 2047 2048 2049 2050 2051 2052 2053 2054
Los Angeles 36.7% 36.6% 36.5% 36.5% 36.4% 36.3% 36.2% 36.1% 36.0% 35.9%
Orange 20.9% 20.9% 20.8% 20.7% 20.7% 20.6% 20.6% 20.5% 20.4% 20.4%
Riverside 22.2% 22.3% 22.4% 22.5% 22.6% 22.7% 22.7% 22.8% 22.9% 22.9%
San Bernardino 20.1% 20.2% 20.2% 20.3% 20.4% 20.4% 20.5% 20.6% 20.7% 20.7%
TOTAL 100.0% 100.0% 100.0% 100.0% 100.0% 100.0% 100.0% 100.0% 100.0% 100.0%
County 2055 2056 2057 2058 2059 2060 2061 2062
Los Angeles 35.9% 35.8% 35.7% 35.6% 35.5% 35.4% 35.3% 35.2%
Orange 20.3% 20.3% 20.2% 20.1% 20.1% 20.0% 20.0% 19.9%
Riverside 23.0% 23.1% 23.1% 23.2% 23.3% 23.4% 23.4% 23.5%
San Bernardino 20.8% 20.9% 21.0% 21.1% 21.2% 21.2% 21.3% 21.4%
TOTAL 100.0% 100.0% 100.0% 100.0% 100.0% 100.0% 100.0% 100.0%
Page 42 of 332

Recreational Demand Salton Sea Lake – North 15
Exhibit 11.-Weighted Share of Visitor Demand by County for Salton Sea Lake - North County 2015 2016 2017 2018 2019 2020 2021 2022 2023 2024
Los Angeles 43.8% 43.6% 43.5% 43.3% 43.2% 43.0% 42.9% 42.8% 42.7% 42.6%
Orange 21.9% 21.9% 21.9% 21.9% 21.9% 21.9% 21.8% 21.7% 21.6% 21.5%
Riverside 17.6% 17.7% 17.8% 18.0% 18.1% 18.2% 18.3% 18.4% 18.5% 18.7%
San Bernardino 16.8% 16.8% 16.8% 16.8% 16.8% 16.9% 16.9% 17.0% 17.1% 17.2%
TOTAL 100.0% 100.0% 100.0% 100.0% 100.0% 100.0% 100.0% 100.0% 100.0% 100.0%
County 2025 2026 2027 2028 2029 2030 2031 2032 2033 2034
Los Angeles 42.5% 42.4% 42.3% 42.2% 42.1% 42.0% 41.9% 41.8% 41.7% 41.6%
Orange 21.4% 21.3% 21.2% 21.2% 21.1% 21.0% 20.9% 20.8% 20.7% 20.6%
Riverside 18.8% 18.9% 19.0% 19.1% 19.2% 19.4% 19.5% 19.6% 19.7% 19.8%
San Bernardino 17.2% 17.3% 17.4% 17.5% 17.6% 17.6% 17.7% 17.8% 17.9% 17.9%
TOTAL 100.0% 100.0% 100.0% 100.0% 100.0% 100.0% 100.0% 100.0% 100.0% 100.0%
County 2035 2036 2037 2038 2039 2040 2041 2042 2043 2044
Los Angeles 41.5% 41.5% 41.6% 41.6% 41.6% 41.6% 41.6% 41.5% 41.4% 41.3%
Orange 20.5% 20.4% 20.4% 20.3% 20.2% 20.1% 20.0% 20.0% 19.9% 19.9%
Riverside 19.9% 20.0% 20.0% 20.1% 20.1% 20.1% 20.2% 20.3% 20.4% 20.5%
San Bernardino 18.0% 18.0% 18.1% 18.1% 18.1% 18.1% 18.2% 18.2% 18.3% 18.3%
TOTAL 100.0% 100.0% 100.0% 100.0% 100.0% 100.0% 100.0% 100.0% 100.0% 100.0%
County 2045 2046 2047 2048 2049 2050 2051 2052 2053 2054
Los Angeles 41.2% 41.1% 41.1% 41.0% 40.9% 40.8% 40.7% 40.6% 40.5% 40.4%
Orange 19.8% 19.7% 19.7% 19.6% 19.6% 19.5% 19.5% 19.4% 19.3% 19.3%
Riverside 20.6% 20.6% 20.7% 20.8% 20.9% 21.0% 21.0% 21.1% 21.2% 21.2%
San Bernardino 18.4% 18.5% 18.5% 18.6% 18.7% 18.7% 18.8% 18.9% 18.9% 19.0%
TOTAL 100.0% 100.0% 100.0% 100.0% 100.0% 100.0% 100.0% 100.0% 100.0% 100.0%
County 2055 2056 2057 2058 2059 2060 2061 2062
Los Angeles 40.4% 40.3% 40.2% 40.1% 40.0% 39.9% 39.8% 39.7%
Orange 19.2% 19.2% 19.1% 19.1% 19.0% 19.0% 18.9% 18.9%
Riverside 21.3% 21.4% 21.4% 21.5% 21.6% 21.6% 21.7% 21.8%
San Bernardino 19.1% 19.2% 19.2% 19.3% 19.4% 19.5% 19.6% 19.6%
TOTAL 100.0% 100.0% 100.0% 100.0% 100.0% 100.0% 100.0% 100.0%
Page 43 of 332

Recreational Demand Salton Sea Lake – North 16
10. Total Southern California Lake Visitors Over Time. As population changes over time, it will increase total Southern California visitor levels for lake-based recreation if there is no SSN-L. Here, the starting point was the 1,877,901 visitors estimated in 2015 broken down by the six lakes to which they were drawn (Exhibit 1). These values are increased by the compound annual increase in the total population of the four counties in each year from 2016-2062 (Exhibit 7; last row of each year). It takes the total number of potential visitors to 2,328,824 by 2062, up 450,924 a gain of 24.0%. The keys are not the end points but the potential demand for each year shown (Exhibit 12).
11. Total SSL-N Capture Over Time. Given the growing total demand, it is necessary to estimate the capture rate from each of the lakes for SSL-N. These are anticipated to vary based upon the distance of the six lakes from each county’s population core, as well as their size and unique aspects (Exhibit 13). Here, the following assumptions were employed:
Capture does not begin until 2022 on the assumption that construction starts in 2017 and it takes five years to have a fresh water SSL-N.
Capture is estimated at 10% from all six lakes in 2022, given the assumed excitement from a new SSN-L.
Lake Havasu and Lake Mohave have the fastest assumed growth and longest increases in capture rates due to driving time that is over two hours more to them than SSL-N from each of the four population centers. Maximum capture is 75% achieved in 2060.
Lake Perris has a relatively rapid assumed increase in capture rate due to its cramped size and on-going crowding, safety and water quality problems. Maximum capture is 50% achieved in 2042.
Lake Elsinore has a modest assumed increase in capture rate due to its specialized range of skiing and racing activities. Maximum capture is 40% in 2050.
Big Bear Lake and Lake Silverwood have relatively slow assumed increases in capture rates due to their mountain locations. Maximum capture is 30% in 2042.
Applying the assumed capture rates (Exhibit 13) to the population adjusted Southern California usage of the six lakes (Exhibit 12) results in total visitor demand by year for SSL-N.
It starts at 196,016 in 2022 when the SSL-N is first available and rises to 1,212,923 by 2062 (Exhibit 14).
12. Total SSL-N Visitor Demand By County. Given the total lake visitor demand by year for SSL-N based upon its capture rates (Exhibit 14) and the weighted share of demand anticipated to come from each county (Exhibit 11), it is possible to derive the number of visitors from each of Southern California’s counties anticipated to be captured each year from 2022-2062 by SSL-N. The total would go from (Exhibit 15):
o Los Angeles (83,988 to 481,541)
Page 44 of 332

Recreational Demand Salton Sea Lake – North 17
o Orange (42,541 to 228,855)
o Riverside (36,132 to 264,239)
o San Bernardino (33,354 to 238,287)
13. Total SSL-N Visitor Economic Impact. It is next necessary to calculate the spending that would occur each year at the SSL-N based upon assumptions of the rate of Southern California lake visitors captured. The following assumptions are from work done above on the forecast:
Number of days each visitor stays based on length of drive to the SSL-N from the various counties (Exhibit 3). Visitor days would increase from 581,824 in 2022 to 3,491,441 in 2062. Again, the key is the annual increases which allow estimates of economic impact for each year.
To provide a better context for these numbers, if they are divided by 365, it gives the average daily estimated tourists for SSL-N which would be open all year. The number of tourists would go from a daily average of 1,594 in 2022 to 9,566 in 2062.
Per capita per day visitor direct and secondary spending impact of $466.86 (Exhibit 4).
Under these assumptions, this work shows that total spending at the SSL-N from capture of visitors to other lakes would vary from $271.6 million in 2022 to $1,630.0 million ($1.6 billion) in 2062 using constant 2015 inflation adjusted dollars (Exhibit 16).
14. Sector Spending at the SSL-N. In each year, it is possible to estimate spending by sector at the SSL-N by visitors capture from the six competitor lakes. This is done by multiplying the total spending (Exhibit 16) by the percentage distribution assumptions found above (Exhibit 6). For example:
Hotels would be the greatest beneficiaries going from an added $38 million in 2022 to $227 million in 2062.
Food & Beverage and Dining outlet would rank second going from $32 million in 2022 to $190 million in 2062.
Boat related services would go from $28 million in 2022 to $168 million in 2062.
Shopping outlets would increases from $15 million in 2022 to $89 million in 2062.
Service station would see business go from 14 million in 2022 to $79 million in 2062.
These estimates do not include additional spending that would occur in each of these sectors, as well as the others not listed, as monies that initially come to the SSL-N market from tourists change hands within the area as the secondary spending impact takes hold. This is quite significant in an area like the SSL-N market because it is a relatively self sufficient, particularly in the provision of labor and services.
It is next necessary to look at the impact of the increase in SSL-N area tourist unrelated to capturing people from competitor lakes (go to page 32).
Page 45 of 332
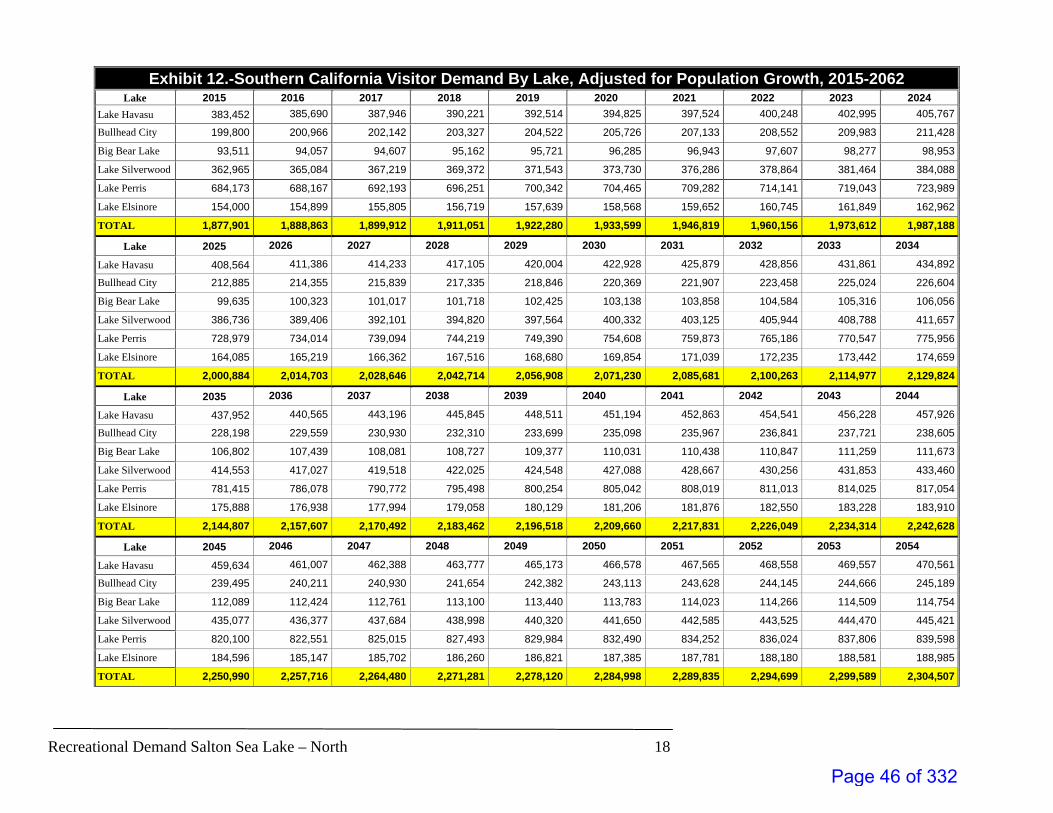
Recreational Demand Salton Sea Lake – North 18
Exhibit 12.-Southern California Visitor Demand By Lake, Adjusted for Population Growth, 2015-2062
Lake 2015 2016 2017 2018 2019 2020 2021 2022 2023 2024
Lake Havasu 383,452 385,690 387,946 390,221 392,514 394,825 397,524 400,248 402,995 405,767
Bullhead City 199,800 200,966 202,142 203,327 204,522 205,726 207,133 208,552 209,983 211,428
Big Bear Lake 93,511 94,057 94,607 95,162 95,721 96,285 96,943 97,607 98,277 98,953
Lake Silverwood 362,965 365,084 367,219 369,372 371,543 373,730 376,286 378,864 381,464 384,088
Lake Perris 684,173 688,167 692,193 696,251 700,342 704,465 709,282 714,141 719,043 723,989
Lake Elsinore 154,000 154,899 155,805 156,719 157,639 158,568 159,652 160,745 161,849 162,962
TOTAL 1,877,901 1,888,863 1,899,912 1,911,051 1,922,280 1,933,599 1,946,819 1,960,156 1,973,612 1,987,188
Lake 2025 2026 2027 2028 2029 2030 2031 2032 2033 2034
Lake Havasu 408,564 411,386 414,233 417,105 420,004 422,928 425,879 428,856 431,861 434,892
Bullhead City 212,885 214,355 215,839 217,335 218,846 220,369 221,907 223,458 225,024 226,604
Big Bear Lake 99,635 100,323 101,017 101,718 102,425 103,138 103,858 104,584 105,316 106,056
Lake Silverwood 386,736 389,406 392,101 394,820 397,564 400,332 403,125 405,944 408,788 411,657
Lake Perris 728,979 734,014 739,094 744,219 749,390 754,608 759,873 765,186 770,547 775,956
Lake Elsinore 164,085 165,219 166,362 167,516 168,680 169,854 171,039 172,235 173,442 174,659
TOTAL 2,000,884 2,014,703 2,028,646 2,042,714 2,056,908 2,071,230 2,085,681 2,100,263 2,114,977 2,129,824
Lake 2035 2036 2037 2038 2039 2040 2041 2042 2043 2044
Lake Havasu 437,952 440,565 443,196 445,845 448,511 451,194 452,863 454,541 456,228 457,926
Bullhead City 228,198 229,559 230,930 232,310 233,699 235,098 235,967 236,841 237,721 238,605
Big Bear Lake 106,802 107,439 108,081 108,727 109,377 110,031 110,438 110,847 111,259 111,673
Lake Silverwood 414,553 417,027 419,518 422,025 424,548 427,088 428,667 430,256 431,853 433,460
Lake Perris 781,415 786,078 790,772 795,498 800,254 805,042 808,019 811,013 814,025 817,054
Lake Elsinore 175,888 176,938 177,994 179,058 180,129 181,206 181,876 182,550 183,228 183,910
TOTAL 2,144,807 2,157,607 2,170,492 2,183,462 2,196,518 2,209,660 2,217,831 2,226,049 2,234,314 2,242,628
Lake 2045 2046 2047 2048 2049 2050 2051 2052 2053 2054
Lake Havasu 459,634 461,007 462,388 463,777 465,173 466,578 467,565 468,558 469,557 470,561
Bullhead City 239,495 240,211 240,930 241,654 242,382 243,113 243,628 244,145 244,666 245,189
Big Bear Lake 112,089 112,424 112,761 113,100 113,440 113,783 114,023 114,266 114,509 114,754
Lake Silverwood 435,077 436,377 437,684 438,998 440,320 441,650 442,585 443,525 444,470 445,421
Lake Perris 820,100 822,551 825,015 827,493 829,984 832,490 834,252 836,024 837,806 839,598
Lake Elsinore 184,596 185,147 185,702 186,260 186,821 187,385 187,781 188,180 188,581 188,985
TOTAL 2,250,990 2,257,716 2,264,480 2,271,281 2,278,120 2,284,998 2,289,835 2,294,699 2,299,589 2,304,507
Page 46 of 332
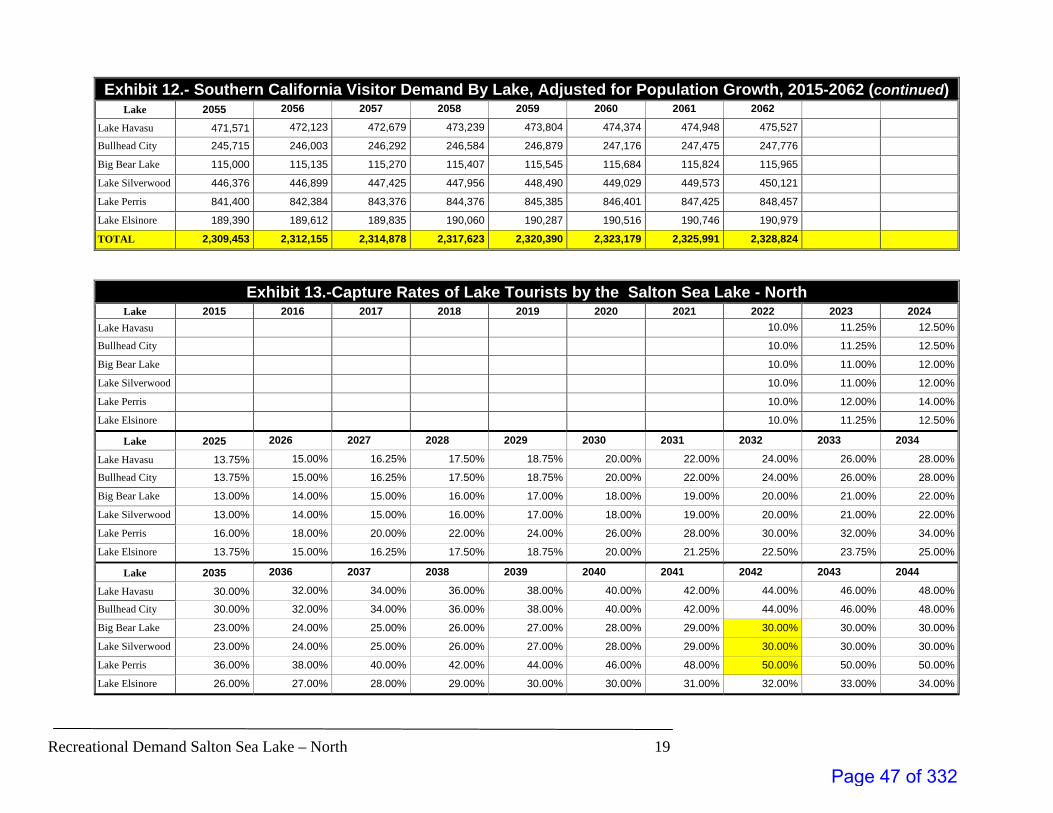
Recreational Demand Salton Sea Lake – North 19
Exhibit 12.- Southern California Visitor Demand By Lake, Adjusted for Population Growth, 2015-2062 (continued)Lake 2055 2056 2057 2058 2059 2060 2061 2062
Lake Havasu 471,571 472,123 472,679 473,239 473,804 474,374 474,948 475,527
Bullhead City 245,715 246,003 246,292 246,584 246,879 247,176 247,475 247,776
Big Bear Lake 115,000 115,135 115,270 115,407 115,545 115,684 115,824 115,965
Lake Silverwood 446,376 446,899 447,425 447,956 448,490 449,029 449,573 450,121
Lake Perris 841,400 842,384 843,376 844,376 845,385 846,401 847,425 848,457
Lake Elsinore 189,390 189,612 189,835 190,060 190,287 190,516 190,746 190,979
TOTAL 2,309,453 2,312,155 2,314,878 2,317,623 2,320,390 2,323,179 2,325,991 2,328,824
Exhibit 13.-Capture Rates of Lake Tourists by the Salton Sea Lake - North Lake 2015 2016 2017 2018 2019 2020 2021 2022 2023 2024
Lake Havasu 10.0% 11.25% 12.50%
Bullhead City 10.0% 11.25% 12.50%
Big Bear Lake 10.0% 11.00% 12.00%
Lake Silverwood 10.0% 11.00% 12.00%
Lake Perris 10.0% 12.00% 14.00%
Lake Elsinore 10.0% 11.25% 12.50%
Lake 2025 2026 2027 2028 2029 2030 2031 2032 2033 2034
Lake Havasu 13.75% 15.00% 16.25% 17.50% 18.75% 20.00% 22.00% 24.00% 26.00% 28.00%
Bullhead City 13.75% 15.00% 16.25% 17.50% 18.75% 20.00% 22.00% 24.00% 26.00% 28.00%
Big Bear Lake 13.00% 14.00% 15.00% 16.00% 17.00% 18.00% 19.00% 20.00% 21.00% 22.00%
Lake Silverwood 13.00% 14.00% 15.00% 16.00% 17.00% 18.00% 19.00% 20.00% 21.00% 22.00%
Lake Perris 16.00% 18.00% 20.00% 22.00% 24.00% 26.00% 28.00% 30.00% 32.00% 34.00%
Lake Elsinore 13.75% 15.00% 16.25% 17.50% 18.75% 20.00% 21.25% 22.50% 23.75% 25.00%
Lake 2035 2036 2037 2038 2039 2040 2041 2042 2043 2044
Lake Havasu 30.00% 32.00% 34.00% 36.00% 38.00% 40.00% 42.00% 44.00% 46.00% 48.00%
Bullhead City 30.00% 32.00% 34.00% 36.00% 38.00% 40.00% 42.00% 44.00% 46.00% 48.00%
Big Bear Lake 23.00% 24.00% 25.00% 26.00% 27.00% 28.00% 29.00% 30.00% 30.00% 30.00%
Lake Silverwood 23.00% 24.00% 25.00% 26.00% 27.00% 28.00% 29.00% 30.00% 30.00% 30.00%
Lake Perris 36.00% 38.00% 40.00% 42.00% 44.00% 46.00% 48.00% 50.00% 50.00% 50.00%
Lake Elsinore 26.00% 27.00% 28.00% 29.00% 30.00% 30.00% 31.00% 32.00% 33.00% 34.00%
Page 47 of 332

Recreational Demand Salton Sea Lake – North 20
Exhibit 13.-Capture Rates of Lake Tourists by the Salton Sea Lake – North (continued) Lake 2045 2046 2047 2048 2049 2050 2051 2052 2053 2054
Lake Havasu 50.00% 52.00% 54.00% 56.00% 58.00% 60.00% 62.00% 64.00% 66.00% 68.00%
Bullhead City 50.00% 52.00% 54.00% 56.00% 58.00% 60.00% 62.00% 64.00% 66.00% 68.00%
Big Bear Lake 30.00% 30.00% 30.00% 30.00% 30.00% 30.00% 30.00% 30.00% 30.00% 30.00%
Lake Silverwood 30.00% 30.00% 30.00% 30.00% 30.00% 30.00% 30.00% 30.00% 30.00% 30.00%
Lake Perris 50.00% 50.00% 50.00% 50.00% 50.00% 50.00% 50.00% 50.00% 50.00% 50.00%
Lake Elsinore 35.00% 36.00% 37.00% 38.00% 39.00% 40.00% 40.00% 40.00% 40.00% 40.00%
Lake 2055 2056 2057 2058 2059 2060 2061 2062
Lake Havasu 70.00% 71.00% 72.00% 73.00% 74.00% 75.00% 75.00% 75.00%
Bullhead City 70.00% 71.00% 72.00% 73.00% 74.00% 75.00% 75.00% 75.00%
Big Bear Lake 30.00% 30.00% 30.00% 30.00% 30.00% 30.00% 30.00% 30.00%
Lake Silverwood 30.00% 30.00% 30.00% 30.00% 30.00% 30.00% 30.00% 30.00%
Lake Perris 50.00% 50.00% 50.00% 50.00% 50.00% 50.00% 50.00% 50.00%
Lake Elsinore 40.00% 40.00% 40.00% 40.00% 40.00% 40.00% 40.00% 40.00%
Exhibit 14.-Southern California Visitor Captured By Lake, 2015-2062 Lake 2015 2016 2017 2018 2019 2020 2021 2022 2023 2024
Lake Havasu 0 0 0 0 0 0 0 40,025 45,337 50,721
Bullhead City 0 0 0 0 0 0 0 20,855 23,623 26,428
Big Bear Lake 0 0 0 0 0 0 0 9,761 10,810 11,874
Lake Silverwood 0 0 0 0 0 0 0 37,886 41,961 46,091
Lake Perris 0 0 0 0 0 0 0 71,414 86,285 101,359
Lake Elsinore 0 0 0 0 0 0 0 16,075 18,208 20,370
TOTAL 0 0 0 0 0 0 0 196,016 226,225 256,843
Total Capture 0.0% 0.0% 0.0% 0.0% 0.0% 0.0% 0.0% 10.4% 12.0% 13.7%
Lake 2025 2026 2027 2028 2029 2030 2031 2032 2033 2034
Lake Havasu 56,178 61,708 67,313 72,993 78,751 84,586 93,693 102,926 112,284 121,770
Bullhead City 29,272 32,153 35,074 38,034 41,034 44,074 48,820 53,630 58,506 63,449
Big Bear Lake 12,953 14,045 15,153 16,275 17,412 18,565 19,733 20,917 22,116 23,332
Lake Silverwood 50,276 54,517 58,815 63,171 67,586 72,060 76,594 81,189 85,845 90,565
Lake Perris 116,637 132,123 147,819 163,728 179,854 196,198 212,765 229,556 246,575 263,825
Lake Elsinore 22,562 24,783 27,034 29,315 31,627 33,971 36,346 38,753 41,192 43,665
TOTAL 287,876 319,329 351,207 383,517 416,263 449,453 487,950 526,970 566,519 606,606
Total Capture 15.3% 17.0% 18.7% 20.4% 22.2% 23.9% 26.0% 28.1% 30.2% 32.3%
Page 48 of 332

Recreational Demand Salton Sea Lake – North 21
Exhibit 14.-Southern California Visitor Captured by Lake, 2015-2062 (continued) Lake 2035 2036 2037 2038 2039 2040 2041 2042 2043 2044
Lake Havasu 131,386 140,981 150,687 160,504 170,434 180,478 190,202 199,998 209,865 219,805
Bullhead City 68,459 73,459 78,516 83,632 88,806 94,039 99,106 104,210 109,352 114,531
Big Bear Lake 24,564 25,785 27,020 28,269 29,532 30,809 32,027 33,254 33,378 33,502
Lake Silverwood 95,347 100,087 104,879 109,726 114,628 119,585 124,314 129,077 129,556 130,038
Lake Perris 281,309 298,710 316,309 334,109 352,112 370,320 387,849 405,507 407,012 408,527
Lake Elsinore 45,731 47,773 49,838 51,927 54,039 54,362 56,382 58,416 60,465 62,529
TOTAL 646,797 686,795 727,250 768,167 809,550 849,592 889,880 930,462 949,628 968,931
Total Capture 34.4% 36.6% 38.7% 40.9% 43.1% 45.2% 47.4% 49.5% 50.6% 51.6%
Lake 2045 2046 2047 2048 2049 2050 2051 2052 2053 2054
Lake Havasu 229,817 239,724 249,689 259,715 269,800 279,947 289,890 299,877 309,908 319,982
Bullhead City 119,748 124,910 130,102 135,326 140,581 145,868 151,049 156,253 161,479 166,729
Big Bear Lake 33,627 33,727 33,828 33,930 34,032 34,135 34,207 34,280 34,353 34,426
Lake Silverwood 130,523 130,913 131,305 131,700 132,096 132,495 132,775 133,057 133,341 133,626
Lake Perris 410,050 411,275 412,507 413,746 414,992 416,245 417,126 418,012 418,903 419,799
Lake Elsinore 64,609 66,653 68,710 70,779 72,860 74,954 75,113 75,272 75,432 75,594
TOTAL 988,373 1,007,202 1,026,142 1,045,195 1,064,362 1,083,643 1,100,161 1,116,752 1,133,416 1,150,155
Total Capture 52.6% 53.6% 54.6% 55.7% 56.7% 57.7% 58.6% 59.5% 60.4% 61.2%
Lake 2055 2056 2057 2058 2059 2060 2061 2062
Lake Havasu 330,100 335,207 340,329 345,465 350,615 355,780 356,211 356,645
Bullhead City 172,001 174,662 177,331 180,007 182,690 185,382 185,606 185,832
Big Bear Lake 34,500 34,540 34,581 34,622 34,663 34,705 34,747 34,789
Lake Silverwood 133,913 134,070 134,227 134,387 134,547 134,709 134,872 135,036
Lake Perris 420,700 421,192 421,688 422,188 422,692 423,200 423,713 424,229
Lake Elsinore 75,756 75,845 75,934 76,024 76,115 76,206 76,299 76,391
TOTAL 1,166,969 1,175,516 1,184,090 1,192,692 1,201,323 1,209,983 1,211,447 1,212,923
Total Capture 62.1% 62.6% 63.1% 63.5% 64.0% 64.4% 64.5% 64.6%
Page 49 of 332

Recreational Demand Salton Sea Lake – North 22
Exhibit 15.-Southern California Visitors Captured by SSL-N, by County, By Year 2015-2062 Lake 2015 2016 2017 2018 2019 2020 2021 2022 2023 2024
Los Angeles 0 0 0 0 0 0 0 83,988 96,705 109,535
Orange 0 0 0 0 0 0 0 42,541 48,892 55,277
Riverside 0 0 0 0 0 0 0 36,132 41,958 47,930
San Bernardino 0 0 0 0 0 0 0 33,354 38,670 44,102
TOTAL 0 0 0 0 0 0 0 196,016 226,225 256,843
Lake 2025 2026 2027 2028 2029 2030 2031 2032 2033 2034
Los Angeles 122,478 135,535 148,706 161,993 175,397 188,916 204,591 220,401 236,349 252,435
Orange 61,695 68,146 74,631 81,150 87,702 94,288 101,923 109,597 117,310 125,063
Riverside 54,051 60,323 66,749 73,333 80,078 86,985 95,005 103,220 111,632 120,245
San Bernardino 49,653 55,325 61,120 67,040 73,087 79,263 86,431 93,752 101,228 108,862
Los Angeles 287,876 319,329 351,207 383,517 416,263 449,453 487,950 526,970 566,519 606,606
Lake 2035 2036 2037 2038 2039 2040 2041 2042 2043 2044
Los Angeles 268,477 285,265 302,263 319,474 336,899 353,786 369,821 385,910 393,064 400,241
Orange 132,765 140,397 148,057 155,743 163,458 170,836 178,395 185,964 189,216 192,473
Riverside 128,976 137,236 145,620 154,130 162,767 171,169 180,027 189,013 193,700 198,449
San Bernardino 116,578 123,897 131,310 138,820 146,426 153,801 161,637 169,575 173,647 177,768
TOTAL 646,797 686,795 727,250 768,167 809,550 849,592 889,880 930,462 949,628 968,931
Lake 2045 2046 2047 2048 2049 2050 2051 2052 2053 2054
Los Angeles 407,441 414,337 421,245 428,165 435,096 442,038 447,830 453,621 459,412 465,203
Orange 195,733 198,869 202,005 205,141 208,276 211,412 214,037 216,658 219,276 221,889
Riverside 203,260 207,934 212,663 217,447 222,286 227,181 231,406 235,670 239,974 244,316
San Bernardino 181,939 186,061 190,229 194,443 198,704 203,012 206,888 210,802 214,755 218,747
TOTAL 988,373 1,007,202 1,026,142 1,045,195 1,064,362 1,083,643 1,100,161 1,116,752 1,133,416 1,150,155
Lake 2055 2056 2057 2058 2059 2060 2061 2062
Los Angeles 470,993 473,340 475,680 478,014 480,341 482,662 482,102 481,541
Orange 224,499 225,523 226,544 227,560 228,572 229,580 229,218 228,855
Riverside 248,699 251,315 253,949 256,601 259,271 261,959 263,097 264,239
San Bernardino 222,779 225,338 227,917 230,518 233,139 235,781 237,031 238,287
TOTAL 1,166,969 1,175,516 1,184,090 1,192,692 1,201,323 1,209,983 1,211,447 1,212,923
Page 50 of 332

Recreational Demand Salton Sea Lake – North 23
Exhibit 16A.-Visitor Spending by County at Salton Sea Lake-N, 2015-2024 County 2015 2016 2017 2018 2019 2020 2021 2022 2023 2024
Los Angeles
Potential Visitors 0 0 0 0 0 0 0 83,988 96,705 109,535
Days 3.5 3.5 3.5 3.5 3.5 3.5 3.5 3.5 3.5 3.5
Potential Visitor Days 0 0 0 0 0 0 0 293,958 338,467 383,371
Spending Per Day $466.86 $466.86 $466.86 $466.86 $466.86 $466.86 $466.86 $466.86 $466.86 $466.86
L.A. Spending $0 $0 $0 $0 $0 $0 $0 $137,237,010 $158,016,754 $178,980,609
Orange
Potential Visitors 0 0 0 0 0 0 0 42,541 48,892 55,277
Days 3.5 3.5 3.5 3.5 3.5 3.5 3.5 3.5 3.5 3.5
Potential Visitor Days 0 0 0 0 0 0 0 148,893 171,122 193,468
Spending Per Day $466.86 $466.86 $466.86 $466.86 $466.86 $466.86 $466.86 $466.86 $466.86 $466.86
Orange Spending $0 $0 $0 $0 $0 $0 $0 $69,512,111 $79,890,088 $90,322,519
Riverside
Potential Visitors 0 0 0 0 0 0 0 36,132 41,958 47,930
Days 2.0 2.0 2.0 2.0 2.0 2.0 2.0 2.0 2.0 2.0
Potential Visitor Days 0 0 0 0 0 0 0 72,265 83,917 95,860
Spending Per Day $466.86 $466.86 $466.86 $466.86 $466.86 $466.86 $466.86 $466.86 $466.86 $466.86
Riverside Spending $0 $0 $0 $0 $0 $0 $0 $33,737,627 $39,177,278 $44,753,259
San Bernardino
Potential Visitors 0 0 0 0 0 0 0 33,354 38,670 44,102
Days 2.0 2.0 2.0 2.0 2.0 2.0 2.0 2.0 2.0 2.0
Potential Visitor Days 0 0 0 0 0 0 0 66,709 77,339 88,204
Spending Per Day $466.86 $466.86 $466.86 $466.86 $466.86 $466.86 $466.86 $466.86 $466.86 $466.86
San Bernardino Spending $0 $0 $0 $0 $0 $0 $0 $31,143,736 $36,106,609 $41,178,771
Grand Totals
Potential Visitors 0 0 0 0 0 0 0 196,016 226,225 256,843
Average Days NA NA NA NA NA NA NA 2.97 2.97 2.96
Potential Visitor Days 0 0 0 0 0 0 0 581,824 670,845 760,903
Average Spending Per Day NA NA NA NA NA NA NA $466.86 $466.86 $466.86
Total Potential Spending $0 $0 $0 $0 $0 $0 $0 $271,630,484 $313,190,728 $355,235,157
Page 51 of 332

Recreational Demand Salton Sea Lake – North 24
Exhibit 16B.-Visitor Spending by County at Salton Sea Lake-N, 2025-2034 County 2025 2026 2027 2028 2029 2030 2031 2032 2033 2034
Los Angeles
Potential Visitors 122,478 135,535 148,706 161,993 175,397 188,916 204,591 220,401 236,349 252,435
Days 3.5 3.5 3.5 3.5 3.5 3.5 3.5 3.5 3.5 3.5
Potential Visitor Days 428,672 474,371 520,472 566,977 613,888 661,207 716,067 771,405 827,222 883,522
Spending Per Day $466.86 $466.86 $466.86 $466.86 $466.86 $466.86 $466.86 $466.86 $466.86 $466.86
L.A. Spending $200,129,661 $221,465,001 $242,987,728 $264,698,943 $286,599,759 $308,691,290 $334,303,232 $360,138,005 $386,196,922 $412,481,304
Orange
Potential Visitors 61,695 68,146 74,631 81,150 87,702 94,288 101,923 109,597 117,310 125,063
Days 3.5 3.5 3.5 3.5 3.5 3.5 3.5 3.5 3.5 3.5
Potential Visitor Days 215,931 238,511 261,208 284,024 306,957 330,008 356,730 383,589 410,586 437,721
Spending Per Day $466.86 $466.86 $466.86 $466.86 $466.86 $466.86 $466.86 $466.86 $466.86 $466.86
Orange Spending $100,809,527 $111,351,236 $121,947,771 $132,599,256 $143,305,818 $154,067,582 $166,542,900 $179,082,410 $191,686,259 $204,354,598
Riverside
Potential Visitors 54,051 60,323 66,749 73,333 80,078 86,985 95,005 103,220 111,632 120,245
Days 2.0 2.0 2.0 2.0 2.0 2.0 2.0 2.0 2.0 2.0
Potential Visitor Days 108,101 120,646 133,499 146,667 160,155 173,971 190,011 206,439 223,263 240,490
Spending Per Day $466.86 $466.86 $466.86 $466.86 $466.86 $466.86 $466.86 $466.86 $466.86 $466.86
Riverside Spending $50,468,156 $56,324,598 $62,325,259 $68,472,856 $74,770,154 $81,219,962 $88,708,384 $96,378,125 $104,232,579 $112,275,202
San Bernardino
Potential Visitors 49,653 55,325 61,120 67,040 73,087 79,263 86,431 93,752 101,228 108,862
Days 2.0 2.0 2.0 2.0 2.0 2.0 2.0 2.0 2.0 2.0
Potential Visitor Days 99,306 110,650 122,240 134,080 146,174 158,527 172,862 187,504 202,456 217,725
Spending Per Day $466.86 $466.86 $466.86 $466.86 $466.86 $466.86 $466.86 $466.86 $466.86 $466.86
San Bernardino Spending $46,362,025 $51,658,202 $57,069,162 $62,596,788 $68,242,992 $74,009,715 $80,702,459 $87,538,018 $94,518,722 $101,646,939
Grand Totals
Potential Visitors 287,876 319,329 351,207 383,517 416,263 449,453 487,950 526,970 566,519 606,606
Average Days 2.96 2.96 2.95 2.95 2.95 2.95 2.94 2.94 2.94 2.93
Potential Visitor Days 852,010 944,178 1,037,420 1,131,748 1,227,175 1,323,713 1,435,670 1,548,937 1,663,528 1,779,459
Average Spending Per Day $466.86 $466.86 $466.86 $466.86 $466.86 $466.86 $466.86 $466.86 $466.86 $466.86
Total Potential Spending $397,769,368 $440,799,038 $484,329,919 $528,367,844 $572,918,723 $617,988,550 $670,256,976 $723,136,557 $776,634,483 $830,758,044
Page 52 of 332

Recreational Demand Salton Sea Lake – North 25
Exhibit 16C.-Visitor Spending by County at Salton Sea Lake-N, 2035-2044 County 2035 2036 2037 2038 2039 2040 2041 2042 2043 2044
Los Angeles
Potential Visitors 268,477 285,265 302,263 319,474 336,899 353,786 369,821 385,910 393,064 400,241
Days 3.5 3.5 3.5 3.5 3.5 3.5 3.5 3.5 3.5 3.5
Potential Visitor Days 939,670 998,428 1,057,922 1,118,159 1,179,146 1,238,250 1,294,375 1,350,684 1,375,725 1,400,845
Spending Per Day $466.86 $466.86 $466.86 $466.86 $466.86 $466.86 $466.86 $466.86 $466.86 $466.86
L.A. Spending $438,694,237 $466,125,896 $493,901,248 $522,023,588 $550,496,237 $578,089,559 $604,291,937 $630,580,530 $642,271,045 $653,998,506
Orange
Potential Visitors 132,765 140,397 148,057 155,743 163,458 170,836 178,395 185,964 189,216 192,473
Days 3.5 3.5 3.5 3.5 3.5 3.5 3.5 3.5 3.5 3.5
Potential Visitor Days 464,679 491,390 518,198 545,102 572,103 597,925 624,383 650,874 662,257 673,654
Spending Per Day $466.86 $466.86 $466.86 $466.86 $466.86 $466.86 $466.86 $466.86 $466.86 $466.86
Orange Spending $216,940,092 $229,410,548 $241,925,962 $254,486,428 $267,092,037 $279,147,498 $291,499,385 $303,866,983 $309,181,357 $314,502,136
Riverside
Potential Visitors 128,976 137,236 145,620 154,130 162,767 171,169 180,027 189,013 193,700 198,449
Days 2.0 2.0 2.0 2.0 2.0 2.0 2.0 2.0 2.0 2.0
Potential Visitor Days 257,952 274,471 291,240 308,260 325,535 342,337 360,053 378,026 387,400 396,898
Spending Per Day $466.86 $466.86 $466.86 $466.86 $466.86 $466.86 $466.86 $466.86 $466.86 $466.86
Riverside Spending $120,427,631 $128,139,761 $135,968,153 $143,914,161 $151,979,154 $159,823,630 $168,094,515 $176,485,100 $180,861,633 $185,295,703
San Bernardino
Potential Visitors 116,578 123,897 131,310 138,820 146,426 153,801 161,637 169,575 173,647 177,768
Days 2.0 2.0 2.0 2.0 2.0 2.0 2.0 2.0 2.0 2.0
Potential Visitor Days 233,156 247,793 262,621 277,639 292,851 307,603 323,273 339,150 347,295 355,537
Spending Per Day $466.86 $466.86 $466.86 $466.86 $466.86 $466.86 $466.86 $466.86 $466.86 $466.86
San Bernardino Spending $108,851,068 $115,684,793 $122,607,032 $129,618,658 $136,720,557 $143,607,324 $150,923,428 $158,335,639 $162,137,915 $165,985,817
Grand Totals
Potential Visitors 646,797 686,795 727,250 768,167 809,550 849,592 889,880 930,462 949,628 968,931
Average Days 2.93 2.93 2.93 2.93 2.93 2.93 2.92 2.92 2.92 2.92
Potential Visitor Days 1,895,457 2,012,083 2,129,980 2,249,160 2,369,635 2,486,116 2,602,085 2,718,734 2,772,677 2,826,933
Average Spending Per Day $466.86 $466.86 $466.86 $466.86 $466.86 $466.86 $466.86 $466.86 $466.86 $466.86
Total Potential Spending $884,913,028 $939,360,997 $994,402,394 $1,050,042,835 $1,106,287,984 $1,160,668,011 $1,214,809,265 $1,269,268,251 $1,294,451,951 $1,319,782,162
Page 53 of 332

Recreational Demand Salton Sea Lake – North 26
Exhibit 16D.-Visitor Spending by County at Salton Sea Lake-N, 2045-2054 County 2045 2046 2047 2048 2049 2050 2051 2052 2053 2054
Los Angeles
Potential Visitors 407,441 414,337 421,245 428,165 435,096 442,038 447,830 453,621 459,412 465,203
Days 3.5 3.5 3.5 3.5 3.5 3.5 3.5 3.5 3.5 3.5
Potential Visitor Days 1,426,044 1,450,181 1,474,359 1,498,577 1,522,835 1,547,135 1,567,405 1,587,675 1,607,943 1,628,210
Spending Per Day $466.86 $466.86 $466.86 $466.86 $466.86 $466.86 $466.86 $466.86 $466.86 $466.86
L.A. Spending $665,762,975 $677,031,517 $688,319,021 $699,625,482 $710,950,899 $722,295,268 $731,758,852 $741,221,846 $750,684,230 $760,145,985
Orange
Potential Visitors 195,733 198,869 202,005 205,141 208,276 211,412 214,037 216,658 219,276 221,889
Days 3.5 3.5 3.5 3.5 3.5 3.5 3.5 3.5 3.5 3.5
Potential Visitor Days 685,065 696,041 707,017 717,993 728,967 739,941 749,129 758,303 767,465 776,612
Spending Per Day $466.86 $466.86 $466.86 $466.86 $466.86 $466.86 $466.86 $466.86 $466.86 $466.86
Orange Spending $319,829,305 $324,953,891 $330,078,135 $335,202,020 $340,325,529 $345,448,648 $349,738,246 $354,021,528 $358,298,487 $362,569,119
Riverside
Potential Visitors 203,260 207,934 212,663 217,447 222,286 227,181 231,406 235,670 239,974 244,316
Days 2.0 2.0 2.0 2.0 2.0 2.0 2.0 2.0 2.0 2.0
Potential Visitor Days 406,520 415,869 425,327 434,894 444,572 454,362 462,813 471,341 479,947 488,633
Spending Per Day $466.86 $466.86 $466.86 $466.86 $466.86 $466.86 $466.86 $466.86 $466.86 $466.86
Riverside Spending $189,787,929 $194,152,570 $198,567,977 $203,034,630 $207,553,013 $212,123,613 $216,068,712 $220,050,140 $224,068,165 $228,123,060
San Bernardino
Potential Visitors 181,939 186,061 190,229 194,443 198,704 203,012 206,888 210,802 214,755 218,747
Days 2.0 2.0 2.0 2.0 2.0 2.0 2.0 2.0 2.0 2.0
Potential Visitor Days 363,877 372,122 380,457 388,886 397,408 406,024 413,775 421,604 429,510 437,494
Spending Per Day $466.86 $466.86 $466.86 $466.86 $466.86 $466.86 $466.86 $466.86 $466.86 $466.86
San Bernardino Spending $169,879,787 $173,728,668 $177,620,372 $181,555,283 $185,533,790 $189,556,283 $193,175,130 $196,829,928 $200,520,967 $204,248,541
Grand Totals
Potential Visitors 988,373 1,007,202 1,026,142 1,045,195 1,064,362 1,083,643 1,100,161 1,116,752 1,133,416 1,150,155
Average Days 2.92 2.91 2.91 2.91 2.91 2.90 2.90 2.90 2.90 2.90
Potential Visitor Days 2,881,506 2,934,213 2,987,160 3,040,349 3,093,782 3,147,461 3,193,122 3,238,923 3,284,865 3,330,949
Average Spending Per Day $466.86 $466.86 $466.86 $466.86 $466.86 $466.86 $466.86 $466.86 $466.86 $466.86
Total Potential Spending $1,345,259,996 $1,369,866,646 $1,394,585,504 $1,419,417,415 $1,444,363,230 $1,469,423,811 $1,490,740,939 $1,512,123,440 $1,533,571,849 $1,555,086,705
Page 54 of 332

Recreational Demand Salton Sea Lake – North 27
Exhibit 16E.-Visitor Spending by County at Salton Sea Lake-N, 2055-2062 County 2055 2056 2057 2058 2059 2060 2061 2062
Los Angeles
Potential Visitors 470,993 473,340 475,680 478,014 480,341 482,662 482,102 481,541
Days 3.5 3.5 3.5 3.5 3.5 3.5 3.5 3.5
Potential Visitor Days 1,648,475 1,656,689 1,664,880 1,673,048 1,681,194 1,689,317 1,687,356 1,685,395
Spending Per Day $466.86 $466.86 $466.86 $466.86 $466.86 $466.86 $466.86 $466.86
L.A. Spending $769,607,093 $773,441,729 $777,265,788 $781,079,285 $784,882,234 $788,674,652 $787,758,908 $786,843,579
Orange
Potential Visitors 224,499 225,523 226,544 227,560 228,572 229,580 229,218 228,855
Days 3.5 3.5 3.5 3.5 3.5 3.5 3.5 3.5
Potential Visitor Days 785,746 789,331 792,902 796,459 800,002 803,531 802,262 800,994
Spending Per Day $466.86 $466.86 $466.86 $466.86 $466.86 $466.86 $466.86 $466.86
Orange Spending $366,833,419 $368,507,192 $370,174,379 $371,834,994 $373,489,051 $375,136,564 $374,544,027 $373,952,034
Riverside
Potential Visitors 248,699 251,315 253,949 256,601 259,271 261,959 263,097 264,239
Days 2.0 2.0 2.0 2.0 2.0 2.0 2.0 2.0
Potential Visitor Days 497,398 502,630 507,899 513,203 518,543 523,919 526,193 528,477
Spending Per Day $466.86 $466.86 $466.86 $466.86 $466.86 $466.86 $466.86 $466.86
Riverside Spending $232,215,096 $234,658,071 $237,117,628 $239,593,862 $242,086,867 $244,596,740 $245,658,639 $246,724,881
San Bernardino
Potential Visitors 222,779 225,338 227,917 230,518 233,139 235,781 237,031 238,287
Days 2.0 2.0 2.0 2.0 2.0 2.0 2.0 2.0
Potential Visitor Days 445,557 450,675 455,834 461,035 466,277 471,562 474,062 476,575
Spending Per Day $466.86 $466.86 $466.86 $466.86 $466.86 $466.86 $466.86 $466.86
San Bernardino Spending $208,012,943 $210,402,265 $212,810,845 $215,238,816 $217,686,313 $220,153,471 $221,320,624 $222,493,721
Grand Totals
Potential Visitors 1,166,969 1,175,516 1,184,090 1,192,692 1,201,323 1,209,983 1,211,447 1,212,923
Average Days 2.89 2.89 2.89 2.89 2.89 2.88 2.88 2.88
Potential Visitor Days 3,377,176 3,399,326 3,421,515 3,443,745 3,466,017 3,488,329 3,489,873 3,491,441
Average Spending Per Day $466.86 $466.86 $466.86 $466.86 $466.86 $466.86 $466.86 $466.86
Total Potential Spending $1,576,668,551 $1,587,009,257 $1,597,368,640 $1,607,746,957 $1,618,144,466 $1,628,561,427 $1,629,282,197 $1,630,014,215
Page 55 of 332

Recreational Demand Salton Sea Lake – North 28
Exhibit 17.-Spending by Sector at Salton Sea Lake North, 2022-2062 Sector Share 2015 2016 2017 2018 2019 2020 2021 2022 2023 2024
Hotel 13.9% $0 $0 $0 $0 $0 $0 $0 $37,818,670 $43,605,035 $49,458,812
Food/Beverage/Dining, s 11.6% $0 $0 $0 $0 $0 $0 $0 $31,610,880 $36,447,436 $41,340,338
Boat Costs 10.3% $0 $0 $0 $0 $0 $0 $0 $27,976,154 $32,256,586 $36,586,886
Other-Total dollar amount spent 9.6% $0 $0 $0 $0 $0 $0 $0 $26,149,865 $30,150,869 $34,198,486
Shopping/Gifts/Souvenirs 5.5% $0 $0 $0 $0 $0 $0 $0 $14,807,755 $17,073,384 $19,365,408
Gasoline 5.2% $0 $0 $0 $0 $0 $0 $0 $14,093,622 $16,249,986 $18,431,473
Casino / Gaming 4.8% $0 $0 $0 $0 $0 $0 $0 $13,085,434 $15,087,543 $17,112,977
Groceries 3.0% $0 $0 $0 $0 $0 $0 $0 $8,107,508 $9,347,980 $10,602,904
Entertainment (not gaming) 2.3% $0 $0 $0 $0 $0 $0 $0 $6,364,184 $7,337,922 $8,323,005
Transportation (no parking/tolls) 1.7% $0 $0 $0 $0 $0 $0 $0 $4,599,856 $5,303,647 $6,015,637
Amenities (spa, health club, etc.) 1.5% $0 $0 $0 $0 $0 $0 $0 $4,137,770 $4,770,860 $5,411,327
Parking/Tolls- (dollars spent) 0.2% $0 $0 $0 $0 $0 $0 $0 $546,102 $629,657 $714,185
Total trip expenditures 69.7% $0 $0 $0 $0 $0 $0 $0 $189,297,799 $218,260,906 $247,561,438
Secondary Sector Impact 30.3% $82,332,685 $94,929,823 $107,673,719
TOTAL 100.0% $271,630,484 $313,190,728 $355,235,157
Sector Share 2025 2026 2027 2028 2029 2030 2031 2032 2033 2034
Hotel 13.9% $55,380,781 $61,371,732 $67,432,465 $73,563,794 $79,766,540 $86,041,539 $93,318,786 $100,681,124 $108,129,553 $115,665,089
Food/Beverage/Dining, s 11.6% $46,290,239 $51,297,798 $56,363,685 $61,488,580 $66,673,169 $71,918,151 $78,000,867 $84,154,705 $90,380,503 $96,679,109
Boat Costs 10.3% $40,967,630 $45,399,403 $49,882,798 $54,418,415 $59,006,862 $63,648,758 $69,032,063 $74,478,312 $79,988,247 $85,562,618
Other-Total dollar amount spent 9.6% $38,293,254 $42,435,720 $46,626,438 $50,865,968 $55,154,881 $59,493,753 $64,525,634 $69,616,351 $74,766,596 $79,977,070
Shopping/Gifts/Souvenirs 5.5% $21,684,132 $24,029,865 $26,402,922 $28,803,621 $31,232,282 $33,689,234 $36,538,612 $39,421,307 $42,337,711 $45,288,221
Gasoline 5.2% $20,638,372 $22,870,978 $25,129,590 $27,414,510 $29,726,044 $32,064,505 $34,776,466 $37,520,138 $40,295,892 $43,104,108
Casino / Gaming 4.8% $19,162,006 $21,234,902 $23,331,944 $25,453,412 $27,599,591 $29,770,769 $32,288,731 $34,836,134 $37,413,325 $40,020,654
Groceries 3.0% $11,872,447 $13,156,777 $14,456,068 $15,770,493 $17,100,228 $18,445,453 $20,005,538 $21,583,865 $23,180,647 $24,796,104
Entertainment (not gaming) 2.3% $9,319,563 $10,327,729 $11,347,639 $12,379,428 $13,423,236 $14,479,202 $15,703,829 $16,942,774 $18,196,208 $19,464,299
Transportation (no parking/tolls) 1.7% $6,735,922 $7,464,597 $8,201,759 $8,947,508 $9,701,943 $10,465,166 $11,350,292 $12,245,768 $13,151,714 $14,068,256
Amenities (spa, health club, etc.) 1.5% $6,059,254 $6,714,728 $7,377,838 $8,048,671 $8,727,319 $9,413,871 $10,210,080 $11,015,599 $11,830,538 $12,655,006
Parking/Tolls- (dollars spent) 0.2% $799,698 $886,208 $973,725 $1,062,261 $1,151,829 $1,242,440 $1,347,523 $1,453,835 $1,561,391 $1,670,204
Total trip expenditures 69.7% $277,203,297 $307,190,439 $337,526,872 $368,216,660 $399,263,924 $430,672,840 $467,098,420 $503,949,911 $541,232,324 $578,950,737
Secondary Sector Impact 30.3% $120,566,071 $133,608,599 $146,803,048 $160,151,183 $173,654,798 $187,315,709 $203,158,555 $219,186,646 $235,402,160 $251,807,307
TOTAL 100.0% $397,769,368 $440,799,038 $484,329,919 $528,367,844 $572,918,723 $617,988,550 $670,256,976 $723,136,557 $776,634,483 $830,758,044
Page 56 of 332

Recreational Demand Salton Sea Lake – North 29
Exhibit 17.-Spending by Sector at Salton Sea Lake North, 2022-2062 (continued) Sector Share 2035 2036 2037 2038 2039 2040 2041 2042 2043 2044
Hotel 13.9% $123,204,999 $130,785,701 $138,449,025 $146,195,753 $154,026,673 $161,597,916 $169,135,914 $176,718,150 $180,224,435 $183,751,119
Food/Beverage/Dining, s 11.6% $102,981,372 $109,317,731 $115,723,150 $122,198,282 $128,743,787 $135,072,239 $141,372,904 $147,710,545 $150,641,288 $153,589,080
Boat Costs 10.3% $91,140,225 $96,748,008 $102,416,910 $108,147,510 $113,940,390 $119,541,175 $125,117,369 $130,726,286 $133,320,042 $135,928,887
Other-Total dollar amount spent 9.6% $85,190,570 $90,432,276 $95,731,111 $101,087,615 $106,502,336 $111,737,500 $116,949,678 $122,192,445 $124,616,879 $127,055,418
Shopping/Gifts/Souvenirs 5.5% $48,240,443 $51,208,638 $54,209,183 $57,242,385 $60,308,551 $63,273,042 $66,224,517 $69,193,312 $70,566,185 $71,947,044
Gasoline 5.2% $45,913,954 $48,739,002 $51,594,840 $54,481,759 $57,400,054 $60,221,576 $63,030,710 $65,856,330 $67,162,993 $68,477,258
Casino / Gaming 4.8% $42,629,498 $45,252,456 $47,904,002 $50,584,405 $53,293,940 $55,913,625 $58,521,807 $61,145,296 $62,358,486 $63,578,735
Groceries 3.0% $26,412,498 $28,037,637 $29,680,489 $31,341,221 $33,020,001 $34,643,113 $36,259,097 $37,884,565 $38,636,237 $39,392,282
Entertainment (not gaming) 2.3% $20,733,127 $22,008,819 $23,298,415 $24,602,046 $25,919,846 $27,193,946 $28,462,452 $29,738,402 $30,328,445 $30,921,921
Transportation (no parking/tolls) 1.7% $14,985,329 $15,907,364 $16,839,448 $17,781,677 $18,734,146 $19,655,030 $20,571,871 $21,494,093 $21,920,559 $22,349,507
Amenities (spa, health club, etc.) 1.5% $13,479,954 $14,309,364 $15,147,814 $15,995,390 $16,852,177 $17,680,552 $18,505,290 $19,334,869 $19,718,494 $20,104,351
Parking/Tolls- (dollars spent) 0.2% $1,779,080 $1,888,546 $1,999,204 $2,111,067 $2,224,145 $2,333,474 $2,442,323 $2,551,810 $2,602,441 $2,653,366
Total trip expenditures 69.7% $616,691,049 $654,635,541 $692,993,590 $731,769,108 $770,966,045 $808,863,189 $846,593,933 $884,546,102 $902,096,485 $919,748,970
Secondary Sector Impact 30.3% $268,221,979 $284,725,456 $301,408,805 $318,273,726 $335,321,939 $351,804,822 $368,215,333 $384,722,149 $392,355,466 $400,033,192
TOTAL 100.0% $884,913,028 $939,360,997 $994,402,394 $1,050,042,835 $1,106,287,984 $1,160,668,011 $1,214,809,265 $1,269,268,251 $1,294,451,951 $1,319,782,162
Sector Share 2045 2046 2047 2048 2049 2050 2051 2052 2053 2054
Hotel 13.9% $187,298,357 $190,724,301 $194,165,867 $197,623,173 $201,096,339 $204,585,482 $207,553,431 $210,530,482 $213,516,709 $216,512,188
Food/Beverage/Dining, s 11.6% $156,554,052 $159,417,640 $162,294,287 $165,184,090 $168,087,148 $171,003,562 $173,484,334 $175,972,713 $178,468,763 $180,972,545
Boat Costs 10.3% $138,552,937 $141,087,260 $143,633,140 $146,190,663 $148,759,918 $151,340,993 $153,536,517 $155,738,774 $157,947,820 $160,163,708
Other-Total dollar amount spent 9.6% $129,508,169 $131,877,051 $134,256,735 $136,647,303 $139,048,837 $141,461,419 $143,513,618 $145,572,112 $147,636,950 $149,708,185
Shopping/Gifts/Souvenirs 5.5% $73,335,951 $74,677,366 $76,024,898 $77,378,593 $78,738,498 $80,104,659 $81,266,748 $82,432,401 $83,601,646 $84,774,514
Gasoline 5.2% $69,799,182 $71,075,905 $72,358,449 $73,646,860 $74,941,180 $76,241,455 $77,347,500 $78,456,937 $79,569,794 $80,686,098
Casino / Gaming 4.8% $64,806,096 $65,991,488 $67,182,286 $68,378,530 $69,580,261 $70,787,521 $71,814,445 $72,844,519 $73,877,767 $74,914,216
Groceries 3.0% $40,152,734 $40,887,182 $41,624,980 $42,366,152 $43,110,724 $43,858,721 $44,494,985 $45,133,201 $45,773,384 $46,415,550
Entertainment (not gaming) 2.3% $31,518,856 $32,095,379 $32,674,531 $33,256,332 $33,840,801 $34,427,960 $34,927,411 $35,428,393 $35,930,920 $36,435,004
Transportation (no parking/tolls) 1.7% $22,780,955 $23,197,650 $23,616,245 $24,036,755 $24,459,193 $24,883,575 $25,244,564 $25,606,661 $25,969,873 $26,334,211
Amenities (spa, health club, etc.) 1.5% $20,492,457 $20,867,292 $21,243,837 $21,622,103 $22,002,105 $22,383,855 $22,708,581 $23,034,302 $23,361,027 $23,688,765
Parking/Tolls- (dollars spent) 0.2% $2,704,588 $2,754,059 $2,803,755 $2,853,679 $2,903,831 $2,954,214 $2,997,072 $3,040,060 $3,083,181 $3,126,436
Total trip expenditures 69.7% $937,504,334 $954,652,573 $971,879,010 $989,184,233 $1,006,568,835 $1,024,033,417 $1,038,889,207 $1,053,790,555 $1,068,737,834 $1,083,731,419
Secondary Sector Impact 30.3% $407,755,663 $415,214,073 $422,706,494 $430,233,182 $437,794,395 $445,390,394 $451,851,732 $458,332,885 $464,834,015 $471,355,286
TOTAL 100.0% $1,345,259,996 $1,369,866,646 $1,394,585,504 $1,419,417,415 $1,444,363,230 $1,469,423,811 $1,490,740,939 $1,512,123,440 $1,533,571,849 $1,555,086,705
Page 57 of 332

Recreational Demand Salton Sea Lake – North 30
Exhibit 17.-Spending by Sector at Salton Sea Lake North, 2022-2062 (continued) Sector Share 2055 2056 2057 2058 2059 2060 2061 2062
Hotel 13.9% $219,516,993 $220,956,712 $222,399,032 $223,843,989 $225,291,617 $226,741,953 $226,842,305 $226,944,223
Food/Beverage/Dining 11.6% $183,484,123 $184,687,518 $185,893,087 $187,100,859 $188,310,864 $189,523,134 $189,607,013 $189,692,201
Boat Costs 10.3% $162,386,497 $163,451,521 $164,518,470 $165,587,368 $166,658,243 $167,731,122 $167,805,356 $167,880,749
Other-Total dollar amount spent 9.6% $151,785,869 $152,781,369 $153,778,666 $154,777,787 $155,778,755 $156,781,596 $156,850,984 $156,921,456
Shopping/Gifts/Souvenirs 5.5% $85,951,034 $86,514,751 $87,079,486 $87,645,253 $88,212,066 $88,779,940 $88,819,232 $88,859,138
Shopping/Gifts/Souvenirs 5.2% $81,805,878 $82,342,408 $82,879,908 $83,418,390 $83,957,867 $84,498,354 $84,535,751 $84,573,732
Gasoline 4.8% $75,953,893 $76,452,042 $76,951,092 $77,451,053 $77,951,939 $78,453,762 $78,488,485 $78,523,748
Casino / Gaming 3.0% $47,059,715 $47,368,360 $47,677,562 $47,987,330 $48,297,670 $48,608,591 $48,630,104 $48,651,953
Groceries 2.3% $36,940,657 $37,182,935 $37,425,651 $37,668,811 $37,912,420 $38,156,485 $38,173,372 $38,190,523
Transportation (no parking/tolls) 1.7% $26,699,683 $26,874,795 $27,050,223 $27,225,972 $27,402,046 $27,578,449 $27,590,655 $27,603,051
Amenities (spa, health club, etc.) 1.5% $24,017,523 $24,175,044 $24,332,849 $24,490,943 $24,649,329 $24,808,012 $24,818,991 $24,830,142
Parking/Tolls- (dollars spent) 0.2% $3,169,825 $3,190,615 $3,211,442 $3,232,307 $3,253,211 $3,274,154 $3,275,603 $3,277,075
Total trip expenditures 69.7% $1,098,771,690 $1,105,978,071 $1,113,197,468 $1,120,430,061 $1,127,676,028 $1,134,935,551 $1,135,437,852 $1,135,947,991
Secondary Sector Impact 30.3% $477,896,861 $481,031,186 $484,171,171 $487,316,896 $490,468,438 $493,625,876 $493,844,345 $494,066,224
TOTAL 100.0% $1,576,668,551 $1,587,009,257 $1,597,368,640 $1,607,746,957 $1,618,144,466 $1,628,561,427 $1,629,282,197 $1,630,014,215
Page 58 of 332

Recreational Demand Salton Sea Lake – North 31
15. Independent Tourist Visitors. As indicated earlier, visitors have been coming to the Salton Sea for decades irrespective of the ability of a recreational system to lure them from other lake locations.. Some come to fish. Some race boats. Others come because of the sea’s unique ecology. As the Salton Sea has become increasingly threatened, tourist visitations have fallen dramatically. The peak was 306,446 visitors in FY 2008-2009. That was at the high end of the 200,000-300,000 visitor usage going back to FY 2002 (earliest available data). Usage then plummeted reaching a low of 38,713 in FY 2011-2012. There were 49,120 visitors in FY 2014 (Exhibit 18).
As the Salton Sea is secured environmentally, this independent activity should resume. It is thus necessary to see the extent that this will add to the visitations and economic impact beyond that from the estimated activity captured from competitor lakes.
A. A relationship is assumed between the number of people visiting the Salton Sea State Recreational Area (SRA) and the population of the six county Southern California area from which most would come (Imperial & San Diego added to the four counties most impacting the northern end of the Salton Sea):
o The visitor percentage relationship averaged 1.289% from FY 2002 to FY 2009 before the dramatic decline due to the lakes environmental problems (Exhibit 19).
o In the FY 2012-FY 2014 period, the number of tourist visitations to the Salton Sea SRA settled to an average of 46,393 per year.
B. The following steps are used to forecast the future number and economic impact of independent tourists:
o From 2015 to FY 2021, the visitor usage of the Salton Sea SRA is assumed to stay at 46,393. By 2021, that would be 46,393 of 22,898,210 people or 0.209% (Exhibit 20).
Page 59 of 332

Recreational Demand Salton Sea Lake – North 32
Exhibit19.-Salton Sea SRA Visitors Share of Southern California’s Population, FY 2002 to FY 20014
Fiscal Year Visitors Population Share
FY 2002 228,148 18,926,759 1.205%
FY 2003 245,657 19,183,768 1.281%
FY 2004 227,533 19,448,113 1.170%
FY 2005 278,192 19,653,406 1.415%
FY 2006 293,625 19,771,957 1.485%
FY 2007 232,652 19,882,225 1.170%
FY 2008 213,470 20,006,083 1.067%
FY 2009 306,446 20,140,412 1.522%
FY 2002-FY 2009 1.289%
FY 2010 62,081 20,235,641 0.307%
FY 2011 121,982 20,351,260 0.599%
FY 2012 38,713 20,485,383 0.189%
FY 2013 51,346 20,665,157 0.248%
FY 2014 49,120 20,982,034 0.234%
FY 2012-FY 2014 46,393
Sources: Exhibit 17 & E-5 Reports, Demographic Research Unit, CA Department of Finance
o With the environmentally clean Salton Sea Lake North & South opened in 2022, the tourism draw will have been enhanced. Tourist visitations to the Salton Sea SRA are assumed to climb from the 0.209% relationship to six county population in 2021 to the prior 1.289% average by 2029, eight years later. Once at that the 1.289% level, it is assumed that share is maintained through 2062.
The share would rise at the compound rate each year form 2021 to 2029 to move it from 0.209% to 1.289%.
The number of Salton Sea SRA tourist visitors would rise from 46,393 to 303,531 in this eight year period. That would put it close to the level achieved before the ecological disaster truly took hold.
o The split between visitors emanating from the four northern counties and the two southern counties would stand at 83.0% v. 17.0% in 2021. It would shift each year as the differences in county population growth rates alter this relationship.
In 2021, the north-south split in the source of tourists would be 38,501 v. 7,892, a total of 46,393 (Exhibit 20, rows 6, 8 & 10)
By 2029, it would be 250,988 (82.7%) v. 52,544 (17.3%), a total of 303,531
By 2062, it would 284,167 (81.9%) v. 62,906 (18.1%), a total of 347,074
Page 60 of 332

Recreational Demand Salton Sea Lake – North 33
Exhibit 20.-Estimates of Salton Sea SRA Visitors, By North & South Direction, By Year 2015-2062 Lake 2015 2016 2017 2018 2019 2020 2021 2022 2023 2024
Four County Population 17,743,546 17,847,121 17,951,526 18,056,772 18,162,865 18,269,816 18,394,728 18,520,747 18,647,885 18,776,155
San Diego 3,227,496 3,286,779 3,347,150 3,408,631 3,471,240 3,535,000 3,567,152 3,599,596 3,632,335 3,665,372
Imperial 183,429 186,622 189,870 193,175 196,537 199,958 203,439 206,980 210,582 214,248
6 County Population 21,154,471 21,320,521 21,488,546 21,658,577 21,830,643 22,004,774 22,165,318 22,327,322 22,490,802 22,655,774
Relationship 0.219% 0.218% 0.216% 0.214% 0.213% 0.211% 0.209% 0.263% 0.330% 0.414%
Salton Sea Visitors 46,393 46,393 46,393 46,393 46,393 46,393 46,393 58,668 74,192 93,825
From Northern Areas 83.9% 83.7% 83.5% 83.4% 83.2% 83.0% 83.0% 83.0% 82.9% 82.9%
Salton Sea Visitors-N 38,913 38,835 38,757 38,678 38,598 38,519 38,501 48,666 61,515 77,758
From Southern Areas 16.1% 16.3% 16.5% 16.6% 16.8% 17.0% 17.0% 17.0% 17.1% 17.1%
Salton Sea Visitors-S 7,480 7,558 7,636 7,715 7,795 7,874 7,892 10,002 12,677 16,067
Lake 2025 2026 2027 2028 2029 2030 2031 2032 2033 2034
Four County Population 18,905,569 19,036,139 19,167,878 19,300,798 19,434,914 19,570,237 19,706,781 19,844,559 19,983,585 20,123,873
San Diego 3,698,709 3,732,350 3,766,296 3,800,552 3,835,119 3,870,000 3,898,412 3,927,032 3,955,862 3,984,904
Imperial 217,977 221,771 225,631 229,558 233,554 237,619 241,755 245,963 250,244 254,600
6 County Population 22,822,255 22,990,259 23,159,805 23,330,908 23,503,586 23,677,856 23,846,947 24,017,554 24,189,691 24,363,377
Relationship 0.520% 0.653% 0.819% 1.029% 1.291% 1.291% 1.291% 1.291% 1.291% 1.291%
Salton Sea Visitors 118,654 150,056 189,772 240,002 303,531 305,782 307,966 310,169 312,392 314,635
From Northern Areas 82.8% 82.8% 82.8% 82.7% 82.7% 82.7% 82.6% 82.6% 82.6% 82.6%
Salton Sea Visitors-N 98,291 124,248 157,062 198,545 250,988 252,735 254,498 256,278 258,073 259,885
From Southern Areas 17.2% 17.2% 17.2% 17.3% 17.3% 17.3% 17.4% 17.4% 17.4% 17.4%
Salton Sea Visitors-S 20,363 25,808 32,710 41,457 52,544 53,047 53,467 53,891 54,319 54,750
Lake 2035 2036 2037 2038 2039 2040 2041 2042 2043 2044
Four County Population 20,265,437 20,386,380 20,508,123 20,630,672 20,754,033 20,878,210 20,955,411 21,033,059 21,111,158 21,189,712
San Diego 4,014,159 4,043,629 4,073,315 4,103,219 4,133,343 4,163,688 4,185,294 4,207,013 4,228,844 4,250,788
Imperial 259,031 263,540 268,127 272,794 277,542 282,373 285,190 288,035 290,909 293,811
6 County Population 24,538,627 24,693,549 24,849,565 25,006,686 25,164,918 25,324,271 25,425,895 25,528,107 25,630,911 25,734,311
Relationship 1.291% 1.291% 1.291% 1.291% 1.291% 1.291% 1.291% 1.291% 1.291% 1.291%
Salton Sea Visitors 316,898 318,899 320,914 322,943 324,986 327,044 328,357 329,677 331,004 332,340
From Northern Areas 82.6% 82.6% 82.5% 82.5% 82.5% 82.4% 82.4% 82.4% 82.4% 82.3%
Salton Sea Visitors-N 261,713 263,275 264,847 266,430 268,023 269,627 270,624 271,626 272,635 273,649
From Southern Areas 17.4% 17.4% 17.5% 17.5% 17.5% 17.6% 17.6% 17.6% 17.6% 17.7%
Salton Sea Visitors-S 55,185 55,624 56,067 56,513 56,963 57,418 57,733 58,050 58,369 58,690
Sources: Exhibit 17 & SCAG forecasts of Population to 2015-2040, SANDAG forecasts of Population, 2015-2050, CA Department of Finance forecast of population growth rates by county 2040-2060
Page 61 of 332

Recreational Demand Salton Sea Lake – North 34
Exhibit 20.- Estimates of Salton Sea SRA Visitors, By North & South Direction, By Year 2015-2062 (continued) Lake 2045 2046 2047 2048 2049 2050 2051 2052 2053 2054
Four County Population 21,268,723 21,332,272 21,396,177 21,460,439 21,525,062 21,590,047 21,635,749 21,681,705 21,727,916 21,774,385
San Diego 4,272,847 4,295,019 4,317,307 4,339,711 4,362,230 4,384,867 4,400,810 4,416,811 4,432,870 4,448,988
Imperial 296,742 299,347 301,974 304,625 307,298 309,995 312,296 314,613 316,948 319,300
6 County Population 25,838,312 25,926,639 26,015,458 26,104,775 26,194,591 26,284,910 26,348,855 26,413,129 26,477,734 26,542,673
Relationship 1.291% 1.291% 1.291% 1.291% 1.291% 1.291% 1.291% 1.291% 1.291% 1.291%
Salton Sea Visitors 333,683 334,823 335,970 337,124 338,284 339,450 340,276 341,106 341,940 342,779
From Northern Areas 82.3% 82.3% 82.2% 82.2% 82.2% 82.1% 82.1% 82.1% 82.1% 82.0%
Salton Sea Visitors-N 274,670 275,490 276,316 277,146 277,980 278,819 279,410 280,003 280,600 281,200
From Southern Areas 17.7% 17.7% 17.8% 17.8% 17.8% 17.9% 17.9% 17.9% 17.9% 18.0%
Salton Sea Visitors-S 59,013 59,333 59,655 59,978 60,304 60,631 60,866 61,103 61,340 61,579
Lake 2055 2056 2057 2058 2059 2060 2061 2062
Four County Population 21,821,113 21,846,640 21,872,372 21,898,310 21,924,456 21,950,809 21,977,372 22,004,146
San Diego 4,465,164 4,475,087 4,485,032 4,494,998 4,504,987 4,514,999 4,525,032 4,535,088
Imperial 321,669 323,677 325,698 327,731 329,776 331,835 333,906 335,990
6 County Population 26,607,946 26,645,404 26,683,101 26,721,039 26,759,219 26,797,643 26,836,310 26,875,224
Relationship 1.291% 1.291% 1.291% 1.291% 1.291% 1.291% 1.291% 1.291%
Salton Sea Visitors 343,622 344,106 344,592 345,082 345,575 346,072 346,571 347,074
From Northern Areas 82.0% 82.0% 82.0% 82.0% 81.9% 81.9% 81.9% 81.9%
Salton Sea Visitors-N 281,804 282,133 282,465 282,800 283,138 283,478 283,821 284,167
From Southern Areas 18.0% 18.0% 18.0% 18.0% 18.1% 18.1% 18.1% 18.1%
Salton Sea Visitors-S 61,818 61,972 62,127 62,282 62,437 62,593 62,750 62,906
Page 62 of 332

Recreational Demand Salton Sea Lake – North 35
C. For each visitor to the Salton Sea SRA who comes from the four northern counties, the economic impact is determined using the Coachella Valley’s tourist group spending previously discussed (Exhibit 4) divided by the average of 3.0 persons per group. Since few of these visitors are likely to use boats, that category of spending is omitted. This yields a total direct and secondary economic impact per person per day of $397.86 for this category of visitor versus the $466.86 for tourist from competitor lakes (Exhibit 21).
Exhibit 21.-Coachella Valley Tourist Spending Per Person, Per Day Sector Visitor Spending Share
Hotel $65.00 16.3%
Food/Beverage/Dining, excluding groceries $54.33 13.7%
Other-Total dollar amount spent $44.94 11.3%
Shopping/Gifts/Souvenirs $25.45 6.4%
Gasoline $24.22 6.1%
Casino / Gaming $22.49 5.7%
Groceries $13.93 3.5%
Entertainment, excluding gaming/Admissions $10.94 2.7%
Transportation (excl. parking/tolls) $7.91 2.0%
Amenities (spa, health club, tips, etc.) $7.11 1.8%
Parking/Tolls-Total dollar amount spent $0.94 0.2%
Total trip expenditures $277.27 69.7%
Secondary Sector Impact $120.59 30.3%
Total Economic Impact $397.86 100.0%
Note: Boating spending omitted Source: Exhibit 4 converted to per person per day by dividing by an average of 3.0 persons per group
D. To analyze the impact of northern area visitor days on the SSL-N economy, the number of visitors to the Salton Sea SRA over and above the 2022 level of 38,501 is calculated from 2022 to 2062 (Exhibit 22, row 1):
o In 2022, the calculation is 48,552 visitors (from Exhibit 20) – 38,501 (2021 level) = 10,165 new visitors to the environmentally secure Salton Sea.
o Each new visitor is assumed be on a 2.0 day trip (20,330 visitor days in 2022).
E. The change in visitor days from the 2021 level data are multiplied by the $397.86 relevant to determine the total economic impact of each year’s new visitors to the Salton Sea SRA (Exhibit 22, row 5):
o $8,088,845 in added spending in the SSL-N area during 2022
o $195,482,640 in added spending in the SSL-N area by 2062
F. The annual economic impact data from new SSL-N area tourists going to the Salton Sea SRA is then multiplied by the sector spending shares (Exhibit 21) to yield the array of added spending in the area (Exhibit 23).
Page 63 of 332

Recreational Demand Salton Sea Lake – North 36
Exhibit 22.-Economic Impact of New Northern Visitors to Salton Sea SRA, 2015-2062 2015 2016 2017 2018 2019 2020 2021 2022 2023 2024
Salton Sea SRA Visitors-North - New 0 0 0 0 0 0 0 10,165 23,014 39,257
Average Days 2.0 2.0 2.0 2.0 2.0 2.0 2.0 2.0 2.0 2.0
Average Visitor Days 0 0 0 0 0 0 0 20,330 46,028 78,514
Economic Impact Per Person $0.00 $0.00 $0.00 $0.00 $0.00 $0.00 $0.00 $397.86 $397.86 $397.86
Total Economic Impact $0 $0 $0 $0 $0 $0 $0 $8,088,345 $18,312,790 $31,237,651
Direct Spending 0 0 0 0 0 0 0 $5,636,724 $12,762,083 $21,769,348
Secondary Spending 0 0 0 0 0 0 0 $2,451,622 $5,550,707 $9,468,303
2025 2026 2027 2028 2029 2030 2031 2032 2033 2034
Salton Sea SRA Visitors-North- New 59,790 85,747 118,561 160,044 212,487 214,234 215,997 217,777 219,572 221,384
Average Days 2.0 2.0 2.0 2.0 2.0 2.0 2.0 2.0 2.0 2.0
Average Visitor Days 119,580 171,494 237,122 320,088 424,973 428,468 431,995 435,554 439,144 442,768
Economic Impact Per Person $397.86 $397.86 $397.86 $397.86 $397.86 $397.86 $397.86 $397.86 $397.86 $397.86
Total Economic Impact $47,576,372 $68,230,953 $94,341,794 $127,350,726 $169,080,717 $170,471,322 $171,874,474 $173,290,311 $174,718,972 $176,160,598
Direct Spending $33,155,713 $47,549,778 $65,746,280 $88,750,025 $117,831,427 $118,800,532 $119,778,381 $120,765,070 $121,760,696 $122,765,357
Secondary Spending $14,420,659 $20,681,175 $28,595,514 $38,600,702 $51,249,290 $51,670,790 $52,096,093 $52,525,241 $52,958,276 $53,395,241
2035 2036 2037 2038 2039 2040 2041 2042 2043 2044
Salton Sea SRA Visitors-North - New 223,212 224,774 226,346 227,929 229,522 231,126 232,123 233,125 234,134 235,148
Average Days 2.0 2.0 2.0 2.0 2.0 2.0 2.0 2.0 2.0 2.0
Average Visitor Days 446,424 449,548 452,692 455,858 459,044 462,251 464,245 466,251 468,268 470,297
Economic Impact Per Person $397.86 $397.86 $397.86 $397.86 $397.86 $397.86 $397.86 $397.86 $397.86 $397.86
Total Economic Impact $177,615,333 $178,858,166 $180,109,223 $181,368,560 $182,636,236 $183,912,306 $184,705,636 $185,503,566 $186,306,129 $187,113,359
Direct Spending $123,779,154 $124,645,277 $125,517,132 $126,394,758 $127,278,194 $128,167,480 $128,720,347 $129,276,420 $129,835,722 $130,398,277
Secondary Spending $53,836,179 $54,212,888 $54,592,090 $54,973,803 $55,358,042 $55,744,826 $55,985,288 $56,227,145 $56,470,407 $56,715,083
2045 2046 2047 2048 2049 2050 2051 2052 2053 2054
Salton Sea SRA Visitors-North 236,169 236,990 237,815 238,645 239,479 240,318 240,909 241,502 242,099 242,699
Average Days 2.0 2.0 2.0 2.0 2.0 2.0 2.0 2.0 2.0 2.0
Average Visitor Days 472,338 473,979 475,630 477,289 478,958 480,637 481,817 483,004 484,198 485,398
Economic Impact Per Person $397.86 $397.86 $397.86 $397.86 $397.86 $397.86 $397.86 $397.86 $397.86 $397.86
Total Economic Impact $187,925,291 $188,578,337 $189,235,034 $189,895,407 $190,559,482 $191,227,284 $191,696,921 $192,169,170 $192,644,048 $193,121,570
Direct Spending $130,964,108 $131,419,212 $131,876,860 $132,337,071 $132,799,861 $133,265,248 $133,592,536 $133,921,644 $134,252,583 $134,585,366
Secondary Spending $56,961,184 $57,159,125 $57,358,174 $57,558,337 $57,759,621 $57,962,036 $58,104,385 $58,247,527 $58,391,465 $58,536,204
Page 64 of 332

Recreational Demand Salton Sea Lake – North 37
Exhibit 22.-Economic Impact of New Northern Visitors to Salton Sea SRA, 2015-2062 (continued)
2055 2056 2057 2058 2059 2060 2061 2062
Salton Sea SRA Visitors-North 243,303 243,632 243,964 244,299 244,637 244,977 245,320 245,666
Average Days 2.0 2.0 2.0 2.0 2.0 2.0 2.0 2.0
Average Visitor Days 486,605 487,264 487,929 488,599 489,274 489,955 490,641 491,333
Economic Impact Per Person $397.86 $397.86 $397.86 $397.86 $397.86 $397.86 $397.86 $397.86
Total Economic Impact $193,601,754 $193,864,076 $194,128,504 $194,395,050 $194,663,725 $194,934,541 $195,207,509 $195,482,640
Direct Spending $134,920,004 $135,102,814 $135,287,092 $135,472,847 $135,660,085 $135,848,815 $136,039,045 $136,230,783
Secondary Spending $58,681,751 $58,761,262 $58,841,411 $58,922,203 $59,003,640 $59,085,726 $59,168,464 $59,251,857
Exhibit 23.-Spending by New Salton Sea SRA Tourists, North, 2022-2062 Sector Share 2015 2016 2017 2018 2019 2020 2021 2022 2023 2024
Hotel 16.3% $0 $0 $0 $0 $0 $0 $0 $1,321,418 $2,991,818 $5,103,393
Food/Beverage/Dining, excluding groceries 13.7% $0 $0 $0 $0 $0 $0 $0 $1,104,513 $2,500,723 $4,265,691
Other-Total dollar amount spent 11.3% $0 $0 $0 $0 $0 $0 $0 $913,700 $2,068,704 $3,528,761
Shopping/Gifts/Souvenirs 6.4% $0 $0 $0 $0 $0 $0 $0 $517,396 $1,171,435 $1,998,214
Gasoline 6.1% $0 $0 $0 $0 $0 $0 $0 $492,444 $1,114,940 $1,901,846
Casino / Gaming 5.7% $0 $0 $0 $0 $0 $0 $0 $457,217 $1,035,183 $1,765,798
Groceries 3.5% $0 $0 $0 $0 $0 $0 $0 $283,284 $641,381 $1,094,058
Entertainment, excluding gaming/Admissions 2.7% $0 $0 $0 $0 $0 $0 $0 $222,370 $503,468 $858,807
Transportation (excl. parking/tolls) 2.0% $0 $0 $0 $0 $0 $0 $0 $160,723 $363,893 $620,722
Amenities (spa, health club, tips, etc.) 1.8% $0 $0 $0 $0 $0 $0 $0 $144,577 $327,337 $558,366
Parking/Tolls-Total dollar amount spent 0.2% $0 $0 $0 $0 $0 $0 $0 $19,081 $43,202 $73,693
Total trip expenditures 69.7% $0 $0 $0 $0 $0 $0 $0 $5,636,724 $12,762,083 $21,769,348
Secondary Sector Impact 30.3% $0 $0 $0 $0 $0 $0 $0 $2,451,622 $5,550,707 $9,468,303
Total Impact 100.0% $0 $0 $0 $0 $0 $0 $0 $8,088,345 $18,312,790 $31,237,651
Page 65 of 332

Recreational Demand Salton Sea Lake – North 38
Exhibit 23.-Spending by New Salton Sea SRA Tourists, North, 2022-2062 (continued) Sector Share 2025 2026 2027 2028 2029 2030 2031 2032 2033 2034
Hotel 16.3% $7,772,701 $11,147,105 $15,412,915 $20,805,688 $27,623,248 $27,850,436 $28,079,673 $28,310,983 $28,544,387 $28,779,911
/Beverage/Dining, excluding groceries 13.7% $6,496,842 $9,317,351 $12,882,945 $17,390,515 $23,088,998 $23,278,894 $23,470,503 $23,663,844 $23,858,936 $24,055,799
Other-Total dollar amount spent 11.3% $5,374,464 $7,707,709 $10,657,320 $14,386,173 $19,100,201 $19,257,291 $19,415,798 $19,575,738 $19,737,127 $19,899,980
Shopping/Gifts/Souvenirs 6.4% $3,043,371 $4,364,606 $6,034,868 $8,146,387 $10,815,777 $10,904,731 $10,994,488 $11,085,056 $11,176,445 $11,268,663
Gasoline 6.1% $2,896,599 $4,154,115 $5,743,824 $7,753,512 $10,294,165 $10,378,829 $10,464,257 $10,550,458 $10,637,439 $10,725,210
Casino / Gaming 5.7% $2,689,391 $3,856,950 $5,332,940 $7,198,864 $9,557,771 $9,636,379 $9,715,696 $9,795,731 $9,876,490 $9,957,982
Groceries 3.5% $1,666,300 $2,389,699 $3,304,197 $4,460,291 $5,921,829 $5,970,534 $6,019,677 $6,069,265 $6,119,302 $6,169,793
Entertainment, excluding gaming/Admissions 2.7% $1,308,002 $1,875,852 $2,593,709 $3,501,213 $4,648,483 $4,686,714 $4,725,291 $4,764,216 $4,803,493 $4,843,128
Transportation (excl. parking/tolls) 2.0% $945,388 $1,355,814 $1,874,661 $2,530,580 $3,359,794 $3,387,427 $3,415,309 $3,443,443 $3,471,832 $3,500,478
Amenities (spa, health club, tips, etc.) 1.8% $850,417 $1,219,613 $1,686,339 $2,276,366 $3,022,281 $3,047,138 $3,072,219 $3,097,526 $3,123,063 $3,148,832
Parking/Tolls-Total dollar amount spent 0.2% $112,238 $160,964 $222,562 $300,434 $398,880 $402,160 $405,470 $408,811 $412,181 $415,582
Total trip expenditures 69.7% $33,155,713 $47,549,778 $65,746,280 $88,750,025 $117,831,427 $118,800,532 $119,778,381 $120,765,070 $121,760,696 $122,765,357
Secondary Sector Impact 30.3% $14,420,659 $20,681,175 $28,595,514 $38,600,702 $51,249,290 $51,670,790 $52,096,093 $52,525,241 $52,958,276 $53,395,241
Total Impact 100.0% $47,576,372 $68,230,953 $94,341,794 $127,350,726 $169,080,717 $170,471,322 $171,874,474 $173,290,311 $174,718,972 $176,160,598
Sector Share 2035 2036 2037 2038 2039 2040 2041 2042 2043 2044
Hotel 16.3% $29,017,575 $29,220,621 $29,425,010 $29,630,752 $29,837,856 $30,046,331 $30,175,940 $30,306,300 $30,437,418 $30,569,298
Food/Beverage/Dining, excluding groceries 13.7% $24,254,452 $24,424,168 $24,595,008 $24,766,978 $24,940,087 $25,114,342 $25,222,676 $25,331,638 $25,441,233 $25,551,465
Other-Total dollar amount spent 11.3% $20,064,314 $20,204,710 $20,346,036 $20,488,297 $20,631,500 $20,775,651 $20,865,270 $20,955,408 $21,046,070 $21,137,258
Shopping/Gifts/Souvenirs 6.4% $11,361,720 $11,441,222 $11,521,249 $11,601,807 $11,682,898 $11,764,525 $11,815,273 $11,866,315 $11,917,654 $11,969,291
Gasoline 6.1% $10,813,779 $10,889,446 $10,965,615 $11,042,287 $11,119,467 $11,197,158 $11,245,459 $11,294,039 $11,342,902 $11,392,048
Casino / Gaming 5.7% $10,040,215 $10,110,470 $10,181,189 $10,252,377 $10,324,036 $10,396,169 $10,441,015 $10,486,120 $10,531,487 $10,577,118
Groceries 3.5% $6,220,743 $6,264,272 $6,308,088 $6,352,195 $6,396,594 $6,441,286 $6,469,072 $6,497,018 $6,525,127 $6,553,399
Entertainment, excluding gaming/Admissions 2.7% $4,883,122 $4,917,291 $4,951,686 $4,986,308 $5,021,160 $5,056,243 $5,078,054 $5,099,991 $5,122,055 $5,144,248
Transportation (excl. parking/tolls) 2.0% $3,529,385 $3,554,082 $3,578,941 $3,603,966 $3,629,155 $3,654,512 $3,670,276 $3,686,132 $3,702,080 $3,718,120
Amenities (spa, health club, tips, etc.) 1.8% $3,174,835 $3,197,051 $3,219,413 $3,241,923 $3,264,583 $3,287,392 $3,301,573 $3,315,836 $3,330,181 $3,344,610
Parking/Tolls-Total dollar amount spent 0.2% $419,014 $421,946 $424,897 $427,868 $430,859 $433,869 $435,741 $437,623 $439,516 $441,421
Total trip expenditures 69.7% $123,779,154 $124,645,277 $125,517,132 $126,394,758 $127,278,194 $128,167,480 $128,720,347 $129,276,420 $129,835,722 $130,398,277
Secondary Sector Impact 30.3% $53,836,179 $54,212,888 $54,592,090 $54,973,803 $55,358,042 $55,744,826 $55,985,288 $56,227,145 $56,470,407 $56,715,083
Total Impact 100.0% $177,615,333 $178,858,166 $180,109,223 $181,368,560 $182,636,236 $183,912,306 $184,705,636 $185,503,566 $186,306,129 $187,113,359
Page 66 of 332

Recreational Demand Salton Sea Lake – North 39
Exhibit 23.-Spending by New Salton Sea SRA Tourists, North, 2022-2062 (continued) Sector Share 2045 2046 2047 2048 2049 2050 2051 2052 2053 2054
Hotel 16.3% $30,701,945 $30,808,636 $30,915,922 $31,023,809 $31,132,301 $31,241,402 $31,318,128 $31,395,281 $31,472,863 $31,550,878
/Beverage/Dining, excluding groceries 13.7% $25,662,339 $25,751,517 $25,841,193 $25,931,370 $26,022,054 $26,113,246 $26,177,378 $26,241,867 $26,306,714 $26,371,923
Other-Total dollar amount spent 11.3% $21,228,978 $21,302,750 $21,376,933 $21,451,532 $21,526,550 $21,601,988 $21,655,040 $21,708,388 $21,762,032 $21,815,976
Shopping/Gifts/Souvenirs 6.4% $12,021,229 $12,063,003 $12,105,010 $12,147,253 $12,189,733 $12,232,451 $12,262,493 $12,292,702 $12,323,079 $12,353,625
Gasoline 6.1% $11,441,481 $11,481,241 $11,521,223 $11,561,428 $11,601,859 $11,642,517 $11,671,110 $11,699,862 $11,728,774 $11,757,847
Casino / Gaming 5.7% $10,623,015 $10,659,930 $10,697,052 $10,734,381 $10,771,920 $10,809,669 $10,836,217 $10,862,912 $10,889,756 $10,916,749
Groceries 3.5% $6,581,836 $6,604,708 $6,627,708 $6,650,837 $6,674,095 $6,697,484 $6,713,932 $6,730,472 $6,747,104 $6,763,829
Entertainment, excluding gaming/Admissions 2.7% $5,166,571 $5,184,525 $5,202,579 $5,220,734 $5,238,992 $5,257,351 $5,270,263 $5,283,246 $5,296,302 $5,309,430
Transportation (excl. parking/tolls) 2.0% $3,734,254 $3,747,231 $3,760,280 $3,773,402 $3,786,598 $3,799,868 $3,809,200 $3,818,584 $3,828,020 $3,837,509
Amenities (spa, health club, tips, etc.) 1.8% $3,359,123 $3,370,797 $3,382,535 $3,394,339 $3,406,209 $3,418,146 $3,426,541 $3,434,982 $3,443,470 $3,452,006
Parking/Tolls-Total dollar amount spent 0.2% $443,336 $444,877 $446,426 $447,984 $449,550 $451,126 $452,234 $453,348 $454,468 $455,595
Total trip expenditures 69.7% $130,964,108 $131,419,212 $131,876,860 $132,337,071 $132,799,861 $133,265,248 $133,592,536 $133,921,644 $134,252,583 $134,585,366
Secondary Sector Impact 30.3% $56,961,184 $57,159,125 $57,358,174 $57,558,337 $57,759,621 $57,962,036 $58,104,385 $58,247,527 $58,391,465 $58,536,204
Total Impact 100.0% $187,925,291 $188,578,337 $189,235,034 $189,895,407 $190,559,482 $191,227,284 $191,696,921 $192,169,170 $192,644,048 $193,121,570
Sector Share 2055 2056 2057 2058 2059 2060 2061 2062
Hotel 16.3% $31,629,327 $31,672,183 $31,715,384 $31,758,930 $31,802,825 $31,847,069 $31,891,664 $31,936,613
Food/Beverage/Dining, excluding groceries 13.7% $26,437,495 $26,473,316 $26,509,425 $26,545,824 $26,582,513 $26,619,495 $26,656,770 $26,694,341
Other-Total dollar amount spent 11.3% $21,870,220 $21,899,853 $21,929,724 $21,959,834 $21,990,185 $22,020,778 $22,051,614 $22,082,694
Shopping/Gifts/Souvenirs 6.4% $12,384,341 $12,401,122 $12,418,037 $12,435,087 $12,452,274 $12,469,597 $12,487,058 $12,504,658
Gasoline 6.1% $11,787,082 $11,803,053 $11,819,152 $11,835,381 $11,851,738 $11,868,227 $11,884,846 $11,901,597
Casino / Gaming 5.7% $10,943,893 $10,958,722 $10,973,669 $10,988,736 $11,003,924 $11,019,233 $11,034,663 $11,050,216
Groceries 3.5% $6,780,646 $6,789,834 $6,799,095 $6,808,431 $6,817,841 $6,827,326 $6,836,886 $6,846,522
Entertainment, excluding gaming/Admissions 2.7% $5,322,632 $5,329,844 $5,337,114 $5,344,442 $5,351,828 $5,359,274 $5,366,778 $5,374,342
Transportation (excl. parking/tolls) 2.0% $3,847,051 $3,852,263 $3,857,518 $3,862,814 $3,868,153 $3,873,534 $3,878,959 $3,884,426
Amenities (spa, health club, tips, etc.) 1.8% $3,460,589 $3,465,278 $3,470,005 $3,474,769 $3,479,571 $3,484,412 $3,489,292 $3,494,209
Parking/Tolls-Total dollar amount spent 0.2% $456,727 $457,346 $457,970 $458,599 $459,233 $459,872 $460,516 $461,165
Total trip expenditures 69.7% $134,920,004 $135,102,814 $135,287,092 $135,472,847 $135,660,085 $135,848,815 $136,039,045 $136,230,783
Secondary Sector Impact 30.3% $58,681,751 $58,761,262 $58,841,411 $58,922,203 $59,003,640 $59,085,726 $59,168,464 $59,251,857
Total Impact 100.0% $193,601,754 $193,864,076 $194,128,504 $194,395,050 $194,663,725 $194,934,541 $195,207,509 $195,482,640
Page 67 of 332

Recreational Demand Salton Sea Lake – North 40
16. Grand Total Economic Impact. It remains to add the annual economic impact of new northern visitors to the Salton Sea SRA (Exhibit 22) to that of annual impact of the tourists captured from other lakes (Exhibit 16) to determine the grand total impact of building the SSL-N (Exhibit 24). Also, the sector breakdown of the independent tourist spending (Exhibit 23) must be added to that of tourists captured from other lakes (Exhibit 17). Those totals are also show below (Exhibit 24).
Grand total economic impact of SSL-N would go from $280 million in 2022 to $1,825 million ($1.8 billion) by 2062 in constant 2015 inflation adjusted dollars.
Sector breakdowns show that the major beneficiaries would be:
Hotels would go from an added $39 million in 2022 to $259 million in 2062.
Food & Beverage and Dining outlets would rank second going from $33 million in 2022 to $216 million in 2062.
Boat related services would go from $28 million in 2022 to $168 million in 2062.
Shopping outlets would increases from $15 million in 2022 to $101 million in 2062
Service station would see business go from $15 million in 2022 to $96 million in 2062
Again, these estimates do not include additional spending that would occur in each of these sectors, as well as the others not listed, as monies that initially come to the SSL-N market from tourists change hands within the area as the secondary spending impact takes hold. This is quite significant in an area like the SSL-N market because it is a relatively self sufficient, particularly in the provision of labor and services.
17. Economic Impact of Ecological Disaster. In December 2014, the Greater Palm Springs Convention and Visitors Bureau released a study commissioned by them and analyzed by Tourism Economics on the potential downside impact on the Coachella Valley’s economy of allowing the environmental condition at the Salton Sea to continue to deteriorate. Viewing a five year time horizon, that study found the following:
“These case studies indicate a potential loss in visitor spending ranging from 5% to 25% per year. The potentially elongated period of time when the Salton Sea could damage the Greater Palm Springs tourism product could cause these losses to accumulate.”
“The degradation of the Salton Sea could cost the Greater Palm Springs region between $1.3 billion and $6.5 billion in lost tourism spending over five years. The resulting total economic loss would range from $1.7 billion to $8.6 billion, including indirect supply chain and induced income effects.”
Interestingly, in the first five years of operation of the restored SSL-N, the positive economic impact would total $1.95 billion (Exhibit 24). Avoiding the losses from ecological disaster as well as experiencing the tourist spending gains analyzed in this report underscore the extraordinary economic importance of the Salton Sea’s restoration to the SSL-N area.
Page 68 of 332

Recreational Demand Salton Sea Lake – North 41
Exhibit 24A.-Grand Total Economic Impact – Salton Sea Lake-North 2015-2024 2015 2016 2017 2018 2019 2020 2021 2022 2023 2024
Lake Captured Tourists $0 $0 $0 $0 $0 $0 $0 $271,630,484 $313,190,728 $355,235,157
Salton Sea SRA Tourists $0 $0 $0 $0 $0 $0 $0 $8,088,345 $18,312,790 $31,237,651
Total Economic Impact $0 $0 $0 $0 $0 $0 $0 $279,718,829 $331,503,519 $386,472,807
Direct Spending $0 $0 $0 $0 $0 $0 $0 $194,934,522 $231,022,989 $269,330,786
Secondary Spending $0 $0 $0 $0 $0 $0 $0 $84,784,307 $100,480,530 $117,142,022
Sector Shares
Hotel $0 $0 $0 $0 $0 $0 $0 $39,140,088 $46,596,853 $54,562,205
Food/Beverage/Dining, excluding groceries $0 $0 $0 $0 $0 $0 $0 $32,715,393 $38,948,159 $45,606,029
Boat Costs $0 $0 $0 $0 $0 $0 $0 $27,976,154 $32,256,586 $36,586,886
Other-Total dollar amount spent $0 $0 $0 $0 $0 $0 $0 $27,063,564 $32,219,573 $37,727,247
Shopping/Gifts/Souvenirs $0 $0 $0 $0 $0 $0 $0 $15,325,151 $18,244,818 $21,363,622
Gasoline $0 $0 $0 $0 $0 $0 $0 $14,586,066 $17,364,927 $20,333,319
Casino / Gaming $0 $0 $0 $0 $0 $0 $0 $13,542,651 $16,122,726 $18,878,775
Groceries $0 $0 $0 $0 $0 $0 $0 $8,390,792 $9,989,362 $11,696,962
Entertainment, excluding gaming/Admissions $0 $0 $0 $0 $0 $0 $0 $6,586,554 $7,841,390 $9,181,812
Transportation (excl. parking/tolls) $0 $0 $0 $0 $0 $0 $0 $4,760,579 $5,667,539 $6,636,359
Amenities (spa, health club, tips, etc.) $0 $0 $0 $0 $0 $0 $0 $4,282,347 $5,098,198 $5,969,693
Parking/Tolls-Total dollar amount spent $0 $0 $0 $0 $0 $0 $0 $565,183 $672,859 $787,878
Total trip expenditures $0 $0 $0 $0 $0 $0 $0 $194,934,522 $231,022,989 $269,330,786
Secondary Sector Impact $0 $0 $0 $0 $0 $0 $0 $84,784,307 $100,480,530 $117,142,022
TOTAL $0 $0 $0 $0 $0 $0 $0 $279,718,829 $331,503,519 $386,472,807
Page 69 of 332

Recreational Demand Salton Sea Lake – North 42
Exhibit 24B.-Grand Total Economic Impact – Salton Sea Lake-North 2025-2034 2025 2026 2027 2028 2029 2030 2031 2032 2033 2034
Lake Captured Tourists $397,769,368 $440,799,038 $484,329,919 $528,367,844 $572,918,723 $617,988,550 $670,256,976 $723,136,557 $776,634,483 $830,758,044
Salton Sea SRA Tourists $47,576,372 $68,230,953 $94,341,794 $127,350,726 $169,080,717 $170,471,322 $171,874,474 $173,290,311 $174,718,972 $176,160,598
Total Economic Impact $445,345,740 $509,029,991 $578,671,713 $655,718,570 $741,999,439 $788,459,871 $842,131,450 $896,426,867 $951,353,455 $1,006,918,642
Direct Spending $310,359,011 $354,740,217 $403,273,152 $456,966,685 $517,095,351 $549,473,372 $586,876,801 $624,714,981 $662,993,019 $701,716,095
Secondary Spending $134,986,730 $154,289,774 $175,398,561 $198,751,885 $224,904,088 $238,986,499 $255,254,648 $271,711,886 $288,360,436 $305,202,548
Sector Shares
Hotel $63,153,482 $72,518,837 $82,845,381 $94,369,482 $107,389,788 $113,891,974 $121,398,459 $128,992,107 $136,673,941 $144,444,999
Food/Beverage/Dining $52,787,081 $60,615,149 $69,246,630 $78,879,095 $89,762,167 $95,197,045 $101,471,369 $107,818,549 $114,239,439 $120,734,908
Boat Costs $40,967,630 $45,399,403 $49,882,798 $54,418,415 $59,006,862 $63,648,758 $69,032,063 $74,478,312 $79,988,247 $85,562,618
Other-Total dollar amount spent $43,667,718 $50,143,429 $57,283,757 $65,252,141 $74,255,082 $78,751,044 $83,941,432 $89,192,088 $94,503,722 $99,877,050
Shopping/Gifts/Souvenirs $24,727,503 $28,394,472 $32,437,790 $36,950,008 $42,048,058 $44,593,964 $47,533,100 $50,506,363 $53,514,156 $56,556,884
Gasoline $23,534,971 $27,025,093 $30,873,414 $35,168,022 $40,020,209 $42,443,334 $45,240,723 $48,070,595 $50,933,331 $53,829,318
Casino / Gaming $21,851,396 $25,091,852 $28,664,884 $32,652,276 $37,157,362 $39,407,149 $42,004,427 $44,631,864 $47,289,814 $49,978,636
Groceries $13,538,746 $15,546,477 $17,760,265 $20,230,784 $23,022,058 $24,415,986 $26,025,215 $27,653,129 $29,299,949 $30,965,897
Entertainment, excluding gaming/Admissions
$10,627,565 $12,203,581 $13,941,348 $15,880,642 $18,071,719 $19,165,917 $20,429,119 $21,706,990 $22,999,701 $24,307,427
Transportation (excl. parking/tolls) $7,681,309 $8,820,410 $10,076,420 $11,478,088 $13,061,737 $13,852,593 $14,765,601 $15,689,211 $16,623,546 $17,568,734
Amenities (spa, health club, tips, etc.) $6,909,671 $7,934,342 $9,064,177 $10,325,038 $11,749,599 $12,461,009 $13,282,299 $14,113,126 $14,953,601 $15,803,838
Parking/Tolls-Total dollar amount spent $911,936 $1,047,172 $1,196,287 $1,362,695 $1,550,709 $1,644,600 $1,752,994 $1,862,646 $1,973,572 $2,085,786
Total trip expenditures $310,359,011 $354,740,217 $403,273,152 $456,966,685 $517,095,351 $549,473,372 $586,876,801 $624,714,981 $662,993,019 $701,716,095
Secondary Sector Impact $134,986,730 $154,289,774 $175,398,561 $198,751,885 $224,904,088 $238,986,499 $255,254,648 $271,711,886 $288,360,436 $305,202,548
TOTAL $445,345,740 $509,029,991 $578,671,713 $655,718,570 $741,999,439 $788,459,871 $842,131,450 $896,426,867 $951,353,455 $1,006,918,642
Page 70 of 332

Recreational Demand Salton Sea Lake – North 43
Exhibit 24C.-Grand Total Economic Impact – Salton Sea Lake-North 2035-2044 2035 2036 2037 2038 2039 2040 2041 2042 2043 2044
Lake Captured Tourists $884,913,028 $939,360,997 $994,402,394 $1,050,042,835 $1,106,287,984 $1,160,668,011 $1,214,809,265 $1,269,268,251 $1,294,451,951 $1,319,782,162
Salton Sea SRA Tourists $177,334,715 $178,575,597 $179,824,690 $181,082,052 $182,347,737 $183,621,805 $184,413,890 $185,210,567 $186,011,871 $186,817,834
Total Economic Impact $1,062,247,743 $1,117,936,594 $1,174,227,085 $1,231,124,886 $1,288,635,722 $1,344,289,816 $1,399,223,155 $1,454,478,818 $1,480,463,822 $1,506,599,996
Direct Spending $740,274,642 $779,083,898 $818,312,433 $857,964,200 $898,043,186 $936,828,220 $975,110,964 $1,013,618,333 $1,031,727,140 $1,049,941,297
Secondary Spending $321,973,101 $338,852,696 $355,914,652 $373,160,687 $390,592,535 $407,461,596 $424,112,191 $440,860,485 $448,736,682 $456,658,699
Sector Shares
Hotel $152,176,728 $159,960,157 $167,827,550 $175,779,696 $183,817,396 $191,596,787 $199,264,191 $206,976,582 $210,613,779 $214,272,136
Food/Beverage/Dining $127,197,504 $133,703,313 $140,279,303 $146,926,135 $153,644,477 $160,146,911 $166,555,740 $173,002,172 $176,042,338 $179,100,189
Boat Costs $91,140,225 $96,748,008 $102,416,910 $108,147,510 $113,940,390 $119,541,175 $125,117,369 $130,726,286 $133,320,042 $135,928,887
Other-Total dollar amount spent $105,223,184 $110,605,066 $116,045,005 $121,543,547 $127,101,245 $132,480,335 $137,781,991 $143,114,754 $145,629,708 $148,159,293
Shopping/Gifts/Souvenirs $59,584,213 $62,631,784 $65,712,232 $68,825,864 $71,972,994 $75,018,985 $78,021,128 $81,040,885 $82,465,015 $83,897,431
Gasoline $56,710,648 $59,611,244 $62,543,131 $65,506,603 $68,501,956 $71,401,048 $74,258,406 $77,132,530 $78,487,979 $79,851,314
Casino / Gaming $52,653,850 $55,346,953 $58,069,107 $60,820,586 $63,601,667 $66,293,373 $68,946,330 $71,614,853 $72,873,340 $74,139,148
Groceries $32,623,413 $34,292,012 $35,978,612 $37,683,381 $39,406,491 $41,074,224 $42,717,951 $44,371,321 $45,151,058 $45,935,331
Entertainment, excluding gaming/Admissions
$25,608,534 $26,918,341 $28,242,278 $29,580,478 $30,933,074 $32,242,202 $33,532,485 $34,830,338 $35,442,411 $36,058,045
Transportation (excl. parking/tolls) $18,509,138 $19,455,831 $20,412,736 $21,379,949 $22,357,568 $23,303,770 $24,236,350 $25,174,403 $25,616,792 $26,061,755
Amenities (spa, health club, tips, etc.) $16,649,773 $17,501,364 $18,362,141 $19,232,192 $20,111,603 $20,962,752 $21,801,648 $22,645,467 $23,043,416 $23,443,679
Parking/Tolls-Total dollar amount spent $2,197,432 $2,309,825 $2,423,430 $2,538,259 $2,654,323 $2,766,658 $2,877,375 $2,988,742 $3,041,263 $3,094,090
Total trip expenditures $740,274,642 $779,083,898 $818,312,433 $857,964,200 $898,043,186 $936,828,220 $975,110,964 $1,013,618,333 $1,031,727,140 $1,049,941,297
Secondary Sector Impact $321,973,101 $338,852,696 $355,914,652 $373,160,687 $390,592,535 $407,461,596 $424,112,191 $440,860,485 $448,736,682 $456,658,699
TOTAL $1,062,247,743 $1,117,936,594 $1,174,227,085 $1,231,124,886 $1,288,635,722 $1,344,289,816 $1,399,223,155 $1,454,478,818 $1,480,463,822 $1,506,599,996
Page 71 of 332

Recreational Demand Salton Sea Lake – North 44
Exhibit 24D.-Grand Total Economic Impact – Salton Sea Lake-North 2045-2054 2045 2046 2047 2048 2049 2050 2051 2052 2053 2054
Lake Captured Tourists $1,345,259,996 $1,369,866,646 $1,394,585,504 $1,419,417,415 $1,444,363,230 $1,469,423,811 $1,490,740,939 $1,512,123,440 $1,533,571,849 $1,555,086,705
Salton Sea SRA Tourists $187,925,291 $188,578,337 $189,235,034 $189,895,407 $190,559,482 $191,227,284 $191,696,921 $192,169,170 $192,644,048 $193,121,570
Total Economic Impact $1,533,185,288 $1,558,444,984 $1,583,820,538 $1,609,312,822 $1,634,922,712 $1,660,651,095 $1,682,437,860 $1,704,292,611 $1,726,215,897 $1,748,208,275
Direct Spending $1,068,468,441 $1,086,071,785 $1,103,755,871 $1,121,521,304 $1,139,368,696 $1,157,298,665 $1,172,481,743 $1,187,712,199 $1,202,990,417 $1,218,316,785
Secondary Spending $464,716,846 $472,373,198 $480,064,668 $487,791,518 $495,554,016 $503,352,430 $509,956,117 $516,580,412 $523,225,480 $529,891,490
Sector Shares
Hotel $218,000,302 $221,532,936 $225,081,789 $228,646,983 $232,228,640 $235,826,885 $238,871,560 $241,925,763 $244,989,573 $248,063,065
Food/Beverage/Dining $182,216,391 $185,169,157 $188,135,479 $191,115,460 $194,109,202 $197,116,809 $199,661,712 $202,214,580 $204,775,477 $207,344,467
Boat Costs $138,552,937 $141,087,260 $143,633,140 $146,190,663 $148,759,918 $151,340,993 $153,536,517 $155,738,774 $157,947,820 $160,163,708
Other-Total dollar amount spent $150,737,147 $153,179,801 $155,633,669 $158,098,836 $160,575,386 $163,063,407 $165,168,659 $167,280,500 $169,398,982 $171,524,161
Shopping/Gifts/Souvenirs $85,357,180 $86,740,369 $88,129,909 $89,525,847 $90,928,231 $92,337,110 $93,529,241 $94,725,102 $95,924,725 $97,128,139
Gasoline $81,240,663 $82,557,146 $83,879,672 $85,208,288 $86,543,040 $87,883,973 $89,018,610 $90,156,799 $91,298,568 $92,443,945
Casino / Gaming $75,429,111 $76,651,418 $77,879,338 $79,112,911 $80,352,181 $81,597,191 $82,650,662 $83,707,431 $84,767,523 $85,830,966
Groceries $46,734,569 $47,491,890 $48,252,688 $49,016,988 $49,784,819 $50,556,205 $51,208,918 $51,863,673 $52,520,488 $53,179,378
Entertainment, excluding gaming/Admissions
$36,685,426 $37,279,903 $37,877,110 $38,477,066 $39,079,793 $39,685,311 $40,197,674 $40,711,640 $41,227,222 $41,744,434
Transportation (excl. parking/tolls) $26,515,209 $26,944,881 $27,376,525 $27,810,157 $28,245,791 $28,683,443 $29,053,764 $29,425,245 $29,797,893 $30,171,720
Amenities (spa, health club, tips, etc.) $23,851,581 $24,238,089 $24,626,372 $25,016,442 $25,408,314 $25,802,001 $26,135,121 $26,469,284 $26,804,498 $27,140,771
Parking/Tolls-Total dollar amount spent $3,147,924 $3,198,936 $3,250,181 $3,301,662 $3,353,382 $3,405,340 $3,449,305 $3,493,408 $3,537,649 $3,582,031
Total trip expenditures $1,068,468,441 $1,086,071,785 $1,103,755,871 $1,121,521,304 $1,139,368,696 $1,157,298,665 $1,172,481,743 $1,187,712,199 $1,202,990,417 $1,218,316,785
Secondary Sector Impact $464,716,846 $472,373,198 $480,064,668 $487,791,518 $495,554,016 $503,352,430 $509,956,117 $516,580,412 $523,225,480 $529,891,490
TOTAL $1,533,185,288 $1,558,444,984 $1,583,820,538 $1,609,312,822 $1,634,922,712 $1,660,651,095 $1,682,437,860 $1,704,292,611 $1,726,215,897 $1,748,208,275
Page 72 of 332

Recreational Demand Salton Sea Lake – North 45
Exhibit 24E.-Grand Total Economic Impact – Salton Sea Lake-North 2055-2062 2055 2056 2057 2058 2059 2060 2061 2062
Lake Captured Tourists $1,576,668,551 $1,587,009,257 $1,597,368,640 $1,607,746,957 $1,618,144,466 $1,628,561,427 $1,629,282,197 $1,630,014,215
Salton Sea SRA Tourists $193,601,754 $193,864,076 $194,128,504 $194,395,050 $194,663,725 $194,934,541 $195,207,509 $195,482,640
Total Economic Impact $1,770,270,305 $1,780,873,332 $1,791,497,143 $1,802,142,006 $1,812,808,191 $1,823,495,968 $1,824,489,706 $1,825,496,855
Direct Spending $1,233,691,694 $1,241,080,885 $1,248,484,561 $1,255,902,908 $1,263,336,113 $1,270,784,367 $1,271,476,897 $1,272,178,774
Secondary Spending $536,578,612 $539,792,447 $543,012,583 $546,239,099 $549,472,078 $552,711,601 $553,012,809 $553,318,081
Sector Shares
Hotel $251,146,320 $252,628,896 $254,114,416 $255,602,919 $257,094,441 $258,589,022 $258,733,969 $258,880,836
Food/Beverage/Dining $209,921,617 $211,160,834 $212,402,512 $213,646,683 $214,893,378 $216,142,629 $216,263,783 $216,386,542
Boat Costs $162,386,497 $163,451,521 $164,518,470 $165,587,368 $166,658,243 $167,731,122 $167,805,356 $167,880,749
Other-Total dollar amount spent $173,656,089 $174,681,222 $175,708,390 $176,737,621 $177,768,940 $178,802,374 $178,902,598 $179,004,150
Shopping/Gifts/Souvenirs $98,335,376 $98,915,872 $99,497,522 $100,080,340 $100,664,340 $101,249,537 $101,306,291 $101,363,796
Gasoline $93,592,960 $94,145,462 $94,699,060 $95,253,770 $95,809,606 $96,366,581 $96,420,597 $96,475,329
Casino / Gaming $86,897,786 $87,410,764 $87,924,761 $88,439,790 $88,955,863 $89,472,995 $89,523,148 $89,573,964
Groceries $53,840,362 $54,158,194 $54,476,658 $54,795,760 $55,115,511 $55,435,917 $55,466,990 $55,498,475
Entertainment, NOT gaming/Admissions $42,263,289 $42,512,779 $42,762,765 $43,013,252 $43,264,248 $43,515,758 $43,540,150 $43,564,865
Transportation (excl. parking/tolls) $30,546,734 $30,727,058 $30,907,741 $31,088,786 $31,270,199 $31,451,984 $31,469,614 $31,487,477
Amenities (spa, health club, tips, etc.) $27,478,112 $27,640,322 $27,802,854 $27,965,712 $28,128,901 $28,292,424 $28,308,283 $28,324,351
Parking/Tolls-Total dollar amount spent $3,626,553 $3,647,961 $3,669,412 $3,690,906 $3,712,444 $3,734,025 $3,736,119 $3,738,239
Total trip expenditures $1,233,691,694 $1,241,080,885 $1,248,484,561 $1,255,902,908 $1,263,336,113 $1,270,784,367 $1,271,476,897 $1,272,178,774
Secondary Sector Impact $536,578,612 $539,792,447 $543,012,583 $546,239,099 $549,472,078 $552,711,601 $553,012,809 $553,318,081
TOTAL $1,770,270,305 $1,780,873,332 $1,791,497,143 $1,802,142,006 $1,812,808,191 $1,823,495,968 $1,824,489,706 $1,825,496,855
Page 73 of 332

BENCHMARK 5:
INFRASTRUCTURE FINANCING
FEASIBILITY ANALYSIS
Appendix 2.2: Tourist Demand Forecast Salton
Sea Lake – South, 2022-2062
Page 74 of 332

Recreational Demand Salton Sea Lake – South i
Economics & Politics, Inc. P.O. Box 8730
Redlands, CA 92375 (909) 307-9444 Phone
[email protected] www.johnhusing.com
Tourist Demand Forecast Salton Sea Lake – South, 2022-2062 Executive Summary
John E. Husing, Ph.D.
As part of the Phase 2 study of the ability to finance development of a recreational system from the Salton Sea, an analysis was needed of the tourism impact of the Salton Sea Lake-South (SSL-S) on Imperial County. For this portion of the project, Economics & Politics, Inc. has been tasked with looking at the economic impact of such a facility over the period from 2022 when it might open until 2062. That would represent the 45 year period that is the limitation on funding through an Enhanced Infrastructure Financing District (EIFD) which could be started in 2017. For this analysis, an increase in potential tourism from two groups was reviewed:
Lake users captured from San Diego County.
Tourists independently going to the Salton Sea State Recreational Area.
This work concluded that the economic impact of these combined groups of tourists would be:
$56.9 million in 2022 when the SSL-S would be able to open.
$557.5 million in 2062 at the end of the forecast period.
The first 5 years of SSL-S (2022-2026), the cumulative impact would be $380.8 million.
This analysis started by assuming that the vast bulk of people impacting Imperial County’s economy by coming to the SSL-S would be from San Diego County. Those living in the balance of Southern California were assumed to use the previously analyzed SSL-N. For those using the SSL-S from Imperial County, the assumption was that they would likely be day tourists since the distances from the county’s population center to the lake’s edge averaged just 33 miles or 35 minutes driving time. Their spending was thus conservatively viewed as already part of the Imperial County economy, not an addition to it.
A key to estimating the impact of San Diego County tourism spending at the SSL-S was the distinctive similarity between that county and Orange County. Both are coastal locations with the following important similarities as of 2015:
Metric San Diego Orange Population 3,227,496 3,157,074Registered Pleasure Craft 51,640 50,534Ratio: Boats to Population 1.600% 1.601%Per Capita Income $31,770 $34,886Population Center to a Salton Sea Lake 111 miles (SSL-S) 137 miles (SSL-N)Driving Time to a Salton Seal Lake 2:25 (SSL-S) 2:13 (SSL-N)
Page 75 of 332

Recreational Demand Salton Sea Lake – South 2
Given these facts, it was assumed that the tendency for San Diego County’s population to use a 20 square mile fresh water lake that is a 111 mile, 2 hour 25 minute drive from its population center would be similar to that of Orange County. That county’s population center is a 137 mile, 2 hour 13 minute drive from a 10 square mile lake. The Orange County potential lake visitors ratio to population was 13% in 2015. That factor was applied to San Diego County throughout its 2022-2062 period. In 2022, the figure would equal the estimated population of 3,599,956 x 13.0% = 468,6620 potential of San Diego County lake visitors.
The SSL-S would have competition from 23 reservoirs and lakes throughout San Diego County. The grand total of these facilities represented 18 square miles of surface area. However, only six have over 1,000 acres of surface area, ranging from 1,100-1,562 acres. Only one of these, El Capitan Reservoir, allows use of recreational watercraft beyond those for fishing.
To determine the extent that the SSL-S would see these potential visitors, the capture rate was assumed to be 10% in year one (2022) due to the excitement of a new lake. It would increase by 1.5% per year to reach a 20% capture rate in 2030 as tourists become increasingly familiar with the site. The pace would add 2.0% per year through 2055, reaching a 70% capture rate. The increase would be consistent with more and more facilities being available for tourists. It would advance 1% per year from there to 2062 ending at 75%. In 2022, the number of estimated lake tourists would be 468,620 x 10% = 46,862. Based on a 365 day year, the average count of lake tourists per day in 2022 would be 449.
Next, the average days a user of the SSL-S would likely stay during a visit were estimated based upon studies of the length of time users stayed at various lakes and their distance from population centers. These were reduced to be conservative. The averages would be 3.5 days for San Diego County. In 2022, the number of visitor days would be 46,862 x 3.5 = 164,017.
Given the number of visitor days estimated for 2022 (468,620), the average economic impact per visitor per day was calculated. This was done by adapting the direct spending estimated for the SSL-N to the lower cost conditions likely in Imperial County. The adjustments were made after reviewing the costs of goods and service in Palm Desert and El Centro using the AreaVibes website. Specifically, the hotel room rate was reduced to an average of $65 per group. Casino spending was eliminated. Eating and drinking costs were reduced -10%. Other items except food and fuel were reduced by -15%. The result was direct spending of $710.82 per tourist party.
Once these dollars enter the SSL-S economy, they change hands locally as workers are hired, supplies and services are purchased by the firms initially receiving the money. The ratio is $0.435 in additional local spending per $1.00 coming to the market. The $710.82 from direct spending thus creates total local economic activity of $1,019.98 per tourist party.
Page 76 of 332

Recreational Demand Salton Sea Lake – South 3
Research on users of Lake Tahoe and the Sacramento-San Joaquin Delta found that a typical party as 3.0 members. Dividing by that figure resulted in an estimated $339.99 per lake using tourist per day.
Combining the number of tourist days with the economic impact per day yielded a 2022 impact of 164,017 x $339.99 = $55.8 million. Of this, $38.9 million is from direct tourist spending and $16.9 million is from the secondary impact of these funds circulating through the Imperial County economy.
By 2062, the number of tourist days with the economic impact would reach 1,549,821 x $339.99 = $529.9 million. Of this, $367.2 million is from direct tourist spending and $159.7 million is from the secondary impact of these funds circulating through the Imperial County economy.
In the first five years, the total impact of lake using tourists would be $355.6 million.
Independent Tourists
Given its uniqueness, the Salton Sea State Recreational Area (SRA) has always lured tourists on its own. In the early 2000s, the number ranged from 200,000-300,000 per year, the equivalent of 1.289% of the surrounding population. That plunged to an average of 46,393 from FY 2012 to FY 2014 as the severity of the sea’s environmental issues increased. To look at the potential for this group to grow, it was assumed that this number remained constant until the SSL-N, SSL-South and the connecting channel’s opening in 2022. In 2021, that would represent the equivalent 0.209% of the four county area population. It was estimated that 17.0% of this represented 7,893 tourists based upon the share of the two southern counties make up of the six total counties (including Imperial & San Diego) from which some tourists would come.
Once the environmental issue begins lessening, the flow of tourists choosing to come to the Salton Sea SRA should begin to normalize. It is assumed it takes eight years to go from 0.209% of population in 2021 back to the 1.289% by 2029 and remains there until 2062. The tourists coming from the SSL-S direction would mean 10,002 tourists by 2022, an added 2,110 visitors over 2021. By 2029, the number would reach 52,544, up an added 44,652 from 2021. The gain would continue from there, moving upward with population growth.
With each independent tourist assumed to make a 2.0 day trip, the number of visitor days for these new tourists would rise from 4,221 in 2022 to 89,304 in 2029 and go on year by year to an extra 110,029 by 2062.
Each of these visitor days would add tourist spending into the SSL-S mix. The economic impact of them was lowered to $277.90 per person per day, based on removing the boating element from the spending array used with SSL-S using tourists. The result would add SSL-S tourist spending impact year by year, going from $1.2 million in 2022 to $30.6 million in 2062.
Page 77 of 332

Recreational Demand Salton Sea Lake – South 4
Grand Total Impact
Adding together, the economic impact of captured lake tourists from competitor areas with the added tourists visiting the Salton Sea SRA for the own independent reasons yields the Grand Total Economic Impact of the SSL-S:
$56.9 million in 2022, rising year by year to $557.5 million by 2062.
In the five years from 2022-2026, the cumulative economic impact would be $380.9 million.
Page 78 of 332

Recreational Demand Salton Sea Lake – South 5
Economics & Politics, Inc. P.O. Box 8730
Redlands, CA 92375 (909) 307-9444 Phone
[email protected] www.johnhusing.com
Demand Forecast Salton Sea Lake – South, 2022-2062 John E. Husing, Ph.D.
A key element of the ability to finance the development of a recreational system out of the Salton Sea will be the economic potential from its use for recreational tourism purposes. To estimate the potential a Salton Sea Lake-South (SSL-S), the methodology used is:
1. Potential Competitors. Determine potential demand at today’s competitor lakes.
Determine the geographic center of population of San Diego County which would be the most likely source of demand for SSL-S. These data are available from the U.S. Census Bureau data for 2010 (Exhibit 1, Col. 1).
http://www2.census.gov/geo/docs/reference/cenpop2010/county/CenPop2010_Mean_CO06.txt
Exhibit 1.-Metrics of Potential Competitors to Salton Sea Lake – South County Location Miles Driving Time Acres Visitors
San Diego County
Miramar Way & I-5 Freewy Lake Havasu 301 05,26 19,300 383,452
San Diego Lake Mohave 303 05,32 28,000 199,800
Salton Sea - South 111 02:24 12,800
El Capitan Reservoir 26 00:33 1,562 NA
Morena Reservoir 65 01:13 1,475 NA
Lake Hodges 13 00:14 1,234 NA
Lake Henshaw 50 01:09 1,140 NA
San Vicente Reservoir 17 00:26 1,100 NA
Lower Otay Reservoir 34 00:44 1,100 NA
Sweet Water Reservoir 30 00:43 936 NA
Barrett Lake 46 01:05 891 NA
Southerland Reservoir 31 00:49 557 NA
Lake Loveland 42 00:55 454 NA
Olivenhain Reservoir 24 00:38 230 NA
Lake Wohlford 24 00:35 225 NA
Lake Murray 20 00:30 171 NA
Miramar Reservoir 3 00:07 162 NA
Lake Ramona 21 00:35 155 NA
Lake Cuyamaca 55 01:00 110 NA
Lake Jennings 20 00:23 76 NA
Lake Dixon 34 00:29 69 NA
Lake Poway 15 00:22 35 NA
Lindo Lake 19 00:22 24 NA
Upper Otay Reservoir 29 00:37 20 NA
Chollas Lake 18 00:21 16 NA
Santee Lakes 12 00:14 NA NA
Page 79 of 332

Recreational Demand Salton Sea Lake – South 6
San Diego County is the only source of demand considered for the SSL-S for the following reasons:
o Those living in the balance of Southern California were assumed to use the previously analyzed SSL-N.
o Those using the SSL-S from Imperial County are assumed to be local day tourists since the distances from the county’s population center to the lake’s edge averaged just 33 miles or 35 minutes driving time. Their spending was thus conservatively viewed as already part of the Imperial County economy, not an addition to it.
o Visitors from Mexico were not considered. This despite the Mexicali metropolitan area having a 2010 population of 996,826 with a median household income in 2010 of $7,137 in nearby Tijuana.
Determine the lakes by name to which residents of San Diego County are likely to drive (Exhibit 1, Col. 2). These include Lake Mohave and Lake Havasu on the Colorado River; plus the 23 lakes that are generally part of the San Diego city and/or county water supply systems. Importantly, only one of those lakes, El Capitan Reservoir allows body contact with the water. Otherwise the primary activity allowed is fishing.
Calculate driving miles and estimated time from the San Diego county population center to each of these six lakes (Exhibit 1, Col. 3-4).
o Google Maps provides data on distances. The Colorado River lakes are 300 miles away from each county’s population center. The local reservoirs area within 2 to 65 driving miles of the San Diego population center.
o Determine driving time using Global Feed.com a standard internet based driving tool. The Colorado River lakes are roughly 5:30 hours away. The local reservoirs are from 7 minutes to just over an hour away. The important El Capitan Reservoir is 26 miles and 33 minutes driving time away.
http://distancecalculator.globefeed.com/US_Distance_Calculator.asp
Find the surface acres of the competitor lakes (Exhibit 1, Col. 5). These ranged from 16 acres to 1,562 acres. The latter is for the El Capitan Lake. Only six total reservoirs have 1,000 surface acres or more.
Determine the number of Southern California visitors to the competitive lakes (Exhibit 1, Col. 6). Here, the issue was the lack of information about the level of usage of the San Diego County reservoirs. This required an indirect means of determining lake usage for residents of the county.
Page 80 of 332

Recreational Demand Salton Sea Lake – South 7
2. Potential Lake Visitor Demand. Given the lack of information about the usage of competitor lakes by San Diego County residents, demand for lake usage had to be estimated by comparison to similar situations in Southern California.
Here, the experience of Orange County provided important parallels:
o Both are coastal counties with enclaves on the Pacific Ocean
o Their populations are similar: San Diego (3,227,496); Orange (3,157,074)
o Register pleasure craft levels are very close: San Diego (51,640); Orange (50,534)
o Ratios of pleasure craft to population are almost identical: San Diego (1.600%); Orange (1.601%)
o Driving distances and time to their respective ends of the Salton Sea are very similar: San Diego (111 miles; 2:25); Orange (137 miles; 2:13).
o 2014 per capita income levels were: San Diego ($31,770); Orange ($34,886)
The Orange County potential lake visitors ratio to population was 13% in 2015.
o 411,009 potential lake visitors based upon population and share of pleasure craft in 2015 from SSL-N calculations.
o 3,157,074 population
o 13% factor which is applied to San Diego County from 2022-2062
Exhibit 2.-San Diego County Population Growth & Potential Lake Visitors, 2015-2062 Year 2015 2016 2017 2018 2019 2020 2021 2022 2023 2024
Population 3,227,496 3,286,779 3,347,150 3,408,631 3,471,240 3,535,000 3,567,152 3,599,596 3,632,335 3,665,372
Lake Share 13% 13% 13% 13% 13% 13% 13% 13% 13% 13%
Potential 420,177 427,895 435,754 443,758 451,909 460,210 464,396 468,620 472,882 477,183
Year 2025 2026 2027 2028 2029 2030 2031 2032 2033 2034
Population 3,732,350 3,766,296 3,800,552 3,835,119 3,870,000 3,898,412 3,927,032 3,955,862 3,984,904 3,732,350
Lake Share 13% 13% 13% 13% 13% 13% 13% 13% 13% 13%
Potential 485,902 490,322 494,781 499,282 503,823 507,521 511,247 515,001 518,782 485,902
Year 2035 2036 2037 2038 2039 2040 2041 2042 2043 2044
Population 4,014,159 4,043,629 4,073,315 4,103,219 4,133,343 4,163,688 4,185,294 4,207,013 4,228,844 4,250,788
Lake Share 13% 13% 13% 13% 13% 13% 13% 13% 13% 13%
Potential 522,590 526,427 530,292 534,185 538,106 542,057 544,870 547,697 550,539 553,396
Year 2045 2046 2047 2048 2049 2050 2051 2052 2053 2054
Population 4,272,847 4,295,019 4,317,307 4,339,711 4,362,230 4,384,867 4,400,810 4,416,811 4,432,870 4,448,988
Lake Share 13% 13% 13% 13% 13% 13% 13% 13% 13% 13%
Potential 556,268 559,154 562,056 564,973 567,904 570,851 572,927 575,010 577,101 579,199
Year 2055 2056 2057 2058 2059 2060 2061 2062
Population 4,465,164 4,475,087 4,485,032 4,494,998 4,504,987 4,514,999 4,525,032 4,535,088
Lake Share 13% 13% 13% 13% 13% 13% 13% 13%
Potential 581,305 582,597 583,892 585,189 586,490 587,793 589,099 590,408
Page 81 of 332

Recreational Demand Salton Sea Lake – South 8
Potential Visitor Counts (Exhibit 2):
o San Diego County population forecast was created in 10 year time periods by the San Diego Association of Governments (SANDAG) through 2050. CA Department of Finance forecasts from 2050-2055 and 2055-2060 were used afterwards.
o Applying 13% factor for potential lake visitors yielded
3,227,496 people and 420,177 potential lake tourists in 2015
3,632,335 people and 468,620 potential lake tourists in 2022
4,535,088 people and 590,408 potential lake tourists in 2062
3. Lake Tourist Capture Rate. Capture rates had to be assumed to determine the extent that over time the SSL-S would see these potential visitors, (Exhibit 3):
10% in year one (2022) due to the excitement of a new lake.
Increasing by 1.5% per year to reach a 20% capture rate in 2030 as tourists become increasingly familiar with the site.
The pace would add 2.0% per year through 2055, reaching a 70% capture rate. The increase would be consistent with more and more facilities being available for tourists.
It would advance 1% per year from there to 2062 ending at 75%.
Exhibit 3.-San Diego County Estimate Salton Sea Lake South Visitors, 2015-2062 Year 2015 2016 2017 2018 2019 2020 2021 2022 2023 2024
Potential 468,620 472,882 477,183
Capture rate 10.00% 11.25% 12.50%
Visitors 46,862 53,199 59,648
Year 2025 2026 2027 2028 2029 2030 2031 2032 2033 2034
Potential 581,305 582,597 583,892 585,189 586,490 587,793 589,099 590,408 581,305 582,597
Capture rate 13.75% 15.00% 16.25% 17.50% 18.75% 20.00% 22.00% 24.00% 26.00% 28.00%
Visitors 66,209 72,885 79,677 86,587 93,615 100,765 111,655 122,699 133,900 145,259
Year 2035 2036 2037 2038 2039 2040 2041 2042 2043 2044
Potential 522,590 526,427 530,292 534,185 538,106 542,057 544,870 547,697 550,539 553,396
Capture rate 30.00% 32.00% 34.00% 36.00% 38.00% 40.00% 42.00% 44.00% 46.00% 48.00%
Visitors 156,777 168,457 180,299 192,306 204,480 216,823 228,845 240,987 253,248 265,630
Year 2045 2046 2047 2048 2049 2050 2051 2052 2053 2054
Potential 556,268 559,154 562,056 564,973 567,904 570,851 572,927 575,010 577,101 579,199
Capture rate 50.00% 52.00% 54.00% 56.00% 58.00% 60.00% 62.00% 64.00% 66.00% 68.00%
Visitors 278,134 290,760 303,510 316,385 329,385 342,511 355,215 368,006 380,887 393,855
Year 2055 2056 2057 2058 2059 2060 2061 2062
Potential 581,305 582,597 583,892 585,189 586,490 587,793 589,099 590,408
Capture rate 70.00% 71.00% 72.00% 73.00% 74.00% 75.00% 75.00% 75.00%
Visitors 406,914 413,644 420,402 427,188 434,002 440,845 441,824 442,806
Page 82 of 332

Recreational Demand Salton Sea Lake – South 9
Estimated Captured Visitors:
o 46,682 in 2022 at 10%
o 100,765 in 2030 at 20%
o 406,914 in 2055 at 70%
o 442,806 in 2062 at 75%
4. Average Days Stay at SSL-S per Trip. Estimated at 3.5 days as follows:
Estimate of average days stayed by visitors assuming that the longer the driving time, the more days a visitor would remain at the SSL-S. This assumption was based upon two sets of information (Exhibit 3):
o In 2015, the Lake Havasu City Benchmark Visitor Study estimated average visitors stays at 4.3 days. That lake is 3:33 hours to 4:33 hours driving time from the four counties estimated to use SSL-N and 5:30 hours from San Diego county’s population center. That was reduced to 3.5 days to be conservative about time at the SSL-S.
o California State Parks: Economic Impact Of Visitor Expenditures, Katherine Litzky, CA State University, Sacramento, 2006 (Master’s Thesis). The study found that the farther visitors traveled the more time and money they spent near CA State Park Lakes.
o The relevant distances and times from the county population centers to other lakes led to the assumptions that a trip from Los Angeles or Orange counties to the SSL-N would last 3.5 days on average. It would be 2.0 days for a trip from Riverside and San Bernardino counties to SSL-N.
Exhibit 4.-Drive Time & Average Days Per Visitor To Salton Sea LakesDrive Time Applies To Average Trip Days to SSL-N
Drive Over 2 Hours (Colorado River Lakes) Los Angeles, Orange, San Diego counties 3.5
Driver 1.5-2.0 2.5
Drive 1.0-1.5 (Inland Empire Lakes) Riverside, San Bernardino counties 2.0
Drive 0.5- 1.0 1.5
Under 0.5 1.0
5. Estimated Number Of Visitor Days. Given the estimated number of visitors from 2022-2062 and the 3.5 day average length of stay for parties coming from San Diego County, it is possible to estimate the number of visitor days that lake tourists will be using the SSL-S each year (Exhibit 5):
46,862 x 3.5 = 164,017 visitor days in 2022, an average of 449 per day for a year.
100,785 x 3.5 = 352,676 visitor days in 2030, an average of 966 per day for a year.
442,806 x 3.5 = 1,549,821 visitor days in 2062, an average of 4,246 per day for a year.
Page 83 of 332

Recreational Demand Salton Sea Lake – South 10
Exhibit 5.-San Diego County Estimate Salton Sea Lake North Visitors, 2015-2062 Year 2015 2016 2017 2018 2019 2020 2021 2022 2023 2024
Visitors 0 0 0 0 0 0 0 46,862 53,199 59,648
Stay 3.5 3.5 3.5 3.5 3.5 3.5 3.5 3.5 3.5 3.5
Visitor-Days 0 0 0 0 0 0 0 164,017 186,197 208,767
Year 2025 2026 2027 2028 2029 2030 2031 2032 2033 2034
Visitors 66,209 72,885 79,677 86,587 93,615 100,765 111,655 122,699 133,900 145,259
Stay 3.5 3.5 3.5 3.5 3.5 3.5 3.5 3.5 3.5 3.5
Visitor-Days 231,733 255,099 278,871 303,054 327,653 352,676 390,791 429,448 468,651 508,406
Year 2035 2036 2037 2038 2039 2040 2041 2042 2043 2044
Visitors 156,777 168,457 180,299 192,306 204,480 216,823 228,845 240,987 253,248 265,630
Stay 3.5 3.5 3.5 3.5 3.5 3.5 3.5 3.5 3.5 3.5
Visitor-Days 548,720 589,598 631,047 673,073 715,681 758,880 800,958 843,454 886,368 929,706
Year 2045 2046 2047 2048 2049 2050 2051 2052 2053 2054
Visitors 278,134 290,760 303,510 316,385 329,385 342,511 355,215 368,006 380,887 393,855
Stay 3.5 3.5 3.5 3.5 3.5 3.5 3.5 3.5 3.5 3.5
Visitor-Days 973,469 1,017,661 1,062,286 1,107,346 1,152,846 1,198,788 1,243,252 1,288,023 1,333,103 1,378,494
Year 2055 2056 2057 2058 2059 2060 2061 2062
Visitors 406,914 413,644 420,402 427,188 434,002 440,845 441,824 442,806
Stay 0 3.5 3.5 3.5 3.5 3.5 3.5 3.5
Visitor-Days 1,424,197 1,447,753 1,471,407 1,495,158 1,519,008 1,542,956 1,546,385 1,549,821
6. Economic Impact Per Tourist Per Day. In the discussion of the impact of the SSL-N, estimates were shown about the tourist spending behavior likely for tourists in the Coachella Valley area. This was based upon research by this analyst conducted in that area in 2010, with the data brought forward to 2015 (Exhibit 6, col. 2). Based upon that research, these data were adapted to the lower cost of living in Imperial County. Adjustments were made after reviewing the costs of goods and service in Palm Desert and El Centro using the AreaVibes website. The changes included (Exhibit 6 column 3):
Hotel room rate was reduced to an average of $65 per group.
Casino spending was eliminated.
Eating and drinking costs were reduced -10%.
Food and fuel were left unchanged -15%.
Other items were reduced by -15%.
The result was direct spending of $710.82 per tourist party.
Each dollar in direct spending that comes into the SSL-S area economy does not just vanish. Much of the money is re-spent by the initial recipients as they hire local workers. They, in turn, spend it locally supporting their families. A lot of the money goes to
Page 84 of 332
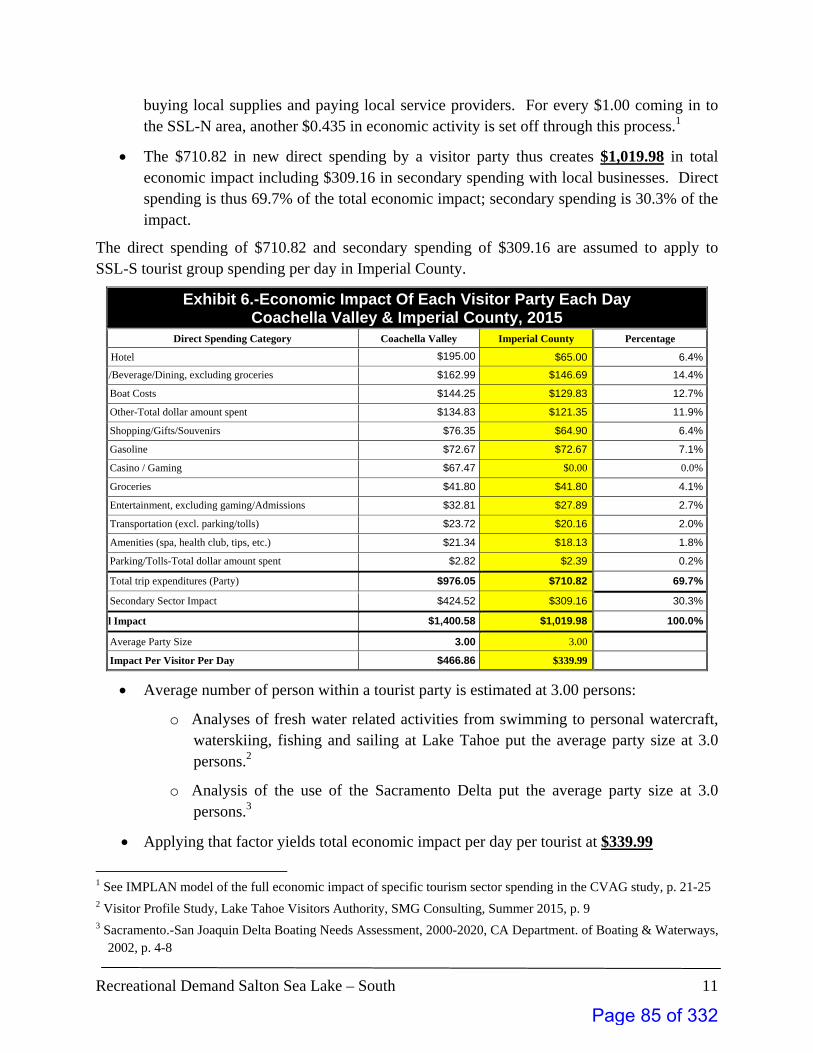
Recreational Demand Salton Sea Lake – South 11
buying local supplies and paying local service providers. For every $1.00 coming in to the SSL-N area, another $0.435 in economic activity is set off through this process.1
The $710.82 in new direct spending by a visitor party thus creates $1,019.98 in total economic impact including $309.16 in secondary spending with local businesses. Direct spending is thus 69.7% of the total economic impact; secondary spending is 30.3% of the impact.
The direct spending of $710.82 and secondary spending of $309.16 are assumed to apply to SSL-S tourist group spending per day in Imperial County.
Exhibit 6.-Economic Impact Of Each Visitor Party Each Day Coachella Valley & Imperial County, 2015
Direct Spending Category Coachella Valley Imperial County Percentage
Hotel $195.00 $65.00 6.4%
d/Beverage/Dining, excluding groceries $162.99 $146.69 14.4%
Boat Costs $144.25 $129.83 12.7%
Other-Total dollar amount spent $134.83 $121.35 11.9%
Shopping/Gifts/Souvenirs $76.35 $64.90 6.4%
Gasoline $72.67 $72.67 7.1%
Casino / Gaming $67.47 $0.00 0.0%
Groceries $41.80 $41.80 4.1%
Entertainment, excluding gaming/Admissions $32.81 $27.89 2.7%
Transportation (excl. parking/tolls) $23.72 $20.16 2.0%
Amenities (spa, health club, tips, etc.) $21.34 $18.13 1.8%
Parking/Tolls-Total dollar amount spent $2.82 $2.39 0.2%
Total trip expenditures (Party) $976.05 $710.82 69.7%
Secondary Sector Impact $424.52 $309.16 30.3%
al Impact $1,400.58 $1,019.98 100.0%
Average Party Size 3.00 3.00
Impact Per Visitor Per Day $466.86 $339.99
Average number of person within a tourist party is estimated at 3.00 persons:
o Analyses of fresh water related activities from swimming to personal watercraft, waterskiing, fishing and sailing at Lake Tahoe put the average party size at 3.0 persons.2
o Analysis of the use of the Sacramento Delta put the average party size at 3.0 persons.3
Applying that factor yields total economic impact per day per tourist at $339.99
1 See IMPLAN model of the full economic impact of specific tourism sector spending in the CVAG study, p. 21-25 2 Visitor Profile Study, Lake Tahoe Visitors Authority, SMG Consulting, Summer 2015, p. 9 3 Sacramento.-San Joaquin Delta Boating Needs Assessment, 2000-2020, CA Department. of Boating & Waterways,
2002, p. 4-8
Page 85 of 332
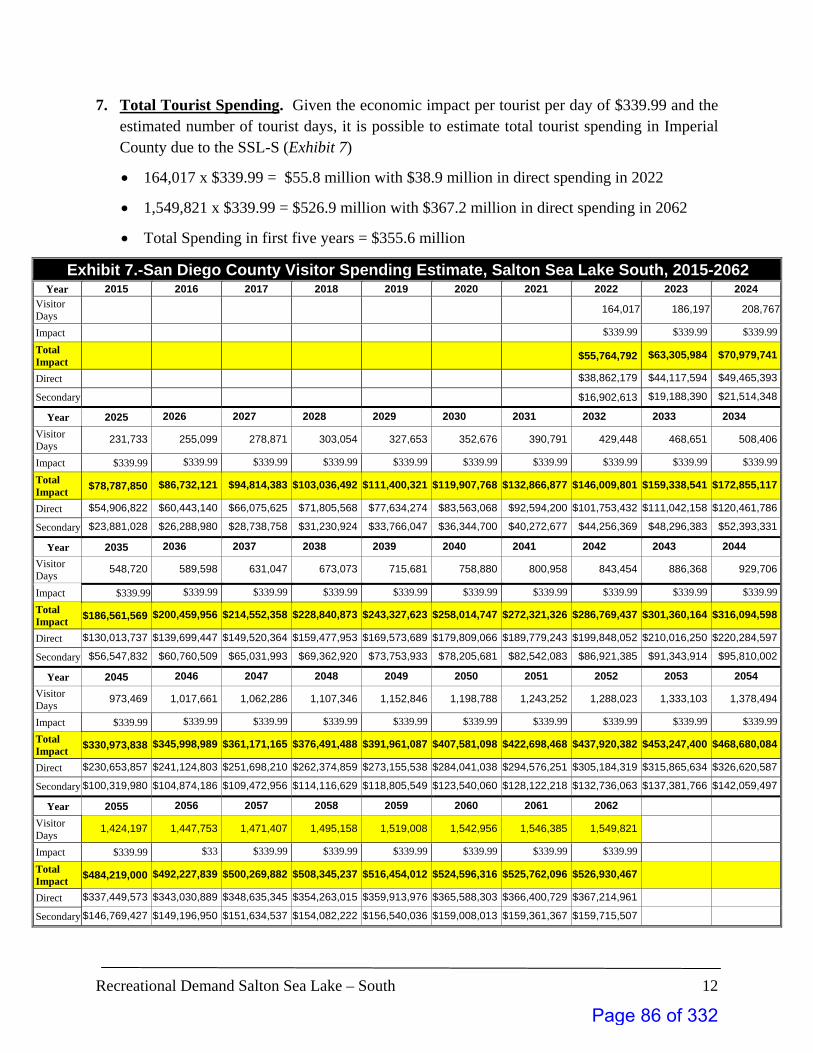
Recreational Demand Salton Sea Lake – South 12
7. Total Tourist Spending. Given the economic impact per tourist per day of $339.99 and the estimated number of tourist days, it is possible to estimate total tourist spending in Imperial County due to the SSL-S (Exhibit 7)
164,017 x $339.99 = $55.8 million with $38.9 million in direct spending in 2022
1,549,821 x $339.99 = $526.9 million with $367.2 million in direct spending in 2062
Total Spending in first five years = $355.6 million
Exhibit 7.-San Diego County Visitor Spending Estimate, Salton Sea Lake South, 2015-2062 Year 2015 2016 2017 2018 2019 2020 2021 2022 2023 2024
Visitor Days
164,017 186,197 208,767
Impact $339.99 $339.99 $339.99
Total Impact
$55,764,792 $63,305,984 $70,979,741
Direct $38,862,179 $44,117,594 $49,465,393
Secondary $16,902,613 $19,188,390 $21,514,348
Year 2025 2026 2027 2028 2029 2030 2031 2032 2033 2034
Visitor Days
231,733 255,099 278,871 303,054 327,653 352,676 390,791 429,448 468,651 508,406
Impact $339.99 $339.99 $339.99 $339.99 $339.99 $339.99 $339.99 $339.99 $339.99 $339.99
Total Impact
$78,787,850 $86,732,121 $94,814,383 $103,036,492 $111,400,321 $119,907,768 $132,866,877 $146,009,801 $159,338,541 $172,855,117
Direct $54,906,822 $60,443,140 $66,075,625 $71,805,568 $77,634,274 $83,563,068 $92,594,200 $101,753,432 $111,042,158 $120,461,786
Secondary $23,881,028 $26,288,980 $28,738,758 $31,230,924 $33,766,047 $36,344,700 $40,272,677 $44,256,369 $48,296,383 $52,393,331
Year 2035 2036 2037 2038 2039 2040 2041 2042 2043 2044
Visitor Days
548,720 589,598 631,047 673,073 715,681 758,880 800,958 843,454 886,368 929,706
Impact $339.99 $339.99 $339.99 $339.99 $339.99 $339.99 $339.99 $339.99 $339.99 $339.99
Total Impact
$186,561,569 $200,459,956 $214,552,358 $228,840,873 $243,327,623 $258,014,747 $272,321,326 $286,769,437 $301,360,164 $316,094,598
Direct $130,013,737 $139,699,447 $149,520,364 $159,477,953 $169,573,689 $179,809,066 $189,779,243 $199,848,052 $210,016,250 $220,284,597
Secondary $56,547,832 $60,760,509 $65,031,993 $69,362,920 $73,753,933 $78,205,681 $82,542,083 $86,921,385 $91,343,914 $95,810,002
Year 2045 2046 2047 2048 2049 2050 2051 2052 2053 2054
Visitor Days
973,469 1,017,661 1,062,286 1,107,346 1,152,846 1,198,788 1,243,252 1,288,023 1,333,103 1,378,494
Impact $339.99 $339.99 $339.99 $339.99 $339.99 $339.99 $339.99 $339.99 $339.99 $339.99
Total Impact
$330,973,838 $345,998,989 $361,171,165 $376,491,488 $391,961,087 $407,581,098 $422,698,468 $437,920,382 $453,247,400 $468,680,084
Direct $230,653,857 $241,124,803 $251,698,210 $262,374,859 $273,155,538 $284,041,038 $294,576,251 $305,184,319 $315,865,634 $326,620,587
Secondary $100,319,980 $104,874,186 $109,472,956 $114,116,629 $118,805,549 $123,540,060 $128,122,218 $132,736,063 $137,381,766 $142,059,497
Year 2055 2056 2057 2058 2059 2060 2061 2062
Visitor Days
1,424,197 1,447,753 1,471,407 1,495,158 1,519,008 1,542,956 1,546,385 1,549,821
Impact $339.99 $33 $339.99 $339.99 $339.99 $339.99 $339.99 $339.99 Total Impact
$484,219,000 $492,227,839 $500,269,882 $508,345,237 $516,454,012 $524,596,316 $525,762,096 $526,930,467
Direct $337,449,573 $343,030,889 $348,635,345 $354,263,015 $359,913,976 $365,588,303 $366,400,729 $367,214,961
Secondary $146,769,427 $149,196,950 $151,634,537 $154,082,222 $156,540,036 $159,008,013 $159,361,367 $159,715,507
Page 86 of 332

Recreational Demand Salton Sea Lake – South 13
8. Estimated Spending By Sector. Given the total spending each year due to the opening of the SSL-S and the coming of lake tourists, plus the breakdown of spending by sector (Exhibit 6, col. 4), it is possible to estimate the spending in each sector during each year from 2022-2062 (Exhibit 8).
In 2022, volume of direct spending in the main sectors receiving activity were (note: share of spending & per capita sales):
Food, Beverage, Dining (14.4%; $48.90) $8,020,005
Boat Costs (12.7%; $43.28) $7,097,838
Other Expenses (11.9%; $40.45) $6,634,489
Gasoline (7.1%; $24.22) $3,972,996
Hotel (6.4%; $21.67) $3,553,698
Shopping & Gifts (6.4%; $21.63) $3,548,164
In 2062, volume of direct spending in the main sectors receiving activity were:
Food, Beverage, Dining (14.4%; $48.90) $75,782,317
Boat Costs (12.7%; $43.28) $67,068,609
Other Expenses (11.9%; $40.45) $62,690,355
Gasoline (7.1%; $24.22) $37,541,480
Hotel (6.4%; $21.67) $33,579,465
Shopping & Gifts (6.4%; $21.63) $33,527,171
Page 87 of 332

Recreational Demand Salton Sea Lake – South 14
Exhibit 8.-Spending by Sector at Salton Sea Lake South, 2022-2062 Sector Share 2015 2016 2017 2018 2019 2020 2021 2022 2023 2024
Hotel 6.4% $0 $0 $0 $0 $0 $0 $0 $3,553,698 $4,034,272 $4,523,295
Food/Beverage/Dining 14.4% $0 $0 $0 $0 $0 $0 $0 $8,020,005 $9,104,568 $10,208,195
Boat Costs 12.7% $0 $0 $0 $0 $0 $0 $0 $7,097,838 $8,057,694 $9,034,423
Other-Total dollar amount spent 11.9% $0 $0 $0 $0 $0 $0 $0 $6,634,489 $7,531,686 $8,444,653
Shopping/Gifts/Souvenirs 6.4% $0 $0 $0 $0 $0 $0 $0 $3,548,164 $4,027,990 $4,516,250
Gasoline 7.1% $0 $0 $0 $0 $0 $0 $0 $3,972,996 $4,510,273 $5,056,995
Groceries 4.1% $0 $0 $0 $0 $0 $0 $0 $2,285,509 $2,594,583 $2,909,091
Entertainment (not gaming) 2.7% $0 $0 $0 $0 $0 $0 $0 $1,524,956 $1,731,179 $1,941,027
Transportation (no parking/tolls) 2.0% $0 $0 $0 $0 $0 $0 $0 $1,102,196 $1,251,248 $1,402,920
Amenities (spa, health club, etc.) 1.8% $0 $0 $0 $0 $0 $0 $0 $991,473 $1,125,552 $1,261,988
Parking/Tolls- (dollars spent) 0.2% $0 $0 $0 $0 $0 $0 $0 $130,854 $148,550 $166,557
Total trip expenditures 69.7% $0 $0 $0 $0 $0 $0 $0 $38,862,179 $44,117,594 $49,465,393
Secondary Sector Impact 30.3% $16,902,613 $19,188,390 $21,514,348
TOTAL 100.0% $55,764,792 $63,305,984 $70,979,741
Sector Share 2025 2026 2027 2028 2029 2030 2031 2032 2033 2034
Hotel 6.4% $5,020,878 $5,527,139 $6,042,194 $6,566,161 $7,099,159 $7,641,309 $8,467,149 $9,304,702 $10,154,097 $11,015,462
Food/Beverage/Dining, s 14.4% $11,331,146 $12,473,678 $13,636,057 $14,818,547 $16,021,420 $17,244,948 $19,108,707 $20,998,901 $22,915,820 $24,859,753
Boat Costs 12.7% $10,028,252 $11,039,412 $12,068,137 $13,114,661 $14,179,223 $15,262,065 $16,911,523 $18,584,377 $20,280,881 $22,001,294
Other-Total dollar amount spent 11.9% $9,373,605 $10,318,757 $11,280,326 $12,258,532 $13,253,600 $14,265,754 $15,807,535 $17,371,184 $18,956,941 $20,565,045
Shopping/Gifts/Souvenirs 6.4% $5,013,059 $5,518,532 $6,032,785 $6,555,935 $7,088,103 $7,629,409 $8,453,963 $9,290,212 $10,138,284 $10,998,307
Gasoline 7.1% $5,613,288 $6,179,282 $6,755,108 $7,340,897 $7,936,783 $8,542,901 $9,466,181 $10,402,557 $11,352,171 $12,315,167
Groceries 4.1% $3,229,105 $3,554,699 $3,885,949 $4,222,930 $4,565,720 $4,914,396 $5,445,523 $5,984,183 $6,530,459 $7,084,433
Entertainment (not gaming) 2.7% $2,154,549 $2,371,795 $2,592,814 $2,817,657 $3,046,376 $3,279,023 $3,633,405 $3,992,814 $4,357,305 $4,726,932
Transportation (no parking/tolls) 2.0% $1,557,248 $1,714,267 $1,874,014 $2,036,525 $2,201,836 $2,369,987 $2,626,125 $2,885,896 $3,149,339 $3,416,495
Amenities (spa, health club, etc.) 1.8% $1,400,812 $1,542,058 $1,685,757 $1,831,942 $1,980,647 $2,131,906 $2,362,313 $2,595,988 $2,832,967 $3,073,286
Parking/Tolls- (dollars spent) 0.2% $184,879 $203,520 $222,486 $241,779 $261,405 $281,368 $311,777 $342,618 $373,894 $405,611
Total trip expenditures 69.7% $54,906,822 $60,443,140 $66,075,625 $71,805,568 $77,634,274 $83,563,068 $92,594,200 $101,753,432 $111,042,158 $120,461,786
Secondary Sector Impact 30.3% $23,881,028 $26,288,980 $28,738,758 $31,230,924 $33,766,047 $36,344,700 $40,272,677 $44,256,369 $48,296,383 $52,393,331
TOTAL 100.0% $78,787,850 $86,732,121 $94,814,383 $103,036,492 $111,400,321 $119,907,768 $132,866,877 $146,009,801 $159,338,541 $172,855,117
Page 88 of 332

Recreational Demand Salton Sea Lake – South 15
Exhibit 8.-Spending by Sector at Salton Sea Lake South, 2022-2062 (continued) Sector Share 2035 2036 2037 2038 2039 2040 2041 2042 2043 2044
Hotel 6.4% $11,888,927 $12,774,623 $13,672,683 $14,583,241 $15,506,432 $16,442,392 $17,354,101 $18,274,829 $19,204,646 $20,143,621
Food/Beverage/Dining, s 14.4% $26,830,993 $28,829,838 $30,856,585 $32,911,537 $34,994,999 $37,107,278 $39,164,828 $41,242,733 $43,341,148 $45,460,231
Boat Costs 12.7% $23,745,875 $25,514,885 $27,308,590 $29,127,257 $30,971,155 $32,840,557 $34,661,523 $36,500,503 $38,357,636 $40,233,060
Other-Total dollar amount spent 11.9% $22,195,739 $23,849,268 $25,525,879 $27,225,823 $28,949,351 $30,696,718 $32,398,811 $34,117,742 $35,853,641 $37,606,637
Shopping/Gifts/Souvenirs 6.4% $11,870,412 $12,754,729 $13,651,391 $14,560,530 $15,482,283 $16,416,786 $17,327,075 $18,246,369 $19,174,738 $20,112,251
Gasoline 7.1% $13,291,692 $14,281,891 $15,285,913 $16,303,906 $17,336,024 $18,382,417 $19,401,698 $20,431,062 $21,470,587 $22,520,351
Groceries 4.1% $7,646,189 $8,215,812 $8,793,386 $9,378,998 $9,972,735 $10,574,684 $11,161,036 $11,753,189 $12,351,187 $12,955,075
Entertainment (not gaming) 2.7% $5,101,751 $5,481,820 $5,867,193 $6,257,930 $6,654,088 $7,055,725 $7,446,956 $7,842,057 $8,241,058 $8,643,989
Transportation (no parking/tolls) 2.0% $3,687,405 $3,962,107 $4,240,645 $4,523,058 $4,809,390 $5,099,682 $5,382,453 $5,668,021 $5,956,408 $6,247,635
Amenities (spa, health club, etc.) 1.8% $3,316,980 $3,564,087 $3,814,644 $4,068,687 $4,326,255 $4,587,386 $4,841,750 $5,098,631 $5,358,047 $5,620,019
Parking/Tolls- (dollars spent) 0.2% $437,774 $470,387 $503,456 $536,984 $570,978 $605,442 $639,013 $672,916 $707,153 $741,728
Total trip expenditures 69.7% $130,013,737 $139,699,447 $149,520,364 $159,477,953 $169,573,689 $179,809,066 $189,779,243 $199,848,052 $210,016,250 $220,284,597
Secondary Sector Impact 30.3% $56,547,832 $60,760,509 $65,031,993 $69,362,920 $73,753,933 $78,205,681 $82,542,083 $86,921,385 $91,343,914 $95,810,002
TOTAL 100.0% $186,561,569 $200,459,956 $214,552,358 $228,840,873 $243,327,623 $258,014,747 $272,321,326 $286,769,437 $301,360,164 $316,094,598
Sector Share 2045 2046 2047 2048 2049 2050 2051 2052 2053 2054
Hotel 6.4% $21,091,823 $22,049,324 $23,016,195 $23,992,506 $24,978,331 $25,973,740 $26,937,118 $27,907,158 $28,883,896 $29,867,368
Food/Beverage/Dining, s 14.4% $47,600,140 $49,761,034 $51,943,073 $54,146,418 $56,371,231 $58,617,677 $60,791,833 $62,981,025 $65,185,333 $67,404,838
Boat Costs 12.7% $42,126,915 $44,039,342 $45,970,482 $47,920,479 $49,889,476 $51,877,618 $53,801,782 $55,739,254 $57,690,103 $59,654,401
Other-Total dollar amount spent 11.9% $39,376,860 $41,164,443 $42,969,519 $44,792,219 $46,632,680 $48,491,035 $50,289,590 $52,100,582 $53,924,080 $55,760,148
Shopping/Gifts/Souvenirs 6.4% $21,058,977 $22,014,987 $22,980,352 $23,955,143 $24,939,432 $25,933,291 $26,895,169 $27,863,698 $28,838,915 $29,820,856
Gasoline 7.1% $23,580,431 $24,650,907 $25,731,858 $26,823,364 $27,925,505 $29,038,362 $30,115,408 $31,199,903 $32,291,885 $33,391,396
Groceries 4.1% $13,564,898 $14,180,701 $14,802,529 $15,430,430 $16,064,448 $16,704,631 $17,324,214 $17,948,081 $18,576,256 $19,208,761
Entertainment (not gaming) 2.7% $9,050,879 $9,461,760 $9,876,662 $10,295,615 $10,718,649 $11,145,797 $11,559,200 $11,975,462 $12,394,598 $12,816,623
Transportation (no parking/tolls) 2.0% $6,541,725 $6,838,698 $7,138,577 $7,441,385 $7,747,143 $8,055,873 $8,354,669 $8,655,532 $8,958,472 $9,263,500
Amenities (spa, health club, etc.) 1.8% $5,884,565 $6,151,706 $6,421,460 $6,693,848 $6,968,891 $7,246,608 $7,515,388 $7,786,026 $8,058,534 $8,332,920
Parking/Tolls- (dollars spent) 0.2% $776,643 $811,900 $847,502 $883,452 $919,752 $956,405 $991,879 $1,027,597 $1,063,563 $1,099,776
Total trip expenditures 69.7% $230,653,857 $241,124,803 $251,698,210 $262,374,859 $273,155,538 $284,041,038 $294,576,251 $305,184,319 $315,865,634 $326,620,587
Secondary Sector Impact 30.3% $100,319,980 $104,874,186 $109,472,956 $114,116,629 $118,805,549 $123,540,060 $128,122,218 $132,736,063 $137,381,766 $142,059,497
TOTAL 100.0% $330,973,838 $345,998,989 $361,171,165 $376,491,488 $391,961,087 $407,581,098 $422,698,468 $437,920,382 $453,247,400 $468,680,084
Page 89 of 332

Recreational Demand Salton Sea Lake – South 16
Exhibit 8.-Spending by Sector at Salton Sea Lake South, 2022-2062 (continued) Sector Share 2055 2056 2057 2058 2059 2060 2061 2062
Hotel 6.4% $30,857,610 $31,367,986 $31,880,477 $32,395,092 $32,911,836 $33,430,717 $33,505,008 $33,579,465
Food/Beverage/Dining, s 14.4% $69,639,620 $70,791,439 $71,948,033 $73,109,418 $74,275,609 $75,446,623 $75,614,283 $75,782,317
Boat Costs 12.7% $61,632,221 $62,651,599 $63,675,204 $64,703,049 $65,735,148 $66,771,514 $66,919,897 $67,068,609
Other-Total dollar amount spent 11.9% $57,608,855 $58,561,689 $59,518,472 $60,479,219 $61,443,943 $62,412,655 $62,551,351 $62,690,355
Shopping/Gifts/Souvenirs 6.4% $30,809,555 $31,319,136 $31,830,830 $32,344,643 $32,860,582 $33,378,655 $33,452,831 $33,527,171
Gasoline 7.1% $34,498,476 $35,069,070 $35,642,030 $36,217,364 $36,795,078 $37,375,182 $37,458,239 $37,541,480
Groceries 4.1% $19,845,621 $20,173,862 $20,503,463 $20,834,430 $21,166,766 $21,500,477 $21,548,256 $21,596,142
Entertainment (not gaming) 2.7% $13,241,553 $13,460,565 $13,680,484 $13,901,315 $14,123,059 $14,345,720 $14,377,600 $14,409,550
Transportation (no parking/tolls) 2.0% $9,570,628 $9,728,923 $9,887,875 $10,047,485 $10,207,755 $10,368,689 $10,391,730 $10,414,823
Amenities (spa, health club, etc.) 1.8% $8,609,195 $8,751,588 $8,894,572 $9,038,148 $9,182,319 $9,327,085 $9,347,812 $9,368,585
Parking/Tolls- (dollars spent) 0.2% $1,136,239 $1,155,032 $1,173,903 $1,192,852 $1,211,880 $1,230,986 $1,233,721 $1,236,463
Total trip expenditures 69.7% $337,449,573 $343,030,889 $348,635,345 $354,263,015 $359,913,976 $365,588,303 $366,400,729 $367,214,961
Secondary Sector Impact 30.3% $146,769,427 $149,196,950 $151,634,537 $154,082,222 $156,540,036 $159,008,013 $159,361,367 $159,715,507
TOTAL 100.0% $484,219,000 $492,227,839 $500,269,882 $508,345,237 $516,454,012 $524,596,316 $525,762,096 $526,930,467
Page 90 of 332

Recreational Demand Salton Sea Lake – South 17
9. Independent Tourist Visitors. Visitors have been coming to the Salton Sea for decades irrespective of the ability of a fresh water lake system to lure them from other lake locations. Some come to fish. Some race boats. Others come because of the sea’s unique ecology. As the Salton Sea has become increasingly threatened, tourist visitations have fallen dramatically. The peak was 306,446 visitors in FY 2008-2009. That was at the high end of the 200,000-300,000 visitor usage going back to FY 2002 (earliest available data). Usage then plummeted reaching a low of 38,713 in FY 2011-2012. There were 49,120 visitors in FY 2014 (Exhibit 9).
As the Salton Sea is secured environmentally, this independent activity should resume. It is thus necessary to see the extent that this will add to the visitations and economic impact beyond that from the estimated activity captured from competitor lakes.
A. A relationship is assumed between the number of people visiting the Salton Sea State Recreational Area (SRA) and the population of the six county Southern California area from which most would come:
o The visitor percentage relationship averaged 1.289% from FY 2002 to FY 2009 before the dramatic decline due to the lake’s environmental problems (Exhibit 10).
o In the FY 2012-FY 2014 period, the number of tourist visitations to the Salton Sea SRA settled to an average of 46,393 per year.
B. The following steps are used to forecast the future number and economic impact of independent tourists:
o From 2015 to FY 2021, the visitor usage of the Salton Sea SRA is assumed to stay at 46,393. By 2021, that would be 46,393 of 22,165,318 people or 0.209% (Exhibit 11).
Page 91 of 332

Recreational Demand Salton Sea Lake – South 18
Exhibit 10.-Salton Sea SRA Visitors Share of Southern California’s Population, FY 2002 to FY 20014
Fiscal Year Visitors 6 Co. Population Share
FY 2002 228,148 18,926,759 1.205%
FY 2003 245,657 19,183,768 1.281%
FY 2004 227,533 19,448,113 1.170%
FY 2005 278,192 19,653,406 1.415%
FY 2006 293,625 19,771,957 1.485%
FY 2007 232,652 19,882,225 1.170%
FY 2008 213,470 20,006,083 1.067%
FY 2009 306,446 20,140,412 1.522%
FY 2002-FY 2009 1.289%
FY 2010 62,081 20,235,641 0.307%
FY 2011 121,982 20,351,260 0.599%
FY 2012 38,713 20,485,383 0.189%
FY 2013 51,346 20,665,157 0.248%
FY 2014 49,120 20,982,034 0.234%
FY 2012-FY 2014 46,393
Sources: Exhibit 9 & E-5 Reports, Demographic Research Unit, CA Department of Finance
o With the Salton Sea North & South Lakes plus the connecting channel opened in 2022, the sea’s environmental difficulties should begin ending. Tourist visitations to the Salton Sea SRA are assumed to climb from the 0.209% relationship to six county population in 2021 to the prior 1.289% average by 2029, eight years later. Once at the 1.289% level, it is assumed that share is maintained through 2062.
The share would rise at the compound rate each year from 2021 to 2029 to move it from 0.209% to 1.289%.
The number of Salton Sea SRA tourist visitors would rise from 46,393 to 303,531 in this eight year period. That would put it close to the level achieved before the ecological disaster truly took hold.
o The split between visitors emanating from the four northern counties and the two southern counties would stand at 83.0% v. 17.0% in 2021. It would shift each year as the differences in county population growth rates alter this relationship.
In 2021, the north-south split in the source of tourists would be 38,501 v. 7,892, a total of 46,393 (Exhibit 20, rows 6, 8 & 10)
By 2029, it would be 250,988 (82.7%) v. 52,544 (17.3%), a total of 303,531
By 2062, it would 284,167 (81.9%) v. 62,906 (18.1%), a total of 347,074
Page 92 of 332

Recreational Demand Salton Sea Lake – South 19
Exhibit 11.-Estimates of Salton Sea SRA Visitors, By North & South Direction, By Year 2015-2062 Lake 2015 2016 2017 2018 2019 2020 2021 2022 2023 2024
Four County Population 17,743,546 17,847,121 17,951,526 18,056,772 18,162,865 18,269,816 18,394,728 18,520,747 18,647,885 18,776,155
San Diego 3,227,496 3,286,779 3,347,150 3,408,631 3,471,240 3,535,000 3,567,152 3,599,596 3,632,335 3,665,372
Imperial 183,429 186,622 189,870 193,175 196,537 199,958 203,439 206,980 210,582 214,248
6 County Population 21,154,471 21,320,521 21,488,546 21,658,577 21,830,643 22,004,774 22,165,318 22,327,322 22,490,802 22,655,774
Relationship 0.219% 0.218% 0.216% 0.214% 0.213% 0.211% 0.209% 0.263% 0.330% 0.414%
Salton Sea Visitors 46,393 46,393 46,393 46,393 46,393 46,393 46,393 58,668 74,192 93,825
From Northern Areas 83.9% 83.7% 83.5% 83.4% 83.2% 83.0% 83.0% 83.0% 82.9% 82.9%
Salton Sea Visitors-N 38,913 38,835 38,757 38,678 38,598 38,519 38,501 48,666 61,515 77,758
From Southern Areas 16.1% 16.3% 16.5% 16.6% 16.8% 17.0% 17.0% 17.0% 17.1% 17.1%
Salton Sea Visitors-S 7,480 7,558 7,636 7,715 7,795 7,874 7,892 10,002 12,677 16,067
Lake 2025 2026 2027 2028 2029 2030 2031 2032 2033 2034
Four County Population 18,905,569 19,036,139 19,167,878 19,300,798 19,434,914 19,570,237 19,706,781 19,844,559 19,983,585 20,123,873
San Diego 3,698,709 3,732,350 3,766,296 3,800,552 3,835,119 3,870,000 3,898,412 3,927,032 3,955,862 3,984,904
Imperial 217,977 221,771 225,631 229,558 233,554 237,619 241,755 245,963 250,244 254,600
6 County Population 22,822,255 22,990,259 23,159,805 23,330,908 23,503,586 23,677,856 23,846,947 24,017,554 24,189,691 24,363,377
Relationship 0.520% 0.653% 0.819% 1.029% 1.291% 1.291% 1.291% 1.291% 1.291% 1.291%
Salton Sea Visitors 118,654 150,056 189,772 240,002 303,531 305,782 307,966 310,169 312,392 314,635
From Northern Areas 82.8% 82.8% 82.8% 82.7% 82.7% 82.7% 82.6% 82.6% 82.6% 82.6%
Salton Sea Visitors-N 98,291 124,248 157,062 198,545 250,988 252,735 254,498 256,278 258,073 259,885
From Southern Areas 17.2% 17.2% 17.2% 17.3% 17.3% 17.3% 17.4% 17.4% 17.4% 17.4%
Salton Sea Visitors-S 20,363 25,808 32,710 41,457 52,544 53,047 53,467 53,891 54,319 54,750
Lake 2035 2036 2037 2038 2039 2040 2041 2042 2043 2044
Four County Population 20,265,437 20,386,380 20,508,123 20,630,672 20,754,033 20,878,210 20,955,411 21,033,059 21,111,158 21,189,712
San Diego 4,014,159 4,043,629 4,073,315 4,103,219 4,133,343 4,163,688 4,185,294 4,207,013 4,228,844 4,250,788
Imperial 259,031 263,540 268,127 272,794 277,542 282,373 285,190 288,035 290,909 293,811
6 County Population 24,538,627 24,693,549 24,849,565 25,006,686 25,164,918 25,324,271 25,425,895 25,528,107 25,630,911 25,734,311
Relationship 1.291% 1.291% 1.291% 1.291% 1.291% 1.291% 1.291% 1.291% 1.291% 1.291%
Salton Sea Visitors 316,898 318,899 320,914 322,943 324,986 327,044 328,357 329,677 331,004 332,340
From Northern Areas 82.6% 82.6% 82.5% 82.5% 82.5% 82.4% 82.4% 82.4% 82.4% 82.3%
Salton Sea Visitors-N 261,713 263,275 264,847 266,430 268,023 269,627 270,624 271,626 272,635 273,649
From Southern Areas 17.4% 17.4% 17.5% 17.5% 17.5% 17.6% 17.6% 17.6% 17.6% 17.7%
Salton Sea Visitors-S 55,185 55,624 56,067 56,513 56,963 57,418 57,733 58,050 58,369 58,690
Sources: Exhibit 17 & SCAG forecasts of Population to 2015-2040, SANDAG forecasts of Population, 2015-2050, CA Department of Finance forecast of population growth rates by county 2040-2060
Page 93 of 332

Recreational Demand Salton Sea Lake – South 20
Exhibit 11.- Estimates of Salton Sea SRA Visitors, By North & South Direction, By Year 2015-2062 (continued) Lake 2045 2046 2047 2048 2049 2050 2051 2052 2053 2054
Four County Population 21,268,723 21,332,272 21,396,177 21,460,439 21,525,062 21,590,047 21,635,749 21,681,705 21,727,916 21,774,385
San Diego 4,272,847 4,295,019 4,317,307 4,339,711 4,362,230 4,384,867 4,400,810 4,416,811 4,432,870 4,448,988
Imperial 296,742 299,347 301,974 304,625 307,298 309,995 312,296 314,613 316,948 319,300
6 County Population 25,838,312 25,926,639 26,015,458 26,104,775 26,194,591 26,284,910 26,348,855 26,413,129 26,477,734 26,542,673
Relationship 1.291% 1.291% 1.291% 1.291% 1.291% 1.291% 1.291% 1.291% 1.291% 1.291%
Salton Sea Visitors 333,683 334,823 335,970 337,124 338,284 339,450 340,276 341,106 341,940 342,779
From Northern Areas 82.3% 82.3% 82.2% 82.2% 82.2% 82.1% 82.1% 82.1% 82.1% 82.0%
Salton Sea Visitors-N 274,670 275,490 276,316 277,146 277,980 278,819 279,410 280,003 280,600 281,200
From Southern Areas 17.7% 17.7% 17.8% 17.8% 17.8% 17.9% 17.9% 17.9% 17.9% 18.0%
Salton Sea Visitors-S 59,013 59,333 59,655 59,978 60,304 60,631 60,866 61,103 61,340 61,579
Lake 2055 2056 2057 2058 2059 2060 2061 2062
Four County Population 21,821,113 21,846,640 21,872,372 21,898,310 21,924,456 21,950,809 21,977,372 22,004,146
San Diego 4,465,164 4,475,087 4,485,032 4,494,998 4,504,987 4,514,999 4,525,032 4,535,088
Imperial 321,669 323,677 325,698 327,731 329,776 331,835 333,906 335,990
6 County Population 26,607,946 26,645,404 26,683,101 26,721,039 26,759,219 26,797,643 26,836,310 26,875,224
Relationship 1.291% 1.291% 1.291% 1.291% 1.291% 1.291% 1.291% 1.291%
Salton Sea Visitors 343,622 344,106 344,592 345,082 345,575 346,072 346,571 347,074
From Northern Areas 82.0% 82.0% 82.0% 82.0% 81.9% 81.9% 81.9% 81.9%
Salton Sea Visitors-N 281,804 282,133 282,465 282,800 283,138 283,478 283,821 284,167
From Southern Areas 18.0% 18.0% 18.0% 18.0% 18.1% 18.1% 18.1% 18.1%
Salton Sea Visitors-S 61,818 61,972 62,127 62,282 62,437 62,593 62,750 62,906
Page 94 of 332

Recreational Demand Salton Sea Lake – South 21
C. For each visitor to the Salton Sea SRA who comes from San Diego County, the economic impact is determined using the Imperial County lake tourist group spending previously discussed (Exhibit 6) divided by the average of 3.0 persons per group. Since few of these visitors are likely to use boats, that category of spending is omitted. This yields a total direct and secondary economic impact per person per day of $277.90 for this category of visitor versus the $339.99 for lake using tourists (Exhibit 12).
Exhibit 12.-Imperial County Lake Tourist Spending Per Person, Per DaySector Visitor Spending Share
Hotel $21.67 7.8%
Food/Beverage/Dining $48.90 17.6%
Other-Total dollar amount spent $40.45 14.6%
Shopping/Gifts/Souvenirs $21.63 7.8%
Gasoline $24.22 8.7%
Groceries $13.93 5.0%
Entertainment, excluding gaming/Admissions $9.30 3.3%
Transportation (excl. parking/tolls) $6.72 2.4%
Amenities (spa, health club, tips, etc.) $6.04 2.2%
Parking/Tolls-Total dollar amount spent $0.80 0.3%
Total trip expenditures (Party) $193.67 69.7%
Secondary Sector Impact $84.23 30.3%
Total Impact $277.90 100.0%
Note: Boating spending omitted Source: Exhibit 6converted to per person per day by dividing by an average of 3.0 persons per group
D. To analyze the impact of San Diego visitor days on the SSL-S economy, the number of visitors to the Salton Sea SRA over and above the 2021 level of 7,892 is calculated from 2022 to 2062 (Exhibit 13, row 1):
o In 2022, the calculation is 10,002 visitors (from Exhibit 11) – 7,892 (2021 level) = 2,110 new visitors to the environmentally secure Salton Sea.
o Each new visitor is assumed be on a 2.0 day trip (4,221 visitor days in 2022).
E. The change in visitor days from the 2021 level data are multiplied by the $277.90 relevant to determine the total economic impact of each year’s new San Diego County visitors to the Salton Sea SRA (Exhibit 13, line 5):
o $1,172,878 in added spending in the SSL-S area during 2022
o $30,576,680 in added spending in the SSL-S area by 2062
F. The annual economic impact data from new SSL-S area tourists going to the Salton Sea SRA is then multiplied by the sector spending shares (Exhibit 12) to yield the array of added spending by sector in Imperial County (Exhibit 14).
Page 95 of 332

Recreational Demand Salton Sea Lake – South 22
Exhibit 13.-Economic Impact of New San Diego County Visitors to Salton Sea SRA, 2015-2062 2015 2016 2017 2018 2019 2020 2021 2022 2023 2024
Salton Sea SRA Visitors-South - New 0 0 0 0 0 0 0 2,110 4,785 8,175
Average Days 2.0 2.0 2.0 2.0 2.0 2.0 2.0 2.0 2.0 2.0
Average Visitor Days 0 0 0 0 0 0 0 4,221 9,570 16,349
Economic Impact Per Person $0.00 $0.00 $0.00 $0.00 $0.00 $0.00 $0.00 $277.90 $277.90 $277.90
Total Economic Impact $0 $0 $0 $0 $0 $0 $0 $1,172,878 $2,659,401 $4,543,448
Direct Spending 0 0 0 0 0 0 0 $817,372 $1,853,322 $3,166,304
Secondary Spending 0 0 0 0 0 0 0 $355,506 $806,079 $1,377,144
2025 2026 2027 2028 2029 2030 2031 2032 2033 2034
Salton Sea SRA Visitors- South - New 12,471 17,916 24,818 33,565 44,652 45,155 45,575 45,999 46,427 46,858
Average Days 2.0 2.0 2.0 2.0 2.0 2.0 2.0 2.0 2.0 2.0
Average Visitor Days 24,942 35,833 49,636 67,130 89,304 90,310 91,150 91,998 92,853 93,716
Economic Impact Per Person $277.90 $277.90 $277.90 $277.90 $277.90 $277.90 $277.90 $277.90 $277.90 $277.90
Total Economic Impact $6,931,333 $9,957,805 $13,793,654 $18,655,352 $24,817,273 $25,096,818 $25,330,434 $25,566,063 $25,803,726 $26,043,443
Direct Spending $4,830,408 $6,939,540 $9,612,722 $13,000,813 $17,295,022 $17,489,835 $17,652,641 $17,816,850 $17,982,476 $18,149,533
Secondary Spending $2,100,925 $3,018,265 $4,180,932 $5,654,539 $7,522,251 $7,606,983 $7,677,793 $7,749,214 $7,821,251 $7,893,910
2035 2036 2037 2038 2039 2040 2041 2042 2043 2044
Salton Sea SRA Visitors- South - New 0 47,732 48,174 48,621 49,071 49,526 49,841 50,158 50,477 50,798
Average Days 2.0 2.0 2.0 2.0 2.0 2.0 2.0 2.0 2.0 2.0
Average Visitor Days 94,586 95,464 96,349 97,242 98,143 99,051 99,682 100,316 100,954 101,596
Economic Impact Per Person $277.90 $277.90 $277.90 $277.90 $277.90 $277.90 $277.90 $277.90 $277.90 $277.90
Total Economic Impact $26,285,235 $26,529,122 $26,775,125 $27,023,266 $27,273,565 $27,526,045 $27,701,349 $27,877,659 $28,054,981 $28,233,322
Direct Spending $18,318,037 $18,488,000 $18,659,438 $18,832,366 $19,006,799 $19,182,751 $19,304,918 $19,427,788 $19,551,363 $19,675,648
Secondary Spending $7,967,199 $8,041,122 $8,115,687 $8,190,900 $8,266,767 $8,343,295 $8,396,430 $8,449,871 $8,503,618 $8,557,674
2045 2046 2047 2048 2049 2050 2051 2052 2053 2054
Salton Sea SRA Visitors-North 51,121 51,441 51,763 52,086 52,411 52,739 52,974 53,211 53,448 53,687
Average Days 2.0 2.0 2.0 2.0 2.0 2.0 2.0 2.0 2.0 2.0
Average Visitor Days 102,242 102,882 103,525 104,172 104,823 105,477 105,949 106,422 106,897 107,374
Economic Impact Per Person $277.90 $277.90 $277.90 $277.90 $277.90 $277.90 $277.90 $277.90 $277.90 $277.90
Total Economic Impact $28,412,689 $28,590,532 $28,769,365 $28,949,194 $29,130,024 $29,311,861 $29,442,807 $29,574,291 $29,706,317 $29,838,886
Direct Spending $19,800,648 $19,924,585 $20,049,213 $20,174,535 $20,300,554 $20,427,275 $20,518,531 $20,610,162 $20,702,170 $20,794,556
Secondary Spending $8,612,041 $8,665,947 $8,720,152 $8,774,659 $8,829,469 $8,884,585 $8,924,276 $8,964,129 $9,004,147 $9,044,330
Page 96 of 332

Recreational Demand Salton Sea Lake – South 23
Exhibit 13.-Economic Impact of New San Diego Visitors to Salton Sea SRA, 2015-2062 (continued)
2055 2056 2057 2058 2059 2060 2061 2062
Salton Sea SRA Visitors- North 53,926 54,080 54,235 54,390 54,545 54,701 54,858 55,014
Average Days 2.0 2.0 2.0 2.0 2.0 2.0 2.0 2.0
Average Visitor Days 107,853 108,161 108,470 108,780 109,091 109,402 109,715 110,029
Economic Impact Per Person $277.90 $277.90 $277.90 $277.90 $277.90 $277.90 $277.90 $277.90
Total Economic Impact $29,972,001 $30,057,634 $30,143,516 $30,229,647 $30,316,028 $30,402,659 $30,489,543 $30,576,680
Direct Spending $20,887,323 $20,947,001 $21,006,851 $21,066,875 $21,127,074 $21,187,447 $21,247,996 $21,308,721
Secondary Spending $9,084,677 $9,110,633 $9,136,665 $9,162,771 $9,188,954 $9,215,212 $9,241,547 $9,267,959
Exhibit 14.-Spending by New Salton Sea SRA Tourists, South, 2022-2062 Sector Share 2015 2016 2017 2018 2019 2020 2021 2022 2023 2024
Hotel 7.8% $0 $0 $0 $0 $0 $0 $0 $91,445 $207,344 $354,236
Food/Beverage/Dining, excluding groceries 17.6% $0 $0 $0 $0 $0 $0 $0 $206,374 $467,935 $799,443
Other-Total dollar amount spent 14.6% $0 $0 $0 $0 $0 $0 $0 $170,721 $387,096 $661,333
Shopping/Gifts/Souvenirs 7.8% $0 $0 $0 $0 $0 $0 $0 $91,303 $207,021 $353,685
Gasoline 8.7% $0 $0 $0 $0 $0 $0 $0 $102,235 $231,808 $396,033
Groceries 5.0% $0 $0 $0 $0 $0 $0 $0 $58,812 $133,350 $227,822
Entertainment, excluding gaming/Admissions 3.3% $0 $0 $0 $0 $0 $0 $0 $39,241 $88,975 $152,009
Transportation (excl. parking/tolls) 2.4% $0 $0 $0 $0 $0 $0 $0 $28,362 $64,309 $109,868
Amenities (spa, health club, tips, etc.) 2.2% $0 $0 $0 $0 $0 $0 $0 $25,513 $57,848 $98,831
Parking/Tolls-Total dollar amount spent 0.3% $0 $0 $0 $0 $0 $0 $0 $3,367 $7,635 $13,044
Total trip expenditures 69.7% $0 $0 $0 $0 $0 $0 $0 $817,372 $1,853,322 $3,166,304
Secondary Sector Impact 30.3% $0 $0 $0 $0 $0 $0 $0 $355,506 $806,079 $1,377,144
Total Impact 100.0% $0 $0 $0 $0 $0 $0 $0 $1,172,878 $2,659,401 $4,543,448
Page 97 of 332

Recreational Demand Salton Sea Lake – South 24
Exhibit 14.-Spending by New Salton Sea SRA Tourists, North, 2022-2062 (continued) Sector Share 2025 2026 2027 2028 2029 2030 2031 2032 2033 2034
Hotel 7.8% $540,411 $776,375 $1,075,442 $1,454,492 $1,934,915 $1,956,710 $1,974,924 $1,993,295 $2,011,825 $2,030,515
Food/Beverage/Dining, excluding groceries 17.6% $1,219,603 $1,752,127 $2,427,064 $3,282,504 $4,366,726 $4,415,913 $4,457,019 $4,498,479 $4,540,297 $4,582,477
Other-Total dollar amount spent 14.6% $1,008,908 $1,449,434 $2,007,770 $2,715,427 $3,612,341 $3,653,031 $3,687,036 $3,721,333 $3,755,927 $3,790,820
Shopping/Gifts/Souvenirs 7.8% $539,570 $775,166 $1,073,767 $1,452,227 $1,931,901 $1,953,663 $1,971,848 $1,990,191 $2,008,692 $2,027,353
Gasoline 8.7% $604,174 $867,979 $1,202,333 $1,626,106 $2,163,214 $2,187,580 $2,207,944 $2,228,483 $2,249,199 $2,270,094
Groceries 5.0% $347,558 $499,314 $691,655 $935,435 $1,244,412 $1,258,429 $1,270,143 $1,281,959 $1,293,876 $1,305,896
Entertainment, excluding gaming/Admissions 3.3% $231,900 $333,156 $461,492 $624,148 $830,307 $839,659 $847,475 $855,359 $863,310 $871,330
Transportation (excl. parking/tolls) 2.4% $167,611 $240,796 $333,553 $451,117 $600,123 $606,882 $612,532 $618,230 $623,977 $629,773
Amenities (spa, health club, tips, etc.) 2.2% $150,773 $216,607 $300,046 $405,799 $539,836 $545,917 $550,999 $556,124 $561,294 $566,508
Parking/Tolls-Total dollar amount spent 0.3% $19,899 $28,588 $39,600 $53,557 $71,247 $72,050 $72,721 $73,397 $74,079 $74,768
Total trip expenditures 69.7% $4,830,408 $6,939,540 $9,612,722 $13,000,813 $17,295,022 $17,489,835 $17,652,641 $17,816,850 $17,982,476 $18,149,533
Secondary Sector Impact 30.3% $2,100,925 $3,018,265 $4,180,932 $5,654,539 $7,522,251 $7,606,983 $7,677,793 $7,749,214 $7,821,251 $7,893,910
Total Impact 100.0% $6,931,333 $9,957,805 $13,793,654 $18,655,352 $24,817,273 $25,096,818 $25,330,434 $25,566,063 $25,803,726 $26,043,443
Sector Share 2035 2036 2037 2038 2039 2040 2041 2042 2043 2044
Hotel 7.8% $2,049,366 $2,068,381 $2,087,561 $2,106,908 $2,126,423 $2,146,108 $2,159,776 $2,173,522 $2,187,347 $2,201,252
Food/Beverage/Dining, excluding groceries 17.6% $4,625,021 $4,667,934 $4,711,220 $4,754,882 $4,798,923 $4,843,348 $4,874,194 $4,905,216 $4,936,417 $4,967,797
Other-Total dollar amount spent 14.6% $3,826,014 $3,861,514 $3,897,321 $3,933,440 $3,969,873 $4,006,624 $4,032,140 $4,057,803 $4,083,614 $4,109,573
Shopping/Gifts/Souvenirs 7.8% $2,046,175 $2,065,160 $2,084,310 $2,103,627 $2,123,112 $2,142,766 $2,156,412 $2,170,137 $2,183,941 $2,197,824
Gasoline 8.7% $2,291,170 $2,312,428 $2,333,871 $2,355,501 $2,377,318 $2,399,326 $2,414,606 $2,429,974 $2,445,431 $2,460,976
Groceries 5.0% $1,318,020 $1,330,249 $1,342,585 $1,355,027 $1,367,578 $1,380,238 $1,389,028 $1,397,869 $1,406,760 $1,415,703
Entertainment, excluding gaming/Admissions 3.3% $879,420 $887,580 $895,810 $904,112 $912,486 $920,933 $926,799 $932,697 $938,630 $944,597
Transportation (excl. parking/tolls) 2.4% $635,620 $641,518 $647,467 $653,467 $659,520 $665,625 $669,864 $674,128 $678,416 $682,728
Amenities (spa, health club, tips, etc.) 2.2% $571,768 $577,073 $582,424 $587,822 $593,267 $598,759 $602,572 $606,407 $610,264 $614,144
Parking/Tolls-Total dollar amount spent 0.3% $75,462 $76,162 $76,868 $77,581 $78,299 $79,024 $79,527 $80,033 $80,543 $81,054
Total trip expenditures 69.7% $18,318,037 $18,488,000 $18,659,438 $18,832,366 $19,006,799 $19,182,751 $19,304,918 $19,427,788 $19,551,363 $19,675,648
Secondary Sector Impact 30.3% $7,967,199 $8,041,122 $8,115,687 $8,190,900 $8,266,767 $8,343,295 $8,396,430 $8,449,871 $8,503,618 $8,557,674
Total Impact 100.0% $26,285,235 $26,529,122 $26,775,125 $27,023,266 $27,273,565 $27,526,045 $27,701,349 $27,877,659 $28,054,981 $28,233,322
Page 98 of 332

Recreational Demand Salton Sea Lake – South 25
Exhibit 14.-Spending by New Salton Sea SRA Tourists, South, 2022-2062 (continued) Sector Share 2045 2046 2047 2048 2049 2050 2051 2052 2053 2054
Hotel 7.8% $2,215,236 $2,229,102 $2,243,045 $2,257,066 $2,271,165 $2,285,342 $2,295,551 $2,305,802 $2,316,096 $2,326,432
Food/Beverage/Dining, excluding groceries 17.6% $4,999,358 $5,030,650 $5,062,117 $5,093,758 $5,125,576 $5,157,571 $5,180,612 $5,203,747 $5,226,978 $5,250,304
Other-Total dollar amount spent 14.6% $4,135,681 $4,161,568 $4,187,598 $4,213,773 $4,240,095 $4,266,562 $4,285,623 $4,304,761 $4,323,979 $4,343,275
Shopping/Gifts/Souvenirs 7.8% $2,211,787 $2,225,631 $2,239,552 $2,253,551 $2,267,628 $2,281,783 $2,291,976 $2,302,212 $2,312,489 $2,322,809
Gasoline 8.7% $2,476,611 $2,492,112 $2,507,700 $2,523,375 $2,539,137 $2,554,987 $2,566,401 $2,577,862 $2,589,370 $2,600,926
Groceries 5.0% $1,424,697 $1,433,615 $1,442,582 $1,451,599 $1,460,666 $1,469,784 $1,476,350 $1,482,943 $1,489,563 $1,496,211
Entertainment, excluding gaming/Admissions 3.3% $950,598 $956,548 $962,531 $968,547 $974,597 $980,681 $985,062 $989,461 $993,878 $998,314
Transportation (excl. parking/tolls) 2.4% $687,066 $691,366 $695,691 $700,039 $704,412 $708,809 $711,976 $715,155 $718,348 $721,553
Amenities (spa, health club, tips, etc.) 2.2% $618,045 $621,914 $625,804 $629,716 $633,649 $637,605 $640,453 $643,313 $646,185 $649,069
Parking/Tolls-Total dollar amount spent 0.3% $81,569 $82,080 $82,593 $83,110 $83,629 $84,151 $84,527 $84,904 $85,283 $85,664
Total trip expenditures 69.7% $19,800,648 $19,924,585 $20,049,213 $20,174,535 $20,300,554 $20,427,275 $20,518,531 $20,610,162 $20,702,170 $20,794,556
Secondary Sector Impact 30.3% $8,612,041 $8,665,947 $8,720,152 $8,774,659 $8,829,469 $8,884,585 $8,924,276 $8,964,129 $9,004,147 $9,044,330
Total Impact 100.0% $28,412,689 $28,590,532 $28,769,365 $28,949,194 $29,130,024 $29,311,861 $29,442,807 $29,574,291 $29,706,317 $29,838,886
Sector Share 2055 2056 2057 2058 2059 2060 2061 2062
Hotel 7.8% $2,336,810 $2,343,487 $2,350,183 $2,356,898 $2,363,633 $2,370,387 $2,377,161 $2,383,955
Food/Beverage/Dining, excluding groceries 17.6% $5,273,726 $5,288,794 $5,303,905 $5,319,061 $5,334,260 $5,349,503 $5,364,791 $5,380,123
Other-Total dollar amount spent 14.6% $4,362,651 $4,375,115 $4,387,616 $4,400,153 $4,412,727 $4,425,336 $4,437,983 $4,450,666
Shopping/Gifts/Souvenirs 7.8% $2,333,171 $2,339,837 $2,346,523 $2,353,228 $2,359,952 $2,366,696 $2,373,459 $2,380,243
Gasoline 8.7% $2,612,529 $2,619,993 $2,627,479 $2,634,987 $2,642,516 $2,650,068 $2,657,641 $2,665,236
Groceries 5.0% $1,502,886 $1,507,179 $1,511,486 $1,515,805 $1,520,136 $1,524,480 $1,528,837 $1,533,206
Entertainment, excluding gaming/Admissions 3.3% $1,002,767 $1,005,632 $1,008,506 $1,011,387 $1,014,277 $1,017,176 $1,020,083 $1,022,998
Transportation (excl. parking/tolls) 2.4% $724,772 $726,843 $728,920 $731,003 $733,092 $735,186 $737,287 $739,395
Amenities (spa, health club, tips, etc.) 2.2% $651,964 $653,827 $655,695 $657,569 $659,448 $661,332 $663,222 $665,117
Parking/Tolls-Total dollar amount spent 0.3% $86,046 $86,292 $86,538 $86,786 $87,034 $87,282 $87,532 $87,782
Total trip expenditures 69.7% $20,887,323 $20,947,001 $21,006,851 $21,066,875 $21,127,074 $21,187,447 $21,247,996 $21,308,721
Secondary Sector Impact 30.3% $9,084,677 $9,110,633 $9,136,665 $9,162,771 $9,188,954 $9,215,212 $9,241,547 $9,267,959
Total Impact 100.0% $29,972,001 $30,057,634 $30,143,516 $30,229,647 $30,316,028 $30,402,659 $30,489,543 $30,576,680
Page 99 of 332

Recreational Demand Salton Sea Lake – South 26
16. Grand Total Economic Impact. It remains to add the annual economic impact of new San Diego County visitors to the Salton Sea SRA (Exhibit 13) to that of annual impact of the lake tourists (Exhibit 7) to determine the grand total impact of building the SSL-S (Exhibit 15A-F, top). Also, the sector breakdown of the independent tourist spending (Exhibit 14) must be added to that of tourists captured from other lakes (Exhibit 8). Those totals are also show below (Exhibit 15A-F, bottom).
Grand total economic impact of SSL-S would go from $56.9 million in 2022 to $557.5 million by 2062 in constant 2015 inflation adjusted dollars.
Sector breakdowns show that the major beneficiaries would be:
Food & Beverage and Dining outlets would rank first going from $8.2 million in 2022 to $81.1 million in 2062
Boat related services would go from $7.1 million in 2022 to $67.1 million in 2062
Other outlets would increase from $6.8 million in 2022 to $67.1 million in 2062
Service station would see business go from $4.1 million in 2022 to $40.2 million in 2062
Hotels would go from an added $3.6 million in 2022 to $36.0 million in 2062
Shopping outlets would increase from $3.6 million in 2022 to $35.9 million in 2062
Again, these estimates do not include additional spending that would occur in each of these sectors, as well as the others not listed, as monies that initially come to the SSL-S market from tourists are spent within the local area creating a secondary spending impact. This is quite significant in an area like the SSL-S market because it is a relatively self sufficient, particularly in the provision of labor and services.
Page 100 of 332

Recreational Demand Salton Sea Lake – South 27
Exhibit 15A.-Grand Total Economic Impact – Salton Sea Lake-South 2015-2024 2015 2016 2017 2018 2019 2020 2021 2022 2023 2024
Lake Captured Tourists $0 $0 $0 $0 $0 $0 $0 $55,764,792 $63,305,984 $70,979,741
Salton Sea SRA Tourists $0 $0 $0 $0 $0 $0 $0 $1,172,878 $2,659,401 $4,543,448
Total Economic Impact $0 $0 $0 $0 $0 $0 $0 $56,937,670 $65,965,385 $75,523,189
Direct Spending $0 $0 $0 $0 $0 $0 $0 $39,679,551 $45,970,916 $52,631,697
Secondary Spending $0 $0 $0 $0 $0 $0 $0 $17,258,119 $19,994,469 $22,891,492
Sector Shares
Hotel $0 $0 $0 $0 $0 $0 $0 $3,645,143 $4,241,616 $4,877,531
Food/Beverage/Dining $0 $0 $0 $0 $0 $0 $0 $8,226,379 $9,572,503 $11,007,638
Boat Costs $0 $0 $0 $0 $0 $0 $0 $7,097,838 $8,057,694 $9,034,423
Other-Total dollar amount spent $0 $0 $0 $0 $0 $0 $0 $6,805,211 $7,918,781 $9,105,986
Shopping/Gifts/Souvenirs $0 $0 $0 $0 $0 $0 $0 $3,639,467 $4,235,011 $4,869,935
Gasoline $0 $0 $0 $0 $0 $0 $0 $4,075,231 $4,742,082 $5,453,027
Groceries $0 $0 $0 $0 $0 $0 $0 $2,344,321 $2,727,934 $3,136,913
Entertainment, excluding gaming/Admissions $0 $0 $0 $0 $0 $0 $0 $1,564,196 $1,820,154 $2,093,036
Transportation (excl. parking/tolls) $0 $0 $0 $0 $0 $0 $0 $1,130,558 $1,315,557 $1,512,788
Amenities (spa, health club, tips, etc.) $0 $0 $0 $0 $0 $0 $0 $1,016,986 $1,183,400 $1,360,819
Parking/Tolls-Total dollar amount spent $0 $0 $0 $0 $0 $0 $0 $134,221 $156,185 $179,600
Total trip expenditures $0 $0 $0 $0 $0 $0 $0 $39,679,551 $45,970,916 $52,631,697
Secondary Sector Impact $0 $0 $0 $0 $0 $0 $0 $17,258,119 $19,994,469 $22,891,492
TOTAL $0 $0 $0 $0 $0 $0 $0 $56,937,670 $65,965,385 $75,523,189
Page 101 of 332

Recreational Demand Salton Sea Lake – South 28
Exhibit 15B.-Grand Total Economic Impact – Salton Sea Lake-South 2025-2034 2025 2026 2027 2028 2029 2030 2031 2032 2033 2034
Lake Captured Tourists $78,787,850 $86,732,121 $94,814,383 $103,036,492 $111,400,321 $119,907,768 $132,866,877 $146,009,801 $159,338,541 $172,855,117
Salton Sea SRA Tourists $6,931,333 $9,957,805 $13,793,654 $18,655,352 $24,817,273 $25,096,818 $25,330,434 $25,566,063 $25,803,726 $26,043,443
Total Economic Impact $85,719,183 $96,689,925 $108,608,038 $121,691,844 $136,217,594 $145,004,587 $158,197,311 $171,575,864 $185,142,267 $198,898,561
Direct Spending $59,737,230 $67,382,680 $75,688,347 $84,806,381 $94,929,296 $101,052,903 $110,246,840 $119,570,281 $129,024,633 $138,611,319
Secondary Spending $25,981,953 $29,307,245 $32,919,690 $36,885,464 $41,288,298 $43,951,683 $47,950,470 $52,005,583 $56,117,634 $60,287,242
Sector Shares
Hotel $5,561,290 $6,303,514 $7,117,636 $8,020,653 $9,034,074 $9,598,019 $10,442,073 $11,297,997 $12,165,922 $13,045,976
Food/Beverage/Dining $12,550,749 $14,225,805 $16,063,120 $18,101,052 $20,388,146 $21,660,861 $23,565,726 $25,497,381 $27,456,117 $29,442,230
Boat Costs $10,028,252 $11,039,412 $12,068,137 $13,114,661 $14,179,223 $15,262,065 $16,911,523 $18,584,377 $20,280,881 $22,001,294
Other-Total dollar amount spent $10,382,513 $11,768,191 $13,288,096 $14,973,960 $16,865,941 $17,918,785 $19,494,570 $21,092,518 $22,712,868 $24,355,864
Shopping/Gifts/Souvenirs $5,552,629 $6,293,698 $7,106,552 $8,008,162 $9,020,005 $9,583,072 $10,425,811 $11,280,403 $12,146,976 $13,025,660
Gasoline $6,217,462 $7,047,261 $7,957,441 $8,967,003 $10,099,997 $10,730,482 $11,674,125 $12,631,039 $13,601,369 $14,585,261
Groceries $3,576,662 $4,054,013 $4,577,604 $5,158,365 $5,810,132 $6,172,826 $6,715,666 $7,266,142 $7,824,335 $8,390,329
Entertainment, excluding gaming/Admissions $2,386,449 $2,704,951 $3,054,305 $3,441,806 $3,876,683 $4,118,682 $4,480,881 $4,848,173 $5,220,615 $5,598,262
Transportation (excl. parking/tolls) $1,724,859 $1,955,064 $2,207,567 $2,487,642 $2,801,959 $2,976,869 $3,238,656 $3,504,125 $3,773,316 $4,046,269
Amenities (spa, health club, tips, etc.) $1,551,586 $1,758,664 $1,985,803 $2,237,742 $2,520,484 $2,677,823 $2,913,312 $3,152,113 $3,394,261 $3,639,794
Parking/Tolls-Total dollar amount spent $204,778 $232,108 $262,086 $295,336 $332,653 $353,418 $384,498 $416,015 $447,974 $480,379
Total trip expenditures $59,737,230 $67,382,680 $75,688,347 $84,806,381 $94,929,296 $101,052,903 $110,246,840 $119,570,281 $129,024,633 $138,611,319
Secondary Sector Impact $25,981,953 $29,307,245 $32,919,690 $36,885,464 $41,288,298 $43,951,683 $47,950,470 $52,005,583 $56,117,634 $60,287,242
TOTAL $85,719,183 $96,689,925 $108,608,038 $121,691,844 $136,217,594 $145,004,587 $158,197,311 $171,575,864 $185,142,267 $198,898,561
Page 102 of 332
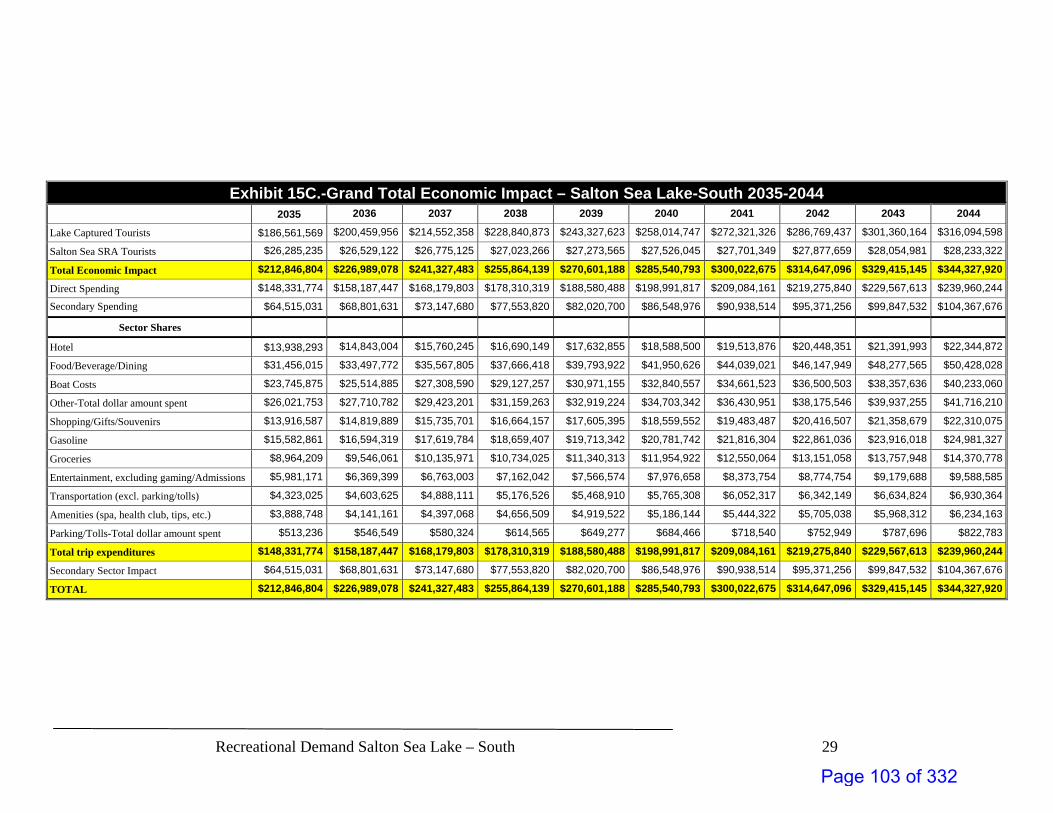
Recreational Demand Salton Sea Lake – South 29
Exhibit 15C.-Grand Total Economic Impact – Salton Sea Lake-South 2035-2044 2035 2036 2037 2038 2039 2040 2041 2042 2043 2044
Lake Captured Tourists $186,561,569 $200,459,956 $214,552,358 $228,840,873 $243,327,623 $258,014,747 $272,321,326 $286,769,437 $301,360,164 $316,094,598
Salton Sea SRA Tourists $26,285,235 $26,529,122 $26,775,125 $27,023,266 $27,273,565 $27,526,045 $27,701,349 $27,877,659 $28,054,981 $28,233,322
Total Economic Impact $212,846,804 $226,989,078 $241,327,483 $255,864,139 $270,601,188 $285,540,793 $300,022,675 $314,647,096 $329,415,145 $344,327,920
Direct Spending $148,331,774 $158,187,447 $168,179,803 $178,310,319 $188,580,488 $198,991,817 $209,084,161 $219,275,840 $229,567,613 $239,960,244
Secondary Spending $64,515,031 $68,801,631 $73,147,680 $77,553,820 $82,020,700 $86,548,976 $90,938,514 $95,371,256 $99,847,532 $104,367,676
Sector Shares
Hotel $13,938,293 $14,843,004 $15,760,245 $16,690,149 $17,632,855 $18,588,500 $19,513,876 $20,448,351 $21,391,993 $22,344,872
Food/Beverage/Dining $31,456,015 $33,497,772 $35,567,805 $37,666,418 $39,793,922 $41,950,626 $44,039,021 $46,147,949 $48,277,565 $50,428,028
Boat Costs $23,745,875 $25,514,885 $27,308,590 $29,127,257 $30,971,155 $32,840,557 $34,661,523 $36,500,503 $38,357,636 $40,233,060
Other-Total dollar amount spent $26,021,753 $27,710,782 $29,423,201 $31,159,263 $32,919,224 $34,703,342 $36,430,951 $38,175,546 $39,937,255 $41,716,210
Shopping/Gifts/Souvenirs $13,916,587 $14,819,889 $15,735,701 $16,664,157 $17,605,395 $18,559,552 $19,483,487 $20,416,507 $21,358,679 $22,310,075
Gasoline $15,582,861 $16,594,319 $17,619,784 $18,659,407 $19,713,342 $20,781,742 $21,816,304 $22,861,036 $23,916,018 $24,981,327
Groceries $8,964,209 $9,546,061 $10,135,971 $10,734,025 $11,340,313 $11,954,922 $12,550,064 $13,151,058 $13,757,948 $14,370,778
Entertainment, excluding gaming/Admissions $5,981,171 $6,369,399 $6,763,003 $7,162,042 $7,566,574 $7,976,658 $8,373,754 $8,774,754 $9,179,688 $9,588,585
Transportation (excl. parking/tolls) $4,323,025 $4,603,625 $4,888,111 $5,176,526 $5,468,910 $5,765,308 $6,052,317 $6,342,149 $6,634,824 $6,930,364
Amenities (spa, health club, tips, etc.) $3,888,748 $4,141,161 $4,397,068 $4,656,509 $4,919,522 $5,186,144 $5,444,322 $5,705,038 $5,968,312 $6,234,163
Parking/Tolls-Total dollar amount spent $513,236 $546,549 $580,324 $614,565 $649,277 $684,466 $718,540 $752,949 $787,696 $822,783
Total trip expenditures $148,331,774 $158,187,447 $168,179,803 $178,310,319 $188,580,488 $198,991,817 $209,084,161 $219,275,840 $229,567,613 $239,960,244
Secondary Sector Impact $64,515,031 $68,801,631 $73,147,680 $77,553,820 $82,020,700 $86,548,976 $90,938,514 $95,371,256 $99,847,532 $104,367,676
TOTAL $212,846,804 $226,989,078 $241,327,483 $255,864,139 $270,601,188 $285,540,793 $300,022,675 $314,647,096 $329,415,145 $344,327,920
Page 103 of 332

Recreational Demand Salton Sea Lake – South 30
Exhibit 15D.-Grand Total Economic Impact – Salton Sea Lake-South 2045-2054 2045 2046 2047 2048 2049 2050 2051 2052 2053 2054
Lake Captured Tourists $330,973,838 $345,998,989 $361,171,165 $376,491,488 $391,961,087 $407,581,098 $422,698,468 $437,920,382 $453,247,400 $468,680,084
Salton Sea SRA Tourists $28,412,689 $28,590,532 $28,769,365 $28,949,194 $29,130,024 $29,311,861 $29,442,807 $29,574,291 $29,706,317 $29,838,886
Total Economic Impact $359,386,526 $374,589,521 $389,940,530 $405,440,682 $421,091,110 $436,892,958 $452,141,275 $467,494,674 $482,953,717 $498,518,970
Direct Spending $250,454,505 $261,049,388 $271,747,423 $282,549,394 $293,456,092 $304,468,313 $315,094,782 $325,794,481 $336,567,804 $347,415,143
Secondary Spending $108,932,022 $113,540,132 $118,193,107 $122,891,288 $127,635,019 $132,424,645 $137,046,493 $141,700,193 $146,385,913 $151,103,826
Sector Shares
Hotel $23,307,060 $24,278,427 $25,259,240 $26,249,572 $27,249,495 $28,259,082 $29,232,669 $30,212,961 $31,199,993 $32,193,800
Food/Beverage/Dining $52,599,498 $54,791,684 $57,005,189 $59,240,176 $61,496,808 $63,775,248 $65,972,446 $68,184,773 $70,412,311 $72,655,142
Boat Costs $42,126,915 $44,039,342 $45,970,482 $47,920,479 $49,889,476 $51,877,618 $53,801,782 $55,739,254 $57,690,103 $59,654,401
Other-Total dollar amount spent $43,512,541 $45,326,011 $47,157,117 $49,005,993 $50,872,774 $52,757,597 $54,575,212 $56,405,344 $58,248,058 $60,103,423
Shopping/Gifts/Souvenirs $23,270,763 $24,240,618 $25,219,904 $26,208,694 $27,207,059 $28,215,074 $29,187,145 $30,165,910 $31,151,405 $32,143,665
Gasoline $26,057,042 $27,143,020 $28,239,559 $29,346,739 $30,464,642 $31,593,349 $32,681,810 $33,777,765 $34,881,256 $35,992,322
Groceries $14,989,595 $15,614,315 $16,245,111 $16,882,029 $17,525,115 $18,174,416 $18,800,564 $19,431,024 $20,065,819 $20,704,972
Entertainment, excluding gaming/Admissions $10,001,477 $10,418,308 $10,839,193 $11,264,162 $11,693,247 $12,126,479 $12,544,262 $12,964,923 $13,388,476 $13,814,937
Transportation (excl. parking/tolls) $7,228,790 $7,530,064 $7,834,268 $8,141,424 $8,451,555 $8,764,683 $9,066,645 $9,370,687 $9,676,819 $9,985,053
Amenities (spa, health club, tips, etc.) $6,502,611 $6,773,619 $7,047,264 $7,323,564 $7,602,540 $7,884,212 $8,155,841 $8,429,339 $8,704,719 $8,981,989
Parking/Tolls-Total dollar amount spent $858,213 $893,980 $930,096 $966,562 $1,003,381 $1,040,556 $1,076,405 $1,112,502 $1,148,846 $1,185,440
Total trip expenditures $250,454,505 $261,049,388 $271,747,423 $282,549,394 $293,456,092 $304,468,313 $315,094,782 $325,794,481 $336,567,804 $347,415,143
Secondary Sector Impact $108,932,022 $113,540,132 $118,193,107 $122,891,288 $127,635,019 $132,424,645 $137,046,493 $141,700,193 $146,385,913 $151,103,826
TOTAL $359,386,526 $374,589,521 $389,940,530 $405,440,682 $421,091,110 $436,892,958 $452,141,275 $467,494,674 $482,953,717 $498,518,970
Page 104 of 332
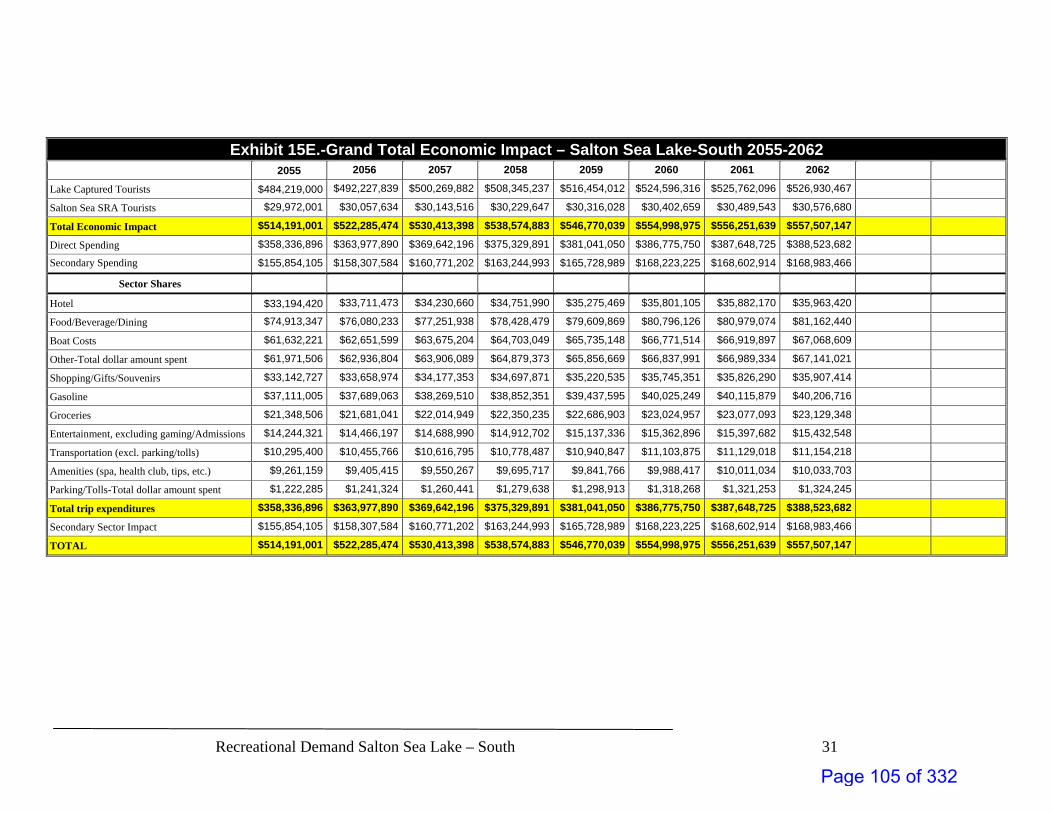
Recreational Demand Salton Sea Lake – South 31
Exhibit 15E.-Grand Total Economic Impact – Salton Sea Lake-South 2055-2062 2055 2056 2057 2058 2059 2060 2061 2062
Lake Captured Tourists $484,219,000 $492,227,839 $500,269,882 $508,345,237 $516,454,012 $524,596,316 $525,762,096 $526,930,467
Salton Sea SRA Tourists $29,972,001 $30,057,634 $30,143,516 $30,229,647 $30,316,028 $30,402,659 $30,489,543 $30,576,680
Total Economic Impact $514,191,001 $522,285,474 $530,413,398 $538,574,883 $546,770,039 $554,998,975 $556,251,639 $557,507,147
Direct Spending $358,336,896 $363,977,890 $369,642,196 $375,329,891 $381,041,050 $386,775,750 $387,648,725 $388,523,682
Secondary Spending $155,854,105 $158,307,584 $160,771,202 $163,244,993 $165,728,989 $168,223,225 $168,602,914 $168,983,466
Sector Shares
Hotel $33,194,420 $33,711,473 $34,230,660 $34,751,990 $35,275,469 $35,801,105 $35,882,170 $35,963,420
Food/Beverage/Dining $74,913,347 $76,080,233 $77,251,938 $78,428,479 $79,609,869 $80,796,126 $80,979,074 $81,162,440
Boat Costs $61,632,221 $62,651,599 $63,675,204 $64,703,049 $65,735,148 $66,771,514 $66,919,897 $67,068,609
Other-Total dollar amount spent $61,971,506 $62,936,804 $63,906,089 $64,879,373 $65,856,669 $66,837,991 $66,989,334 $67,141,021
Shopping/Gifts/Souvenirs $33,142,727 $33,658,974 $34,177,353 $34,697,871 $35,220,535 $35,745,351 $35,826,290 $35,907,414
Gasoline $37,111,005 $37,689,063 $38,269,510 $38,852,351 $39,437,595 $40,025,249 $40,115,879 $40,206,716
Groceries $21,348,506 $21,681,041 $22,014,949 $22,350,235 $22,686,903 $23,024,957 $23,077,093 $23,129,348
Entertainment, excluding gaming/Admissions $14,244,321 $14,466,197 $14,688,990 $14,912,702 $15,137,336 $15,362,896 $15,397,682 $15,432,548
Transportation (excl. parking/tolls) $10,295,400 $10,455,766 $10,616,795 $10,778,487 $10,940,847 $11,103,875 $11,129,018 $11,154,218
Amenities (spa, health club, tips, etc.) $9,261,159 $9,405,415 $9,550,267 $9,695,717 $9,841,766 $9,988,417 $10,011,034 $10,033,703
Parking/Tolls-Total dollar amount spent $1,222,285 $1,241,324 $1,260,441 $1,279,638 $1,298,913 $1,318,268 $1,321,253 $1,324,245
Total trip expenditures $358,336,896 $363,977,890 $369,642,196 $375,329,891 $381,041,050 $386,775,750 $387,648,725 $388,523,682
Secondary Sector Impact $155,854,105 $158,307,584 $160,771,202 $163,244,993 $165,728,989 $168,223,225 $168,602,914 $168,983,466
TOTAL $514,191,001 $522,285,474 $530,413,398 $538,574,883 $546,770,039 $554,998,975 $556,251,639 $557,507,147
Page 105 of 332

BENCHMARK 5:
INFRASTRUCTURE FINANCING
FEASIBILITY ANALYSIS
Appendix 2.3: TOT & Sales Tax Estimates –
Salton Sea Project, 2022-2062
Page 106 of 332

Salton Sea Project TOT & Sales Tax Estimates 1
Economics & Politics, Inc. P.O. Box
Redlands, CA 92375 (909) 307-9444 Phone
[email protected] www.johnhusing.com
TOT & Sales Tax Estimates, Salton Sea Project, 2022-2062
To determine the basis for the Transient Occupancy Tax collections within the Opportunity Areas adjacent to the Salton Sea to the north and the south, the following procedures were used:
Opportunity Areas 1, 2, 2A
In the areas adjacent to the Coachella Valley, the TOT from the Salton Sea Lake-North were estimated as follows:
1. Total Visitor Days were calculated from the modeling of potential lake tourists from 2022-2062 for the full Coachella Valley. In Opportunity Areas 1, 2, 2A, no rooms were assumed to be rented in the area from 2017-2024 on the assumption that entrepreneurs will be skeptical about investing in hotel and motel facilities until they believe the clean lake will be created. It will then take from 2022-2024 years to get facilities ready. This is assumed given the number of times a solution to the Salton Sea’s issues has been discussed and gone nowhere.
2. These were divided by 3.0 Average Visitors in a party to calculated the number of Hotel Rooms.
3. The Captured Share from the Coachella Valley (CV) by Opportunity Areas 1, 2, 2A was started at 5% assumption in 2024 and increased in four year periods by 2%, 3%, 4%, 5%, 6% as market penetration of the full CV market b grows to maximum of 85%.
4. Those Capture Rates were multiplied by the Number Of Rooms in the CV area to determine the number captured per year by Opportunity Areas 1, 2, 2A.
5. The Room Rate was started at $100 and increasing $5 per year to a $199 maximum.
6. Each year, the Room Rate times the number of Captured Rooms = Total Room Revenue.
7. 10% Transient Occupancy Tax times Total Room Revenue = Estimate TOT Revenue.
8. 3,000,000 is the total CV room-day usage in recent years. This was used to calculate the percentage above that level that would be captured in Opportunity Areas 1, 2, 2A.
9. That percentage allowed the estimate of the actual Opportunity Areas 1, 2, 2A usage above the 3,000,000 CV level.
10. Estimates showed the Number of Rooms needed if Opportunity Areas 1, 2, 2A handled their full market.
11. That was compared to the Number of Rooms at the Opportunity Areas 1, 2, 2A capture rates.
The result shows the number of rooms captured, revenue and TOT in Opportunity Areas 1, 2, 2A:
38 of a possible 767 in 2024; Room Revenue of $1,399,028; TOT of $139,903.
3,092 of a possible 3,637 in 2062; Room Revenue of $224,562,055; TOT of $22,456,205.
Page 107 of 332

Salton Sea Project TOT & Sales Tax Estimates 2
Exhibit 1.-Estimates of Transient Occupancy Tax, Opportunity Areas 1, 2, 2A, 2022-2031 Year 2022 2023 2024 2025 2026 2027 2028 2029 2030 2031
Visitors Days 602,154 716,873 839,417 971,590 1,115,672 1,274,542 1,451,835 1,652,148 1,752,181 1,867,665
Parties/Rooms 200,718 238,958 279,806 323,863 371,891 424,847 483,945 550,716 584,060 622,555
Increase In Capture 0.0% 0.0% 5.0% 2.0% 2.0% 2.0% 2.0% 3.0% 3.0% 3.0%
Share Captured 0.0% 0.0% 5.0% 7.0% 9.0% 11.0% 13.0% 16.0% 19.0% 22.0%
Rooms/Year 0 0 13,990 22,670 33,470 46,733 62,913 88,115 110,971 136,962
Local Rent $100 $100 $100 $100 $105 $110 $115 $120 $125 $130
Room Revenue $0 $0 $1,399,028 $2,267,043 $3,514,367 $5,140,652 $7,234,980 $10,573,745 $13,871,433 $17,805,074
TOT 10% $0 $0 $139,903 $226,704 $351,437 $514,065 $723,498 $1,057,374 $1,387,143 $1,780,507
Share of CV Rooms 6.7% 8.0% 9.3% 10.8% 12.4% 14.2% 16.1% 18.4% 19.5% 20.8%
Share CV Captured 1, 2, 2A 0.0% 0.0% 0.5% 0.8% 1.1% 1.6% 2.1% 2.9% 3.7% 4.6%
Rooms Possible 550 655 767 887 1,019 1,164 1,326 1,509 1,600 1,706
Rooms Needed 1, 2, 2A 0 0 38 62 92 128 172 241 304 375
Exhibit 1.-Estimates of Transient Occupancy Tax, Opportunity Areas 1, 2, 2A, 2032-2041 Year 2032 2033 2034 2035 2036 2037 2038 2039 2040 2041
Visitors Days 1,984,490 2,102,672 2,222,226 2,341,881 2,461,631 2,582,672 2,705,018 2,828,679 2,948,367 3,066,330
Parties/Rooms 661,497 700,891 740,742 780,627 820,544 860,891 901,673 942,893 982,789 1,022,110
Increase In Capture 3.0% 4.0% 4.0% 4.0% 4.0% 5.0% 5.0% 5.0% 5.0% 6.0%
Share Captured 25.0% 29.0% 33.0% 37.0% 41.0% 46.0% 51.0% 56.0% 61.0% 67.0%
Rooms/Year 165,374 203,258 244,445 288,832 336,423 396,010 459,853 528,020 599,501 684,814
Local Rent $135 $140 $145 $150 $155 $160 $165 $170 $175 $180
Room Revenue $22,325,515 $28,456,161 $35,444,512 $43,324,802 $52,145,547 $63,361,561 $75,875,747 $89,763,424 $104,912,727 $123,266,464
TOT 10% $2,232,551 $2,845,616 $3,544,451 $4,332,480 $5,214,555 $6,336,156 $7,587,575 $8,976,342 $10,491,273 $12,326,646
Share of CV Rooms 22.0% 23.4% 24.7% 26.0% 27.4% 28.7% 30.1% 31.4% 32.8% 34.1%
Share CV Captured 1, 2, 2A 5.5% 6.8% 8.1% 9.6% 11.2% 13.2% 15.3% 17.6% 20.0% 22.8%
Rooms Possible 1,812 1,920 2,029 2,139 2,248 2,359 2,470 2,583 2,693 2,800
Rooms Needed 1, 2, 2A 453 557 670 791 922 1,085 1,260 1,447 1,642 1,876
Page 108 of 332

Salton Sea Project TOT & Sales Tax Estimates 3
Exhibit 1.-Estimates of Transient Occupancy Tax, Opportunity Areas 1, 2, 2A, 2042-2051 Year 2042 2043 2044 2045 2046 2047 2048 2049 2050 2051
Visitors Days 3,184,985 3,240,945 3,297,230 3,353,844 3,408,192 3,462,790 3,517,639 3,572,741 3,628,098 3,674,939
Parties/Rooms 1,061,662 1,080,315 1,099,077 1,117,948 1,136,064 1,154,263 1,172,546 1,190,914 1,209,366 1,224,980
Increase In Capture 6.0% 6.0% 6.0% 0.0% 0.0% 0.0% 0.0% 0.0% 0.0% 0.0%
Share Captured 73.0% 79.0% 85.0% 85.0% 85.0% 85.0% 85.0% 85.0% 85.0% 85.0%
Rooms/Year 775,013 853,449 934,215 950,256 965,654 981,124 996,664 1,012,277 1,027,961 1,041,233
Local Rent $185 $190 $199 $199 $199 $199 $199 $199 $199 $199
Room Revenue $143,377,407 $162,155,276 $185,908,838 $189,100,896 $192,165,222 $195,243,617 $198,336,187 $201,443,038 $204,564,277 $207,205,331
TOT 10% $14,337,741 $16,215,528 $18,590,884 $18,910,090 $19,216,522 $19,524,362 $19,833,619 $20,144,304 $20,456,428 $20,720,533
Share of CV Rooms 35.4% 36.0% 36.6% 37.3% 37.9% 38.5% 39.1% 39.7% 40.3% 40.8%
Share CV Captured 1, 2, 2A 25.8% 28.4% 31.1% 31.7% 32.2% 32.7% 33.2% 33.7% 34.3% 34.7%
Rooms Possible 2,909 2,960 3,011 3,063 3,113 3,162 3,212 3,263 3,313 3,356
Rooms Needed 1, 2, 2A 2,123 2,338 2,559 2,603 2,646 2,688 2,731 2,773 2,816 2,853
Exhibit 1.-Estimates of Transient Occupancy Tax, Opportunity Areas 1, 2, 2A, 2052-2062 Year 2052 2053 2054 2055 2056 2057 2058 2059 2060 2061 2062
Visitors Days 3,721,927 3,769,062 3,816,347 3,863,781 3,886,590 3,909,444 3,932,344 3,955,291 3,978,284 3,980,514 3,982,774
Parties/Rooms 1,240,642 1,256,354 1,272,116 1,287,927 1,295,530 1,303,148 1,310,781 1,318,430 1,326,095 1,326,838 1,327,591
Increase In Capture 0.0% 0.0% 0.0% 0.0% 0.0% 0.0% 0.0% 0.0% 0.0% 0.0% 0.0%
Share Captured 85.0% 85.0% 85.0% 85.0% 85.0% 85.0% 85.0% 85.0% 85.0% 85.0% 85.0%
Rooms/Year 1,054,546 1,067,901 1,081,298 1,094,738 1,101,201 1,107,676 1,114,164 1,120,666 1,127,181 1,127,812 1,128,453
Local Rent $199 $199 $199 $199 $199 $199 $199 $199 $199 $199 $199
Room Revenue $209,854,651 $212,512,303 $215,178,354 $217,852,874 $219,138,910 $220,427,501 $221,718,678 $223,012,476 $224,308,925 $224,434,658 $224,562,055
TOT 10% $20,985,465 $21,251,230 $21,517,835 $21,785,287 $21,913,891 $22,042,750 $22,171,868 $22,301,248 $22,430,893 $22,443,466 $22,456,205
Share of CV Rooms 41.4% 41.9% 42.4% 42.9% 43.2% 43.4% 43.7% 43.9% 44.2% 44.2% 44.3%
Share CV Captured 1, 2, 2A 35.2% 35.6% 36.0% 36.5% 36.7% 36.9% 37.1% 37.4% 37.6% 37.6% 37.6%
Rooms Possible 3,399 3,442 3,485 3,529 3,549 3,570 3,591 3,612 3,633 3,635 3,637
Rooms Needed 1, 2, 2A 2,889 2,926 2,962 2,999 3,017 3,035 3,053 3,070 3,088 3,090 3,092
Page 109 of 332

Salton Sea Project TOT & Sales Tax Estimates 4
Opportunity Areas 3-6
In Imperial County, the determination of the TOT from the Salton Sea project’s Salton Sea Lake-South was estimated as follows:
1. Total Visitor Days were calculated from the modeling of potential lake tourists from 2022-2062 for the full Imperial County. Again, no rooms were assumed to be rented in Opportunity Areas 3-6 area from 2017-2024 on the assumption that entrepreneurs will be skeptical of investing in hotel/ motel facilities until they believe the clean recreational sea will be created. It will then take from 2022-2024 years to get facilities ready. This is assumed given the number of times a solution to the Salton Sea’s issues has been discussed and gone nowhere.
2. These were divided by 3.0 Average Visitors in a party to calculated the number of Hotel Rooms.
3. The Captured Share from the Imperial County market by Opportunity Areas 3-6 was started at 10% in 2024and increased in four year periods by 4%, 5%, 6%, 7%, 8% as market penetration of Imperial County grows to a maximum of 85%.
4. Those Capture Rates were multiplied by the Hotel Rooms to determine the number captured per year by Opportunity Areas 3-6.
5. The Room Rate was started at $65 and increasing $3 per year to a $135 maximum.
6. Each year, the Room Rate times the number of Captured Rooms = Total Room Revenue.
7. 8% Transient Occupancy Tax times Total Room Revenue = Estimate TOT Revenue.
8. Estimates showed the Number of Rooms needed if Opportunity Areas 3-6 handled their full market.
9. That was compared to the Number of Rooms at the Opportunity Areas 3-6 capture rates.
The result shows the number of rooms captured, revenue and TOT in Opportunity Areas 3-6 as follows:
20 of a possible 198 in 2024; Room Revenue of $470,752; TOT of $37,603
1,246 of a possible 1,466 in 2062; Room Revenue of $59,111,452; TOT of $4,728,916
Grand Total TOT from all six Opportunity Areas varies as follows:
$177,506 in 2024
$27,185122 in 2062
$564,162,485 Total from 2022-2062
Extending the 2062 TOT figure of $27,185122 annually through 2074 for fiscal year 2074-2075, assuming no changes in the population or capture rates after 2062, the Total TOT for a full 50 year period would be $920,383,945.
Page 110 of 332

Salton Sea Project TOT & Sales Tax Estimates 5
Exhibit 2.-Estimates of Transient Occupancy Tax, Opportunity Areas 3-6, 2022-2031 Year 2022 2023 2024 2025 2026 2027 2028 2029 2030 2031
Visitors Days 166,127 190,982 216,942 244,204 273,015 303,688 336,619 372,305 397,831 436,367
Parties/Rooms 55,376 63,661 72,314 81,401 91,005 101,229 112,206 124,102 132,610 145,456
Increase In Capture 0.0% 0.0% 10.0% 4.0% 4.0% 4.0% 4.0% 5.0% 5.0% 5.0%
Share Captured 0.0% 0.0% 10.0% 14.0% 18.0% 22.0% 26.0% 31.0% 36.0% 41.0%
Rooms/Year 0 0 7,231 11,396 16,381 22,270 29,174 38,472 47,740 59,637
Local Rent $65 $65 $65 $65 $68 $71 $74 $77 $80 $83
Room Revenue $0 $0 $470,041 $740,752 $1,113,902 $1,581,204 $2,158,848 $2,962,310 $3,819,174 $4,949,852
TOT 8% $0 $0 $37,603 $59,260 $89,112 $126,496 $172,708 $236,985 $305,534 $395,988
Rooms Possible 152 174 198 223 249 277 307 340 363 399
Rooms Needed Areas 3-6 0 0 20 31 45 61 80 105 131 163
Exhibits 1 2.-Grand Total Transient Occupancy Tax, All Opportunity Areas, 2022-2031 Year 2022 2023 2024 2025 2026 2027 2028 2029 2030 2031
GRAND TOTAL TOT $0 $0 $177,506 $285,964 $440,549 $640,562 $896,206 $1,294,359 $1,692,677 $2,176,496
Exhibit 2.-Estimates of Transient Occupancy Tax, Opportunity Areas 3-6, 2032-2041 Year 2032 2033 2034 2035 2036 2037 2038 2039 2040 2041
Visitors Days 475,447 515,077 555,264 596,013 637,330 679,221 721,694 764,753 808,405 850,799
Parties/Rooms 158,482 171,692 185,088 198,671 212,443 226,407 240,565 254,918 269,468 283,600
Increase In Capture 5.0% 6.0% 6.0% 6.0% 6.0% 7.0% 7.0% 7.0% 1.0% 0.0%
Share Captured 46.0% 52.0% 58.0% 64.0% 70.0% 77.0% 84.0% 84.0% 85.0% 85.0%
Rooms/Year 72,902 89,280 107,351 127,149 148,710 174,333 202,074 214,131 229,048 241,060
Local Rent $86 $89 $92 $95 $98 $101 $104 $107 $110 $113
Room Revenue $6,269,560 $7,945,927 $9,876,295 $12,079,192 $14,573,609 $17,607,683 $21,015,718 $22,911,993 $25,195,295 $27,239,763
TOT 8% $501,565 $635,674 $790,104 $966,335 $1,165,889 $1,408,615 $1,681,257 $1,832,959 $2,015,624 $2,179,181
Rooms Possible 434 470 507 544 582 620 659 698 738 777
Rooms Needed Areas 3-6 200 245 294 348 407 478 554 587 628 660
Exhibits 1 2.-Grand Total Transient Occupancy Tax, All Opportunity Areas, 2032-2041
Year 2032 2033 2034 2035 2036 2037 2038 2039 2040 2041
GRAND TOTAL TOT $2,734,116 $3,481,290 $4,334,555 $5,298,816 $6,380,443 $7,744,771 $9,268,832 $10,809,302 $12,506,896 $14,505,827
Page 111 of 332

Salton Sea Project TOT & Sales Tax Estimates 6
Exhibit 2.-Estimates of Transient Occupancy Tax, Opportunity Areas 3-6, 2042-2051 Year 2042 2043 2044 2045 2046 2047 2048 2049 2050 2051
Visitors Days 893,612 936,846 980,504 1,024,590 1,069,102 1,114,049 1,159,433 1,205,258 1,251,527 1,296,226
Parties/Rooms 297,871 312,282 326,835 341,530 356,367 371,350 386,478 401,753 417,176 432,075
Increase In Capture 0.0% 0.0% 0.0% 0.0% 0.0% 0.0% 0.0% 0.0% 0.0% 0.0%
Share Captured 85.0% 85.0% 85.0% 85.0% 85.0% 85.0% 85.0% 85.0% 85.0% 85.0%
Rooms/Year 253,190 265,440 277,809 290,300 302,912 315,647 328,506 341,490 354,599 367,264
Local Rent $116 $119 $122 $125 $128 $130 $130 $130 $130 $130
Room Revenue $29,370,043 $31,587,308 $33,892,744 $36,287,549 $38,772,764 $41,034,120 $42,705,767 $44,393,652 $46,097,899 $47,744,319
TOT 8% $2,349,603 $2,526,985 $2,711,420 $2,903,004 $3,101,821 $3,282,730 $3,416,461 $3,551,492 $3,687,832 $3,819,546
Rooms Possible 816 856 895 936 976 1,017 1,059 1,101 1,143 1,184
Rooms Needed Areas 3-6 694 727 761 795 830 865 900 936 972 1,006
Exhibits 1 2.-Grand Total Transient Occupancy Tax, All Opportunity Areas, 2042-2051 Year 2042 2043 2044 2045 2046 2047 2048 2049 2050 2051
GRAND TOTAL TOT $16,687,344 $18,742,512 $21,302,303 $21,813,093 $22,318,343 $22,807,091 $23,250,080 $23,695,796 $24,144,260 $24,540,079
Exhibit 2.-Estimates of Transient Occupancy Tax, Opportunity Areas 3-6, 2052-2062 Year 2052 2053 2054 2055 2056 2057 2058 2059 2060 2061 2062
Visitors Days 1,341,234 1,386,551 1,432,181 1,478,124 1,501,834 1,525,642 1,549,548 1,573,553 1,597,657 1,601,243 1,604,836
Parties/Rooms 447,078 462,184 477,394 492,708 500,611 508,547 516,516 524,518 532,552 533,748 534,945
Increase In Capture 0.0% 0.0% 0.0% 0.0% 0.0% 0.0% 0.0% 0.0% 0.0% 0.0% 0.0%
Share Captured 85.0% 85.0% 85.0% 85.0% 85.0% 85.0% 85.0% 85.0% 85.0% 85.0% 85.0%
Rooms/Year 380,016 392,856 405,785 418,802 425,520 432,265 439,039 445,840 452,670 453,685 454,703
Local Rent $130 $130 $130 $130 $130 $130 $130 $130 $130 $130 $130
Room Revenue $49,402,101 $51,071,306 $52,751,993 $54,444,226 $55,317,540 $56,194,467 $57,075,020 $57,959,210 $58,847,049 $58,979,102 $59,111,452
TOT 8% $3,952,168 $4,085,704 $4,220,159 $4,355,538 $4,425,403 $4,495,557 $4,566,002 $4,636,737 $4,707,764 $4,718,328 $4,728,916
Rooms Possible 1,225 1,266 1,308 1,350 1,372 1,393 1,415 1,437 1,459 1,462 1,466
Rooms Needed Areas 3-6 1,041 1,076 1,112 1,147 1,166 1,184 1,203 1,221 1,240 1,243 1,246
Exhibits 2.-Grand Total Transient Occupancy Tax, All Opportunity Areas, 2052-2062 Year 2052 2053 2054 2055 2056 2057 2058 2059 2060 2061 2062
GRAND TOTAL TOT $24,937,633 $25,336,935 $25,737,995 $26,140,825 $26,339,294 $26,538,307 $26,737,869 $26,937,984 $27,138,656 $27,161,794 $27,185,122
Page 112 of 332

Salton Sea Project TOT & Sales Tax Estimates 7
To determine the basis for the Sales Tax collections within the Opportunity Areas adjacent to the Salton Sea to the north and the south the following procedures were used:
Opportunity Areas 1, 2, 2A Sales Taxes
In the areas adjacent to the Coachella Valley, the Sales Taxes in Opportunity Areas 1, 2, 2A from the Salton Sea Lake-North were estimated as follows:
1. The retail sales potential for the total Coachella Valley area from the project were taken from the earlier modeling. No sales were assumed to be captured in Opportunity Areas 1, 2, 2A before the Salton Sea Lake-North clean-up is complete on the assumption that developers will be skeptical about the project coming to fruition.
2. Hotel revenue was omitted from retail sales determination as it is assumed that sector will be covered by TOT.
3. Casino sales taxes are assumed at zero as that is on Torres-Martinez Tribal lands. It will be a tribal decision if and how to participate in the project.
4. Capture rates begin in 2022 for sectors not related to the hotel sector. These include food, beverage and dining (5%); boat related (25%); general spending (5%); shopping, gifts and souvenirs (5%); gasoline (5%); groceries (5%). These are assumed to grow by adding the rates in column 1. Most reach maximums at 85%. The exceptions are growing to 100% for boat related and 90% for Gasoline. The increase in capture rates are different because sales in some sectors will be more likely to be satisfied longer in the balance of the Coachella Valley.
6. Entertainment, Transportation, Amenities and Parking are assumed to grow as the hotel sector increases. The capture rates for these sectors were calculated at the rate of increase of hotel room expansion in the TOT calculations for Opportunity Areas 1, 2, 2A.
7. Once Grocery sales are calculated, they were reduced to 0% of the captured sales even though most but not all grocery store items are non-taxable.
8. Secondary sales capture was determined as the amount of sales captured each year, less boat sales divided by the potential sales at 100%. This was done since the boat item is particular to the lake.
9. The total sales capture each year were multiplied by the 1.0% sales tax rate applicable to local government to determine the incremental sales tax created by the project.
The result shows the Sales captured, and Sales Tax Revenue in Opportunity Areas 1, 2, 2A vary as follows:
$13.9 million of a possible $240.6 million in Sales in 2022; Sales Taxes of $139,190
$1.099 billion of a possible $1.567 billion in Sales in 2062; Sales Taxes of $10,956,953
Page 113 of 332

Salton Sea Project TOT & Sales Tax Estimates 8
Exhibit 3A.-Total Sales, Opportunity Areas 1, 2, 2A, 2022-2031 Year 2022 2023 2024 2025 2026 2027 2028 2029 2030 2031
Food/Beverage/Dining $32,715,393 $38,948,159 $45,606,029 $52,787,081 $60,615,149 $69,246,630 $78,879,095 $89,762,167 $95,197,045 $101,471,369
Boat Costs $27,976,154 $32,256,586 $36,586,886 $40,967,630 $45,399,403 $49,882,798 $54,418,415 $59,006,862 $63,648,758 $69,032,063
Other-Total dollar amount spent $27,063,564 $32,219,573 $37,727,247 $43,667,718 $50,143,429 $57,283,757 $65,252,141 $74,255,082 $78,751,044 $83,941,432
Shopping/Gifts/Souvenirs $15,325,151 $18,244,818 $21,363,622 $24,727,503 $28,394,472 $32,437,790 $36,950,008 $42,048,058 $44,593,964 $47,533,100
Gasoline $14,586,066 $17,364,927 $20,333,319 $23,534,971 $27,025,093 $30,873,414 $35,168,022 $40,020,209 $42,443,334 $45,240,723
Casino / Gaming $13,542,651 $16,122,726 $18,878,775 $21,851,396 $25,091,852 $28,664,884 $32,652,276 $37,157,362 $39,407,149 $42,004,427
Groceries $8,390,792 $9,989,362 $11,696,962 $13,538,746 $15,546,477 $17,760,265 $20,230,784 $23,022,058 $24,415,986 $26,025,215
Entertainment, Not gaming $6,586,554 $7,841,390 $9,181,812 $10,627,565 $12,203,581 $13,941,348 $15,880,642 $18,071,719 $19,165,917 $20,429,119
Transportation, not parking/tolls $4,760,579 $5,667,539 $6,636,359 $7,681,309 $8,820,410 $10,076,420 $11,478,088 $13,061,737 $13,852,593 $14,765,601
Amenities (spa, tips, etc.) $4,282,347 $5,098,198 $5,969,693 $6,909,671 $7,934,342 $9,064,177 $10,325,038 $11,749,599 $12,461,009 $13,282,299
Parking/Tolls $565,183 $672,859 $787,878 $911,936 $1,047,172 $1,196,287 $1,362,695 $1,550,709 $1,644,600 $1,752,994
Total trip expenditures $155,794,434 $184,426,136 $214,768,581 $247,205,528 $282,221,380 $320,427,771 $362,597,203 $409,705,563 $435,581,398 $465,478,342
Secondary Sector Impact $84,784,307 $100,480,530 $117,142,022 $134,986,730 $154,289,774 $175,398,561 $198,751,885 $224,904,088 $238,986,499 $255,254,648
Total Impact $240,578,741 $284,906,666 $331,910,602 $382,192,258 $436,511,154 $495,826,332 $561,349,088 $634,609,651 $674,567,897 $720,732,990
Exhibit 3B.-Sales Capture Rates, Opportunity Areas 1, 2, 2A, 2022-2031 Year Factor 2022 2023 2024 2025 2026 2027 2028 2029 2030 2031
Food/Beverage/Dining 5.0% 5.0% 10.0% 15.0% 20.0% 25.0% 30.0% 35.0% 40.0% 45.0% 50.0%
Boat Costs 25.0% 25.0% 50.0% 75.0% 100.0% 100.0% 100.0% 100.0% 100.0% 100.0% 100.0%
Other-Total dollar amount spent 5.0% 5.0% 10.0% 15.0% 20.0% 25.0% 30.0% 35.0% 40.0% 45.0% 50.0%
Shopping/Gifts/Souvenirs 5.0% 5.0% 10.0% 15.0% 20.0% 25.0% 30.0% 35.0% 40.0% 45.0% 50.0%
Gasoline 7.5% 5.0% 12.5% 20.0% 27.5% 35.0% 42.5% 50.0% 57.5% 65.0% 72.5%
Casino / Gaming 0.0% 0.0% 0.0% 0.0% 0.0% 0.0% 0.0% 0.0% 0.0% 0.0% 0.0%
Groceries 5.0% 5.0% 10.0% 15.0% 20.0% 25.0% 30.0% 35.0% 40.0% 45.0% 50.0%
Entertainment, not gaming Hotel 0.0% 0.0% 5.0% 7.0% 9.0% 11.0% 13.0% 16.0% 19.0% 22.0%
Transportation, not parking/tolls Hotel 0.0% 0.0% 5.0% 7.0% 9.0% 11.0% 13.0% 16.0% 19.0% 22.0%
Amenities (spa, tips, etc.) Hotel 0.0% 0.0% 5.0% 7.0% 9.0% 11.0% 13.0% 16.0% 19.0% 22.0%
Parking/Tolls Hotel 0.0% 0.0% 5.0% 7.0% 9.0% 11.0% 13.0% 16.0% 19.0% 22.0%
Secondary Sector Impact Formula 2.9% 6.0% 9.6% 13.0% 16.5% 19.9% 23.5% 27.2% 30.6% 34.1%
Page 114 of 332

Salton Sea Project TOT & Sales Tax Estimates 9
Exhibit 3C.-Captured Sales & Sales Taxes, Opportunity Areas 1, 2, 2A, 2022-2031
Year 2022 2023 2024 2025 2026 2027 2028 2029 2030 2031
Food/Beverage/Dining $1,635,770 $3,894,816 $6,840,904 $10,557,416 $15,153,787 $20,773,989 $27,607,683 $35,904,867 $42,838,670 $50,735,685
Costs $6,994,039 $16,128,293 $27,440,165 $40,967,630 $45,399,403 $49,882,798 $54,418,415 $59,006,862 $63,648,758 $69,032,063
Other-Total dollar amount spent $1,353,178 $3,221,957 $5,659,087 $8,733,544 $12,535,857 $17,185,127 $22,838,249 $29,702,033 $35,437,970 $41,970,716
Shopping/Gifts/Souvenirs $766,258 $1,824,482 $3,204,543 $4,945,501 $7,098,618 $9,731,337 $12,932,503 $16,819,223 $20,067,284 $23,766,550
Gasoline $729,303 $2,170,616 $4,066,664 $6,472,117 $9,458,783 $13,121,201 $17,584,011 $23,011,620 $27,588,167 $32,799,524
Casino / Gaming $0 $0 $0 $0 $0 $0 $0 $0 $0 $0
Groceries $0 $0 $0 $0 $0 $0 $0 $0 $0 $0
Entertainment, Not gaming $0 $0 $459,091 $743,930 $1,098,322 $1,533,548 $2,064,483 $2,891,475 $3,641,524 $4,494,406
Transportation, not parking/tolls $0 $0 $331,818 $537,692 $793,837 $1,108,406 $1,492,151 $2,089,878 $2,631,993 $3,248,432
Amenities (spa, tips, etc.) $0 $0 $298,485 $483,677 $714,091 $997,059 $1,342,255 $1,879,936 $2,367,592 $2,922,106
Parking/Tolls $0 $0 $39,394 $63,836 $94,245 $131,592 $177,150 $248,113 $312,474 $385,659
Total trip expenditures $11,478,547 $27,240,164 $48,340,150 $73,505,341 $92,346,944 $114,465,058 $140,456,901 $171,554,008 $198,534,431 $229,355,140
Secondary Sector Impact $2,440,498 $6,054,059 $11,399,556 $17,767,237 $25,666,111 $35,351,603 $47,160,627 $61,781,717 $74,006,500 $87,916,466
Total Impact $13,919,045 $33,294,223 $59,739,706 $91,272,579 $118,013,055 $149,816,661 $187,617,527 $233,335,725 $272,540,931 $317,271,606
Sales Tax @ 1.0% $139,190 $332,942 $597,397 $912,726 $1,180,131 $1,498,167 $1,876,175 $2,333,357 $2,725,409 $3,172,716
Page 115 of 332

Salton Sea Project TOT & Sales Tax Estimates 10
Exhibit 3A.-Total Sales, Opportunity Areas 1, 2, 2A, 2032-2041 Year 2032 2033 2034 2035 2036 2037 2038 2039 2040 2041
Food/Beverage/Dining $107,818,549 $114,239,439 $120,734,908 $127,235,824 $133,741,899 $140,318,157 $146,965,260 $153,683,874 $160,186,581 $166,595,580
Costs $74,478,312 $79,988,247 $85,562,618 $91,140,225 $96,748,008 $102,416,910 $108,147,510 $113,940,390 $119,541,175 $125,117,369
Other-Total dollar amount spent $89,192,088 $94,503,722 $99,877,050 $105,254,884 $110,636,986 $116,077,147 $121,575,913 $127,133,836 $132,513,152 $137,814,948
Shopping/Gifts/Souvenirs $50,506,363 $53,514,156 $56,556,884 $59,602,163 $62,649,860 $65,730,433 $68,844,191 $71,991,449 $75,037,568 $78,039,790
Gasoline $48,070,595 $50,933,331 $53,829,318 $56,727,733 $59,628,448 $62,560,454 $65,524,046 $68,519,521 $71,418,735 $74,276,169
Casino / Gaming $44,631,864 $47,289,814 $49,978,636 $52,669,713 $55,362,926 $58,085,191 $60,836,782 $63,617,976 $66,309,794 $68,962,822
Groceries $27,653,129 $29,299,949 $30,965,897 $32,633,241 $34,301,909 $35,988,577 $37,693,415 $39,416,595 $41,084,399 $42,728,169
Entertainment, Not gaming $21,706,990 $22,999,701 $24,307,427 $25,616,249 $26,926,110 $28,250,101 $29,588,355 $30,941,006 $32,250,189 $33,540,505
Transportation, not parking/tolls $15,689,211 $16,623,546 $17,568,734 $18,514,715 $19,461,446 $20,418,390 $21,385,642 $22,363,301 $23,309,542 $24,242,148
Amenities (spa, tips, etc.) $14,113,126 $14,953,601 $15,803,838 $16,654,789 $17,506,415 $18,367,227 $19,237,313 $20,116,760 $20,967,944 $21,806,863
Parking/Tolls $1,862,646 $1,973,572 $2,085,786 $2,198,094 $2,310,491 $2,424,101 $2,538,935 $2,655,004 $2,767,343 $2,878,063
Total trip expenditures $495,722,874 $526,319,078 $557,271,095 $588,247,630 $619,274,497 $650,636,687 $682,337,362 $714,379,710 $745,386,422 $776,002,426
Secondary Sector Impact $271,711,886 $288,360,436 $305,202,548 $322,058,158 $338,938,344 $356,000,895 $373,247,529 $390,679,981 $407,549,648 $424,200,621
Total Impact $767,434,761 $814,679,514 $862,473,643 $910,305,787 $958,212,842 $1,006,637,582 $1,055,584,891 $1,105,059,691 $1,152,936,070 $1,200,203,047
Exhibit 3B.-Sales Capture Rates, Opportunity Areas 1, 2, 2A, 2032-2041 Year Factor 2032 2033 2034 2035 2036 2037 2038 2039 2040 2041
Food/Beverage/Dining 5.0% 55.0% 60.0% 65.0% 70.0% 75.0% 80.0% 85.0% 85.0% 85.0% 85.0%
Costs 25.0% 100.0% 100.0% 100.0% 100.0% 100.0% 100.0% 100.0% 100.0% 100.0% 100.0%
Other-Total dollar amount spent 5.0% 55.0% 60.0% 65.0% 70.0% 75.0% 80.0% 85.0% 85.0% 85.0% 85.0%
Shopping/Gifts/Souvenirs 5.0% 55.0% 60.0% 65.0% 70.0% 75.0% 80.0% 85.0% 85.0% 85.0% 85.0%
Gasoline 7.5% 80.0% 87.5% 90.0% 90.0% 90.0% 90.0% 90.0% 90.0% 90.0% 90.0%
Casino / Gaming 0.0% 0.0% 0.0% 0.0% 0.0% 0.0% 0.0% 0.0% 0.0% 0.0% 0.0%
Groceries 5.0% 55.0% 60.0% 65.0% 70.0% 75.0% 80.0% 85.0% 85.0% 85.0% 85.0%
Entertainment, not gaming Hotel 25.0% 29.0% 33.0% 37.0% 41.0% 46.0% 51.0% 56.0% 61.0% 67.0%
Transportation, not parking/tolls Hotel 25.0% 29.0% 33.0% 37.0% 41.0% 46.0% 51.0% 56.0% 61.0% 67.0%
Amenities (spa, tips, etc.) Hotel 25.0% 29.0% 33.0% 37.0% 41.0% 46.0% 51.0% 56.0% 61.0% 67.0%
Parking/Tolls Hotel 25.0% 29.0% 33.0% 37.0% 41.0% 46.0% 51.0% 56.0% 61.0% 67.0%
Secondary Sector Impact Formula 37.5% 41.0% 44.1% 47.0% 49.8% 52.8% 55.7% 56.2% 56.7% 57.2%
Page 116 of 332

Salton Sea Project TOT & Sales Tax Estimates 11
Exhibit 3C.-Captured Sales & Sales Taxes, Opportunity Areas 1, 2, 2A, 2032-2041
Year 2032 2033 2034 2035 2036 2037 2038 2039 2040 2041
Food/Beverage/Dining $59,300,202 $68,543,663 $78,477,690 $89,065,077 $100,306,424 $112,254,526 $124,920,471 $130,631,293 $136,158,594 $141,606,243
Costs $74,478,312 $79,988,247 $85,562,618 $91,140,225 $96,748,008 $102,416,910 $108,147,510 $113,940,390 $119,541,175 $125,117,369
Other-Total dollar amount spent $49,055,649 $56,702,233 $64,920,083 $73,678,419 $82,977,740 $92,861,717 $103,339,526 $108,063,760 $112,636,179 $117,142,706
Shopping/Gifts/Souvenirs $27,778,500 $32,108,494 $36,761,974 $41,721,514 $46,987,395 $52,584,346 $58,517,563 $61,192,732 $63,781,933 $66,333,821
Gasoline $38,456,476 $44,566,665 $48,446,386 $51,054,959 $53,665,603 $56,304,409 $58,971,641 $61,667,569 $64,276,861 $66,848,552
Casino / Gaming $0 $0 $0 $0 $0 $0 $0 $0 $0 $0
Groceries $0 $0 $0 $0 $0 $0 $0 $0 $0 $0
Entertainment, Not gaming $5,426,748 $6,669,913 $8,021,451 $9,478,012 $11,039,705 $12,995,046 $15,090,061 $17,326,963 $19,672,615 $22,472,139
Transportation, not parking/tolls $3,922,303 $4,820,828 $5,797,682 $6,850,444 $7,979,193 $9,392,459 $10,906,678 $12,523,449 $14,218,821 $16,242,239
Amenities (spa, tips, etc.) $3,528,281 $4,336,544 $5,215,267 $6,162,272 $7,177,630 $8,448,925 $9,811,030 $11,265,385 $12,790,446 $14,610,598
Parking/Tolls $465,662 $572,336 $688,309 $813,295 $947,301 $1,115,086 $1,294,857 $1,486,802 $1,688,079 $1,928,302
Total trip expenditures $262,412,132 $298,308,924 $333,891,460 $369,964,217 $407,828,999 $448,373,425 $490,999,335 $518,098,343 $544,764,703 $572,301,970
Secondary Sector Impact $103,008,869 $119,613,839 $136,003,098 $152,652,619 $170,259,354 $189,292,782 $209,424,994 $221,025,904 $232,496,453 $244,452,825
Total Impact $365,421,001 $417,922,762 $469,894,558 $522,616,837 $578,088,354 $637,666,207 $700,424,329 $739,124,247 $777,261,156 $816,754,795
Sales Tax @ 1.0% $3,654,210 $4,179,228 $4,698,946 $5,226,168 $5,780,884 $6,376,662 $7,004,243 $7,391,242 $7,772,612 $8,167,548
Page 117 of 332

Salton Sea Project TOT & Sales Tax Estimates 12
Exhibit 3A.-Total Sales, Opportunity Areas 1, 2, 2A, 2042-2051 Year 2042 2043 2044 2045 2046 2047 2048 2049 2050 2051
Food/Beverage/Dining $173,042,183 $176,082,520 $179,140,545 $182,216,391 $185,169,157 $188,135,479 $191,115,460 $194,109,202 $197,116,809 $199,661,712
Costs $130,726,286 $133,320,042 $135,928,887 $138,552,937 $141,087,260 $143,633,140 $146,190,663 $148,759,918 $151,340,993 $153,536,517
Other-Total dollar amount spent $143,147,853 $145,662,949 $148,192,677 $150,737,147 $153,179,801 $155,633,669 $158,098,836 $160,575,386 $163,063,407 $165,168,659
Shopping/Gifts/Souvenirs $81,059,627 $82,483,838 $83,916,335 $85,357,180 $86,740,369 $88,129,909 $89,525,847 $90,928,231 $92,337,110 $93,529,241
Gasoline $77,150,369 $78,505,894 $79,869,306 $81,240,663 $82,557,146 $83,879,672 $85,208,288 $86,543,040 $87,883,973 $89,018,610
Casino / Gaming $71,631,415 $72,889,974 $74,155,853 $75,429,111 $76,651,418 $77,879,338 $79,112,911 $80,352,181 $81,597,191 $82,650,662
Groceries $44,381,583 $45,161,364 $45,945,681 $46,734,569 $47,491,890 $48,252,688 $49,016,988 $49,784,819 $50,556,205 $51,208,918
Entertainment, Not gaming $34,838,393 $35,450,501 $36,066,169 $36,685,426 $37,279,903 $37,877,110 $38,477,066 $39,079,793 $39,685,311 $40,197,674
Transportation, not parking/tolls $25,180,225 $25,622,639 $26,067,627 $26,515,209 $26,944,881 $27,376,525 $27,810,157 $28,245,791 $28,683,443 $29,053,764
Amenities (spa, tips, etc.) $22,650,704 $23,048,675 $23,448,962 $23,851,581 $24,238,089 $24,626,372 $25,016,442 $25,408,314 $25,802,001 $26,135,121
Parking/Tolls $2,989,433 $3,041,957 $3,094,787 $3,147,924 $3,198,936 $3,250,181 $3,301,662 $3,353,382 $3,405,340 $3,449,305
Total trip expenditures $806,798,072 $821,270,354 $835,826,830 $850,468,139 $864,538,849 $878,674,082 $892,874,321 $907,140,056 $921,471,781 $933,610,183
Secondary Sector Impact $440,949,294 $448,825,873 $456,748,274 $464,716,846 $472,373,198 $480,064,668 $487,791,518 $495,554,016 $503,352,430 $509,956,117
Total Impact $1,247,747,366 $1,270,096,226 $1,292,575,104 $1,315,184,985 $1,336,912,047 $1,358,738,749 $1,380,665,839 $1,402,694,072 $1,424,824,210 $1,443,566,300
Exhibit 3B.-Sales Capture Rates, Opportunity Areas 1, 2, 2A, 2042-2051 Year Factor 2042 2043 2044 2045 2046 2047 2048 2049 2050 2051
Food/Beverage/Dining 5.0% 85.0% 85.0% 85.0% 85.0% 85.0% 85.0% 85.0% 85.0% 85.0% 85.0%
Costs 25.0% 100.0% 100.0% 100.0% 100.0% 100.0% 100.0% 100.0% 100.0% 100.0% 100.0%
Other-Total dollar amount spent 5.0% 85.0% 85.0% 85.0% 85.0% 85.0% 85.0% 85.0% 85.0% 85.0% 85.0%
Shopping/Gifts/Souvenirs 5.0% 85.0% 85.0% 85.0% 85.0% 85.0% 85.0% 85.0% 85.0% 85.0% 85.0%
Gasoline 7.5% 90.0% 90.0% 90.0% 90.0% 90.0% 90.0% 90.0% 90.0% 90.0% 90.0%
Casino / Gaming 0.0% 0.0% 0.0% 0.0% 0.0% 0.0% 0.0% 0.0% 0.0% 0.0% 0.0%
Groceries 5.0% 85.0% 85.0% 85.0% 85.0% 85.0% 85.0% 85.0% 85.0% 85.0% 85.0%
Entertainment, not gaming Hotel 73.0% 79.0% 85.0% 85.0% 85.0% 85.0% 85.0% 85.0% 85.0% 85.0%
Transportation, not parking/tolls Hotel 73.0% 79.0% 85.0% 85.0% 85.0% 85.0% 85.0% 85.0% 85.0% 85.0%
Amenities (spa, tips, etc.) Hotel 73.0% 79.0% 85.0% 85.0% 85.0% 85.0% 85.0% 85.0% 85.0% 85.0%
Parking/Tolls Hotel 73.0% 79.0% 85.0% 85.0% 85.0% 85.0% 85.0% 85.0% 85.0% 85.0%
Secondary Sector Impact Formula 57.8% 58.4% 59.1% 59.0% 59.0% 59.0% 59.0% 59.0% 58.9% 58.9%
Page 118 of 332

Salton Sea Project TOT & Sales Tax Estimates 13
Exhibit 3C.-Captured Sales & Sales Taxes, Opportunity Areas 1, 2, 2A, 2042-2051
Year 2042 2043 2044 2045 2046 2047 2048 2049 2050 2051
Food/Beverage/Dining $147,085,856 $149,670,142 $152,269,463 $154,883,932 $157,393,783 $159,915,157 $162,448,141 $164,992,822 $167,549,287 $169,712,455
Costs $130,726,286 $133,320,042 $135,928,887 $138,552,937 $141,087,260 $143,633,140 $146,190,663 $148,759,918 $151,340,993 $153,536,517
Other-Total dollar amount spent $121,675,675 $123,813,506 $125,963,775 $128,126,575 $130,202,831 $132,288,618 $134,384,010 $136,489,078 $138,603,896 $140,393,360
Shopping/Gifts/Souvenirs $68,900,683 $70,111,263 $71,328,885 $72,553,603 $73,729,314 $74,910,423 $76,096,970 $77,288,996 $78,486,543 $79,499,854
Gasoline $69,435,332 $70,655,305 $71,882,375 $73,116,597 $74,301,431 $75,491,705 $76,687,459 $77,888,736 $79,095,575 $80,116,749
Casino / Gaming $0 $0 $0 $0 $0 $0 $0 $0 $0 $0
Groceries $0 $0 $0 $0 $0 $0 $0 $0 $0 $0
Entertainment, Not gaming $25,432,027 $28,005,896 $30,656,244 $31,182,612 $31,687,918 $32,195,543 $32,705,506 $33,217,824 $33,732,514 $34,168,023
Transportation, not parking/tolls $18,381,564 $20,241,885 $22,157,483 $22,537,928 $22,903,149 $23,270,046 $23,638,633 $24,008,922 $24,380,926 $24,695,699
Amenities (spa, tips, etc.) $16,535,014 $18,208,454 $19,931,617 $20,273,844 $20,602,376 $20,932,416 $21,263,976 $21,597,067 $21,931,701 $22,214,853
Parking/Tolls $2,182,286 $2,403,146 $2,630,569 $2,675,736 $2,719,095 $2,762,654 $2,806,413 $2,850,374 $2,894,539 $2,931,910
Total trip expenditures $600,354,723 $616,429,638 $632,749,299 $643,903,764 $654,627,156 $665,399,702 $676,221,772 $687,093,738 $698,015,975 $707,269,421
Secondary Sector Impact $256,671,818 $264,020,350 $271,493,876 $276,136,203 $280,591,767 $285,067,805 $289,564,470 $294,081,917 $298,620,301 $302,459,728
Total Impact $857,026,541 $880,449,988 $904,243,175 $920,039,967 $935,218,923 $950,467,507 $965,786,242 $981,175,654 $996,636,276 $1,009,729,148
Sales Tax @ 1.0% $8,570,265 $8,804,500 $9,042,432 $9,200,400 $9,352,189 $9,504,675 $9,657,862 $9,811,757 $9,966,363 $10,097,291
Page 119 of 332

Salton Sea Project TOT & Sales Tax Estimates 14
Exhibit 3A.-Total Sales, Opportunity Areas 1, 2, 2A, 2052-2062 Year 2052 2053 2054 2055 2056 2057 2058 2059 2060 2061 2062
Food/Beverage $202,214,580 $204,775,477 $207,344,467 $209,921,617 $211,160,834 $212,402,512 $213,646,683 $214,893,378 $216,142,629 $216,263,783 $216,386,542
Costs $155,738,774 $157,947,820 $160,163,708 $162,386,497 $163,451,521 $164,518,470 $165,587,368 $166,658,243 $167,731,122 $167,805,356 $167,880,749
Other t $167,280,500 $169,398,982 $171,524,161 $173,656,089 $174,681,222 $175,708,390 $176,737,621 $177,768,940 $178,802,374 $178,902,598 $179,004,150
Shopping/Gifts $94,725,102 $95,924,725 $97,128,139 $98,335,376 $98,915,872 $99,497,522 $100,080,340 $100,664,340 $101,249,537 $101,306,291 $101,363,796
Gasoline $90,156,799 $91,298,568 $92,443,945 $93,592,960 $94,145,462 $94,699,060 $95,253,770 $95,809,606 $96,366,581 $96,420,597 $96,475,329
Casino $83,707,431 $84,767,523 $85,830,966 $86,897,786 $87,410,764 $87,924,761 $88,439,790 $88,955,863 $89,472,995 $89,523,148 $89,573,964
Groceries $51,863,673 $52,520,488 $53,179,378 $53,840,362 $54,158,194 $54,476,658 $54,795,760 $55,115,511 $55,435,917 $55,466,990 $55,498,475
Entertainment $40,711,640 $41,227,222 $41,744,434 $42,263,289 $42,512,779 $42,762,765 $43,013,252 $43,264,248 $43,515,758 $43,540,150 $43,564,865
Transports $29,425,245 $29,797,893 $30,171,720 $30,546,734 $30,727,058 $30,907,741 $31,088,786 $31,270,199 $31,451,984 $31,469,614 $31,487,477
Amenities) $26,469,284 $26,804,498 $27,140,771 $27,478,112 $27,640,322 $27,802,854 $27,965,712 $28,128,901 $28,292,424 $28,308,283 $28,324,351
Parking/Tolls $3,493,408 $3,537,649 $3,582,031 $3,626,553 $3,647,961 $3,669,412 $3,690,906 $3,712,444 $3,734,025 $3,736,119 $3,738,239
Total trip s $945,786,435 $958,000,844 $970,253,720 $982,545,374 $988,451,989 $994,370,145 $1,000,299,989 $1,006,241,672 $1,012,195,345 $1,012,742,928 $1,013,297,938
Secondary t $516,580,412 $523,225,480 $529,891,490 $536,578,612 $539,792,447 $543,012,583 $546,239,099 $549,472,078 $552,711,601 $553,012,809 $553,318,081
Total Impact $1,462,366,847 $1,481,226,324 $1,500,145,210 $1,519,123,986 $1,528,244,437 $1,537,382,727 $1,546,539,088 $1,555,713,749 $1,564,906,946 $1,565,755,737 $1,566,616,019
Exhibit 3B.-Sales Capture Rates, Opportunity Areas 1, 2, 2A, 2052-2062 Year Factor 2052 2053 2054 2055 2056 2057 2058 2059 2060 2061 2062
Food/Beverage/Dining 5.0% 85.0% 85.0% 85.0% 85.0% 85.0% 85.0% 85.0% 85.0% 85.0% 85.0% 85.0%
Costs 25.0% 100.0% 100.0% 100.0% 100.0% 100.0% 100.0% 100.0% 100.0% 100.0% 100.0% 100.0%
Other-Total dollar amount spent 5.0% 85.0% 85.0% 85.0% 85.0% 85.0% 85.0% 85.0% 85.0% 85.0% 85.0% 85.0%
Shopping/Gifts/Souvenirs 5.0% 85.0% 85.0% 85.0% 85.0% 85.0% 85.0% 85.0% 85.0% 85.0% 85.0% 85.0%
Gasoline 7.5% 90.0% 90.0% 90.0% 90.0% 90.0% 90.0% 90.0% 90.0% 90.0% 90.0% 90.0%
Casino / Gaming 0.0% 0.0% 0.0% 0.0% 0.0% 0.0% 0.0% 0.0% 0.0% 0.0% 0.0% 0.0%
Groceries 5.0% 85.0% 85.0% 85.0% 85.0% 85.0% 85.0% 85.0% 85.0% 85.0% 85.0% 85.0%
Entertainment, not gaming Hotel 85.0% 85.0% 85.0% 85.0% 85.0% 85.0% 85.0% 85.0% 85.0% 85.0% 85.0%
Transportation, not parking/tolls Hotel 85.0% 85.0% 85.0% 85.0% 85.0% 85.0% 85.0% 85.0% 85.0% 85.0% 85.0%
Amenities (spa, tips, etc.) Hotel 85.0% 85.0% 85.0% 85.0% 85.0% 85.0% 85.0% 85.0% 85.0% 85.0% 85.0%
Parking/Tolls Hotel 85.0% 85.0% 85.0% 85.0% 85.0% 85.0% 85.0% 85.0% 85.0% 85.0% 85.0%
Secondary Sector Impact Formula 58.9% 58.9% 58.9% 58.9% 58.9% 58.9% 58.9% 58.8% 58.8% 58.8% 58.8%
Page 120 of 332

Salton Sea Project TOT & Sales Tax Estimates 15
Exhibit 3C.-Captured Sales & Sales Taxes, Opportunity Areas 1, 2, 2A, 2052-2062
Year 2052 2053 2054 2055 2056 2057 2058 2059 2060 2061 2062
Food/Beverage $171,882,393 $174,059,155 $176,242,797 $178,433,375 $179,486,709 $180,542,135 $181,599,680 $182,659,371 $183,721,234 $183,824,216 $183,928,561
Costs $155,738,774 $157,947,820 $160,163,708 $162,386,497 $163,451,521 $164,518,470 $165,587,368 $166,658,243 $167,731,122 $167,805,356 $167,880,749
Other t $142,188,425 $143,989,135 $145,795,537 $147,607,675 $148,479,038 $149,352,132 $150,226,978 $151,103,599 $151,982,018 $152,067,208 $152,153,527
Shopping/Gifts $80,516,337 $81,536,016 $82,558,918 $83,585,069 $84,078,492 $84,572,894 $85,068,289 $85,564,689 $86,062,106 $86,110,347 $86,159,226
Gasoline $81,141,119 $82,168,711 $83,199,551 $84,233,664 $84,730,915 $85,229,154 $85,728,393 $86,228,645 $86,729,922 $86,778,537 $86,827,796
Casino $0 $0 $0 $0 $0 $0 $0 $0 $0 $0 $0
Groceries $0 $0 $0 $0 $0 $0 $0 $0 $0 $0 $0
Entertainment $34,604,894 $35,043,139 $35,482,769 $35,923,796 $36,135,862 $36,348,350 $36,561,265 $36,774,611 $36,988,395 $37,009,128 $37,030,136
Transports $25,011,458 $25,328,209 $25,645,962 $25,964,724 $26,118,000 $26,271,580 $26,425,468 $26,579,669 $26,734,186 $26,749,172 $26,764,355
Amenities) $22,498,891 $22,783,823 $23,069,655 $23,356,395 $23,494,274 $23,632,426 $23,770,855 $23,909,565 $24,048,560 $24,062,040 $24,075,699
Parking/Tolls $2,969,397 $3,007,002 $3,044,726 $3,082,570 $3,100,767 $3,119,000 $3,137,270 $3,155,577 $3,173,922 $3,175,701 $3,177,503
Total trip s $716,551,688 $725,863,010 $735,203,623 $744,573,765 $749,075,578 $753,586,141 $758,105,567 $762,633,970 $767,171,465 $767,581,705 $767,997,553
Secondary t $306,311,187 $310,174,777 $314,050,594 $317,938,738 $319,808,596 $321,682,182 $323,559,543 $325,440,727 $327,325,782 $327,510,560 $327,697,774
Total Impact $1,022,862,875 $1,036,037,787 $1,049,254,217 $1,062,512,503 $1,068,884,174 $1,075,268,322 $1,081,665,109 $1,088,074,696 $1,094,497,247 $1,095,092,265 $1,095,695,326
Sales Tax @ 1.0% $10,228,629 $10,360,378 $10,492,542 $10,625,125 $10,688,842 $10,752,683 $10,816,651 $10,880,747 $10,944,972 $10,950,923 $10,956,953
Page 121 of 332

Salton Sea Project TOT & Sales Tax Estimates 16
Opportunity Areas 3-6 Sales Taxes
In the Imperial County Opportunity Areas 3-6 adjacent to the Salton Sea Lake-South, the Sales Taxes were estimated as follows:
1. The retail sales potential for the total of Imperial County from the project were taken from the earlier modeling. Again, no sales were assumed to be captured in Opportunity Areas 3-6 before the cleaned-up of Salton Sea Lake-South is completed on the assumption that developers will be skeptical about the project being completed.
2. Hotel revenue was omitted from retail sales determination as it is assumed that sector will be covered by TOT.
3. Capture rates begin in 2022 for sectors not related to the hotel sector. These include food, beverage and dining (5%); boat related (25%); general spending (5%); shopping, gifts and souvenirs (5%); gasoline (5%); groceries (5%). These are assumed each year by adding the rates in column 1. Most reach maximums at 85%. The exceptions are growing to 100% for boat related and 90% for Gasoline. The increase in capture rates are different since sales in some sectors will be more likely satisfied less long in the rest of Imperial County.
6. Entertainment, Transportation, Amenities and Parking are assumed to grow as the hotel sector increases. The capture rates for these sectors were calculated at the rate of increase of hotel room expansion in the TOT calculations for Opportunity Areas 3-6.
7. Once Grocery sales are calculated, they were reduced to just 0% of the captured sales even though most but not all grocery store items are non-taxable.
8. Secondary sales capture was determined as the amount of sales captured each year, less boat sales divided by the potential sales at 100%. This was done since the boat item is particular to the lake.
9. The total sales capture each year were multiplied by the 1.0% sales tax rate applicable to local government to determine the incremental sales tax created by the project.
The Sales captured and Sales Tax Revenue in Opportunity Areas 3-6 vary would be as follows:
$3.5 million of a possible $53.3 million in Sales in 2022; Sales Taxes of $34,565
$399.9 million of a possible $521.5 million in Sales in 2062; Sales Taxes of $3,999,390
Grand Total Sales captured and Sales Tax Revenue in All Opportunity Areas vary as follows:
$173,755 in 2022
$14,956,343 in 2062.
$374,625,345 total from 2022-2062
Using the $14,956,343 from 2062 out to 2074 for a 50 year forecasting period from FY 2025-2075, the total retail sales revenue would be $554,101,467.
This figure is reduced to $393,371,085 by eliminating $160,730,382 in sales taxes created by the secondary impact of funds flowing through the outlets in the study area (Exhibit 5).
Page 122 of 332

Salton Sea Project TOT & Sales Tax Estimates 17
Exhibit 4A.-Total Sales, Opportunity Areas3-6, 2022-2031 Year 2022 2023 2024 2025 2026 2027 2028 2029 2030 2031
Food/Beverage/Dining $8,226,379 $9,572,503 $11,007,638 $12,550,749 $14,225,805 $16,063,120 $18,101,052 $20,388,146 $21,660,861 $23,565,726
Boat Costs $7,097,838 $8,057,694 $9,034,423 $10,028,252 $11,039,412 $12,068,137 $13,114,661 $14,179,223 $15,262,065 $16,911,523
Other-Total dollar amount spent $6,805,211 $7,918,781 $9,105,986 $10,382,513 $11,768,191 $13,288,096 $14,973,960 $16,865,941 $17,918,785 $19,494,570
Shopping/Gifts/Souvenirs $3,639,467 $4,235,011 $4,869,935 $5,552,629 $6,293,698 $7,106,552 $8,008,162 $9,020,005 $9,583,072 $10,425,811
Gasoline $4,075,231 $4,742,082 $5,453,027 $6,217,462 $7,047,261 $7,957,441 $8,967,003 $10,099,997 $10,730,482 $11,674,125
Groceries $2,344,321 $2,727,934 $3,136,913 $3,576,662 $4,054,013 $4,577,604 $5,158,365 $5,810,132 $6,172,826 $6,715,666
Entertainment, Not gaming $1,564,196 $1,820,154 $2,093,036 $2,386,449 $2,704,951 $3,054,305 $3,441,806 $3,876,683 $4,118,682 $4,480,881
Transportation, not parking/tolls $1,130,558 $1,315,557 $1,512,788 $1,724,859 $1,955,064 $2,207,567 $2,487,642 $2,801,959 $2,976,869 $3,238,656
Amenities (spa, tips, etc.) $1,016,986 $1,183,400 $1,360,819 $1,551,586 $1,758,664 $1,985,803 $2,237,742 $2,520,484 $2,677,823 $2,913,312
Parking/Tolls $134,221 $156,185 $179,600 $204,778 $232,108 $262,086 $295,336 $332,653 $353,418 $384,498
Total trip expenditures $36,034,408 $41,729,300 $47,754,166 $54,175,940 $61,079,166 $68,570,711 $76,785,728 $85,895,223 $91,454,884 $99,804,768
Secondary Sector Impact $17,258,119 $19,994,469 $22,891,492 $25,981,953 $29,307,245 $32,919,690 $36,885,464 $41,288,298 $43,951,683 $47,950,470
Total Impact $53,292,527 $61,723,769 $70,645,658 $80,157,893 $90,386,411 $101,490,401 $113,671,192 $127,183,520 $135,406,567 $147,755,238
Exhibit 4B.-Sales Capture Rates, Opportunity Areas 3-6, 2022-2031 Year Factor 2022 2023 2024 2025 2026 2027 2028 2029 2030 2031
Food/Beverage/Dining 5.0% 5.0% 10.0% 15.0% 20.0% 25.0% 30.0% 35.0% 40.0% 45.0% 50.0%
Boat Costs 25.0% 25.0% 50.0% 75.0% 100.0% 100.0% 100.0% 100.0% 100.0% 100.0% 100.0%
Other-Total dollar amount spent 5.0% 5.0% 10.0% 15.0% 20.0% 25.0% 30.0% 35.0% 40.0% 45.0% 50.0%
Shopping/Gifts/Souvenirs 5.0% 5.0% 10.0% 15.0% 20.0% 25.0% 30.0% 35.0% 40.0% 45.0% 50.0%
Gasoline 7.5% 5.0% 12.5% 20.0% 27.5% 35.0% 42.5% 50.0% 57.5% 65.0% 72.5%
Groceries 5.0% 5.0% 10.0% 15.0% 20.0% 25.0% 30.0% 35.0% 40.0% 45.0% 50.0%
Entertainment, not gaming Hotel 0.0% 0.0% 10.0% 14.0% 18.0% 22.0% 26.0% 31.0% 36.0% 41.0%
Transportation, not parking/tolls Hotel 0.0% 0.0% 10.0% 14.0% 18.0% 22.0% 26.0% 31.0% 36.0% 41.0%
Amenities (spa, tips, etc.) Hotel 0.0% 0.0% 10.0% 14.0% 18.0% 22.0% 26.0% 31.0% 36.0% 41.0%
Parking/Tolls Hotel 0.0% 0.0% 10.0% 14.0% 18.0% 22.0% 26.0% 31.0% 36.0% 41.0%
Secondary Sector Impact Formula 3.2% 6.7% 11.3% 15.3% 19.3% 23.4% 27.5% 31.9% 36.0% 40.0%
Page 123 of 332

Salton Sea Project TOT & Sales Tax Estimates 18
Exhibit 4C.-Captured Sales & Sales Taxes, Opportunity Areas 3-6, 2022-2031
Year 2022 2023 2024 2025 2026 2027 2028 2029 2030 2031
Food/Beverage/Dining $411,319 $957,250 $1,651,146 $2,510,150 $3,556,451 $4,818,936 $6,335,368 $8,155,258 $9,747,388 $11,782,863
Costs $1,774,459 $4,028,847 $6,775,817 $10,028,252 $11,039,412 $12,068,137 $13,114,661 $14,179,223 $15,262,065 $16,911,523
Other-Total dollar amount spent $340,261 $791,878 $1,365,898 $2,076,503 $2,942,048 $3,986,429 $5,240,886 $6,746,377 $8,063,453 $9,747,285
Shopping/Gifts/Souvenirs $181,973 $423,501 $730,490 $1,110,526 $1,573,424 $2,131,966 $2,802,857 $3,608,002 $4,312,382 $5,212,906
Gasoline $203,762 $592,760 $1,090,605 $1,709,802 $2,466,541 $3,381,912 $4,483,502 $5,807,498 $6,974,813 $8,463,740
Groceries $0 $0 $0 $0 $0 $0 $0 $0 $0 $0
Entertainment, Not gaming $0 $0 $209,304 $334,103 $486,891 $671,947 $894,869 $1,201,772 $1,482,726 $1,837,161
Transportation, not parking/tolls $0 $0 $151,279 $241,480 $351,911 $485,665 $646,787 $868,607 $1,071,673 $1,327,849
Amenities (spa, tips, etc.) $0 $0 $136,082 $217,222 $316,560 $436,877 $581,813 $781,350 $964,016 $1,194,458
Parking/Tolls $0 $0 $17,960 $28,669 $41,779 $57,659 $76,787 $103,122 $127,231 $157,644
Total trip expenditures $2,911,774 $6,794,237 $12,128,581 $18,256,706 $22,775,018 $28,039,527 $34,177,529 $41,451,209 $48,005,747 $56,635,429
Secondary Sector Impact $544,699 $1,325,028 $2,565,907 $3,946,241 $5,631,025 $7,667,606 $10,117,944 $13,109,156 $15,736,064 $19,085,060
Total Impact $3,456,473 $8,119,265 $14,694,488 $22,202,947 $28,406,043 $35,707,133 $44,295,473 $54,560,365 $63,741,812 $75,720,489
Sales Tax @1.0% $34,565 $81,193 $146,945 $222,029 $284,060 $357,071 $442,955 $545,604 $637,418 $757,205
Exhibits 3-4.-Grand Total Sales Tax Revenue, All Opportunity Areas, 2022-2031 Year 2022 2023 2024 2025 2026 2027 2028 2029 2030 2031
GRAND TOTAL TOT $173,755 $414,135 $744,342 $1,134,755 $1,464,191 $1,855,238 $2,319,130 $2,878,961 $3,362,827 $3,929,921
Page 124 of 332
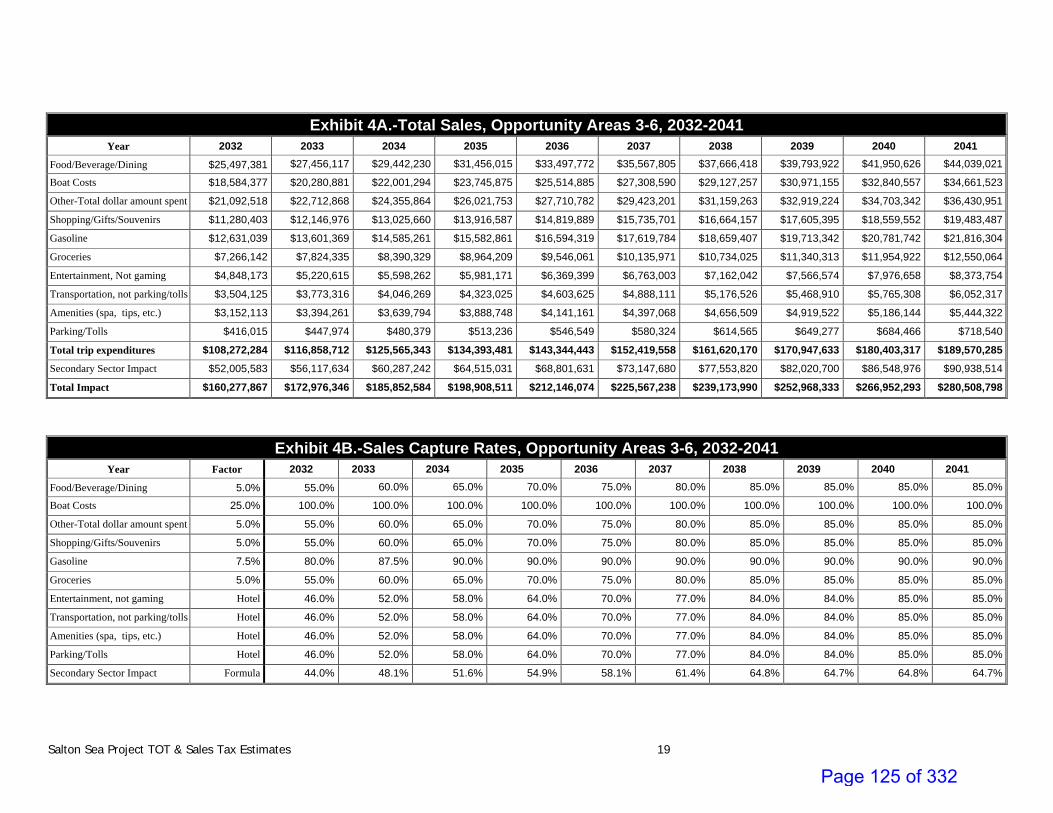
Salton Sea Project TOT & Sales Tax Estimates 19
Exhibit 4A.-Total Sales, Opportunity Areas 3-6, 2032-2041 Year 2032 2033 2034 2035 2036 2037 2038 2039 2040 2041
Food/Beverage/Dining $25,497,381 $27,456,117 $29,442,230 $31,456,015 $33,497,772 $35,567,805 $37,666,418 $39,793,922 $41,950,626 $44,039,021
Boat Costs $18,584,377 $20,280,881 $22,001,294 $23,745,875 $25,514,885 $27,308,590 $29,127,257 $30,971,155 $32,840,557 $34,661,523
Other-Total dollar amount spent $21,092,518 $22,712,868 $24,355,864 $26,021,753 $27,710,782 $29,423,201 $31,159,263 $32,919,224 $34,703,342 $36,430,951
Shopping/Gifts/Souvenirs $11,280,403 $12,146,976 $13,025,660 $13,916,587 $14,819,889 $15,735,701 $16,664,157 $17,605,395 $18,559,552 $19,483,487
Gasoline $12,631,039 $13,601,369 $14,585,261 $15,582,861 $16,594,319 $17,619,784 $18,659,407 $19,713,342 $20,781,742 $21,816,304
Groceries $7,266,142 $7,824,335 $8,390,329 $8,964,209 $9,546,061 $10,135,971 $10,734,025 $11,340,313 $11,954,922 $12,550,064
Entertainment, Not gaming $4,848,173 $5,220,615 $5,598,262 $5,981,171 $6,369,399 $6,763,003 $7,162,042 $7,566,574 $7,976,658 $8,373,754
Transportation, not parking/tolls $3,504,125 $3,773,316 $4,046,269 $4,323,025 $4,603,625 $4,888,111 $5,176,526 $5,468,910 $5,765,308 $6,052,317
Amenities (spa, tips, etc.) $3,152,113 $3,394,261 $3,639,794 $3,888,748 $4,141,161 $4,397,068 $4,656,509 $4,919,522 $5,186,144 $5,444,322
Parking/Tolls $416,015 $447,974 $480,379 $513,236 $546,549 $580,324 $614,565 $649,277 $684,466 $718,540
Total trip expenditures $108,272,284 $116,858,712 $125,565,343 $134,393,481 $143,344,443 $152,419,558 $161,620,170 $170,947,633 $180,403,317 $189,570,285
Secondary Sector Impact $52,005,583 $56,117,634 $60,287,242 $64,515,031 $68,801,631 $73,147,680 $77,553,820 $82,020,700 $86,548,976 $90,938,514
Total Impact $160,277,867 $172,976,346 $185,852,584 $198,908,511 $212,146,074 $225,567,238 $239,173,990 $252,968,333 $266,952,293 $280,508,798
Exhibit 4B.-Sales Capture Rates, Opportunity Areas 3-6, 2032-2041 Year Factor 2032 2033 2034 2035 2036 2037 2038 2039 2040 2041
Food/Beverage/Dining 5.0% 55.0% 60.0% 65.0% 70.0% 75.0% 80.0% 85.0% 85.0% 85.0% 85.0%
Boat Costs 25.0% 100.0% 100.0% 100.0% 100.0% 100.0% 100.0% 100.0% 100.0% 100.0% 100.0%
Other-Total dollar amount spent 5.0% 55.0% 60.0% 65.0% 70.0% 75.0% 80.0% 85.0% 85.0% 85.0% 85.0%
Shopping/Gifts/Souvenirs 5.0% 55.0% 60.0% 65.0% 70.0% 75.0% 80.0% 85.0% 85.0% 85.0% 85.0%
Gasoline 7.5% 80.0% 87.5% 90.0% 90.0% 90.0% 90.0% 90.0% 90.0% 90.0% 90.0%
Groceries 5.0% 55.0% 60.0% 65.0% 70.0% 75.0% 80.0% 85.0% 85.0% 85.0% 85.0%
Entertainment, not gaming Hotel 46.0% 52.0% 58.0% 64.0% 70.0% 77.0% 84.0% 84.0% 85.0% 85.0%
Transportation, not parking/tolls Hotel 46.0% 52.0% 58.0% 64.0% 70.0% 77.0% 84.0% 84.0% 85.0% 85.0%
Amenities (spa, tips, etc.) Hotel 46.0% 52.0% 58.0% 64.0% 70.0% 77.0% 84.0% 84.0% 85.0% 85.0%
Parking/Tolls Hotel 46.0% 52.0% 58.0% 64.0% 70.0% 77.0% 84.0% 84.0% 85.0% 85.0%
Secondary Sector Impact Formula 44.0% 48.1% 51.6% 54.9% 58.1% 61.4% 64.8% 64.7% 64.8% 64.7%
Page 125 of 332

Salton Sea Project TOT & Sales Tax Estimates 20
Exhibit 4C.-Captured Sales & Sales Taxes, Opportunity Areas 3-6, 2032-2041
Year 2032 2033 2034 2035 2036 2037 2038 2039 2040 2041
Food/Beverage/Dining $14,023,559 $16,473,670 $19,137,449 $22,019,210 $25,123,329 $28,454,244 $32,016,456 $33,824,833 $35,658,032 $37,433,168
Boat Costs $18,584,377 $20,280,881 $22,001,294 $23,745,875 $25,514,885 $27,308,590 $29,127,257 $30,971,155 $32,840,557 $34,661,523
Other-Total dollar amount spent $11,600,885 $13,627,721 $15,831,312 $18,215,227 $20,783,086 $23,538,561 $26,485,374 $27,981,341 $29,497,841 $30,966,309
Shopping/Gifts/Souvenirs $6,204,221 $7,288,185 $8,466,679 $9,741,611 $11,114,917 $12,588,561 $14,164,534 $14,964,586 $15,775,619 $16,560,964
Gasoline $10,104,831 $11,901,198 $13,126,735 $14,024,575 $14,934,887 $15,857,805 $16,793,466 $17,742,008 $18,703,568 $19,634,673
Groceries $0 $0 $0 $0 $0 $0 $0 $0 $0 $0
Entertainment, Not gaming $2,230,160 $2,714,720 $3,246,992 $3,827,950 $4,458,579 $5,207,513 $6,016,115 $6,355,922 $6,780,160 $7,117,691
Transportation, not parking/tolls $1,611,898 $1,962,124 $2,346,836 $2,766,736 $3,222,538 $3,763,846 $4,348,281 $4,593,884 $4,900,511 $5,144,470
Amenities (spa, tips, etc.) $1,449,972 $1,765,016 $2,111,081 $2,488,799 $2,898,812 $3,385,743 $3,911,468 $4,132,398 $4,408,223 $4,627,674
Parking/Tolls $191,367 $232,946 $278,620 $328,471 $382,584 $446,849 $516,234 $545,393 $581,796 $610,759
Total trip expenditures $66,001,269 $76,246,462 $86,546,998 $97,158,454 $108,433,619 $120,551,711 $133,379,185 $141,111,520 $149,146,307 $156,757,231
Secondary Sector Impact $22,775,387 $26,875,668 $30,990,099 $35,241,403 $39,798,851 $44,748,312 $50,025,534 $52,845,364 $55,797,996 $58,570,372
Total Impact $88,776,656 $103,122,130 $117,537,097 $132,399,857 $148,232,469 $165,300,023 $183,404,719 $193,956,884 $204,944,302 $215,327,603
Exhibits 3-4.-Grand Total Sales Tax Revenue, All Opportunity Areas, 2032-2041 Year 2032 2033 2034 2035 2036 2037 2038 2039 2040 2041
GRAND TOTAL TOT $4,541,977 $5,210,449 $5,874,317 $6,550,167 $7,263,208 $8,029,662 $8,838,290 $9,330,811 $9,822,055 $10,320,824
Page 126 of 332

Salton Sea Project TOT & Sales Tax Estimates 21
Exhibit 3A.-Total Sales, Opportunity Areas 3-6, 2042-2051 Year 2042 2043 2044 2045 2046 2047 2048 2049 2050 2051
Food/Beverage/Dining $46,147,949 $48,277,565 $50,428,028 $52,599,498 $54,791,684 $57,005,189 $59,240,176 $61,496,808 $63,775,248 $65,972,446
Costs $36,500,503 $38,357,636 $40,233,060 $42,126,915 $44,039,342 $45,970,482 $47,920,479 $49,889,476 $51,877,618 $53,801,782
Other-Total dollar amount spent $38,175,546 $39,937,255 $41,716,210 $43,512,541 $45,326,011 $47,157,117 $49,005,993 $50,872,774 $52,757,597 $54,575,212
Shopping/Gifts/Souvenirs $20,416,507 $21,358,679 $22,310,075 $23,270,763 $24,240,618 $25,219,904 $26,208,694 $27,207,059 $28,215,074 $29,187,145
Gasoline $22,861,036 $23,916,018 $24,981,327 $26,057,042 $27,143,020 $28,239,559 $29,346,739 $30,464,642 $31,593,349 $32,681,810
Groceries $13,151,058 $13,757,948 $14,370,778 $14,989,595 $15,614,315 $16,245,111 $16,882,029 $17,525,115 $18,174,416 $18,800,564
Entertainment, Not gaming $8,774,754 $9,179,688 $9,588,585 $10,001,477 $10,418,308 $10,839,193 $11,264,162 $11,693,247 $12,126,479 $12,544,262
Transportation, not parking/tolls $6,342,149 $6,634,824 $6,930,364 $7,228,790 $7,530,064 $7,834,268 $8,141,424 $8,451,555 $8,764,683 $9,066,645
Amenities (spa, tips, etc.) $5,705,038 $5,968,312 $6,234,163 $6,502,611 $6,773,619 $7,047,264 $7,323,564 $7,602,540 $7,884,212 $8,155,841
Parking/Tolls $752,949 $787,696 $822,783 $858,213 $893,980 $930,096 $966,562 $1,003,381 $1,040,556 $1,076,405
Total trip expenditures $198,827,489 $208,175,620 $217,615,372 $227,147,445 $236,770,961 $246,488,182 $256,299,821 $266,206,596 $276,209,231 $285,862,112
Secondary Sector Impact $95,371,256 $99,847,532 $104,367,676 $108,932,022 $113,540,132 $118,193,107 $122,891,288 $127,635,019 $132,424,645 $137,046,493
Total Impact $294,198,745 $308,023,152 $321,983,048 $336,079,467 $350,311,094 $364,681,290 $379,191,109 $393,841,615 $408,633,877 $422,908,606
Exhibit 3B.-Sales Capture Rates, Opportunity Areas 3-6, 2042-2051 Year Factor 2042 2043 2044 2045 2046 2047 2048 2049 2050 2051
Food/Beverage/Dining 5.0% 85.0% 85.0% 85.0% 85.0% 85.0% 85.0% 85.0% 85.0% 85.0% 85.0%
Costs 25.0% 100.0% 100.0% 100.0% 100.0% 100.0% 100.0% 100.0% 100.0% 100.0% 100.0%
Other-Total dollar amount spent 5.0% 85.0% 85.0% 85.0% 85.0% 85.0% 85.0% 85.0% 85.0% 85.0% 85.0%
Shopping/Gifts/Souvenirs 5.0% 85.0% 85.0% 85.0% 85.0% 85.0% 85.0% 85.0% 85.0% 85.0% 85.0%
Gasoline 7.5% 90.0% 90.0% 90.0% 90.0% 90.0% 90.0% 90.0% 90.0% 90.0% 90.0%
Groceries 5.0% 85.0% 85.0% 85.0% 85.0% 85.0% 85.0% 85.0% 85.0% 85.0% 85.0%
Entertainment, not gaming Hotel 85.0% 85.0% 85.0% 85.0% 85.0% 85.0% 85.0% 85.0% 85.0% 85.0%
Transportation, not parking/tolls Hotel 85.0% 85.0% 85.0% 85.0% 85.0% 85.0% 85.0% 85.0% 85.0% 85.0%
Amenities (spa, tips, etc.) Hotel 85.0% 85.0% 85.0% 85.0% 85.0% 85.0% 85.0% 85.0% 85.0% 85.0%
Parking/Tolls Hotel 85.0% 85.0% 85.0% 85.0% 85.0% 85.0% 85.0% 85.0% 85.0% 85.0%
Secondary Sector Impact Formula 64.6% 64.6% 64.5% 64.5% 64.4% 64.4% 64.4% 64.3% 64.3% 64.3%
Page 127 of 332

Salton Sea Project TOT & Sales Tax Estimates 22
Exhibit 3C.-Captured Sales & Sales Taxes, Opportunity Areas 3-6, 2042-2051
Year 2042 2043 2044 2045 2046 2047 2048 2049 2050 2051
Food/Beverage/Dining $39,225,756 $41,035,930 $42,863,824 $44,709,573 $46,572,931 $48,454,411 $50,354,150 $52,272,286 $54,208,961 $56,076,579
Costs $36,500,503 $38,357,636 $40,233,060 $42,126,915 $44,039,342 $45,970,482 $47,920,479 $49,889,476 $51,877,618 $53,801,782
Other-Total dollar amount spent $32,449,214 $33,946,667 $35,458,778 $36,985,660 $38,527,109 $40,083,549 $41,655,094 $43,241,858 $44,843,958 $46,388,931
Shopping/Gifts/Souvenirs $17,354,031 $18,154,877 $18,963,563 $19,780,149 $20,604,525 $21,436,918 $22,277,390 $23,126,000 $23,982,813 $24,809,073
Gasoline $20,574,933 $21,524,416 $22,483,194 $23,451,338 $24,428,718 $25,415,603 $26,412,065 $27,418,178 $28,434,014 $29,413,629
Groceries $0 $0 $0 $0 $0 $0 $0 $0 $0 $0
Entertainment, Not gaming $7,458,541 $7,802,734 $8,150,297 $8,501,256 $8,855,562 $9,213,314 $9,574,538 $9,939,260 $10,307,507 $10,662,623
Transportation, not parking/tolls $5,390,827 $5,639,600 $5,890,809 $6,144,472 $6,400,555 $6,659,128 $6,920,210 $7,183,821 $7,449,980 $7,706,648
Amenities (spa, tips, etc.) $4,849,282 $5,073,065 $5,299,038 $5,527,219 $5,757,577 $5,990,174 $6,225,029 $6,462,159 $6,701,580 $6,932,464
Parking/Tolls $640,007 $669,542 $699,365 $729,481 $759,883 $790,581 $821,577 $852,874 $884,473 $914,945
Total trip expenditures $164,443,094 $172,204,468 $180,041,930 $187,956,062 $195,946,201 $204,014,161 $212,160,532 $220,385,913 $228,690,904 $236,706,674
Secondary Sector Impact $61,370,012 $64,197,123 $67,051,912 $69,934,592 $72,844,765 $75,783,242 $78,750,237 $81,745,968 $84,770,652 $87,687,290
Total Impact $225,813,106 $236,401,590 $247,093,843 $257,890,654 $268,790,966 $279,797,402 $290,910,770 $302,131,881 $313,461,556 $324,393,964
Sales Tax @ 1.0% $2,258,131 $2,364,016 $2,470,938 $2,578,907 $2,687,910 $2,797,974 $2,909,108 $3,021,319 $3,134,616 $3,243,940
Exhibits 3-4.-Grand Total Sales Tax Revenue, All Opportunity Areas, 2042-2051 Year 2042 2043 2044 2045 2046 2047 2048 2049 2050 2051
GRAND TOTAL TOT $10,828,396 $11,168,516 $11,513,370 $11,779,306 $12,040,099 $12,302,649 $12,566,970 $12,833,075 $13,100,978 $13,341,231
Page 128 of 332

Salton Sea Project TOT & Sales Tax Estimates 23
Exhibit 3A.-Total Sales, Opportunity Areas 3-6, 2052-2062 Year 2052 2053 2054 2055 2056 2057 2058 2059 2060 2061 2062
Food/Beverage $68,184,773 $70,412,311 $72,655,142 $74,913,347 $76,080,233 $77,251,938 $78,428,479 $79,609,869 $80,796,126 $80,979,074 $81,162,440
Costs $55,739,254 $57,690,103 $59,654,401 $61,632,221 $62,651,599 $63,675,204 $64,703,049 $65,735,148 $66,771,514 $66,919,897 $67,068,609
Other t $56,405,344 $58,248,058 $60,103,423 $61,971,506 $62,936,804 $63,906,089 $64,879,373 $65,856,669 $66,837,991 $66,989,334 $67,141,021
Shopping/Gifts $30,165,910 $31,151,405 $32,143,665 $33,142,727 $33,658,974 $34,177,353 $34,697,871 $35,220,535 $35,745,351 $35,826,290 $35,907,414
Gasoline $33,777,765 $34,881,256 $35,992,322 $37,111,005 $37,689,063 $38,269,510 $38,852,351 $39,437,595 $40,025,249 $40,115,879 $40,206,716
Groceries $19,431,024 $20,065,819 $20,704,972 $21,348,506 $21,681,041 $22,014,949 $22,350,235 $22,686,903 $23,024,957 $23,077,093 $23,129,348
Entertainment $12,964,923 $13,388,476 $13,814,937 $14,244,321 $14,466,197 $14,688,990 $14,912,702 $15,137,336 $15,362,896 $15,397,682 $15,432,548
Transports $9,370,687 $9,676,819 $9,985,053 $10,295,400 $10,455,766 $10,616,795 $10,778,487 $10,940,847 $11,103,875 $11,129,018 $11,154,218
Amenities) $8,429,339 $8,704,719 $8,981,989 $9,261,159 $9,405,415 $9,550,267 $9,695,717 $9,841,766 $9,988,417 $10,011,034 $10,033,703
Parking/Tolls $1,112,502 $1,148,846 $1,185,440 $1,222,285 $1,241,324 $1,260,441 $1,279,638 $1,298,913 $1,318,268 $1,321,253 $1,324,245
Total trip s $295,581,520 $305,367,811 $315,221,343 $325,142,476 $330,266,417 $335,411,536 $340,577,900 $345,765,581 $350,974,646 $351,766,555 $352,560,262
Secondary t $141,700,193 $146,385,913 $151,103,826 $155,854,105 $158,307,584 $160,771,202 $163,244,993 $165,728,989 $168,223,225 $168,602,914 $168,983,466
Total Impact $437,281,713 $451,753,724 $466,325,170 $480,996,581 $488,574,001 $496,182,738 $503,822,893 $511,494,570 $519,197,870 $520,369,470 $521,543,727
Exhibit 3B.-Sales Capture Rates, Opportunity Areas 3-6, 2052-2062 Year Factor 2052 2053 2054 2055 2056 2057 2058 2059 2060 2061 2062
Food/Beverage/Dining 5.0% 85.0% 85.0% 85.0% 85.0% 85.0% 85.0% 85.0% 85.0% 85.0% 85.0% 85.0%
Costs 25.0% 100.0% 100.0% 100.0% 100.0% 100.0% 100.0% 100.0% 100.0% 100.0% 100.0% 100.0%
Other-Total dollar amount spent 5.0% 85.0% 85.0% 85.0% 85.0% 85.0% 85.0% 85.0% 85.0% 85.0% 85.0% 85.0%
Shopping/Gifts/Souvenirs 5.0% 85.0% 85.0% 85.0% 85.0% 85.0% 85.0% 85.0% 85.0% 85.0% 85.0% 85.0%
Gasoline 7.5% 90.0% 90.0% 90.0% 90.0% 90.0% 90.0% 90.0% 90.0% 90.0% 90.0% 90.0%
Groceries 5.0% 85.0% 85.0% 85.0% 85.0% 85.0% 85.0% 85.0% 85.0% 85.0% 85.0% 85.0%
Entertainment, not gaming Hotel 85.0% 85.0% 85.0% 85.0% 85.0% 85.0% 85.0% 85.0% 85.0% 85.0% 85.0%
Transportation, not parking/tolls Hotel 85.0% 85.0% 85.0% 85.0% 85.0% 85.0% 85.0% 85.0% 85.0% 85.0% 85.0%
Amenities (spa, tips, etc.) Hotel 85.0% 85.0% 85.0% 85.0% 85.0% 85.0% 85.0% 85.0% 85.0% 85.0% 85.0%
Parking/Tolls Hotel 85.0% 85.0% 85.0% 85.0% 85.0% 85.0% 85.0% 85.0% 85.0% 85.0% 85.0%
Secondary Sector Impact Formula 64.2% 64.2% 64.2% 64.2% 64.1% 64.1% 64.1% 64.1% 64.1% 64.1% 64.1%
Page 129 of 332

Salton Sea Project TOT & Sales Tax Estimates 24
Exhibit 3C.-Captured Sales & Sales Taxes, Opportunity Areas 3-6, 2052-2062
Year 2052 2053 2054 2055 2056 2057 2058 2059 2060 2061 2062
Food/Beverage $57,957,057 $59,850,464 $61,756,871 $63,676,345 $64,668,198 $65,664,148 $66,664,207 $67,668,389 $68,676,707 $68,832,213 $68,988,074
Costs $55,739,254 $57,690,103 $59,654,401 $61,632,221 $62,651,599 $63,675,204 $64,703,049 $65,735,148 $66,771,514 $66,919,897 $67,068,609
Other t $47,944,542 $49,510,849 $51,087,910 $52,675,780 $53,496,284 $54,320,175 $55,147,467 $55,978,169 $56,812,292 $56,940,934 $57,069,868
Shopping/Gifts $25,641,024 $26,478,694 $27,322,115 $28,171,318 $28,610,128 $29,050,750 $29,493,190 $29,937,454 $30,383,549 $30,452,347 $30,521,302
Gasoline $30,399,988 $31,393,130 $32,393,090 $33,399,904 $33,920,157 $34,442,559 $34,967,116 $35,493,835 $36,022,725 $36,104,292 $36,186,045
Groceries $0 $0 $0 $0 $0 $0 $0 $0 $0 $0 $0
Entertainment $11,020,185 $11,380,205 $11,742,696 $12,107,673 $12,296,268 $12,485,641 $12,675,797 $12,866,736 $13,058,461 $13,088,030 $13,117,666
Transports $7,965,084 $8,225,296 $8,487,295 $8,751,090 $8,887,401 $9,024,275 $9,161,714 $9,299,720 $9,438,294 $9,459,665 $9,481,085
Amenities) $7,164,938 $7,399,011 $7,634,690 $7,871,985 $7,994,603 $8,117,727 $8,241,359 $8,365,501 $8,490,155 $8,509,379 $8,528,647
Parking/Tolls $945,626 $976,519 $1,007,624 $1,038,942 $1,055,125 $1,071,375 $1,087,692 $1,104,076 $1,120,528 $1,123,065 $1,125,608
Total trip s $244,777,698 $252,904,271 $261,086,692 $269,325,258 $273,579,763 $277,851,855 $282,141,591 $286,449,028 $290,774,225 $291,429,821 $292,086,904
Secondary t $90,624,014 $93,580,932 $96,558,150 $99,555,779 $101,104,824 $102,660,266 $104,222,127 $105,790,427 $107,365,187 $107,608,375 $107,852,119
Total Impact $335,401,712 $346,485,203 $357,644,842 $368,881,036 $374,684,587 $380,512,121 $386,363,718 $392,239,455 $398,139,411 $399,038,197 $399,939,023
Sales Tax @ 1.0% $3,354,017 $3,464,852 $3,576,448 $3,688,810 $3,746,846 $3,805,121 $3,863,637 $3,922,395 $3,981,394 $3,990,382 $3,999,390
Exhibits 3 4.-Grand Total Sales Tax Revenue, All Opportunity Areas, 2052-2062 Year 2052 2053 2054 2055 2056 2057 2058 2059 2060 2061 2062
GRAND TOTAL TOT $13,582,646 $13,825,230 $14,068,991 $14,313,935 $14,435,688 $14,557,804 $14,680,288 $14,803,142 $14,926,367 $14,941,305 $14,956,343
Page 130 of 332

Salton Sea Project TOT & Sales Tax Estimates 25
As indicated, for the forecasting period of 2022-2074, the total retail sales tax collections would be $554,101,467. Vey conservatively eliminating, the retail sales taxes created by the Salon Sea project due to the secondary impact that occurs as money flowed through the six Opportunity Areas in the CV and Imperial area economies results in a reduction of 29.0% in sales taxes generated for the full time period ($160,730,382 ÷ $554,101,467 = 29.0%). The forecasting total is thus estimated at $394,604,677 in sales tax revenue for the study period (Exhibit 5).
Exhibit 5.-Sales Taxes Forecast, Six Opportunity Areas, 2022-2074 With Eliminated Secondary Activity Removed Activity
Opportunity
Areas 1, 2, 2a Opportunity
Areas 3-6
Six Opportunity
Areas 1.0% 100.0%
Opportunity Areas 1, 2, 2a
Opportunity Areas 3-6
Six Opportunity
Areas 1.0% 100.0%
2022 $11,478,547 $2,911,774 $14,390,321 $143,903 $143,903 $2,440,498 $544,699 $2,985,197 $29,852 $29,852
2023 $27,240,164 $6,794,237 $34,034,401 $340,344 $340,344 $6,054,059 $1,325,028 $7,379,087 $73,791 $73,791
2024 $48,340,150 $12,128,581 $60,468,731 $604,687 $604,687 $11,399,556 $2,565,907 $13,965,463 $139,655 $139,655
2025 $73,505,341 $18,256,706 $91,762,048 $917,620 $917,620 $17,767,237 $3,946,241 $21,713,478 $217,135 $217,135
2026 $92,346,944 $22,775,018 $115,121,962 $1,151,220 $1,151,220 $25,666,111 $5,631,025 $31,297,136 $312,971 $312,971
2027 $114,465,058 $28,039,527 $142,504,585 $1,425,046 $1,425,046 $35,351,603 $7,667,606 $43,019,210 $430,192 $430,192
2028 $140,456,901 $34,177,529 $174,634,430 $1,746,344 $1,746,344 $47,160,627 $10,117,944 $57,278,570 $572,786 $572,786
2029 $171,554,008 $41,451,209 $213,005,217 $2,130,052 $2,130,052 $61,781,717 $13,109,156 $74,890,873 $748,909 $748,909
2030 $198,534,431 $48,005,747 $246,540,179 $2,465,402 $2,465,402 $74,006,500 $15,736,064 $89,742,565 $897,426 $897,426
2031 $229,355,140 $56,635,429 $285,990,569 $2,859,906 $2,859,906 $87,916,466 $19,085,060 $107,001,526 $1,070,015 $1,070,015
2032 $262,412,132 $66,001,269 $328,413,401 $3,284,134 $3,284,134 $103,008,869 $22,775,387 $125,784,256 $1,257,843 $1,257,843
2033 $298,308,924 $76,246,462 $374,555,386 $3,745,554 $3,745,554 $119,613,839 $26,875,668 $146,489,507 $1,464,895 $1,464,895
2034 $333,891,460 $86,546,998 $420,438,458 $4,204,385 $4,204,385 $136,003,098 $30,990,099 $166,993,197 $1,669,932 $1,669,932
2035 $369,964,217 $97,158,454 $467,122,671 $4,671,227 $4,671,227 $152,652,619 $35,241,403 $187,894,022 $1,878,940 $1,878,940
2036 $407,828,999 $108,433,619 $516,262,618 $5,162,626 $5,162,626 $170,259,354 $39,798,851 $210,058,205 $2,100,582 $2,100,582
2037 $448,373,425 $120,551,711 $568,925,136 $5,689,251 $5,689,251 $189,292,782 $44,748,312 $234,041,094 $2,340,411 $2,340,411
2038 $490,999,335 $133,379,185 $624,378,520 $6,243,785 $6,243,785 $209,424,994 $50,025,534 $259,450,528 $2,594,505 $2,594,505
2039 $518,098,343 $141,111,520 $659,209,863 $6,592,099 $6,592,099 $221,025,904 $52,845,364 $273,871,268 $2,738,713 $2,738,713
2040 $544,764,703 $149,146,307 $693,911,010 $6,939,110 $6,939,110 $232,496,453 $55,797,996 $288,294,449 $2,882,944 $2,882,944
2041 $572,301,970 $156,757,231 $729,059,200 $7,290,592 $7,290,592 $244,452,825 $58,570,372 $303,023,198 $3,030,232 $3,030,232
2042 $600,354,723 $164,443,094 $764,797,817 $7,647,978 $7,647,978 $256,671,818 $61,370,012 $318,041,830 $3,180,418 $3,180,418
2043 $616,429,638 $172,204,468 $788,634,106 $7,886,341 $7,886,341 $264,020,350 $64,197,123 $328,217,473 $3,282,175 $3,282,175
2044 $632,749,299 $180,041,930 $812,791,229 $8,127,912 $8,127,912 $271,493,876 $67,051,912 $338,545,789 $3,385,458 $3,385,458
2045 $643,903,764 $187,956,062 $831,859,826 $8,318,598 $8,318,598 $276,136,203 $69,934,592 $346,070,795 $3,460,708 $3,460,708
2046 $654,627,156 $195,946,201 $850,573,357 $8,505,734 $8,505,734 $280,591,767 $72,844,765 $353,436,532 $3,534,365 $3,534,365
2047 $665,399,702 $204,014,161 $869,413,863 $8,694,139 $8,694,139 $285,067,805 $75,783,242 $360,851,046 $3,608,510 $3,608,510
2048 $676,221,772 $212,160,532 $888,382,304 $8,883,823 $8,883,823 $289,564,470 $78,750,237 $368,314,707 $3,683,147 $3,683,147
2049 $687,093,738 $220,385,913 $907,479,651 $9,074,797 $9,074,797 $294,081,917 $81,745,968 $375,827,885 $3,758,279 $3,758,279
2050 $698,015,975 $228,690,904 $926,706,879 $9,267,069 $9,267,069 $298,620,301 $84,770,652 $383,390,953 $3,833,910 $3,833,910
2051 $707,269,421 $236,706,674 $943,976,095 $9,439,761 $9,439,761 $302,459,728 $87,687,290 $390,147,018 $3,901,470 $3,901,470
2052 $716,551,688 $244,777,698 $961,329,386 $9,613,294 $9,613,294 $306,311,187 $90,624,014 $396,935,202 $3,969,352 $3,969,352
2053 $725,863,010 $252,904,271 $978,767,282 $9,787,673 $9,787,673 $310,174,777 $93,580,932 $403,755,709 $4,037,557 $4,037,557
2054 $735,203,623 $261,086,692 $996,290,315 $9,962,903 $9,962,903 $314,050,594 $96,558,150 $410,608,745 $4,106,087 $4,106,087
2055 $744,573,765 $269,325,258 $1,013,899,022 $10,138,990 $10,138,990 $317,938,738 $99,555,779 $417,494,517 $4,174,945 $4,174,945
Page 131 of 332
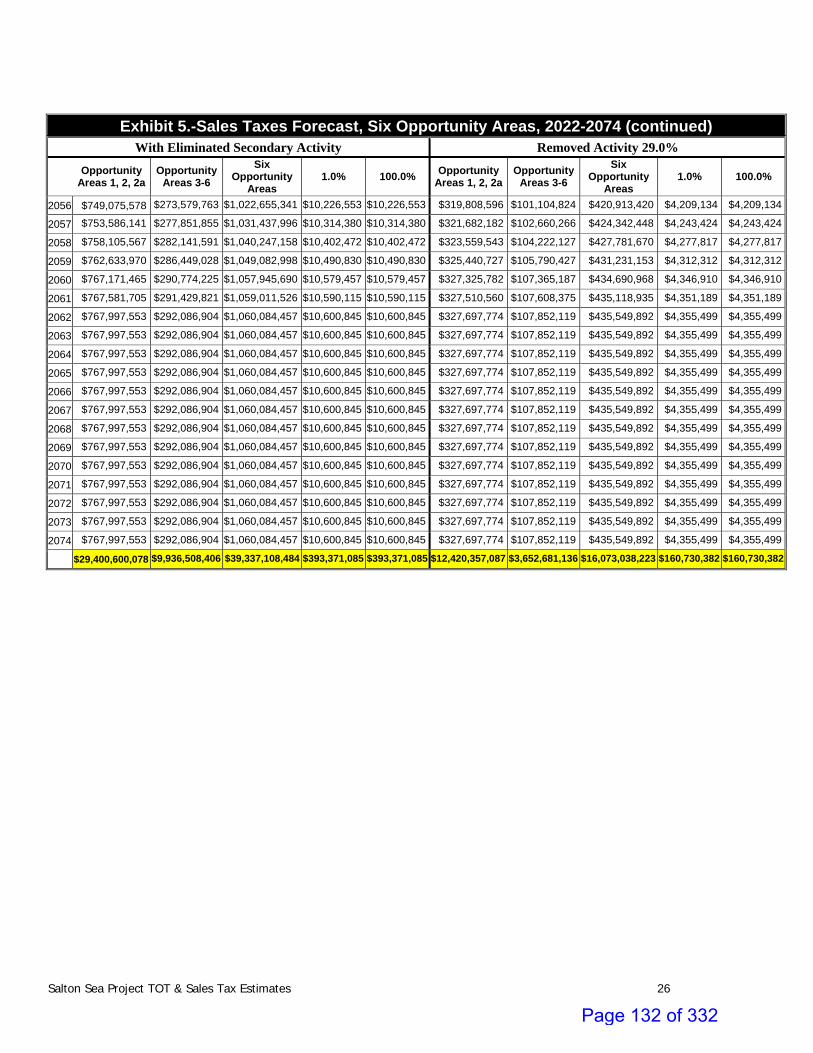
Salton Sea Project TOT & Sales Tax Estimates 26
Exhibit 5.-Sales Taxes Forecast, Six Opportunity Areas, 2022-2074 (continued)
With Eliminated Secondary Activity Removed Activity 29.0%
Opportunity Areas 1, 2, 2a
Opportunity Areas 3-6
Six Opportunity
Areas 1.0% 100.0%
Opportunity Areas 1, 2, 2a
Opportunity Areas 3-6
Six Opportunity
Areas 1.0% 100.0%
2056 $749,075,578 $273,579,763 $1,022,655,341 $10,226,553 $10,226,553 $319,808,596 $101,104,824 $420,913,420 $4,209,134 $4,209,134
2057 $753,586,141 $277,851,855 $1,031,437,996 $10,314,380 $10,314,380 $321,682,182 $102,660,266 $424,342,448 $4,243,424 $4,243,424
2058 $758,105,567 $282,141,591 $1,040,247,158 $10,402,472 $10,402,472 $323,559,543 $104,222,127 $427,781,670 $4,277,817 $4,277,817
2059 $762,633,970 $286,449,028 $1,049,082,998 $10,490,830 $10,490,830 $325,440,727 $105,790,427 $431,231,153 $4,312,312 $4,312,312
2060 $767,171,465 $290,774,225 $1,057,945,690 $10,579,457 $10,579,457 $327,325,782 $107,365,187 $434,690,968 $4,346,910 $4,346,910
2061 $767,581,705 $291,429,821 $1,059,011,526 $10,590,115 $10,590,115 $327,510,560 $107,608,375 $435,118,935 $4,351,189 $4,351,189
2062 $767,997,553 $292,086,904 $1,060,084,457 $10,600,845 $10,600,845 $327,697,774 $107,852,119 $435,549,892 $4,355,499 $4,355,499
2063 $767,997,553 $292,086,904 $1,060,084,457 $10,600,845 $10,600,845 $327,697,774 $107,852,119 $435,549,892 $4,355,499 $4,355,499
2064 $767,997,553 $292,086,904 $1,060,084,457 $10,600,845 $10,600,845 $327,697,774 $107,852,119 $435,549,892 $4,355,499 $4,355,499
2065 $767,997,553 $292,086,904 $1,060,084,457 $10,600,845 $10,600,845 $327,697,774 $107,852,119 $435,549,892 $4,355,499 $4,355,499
2066 $767,997,553 $292,086,904 $1,060,084,457 $10,600,845 $10,600,845 $327,697,774 $107,852,119 $435,549,892 $4,355,499 $4,355,499
2067 $767,997,553 $292,086,904 $1,060,084,457 $10,600,845 $10,600,845 $327,697,774 $107,852,119 $435,549,892 $4,355,499 $4,355,499
2068 $767,997,553 $292,086,904 $1,060,084,457 $10,600,845 $10,600,845 $327,697,774 $107,852,119 $435,549,892 $4,355,499 $4,355,499
2069 $767,997,553 $292,086,904 $1,060,084,457 $10,600,845 $10,600,845 $327,697,774 $107,852,119 $435,549,892 $4,355,499 $4,355,499
2070 $767,997,553 $292,086,904 $1,060,084,457 $10,600,845 $10,600,845 $327,697,774 $107,852,119 $435,549,892 $4,355,499 $4,355,499
2071 $767,997,553 $292,086,904 $1,060,084,457 $10,600,845 $10,600,845 $327,697,774 $107,852,119 $435,549,892 $4,355,499 $4,355,499
2072 $767,997,553 $292,086,904 $1,060,084,457 $10,600,845 $10,600,845 $327,697,774 $107,852,119 $435,549,892 $4,355,499 $4,355,499
2073 $767,997,553 $292,086,904 $1,060,084,457 $10,600,845 $10,600,845 $327,697,774 $107,852,119 $435,549,892 $4,355,499 $4,355,499
2074 $767,997,553 $292,086,904 $1,060,084,457 $10,600,845 $10,600,845 $327,697,774 $107,852,119 $435,549,892 $4,355,499 $4,355,499
$29,400,600,078 $9,936,508,406 $39,337,108,484 $393,371,085 $393,371,085 $12,420,357,087 $3,652,681,136 $16,073,038,223 $160,730,382 $160,730,382
Page 132 of 332

BENCHMARK 5:
INFRASTRUCTURE FINANCING
FEASIBILITY ANALYSIS
Appendix 3: Salton Sea Recreation
Opportunities
Page 133 of 332

The followcurrent dorecreationnoted thaarea and f
The recresix Opporidentified
wing Salton Seocumentationnal uses, or pat the listed refurther analy
ational oppotunity Areas .
Salton
ea Recreationn and historicotential recreecreational usis of its feas
rtunities of thmore specific
n Sea Recr
n Opportunitical reports. Theational uses ses could potibility and act
he Salton Seac locations wi
reation O
ies have beenhe opportunithat could octentially be estual developm
have been foth a brief des
pportunit
n identified thties identifiedccur based onstablished anment will be n
ocused withinscription of p
ties
hrough varioud are either en approved pywhere adjacnecessary.
n six areas of otential uses
us sources of existing lans. It shouldcent to the la
focus. Withinhave been
d be ke
n the
Page 134 of 332

Opportunity Area 1
Page 135 of 332

North Shore Yacht Club Originally opened in 1959, The North Shore Yacht Club, was once California’s largest marina and very popular for boating and vacationing for the entertainment industry’s rich and famous and is now over fifty‐five years old. In various states of use over the years, the marina being destroyed and closed in 1994. In 2010, the Salton Sea History Museum was located at the restored facility but has since closed for relocation. Currently its main use is a community center for the North Shore area residents. It is open to the public and provides space for:
Community events/Event Center
Private events (weddings, parties)
Meeting space area
Other potential activities and uses:
Beach
Marina/Boat Launch
Hotel
Museums/Cultural/Community Center
Sports/Recreational facilities
Hiking
Salton Sea State Recreation Area Salton Sea State Recreation Area (SRA) covers approximate 14 miles of the northeastern shore. In a January 2016 news release, the SRA announced that Varner Harbor within the SRA is now open to provide access to the sea for boating and water skiing. Other available Activities and Facilities at Salton Sea State Recreation Area per the current website information include:
BOATING o Boating o Boat Ramps o Kayaking o Water skiing
OVERNIGHT FACILITIES o En‐route Campsites o Family Campsites o Group Campsites o Hike or Bike Campsites o Primitive Camping o RV Sites w/Hookups o RV Dump Station o RV Access
TRAIL USE o Hiking Trails
DAY‐USE ACTIVITIES & FACILITIES o Historical/Cultural Site o Picnic Areas
Page 136 of 332

o Environmental Learning/Visitor Center o Exhibits and Programs o Fishing o Guided Tours o Interpretive Exhibits o Beach Area o Swimming o Nature & Wildlife Viewing o Birding o Photography o Windsurfing/Surfing o Museums o Family Programs o Geocaching
OTHER FACILITIES & VISITOR INFORMATION o Parking o Restrooms / Showers o Restrooms o Drinking Water Available
Page 137 of 332

Opportunity Area 2
Page 138 of 332

Travertine Point Travertine Point is located adjacent to the western shoreline of the Salton Sea at the boundaries of Riverside County and Imperial County. The Travertine Point Specific Plan document was approved in February 2012. The Specific Plan area encompasses approximately 4,900 acres with multiple ownerships. Planning Areas that are adjacent to Salton Sea Shoreline consist of open space (recreation), open space (water), and commercial tourist land use designations. The Torres Martinez Desert Cahuilla Indian Tribe owns the planning areas directly adjacent to the shoreline and is currently undeveloped. Pursuant to the land use designations, permitted uses include the following, but are not limited to:
Boat launch
Boating
Camp Grounds
Fishing
Hotel
Hunting
Recreational Vehicles
Scenic Viewpoint
Museums, Cultural, Tourist Community Centers
Picnic Grounds
Sports and recreation facilities (e.g., parks, playgrounds, golf club, country club)
Equestrian, Riding/Stables
Day/Medical Spas
Torres Martinez Tribe – Wetland Habitat The Torres‐Martinez Desert Cahuilla Indian Tribe developed an 85‐acre wetland project at the mouth of the Whitewater River, where it enters the Salton Sea in 2009. The Wetland Habitat, provides the following:
Educational programs/interpretive exhibits for natural water treatment, habitat restoration, and sediment stabilization through seven water quality cells and four habitat ponds.
Page 139 of 332

Duck Ponds This delta area is mostly in private ownership and is adjacent to Torres Martinez Tribal land. Limited public access is available to this area. Waterfowl hunting has occurred within privately owned duck ponds within the area of where the Whitewater River enters into the Salton Sea. (Source: Recreation and Economic Opportunities Assessment for the Salton Sea, California, Draft Report, August 12, 2005.). Other uses within the immediate vicinity include crops and orchards. Recreational opportunities may include:
Educational/interpretive exhibits associated with the Torres‐Martinez Indian Reservation
Tribal gaming establishments, tribal resorts/marinas, private resorts/marinas
Potential to create a multiple use biking/hiking trail around the Sea’s perimeter, which would require cooperation of numerous agencies, entities, and stakeholders.
North Lake Village The North Lake Village was identified as a Village Core area within the “Salton Sea Master Development Plan” (Mooney, Jones, & Stokes, February 2006). Potential uses for this area may include:
Beach
Boat Launch
Fishing pier/Fishing
Hotel
RV Park
Salton Sea North Lake The Salton Sea North lake area of the “Perimeter Lake Plan” is an area suitable for active water sports such as the following:
Boating
Water Skiing
Windsurfing
Kayaking
Jet Skiing
Page 140 of 332

Opportunity Area 3
Page 141 of 332

Desert Shores Desert Shores is a residential community located within the Imperial County General Plan’s West Shores/Salton City Urban Area which encompasses approximately 34,000 acres. The Desert Shores community primarily consists of single family and mobile home residences, with some support retail. It is more specifically located adjacent to the western shoreline of the Salton Sea at the boundaries of Riverside County and Imperial County. Potential recreational opportunities for this area may include:
Beach
Boat launch
Marina
Picnic Grounds
Salton City Salton City is residential community that originally began development in 1958. The 19,000 acre community primarily consists of residential uses and was originally developed with a small airport and golf as well as hotel‐motels, restaurants and bars, market and gas, in close proximity to Highway 86. Other public service facilities include a post office, fire and sheriff department, churches, parks, school and library. The community is located within the Imperial County General Plan’s West Shores/Salton City Urban Area. Salton City is located adjacent to the western shoreline of the Salton Sea at the boundaries of Riverside County and Imperial County. Potential recreational opportunities for this area include:
Beach
Boat launch
Marina
Picnic Grounds
Off‐roading
RV Park
Page 142 of 332

Opportunity Area 4 / 5
Page 143 of 332

South Lake Village The South Lake Village is located at the southern end of the Salton Sea, adjacent to the recreational estuary lake of the Perimeter Lake Design Concept (Tetra Tech), and the Sonny Bono National Wildlife Refuge (NWR). The majority of this area is primarily used for agriculture. Much of the farming operations involves cooperative farmers and some of the crops grown serve as part of the resource management program of the Sonny Bono National Wildlife Refuge for consumption by wintering waterfowl. The South Lake Village is just south of the potential Village Core location in the Salton Sea Authority Master Development Plan analysis (Mooney, Jones, and Stokes). The South Lake Village location in relation to the recreational opportunities of the Sonny Bono NWR and other areas such as the Red Hill Marina, this Village could provide the following recreational opportunities:
Bird watching
Hiking
Scenic View Point
Beach
Boat launch
Marina
Picnic Grounds
Sonny Bono National Wildlife Refuge The 37,900 acre Sonny Bono National Wildlife Refuge (NWR) was originally established in 1930. It serves to protect and manage habitat to support migratory birds, particularly waterfowl, and other wildlife. The Refuge is currently managed by the United States Fish and Wildlife Service. The Refuge is over 37,000 acres and is located in the southern portion of the Salton Sea in three general locations. The largest area is open water in the southern portion of the Salton Sea. The area described as “Unit 1” (3,782 acres) is located along the southern tip in the area south of Bruchard Bay. The area described as “Unit 2” (2,025 acres) is located near the terminus of the Alamo River and is where the Refuge headquarters is located. The U.S. Fish and Wildlife Service prepared a Comprehensive Conservation Plan (CCP) that provides the long‐term goals for the Refuge. The CCP includes the Refuge area and indicates that agricultural uses in the area serve as waterfowl forage. Duck ponds, managed habitats on the Refuge, and fish farms are also considered permanent crops. Public recreational opportunities listed from U.S. Fish and Wildlife Service’s website include:
Hiking
Birding
Scenic View Point
Picnic Grounds
Boat Launch
Hunting (limited areas)
Fishing (limited areas)
Page 144 of 332

Salton Sea South Lake The Salton Sea South lake area adjacent to the 32,410 acre Sonny Bono Salton Sea National Wildlife and the South Lake Village area may be suitable for active water sports such as the following:
Boat Launch
Boating
Water Skiing
Windsurfing
Kayaking
Jet Skiing
Page 145 of 332

Opportunity Area 6
Page 146 of 332

Bombay Beach Community Bombay Beach is designated by the Imperial County General Plan as a recreation/retirement community located off of Highway 111, on the eastern shore of the Salton Sea, and is located just south of the Salton Sea State Recreation Area. Once a burgeoning resort community in the 1950’s and 60’s, with homes, hotels, beach, it is currently a small residential community that consists primarily of single family and mobile homes, a community center, library, medical clinic, marina, park and church. Recreational uses for this area may include:
Beach
Boat launch
Picnic Grounds
Off‐Roading
RV Park
Day/Medical Spa
Page 147 of 332

Image
Image
A North Shore Yacht
B Salton Sea State Re
t Club
ecreation Area
Page 148 of 332

Image
Image
C Travertine Point
D Duck Ponds
Page 149 of 332

Image
Image
E North Lake Village
F Desert Shores
Page 150 of 332

Image G Salton City
Page 151 of 332

Image
Image
H South Lake Village
I Bombay Beach
e
Page 152 of 332

Appendices Land Use Matrix Salton Sea Funding and Feasibility Action Plan Benchmark 3: Evaluation of Alternatives With Respect to Existing Conditions Tetra Tech June 2015 Salton Sea Restoration and Renewable Energy Initiative Executive White Paper Framework for a Smaller Sustainable Salton Sea Imperial Irrigation District and County of Imperial Draft ‐ July 2015 Salton Sea Master Development Plan Mooney, Jones, and Stokes February 2006
Page 153 of 332

Recreational Opportunities Matrix
Activities
Travertine
Point
North Lake
Village
North Shore
Yacht Club
Salton Sea
Recreation
Area
Duck Ponds
Torres
Martinez
Wetlan
d
Hab
itat
Salton Sea
North Lake
Desert
Shores
Salton City
South Lake
Village
Sonny Bono
National
Wild
life
Refuge
Bombay
Beach
Salton Sea
South Lake
Beach X X X X X X X X X
Bike Trail X
Bird Watching/Photography X X X X
Boat launch X X X X X X X X X X X
Boating X X X X
Bridge
Camp Grounds X X
Day/Medical Spas X X
Equestrian use X
Fishing X X X X X
Fishing Pier X
Hiking X X X
Hotel/Motel X X X
Hunting X X X
Jet Ski X X
Kayak X X X
Off‐Roading X X
Marina X X X X
Museums, Cultural, Tourist, Community, Event Centers
X X X
Picnic Grounds X X X X X X X
RV Park X X X X X
Scenic Viewpoint X X X
Sports Facilities: (parks, playgrounds, Golf Club, Country Club
X X
Water skiing X X X
Wind Surfing X X X
Page 154 of 332

List of References References Description
Perimeter Lake Design Concept Workshop Presentation Tetra Tech, January 20, 2016
• Total levee length: 61 miles ▪ Plus 6 miles of connector levees • Total lake area: 36 square miles (23,000 acres) ▪ 10 sq mi in Riverside County, 26 sq mi in Imperial County • About 115 miles of shallow habitat along the shoreline and levee • Deep water habitat up to 25’ • Treatment wetlands proposed to cleanup inflow • Initial flushing could be used clean out existing detritus • Constructed one cell at a time ▪ Connector dikes can be breached for connectivity ▪ Floating bridge or small ferry could be used for service • Dredging allows access to existing marinas • Constructability analysis and construction scenario in development ▪ Use of project specific dredges ▪ Detailed feasibility level cost analysis nearly complete • Water expected to be brackish: 15‐20 PPT • Seepage barrier included to minimize losses and for structural integrity • 25,000 acre footprint with no dust concerns
Recreation and Economic Opportunities Assessment for the Salton Sea, California The Salton Sea Authority Draft ‐ August 2005
The Authority lists specific recreational activities, user areas, facilities, services, and other amenities, consistent with the ecosystem management focus of the program, that address protection and possible enhancement of recreation values surrounding the Salton Sea. ... Today, the Sea remains extremely popular for bird watching, camping, and fishing. Although opportunities are plentiful for boating, swimming, and water skiing, these activities have markedly declined since the early 1960s."
Draft SSWIFT Concept PowerPoint Presentation Tetra Tech, Sep 14 2015
• Total levee length: ~65 mi• Total lake area: 36 sq mi ▪ Riverside County: 10 sq mi ▪ Imperial County: 26 sq mi • Total of 12 spur levees that connect to existing roads • Annual evaporation (Inflow requirement): 140,000 AFY
Page 155 of 332

Salton Sea Restoration and Renewable Energy InitiativeExecutive White PaperFramework for a Smaller Sustainable Salton SeaImperial Irrigation District and County of ImperialDraft ‐ July 2015
Comprehensive Vision. Five Goals: 1. Ensuring Water Supply Reliability for California. 2. Protect California's Health3. Carbon‐free Energy4. Ecosystem Protection and Restoration5. Economic GrowthImplementation Plan: • Short‐term (2016‐2017) Projects that are shovel ready and have immediate impact. • Medium‐term (2018‐2023) Projects that will take effect when the Salton Sea water supply changes. • Long‐term (2024+) Projects that will sustain the goals of the plan for long‐term human, ecosystem, and economic health.
Salton Sea Funding and Feasibility Action PlanBenchmark 3: Evaluation of Alternatives With Respect to Existing Conditions Tetra Tech June 2015
Review of Salton Sea restoration alternatives. Considering a set of eight alternatives, a Preferred Alternative was outlined in detail in 2007. The Preferred Alternative takes aspects from many of the alternatives evaluated and includes: • Saline Habitat Complex in the northern and southern seabed, • A Marine Sea that extends around the northern shoreline from San Felipe Creek to Bombay Beach in a “horseshoe” shape, • Air Quality Management facilities to reduce particulate emissions from the exposed playa, • Brine sink for discharge of salts, • Sedimentation/Distribution facilities, and • Early Start Habitat to provide habitat prior to construction of the habitat components. • The Preferred Alternative also could be configured to accommodate future geothermal development. The Bureau of Reclamation, in September 2007, responded to the Water Supply Reliability and Environmental Improvement Act 361) by performing a feasibility study to determine a preferred alternative action for restoring the Salton Sea with six different alternatives: 1. Mid‐Sea Dam with North Marine Lake 2. Mid‐Sea Barrier with South Marine Lake 3. Concentric Lakes 4. North‐Sea Dam with Marine Lake 5. Habitat Without Marine Lake 6. No Project Other Restoration Concepts describing early planning concepts
Page 156 of 332

Salton Sea Master Development Plan Mooney, Jones, and Stokes February 2006
Master Development Plan"The MDP will be the framework that jurisdictions within the Salton Sea Authority Infrastructure Financing District boundary (SSA boundary) would utilize to plan future land uses and development to help finance the Revitalization Plan and to ensure the long‐term sustainability of the area over the next 30 – 50 years.Approximately 200,000 new dwelling units have been factored into the MDP planning area. The MDP area is organized into six Planning Districts. Generally, the approximate allocation of land uses within the MDP planning area is: 25 percent developed, 25 percent agriculture and 50 percent open space. The western districts will be more intensely urbanized than the eastern Districts. Each District will include communities adjacent to the Salton Sea, also known as “seaside villages”. These villages would incorporate elements of New Urbanism and Smart Growth including mixed‐used communities, compact urban centers, pedestrian orientated streets and a sense of place."
Travertine Point Specific Plan (Riverside and Imperial County) February 2012 ‐ Final
Section 3.1, Land Use Plan and Section 3.2, Specific Plan Districts and Development Standards
U.S. Fish & Wildlife Service, Pacific Southwest Region, and Sonny Bono Salton Sea National Wildlife Refuge Complex, (approved March 6, 2014) “Final Sonny Bono Salton Sea National Wildlife Refuge (NWR) Complex Comprehensive Plan and Environmental Assessment (EA)”
Complex Comprehensive Plan
http://www.fws.gov/refuge/sonny_bono_salton_sea/ U.S. Fish and Wildlife Service Website for Sonny Bono Salton Sea National Wildlife Refuge
http://www.parks.ca.gov/?page_id=639
Salton Sea State Recreation Area Website
http://www.palmspringslife.com/Palm‐Springs‐Life/April‐2013/At‐Salton‐Sea‐North‐Shore‐Yacht‐Club‐is‐Alive/)
Status of North Shore Yacht Club
Page 157 of 332

BENCHMARK 5:
INFRASTRUCTURE FINANCING
FEASIBILITY ANALYSIS
Appendix 4: Market Study and Land Use
Analysis to Assess the Real
Estate Impact of Restoring the
Salton Sea to a Viable
Recreational Resource
Page 158 of 332

369 SAN MIGUEL DRIVE, SUITE 265 NEWPORT BEACH, CALIFORNIA 92660 PHONE 949.717.6450 FAX 949.717.6444 251 KEARNY STREET, 6TH FLOOR SAN FRANCISCO, CALIFORNIA 94108 PHONE 415.397.5490 FAX 415.397.5496
641 LEXINGTON AVE, SUITE 1400 NEW YORK, NY 10022 PHONE 212.535.2226 1170 PEACHETREE STREET NE, SUITE 1200 ATLANTA, GEORGIA 30309 PHONE 404.879.5000
MARKET STUDY AND LAND USE ANALYSIS TO
ASSESS THE REAL ESTATE IMPACT OF RESTORING
THE SALTON SEA TO A VIABLE RECREATIONAL
RESOURCE
DRAFT REPORT MAY 12, 2016
PREPARED FOR: SALTON SEA ACTION COMMITTEE
Page 159 of 332

SALTON SEA ACTION COMMITTEE Page 1 May 2016 15259.00
LIST OF EXHIBITS
I. SUMMARY 1. Regional Location 2. Market Analysis Methodology 3. Key Regional Trends 4. Urbanized Land Trends 5. Population Trends by County 6. Home Price Trends by County 7. Summary of Demographic Trends 8. Traffic Counts at Selected Locations 9. Residential Market Overview 10. Industrial Market Overview
A. Riverside County B. Imperial County
11. Hotel Market Overview
A. Riverside County B. Imperial County
Page 160 of 332

SALTON SEA ACTION COMMITTEE Page 2 May 2016 15259.00
12. Retail Market Overview A. Riverside County B. Imperial County
13. Office Market Overview
A. Riverside County B. Imperial County
14. Planned and Proposed Units
A. Riverside County B. Imperial County
15. Evaluation of Market Demand Potential and Potential Market Share Capture
A. Riverside County B. Imperial County
16. Recommended Development Program and Product Positioning
A. Riverside County B. Imperial County
17. Land Residual
A. Summary B. Per Product Type
i. Riverside County ii. Imperial County
18. Asset Trades
A. For Sale Residential B. Industrial C. Retail
Page 161 of 332

SALTON SEA ACTION COMMITTEE Page 3 May 2016 15259.00
II. SOCIO-ECONOMIC AND DEMOGRAPHIC TRENDS
1. Household Growth
2. Employment Growth
3. Annual Employment by Industry
4. Consumer Confidence Index
5. Gross Domestic Product
6. Per Capita Income
7. Birth Count
8. Unemployment Rate
9. Amusements, Recreation and Gambling Revenue III. RESIDENTIAL
1. Building Permits A. Riverside County B. Imperial County
2. New and Existing Home Closings - Volume
A. Riverside County B. Imperial County
Page 162 of 332

SALTON SEA ACTION COMMITTEE Page 4 May 2016 15259.00
3. New and Existing Home Closings – Median Price
A. Riverside County B. Imperial County
4. Regional Location Map
5. Submarket Performance
6. New Home Inventory Map
A. Riverside County B. Imperial County
7. New Home Inventory Table
A. Riverside County B. Imperial County
8. Planned and Proposed Units
A. Riverside County B. Imperial County
9. Price to Size Relationship
10. Analog Analysis
A. Historical Home Closings B. Historical Median Price C. New Home Inventory Map D. Performance E. Inventory Resale – Built Post 2000
Page 163 of 332

SALTON SEA ACTION COMMITTEE Page 5 May 2016 15259.00
IV. INDUSTRIAL
1. Map of Major Industrial – Current and Planned A. Riverside County B. Imperial County
2. Industrial Macro Market Performance
A. Riverside County B. Imperial County
3. Submarket Comparison
4. Industrial Inventory Table
A. Riverside County B. Imperial County
5. Future Industrial Supply
A. Riverside County B. Imperial County
6. Comparison of Lease Rates of Selected Industrial Developments
V. HOSPITALITY/RESORT
1. Location of Selected Casinos
2. Location of Selected Hotels – Current and Planned
A. Riverside County B. Imperial County
Page 164 of 332

SALTON SEA ACTION COMMITTEE Page 6 May 2016 15259.00
3. Summary Characteristics of Selected Hotels
A. Riverside County B. Imperial County
4. Summary Characteristics of Planned Hotel Developments
A. Riverside County B. Imperial County
5. Comparison of Daily Rates for Selected Hotels– Peak Season
A. Riverside County B. Imperial County
6. Hotel Inventory
A. Riverside County B. Imperial County
7. Hotel Demand
A. Riverside County B. Imperial County
8. Hotel Occupancy
A. Riverside County B. Imperial County
9. Hotel Revenue
A. Riverside County B. Imperial County
Page 165 of 332

SALTON SEA ACTION COMMITTEE Page 7 May 2016 15259.00
VI. RETAIL
1. Taxable Retail Sales A. Riverside County B. Imperial County
2. Retail Gap Analysis
3. Map of Major Retail – Current and Planned
A. Riverside County B. Imperial County
4. Retail Macro Market Performance
A. Riverside County B. Imperial County
5. Submarket Comparison
6. Retail Inventory Table
A. Riverside County B. Imperial County
7. Future Retail Supply
A. Riverside County B. Imperial County
8. Comparison of Lease Rates of Selected Retail Developments
Page 166 of 332

SALTON SEA ACTION COMMITTEE Page 8 May 2016 15259.00
VII. OFFICE
1. Map of Major Office – Current and Planned A. Riverside County B. Imperial County
2. Office Macro Market Performance
A. Riverside County B. Imperial County
3. Submarket Comparison
4. Office Inventory Table – Built Before and After 2000
A. Riverside County B. Imperial County
5. Future Office Supply
A. Riverside County B. Imperial County
6. Comparison of Lease Rates of Selected Office Developments
VIII. APPENDICES
A. Residential Survey – New Homes B. Residential Planned and Proposed C. Analog Survey – New Homes D. Analog Survey - Resales
Page 167 of 332

The Concord Group
I. SUMMARY
Page 168 of 332

EXHIBIT I-1
REGIONAL LOCATIONCOACHELLA VALLEY
FEBRUARY 2016
Southern California market is made up of the highlighted 7 counties:
- Ventura- Los Angeles- Orange- San Bernardino- Riverside-San Diego- Imperial
The redeveloped Salton Sea can serve as a new recreational destination for the region.
15529.00 Maps:RegLoc Page 1 of 6 The Concord GroupPage 169 of 332

EXHIBIT I-1
REGIONAL LOCATIONCOACHELLA VALLEY
FEBRUARY 2016
The Southern California market is made up of the following 7 counties:- Ventura- Los Angeles- Orange- San Bernardino- Riverside-San Diego- Imperial
The highlighted counties (Riverside, San Bernardino, Los Angeles, and Orange) represent the primary counties where demand will be sourced following the redevelopment for the north portion of the Salton Sea.
15529.00 Maps:RegLoc Page 2 of 6 The Concord GroupPage 170 of 332

EXHIBIT I-1
REGIONAL LOCATION9 CITIES, RIVERSIDE COUNTY
FEBRUARY 2016
The highlighted areas are the 9 Cities of Coachella Valley, they are comprised of the following:
- Desert Hot Springs- Palm Springs- Cathedral City- Rancho Mirage- Palm Desert- Indian Weells- La Quinta- Indio-Coachella
Highlighting Red to Purple indicates distance from the north portion of the Salton Sea. Red being the closest, purple being the furthest.
15529.00 Maps:RegLoc Page 3 of 6 The Concord GroupPage 171 of 332

EXHIBIT I-1
REGIONAL LOCATIONCOACHELLA VALLEY
FEBRUARY 2016
The highlighted areas are the North, West, Central, and East Coachella Valley geographies, they are comprised of the following Cities and zip codes:
- North Valley: Desert Hot Springs, Thousand Palms, North Palm Springs (92240, 92276, 92282, 92241)- West Valley: Cathedral City, Palm Springs (92234, 92262, 62263, 92264, 92235, 92292)- Central Valley: La Quinta, Palm Desert, Rancho Mirage, Indian Wells (92253, 92260, 92261, 92270, 92210, 92202, 92211)- East Valley: Coachella, Thermal, Mecca, Indio, Bermuda Dunes (92203, 92201, 92202, 92236, 9274, 92254)
East Valley
Central Valley
West Valley
North Valley
This map divides the Coachella Valley up into four submarkets by zip code. The Opportunity Areas in Phase I fall within East Valley and will be compared to the other three in respect to the residential market and demographics.
15529.00 Maps:RegLoc Page 4 of 6 The Concord GroupPage 172 of 332

EXHIBIT I-1
REGIONAL LOCATIONWEST SHORES / SALTON CITY
MARCH 2016
Source: FORMA
Salton City
Salton SeaBeach
Desert Shores
The highlighted areas are the West Shores / Salton City urban area of Imperial County. This area is comprised of the following unincorporated townships:
- Desert Shores‐ Salton Sea Beach- Salton City
15529.00 Maps:RegLoc Page 5 of 6 The Concord GroupPage 173 of 332

EXHIBIT I-1
REGIONAL LOCATIONPHASE I & 2 OPPORTUNITY AREAS
MARCH 2016
Source: FORMA
Se Next Page for Phase I Opportunity Areas
15529.00 Maps:RegLoc Page 6 of 6 The Concord GroupPage 174 of 332

EXHIBIT I-2
MARKET ANALYSIS METHODOLOGYSALTON SEA
FEBRUARY 2016
PRODUCT TYPES UNDER CONSIDERATION
RESIDENTIAL INDUSTRIAL HOTEL/RESORT RETAIL OFFICE
SPHERE OF INFLUENCE
Coachella Valley/ Inland Empire/ Western US Coachella Valley/ Inland Empire/Imperial County/SoCal Imperial County/Mexicali Imperial Valley Imperial County
DRIVERS OF DEVELOPMENT
Age Wave/Boomers NAFTA Highway US & Regional Economy Population Growth Regional EconomyJob Growth Regional Industries Gaming Tourism Job Growth
Rising Home Prices Job Growth Amenity Traffic Counts Rising Office Rents
KEY CONSIDERATIONS
Salton Sea Redevelopment Future of 86S Development Salton Sea Remediation Retail Center Type/Size Office Class TypeInventory - Current & Planned Fit with Other Uses Future Expansion of Gaming Accessibility CV Vacancy Rates
Primary vs. Second Home Flex vs. Warehouse Resort vs. Budget Sufficient Density/Traffic? Target Industries?High/Medium/Low DensityLack of Current Services
CATALYSTS - POTENTIAL UPSIDE
Competitive Pricing Increased Truck Traffic Casino Development Synergy of Uses Competitive RentsWater Views Along NAFTA Highway Placemaking Internal Growth Regional Growth
Proximity to CV Proximity to 10 Freeway Water Amenity Increasing Traffic Synergy of UsesPossible Expansion of 86S Secluded Location
The following outlines The Concord Group's methodologies and considerations for all phases.
15259.00 Methodology: Summ The Concord GroupPage 175 of 332

EXHIBIT I-3
KEY REGIONAL TRENDSSOUTHERN CALIFORNIA
FEBRUARY 2016
Source: CA DOT, BTS, SCAG
Coachella Valley● Number of households and employment projected to nearly double between 2005
and 2035● As Valley gets increasingly built-out
(and less affordable), development moving to eastern and western fringes
LA/Orange Counties● Increasing housing affordability issues
● Rising home and commercial prices continue to push development east
Mexicali● Employment = 562,000
● Over 54,000 employed in maquiladoras
● Improving infrastructure and increasing development
Salton Sea● Long-term restoration plan
currently being discussed/ analyzed● Initial restoration bill (Senate Bill
187) approved ● Revitalization would bring jobs,
homes and tourists to area
"NAFTA Highway"● Beginning at Calexico East border crossing,
runs past subject site● Current traffic in front of subject site =
approximately 13,000 vehicles/day, with 3,300 trucks
● No current plans for major upgrade of 86S
Calexico East Border Crossing● Opened 1996,
252,000 trucks crossed in 2015, down 10% from 2000 crossings
● Value of trade crossing at border in 2005 = $11 Billion
Imperial County● Number of households and
employment projected to nearly double between 2005 and 2035
● One of most affordable housing areas in all of Southern
Inland Empire● Strong household and employment
growth projected to continue● Key logistics/distribution area of
Southern California
15529.00 Maps: Key Trends The Concord GroupPage 176 of 332

EXHIBIT I-4
URBANIZED LAND TRENDSSOUTHWESTERN UNITED STATES
2000 TO 2050
Source: SCAG
15529.00 Maps: Urban Growth Page 1 of 3 The Concord GroupPage 177 of 332

EXHIBIT I-4
URBANIZED LAND TRENDSSOUTHWESTERN UNITED STATES
2000 TO 2050
Source: SCAG
15529.00 Maps: Urban Growth Page 2 of 3 The Concord GroupPage 178 of 332

EXHIBIT I-4
URBANIZED LAND TRENDSSOUTHWESTERN UNITED STATES
2000 TO 2050
Source: SCAG
15529.00 Maps: Urban Growth Page 3 of 3 The Concord GroupPage 179 of 332

EXHIBIT I-5
POPULATION TRENDS BY COUNTYSOUTHERN CALIFORNIA
2005 TO 2035
Source: SCAG
San Bernardino● 2.02 MM - 2008● 2.75 MM - 2035
● 1.2% Annual Growth
Riverside● 2.13 MM - 2008● 3.32 MM - 2035
● 1.7% Annual Growth
Imperial● 170K - 2008● 288K - 2035
● 2.0% Annual Growth
San Diego● 3.13 MM - 2008● 4.03 MM - 2035
● 0.9% Annual Growth
Los Angeles● 9.78 MM - 2008
● 11.35 MM - 2035● 0.6% Annual Growth
Ventura● 813K - 2008● 954K - 2035
● 0.6% Annual Growth
Orange● 2.99 MM - 2008● 3.42 MM - 2035
● 0.5% Annual Growth
Key:
County● Population - 2008● Population - 2035
● Annual Growth 2008- 2035 (%)
15529.00 Maps: Population - County 2016 The Concord GroupPage 180 of 332

EXHIBIT I-6
HOME PRICES BY COUNTYSOUTHERN CALIFORNIA
THIRD QUARTER 2015
Source: SCAG
San Bernardino● $440K - New
● $255K - Resale● 74% Price Growth
Riverside● $383K - New
● $300K - Resale● 33% Price Growth
Imperial● $252K - New
● $185K - Resale● 28% Price Growth
San Diego● $625K - New
● $460K - Resale● 37% Price Growth
Los Angeles● $565K - New
● $490K - Resale● 46% Price Growth
Ventura● $495K - New
● $505K - Resale● 39% Price Growth
Orange● $824K - New
● $600K - Resale● 46% Price Growth
Key:
County● Median New Home Price (Q3 '15)
● Median Resale Home Price (Q3 '15)● % Growth - New Home Price '11-'15
15529.00 Maps: Home Price - County 2016 The Concord GroupPage 181 of 332

EXHIBIT I-7
DEMOGRAPHICSCOACHELLA VALLEY
2010, 2016, AND 2021
North Valley (1) West Valley (2) Central Valley (3) East Valley (4) 9 Cities Coachella Valley Southern CaliforniaGeography: Num. Perc. Num. Perc. Num. Perc. Num. Perc. Num. Perc. Num. Perc. Num. Perc.
Population2010 52,846 95,752 115,861 166,511 346,518 441,802 21,146,8472016 58,712 101,369 124,809 182,400 376,808 477,703 22,290,209
Gr./ Yr. 978 1.8% 936 1.0% 1,491 1.2% 2,648 1.5% 5,048 1.4% 5,984 1.3% 190,560 0.9%2021 63,390 106,331 132,258 195,516 400,356 508,038 23,336,469
Gr./ Yr. 936 1.5% 992 1.0% 1,490 1.2% 2,623 1.4% 4,710 1.2% 6,067 1.2% 209,252 0.9%
Households2010 18,752 39,735 53,699 44,934 129,987 158,563 6,934,7742016 20,582 42,444 57,516 49,091 140,763 171,136 7,293,762
Gr./ Yr. 305 1.6% 452 1.1% 636 1.2% 693 1.5% 1,796 1.3% 2,096 1.3% 59,831 0.8%2021 22,087 44,715 60,895 52,651 149,399 181,949 7,642,838
Gr./ Yr. 301 1.4% 454 1.0% 676 1.1% 712 1.4% 1,727 1.2% 2,163 1.2% 69,815 0.9%
Household Size ('16) 2.9 2.4 2.2 3.7 2.7 2.8 3.11-2 Persons 11,770 57% 29,319 69% 43,512 76% 18,741 38% 87,577 62% 104,494 61% 3,646,731 50%3+ Persons 8,812 43% 13,125 31% 14,004 24% 30,350 62% 53,186 38% 66,642 39% 3,647,031 50%
Average Income2000 $36,988 $53,546 $78,138 $45,485 $60,224 $57,663 $63,4432016 $47,294 $65,504 $89,609 $61,374 $73,149 $70,361 $86,855
Gr./ Yr. $644 1.5% $747 1.3% $717 0.9% $993 1.9% $808 1.2% $794 1.3% $1,463 2.0%2021 $50,733 $69,959 $96,126 $66,153 $78,497 $75,458 $94,141
Gr./ Yr. $688 1.4% $891 1.3% $1,303 1.4% $956 1.5% $1,070 1.4% $1,019 1.4% $1,457 1.6%
Income Profile ('16)Over $50K 6,832 33% 18,907 45% 32,693 57% 21,839 44% 69,008 49% 80,994 47% 4,235,339 58%Over $75K 3,411 17% 11,716 28% 22,604 39% 13,184 27% 44,562 32% 51,424 30% 3,013,891 41%Over $100K 1,952 9% 7,628 18% 16,424 29% 8,197 17% 30,370 22% 34,547 20% 2,132,156 29%
Age Profile ('16)Median - Population 36.7 45.4 57.0 30.7 41.1 40.4 36.0Householder
Under 24 787 4% 1,031 2% 912 2% 1,463 3% 3,973 3% 4,935 3% 230,365 3%25-34 2,786 14% 4,225 10% 3,826 7% 5,952 12% 16,650 12% 20,572 12% 1,116,728 15%35-44 3,270 16% 5,305 12% 6,150 11% 7,640 16% 19,604 14% 23,889 14% 1,402,942 19%45-54 3,592 17% 7,919 19% 5,808 10% 4,888 10% 23,772 17% 28,353 17% 1,524,344 21%55-64 3,686 18% 8,804 21% 6,346 11% 3,818 8% 26,135 19% 30,967 18% 1,383,223 19%65 Plus 6,461 31% 15,160 36% 16,091 28% 6,533 13% 50,629 36% 62,420 36% 1,636,160 22%
(1) North Valley geographies are defined by the following zip codes: 92240, 92276, 92282, 92241(2) West Valley geographies include 92234, 92262, 62263, 92264, 92235, 92292(3) Central Valley geographies are defined by the following zip codes: 92253, 92260, 92261, 92270, 92210, 92202, 92211(4) East Valley geographies are defined by the following zip codes: 92203, 92201, 92202, 92236, 9274, 92254Source: Claritas
Coachella Valley population and household Growth rates suprpass
Southern California.
15259.00 Demos:DemoCL Page 1 of 3 THE CONCORD GROUPPage 182 of 332

EXHIBIT I-7
SUMMARY OF DEMOGRAPHIC TRENDSCOACHELLA VALLEY
2010, 2016, AND 2021
Cathedral City Coachella Desert Hot Springs Indian Wells Indio La Quinta Palm Desert Palm Springs Rancho Mirage Thermal / Mecca 9 Cities Coachella ValleyGeography: Num. Perc. Num. Perc. Num. Perc. Num. Perc. Num. Perc. Num. Perc. Num. Perc. Num. Perc. Num. Perc. Num. Perc. Num. Perc. Num. Perc.
Population2010 51,200 40,704 25,938 4,958 76,036 37,467 48,445 44,552 17,218 11,442 346,518 441,8022016 54,202 45,240 29,013 5,467 84,410 41,996 50,676 47,167 18,637 12,703 376,808 477,703
Gr./ Yr. 500 1.0% 756 1.8% 513 1.9% 85 1.6% 1,396 1.8% 755 1.9% 372 0.8% 436 1.0% 237 1.3% 210 1.8% 5,048 1.4% 5,984 1.3%2021 56,885 48,921 31,195 5,653 90,591 45,079 52,947 49,446 19,639 13,791 400,356 508,038
Gr./ Yr. 537 1.0% 736 1.6% 436 1.5% 37 0.7% 1,236 1.4% 617 1.4% 454 0.9% 456 0.9% 200 1.1% 218 1.7% 4,710 1.2% 6,067 1.2%
Households2010 17,045 9,064 8,569 2,582 23,365 14,634 23,286 22,690 8,752 2,556 129,987 158,5632016 18,140 9,707 9,358 2,858 26,063 16,301 24,500 24,304 9,532 2,694 140,763 171,136
Gr./ Yr. 183 1.0% 107 1.1% 132 1.5% 46 1.7% 450 1.8% 278 1.8% 202 0.9% 269 1.2% 130 1.4% 23 0.9% 1,796 1.3% 2,096 1.3%2021 19,057 10,428 9,975 2,968 28,077 17,483 25,672 25,658 10,081 2,890 149,399 181,949
Gr./ Yr. 183 1.0% 144 1.4% 123 1.3% 22 0.8% 403 1.5% 236 1.4% 234 0.9% 271 1.1% 110 1.1% 39 1.4% 1,727 1.2% 2,163 1.2%
Household Size ('16) 3.0 4.7 3.1 1.9 3.2 2.6 2.1 1.9 2.0 4.7 2.7 2.81-2 Persons 9,601 53% 1,586 16% 4,620 49% 2,451 86% 12,206 47% 10,324 63% 19,159 78% 19,718 81% 7,912 83% 452 17% 87,577 62% 104,494 61%3+ Persons 8,539 47% 8,121 84% 4,738 51% 407 14% 13,857 53% 5,977 37% 5,341 22% 4,586 19% 1,620 17% 2,242 83% 53,186 38% 66,642 39%
Average Income2000 $50,843 $36,886 $34,864 $110,997 $46,592 $74,946 $68,694 $55,417 $101,615 $40,495 $60,224 $57,6632016 $62,434 $53,011 $42,756 $112,308 $67,761 $97,884 $79,699 $67,796 $101,395 $36,024 $73,149 $70,361
Gr./ Yr. $724 1.3% $1,008 2.3% $493 1.3% $82 0.1% $1,323 2.4% $1,434 1.7% $688 0.9% $774 1.3% -$14 0.0% -$279 -0.7% $808 1.2% $794 1.3%2021 $65,827 $56,930 $46,066 $122,032 $73,064 $104,221 $85,883 $73,028 $109,664 $38,141 $78,497 $75,458
Gr./ Yr. $679 1.1% $784 1.4% $662 1.5% $1,945 1.7% $1,061 1.5% $1,267 1.3% $1,237 1.5% $1,046 1.5% $1,654 1.6% $423 1.1% $1,070 1.4% $1,019 1.4%
Income Profile ('16)Over $50K 8,030 44% 3,845 40% 2,812 30% 1,707 60% 13,030 50% 10,118 62% 12,795 52% 10,877 45% 5,794 61% 536 20% 69,008 49% 80,994 47%Over $75K 4,789 26% 1,938 20% 1,344 14% 1,295 45% 8,435 32% 7,017 43% 8,468 35% 6,927 29% 4,349 46% 190 7% 44,562 32% 51,424 30%Over $100K 2,908 16% 974 10% 709 8% 1,081 38% 5,591 21% 5,113 31% 5,874 24% 4,720 19% 3,400 36% 86 3% 30,370 22% 34,547 20%
Age Profile ('16)Median - Population 37.2 26.7 32.1 64.6 33.9 47.0 55.5 52.9 63.6 26.5 41.1 40.4Householder
Under 24 476 3% 428 4% 492 5% 27 1% 884 3% 307 2% 698 3% 555 2% 106 1% 139 5% 3,973 3% 4,935 3%25-34 2,239 12% 2,220 23% 1,605 17% 108 4% 4,187 16% 1,540 9% 2,414 10% 1,986 8% 351 4% 652 24% 16,650 12% 20,572 12%35-44 2,881 16% 2,524 26% 1,767 19% 146 5% 5,012 19% 1,983 12% 2,362 10% 2,424 10% 505 5% 620 23% 19,604 14% 23,889 14%45-54 3,639 20% 2,161 22% 1,877 20% 251 9% 4,746 18% 2,839 17% 2,969 12% 4,280 18% 1,010 11% 583 22% 23,772 17% 28,353 17%55-64 3,409 19% 1,340 14% 1,756 19% 541 19% 4,286 16% 3,570 22% 4,048 17% 5,395 22% 1,790 19% 407 15% 26,135 19% 30,967 18%65 Plus 5,496 30% 1,034 11% 1,861 20% 1,785 62% 6,948 27% 6,062 37% 12,009 49% 9,664 40% 5,770 61% 293 11% 50,629 36% 62,420 36%
Source: Claritas
Annual Population growth in Thermal/Mecca surpassed population
growth in Coachella Valley from 2010 to 2016, and is expected to continue at the
same rate by 2021.
15259.00 Demos:DemoCL (9) Page 2 of 3 THE CONCORD GROUPPage 183 of 332

EXHIBIT I-7-B
DEMOGRAPHICSIMPERIAL COUNTY2010, 2016, AND 2021
West Shores / Salton CityDesert Shores Salton Sea Beach Salton City Imperial County Southern California
Geography: Num. Perc. Num. Perc. Num. Perc. Num. Perc. Num. Perc.
Population2010 1,104 422 3,763 174,528 21,146,8472016 1,197 678 4,272 182,277 22,290,209
Gr./ Yr. 16 1.4% 43 8.2% 85 2.1% 1,292 0.7% 190,560 0.9%2021 1,270 762 4,719 189,891 23,336,469
Gr./ Yr. 15 1.2% 17 2.4% 89 2.0% 1,523 0.8% 209,252 0.9%
Households2010 344 131 1,107 49,126 6,934,7742016 372 202 1,259 52,004 7,293,762
Gr./ Yr. 5 1.3% 12 7.5% 25 2.2% 480 1.0% 59,831 0.8%2021 394 224 1,403 54,346 7,642,838
Gr./ Yr. 4 1.2% 4 2.1% 29 2.2% 468 0.9% 69,815 0.9%
Household Size ('16) 3.2 3.4 3.4 3.5 3.11-2 Persons 163 44% 97 48% 707 56% 20,648 40% 3,646,731 50%3+ Persons 209 56% 105 52% 552 44% 31,356 60% 3,647,031 50%
Average Income2000 $26,449 $17,009 $28,335 $43,072 $63,4432016 $47,372 $51,881 $46,698 $62,603 $86,855
Gr./ Yr. $1,308 3.7% $2,180 7.2% $1,148 3.2% $1,221 2.4% $1,463 2.0%2021 $55,838 $60,971 $52,730 $71,470 $94,141
Gr./ Yr. $1,693 3.3% $1,818 3.3% $1,206 2.5% $1,773 2.7% $1,457 1.6%
Income Profile ('16)Over $50K 143 38% 74 37% 407 32% 23,968 46% 4,235,339 58%Over $75K 64 17% 45 22% 247 20% 15,885 31% 3,013,891 41%Over $100K 23 6% 22 11% 121 10% 9,666 19% 2,132,156 29%
Age Profile ('16)Median - Population 30.7 28.9 33.0 32.2 36.0Householder
Under 24 13 3% 12 6% 56 4% 1,897 4% 230,365 3%25-34 60 16% 33 16% 185 15% 8,154 16% 1,116,728 15%35-44 55 15% 35 17% 168 13% 9,304 18% 1,402,942 19%45-54 74 20% 33 16% 197 16% 10,143 20% 1,524,344 21%55-64 59 16% 31 15% 222 18% 9,944 19% 1,383,223 19%65 Plus 111 30% 58 29% 431 34% 12,562 24% 1,636,160 22%
Source: Claritas
Imperial County household and income growth rates suprpass
Southern California.
15259.00 Demos Ph. 2:DemoCL THE CONCORD GROUPPage 184 of 332

EXHIBIT I-8
TRAFFIC COUNTS AT SELECTED LOCATIONSCOACHELLA VALLEY
FEBRUARY 2016
ADT = 14,000
ADT = 14,500
ADT = 4,092
ADT = 27,551
ADT = 24,576
ADT = 99,245
ADT = 12,599
ADT = 12,090
15529.00 Maps:Traffic Counts The Concord GroupPage 185 of 332

EXHIBIT I-9-A
RESIDENTIAL MARKET OVERVIEWCOACHELLA VALLEY
FEBRUARY 2016
Supply Characteristics (2016):• 477,000 permanent residents - Coachella Valley (CV)• 170,000 permanent residents - East Coachella Valley (East CV)• 1,300 building permits issued in CV in 2014• 800 new home sales in CV• 375 new home sales in East CV submarket, representing
nearly half of new home sales in CV• Record new home prices in CV - $465K• $380k New home prices in East CV• 90,000 residential units in various stages of planning process
in CV, approximately half of proposed units are in East CV
Key Supply Trends:• Population of CV projected to grow by 2,800 people per year
from 2005 to 2035, for annual growth of 1.5%• New home sales volumes are increasing by 2% annually
since 2010• Resale volume below pre-Recession levels peaks but have been
increasing over the past 3 years• 10% ($15k) annual price appreciation in both CV and East CV
from 1996 to 2015• New home median prices have surpassed peak prices by
$17k
Source: Dataquick, SCAG, Claritas, US Department of Housing and Urban Development, Planning Departments
0
1,000
2,000
3,000
4,000
5,000
6,000
7,000
8,000
9,000
0
500
1,000
1,500
2,000
2,500
3,000
3,500
4,000
2000 2001 2002 2003 2004 2005 2006 2007 2008 2009 2010 2011 2012 2013 2014 2015
Bui
ldin
g P
erm
its
New
Hom
e Sa
les
New Home Sales - CV New Home Sales - East CV Building Permits
$0
$100,000
$200,000
$300,000
$400,000
$500,000
$600,000
0
500
1,000
1,500
2,000
2,500
3,000
3,500
4,000
1996 1997 1998 1999 2000 2001 2002 2003 2004 2005 2006 2007 2008 2009 2010 2011 2012 2013 2014 2015
New
Hom
e M
edia
n P
rice
New
Hom
e S
ales
New Home Sales - CV New Home Sales - East CV New Home Sales - East CV New Home Sales - CV
15259.00 Residential Snapshot: Res Summ The Concord GroupPage 186 of 332

EXHIBIT I-9-B
RESIDENTIAL MARKET OVERVIEWIMPERIAL COUNTY
MARCH 2016
Supply Characteristics (2016):• 182,000 permanent residents - Imperial County (IC)• 6,000 permanent residents - West Shores / Salton City• 246 building permits issued in IC in 2015• 163 new home sales in IC• $263k New home prices in IC• 154 units in approved in West Shores / Salton City
with the potential for 20,000 additional units to be developed
Key Supply Trends:• Strong household growth projections from 2005 to 2035
with an estimated annual growth rate of 2.4% • New home sales volumes show minimal increase (0.37% since 2010)
though historically sale volumes have been higher• Resale volume below pre-Recession levels peaks but have been
increasing over the past 3 years• Prices have increased modestly at 3% ($3k) annually
since the Recession• New home median prices have almost reached
peak prices ($40k below peak prices)
Source: Dataquick, SCAG, Claritas, US Department of Housing and Urban Development, Planning Departments
0
500
1,000
1,500
2,000
2,500
0
10,000
20,000
30,000
40,000
50,000
60,000
70,000
2000 2001 2002 2003 2004 2005 2006 2007 2008 2009 2010 2011 2012 2013 2014 2015
Bui
ldin
g P
erm
its
New
Hom
e Sa
les
New Home Sales - IC New Home Sales - So Cal Building Permits
$0
$100,000
$200,000
$300,000
$400,000
$500,000
$600,000
0
10,000
20,000
30,000
40,000
50,000
60,000
70,000
80,000
1996 1997 1998 1999 2000 2001 2002 2003 2004 2005 2006 2007 2008 2009 2010 2011 2012 2013 2014 2015
New
Hom
e M
edia
n P
rice
New
Hom
e S
ales
New Home Sales - IC New Home Sales - So Cal New Home Prices - So Cal New Home Prices - IC
15259.00 Residential Snapshot: Res Summ The Concord GroupPage 187 of 332

EXHIBIT I-10-A
INDUSTRIAL MARKET OVERVIEWCOACHELLA VALLEY
FEBRUARY 2016
Supply Characteristics:• Over 11 million s.f. of industrial
space throughout the Coachella Valley• 5 million s.f. of industrial space, 44%
of CV total throughout East CV• Market occupancy - 91%• Average lease rate - $8/sf/year• 246 square feet of industrial space per
industrial-using employee
Key Supply Trends:• Total industrial square footage has
grown by 8% since 2007• Occupancy rates have remained over 90%
in the past four years• No net deliveries since 2009 until 2015
when 95k s.f. was delivered• 5.3 million s.f. proposed in CV• Currently no industrial projects proposed in
East CV• Currently no inventory under construction
Source: CoStar; U.S. Census
-8.0%
-6.0%
-4.0%
-2.0%
0.0%
2.0%
4.0%
6.0%
9,800,000
10,000,000
10,200,000
10,400,000
10,600,000
10,800,000
11,000,000
11,200,000
11,400,000
2007 2008 2009 2010 2011 2012 2013 2014 2015
Em
plo
ymen
t Gro
wth
Tot
al I
nd
ust
rial
Sq
uar
e F
oota
ge
Industrial S.F. - CV IE Employment Growth
78%
80%
82%
84%
86%
88%
90%
92%
94%
96%
-200,000
-100,000
0
100,000
200,000
300,000
400,000
500,000
600,000
700,000
2008 2009 2010 2011 2012 2013 2014 2015
Occ
up
ancy
Rat
e
Sq
uar
e F
oota
ge
Net Absorption Deliveries Occupancy
15259.00 Industrial Snapshot: Summ The Concord GroupPage 188 of 332

EXHIBIT I-10-B
INDUSTRIAL MARKET OVERVIEWIMPERIAL COUNTY
MARCH 2016
Supply Characteristics:• Approximately 3.4 million s.f. of industrial
space throughout Imperial County• Market occupancy - 82%• Average lease rate - $4/sf/year• 180 square feet of industrial space per
industrial-using employee
Key Supply Trends:• Total industrial square footage has
grown by 11% since 2007• Average 5 year Occupancy has been 82%
historically Imperial County has been able to achieve over 90% occupancy rates
• 106k s.f. was delivered in 2014, prior to thisno deliveres were made since 2008
• Currently no industrial projects proposed in West Shores / Salton City
• No inventory under construction at this time
Source: CoStar; U.S. Census
-8.0%
-6.0%
-4.0%
-2.0%
0.0%
2.0%
4.0%
6.0%
2,900,000
3,000,000
3,100,000
3,200,000
3,300,000
3,400,000
3,500,000
3,600,000
2007 2008 2009 2010 2011 2012 2013 2014 2015
Em
plo
ymen
t Gro
wth
Tot
al I
nd
ust
rial
Sq
uar
e F
oota
ge
Industrial S.F. - IC IE Employment Growth
74%
76%
78%
80%
82%
84%
86%
88%
90%
92%
94%
-400,000
-300,000
-200,000
-100,000
0
100,000
200,000
300,000
2008 2009 2010 2011 2012 2013 2014 2015
Occ
up
ancy
Rat
e
Sq
uar
e F
oota
ge
Net Absorption Deliveries Occupancy
15259.00 Industrial Snapshot: Summ The Concord GroupPage 189 of 332

EXHIBIT I-11-A
HOTEL MARKET OVERVIEWCOACHELLA VALLEY
FEBRUARY 2016
Supply Characteristics:• 133 hotels• 14,440 rooms• Over 4,900 rooms in planned and proposed• 840 rooms under construction• 59% occupancy• $462 million hotel revenue annually• $148 average room rate
Key Supply Trends:• Moderate growth in inventory• Occupancy rising to 59%, after 3-year
decline from Recession• Real room rates are currently higher than
Peak rates, from $130 to $148• Approximately 2,300 planned rooms stalled,
47% of all planned and proposed rooms
Source: STR; U.S. Bureau of Economic AnalysisNote: Hotel revenue and personal income has been adjusted for inflation, as such, graphs reflect real revenue/income growth.
50%
52%
54%
56%
58%
60%
62%
64%
66%
-20.00%
-15.00%
-10.00%
-5.00%
0.00%
5.00%
10.00%
15.00%
20.00%
2001 2002 2003 2004 2005 2006 2007 2008 2009 2010 2011 2012 2013 2014 2015
Hot
el O
ccup
ancy
Tou
rist
/Hot
el R
even
ue G
row
th
Demand Growth Hotel Revenue Growth Hotel Occupancy
-20%
-15%
-10%
-5%
0%
5%
10%
15%
20%
0.0
20.0
40.0
60.0
80.0
100.0
120.0
140.0
160.0
2000 2001 2002 2003 2004 2005 2006 2007 2008 2009 2010 2011 2012 2013 2014
Hot
el R
even
ue/P
erso
nal
Inco
me
Gro
wth
Con
sum
er C
onfi
denc
e In
dex
Consumer Confidence Hotel Revenue Growth Income Growth - LA/OC
15259.00 Hotel Snapshot: Summ The Concord GroupPage 190 of 332

EXHIBIT I-11-B
HOTEL MARKET OVERVIEWIMPERIAL COUNTY
MARCH 2016
Supply Characteristics:• 39 hotels• 2,379 rooms• 108 rooms under construction• Currently no projects proposed• 52% occupancy• $32 million hotel revenue annually• $71 average room rate
Key Supply Trends:• Minimal growth in inventory• Occupancy rising to 52%, after 3-year
decline from Recession• Real room rates have increased
7% from previous year• Presently no rooms are planned or proposed
in West Shores / Salton City
Source: STR; U.S. Bureau of Economic AnalysisNote: Hotel revenue and personal income has been adjusted for inflation, as such, graphs reflect real revenue/income growth.
40%
42%
44%
46%
48%
50%
52%
54%
56%
-10.00%
-5.00%
0.00%
5.00%
10.00%
15.00%
20.00%
2011 2012 2013 2014 2015
Hot
el O
ccup
ancy
Tou
rist
/Hot
el R
even
ue G
row
th
Demand Growth Hotel Revenue Growth Hotel Occupancy
-10%
-5%
0%
5%
10%
15%
20%
0.0
10.0
20.0
30.0
40.0
50.0
60.0
70.0
80.0
90.0
100.0
2010 2011 2012 2013 2014
Hot
el R
even
ue/P
erso
nal
Inco
me
Gro
wth
Con
sum
er C
onfi
denc
e In
dex
Consumer Confidence Hotel Revenue Growth Income Growth - LA/OC
07122.00 Hotel Snapshot Ph. 2: Summ The Concord GroupPage 191 of 332

EXHIBIT I-12-A
RETAIL MARKET OVERVIEWCOACHELLA VALLEY
FEBRUARY 2016
Supply Characteristics:• Taxable retail sales of over $6 billion
in CV• Over 26 million s.f. of retail
throughout the CV• 2.4 mill s.f. of retain in East CV,
9% of CV • Market occupancy - 89%• Average lease rate - $16.6/sf/year• 58 square feet of retail per
resident (permanent and seasonal)
Key Supply Trends:• Total retail square footage has
grown by 7% since 2007• Occupancy rates have remained
at an average of 88% for the past 8 years• Over 1.8 million s.f. proposed
in CV, with 130,000 s.f. currently under construction
• 922,000 s.f. proposed in East CV,approximately half of CV total
Note: All historical revenues and valuations have been adjusted for inflation.Source: CoStar; Bureau of Labor Statistics
-8%
-6%
-4%
-2%
0%
2%
4%
6%
8%
$0
$1
$2
$3
$4
$5
$6
$7
2000 2001 2002 2003 2004 2005 2006 2007 2008 2009 2010 2011 2012 2013 2014
Em
ploy
men
t G
row
th
Tax
able
Ret
ail S
ales
(201
6 $s
, Bill
ion
$)
Taxable Retail Sales - CV* IE MSA Employment Growth
85%
86%
87%
88%
89%
90%
91%
92%
93%
23,000,000
23,500,000
24,000,000
24,500,000
25,000,000
25,500,000
26,000,000
26,500,000
27,000,000
2007 2008 2009 2010 2011 2012 2013 2014 2015 2016
Occ
upan
cy
Tot
al R
etai
l Squ
are
Foo
tage
Retail S.F. - CV Occupancy
15259.00 Retail Snapshot: Summ The Concord GroupPage 192 of 332

EXHIBIT I-12-B
RETAIL MARKET OVERVIEWIMPERIAL COUNTY
MARCH 2016
Supply Characteristics:• Taxable retail sales of over $3 billion
in IC• Over 7 million s.f. of retail
throughout IC• Market occupancy - 90%• Average lease rate - $14.25 sf/year• 41 square feet of retail per
resident (permanent and seasonal)
Key Supply Trends:• Total retail square footage has
grown 11% since 2007• Average occupancy since 2010
has been 91%• No projects planned or proposed in
West Shores/Salton Sea
Note: All historical revenues and valuations have been adjusted for inflation.Source: CoStar; Bureau of Labor Statistics
-8%
-6%
-4%
-2%
0%
2%
4%
6%
8%
$0
$1
$1
$2
$2
$3
$3
$4
$4
2000 2001 2002 2003 2004 2005 2006 2007 2008 2009 2010 2011 2012 2013 2014
Em
ploy
men
t G
row
th
Tax
able
Ret
ail S
ales
(201
6 $s
, Bill
ion
$)
Taxable Retail Sales - IC* IE MSA Employment Growth
86%
88%
90%
92%
94%
96%
98%
6,200,000
6,400,000
6,600,000
6,800,000
7,000,000
7,200,000
7,400,000
7,600,000
2007 2008 2009 2010 2011 2012 2013 2014 2015 2016
Occ
upan
cy
Tot
al R
etai
l Squ
are
Foo
tage
Retail S.F. - IC Occupancy
15259.00 Retail Snapshot: Summ The Concord GroupPage 193 of 332

EXHIBIT I-13-A
OFFICE MARKET OVERVIEWCOACHELLA VALLEY
FEBRUARY 2016
Supply Characteristics:• Over 8 million s.f. of office
throughout the CV• 1 million s.f. of office in East CV• Market occupancy - 90%• Average lease rate - $24/sf/year
111 square feet of office space peroffice-using employee
Key Supply Trends:• Total office square footage has
increased by 4%, 334k s.f. since 2007• Occupancy has remained at 90% for three
consecutive years• 463,000 s.f. proposed in CV of which 56%
or approximately 260,000 s.f. are locatedin East CV
Source: CoStar; U.S. Census
-8.0%
-6.0%
-4.0%
-2.0%
0.0%
2.0%
4.0%
6.0%
7,600,000
7,700,000
7,800,000
7,900,000
8,000,000
8,100,000
8,200,000
2007 2008 2009 2010 2011 2012 2013 2014 2015
Em
plo
ymen
t Gro
wth
Tot
al O
ffic
e S
qu
are
Foo
tage
Office S.F. - CV IE Employment Growth
78%
80%
82%
84%
86%
88%
90%
92%
-200,000
-150,000
-100,000
-50,000
0
50,000
100,000
150,000
200,000
250,000
300,000
2008 2009 2010 2011 2012 2013 2014 2015
Occ
up
ancy
Rat
e
Sq
uar
e F
oota
ge
Net Absorption CV Deliveries CV Occupancy
15259.00 Office Snapshot: Summ The Concord GroupPage 194 of 332
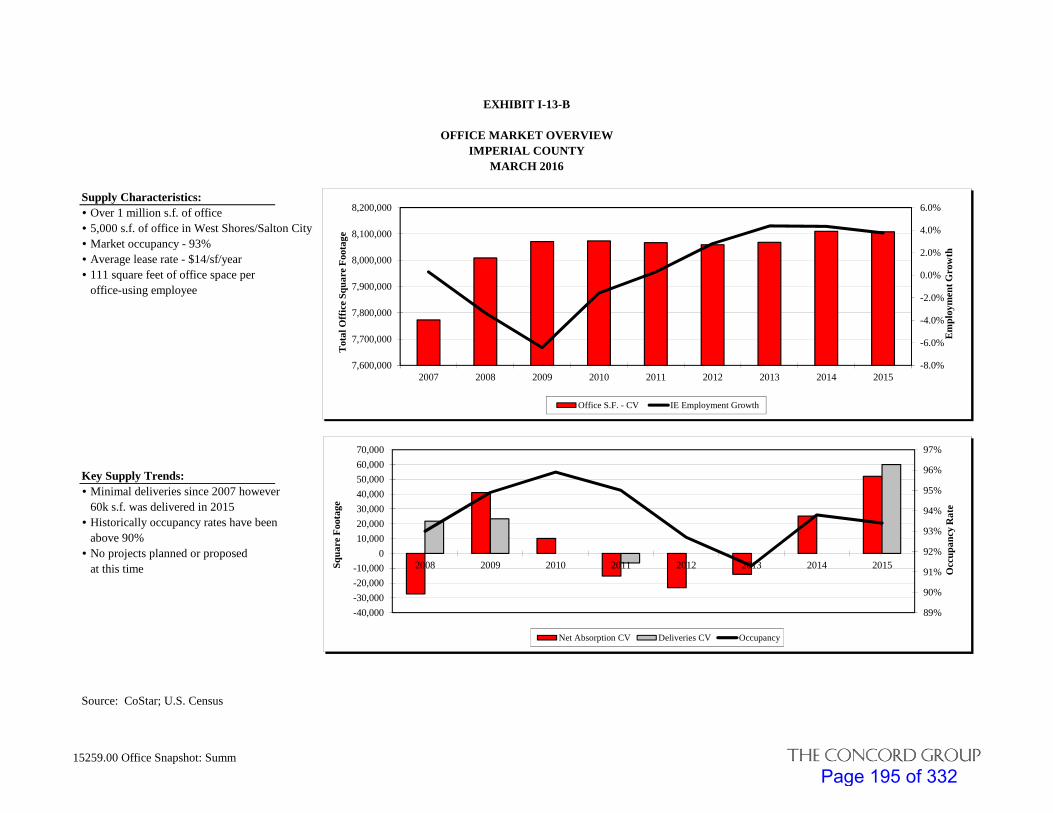
EXHIBIT I-13-B
OFFICE MARKET OVERVIEWIMPERIAL COUNTY
MARCH 2016
Supply Characteristics:• Over 1 million s.f. of office• 5,000 s.f. of office in West Shores/Salton City• Market occupancy - 93%• Average lease rate - $14/sf/year• 111 square feet of office space per
office-using employee
Key Supply Trends:• Minimal deliveries since 2007 however
60k s.f. was delivered in 2015• Historically occupancy rates have been
above 90%• No projects planned or proposed
at this time
Source: CoStar; U.S. Census
-8.0%
-6.0%
-4.0%
-2.0%
0.0%
2.0%
4.0%
6.0%
7,600,000
7,700,000
7,800,000
7,900,000
8,000,000
8,100,000
8,200,000
2007 2008 2009 2010 2011 2012 2013 2014 2015
Em
plo
ymen
t Gro
wth
Tot
al O
ffic
e S
qu
are
Foo
tage
Office S.F. - CV IE Employment Growth
89%
90%
91%
92%
93%
94%
95%
96%
97%
-40,000
-30,000
-20,000
-10,000
0
10,000
20,000
30,000
40,000
50,000
60,000
70,000
2008 2009 2010 2011 2012 2013 2014 2015
Occ
up
ancy
Rat
e
Sq
uar
e F
oota
ge
Net Absorption CV Deliveries CV Occupancy
15259.00 Office Snapshot: Summ The Concord GroupPage 195 of 332
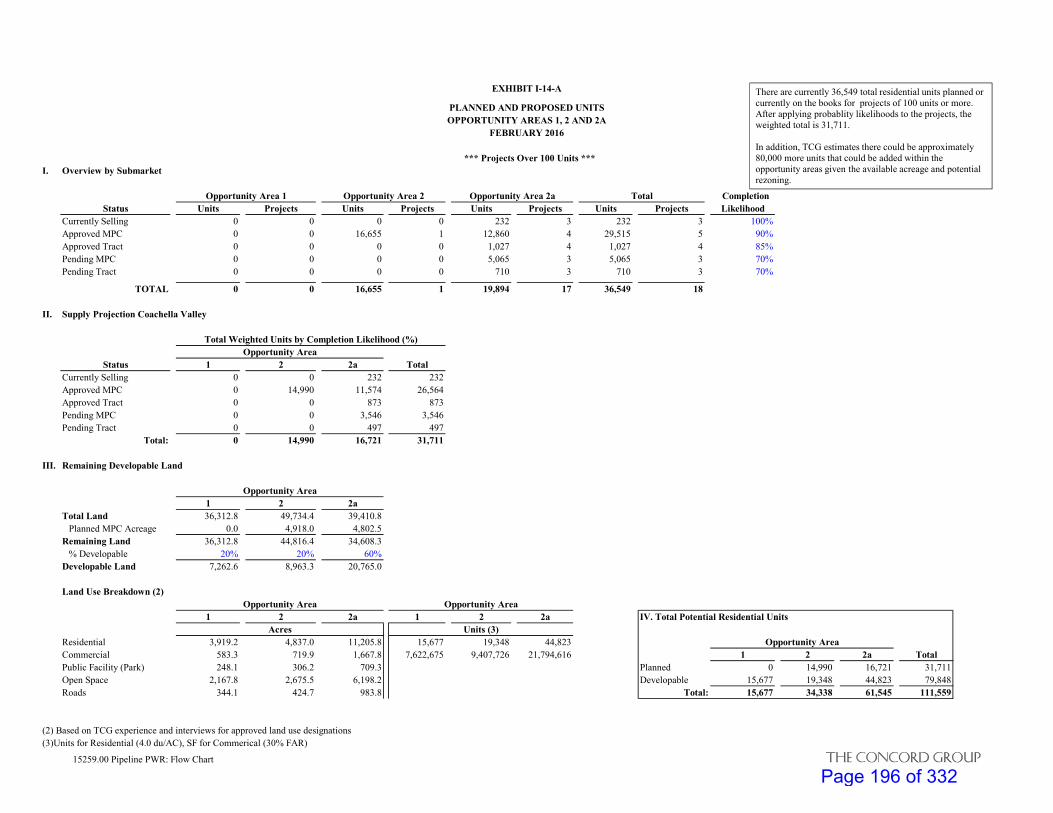
EXHIBIT I-14-A
PLANNED AND PROPOSED UNITSOPPORTUNITY AREAS 1, 2 AND 2A
FEBRUARY 2016
*** Projects Over 100 Units ***I. Overview by Submarket
Opportunity Area 1 Opportunity Area 2 Opportunity Area 2a Total CompletionStatus Units Projects Units Projects Units Projects Units Projects Likelihood
Currently Selling 0 0 0 0 232 3 232 3 100%Approved MPC 0 0 16,655 1 12,860 4 29,515 5 90%Approved Tract 0 0 0 0 1,027 4 1,027 4 85%Pending MPC 0 0 0 0 5,065 3 5,065 3 70%Pending Tract 0 0 0 0 710 3 710 3 70%
TOTAL 0 0 16,655 1 19,894 17 36,549 18
II. Supply Projection Coachella Valley
Total Weighted Units by Completion Likelihood (%)Opportunity Area
Status 1 2 2a TotalCurrently Selling 0 0 232 232Approved MPC 0 14,990 11,574 26,564Approved Tract 0 0 873 873Pending MPC 0 0 3,546 3,546Pending Tract 0 0 497 497
Total: 0 14,990 16,721 31,711
III. Remaining Developable Land
Opportunity Area1 2 2a
Total Land 36,312.8 49,734.4 39,410.8Planned MPC Acreage 0.0 4,918.0 4,802.5
Remaining Land 36,312.8 44,816.4 34,608.3% Developable 20% 20% 60%
Developable Land 7,262.6 8,963.3 20,765.0
Land Use Breakdown (2)Opportunity Area Opportunity Area
1 2 2a 1 2 2a IV. Total Potential Residential UnitsAcres Units (3)
Residential 3,919.2 4,837.0 11,205.8 15,677 19,348 44,823 Opportunity AreaCommercial 583.3 719.9 1,667.8 7,622,675 9,407,726 21,794,616 1 2 2a TotalPublic Facility (Park) 248.1 306.2 709.3 Planned 0 14,990 16,721 31,711Open Space 2,167.8 2,675.5 6,198.2 Developable 15,677 19,348 44,823 79,848Roads 344.1 424.7 983.8 Total: 15,677 34,338 61,545 111,559
(2) Based on TCG experience and interviews for approved land use designations(3)Units for Residential (4.0 du/AC), SF for Commerical (30% FAR)
There are currently 36,549 total residential units planned or currently on the books for projects of 100 units or more. After applying probablity likelihoods to the projects, the weighted total is 31,711.
In addition, TCG estimates there could be approximately 80,000 more units that could be added within the opportunity areas given the available acreage and potential rezoning.
15259.00 Pipeline PWR: Flow Chart THE CONCORD GROUP
Page 196 of 332

EXHIBIT I-14-B
PLANNED AND PROPOSED UNITSOPPORTUNITY AREA 3
MARCH 2016
I. Overview by Submarket
Salton City/Vista Del Mar (1) Other Opportunity Area 3 Total CompletionStatus Units Projects Units Projects Units Projects Likelihood
Currently Selling 0 0 0 0 0 0 100%Undeveloped Lots 17,897 0 0 0 17,897 0 95%Approved MPC 0 0 154 5 154 5 90%Approved Tract 0 0 0 0 0 0 90%Pending 0 0 0 0 0 0 85%
TOTAL 17,897 0 154 5 18,051 5
II. Supply Projection Opportunity Area 3
Total Weighted Units by Completion Likelihood (%)Status Opportunity Area 3
Currently Selling 0Approved MPC 139Approved Tract 0Pending 0Undeveloped Lots 17,002
17,141
III. Urban Area Development Vacant Parcels West Shores/Salton City Urban Area (4)
Townships/Specific Plan Acres RealSalton City 13,715.8 Zone Acres Max Units Unit Capacity Units/Acre MixDesert Shores 436 Medium Density (R3) 113.9 2,287 1,823 16 54%Salton Sea Beach 193 High Density (R4) 65.6 1,900 1,522 23 46%Habitat 2000 1,720 Total/Average: 179.5 4,187 3,345 20 100%Total 16,065
Land Use Breakdown (2) IV. Total Potential Residential UnitsUrban Area
TotalAcres Units (3) Opportunity Area 3 Mix
Residential 3,428.1 17,141 Planned 17,141 84%Commercial 527.7 6,896,607 Vacant Parcels 3,345 16%Public Facility (Park) 2,253.6Open Space 621.4 Total: 20,486 100%Roads 811.1
(1) Source: West Shores / Salton City Urban Area Plan 2000(2) Based on TCG experience and interviews for approved land use designations(3) Units for Residential (5.0 du/AC), SF for Commercial (30% FAR)(4) Source: Imperial County General Plan, Housing Element 2014
There are 154 total residential units planned. TCG estimates there is a potential 20,486
residential units that can be developed.
15259.00 Pipeline Ph. 2: Flow Chart Ph.2 Page 1 of 2 THE CONCORD GROUP
Page 197 of 332

EXHIBIT I-14-B
PLANNED AND PROPOSED UNITSOPPORTUNITY AREAS 4, 5 AND 6
FEBRUARY 2016
I. Overview by Submarket
Opportunity Area 4 (1) Opportunity Area 5 Opportunity Area 6 Total CompletionStatus Units Projects Units Projects Units Projects Units Projects Likelihood
Currently Selling 0 0 0 0 0 0 0 0 100%Approved MPC 0 0 0 0 0 0 0 0 90%Approved Tract 0 0 0 0 0 0 0 0 85%Pending MPC 0 0 0 0 0 0 0 0 70%Pending Tract 0 0 0 0 0 0 0 0 70%
TOTAL 0 0 0 0 0 0 0 0
II. Supply Projection Coachella Valley
Total Weighted Units by Completion Likelihood (%)Opportunity Area
Status 4 (1) 5 6 TotalCurrently Selling 0 0 0 0Approved MPC 0 0 0 0Approved Tract 0 0 0 0Pending MPC 0 0 0 0Pending Tract 0 0 0 0
Total: 0 0 0 0
III. Remaining Developable Land
Opportunity Area4 (1) 5 6
Total Land 36,529.4 26,609.9 39,068.6Planned MPC Acreage 0.0 0.0 0.0
Remaining Land 36,529.4 26,609.9 39,068.6% Developable 14% 51% 68%
Developable Land (1) 5,044.8 13,528.5 26,651.5IV. Total Potential Residential Units
Land Use Breakdown (2)Opportunity Area Opportunity Area Opportunity Area
4 (1) 5 6 4 (1) 5 6 4 (1) 5 6 TotalAcres Units (3) Planned 0 0 0 0
Residential 3,026.9 8,117.1 15,990.9 12,108 32,468 63,964 Developable 12,108 32,468 63,964 108,539Commercial 378.4 1,014.6 1,998.9 4,944,413 13,259,247 26,121,113 Total: 12,108 32,468 63,964 108,539Public Facility (Park) 756.7 2,029.3 3,997.7Open Space 529.7 1,420.5 2,798.4Roads 353.1 947.0 1,865.6
(1) Excludes Salton City Urban Plan that encompasses the northern portion of Opportunity Area 4(2) Based on TCG experience and interviews for approved land use designations(3)Units for Residential (3.0 du/AC), SF for Commerical (30% FAR)
There are currently no projects planned in Opportunity Areas 4, 5, and 6.
TCG estimates there could be approximately 108,500 more units that could be added within the opportunity areas given the available acreage and potential rezoning.
15259.00 Pipeline Ph. 2: Ph.3 Flow Chart Page 2 of 2 THE CONCORD GROUP
Page 198 of 332

EXHIBIT I-15-A
EVALUATION OF MARKET DEMAND POTENTIAL AND POTENTIAL CAPTURECOACHELLA VALLEY
2016-2062
PRODUCT TYPEDEMAND ANALYSIS RESIDENTIAL INDUSTRIAL HOTEL/RESORT RETAIL OFFICE
So. Cal (4-County) CV Industrial CV Office-Driver of Demand: Employment Employment 2/ SoCal Avg. Income CV Population Using Employment 1/
1 2016 Driver Value 7,933,170 108,660 $86,855 477,703 72,4402 2062 Projected Driver Value 9,628,433 192,151 $140,000 890,000 128,1003 Driver Annual Growth 36,854 1,815 $1,155 8,963 1,210
Factor of Comparison: CV New Home Sales (20-Yr Avg) 4/CV Industrial Space CV Hotel Rooms CV Retail Space CV Office Space4 Factor Value 2,117 11,433,450 14,440 26,372,051 8,122,571
Equilibrium Ratio: Jobs Per New Home Sale SF Per Employee Income Per Room SF Per Resident SF Per Employee5 3,748 105 $6.01 55 112
(1 divided by 4) (4 divided by 1) (1 divided by 4) (4 divided by 1) (4 divided by 1)
6 Annual New HH Demand Potential 2,300 homes 191,000 sf 190 rooms 213,000 sf 136,000 sf
Annual Supply Added - 2005 to 2014 (historical) 3/ 2,308 homes 101,056 sf 86 rooms 229,725 sf 41,850 sf
7 Total Demand Potential (2016-2035) 105,800 homes 8,786,000 sf 8,740 rooms 9,798,000 sf 6,256,000 sf
Opportunity Area 1, 2, 2a Potential Capture8 Target Market Share Capture 45.0% 60.0% 45.0% 40.0% 20.0%
% East Coachella of CV (Long Term Avg) 34.8% 68.1% 50.1% 15.7%
9 Annual Market Share Capture (2016-2062) 1,035 homes 114,600 sf 86 rooms 85,200 sf 27,200 sf
% Historical Annual Supply Added 44.8% 113.4% 99.4% 37.1% 65.0%
10 Total Market Share Capture (2016-2062) 47,610 homes 5,271,600 sf 3,933 rooms 3,919,200 sf 1,251,200 sf
Source: SCAG, CoStar, Claritas, Metrostudy, Planning Departments, TCGNotes:1/ Office-using employment - estimate based on office-using industries, and TCG projections of percent of industry that uses office space, per CoStar and broker interviews.2/ Industrial employment - estimate based on industrial-using industries, and TCG projections of percent of industry that uses office space, per CoStar and broker interviews.3/ Historical annual supply added figures for office and industrial space represent Coachella Valley s.f. only.4/ 20 Year Average excluding new home sales from 2009-2013
15259.00 Demand Ph2: Ph1.Capture The Concord GroupPage 199 of 332

EXHIBIT I-15-B
EVALUATION OF MARKET DEMAND POTENTIAL AND POTENTIAL CAPTUREIMPERIAL COUNTY
2016-2062
PRODUCT TYPEDEMAND ANALYSIS RESIDENTIAL INDUSTRIAL HOTEL/RESORT RETAIL OFFICE
Imperial County IC Industrial Imperial County IC Office-Driver of Demand: Population Employment 2/ SoCal Avg. Income Population Using Employment 1/
1 2016 Driver Value 186,622 61,763 $86,855 186,622 26,4702 2062 Projected Driver Value 335,990 109,410 $140,000 335,990 46,8903 Driver Annual Growth 3,247 1,036 $1,155 3,247 444
Factor of Comparison: IC New Home Sales (20-Yr Avg) 4/ IC Industrial Space IC Hotel Rooms IC Retail Space IC Office Space4 Factor Value 601 3,488,505 2,379 7,391,095 1,069,747
Equilibrium Ratio: Population Per New Home Sale SF Per Employee Income Per Room SF Per Resident SF Per Employee5 311 56 $36.51 40 40
(1 divided by 4) (4 divided by 1) (1 divided by 4) (4 divided by 1) (4 divided by 1)
6 Annual New HH Demand Potential 800 homes 59,000 sf 30 rooms 129,000 sf 18,000 sf
Annual Supply Added - 2005 to 2014 (historical) 3/ 727 homes 44,537 sf 29 rooms 89,755 sf 12,335 sf
7 Total Demand Potential (2016-2035) 36,800 homes 2,714,000 sf 1,380 rooms 5,934,000 sf 828,000 sf
Opportunity Area 3 Potential Capture8 Target Market Share Capture 30.0% 5.0% 100.0% 5/ 20.0% 10.0%
9 Annual Market Share Capture (2016-2062) 240 homes 2,950 sf 30 rooms 25,800 sf 1,800 sf
% Historical Annual Supply Added 33.0% 6.6% 103.4% 28.7% 14.6%
10 Total Market Share Capture (2016-2062) 11,040 homes 135,700 sf 1,380 rooms 1,186,800 sf 82,800 sf
Source: SCAG, CoStar, Claritas, Metrostudy, Planning Departments, TCGNotes:1/ Office-using employment - estimate based on office-using industries, and TCG projections of percent of industry that uses office space, per CoStar and broker interviews.2/ Industrial employment - estimate based on industrial-using industries, and TCG projections of percent of industry that uses office space, per CoStar and broker interviews.3/ Historical annual supply added figures for office and industrial space represent Imperial County s.f. only.4/ 20 Year Average excluding new home sales from 2009-20135/ Imperial County total capture exceeds 100% due to historical metrics being unrepresentative of development opportunity with the managed lake plan
15259.00 Demand Ph2: Ph2.Capture Page 1 of 3 The Concord GroupPage 200 of 332

EXHIBIT I-15-B
EVALUATION OF MARKET DEMAND POTENTIAL AND POTENTIAL CAPTUREIMPERIAL COUNTY
2016-2062
PRODUCT TYPEDEMAND ANALYSIS RESIDENTIAL INDUSTRIAL HOTEL/RESORT RETAIL OFFICE
Imperial County IC Industrial Imperial County IC Office-Driver of Demand: Population Employment 2/ SoCal Avg. Income Population Using Employment 1/
1 2016 Driver Value 186,622 61,763 $86,855 186,622 26,4702 2062 Projected Driver Value 335,990 109,410 $140,000 335,990 46,8903 Driver Annual Growth 3,247 1,036 $1,155 3,247 444
Factor of Comparison: IC New Home Sales (20-Yr Avg) 4/ IC Industrial Space IC Hotel Rooms IC Retail Space IC Office Space4 Factor Value 601 3,488,505 2,379 7,391,095 1,069,747
Equilibrium Ratio: Population Per New Home Sale SF Per Employee Income Per Room SF Per Resident SF Per Employee5 311 56 $36.51 40 40
(1 divided by 4) (4 divided by 1) (1 divided by 4) (4 divided by 1) (4 divided by 1)
6 Annual New HH Demand Potential 800 homes 59,000 sf 30 rooms 129,000 sf 18,000 sf
Annual Supply Added - 2005 to 2014 (historical) 3/ 727 homes 44,537 sf 29 rooms 89,755 sf 12,335 sf
7 Total Demand Potential (2016-2035) 36,800 homes 2,714,000 sf 1,380 rooms 5,934,000 sf 828,000 sf
Opportunity Area 4,5,6 Potential Capture8 Target Market Share Capture 25.0% 15.0% 20.0% 5/ 10.0% 5.0%
9 Annual Market Share Capture (2016-2062) 200 homes 8,850 sf 6 rooms 12,900 sf 900 sf
% Historical Annual Supply Added 27.5% 19.9% 20.7% 14.4% 7.3%
10 Total Market Share Capture (2016-2062) 9,200 homes 407,100 sf 276 rooms 593,400 sf 41,400 sf
Source: SCAG, CoStar, Claritas, Metrostudy, Planning Departments, TCGNotes:1/ Office-using employment - estimate based on office-using industries, and TCG projections of percent of industry that uses office space, per CoStar and broker interviews.2/ Industrial employment - estimate based on industrial-using industries, and TCG projections of percent of industry that uses office space, per CoStar and broker interviews.3/ Historical annual supply added figures for office and industrial space represent Imperial County s.f. only.4/ 20 Year Average excluding new home sales from 2009-20135/ Imperial County total capture exceeds 100% due to historical metrics being unrepresentative of development opportunity with the managed lake plan
15259.00 Demand Ph2: Ph3.Capture Page 2 of 3 The Concord GroupPage 201 of 332

EXHIBIT I-15-B
EVALUATION OF MARKET DEMAND POTENTIAL AND POTENTIAL CAPTUREIMPERIAL COUNTY
2016-2062
PRODUCT TYPEDEMAND ANALYSIS RESIDENTIAL INDUSTRIAL HOTEL/RESORT RETAIL OFFICE
Imperial County IC Industrial Imperial County IC Office-Driver of Demand: Population Employment 2/ SoCal Avg. Income Population Using Employment 1/
1 2016 Driver Value 186,622 61,763 $86,855 186,622 26,4702 2062 Projected Driver Value 335,990 109,410 $140,000 335,990 46,8903 Driver Annual Growth 3,247 1,036 $1,155 3,247 444
Factor of Comparison: IC New Home Sales (20-Yr Avg) 4/ IC Industrial Space IC Hotel Rooms IC Retail Space IC Office Space4 Factor Value 601 3,488,505 2,379 7,391,095 1,069,747
Equilibrium Ratio: Population Per New Home Sale SF Per Employee Income Per Room SF Per Resident SF Per Employee5 311 56 $36.51 40 40
(1 divided by 4) (4 divided by 1) (1 divided by 4) (4 divided by 1) (4 divided by 1)
6 Annual New HH Demand Potential 800 homes 59,000 sf 30 rooms 129,000 sf 18,000 sf
Annual Supply Added - 2005 to 2014 (historical) 3/ 727 homes 44,537 sf 29 rooms 89,755 sf 12,335 sf
7 Total Demand Potential (2016-2035) 36,800 homes 2,714,000 sf 1,380 rooms 5,934,000 sf 828,000 sf
Imperial County Opportunity Areas (3, 4, 5, 6) Potential Capture8 Target Market Share Capture 55.0% 20.0% 120.0% 5/ 30.0% 15.0%
9 Annual Market Share Capture (2016-2062) 440 homes 11,800 sf 36 rooms 38,700 sf 2,700 sf
% Historical Annual Supply Added 60.5% 26.5% 124.1% 43.1% 21.9%
10 Total Market Share Capture (2016-2062) 20,240 homes 542,800 sf 1,656 rooms 1,780,200 sf 124,200 sf
Source: SCAG, CoStar, Claritas, Metrostudy, Planning Departments, TCGNotes:1/ Office-using employment - estimate based on office-using industries, and TCG projections of percent of industry that uses office space, per CoStar and broker interviews.2/ Industrial employment - estimate based on industrial-using industries, and TCG projections of percent of industry that uses office space, per CoStar and broker interviews.3/ Historical annual supply added figures for office and industrial space represent Imperial County s.f. only.4/ 20 Year Average excluding new home sales from 2009-20135/ Imperial County total capture exceeds 100% due to historical metrics being unrepresentative of development opportunity with the managed lake plan
15259.00 Demand Ph2: IC Capture Page 3 of 3 The Concord GroupPage 202 of 332

EXHIBIT I-16-A
RECOMMENDED DEVELOPMENT PROGRAM AND PRODUCT POSITIONINGOPPORTUNITY AREAS 1,2 AND 2A
FEBRUARY 2016
*** FEBRUARY 2016 PRICING ASSUMING SALTON SEA MANAGEMENT ***
Pricing Rationale:• Residential product priced between Indio/Coachella median resale price and Indio/Coachella median new home price• Lake proximate premium estimated from average premium for analogue lakes• Commerical products priced at or above Coachella/Indio levels for centers within residential core
Density/ SF/ Home Base Price Lake Lake ProximateProduct Mix FAR Acres Units Size $ $/unit Premium $ $/unit
Residential
Medium Density 90% 3.0 25,100 75,861 2,500 $300,000 $120 20.0% $360,000 $144High Density 6% 8.0 1,673 13,387 2,000 $250,000 $125 20.0% $300,000 $120Highest Density 4% 20.0 1,116 22,311 1,600 $180,000 $113 20.0% $216,000 $86
100% 4.0 27,889 111,559 2,260 $270,001 $119
Non Residental
Industrial (1)
Industrial 100% 0.30 1,634 21,353,759 --- $8.75 $0.73 (1) N/A N/A N/A
Retail (1)
Community Center 60% 0.30 624 8,153,254 --- $16.50 $1.38 (1) 25.0% $20.63 $1.72Neighborhood Center 40% 0.30 416 5,435,502 --- $18.00 $1.50 (1) 25.0% $22.50 $1.88
100% 0.30 1,040 13,588,756 $17.10 $1.43 (1)
Office (1)
Office/Flex 100% 0.30 297 3,882,502 --- $20.00 $1.67 (1) 25.0% $25.00 $2.08
Total Non Residential: 2,971 38,825,017
(1) $/unit represents $/SF for residential, $/sf/mo. for commerical use
15259.00 Residual Ph.2:Rec 2016 (Post) The Concord GroupPage 203 of 332

EXHIBIT I-16-B
RECOMMENDED DEVELOPMENT PROGRAM AND PRODUCT POSITIONINGOPPORTUNITY AREA 3
MARCH 2016
*** MARCH 2016 PRICING ASSUMING SALTON SEA MANAGEMENT ***
Pricing Rationale:• Residential product priced at a 10% discount from Riverside County opportunity areas (one quarter of 2015 Imperial County discount to Coachella Valley of 40%)• Lake proximate premium estimated from average premium for analogue lakes• Commercial products priced at a 5%-15% discount from Riverside Opportunity Areas (Retail 5%, Office 10%, Industrial 15%; slightly less than half of Imperial County 10-Year Average discount versus Coachella Valley)
Density/ SF/ Home Base Price Lake Lake ProximateProduct Mix FAR Acres Units Size $ $/unit Premium $ $/unit
Residential
Low Density 84% 5.0 3,428 17,141 2,500 $270,000 $108 20.0% $324,000 $130Medium Density 9% 16.0 114 1,823 2,000 $225,000 $113 20.0% $270,000 $108High Density 7% 23.0 66 1,522 1,600 $162,000 $101 20.0% $194,400 $78
100% 7.3 2,800 20,486 2,389 $257,971 $108
Non Residential
Industrial (1)
Industrial 100% 0.30 53 689,661 --- $7.44 $0.62 (1) N/A N/A N/A
Retail (1)
Neighborhood Center 70% 0.30 222 2,896,575 --- $17.10 $1.43 (1) 25.0% $21.38 $1.78Community Center 30% 0.30 95 1,241,389 --- $15.68 $1.31 (1) 25.0% $19.59 $1.63
100% 0.30 317 4,137,964 $16.67 $1.39 (1)
Office (1)
Office/Flex 100% 0.30 158 2,068,982 --- $18.00 $1.50 (1) 25.0% $22.50 $1.88
Total Non Residential: 528 6,896,607
(1) $/unit represents $/SF for residential, $/sf/mo. for commercial use
15259.00 Residual Ph.2:Rec 2016 Ph2 (Post) Page 1 of 2 The Concord GroupPage 204 of 332
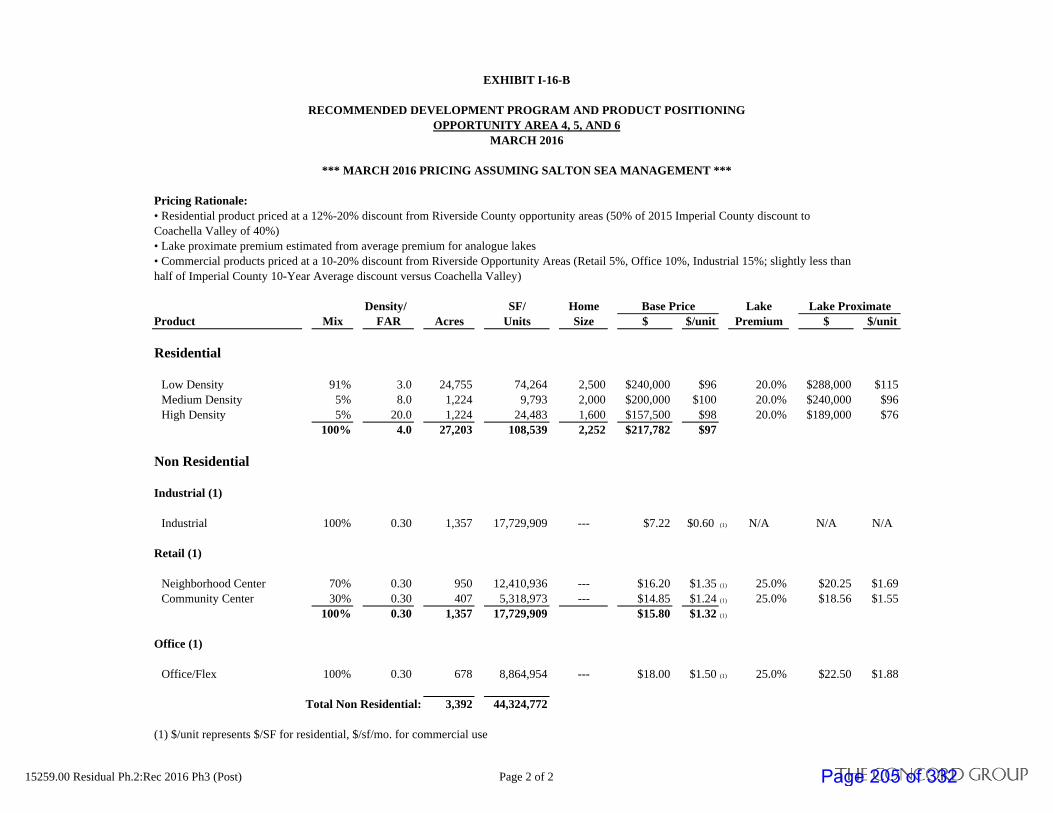
EXHIBIT I-16-B
RECOMMENDED DEVELOPMENT PROGRAM AND PRODUCT POSITIONINGOPPORTUNITY AREA 4, 5, AND 6
MARCH 2016
*** MARCH 2016 PRICING ASSUMING SALTON SEA MANAGEMENT ***
Pricing Rationale:• Residential product priced at a 12%-20% discount from Riverside County opportunity areas (50% of 2015 Imperial County discount to Coachella Valley of 40%)• Lake proximate premium estimated from average premium for analogue lakes• Commercial products priced at a 10-20% discount from Riverside Opportunity Areas (Retail 5%, Office 10%, Industrial 15%; slightly less than half of Imperial County 10-Year Average discount versus Coachella Valley)
Density/ SF/ Home Base Price Lake Lake ProximateProduct Mix FAR Acres Units Size $ $/unit Premium $ $/unit
Residential
Low Density 91% 3.0 24,755 74,264 2,500 $240,000 $96 20.0% $288,000 $115Medium Density 5% 8.0 1,224 9,793 2,000 $200,000 $100 20.0% $240,000 $96High Density 5% 20.0 1,224 24,483 1,600 $157,500 $98 20.0% $189,000 $76
100% 4.0 27,203 108,539 2,252 $217,782 $97
Non Residential
Industrial (1)
Industrial 100% 0.30 1,357 17,729,909 --- $7.22 $0.60 (1) N/A N/A N/A
Retail (1)
Neighborhood Center 70% 0.30 950 12,410,936 --- $16.20 $1.35 (1) 25.0% $20.25 $1.69Community Center 30% 0.30 407 5,318,973 --- $14.85 $1.24 (1) 25.0% $18.56 $1.55
100% 0.30 1,357 17,729,909 $15.80 $1.32 (1)
Office (1)
Office/Flex 100% 0.30 678 8,864,954 --- $18.00 $1.50 (1) 25.0% $22.50 $1.88
Total Non Residential: 3,392 44,324,772
(1) $/unit represents $/SF for residential, $/sf/mo. for commercial use
15259.00 Residual Ph.2:Rec 2016 Ph3 (Post) Page 2 of 2 The Concord GroupPage 205 of 332

EXHIBIT I-17A
LAND RESIDUAL VALUATION - SUMMARYOPPORTUNITY AREAS 1, 2, 2A, 3, 4, 5, 6
MARCH 2016
Land Residual Summary:
Phase 1 Phase 2 Phase 3Land Use $/unit $/AC $/unit $/AC $/unit $/AC
Residential
Medium Density $96,500 $291,652 $73,100 $291,652 $49,700 $149,100High Density $65,000 $520,000 $45,500 $520,000 $26,000 $208,000Highest Density $12,400 $248,000 $6,360 $248,000 $2,850 $57,000
Non Residental
Industrial (1)
Industrial $12.96 $169,394 $1.17 $169,394 $0.13 $1,707
Retail (1)
Community Center $37.02 $483,712 $23.92 $483,712 $0.85 $11,118Neighborhood Center $28.04 $366,467 $25.64 $366,467 $0.47 $6,189
Office (1)
Office/Flex $14.49 $189,385 $3.04 $189,385 $2.47 $32,259
Phase 1 - Opportunity Areas 1, 2, 2aPhase 2 - Opportunity Area 3Phase 3 - Opportunity Areas 4, 5, 6
Post restoration values assumes:- Continued southeastern growth of the Coachella Valley- Development and community creation of the opportunity areas- Price point adjustments earned by proximity to a recreational body of water
15259.00 Residual Ph.2:Summ (Ph3) The Concord GroupPage 206 of 332

EXHIBIT I-17B-i
LAND RESIDUAL VALUATION - PER PRODUCT TYPE - PHASE 1OPPORTUNITY AREAS 1, 2, 2A
FEBRUARY 2016
Ratio Residential Industrial / Flex Retail Office
Product Types: Val. CommentMedium Density
High Density
Highest Density Ware/Distribution
Community Center
Neighborhood Center Office/Flex
Product per unit per SF per SF per SFDu/AC / FAR 3.0 8.0 20.0 0.30 0.30 0.30 0.30Size (SF) 2,500 2,000 1,600 --- --- --- ---
Rents/Year/SFRevenues $8.75 $16.50 $18.00 $20.00
Cap Rate 6.0% 6.0% 6.5% 6.5%Average Price $300,000 $250,000 $180,000 $118 $223 $224 $249
$/SF $120 $125 $113 $118 $223 $224 $249Less Commissions 3.0% of Average Price $9,000 $7,500 $5,400 $4 $7 $7 $7
Net Revenues $291,000 $242,500 $174,600 $115 $216 $218 $242
CostsHard Costs
$/SF $55 $65 $80 $65 $110 $120 $150Hard Costs $137,500 $130,000 $128,000 $65 $110 $120 $150
Soft Costs/Financing CostsSoft Costs/Financing Costs 11.0% of Average Price $33,000 $27,500 $19,800 $13 $25 $25 $27
Total Costs $170,500 $157,500 $147,800 $78 $135 $145 $177
Builder ProfitPercent 8% 8% 8% 20% 20% 20% 20%Builder Profit $24,000 $20,000 $14,400 $24 $45 $45 $50
Finished Lot ValuationRevenues $291,000 $242,500 $174,600 $115 $216 $218 $242
Total Costs $170,500 $157,500 $147,800 $78 $135 $145 $177Builder Profit $24,000 $20,000 $14,400 $24 $45 $45 $50
Finished Lot Residual $96,500 $65,000 $12,400 $12.96 $37.02 $28.04 $14.49% Capitalized Value 32% 26% 7% 11% 17% 13% 6%$/AC $291,652 $520,000 $248,000 $169,394 $483,712 $366,467 $189,385
15259.00 Residual Ph.2: Residual -Post (Summ) The Concord GroupPage 207 of 332

EXHIBIT I-17B-ii
LAND RESIDUAL VALUATION - PER PRODUCT TYPE - PHASE 2OPPORTUNITY AREA 3
MARCH 2016
Ratio Residential Industrial / Flex Retail Office
Product Types: Val. Comment Low DensityMedium Density
High Density Ware/Distribution
Neighborhood Center
Community Center Office/Flex
Product per unit per SF per SF per SFDu/AC / FAR 5.0 16.0 23.0 0.30 0.30 0.30 0.30Size (SF) 2,500 2,000 1,600 --- --- --- ---
Rents/Year/SFRevenues $7.44 $17.10 $15.68 $18.00
Cap Rate 6.5% 6.5% 6.5% 6.5%Average Price $270,000 $225,000 $162,000 $93 $213 $195 $224
$/SF $108 $113 $101 $93 $213 $195 $224Less Commissions 3.0% of Average Price $8,100 $6,750 $4,860 $3 $6 $6 $7
Net Revenues $261,900 $218,250 $157,140 $90 $207 $189 $218
CostsHard Costs
$/SF $55 $65 $75 $60 $115 $105 $145Hard Costs $137,500 $130,000 $120,000 $60 $115 $105 $145
Soft Costs/Financing CostsSoft Costs/Financing Costs 11.0% of Average Price $29,700 $24,750 $17,820 $10 $23 $21 $25
Total Costs $167,200 $154,750 $137,820 $70 $138 $126 $170
Builder ProfitPercent 8% 8% 8% 20% 20% 20% 20%Builder Profit $21,600 $18,000 $12,960 $19 $43 $39 $45
Finished Lot ValuationRevenues $261,900 $218,250 $157,140 $90 $207 $189 $218
Total Costs $167,200 $154,750 $137,820 $70 $138 $126 $170Builder Profit $21,600 $18,000 $12,960 $19 $43 $39 $45
Finished Lot Residual $73,100 $45,500 $6,360 $1.17 $25.64 $23.92 $3.04% Capitalized Value 27% 20% 4% 1% 12% 12% 1%$/AC $365,500 $728,000 $146,280 $15,297 $335,076 $312,598 $39,767
15259.00 Residual Ph.2: Residual -Post (Summ) Ph2 Page 1 of 2 The Concord GroupPage 208 of 332

EXHIBIT I-17B-ii
LAND RESIDUAL VALUATION - PER PRODUCT TYPE - PHASE 3OPPORTUNITY AREAS 4, 5, AND 6
MARCH 2016
Ratio Residential Industrial / Flex Retail Office
Product Types: Val. Comment Low DensityMedium Density
High Density Ware/Distribution
Neighborhood Center
Community Center Office/Flex
Product per unit per SF per SF per SFDu/AC / FAR 3.0 8.0 20.0 0.30 0.30 0.30 0.30Size (SF) 2,500 2,000 1,600 --- --- --- ---
Rents/Year/SFRevenues $7.22 $16.20 $14.85 $18.00
Cap Rate 7.0% 7.5% 7.5% 7.0%Average Price $240,000 $200,000 $157,500 $84 $175 $160 $208
$/SF $96 $100 $98 $84 $175 $160 $208Less Commissions 3.0% of Average Price $7,200 $6,000 $4,725 $3 $5 $5 $6
Net Revenues $232,800 $194,000 $152,775 $81 $170 $156 $202
CostsHard Costs
$/SF $55 $65 $75 $55 $115 $105 $135Hard Costs $137,500 $130,000 $120,000 $55 $115 $105 $135
Soft Costs/Financing CostsSoft Costs/Financing Costs 11.0% of Average Price $26,400 $22,000 $17,325 $9 $19 $18 $23
Total Costs $163,900 $152,000 $137,325 $64 $134 $123 $158
Builder ProfitPercent 8% 8% 8% 20% 20% 20% 20%Builder Profit $19,200 $16,000 $12,600 $17 $35 $32 $42
Finished Lot ValuationRevenues $232,800 $194,000 $152,775 $81 $170 $156 $202
Total Costs $163,900 $152,000 $137,325 $64 $134 $123 $158Builder Profit $19,200 $16,000 $12,600 $17 $35 $32 $42
Finished Lot Residual $49,700 $26,000 $2,850 $0.13 $0.47 $0.85 $2.47% Capitalized Value 21% 13% 2% 0% 0% 1% 1%$/AC $149,100 $208,000 $57,000 $1,707 $6,189 $11,118 $32,259
15259.00 Residual Ph.2: Residual -Post (Summ) Ph3 Page 2 of 2 The Concord GroupPage 209 of 332

EXHIBIT I-18A
ASSET TRADES - FOR SALE RESIDENTIALCOACHELLA VALLEY
LAST THREE YEARS ENDING FEBRUARY 2016
Map Proposed Sale Sale PriceKey Property Address City Buyer Seller Use Status Acres Lots Date $ Per Acre Per Unit
LAND TRADES
A Vista Santa Rosa 62 Van Buren St Thermal --- --- SFD Improved 537 775 Listing $18,000,000 $33,520 $23,226B Desert Dunes 20th Ave Desert Hot Springs VLP Capital, Inc. Pulte Group MPC Raw 154 1,709 Mar-13 $13,500,000 $87,662 $7,899C Watermark Jefferson St/Ave 52 La Quinta Beazer Homes JEN Partners SFD Graded 20 82 Nov-13 $10,400,000 $507,813 $126,829D Ave 44 Ave 44 Indio Richmond Communities Far West Industries SFD Finished Lots 79 300 Jul-14 $8,900,000 $112,445 $29,667E 3000 S Palm Canyon Dr 3000 S Palm Canyon Dr Palm Springs Cole Realty Lehman Brothers SFD Raw 116 --- Oct-13 $6,610,000 $57,229 ---F College Dr University Park Dr/College DPalm Desert --- Highpointe Management SFD Finished Lots 24 119 Jul-14 $6,600,000 $276,730 $55,346G Vista Del Oro Vista Del Oro Thousand Palms Carver Companies Noble & Company SFD Raw 158 17 Mar-14 $1,640,000 $10,350 $96,471H Alexander Vista Estates 1710 E Vista Chino Palm Springs Miragedunes Properties Pacific Mercantile Bancorp SFD Raw 11 39 Nov-15 $580,000 $52,727 $14,872I Taquitz Canyon Mesquite Ave 90 Palm Springs Maxxamillian & Co BB&T SFD Raw 29 90 Jun-13 $380,000 $13,014 $4,222J 62nd Ave 62nd Ave Thermal Darren Smith Tower Energy Group SFD Raw 255 --- Aug-13 $275,000 $1,080 ---K Fiesta De Vida Frances Wy Indio Presidio Mana Indio CW Capital MPC Raw 654 1,459 Dec-13 --- --- ---
Totals / Averages: 2,037 4,590 --- $66,885,000 $48,351 $19,162
Source: CoStar
Green = Land Trades
15259.00 Trades: Residential The Concord GroupPage 210 of 332

EXHIBIT I-18B
ASSET TRADES - INDUSTRIALCOACHELLA VALLEY
LAST THREE YEARS ENDING FEBRUARY 2016
Map Sale Sale PriceKey Property Address City Buyer Seller Status Acres SF Date $ Per Acre Per SF
LAND TRADES
A 90575 64th St 90575 64th St Mecca Gagnon Family Trust --- Raw 46.66 2,032,510 For Sale $5,000,000 $107,158 $2.46B Industrial Way/Enterprise Wy Industrial Way/Enterprise Wy Coachella Anthony Vineyards --- Semi-Improved 14.97 652,093 Apr-14 $1,040,866 $69,530 $1.60C Tyler St Tyler St S/O 54 Ave Thermal M & M Charles Ripps Raw 37.30 1,624,788 May-13 $670,000 $17,962 $0.41D Shady Lane/54 Ave Shady Lane/54 Ave Thermal --- --- Raw 4.17 181,645 For Sale $544,936 $130,680 $3.00E 83150 Ave 45 83150 Ave 45 Indio --- Morrison Supply Co Raw 6.53 284,447 Sep-14 $400,000 $61,256 $1.41F Cabot Rd/ San Gorgonio Ln Cabot Rd/ San Gorgonio Ln Desert Hot Springs Andrew Stepansky Grant & Iris Freeland Raw 2.52 109,771 Oct-15 $350,000 $138,889 $3.19G 14th Ave/Little Morongo Rd 14th Ave/Little Morongo Rd Desert Hot Springs SRP RE Alex & Anaiit Mandoyan Raw 1.07 46,609 May-15 $150,000 $140,187 $3.22
Totals / Averages: 113.22 4,931,863 --- $8,155,802 $72,035 $1.65
Source: CoStar
FG
15259.00 Trades: Industrial The Concord GroupPage 211 of 332

EXHIBIT I-18C
ASSET TRADES - RETAILCOACHELLA VALLEY
LAST THREE YEARS ENDING FEBRUARY 2016
Map Sale Sale PriceKey Property Address City Buyer Seller Status Acres SF Date $ Per Acre Per SF
LAND TRADES
A Monroe St/ Shadow Ranch Monroe St Indio Rothbart Development Corp Wal-Mart Stores Raw 63.95 2,785,662 Mar-14 $1,549,500 $24,230 $0.56B 90933 66th Ave 90933 66th Ave Thermal --- --- Raw 1.7 76,192 For Sale $995,000 $568,855 $13.06C 40-995 Adams st 40-995 Adams st Bermuda Dunes --- --- Raw 3.74 162,914 For Sale $815,000 $217,914 $5.00D 55100 Shady Lane 55100 Shady Lane Thermal --- --- Semi-improved 3.35 145,926 For Sale $475,000 $141,791 $3.26E Zenda Dr Zenda Dr Indio Carleton W & Traci Brooks Parity LLC Raw 4.77 207,781 Jan-14 $375,000 $78,616 $1.80F Calhoun St @ Dr Carreon Blvd Calhoun St Indio Dakota Dunes, Inc. --- Raw 1.50 65,340 Oct-15 $225,000 $150,000 $3.44
Totals / Averages: 79.06 3,443,816 --- $4,434,500 $56,091 $1.29
Source: CoStar
15259.00 Trades: Retail The Concord GroupPage 212 of 332

The Concord Group
II. SOCIO-ECONOMIC AND DEMOGRAPHIC TRENDS
Page 213 of 332
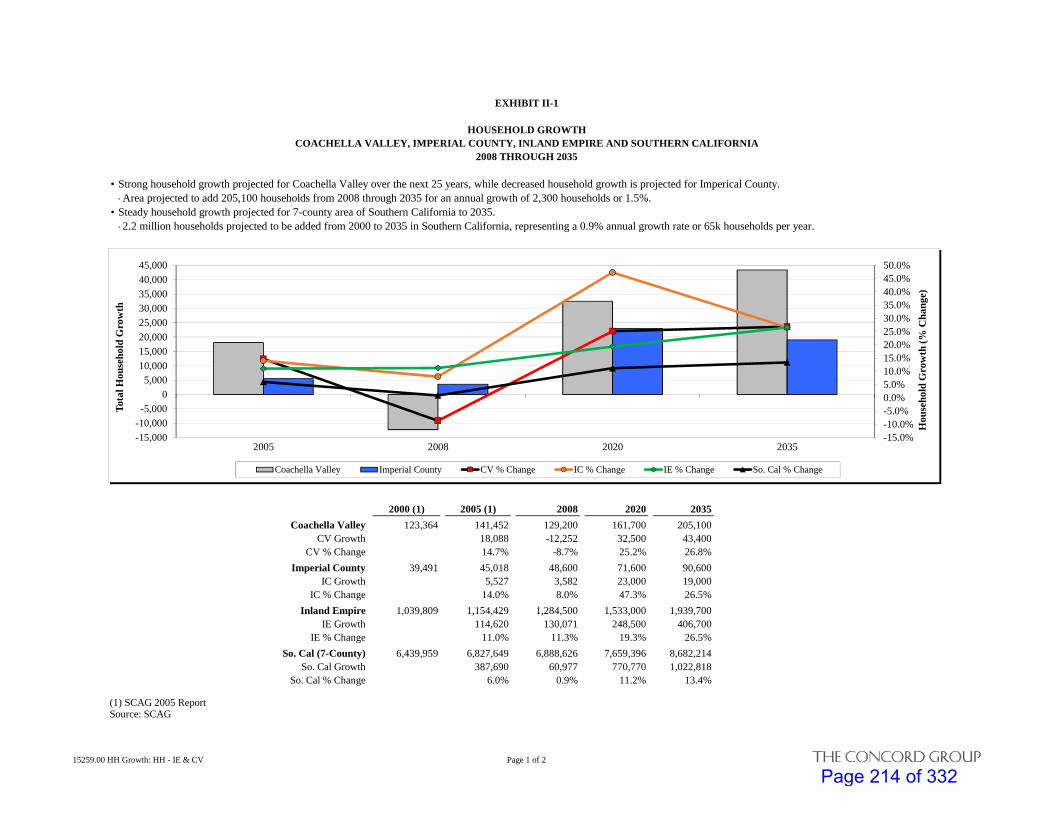
EXHIBIT II-1
HOUSEHOLD GROWTHCOACHELLA VALLEY, IMPERIAL COUNTY, INLAND EMPIRE AND SOUTHERN CALIFORNIA
2008 THROUGH 2035
• Strong household growth projected for Coachella Valley over the next 25 years, while decreased household growth is projected for Imperical County.-Area projected to add 205,100 households from 2008 through 2035 for an annual growth of 2,300 households or 1.5%.
• Steady household growth projected for 7-county area of Southern California to 2035.-2.2 million households projected to be added from 2000 to 2035 in Southern California, representing a 0.9% annual growth rate or 65k households per year.
2000 (1) 2005 (1) 2008 2020 2035
Coachella Valley 123,364 141,452 129,200 161,700 205,100CV Growth 18,088 -12,252 32,500 43,400
CV % Change 14.7% -8.7% 25.2% 26.8%
Imperial County 39,491 45,018 48,600 71,600 90,600IC Growth 5,527 3,582 23,000 19,000
IC % Change 14.0% 8.0% 47.3% 26.5%
Inland Empire 1,039,809 1,154,429 1,284,500 1,533,000 1,939,700IE Growth 114,620 130,071 248,500 406,700
IE % Change 11.0% 11.3% 19.3% 26.5%
So. Cal (7-County) 6,439,959 6,827,649 6,888,626 7,659,396 8,682,214So. Cal Growth 387,690 60,977 770,770 1,022,818
So. Cal % Change 6.0% 0.9% 11.2% 13.4%
(1) SCAG 2005 ReportSource: SCAG
-15.0%-10.0%-5.0%0.0%5.0%10.0%15.0%20.0%25.0%30.0%35.0%40.0%45.0%50.0%
-15,000
-10,000
-5,000
0
5,00010,000
15,000
20,000
25,000
30,000
35,000
40,000
45,000
2005 2008 2020 2035
Hou
seh
old
Gro
wth
(%
Ch
ange
)
Tot
al H
ouse
hol
d G
row
th
Coachella Valley Imperial County CV % Change IC % Change IE % Change So. Cal % Change
15259.00 HH Growth: HH - IE & CV Page 1 of 2 THE CONCORD GROUP
Page 214 of 332

EXHIBIT II-1
HOUSEHOLD GROWTHEAST COACHELLA VALLEY, COACHELLA VALLEY, AND IMPERIAL COUNTY
2000 THROUGH 2030
• Eastern Coachella Valley (cities of Thermal, Mecca, Coachella and Indio) projected to add 37,000 households from 2008-2035, representing 49% of the Coachella Valley's projected growth.-Eastern Coachella Valley's household projected to grow at a slightly faster pace (3.8% or 1,400 households per year) than the entire Coachella Valley (1.5% or 2,335 households) and Imperial County (2.4% or 1,460 households) on average.
2000 (1) 2005 (1) 2008 2020 2035
East Coachella Valley 18,785 21,768 31,600 45,900 68,600EC Growth 2,983 9,832 14,300 22,700
EC % Change 15.9% 45.2% 45.3% 49.5%
Coachella Valley 123,364 141,452 129,200 161,700 205,100CV Growth 18,088 -12,252 32,500 43,400
CV % Change 14.7% -8.7% 25.2% 26.8%
Imperial County 39,491 45,018 48,600 71,600 90,600IC Growth 5,527 3,582 23,000 19,000
IC % Change 14.0% 8.0% 47.3% 26.5%
(1) SCAG 2005 ReportSource: SCAG
-10.0%
-5.0%
0.0%
5.0%
10.0%
15.0%
20.0%
25.0%
30.0%
35.0%
40.0%
45.0%
50.0%
0
5,000
10,000
15,000
20,000
25,000
30,000
35,000
40,000
45,000
2005 2008 2020 2035
Hou
seh
old
Gro
wth
(%
Ch
ange
)
Tot
al H
ouse
hol
d G
row
th
Coachella Valley Imperial County East Coachella Valley CV % Change IC % Change EC % Change
15259.00 HH Growth: HH - East CV Page 2 of 2 THE CONCORD GROUP
Page 215 of 332

EXHIBIT II-2
EMPLOYMENT GROWTHCOACHELLA VALLEY, IMPERIAL COUNTY, INLAND EMPIRE AND SOUTHERN CALIFORNIA
2000 THROUGH 2035
• Strong employment growth projected for Coachella Valley, while moderate growth is projected for Imperial County over the next 25 years.-Area projected to add 148,100 jobs from 2008 through 2035, for an increase of approximately 5,485 jobs per year, or 3.7% annual growth.-Coachella Valley projected to account for 60% of the area's employment growth, adding approximately 92,400 jobs during that time span.
• Steady employment growth projected for 7-county area of Southern California to 2035.-3.2 million jobs projected to be added from 2005 to 2035 in Southern California or 600k jobs annually, representing a 4% annual growth rate.
• Strongest growth projected for 2008-2020 time period, with positive but more steady growth forecasted from 2020-2035.
2000 (1) 2005 (1) 2008 2020 2035
Coachella Valley 138,400 156,678 142,600 181,100 230,800CV Growth 18,278 -14,078 38,500 49,700
CV % Change 13.2% -9.0% 27.0% 27.4%
Imperial County 55,373 61,051 61,300 101,700 121,200IC Growth 5,678 249 40,400 19,500
IC % Change 10.3% 0.4% 65.9% 19.2%
Inland Empire 1,121,464 1,272,638 1,364,600 1,749,600 2,302,400IE Growth 151,174 91,962 385,000 552,800
IE % Change 13.5% 7.2% 28.2% 31.6%
So. Cal (4-County) 7,089,552 8,270,788 7,329,370 7,933,170 8,908,9704-County Growth 1,181,236 -941,418 603,800 975,800
4-County % Change 16.7% -11.4% 8.2% 12.3%
So. Cal (7-County) 8,866,872 9,536,962 24,716,790 26,846,225 30,112,2827-County Growth 670,090 15,179,828 2,129,435 3,266,057
7-County % Change 7.6% 159.2% 8.6% 12.2%
(1) 2005 SCAG ReportSource: SCAG
-20.0%
0.0%
20.0%
40.0%
60.0%
80.0%
-20,000
-10,000
0
10,000
20,000
30,000
40,000
50,000
60,000
2005 2008 2020 2035
Em
ploy
men
t G
row
th (
% C
hang
e)
Tot
al E
mpl
oym
ent
Gro
wth
Coachella Valley Imperial County CV % Change IC % Change IE % Change
15259.00 Employment: Empl - IE & CV Page 1 of 2 THE CONCORD GROUP
Page 216 of 332

EXHIBIT II-2
EMPLOYMENT GROWTHEAST COACHELLA VALLEY, COACHELLA VALLEY, AND IMPERIAL COUNTY
2000 THROUGH 2030
• Eastern Coachella Valley (cities of Coachella and Indio) projected to add 40,500 jobs from 2008-2035, representing 48% of the Coachella Valley's projected growth.-Eastern Coachella Valley's employment projected to grow at a faster (3.5%, 1,300 jobs annually) than the entire Coachella Valley (1%, 2,600 jobs annually) and Imperial County (2.0%, 1,800 jobs annually)
2000 (1) 2005 (1) 2008 2020 2035
East Coachella Valley 22,462 25,764 27,400 42,900 67,900East CV Growth 3,302 1,636 15,500 25,000
East CV % Change 14.7% 6.3% 56.6% 58.3%
Coachella Valley 138,400 156,678 142,600 181,100 230,800CV Growth 18,278 -14,078 38,500 49,700
CV % Change 13.2% -9.0% 27.0% 27.4%
Imperial County 55,373 61,051 61,300 101,700 121,200IC Growth 5,678 249 40,400 19,500
IC % Change 10.3% 0.4% 65.9% 19.2%
(1) 2005 SCAG ReportSource: SCAG
-20.0%
-10.0%
0.0%
10.0%
20.0%
30.0%
40.0%
50.0%
60.0%
70.0%
80.0%
-20,000
-10,000
0
10,000
20,000
30,000
40,000
50,000
60,000
70,000
80,000
2005 2008 2020 2035
Em
ploy
men
t G
row
th (
% C
hang
e)
Tot
al E
mpl
oym
ent
Gro
wth
Coachella Valley Imperial County East Coachella Valley CV % Change IC % Change East CV % Change
15259.00 Employment: Empl - East CV Page 2 of 2 THE CONCORD GROUP
Page 217 of 332

EXHIBIT II-3
ANNUAL EMPLOYMENT BY INDUSTRYCOACHELLA VALLEY
2000 THROUGH 2013
• Coachella Valley employment has slowly recovered and has returned to pre-recission numbers.• Health industries and other services have experienced the greatest rate of growth since 2005 (around 5%, 550 jobs annually)• Construction industry segment is signnificantly below 2005 levels decreasing at 1,200 jobs or 10.5% anually since then.
2000 2005 2013 (1) Annual GrowthNumber % Number % Number % 2000-2005 2005-2013
Total, All Industries 138,400 100% 156,678 100% 157,696 100% 2.5% 0.1%
Ranked by 2013 Market Share
Retail 30,518 22.1% 34,755 22.2% 38,004 24.1% 2.6% 1.1%Travel (Hotel & Amusement) 20,880 15.1% 23,037 14.7% 23,654 15.0% 2.0% 0.3%Health 11,091 8.0% 11,438 7.3% 16,400 10.4% 0.6% 4.6%Agriculture 16,388 11.8% 14,534 9.3% 14,508 9.2% -2.4% 0.0%Other Services 8,688 6.3% 9,388 6.0% 14,035 8.9% 1.6% 5.2%Education 9,048 6.5% 9,969 6.4% 11,354 7.2% 2.0% 1.6%Construction 14,172 10.2% 19,508 12.5% 8,042 5.1% 6.6% -10.5%Distribution 6,070 4.4% 7,440 4.7% 8,042 5.1% 4.2% 1.0%FIRE 5,543 4.0% 5,780 3.7% 6,310 4.0% 0.8% 1.1%Business Services 4,145 3.0% 5,061 3.2% 5,519 3.5% 4.1% 1.1%Manufacturing 4,082 2.9% 4,235 2.7% 3,154 2.0% 0.7% -3.6%Engineering & Management 1,944 1.4% 4,540 2.9% 2,838 1.8% 18.5% -5.7%Utilities 2,754 2.0% 3,209 2.0% 2,524 1.6% 3.1% -3.0%Government 1,812 1.3% 2,066 1.3% 2,365 1.5% 2.7% 1.7%Employment Agencies 1,266 0.9% 1,718 1.1% 946 0.6% 6.3% -7.2%Total 138,400 100% 156,678 100% 157,696 100% 2.5% 0.1%
(1) 2014 Coachella Valley Economic Report, TCGSources: John E. Husing report compiled for the Coachella Valley Economic Partnership; California Employment Development Department; Southern California Association of Governments
15259.00 Employment: Coachella Valley IndustryThe Concord Group
Page 218 of 332

EXHIBIT II-4
CONSUMER CONFIDENCE INDEXUNITED STATES
1990 THROUGH 2015
Year Confidence
1990 91.51991 68.51992 61.61993 65.91994 90.61995 100.01996 104.61997 125.11998 131.71999 135.32000 139.02001 106.62002 96.62003 79.62004 96.02005 100.32006 105.92007 103.42008 57.92009 45.42010 54.52011 58.12012 67.12013 73.12014 86.92015 97.9
Source: The Conference Board
0
20
40
60
80
100
120
140
2000 2001 2002 2003 2004 2005 2006 2007 2008 2009 2010 2011 2012 2013 2014 2015
Con
sum
er C
onfi
den
ce I
nd
ex
Consumer Confidence
At 97.9 points, Consumer confidence increased 52 points or 7.5 points
annualy since 2009, and have almost reached pre-Recession levels of an
average 100 points.
15259.00 ConsConf: Summ The Concord GroupPage 219 of 332

EXHIBIT II-5
GROSS DOMESTIC PRODUCTUNITED STATES AND CALIFORNIA
1975 THROUGH 2014
% %
YEAR CA Change US Change(Real GDP, in millions)
1975 --- --- $5,385,400 0%1976 --- --- $5,675,400 5%1977 --- --- $5,937,000 5%1978 --- --- $6,267,200 6%1979 --- --- $6,466,200 3%1980 --- --- $6,450,400 0%1981 --- --- $6,617,700 3%1982 --- --- $6,491,300 -2%1983 --- --- $6,792,000 5%1984 --- --- $7,285,000 7%1985 --- --- $7,593,800 4%1986 --- --- $7,860,500 4%1987 --- --- $8,132,600 3%1988 --- --- $8,474,500 4%1989 --- --- $8,786,400 4%1990 --- --- $8,955,000 2%1991 --- --- $8,948,400 0%1992 --- --- $9,266,600 4%1993 --- --- $9,521,000 3%1994 --- --- $9,905,400 4%1995 --- --- $10,174,800 3%1996 --- --- $10,561,000 4%1997 $1,082,051 --- $11,034,900 4%1998 $1,158,822 7% $11,525,900 4%1999 $1,258,697 9% $12,065,900 5%2000 $1,377,014 9% $12,559,700 4%2001 $1,394,863 1% $12,682,200 1%2002 $1,449,536 4% $12,908,800 2%2003 $1,535,202 6% $13,271,100 3%2004 $1,643,908 7% $13,773,500 4%2005 $1,760,508 7% $14,234,200 3%2006 $1,868,969 6% $14,613,800 3%2007 $1,951,997 4% $14,873,700 2%2008 $1,997,225 2% $14,830,400 0%2009 $1,915,723 -4% $14,418,700 -3%2010 $1,964,588 3% $14,783,800 3%2011 $2,035,315 4% $15,020,600 2%2012 $2,124,143 4% $15,354,600 2%2013 $2,215,726 4% $15,583,300 1%2014 $2,305,921 4% $15,961,700 2%
Source: U.S. Bureau of Economic Analysis
-5%
-4%
-3%
-2%
-1%
0%
1%
2%
3%
4%
5%
6%
7%
8%
9%
10%
An
nu
al C
han
ge in
Rea
l GD
P
Percent Annual Change in Real Gross Domestic Product
California United States
California GDP has increased 4% or $90k annually for the
past 4 years.
15259.00 GDP: Summ The Concord Group
Page 220 of 332
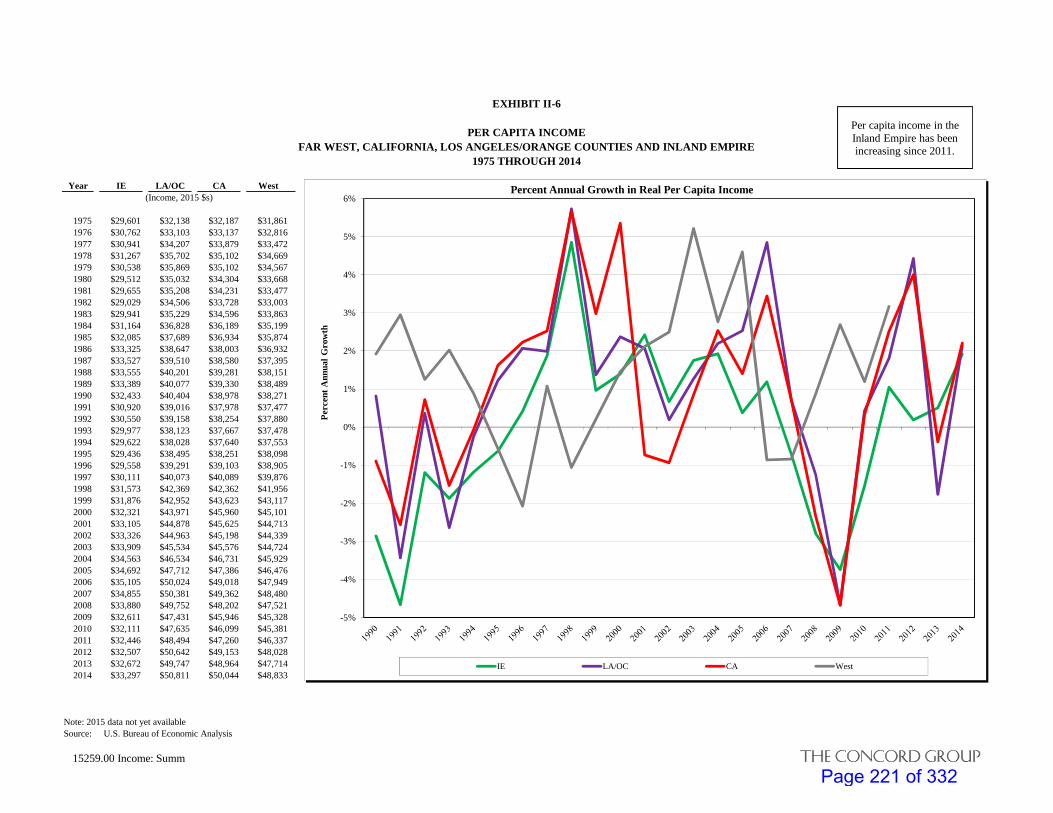
EXHIBIT II-6
PER CAPITA INCOMEFAR WEST, CALIFORNIA, LOS ANGELES/ORANGE COUNTIES AND INLAND EMPIRE
1975 THROUGH 2014
Year IE LA/OC CA West(Income, 2015 $s)
1975 $29,601 $32,138 $32,187 $31,8611976 $30,762 $33,103 $33,137 $32,8161977 $30,941 $34,207 $33,879 $33,4721978 $31,267 $35,702 $35,102 $34,6691979 $30,538 $35,869 $35,102 $34,5671980 $29,512 $35,032 $34,304 $33,6681981 $29,655 $35,208 $34,231 $33,4771982 $29,029 $34,506 $33,728 $33,0031983 $29,941 $35,229 $34,596 $33,8631984 $31,164 $36,828 $36,189 $35,1991985 $32,085 $37,689 $36,934 $35,8741986 $33,325 $38,647 $38,003 $36,9321987 $33,527 $39,510 $38,580 $37,3951988 $33,555 $40,201 $39,281 $38,1511989 $33,389 $40,077 $39,330 $38,4891990 $32,433 $40,404 $38,978 $38,2711991 $30,920 $39,016 $37,978 $37,4771992 $30,550 $39,158 $38,254 $37,8801993 $29,977 $38,123 $37,667 $37,4781994 $29,622 $38,028 $37,640 $37,5531995 $29,436 $38,495 $38,251 $38,0981996 $29,558 $39,291 $39,103 $38,9051997 $30,111 $40,073 $40,089 $39,8761998 $31,573 $42,369 $42,362 $41,9561999 $31,876 $42,952 $43,623 $43,1172000 $32,321 $43,971 $45,960 $45,1012001 $33,105 $44,878 $45,625 $44,7132002 $33,326 $44,963 $45,198 $44,3392003 $33,909 $45,534 $45,576 $44,7242004 $34,563 $46,534 $46,731 $45,9292005 $34,692 $47,712 $47,386 $46,4762006 $35,105 $50,024 $49,018 $47,9492007 $34,855 $50,381 $49,362 $48,4802008 $33,880 $49,752 $48,202 $47,5212009 $32,611 $47,431 $45,946 $45,3282010 $32,111 $47,635 $46,099 $45,3812011 $32,446 $48,494 $47,260 $46,3372012 $32,507 $50,642 $49,153 $48,0282013 $32,672 $49,747 $48,964 $47,7142014 $33,297 $50,811 $50,044 $48,833
Note: 2015 data not yet availableSource: U.S. Bureau of Economic Analysis
-5%
-4%
-3%
-2%
-1%
0%
1%
2%
3%
4%
5%
6%
Per
cent
Ann
ual
Gro
wth
Percent Annual Growth in Real Per Capita Income
IE LA/OC CA West
Per capita income in the Inland Empire has been increasing since 2011.
15259.00 Income: Summ The Concord GroupPage 221 of 332

EXHIBIT II-7
BIRTH COUNTUNITED STATES
1931THROUGH 2014
Year Births Year Births(in Millions)
1931 2.51 1973 3.141932 2.44 1974 3.161933 2.31 1975 3.141934 2.40 1976 3.171935 2.38 1977 3.331936 2.36 1978 3.331937 2.41 1979 3.491938 2.50 1980 3.611939 2.47 1981 3.631940 2.56 1982 3.681941 2.70 1983 3.641942 2.99 1984 3.671943 3.10 1985 3.761944 2.94 1986 3.761945 2.86 1987 3.811946 3.41 1988 3.911947 3.82 1989 3.901948 3.64 1990 4.091949 3.65 1991 4.091950 3.63 1992 4.051951 3.82 1993 4.001952 3.91 1994 3.951953 3.96 1995 3.901954 4.07 1996 3.891955 4.10 1997 3.881956 4.21 1998 3.941957 4.30 1999 3.961958 4.25 2000 4.061959 4.29 2001 4.031960 4.26 2002 4.021961 4.27 2003 4.091962 4.17 2004 4.111963 4.10 2005 4.141964 4.03 2006 4.271965 3.76 2007 4.321966 3.61 2008 4.251967 3.52 2009 4.131968 3.50 2010 4.001969 3.60 2011 3.951970 3.73 2012 3.951971 3.56 2013 3.931972 3.26 2014 3.99
Source: National Center for Disease Control
2.0
2.5
3.0
3.5
4.0
4.5
1972 1976 1980 1984 1988 1992 1996 2000 2004 2008 2012 2016 2020 2024 2028 2032 2036 2040 2044 2048 2052 2056 2060 2064
An
nu
al B
irth
s -
52 Y
ear
Bir
th L
ag (
Pea
k S
econ
d H
ome
Bu
yin
g A
ge)
Baby Boomers Turning Age 52(1998 to 2016)
Peak Second HomeBuying Age - 52 Years
15259.00 Natality: Summ The Concord GroupPage 222 of 332

EXHIBIT II-8
UNEMPLOYMENT RATECALIFORNIA AND LOS ANGELES/ORANGE/SAN DIEGO COUNTIES
1976 THROUGH APRIL 2014
Year IC IE SD LA/OC CA(Unemployment Rate)
1976 --- --- --- --- 9.1%1977 --- --- --- --- 8.3%1978 --- --- --- --- 7.2%1979 --- --- --- --- 6.2%1980 --- --- --- --- 6.9%1981 --- --- --- --- 7.4%1982 --- --- --- --- 10.0%1983 --- --- --- --- 9.8%1984 --- --- --- --- 7.8%1985 --- --- --- --- 7.2%1986 --- --- --- --- 6.7%1987 --- --- --- --- 5.8%1988 --- --- --- --- 5.3%1989 --- --- --- --- 5.1%1990 25.5% 6.3% 4.6% 5.3% 5.8%1991 25.9% 9.1% 6.2% 7.4% 7.8%1992 30.7% 10.6% 7.2% 9.1% 9.3%1993 29.3% 10.9% 7.8% 9.2% 9.4%1994 26.3% 9.5% 7.1% 8.4% 8.6%1995 29.2% 8.6% 6.3% 7.3% 7.9%1996 29.8% 7.8% 5.3% 7.2% 7.3%1997 26.8% 7.0% 4.3% 6.0% 6.4%1998 26.0% 6.1% 3.5% 5.7% 5.9%1999 23.6% 5.2% 3.1% 5.1% 5.2%2000 17.5% 5.1% 3.9% 4.9% 4.9%2001 15.9% 5.3% 4.2% 5.3% 5.5%2002 14.9% 6.2% 5.1% 6.3% 6.7%2003 15.5% 6.3% 5.2% 6.4% 6.8%2004 17.0% 5.9% 4.7% 5.9% 6.2%2005 16.0% 5.3% 4.3% 5.0% 5.4%2006 15.4% 4.9% 4.0% 4.4% 4.9%2007 18.1% 5.8% 4.6% 4.8% 5.4%2008 22.6% 8.3% 6.0% 7.0% 7.5%2009 27.4% 12.9% 9.4% 10.9% 11.3%2010 29.1% 13.7% 10.7% 11.8% 12.1%2011 29.1% 13.0% 10.3% 11.5% 11.6%2012 27.4% 11.5% 9.1% 10.2% 10.2%2013 24.9% 9.8% 7.8% 9.0% 8.8%2014 23.6% 8.2% 6.4% 7.6% 7.5%
Note: 2015 data not yet available
Source: U.S. Bureau of Labor Statistics
0.0%
2.0%
4.0%
6.0%
8.0%
10.0%
12.0%
14.0%
16.0%
18.0%
20.0%
22.0%
24.0%
26.0%
28.0%
30.0%
32.0%
34.0%
Per
cen
t U
nem
plo
yed
Year
Unemployment
Imperial Co SD IE LA/OC CA
Unemployment in Imperial County and
Inland Empire have been decreasing since 2011.
15259.00 UnEmp: Summ The Concord Group
Page 223 of 332

EXHIBIT II-9
AMUSEMENTS, RECREATION AND GAMBLING REVENUEWEST REGION, FAR WEST AND CALIFORNIA
1997 THROUGH 2013
Year West (1) Far West (2) CA(Real Gaming Revenue, Millions)
1997 $10,045 $8,153 $5,2011998 $9,897 $7,994 $5,0581999 $10,813 $8,779 $5,6382000 $11,987 $9,689 $6,3212001 $10,796 $8,699 $5,6192002 $11,309 $9,119 $5,8942003 $11,913 $9,620 $6,2362004 $12,798 $10,366 $6,6642005 $13,634 $11,040 $7,1232006 $14,153 $11,410 $7,2122007 $15,509 $12,529 $7,8902008 $15,135 $12,178 $7,8482009 $14,436 $11,551 $7,5232010 $16,067 $12,611 $8,3392011 $16,466 $12,863 $8,5122012 $17,494 $13,790 $9,1642013 $18,632 $14,716 $9,791
(1) West Region is Rocky Mountains Region which includes CO, ID, MT, UT, WY(2) Far West Region includes AK, CA, HI, NV, OR, WASource: U.S. Bureau Economic Analysis
$0
$2,000
$4,000
$6,000
$8,000
$10,000
$12,000
$14,000
$16,000
$18,000
$20,000
2003 2004 2005 2006 2007 2008 2009 2010 2011 2012 2013
Rea
l Am
use
men
ts, R
ecre
atio
n &
Gam
blin
g R
even
ue
(in
Mill
ions
of
2006
$s)
California Remaining Far West Remaining West Region
Revenue from amusments, recreation, and gambling
have been increasing since 2009.
05045.00 GamingRev: Summ The Concord GroupPage 224 of 332

The Concord Group
III. RESIDENTIAL
Page 225 of 332
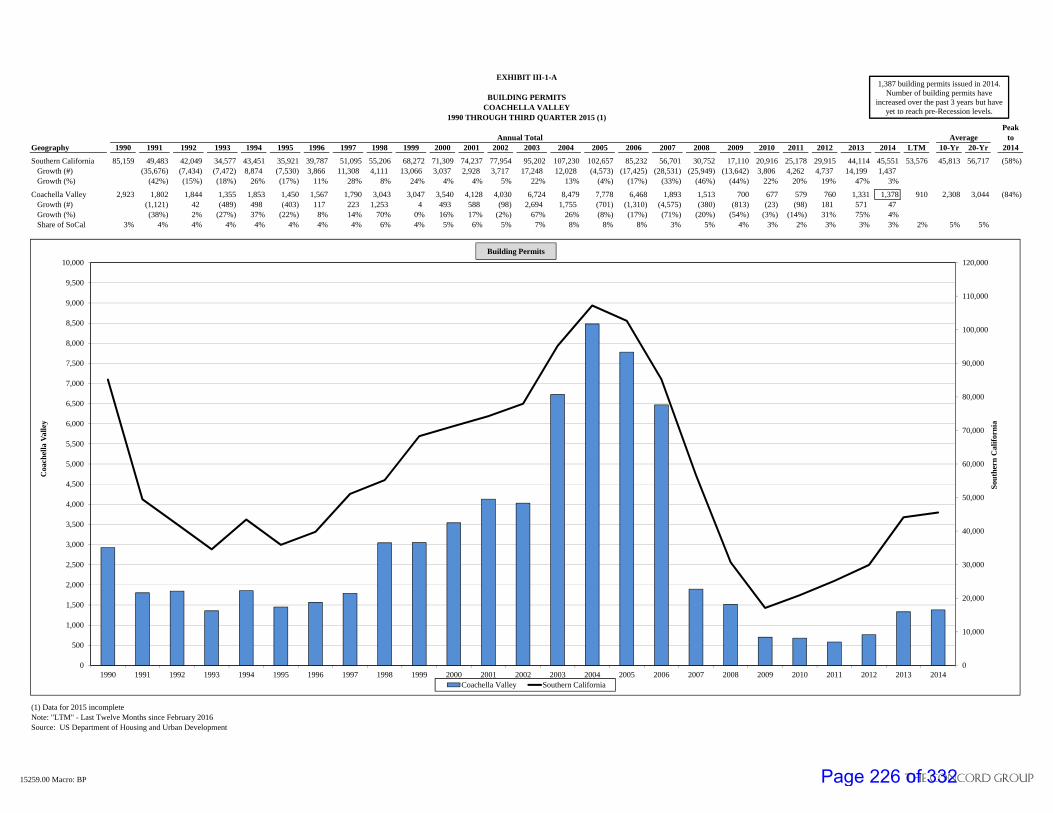
EXHIBIT III-1-A
BUILDING PERMITSCOACHELLA VALLEY
1990 THROUGH THIRD QUARTER 2015 (1)Peak
Annual Total Average toGeography 1990 1991 1992 1993 1994 1995 1996 1997 1998 1999 2000 2001 2002 2003 2004 2005 2006 2007 2008 2009 2010 2011 2012 2013 2014 LTM 10-Yr 20-Yr 2014
Southern California 85,159 49,483 42,049 34,577 43,451 35,921 39,787 51,095 55,206 68,272 71,309 74,237 77,954 95,202 107,230 102,657 85,232 56,701 30,752 17,110 20,916 25,178 29,915 44,114 45,551 53,576 45,813 56,717 (58%)Growth (#) (35,676) (7,434) (7,472) 8,874 (7,530) 3,866 11,308 4,111 13,066 3,037 2,928 3,717 17,248 12,028 (4,573) (17,425) (28,531) (25,949) (13,642) 3,806 4,262 4,737 14,199 1,437Growth (%) (42%) (15%) (18%) 26% (17%) 11% 28% 8% 24% 4% 4% 5% 22% 13% (4%) (17%) (33%) (46%) (44%) 22% 20% 19% 47% 3%
Coachella Valley 2,923 1,802 1,844 1,355 1,853 1,450 1,567 1,790 3,043 3,047 3,540 4,128 4,030 6,724 8,479 7,778 6,468 1,893 1,513 700 677 579 760 1,331 1,378 910 2,308 3,044 (84%)Growth (#) (1,121) 42 (489) 498 (403) 117 223 1,253 4 493 588 (98) 2,694 1,755 (701) (1,310) (4,575) (380) (813) (23) (98) 181 571 47Growth (%) (38%) 2% (27%) 37% (22%) 8% 14% 70% 0% 16% 17% (2%) 67% 26% (8%) (17%) (71%) (20%) (54%) (3%) (14%) 31% 75% 4%Share of SoCal 3% 4% 4% 4% 4% 4% 4% 4% 6% 4% 5% 6% 5% 7% 8% 8% 8% 3% 5% 4% 3% 2% 3% 3% 3% 2% 5% 5%
(1) Data for 2015 incompleteNote: "LTM" - Last Twelve Months since February 2016Source: US Department of Housing and Urban Development
0
10,000
20,000
30,000
40,000
50,000
60,000
70,000
80,000
90,000
100,000
110,000
120,000
0
500
1,000
1,500
2,000
2,500
3,000
3,500
4,000
4,500
5,000
5,500
6,000
6,500
7,000
7,500
8,000
8,500
9,000
9,500
10,000
1990 1991 1992 1993 1994 1995 1996 1997 1998 1999 2000 2001 2002 2003 2004 2005 2006 2007 2008 2009 2010 2011 2012 2013 2014
Sou
ther
n C
alif
orn
ia
Coa
chel
la V
alle
y
Coachella Valley Southern California
Building Permits
1,387 building permits issued in 2014. Number of building permits have
increased over the past 3 years but have yet to reach pre-Recession levels.
15259.00 Macro: BP The Concord GroupPage 226 of 332

EXHIBIT III-1-B
BUILDING PERMITSIMPERIAL COUNTY
1990 THROUGH THIRD QUARTER 2015 (1)Peak
Annual Total Average toGeography 1990 1991 1992 1993 1994 1995 1996 1997 1998 1999 2000 2001 2002 2003 2004 2005 2006 2007 2008 2009 2010 2011 2012 2013 2014 LTM 10-Yr 20-Yr 2014
Southern California 85,159 49,483 42,049 34,577 43,451 35,921 39,787 51,095 55,206 68,272 71,309 74,237 77,954 95,202 107,230 102,657 85,232 56,701 30,752 17,110 20,916 25,178 29,915 44,114 45,551 53,576 45,813 56,717 (58%)Growth (#) (35,676) (7,434) (7,472) 8,874 (7,530) 3,866 11,308 4,111 13,066 3,037 2,928 3,717 17,248 12,028 (4,573) (17,425) (28,531) (25,949) (13,642) 3,806 4,262 4,737 14,199 1,437Growth (%) (42%) (15%) (18%) 26% (17%) 11% 28% 8% 24% 4% 4% 5% 22% 13% (4%) (17%) (33%) (46%) (44%) 22% 20% 19% 47% 3%
Imperial County 1,087 837 1,001 627 834 492 352 342 433 339 773 1,057 1,021 1,201 1,778 2,191 2,203 969 511 196 102 257 287 303 246 164 727 753 (89%)Growth (#) (250) 164 (374) 207 (342) (140) (10) 91 (94) 434 284 (36) 180 577 413 12 (1,234) (458) (315) (94) 155 30 16 (57)Growth (%) (23%) 20% (37%) 33% (41%) (28%) (3%) 27% (22%) 128% 37% (3%) 18% 48% 23% 1% (56%) (47%) (62%) (48%) 152% 12% 6% (19%)Share of SoCal 1% 2% 2% 2% 2% 1% 1% 1% 1% 0% 1% 1% 1% 1% 2% 2% 3% 2% 2% 1% 0% 1% 1% 1% 1% 0% 2% 1%
(1) Data for 2015 incompleteNote: "LTM" - Last Twelve Months since February 2016Source: US Department of Housing and Urban Development
0
10,000
20,000
30,000
40,000
50,000
60,000
70,000
80,000
90,000
100,000
110,000
120,000
0
500
1,000
1,500
2,000
2,500
3,000
3,500
4,000
4,500
5,000
5,500
6,000
6,500
7,000
7,500
8,000
8,500
9,000
9,500
10,000
1990 1991 1992 1993 1994 1995 1996 1997 1998 1999 2000 2001 2002 2003 2004 2005 2006 2007 2008 2009 2010 2011 2012 2013 2014
Sou
ther
n C
alif
orn
ia
Coa
chel
la V
alle
y
Imperial County Southern California
Building Permits
Although number of building permits have yet to reach pre-Recession levels, 246 building permits issued in 2014,
above the 5 year average of 232.
15259.00 Macro Ph. 2: BP The Concord GroupPage 227 of 332

EXHIBIT III-2-A
NEW AND EXISTING HOME CLOSINGS - VOLUMECOACHELLA VALLEY
2002 THROUGH 2015
Quarterly Annual AveragePeriod: 2002 2003 2004 2005 2006 2007 2008 2009 2010 2011 2012 2013 2014 2015 2Q14 3Q14 4Q14 1Q15 2Q15 3Q15 4Q15 5-Yr 10-Yr
New Home ClosingsCoachella Valley 2,926 3,087 3,507 3,635 3,572 2,425 1,438 816 546 451 452 572 643 800 154 172 198 179 221 191 209 584 1,172
Growth (%) 6% 14% 4% -2% -32% -41% -43% -33% -17% 0% 27% 12% 24% 47% -4% 6% 50% 44% 11% 6%% of SoCal 5% 5% 5% 5% 5% 5% 6% 4% 3% 3% 3% 3% 4% 4% 3% 4% 4% 5% 5% 4% 4%
Southern California 53,683 62,598 67,178 71,973 67,707 45,279 24,472 18,720 16,916 13,265 14,998 18,030 18,091 18,134 4,699 4,410 5,134 3,460 4,640 4,611 5,423 16,504 25,561Growth (%) 17% 7% 7% -6% -33% -46% -24% -10% -22% 13% 20% 0% 0% 1% -4% 0% -10% -1% 5% 6%
Resale ClosingsCoachella Valley 9,837 10,834 13,017 11,100 8,406 6,984 8,024 10,327 10,295 10,708 11,087 10,768 9,515 9,759 2,887 2,194 2,089 2,224 2,874 2,290 2,371 10,367 9,587
Growth (%) 10% 20% -15% -24% -17% 15% 29% 0% 4% 4% -3% -12% 3% -14% -11% -7% -5% 0% 4% 13%% of SoCal 3% 4% 4% 4% 4% 4% 4% 4% 5% 5% 5% 5% 5% 4% 5% 4% 4% 5% 4% 4% 4%
Southern California 289,046 302,704 298,593 286,932 232,678 162,286 181,748 231,174 213,588 205,467 226,067 228,041 206,670 223,755 57,633 55,417 49,869 44,577 63,904 62,497 52,777 218,000 211,147Growth (%) 5% -1% -4% -19% -30% 12% 27% -8% -4% 10% 1% -9% 8% -9% -10% -5% 2% 11% 13% 6%
New and Resale ClosingsCoachella Valley 12,763 13,921 16,524 14,735 11,978 9,409 9,462 11,143 10,841 11,159 11,539 11,340 10,158 10,559 3,041 2,366 2,287 2,403 3,095 2,481 2,580 10,951 10,759
Growth (%) 9% 19% -11% -19% -21% 1% 18% -3% 3% 3% -2% -10% 4% -12% -10% -6% -2% 2% 5% 13%% New of Total Sales 23% 22% 21% 25% 30% 26% 15% 7% 5% 4% 4% 5% 6% 8% 5% 7% 9% 7% 7% 8% 8%% of SoCal 4% 4% 5% 4% 4% 5% 5% 4% 5% 5% 5% 5% 5% 4% 5% 4% 4% 5% 5% 4% 4%
Southern California 342,729 365,302 365,771 358,905 300,385 207,565 206,220 249,894 230,504 218,732 241,065 246,071 224,761 241,889 62,332 59,827 55,003 48,037 68,544 67,108 58,200 234,504 236,709Growth (%) 7% 0% -2% -16% -31% -1% 21% -8% -5% 10% 2% -9% 8% -8% -10% -5% 1% 10% 12% 6%% New of Total Sales 16% 17% 18% 20% 23% 22% 12% 7% 7% 6% 6% 7% 8% 7% 8% 7% 9% 7% 7% 7% 9%
Note: Includes detached and attached product types
0
2,000
4,000
6,000
8,000
10,000
12,000
14,000
2002 2003 2004 2005 2006 2007 2008 2009 2010 2011 2012 2013 2014 2015 1Q14 2Q14 3Q14 4Q14 1Q15 2Q15 3Q15 4Q15
Coachella Valley Home Sales
Coachella Valley New Home Sales Coachella Valley Resales
Annual Quarterly
800 new home closings in 2015. Historically Coachella Valley has achieved new home sales volume of approximately 3,000 units annually.
Approximately 170 more resale closings in 2015 than 10 year average.
15259.00 Macro: HC-Vol the concord groupPage 228 of 332

EXHIBIT III-2-B
NEW AND EXISTING HOME CLOSINGS - VOLUMEIMPERIAL COUNTY2002 THROUGH 2015
Quarterly Annual AveragePeriod: 2002 2003 2004 2005 2006 2007 2008 2009 2010 2011 2012 2013 2014 2015 2Q14 3Q14 4Q14 1Q15 2Q15 3Q15 4Q15 5-Yr 10-Yr
New Home ClosingsImperial County 570 769 1,162 1,429 1,789 675 489 292 152 153 149 180 204 163 53 53 50 24 48 55 36 170 425
Growth (%) 35% 51% 23% 25% -62% -28% -40% -48% 1% -3% 21% 13% -20% 61% -12% -7% -50% -9% 4% -28%% of SoCal 1% 1% 2% 2% 3% 1% 2% 2% 1% 1% 1% 1% 1% 1% 1% 1% 1% 1% 1% 1% 1%
Southern California 53,683 62,598 67,178 71,973 67,707 45,279 24,472 18,720 16,916 13,265 14,998 18,030 18,091 18,134 4,699 4,410 5,134 3,460 4,640 4,611 5,423 16,504 25,561Growth (%) 17% 7% 7% -6% -33% -46% -24% -10% -22% 13% 20% 0% 0% 1% -4% 0% -10% -1% 5% 6%
Resale ClosingsImperial County 845 1,029 1,259 1,357 1,218 694 1,156 2,008 1,821 1,620 1,470 1,305 1,189 1,335 296 352 289 306 336 368 325 1,384 1,382
Growth (%) 22% 22% 8% -10% -43% 67% 74% -9% -11% -9% -11% -9% 12% -13% 8% -16% 21% 14% 5% 12%% of SoCal 0% 0% 0% 0% 1% 0% 1% 1% 1% 1% 1% 1% 1% 1% 1% 1% 1% 1% 1% 1% 1%
Southern California 289,046 302,704 298,593 286,932 232,678 162,286 181,748 231,174 213,588 205,467 226,067 228,041 206,670 223,755 57,633 55,417 49,869 44,577 63,904 62,497 52,777 218,000 211,147Growth (%) 5% -1% -4% -19% -30% 12% 27% -8% -4% 10% 1% -9% 8% -9% -10% -5% 2% 11% 13% 6%
New and Resale ClosingsImperial County 1,415 1,798 2,421 2,786 3,007 1,369 1,645 2,300 1,973 1,773 1,619 1,485 1,393 1,498 349 405 339 330 384 423 361 1,554 1,806
Growth (%) 27% 35% 15% 8% -54% 20% 40% -14% -10% -9% -8% -6% 8% -7% 5% -15% 10% 10% 4% 6%% New of Total Sales 40% 43% 48% 51% 59% 49% 30% 13% 8% 9% 9% 12% 15% 11% 15% 13% 15% 7% 13% 13% 10%% of SoCal 0% 0% 1% 1% 1% 1% 1% 1% 1% 1% 1% 1% 1% 1% 1% 1% 1% 1% 1% 1% 1%
Southern California 342,729 365,302 365,771 358,905 300,385 207,565 206,220 249,894 230,504 218,732 241,065 246,071 224,761 241,889 62,332 59,827 55,003 48,037 68,544 67,108 58,200 234,504 236,709Growth (%) 7% 0% -2% -16% -31% -1% 21% -8% -5% 10% 2% -9% 8% -8% -10% -5% 1% 10% 12% 6%% New of Total Sales 16% 17% 18% 20% 23% 22% 12% 7% 7% 6% 6% 7% 8% 7% 8% 7% 9% 7% 7% 7% 9%
Note: Includes detached and attached product types
0
500
1,000
1,500
2,000
2,500
3,000
3,500
2002 2003 2004 2005 2006 2007 2008 2009 2010 2011 2012 2013 2014 2015 1Q14 2Q14 3Q14 4Q14 1Q15 2Q15 3Q15 4Q15
Imperial County Home Sales
Imperial County New Home Sales Imperial County Resales
Annual Quarterly
163 new home closings in 2015. Resale volume has reached 10-year average. Imperial County has
experienced modest growth, and total new and resale closings are only 17% below 10-year average.
15259.00 Macro Ph. 2: HC-Vol the concord groupPage 229 of 332

EXHIBIT III-3-A
NEW AND EXISTING HOME CLOSINGS - MEDIAN PRICE - $COACHELLA VALLEY2002 THROUGH 2015
TTM Quarterly Annual GrowthPeriod: 2002 2003 2004 2005 2006 2007 2008 2009 2010 2011 2012 2013 2014 2015 2Q14 3Q14 4Q14 1Q15 2Q15 3Q15 4Q15 5-Yr 10-Yr
Median New Home Price (000s)Coachella Valley $300 $310 $349 $426 $448 $414 $346 $312 $291 $317 $332 $439 $497 $456 $464 $458 $508 $485 $433 $442 $467 8% 0%
Growth (%) 3% 13% 22% 5% -8% -16% -10% -6% 9% 4% 32% 13% -8% 2% 3% 7% -16% -7% -3% -8%vs. SoCal 83% 84% 94% 97% 91% 87% 86% 75% 81% 84% 94% 92% 82% 85% 85% 94% 88% 79% 82% 81%
Southern California $337 $371 $417 $455 $462 $453 $396 $361 $391 $390 $394 $467 $538 $554 $545 $537 $540 $551 $547 $540 $574 7% 2%Growth % 10% 12% 9% 1% -2% -13% -9% 8% 0% 1% 19% 15% 3% 19% 14% 7% 4% 0% 1% 6%
Median Resale Price (000s)Coachella Valley $201 $238 $314 $389 $427 $412 $295 $200 $220 $211 $226 $267 $299 $294 $314 $286 $289 $304 $310 $288 $273 7% -4%
Growth (%) 19% 32% 24% 10% -3% -29% -32% 10% -4% 7% 18% 12% -2% 13% 10% 4% 1% -1% 1% -6%vs. SoCal 77% 81% 85% 86% 83% 87% 74% 76% 75% 75% 72% 73% 68% 76% 68% 70% 73% 70% 65% 62%
Southern California $256 $308 $387 $459 $494 $498 $339 $272 $291 $281 $302 $371 $409 $436 $414 $418 $414 $416 $440 $443 $439 9% -1%Growth % 20% 26% 19% 8% 1% -32% -20% 7% -3% 7% 23% 10% 6% 10% 8% 7% 7% 6% 6% 6%
Note: Includes detached and attached product typesSource: DataQuick
$150
$200
$250
$300
$350
$400
$450
$500
$550
$600
2002 2003 2004 2005 2010 2011 2012 2013 2014 2015 2Q14 3Q14 4Q14 1Q15 2Q15 3Q15 4Q15
Southern California (New) Southern California (Resale) Coachella Valley (New) Coachella Valley (Resale)
Median Home Price
In 2015 median new home prices were $456k, higher than
peak prices of $448k.
15259.00 Macro: HC-Med the concord groupPage 230 of 332

EXHIBIT III-3-B
NEW AND EXISTING HOME CLOSINGS - MEDIAN PRICE - $IMPERIAL COUNTY2002 THROUGH 2015
TTM Quarterly Annual GrowthPeriod: 2002 2003 2004 2005 2006 2007 2008 2009 2010 2011 2012 2013 2014 2015 2Q14 3Q14 4Q14 1Q15 2Q15 3Q15 4Q15 5-Yr 10-Yr
Median New Home Price (000s)Imperial County $149 $168 $196 $264 $301 $292 $238 $186 $196 $196 $193 $208 $229 $264 $245 $219 $233 $258 $272 $252 $276 6% -1%
Growth (%) 13% 17% 35% 14% -3% -19% -22% 6% 0% -2% 8% 10% 15% 23% 3% 10% 18% 11% 15% 18%vs. SoCal 45% 47% 58% 65% 64% 60% 51% 50% 50% 49% 45% 43% 48% 45% 41% 43% 47% 50% 47% 48%
Southern California $337 $371 $417 $455 $462 $453 $396 $361 $391 $390 $394 $467 $538 $554 $545 $537 $540 $551 $547 $540 $574 7% 2%Growth % 10% 12% 9% 1% -2% -13% -9% 8% 0% 1% 19% 15% 3% 19% 14% 7% 4% 0% 1% 6%
Median Resale Price (000s)Imperial County $123 $137 $170 $225 $246 $227 $165 $118 $121 $127 $124 $134 $161 $178 $165 $160 $170 $170 $175 $185 $180 7% -3%
Growth (%) 11% 24% 32% 9% -7% -27% -29% 3% 5% -2% 8% 20% 11% 28% 14% 20% 15% 6% 16% 6%vs. SoCal 45% 44% 49% 50% 46% 49% 43% 42% 45% 41% 36% 39% 41% 40% 38% 41% 41% 40% 42% 41%
Southern California $256 $308 $387 $459 $494 $498 $339 $272 $291 $281 $302 $371 $409 $436 $414 $418 $414 $416 $440 $443 $439 9% -1%Growth % 20% 26% 19% 8% 1% -32% -20% 7% -3% 7% 23% 10% 6% 10% 8% 7% 7% 6% 6% 6%
Note: Includes detached and attached product typesSource: DataQuick
$100
$150
$200
$250
$300
$350
$400
$450
$500
$550
$600
2002 2003 2004 2005 2010 2011 2012 2013 2014 2015 2Q14 3Q14 4Q14 1Q15 2Q15 3Q15 4Q15
Southern California (New) Southern California (Resale) Imperial County (New) Imperial County (Resale)
Median Home Price
New home prices have been increasing 6% over the past 5 years.
15259.00 Macro Ph. 2: HC-Med the concord groupPage 231 of 332

EXHIBIT III-4
REGIONAL LOCATIONCOACHELLA VALLEY
FEBRUARY 2016
The highlighted areas are the North, West, Central, and East Coachella Valley geographies, they are comprised of the following Cities and zip codes:
- North Valley: Desert Hot Springs, Thousand Palms, North Palm Springs (92240, 92276, 92282, 92241)- West Valley: Cathedral City, Palm Springs (92234, 92262, 62263, 92264, 92235, 92292)- Central Valley: La Quinta, Palm Desert, Rancho Mirage, Indian Wells (92253, 92260, 92261, 92270, 92210, 92202, 92211)- East Valley: Coachella, Thermal, Mecca, Indio, Bermuda Dunes (92203, 92201, 92202, 92236, 9274, 92254)
East Valley
Central Valley
West Valley
North Valley
This map divides the Coachella Valley up into four submarkets by zip code. The Opportunity Areas in Phase I fall within East Valley and will be compared to the other three in respect to the residential market and demographics.
15529.00 Maps:RegLoc (3) The concord groupPage 232 of 332

EXHIBIT III-5
RESIDENTIAL SUBMARKET PERFORMANCECOACHELLA VALLEY
FEBRUARY 2016
Market Area North Valley (1) West Valley (2) Central Valley (3) East Valley (4) Coachella ValleyGeneral Information
Population 2016 58,712 101,369 221,902 85,307 477,703
Households 2016 20,582 42,444 87,994 18,613 171,136
Households Estimate 2021 22,087 44,715 93,667 19,879 181,949
Annual Household Growth Rate (2016-2021) 1.4% 1.0% 1.3% 1.3% 1.2%
Median Household Income 2016 $47,294 $65,504 $82,553 $48,496 $70,361
Median Household Income Estimate 2021 $50,733 $69,959 $88,515 $52,604 $75,458
Annual Income Growth Rate (2016-2021) 1.4% 1.3% 1.4% 1.6% 1.4%
New Homes For-Sale LTM 4Q15 LTM 4Q15 LTM 4Q15 LTM 4Q15 LTM 4Q15
Sales 11 3 152 40 262 66 375 100 800 209Implied Annual 12 160 264 400 836
Percent of Coachella Valley 1% 1% 19% 19% 33% 32% 47% 48%
Sales per 1,000 Households 0.5 3.6 6.2 20.1 4.7
Average Price $162,591 $90,000 $618,428 $645,775 $529,250 $520,682 $339,388 $369,285 $452,154 $466,002Percent of Coachella Valley 36% 19% 137% 139% 117% 112% 75% 79%
Average Size 2,438 2,189 2,384 2,333 2,782 2,577 0 0 1,397 1,292
Value Ratio $67 $41 $259 $277 $190 $202 --- --- $324 $361Percent of Coachella Valley 21% 80% 77% 59% 56% --- ---
Units Remaining in Active Projects 2,570 1,325 1,940 0 8,287
Months of Available Inventory 2,804 105 89 0 124
Number of Residential Projects Selling 11 18 37 23 89
Average Sales per Month 1 1 13 13 22 22 31 33 67 70
Median Existing Home Price $154,519 $155,877 $288,192 $275,707 $345,625 $351,686 $237,834 $244,429 $295,180 $258,958Existing Home Sales 725 191 2,786 586 4,423 478 1,773 2,371 9,707 3,626
(1) North Valley georgraphies are defined by the following zip codes: 92240, 92276, 92282, 92241(2) West Valley geographies include 92234, 92262, 62263, 92264, 92235, 92292(3) Central Valley geographies are defined by the following zip codes: 92203, 92201, 92253, 92260, 92261, 92270, 92210, 92202, 92211(4) East Valley geographies are defined by the following zip codes: 92236, 9274, 92254Sources: Claritas, DataQuick, Metrostudy
1.3% annual household growth in East Coachella Valley, greater than 1.2% in
Coachella Valley. 375 new home sales in East Coachella Valley, approximately half of the new home sales in Coachella Valley.
15259.00 Macro:Submarket THE CONCORD GROUP
Page 233 of 332

EXHIBIT III-6-A
RESIDENTIAL - NEW HOME INVENTORY MAPEASTERN COACHELLA VALLEY
FEBRUARY 2016
Map TotalKey Project Name Builder Units
Indio
1 Desert Trace Woodside Homes 852 Gallery Links Gallery Homes 863 Palazzo at Shadow Hills Woodside Homes 61
La Quinta
4 Andalusia at Coral Mountain TD Desert Development 4205 Pimlico Griffin Ranch Lennar 1526 Belmont Griffin Ranch Lennar 1527 Monterra Woodbridge Pacific Group 398 Estates - Signature at PGA West California West 689 Alta Verde at Coral Mountain Alta Verde Group 70
10 Haciendas - Signature at PGA West California West 5611 Santerra Legacy Homes 2812 Darby Estates GHA 1913 Villas - Signature at PGA West California West 106
Bermuda Dunes
14 Vibrante Corman Leigh 1215 Yorkville GHA 29
Source: Appendix A
1514
1
2
3
12
104
65
11
7-913
15259.00 RecComps: Loc-N The Concord GroupPage 234 of 332

EXHIBIT III-6-B
NEW HOME INVENTORY MAPIMPERIAL COUNTY
MARCH 2016
*** Currently no new home projects existing or planned in the Imperial County Opportunity Areas ***
Color = Status
Yellow = ExistingGreen = Under Construction
Blue = Planned
15529.00 Resi Maps Ph. 2: Office - Current and Planned The Concord GroupPage 235 of 332

EXHIBIT III-7-A
RESIDENTIAL - NEW HOME INVENTORY TABLEEASTERN COACHELLA VALLEY
FEBRUARY 2016
Sales FloorplansMap Product Lot Units Month Home Base Price TaxKey Project Name Builder Type Size Total Rem. Start Sold Rate Num. Size $ $/sf HOA Rate
Indio
1 Desert Trace Woodside Homes SFD 8,000 85 52 Aug-14 33 1.8 4 2,196 $294,240 $134 $102 1.4%2 Gallery Links Gallery Homes SFD 6,500 86 66 Feb-15 20 1.7 3 2,030 $291,997 $144 $254 1.4%3 Palazzo at Shadow Hills Woodside Homes SFD 7,500 61 3 Sep-14 58 3.4 1 2,181 $292,990 $134 $0 1.4%
Subtotal/Average: 232 121 111 2.3 8 2,130 $293,080 $138 $132 1.4%
La Quinta
4 Andalusia at Coral Mountain TD Desert Development SFD 15,000 420 235 Jun-05 185 0.1 5 4,164 $1,609,000 $386 $710 1.3%5 Pimlico Griffin Ranch Lennar SFD 18,000 152 142 Mar-14 10 0.4 4 4,566 $1,065,412 $233 $653 1.3%6 Belmont Griffin Ranch Lennar SFD 12,000 152 135 Mar-14 17 0.7 5 3,256 $906,737 $278 $653 1.3%7 Monterra Woodbridge Pacific Group SFD 12,000 39 39 Feb-16 0 0.0 4 3,353 $850,250 $254 $391 1.3%8 Estates - Signature at PGA West California West SFD 7,900 68 65 Mar-15 3 0.3 3 2,976 $810,667 $272 $380 1.3%9 Alta Verde at Coral Mountain Alta Verde Group SFD 9,583 70 5 Jul-14 65 3.4 2 2,809 $662,450 $236 $195 1.3%10 Haciendas - Signature at PGA West California West SFD 7,900 56 53 Mar-15 3 0.3 4 2,209 $646,500 $293 $380 1.3%11 Santerra Legacy Homes SFD --- 28 7 Jan-00 21 0.0 4 2,661 $524,968 $197 $177 1.3%12 Darby Estates GHA SFD 8,400 19 2 Dec-14 17 1.2 1 2,698 $499,900 $185 $76 1.3%13 Villas - Signature at PGA West California West TH --- 106 103 Mar-15 3 0.3 4 1,942 $459,750 $237 $530 1.3%
Subtotal/Average: 1,109 785 324 0.7 36 3,534 $1,098,604 $311 $572 1.3%
Bermuda Dunes
14 Vibrante Corman Leigh SFD 10,500 12 12 May-15 0 0.0 2 3,014 $487,950 $162 $161 1.2%15 Yorkville GHA SFD 9,000 29 25 Jan-16 4 3.9 3 2,137 $486,667 $228 $150 1.2%
Subtotal/Average: 41 37 4 2.0 5 2,394 $487,042 $203 $153 1.2%
Total/Average: 1,382 943 439 1.7 49 3,264 $945,235 $290 $486 1.3%
Source: Appendix IV-1Note: Weighted averages
15259.00 RecComps: Inv-N The Concord GroupPage 236 of 332

EXHIBIT III-7-B
RESIDENTIAL - NEW HOME INVENTORY TABLEIMPERIAL COUNTY OPPORTUNITY AREAS
FEBRUARY 2016
Sales FloorplansMap Product Lot Units Month Home Base Price TaxKey Project Name Builder Type Size Total Rem. Start Sold Rate Num. Size $ $/sf HOA Rate
*** There are no new home communities currently selling in the Imperial County Opportunity Areas ***
15259.00 RecComps Ph. 2: Inv-N The Concord GroupPage 237 of 332

EXHIBIT III-8-A
PLANNED AND PROPOSED UNITSOPPORTUNITY AREAS 1, 2 AND 2A
FEBRUARY 2016
*** Projects Over 100 Units ***I. Overview by Submarket
Opportunity Area 1 Opportunity Area 2 Opportunity Area 2a Total CompletionStatus Units Projects Units Projects Units Projects Units Projects Likelihood
Currently Selling 0 0 0 0 232 3 232 3 100%Approved MPC 0 0 16,655 1 12,860 4 29,515 5 90%Approved Tract 0 0 0 0 1,027 4 1,027 4 85%Pending MPC 0 0 0 0 5,065 3 5,065 3 70%Pending Tract 0 0 0 0 710 3 710 3 70%
TOTAL 0 0 16,655 1 19,894 17 36,549 18
II. Supply Projection Coachella Valley
Total Weighted Units by Completion Likelihood (%)Opportunity Area
Status 1 2 2a TotalCurrently Selling 0 0 232 232Approved MPC 0 14,990 11,574 26,564Approved Tract 0 0 873 873Pending MPC 0 0 3,546 3,546Pending Tract 0 0 497 497
Total: 0 14,990 16,721 31,711
III. Remaining Developable Land
Opportunity Area1 2 2a
Total Land 36,312.8 49,734.4 39,410.8Planned MPC Acreage 0.0 4,918.0 4,802.5
Remaining Land 36,312.8 44,816.4 34,608.3% Developable 20% 20% 60%
Developable Land 7,262.6 8,963.3 20,765.0
Land Use Breakdown (2)Opportunity Area Opportunity Area
1 2 2a 1 2 2a IV. Total Potential Residential UnitsAcres Units (3)
Residential 3,919.2 4,837.0 11,205.8 15,677 19,348 44,823 Opportunity AreaCommercial 583.3 719.9 1,667.8 7,622,675 9,407,726 21,794,616 1 2 2a TotalPublic Facility (Park) 248.1 306.2 709.3 Planned 0 14,990 16,721 31,711Open Space 2,167.8 2,675.5 6,198.2 Developable 15,677 19,348 44,823 79,848Roads 344.1 424.7 983.8 Total: 15,677 34,338 61,545 111,559
(2) Based on TCG experience and interviews for approved land use designations(3)Units for Residential (4.0 du/AC), SF for Commerical (30% FAR)
There are currently 36,549 total residential units planned or currently on the books for projects of 100 units or more. After applying probablity likelihoods to the projects, the weighted total is 31,711.
In addition, TCG estimates there could be approximately 80,000 more units that could be added within the opportunity areas given the available acreage and potential rezoning.
15259.00 Pipeline PWR: Flow Chart THE CONCORD GROUP
Page 238 of 332

EXHIBIT III-8-B
PLANNED AND PROPOSED UNITSOPPORTUNITY AREA 3
MARCH 2016
I. Overview by Submarket
Salton City/Vista Del Mar (1) Other Opportunity Area 3 Total CompletionStatus Units Projects Units Projects Units Projects Likelihood
Currently Selling 0 0 0 0 0 0 100%Undeveloped Lots 17,897 0 0 0 17,897 0 95%Approved MPC 0 0 154 5 154 5 90%Approved Tract 0 0 0 0 0 0 90%Pending 0 0 0 0 0 0 85%
TOTAL 17,897 0 154 5 18,051 5
II. Supply Projection Opportunity Area 3
Total Weighted Units by Completion Likelihood (%)Status Opportunity Area 3
Currently Selling 0Approved MPC 139Approved Tract 0Pending 0Undeveloped Lots 17,002
17,141
III. Urban Area Development Vacant Parcels West Shores/Salton City Urban Area (4)
Townships/Specific Plan Acres RealSalton City 13,715.8 Zone Acres Max Units Unit Capacity Units/Acre MixDesert Shores 436 Medium Density (R3) 113.9 2,287 1,823 16 54%Salton Sea Beach 193 High Density (R4) 65.6 1,900 1,522 23 46%Habitat 2000 1,720 Total/Average: 179.5 4,187 3,345 20 100%Total 16,065
Land Use Breakdown (2) IV. Total Potential Residential UnitsUrban Area
TotalAcres Units (3) Opportunity Area 3 Mix
Residential 3,428.1 17,141 Planned 17,141 84%Commercial 527.7 6,896,607 Vacant Parcels 3,345 16%Public Facility (Park) 2,253.6Open Space 621.4 Total: 20,486 100%Roads 811.1
(1) Source: West Shores / Salton City Urban Area Plan 2000(2) Based on TCG experience and interviews for approved land use designations(3) Units for Residential (5.0 du/AC), SF for Commercial (30% FAR)(4) Source: Imperial County General Plan, Housing Element 2014
There are 154 total residential units planned. TCG estimates there is a potential 20,486
residential units that can be developed.
15259.00 Pipeline Ph. 2: Flow Chart Ph.2 Page 1 of 2 THE CONCORD GROUP
Page 239 of 332

EXHIBIT III-8-B
PLANNED AND PROPOSED UNITSOPPORTUNITY AREAS 4, 5 AND 6
FEBRUARY 2016
I. Overview by Submarket
Opportunity Area 4 (1) Opportunity Area 5 Opportunity Area 6 Total CompletionStatus Units Projects Units Projects Units Projects Units Projects Likelihood
Currently Selling 0 0 0 0 0 0 0 0 100%Approved MPC 0 0 0 0 0 0 0 0 90%Approved Tract 0 0 0 0 0 0 0 0 85%Pending MPC 0 0 0 0 0 0 0 0 70%Pending Tract 0 0 0 0 0 0 0 0 70%
TOTAL 0 0 0 0 0 0 0 0
II. Supply Projection Coachella Valley
Total Weighted Units by Completion Likelihood (%)Opportunity Area
Status 4 (1) 5 6 TotalCurrently Selling 0 0 0 0Approved MPC 0 0 0 0Approved Tract 0 0 0 0Pending MPC 0 0 0 0Pending Tract 0 0 0 0
Total: 0 0 0 0
III. Remaining Developable Land
Opportunity Area4 (1) 5 6
Total Land 36,529.4 26,609.9 39,068.6Planned MPC Acreage 0.0 0.0 0.0
Remaining Land 36,529.4 26,609.9 39,068.6% Developable 14% 51% 68%
Developable Land (1) 5,044.8 13,528.5 26,651.5IV. Total Potential Residential Units
Land Use Breakdown (2)Opportunity Area Opportunity Area Opportunity Area
4 (1) 5 6 4 (1) 5 6 4 (1) 5 6 TotalAcres Units (3) Planned 0 0 0 0
Residential 3,026.9 8,117.1 15,990.9 12,108 32,468 63,964 Developable 12,108 32,468 63,964 108,539Commercial 378.4 1,014.6 1,998.9 4,944,413 13,259,247 26,121,113 Total: 12,108 32,468 63,964 108,539Public Facility (Park) 756.7 2,029.3 3,997.7Open Space 529.7 1,420.5 2,798.4Roads 353.1 947.0 1,865.6
(1) Excludes Salton City Urban Plan that encompasses the northern portion of Opportunity Area 4(2) Based on TCG experience and interviews for approved land use designations(3)Units for Residential (3.0 du/AC), SF for Commerical (30% FAR)
There are currently no projects planned in Opportunity Areas 4, 5, and 6.
TCG estimates there could be approximately 108,500 more units that could be added within the opportunity areas given the available acreage and potential rezoning.
15259.00 Pipeline Ph. 2: Ph.3 Flow Chart Page 2 of 2 THE CONCORD GROUP
Page 240 of 332

EXHIBIT III-9
PRICE TO SIZE RELATIONSHIPMARKET AREAFEBRUARY 2016
Source: Appendix IV-1
$100,000
$200,000
$300,000
$400,000
$500,000
$600,000
$700,000
$800,000
$900,000
$1,000,000
$1,100,000
$1,200,000
$1,300,000
$1,400,000
$1,500,000
$1,600,000
$1,700,000
$1,800,000
$1,900,000
$2,000,000
1,300 1,500 1,700 1,900 2,100 2,300 2,500 2,700 2,900 3,100 3,300 3,500 3,700 3,900 4,100 4,300 4,500 4,700 4,900 5,100
Sale
Pri
ce
Unit Size (sq. ft.)TCG - Recommended Base Price Vibrante (10,500) Yorkville (9,000) Desert Trace (8,000)Gallery Links (6,500) Palazzo at Shadow Hills (7,500) Darby Estates (8,400) Alta Verde at Coral Mountain (9,583)Andalusia at Coral Mountain (15,000) Belmont Griffin Ranch (12,000) Pimlico Griffin Ranch (18,000) Santerra (---)Villas - Signature at PGA West (---) Estates - Signature at PGA West (7,900) Haciendas - Signature at PGA West (7,900) Monterra (12,000)Linear (Palazzo at Shadow Hills (7,500)) Indio Trendline La Quinta Trendline
Shape = Product Type
Solid = SFD (New)Hollow = Attached (New)
La Quinta (New Trendline)
Color = LocationRed = Indio
Orange = La QuintaYellow = Bermuda Dunes
Bermuda Dunes (New Trendline)
Indio(New Trendline)
15259.00 RecComps: PS The Concord GroupPage 241 of 332

EXHIBIT III-10A
ANALOG ANALYSIS - HISTORICAL HOME CLOSINGSANALOG MARKETS
1997-2015Thru 3Q15
Annual AveragePeriod: 1997 1998 1999 2000 2001 2002 2003 2004 2005 2006 2007 2008 2009 2010 2011 2012 2013 2014 2015 5-Yr 10-Yrthru 3q15New Home Closings
Big Bear Lake 13 16 37 32 27 30 31 49 26 21 13 13 11 4 4 9 8 8 18 7 12Growth (%) 23% 131% -14% -16% 11% 3% 58% -47% -19% -38% 0% -15% --- 0% 125% -11% 0% 125%% of 9 Cities 1% 1% 2% 1% 1% 1% 1% 1% 1% 1% 1% 1% 1% 1% 1% 2% 1% 1% 2%
Lake Silverwood 46 66 64 103 68 126 111 101 174 269 194 149 73 81 68 131 173 198 318 130 151Growth (%) 43% -3% 61% -34% 85% -12% -9% 72% 55% -28% -23% -51% --- -16% 93% 32% 14% 61%% of 9 Cities 4% 4% 3% 5% 3% 4% 4% 3% 5% 8% 8% 11% 9% 16% 15% 29% 30% 31% 40%
Lake Perris 124 111 149 47 63 79 360 661 827 564 480 216 202 262 35 30 4 27 118 72 265Growth (%) -10% 34% -68% 34% 25% 356% 84% 25% -32% -15% -55% -6% --- -87% -14% -87% 575% 337%% of 9 Cities 10% 6% 6% 2% 3% 3% 12% 19% 23% 16% 21% 15% 26% 51% 8% 7% 1% 4% 15%
Lake Elsinore 212 244 65 51 39 234 323 244 116 404 153 90 91 51 31 68 153 199 190 100 136Growth (%) 15% -73% -22% -24% 500% 38% -24% -52% 248% -62% -41% 1% --- -39% 119% 125% 30% -5%% of 9 Cities 18% 13% 3% 2% 2% 8% 11% 7% 3% 12% 7% 6% 12% 10% 7% 15% 27% 31% 24%
9 Cities 1,197 1,879 2,329 2,250 1,955 2,856 3,017 3,423 3,563 3,424 2,334 1,399 779 515 441 449 569 636 797 522 1,411Growth (%) 57% 24% -3% -13% 46% 6% 13% 4% -4% -32% -40% -44% --- -14% 2% 27% 12% 25%
Resale ClosingsBig Bear Lake 910 1,147 1,266 1,342 1,407 1,555 1,460 1,672 1,572 1,078 756 694 871 941 894 1,092 1,236 1,054 1,070 1,043 1,019
Growth (%) 26% 10% 6% 5% 11% -6% 15% -6% -31% -30% -8% 26% --- -5% 22% 13% -15% 2%% of 9 Cities 15% 14% 13% 14% 18% 16% 14% 13% 14% 13% 11% 9% 9% 10% 9% 10% 12% 11% 11%
Lake Silverwood 712 876 900 902 915 949 968 1,021 938 920 426 566 913 777 722 617 655 622 670 679 716Growth (%) 23% 3% 0% 1% 4% 2% 5% -8% -2% -54% 33% 61% --- -7% -15% 6% -5% 8%% of 9 Cities 12% 11% 9% 9% 12% 10% 9% 8% 9% 11% 6% 7% 9% 8% 7% 6% 6% 7% 7%
Lake Perris 488 678 652 579 570 613 695 707 908 991 425 1,267 1,715 1,146 993 750 625 612 658 825 943Growth (%) 39% -4% -11% -2% 8% 13% 2% 28% 9% -57% 198% 35% --- -13% -24% -17% -2% 8%% of 9 Cities 8% 8% 7% 6% 7% 6% 7% 6% 8% 12% 6% 16% 18% 12% 10% 7% 6% 7% 7%
Lake Elsinore 555 723 779 781 792 870 935 936 1,006 847 413 918 1,252 1,001 849 688 674 654 687 773 830Growth (%) 30% 8% 0% 1% 10% 7% 0% 7% -16% -51% 122% 36% --- -15% -19% -2% -3% 5%% of 9 Cities 9% 9% 8% 8% 10% 9% 9% 7% 9% 10% 6% 12% 13% 10% 8% 6% 6% 7% 7%
9 Cities 6,062 8,068 9,485 9,626 7,815 9,665 10,660 12,759 10,867 8,169 6,837 7,782 9,751 9,882 10,372 10,755 10,484 9,257 9,483 10,150 9,416Growth (%) 33% 18% 1% -19% 24% 10% 20% -15% -25% -16% 14% 25% --- 5% 4% -3% -12% 2%
New and resale home closings in Analog markets almost reached
10-year averages.
Residential market area defined by zip codes surrounding lakes.
15259.00 Analog Macro: HC-Vol Page 1 of 2 the concord groupPage 242 of 332

EXHIBIT III-10A
ANALOG ANALYSIS - HISTORICAL HOME CLOSINGSANALOG MARKETS
1997-2015Thru 3Q15
Annual AveragePeriod: 1997 1998 1999 2000 2001 2002 2003 2004 2005 2006 2007 2008 2009 2010 2011 2012 2013 2014 2015 5-Yr 10-Yrthru 3q15
New and resale home closings in Analog markets almost reached
10-year averages.
Residential market area defined by zip codes surrounding lakes.
New and Resale ClosingsBig Bear Lake 923 1,163 1,303 1,374 1,434 1,585 1,491 1,721 1,598 1,099 769 707 882 945 898 1,101 1,244 1,062 1,088 1,050 1,031
Growth (%) 26% 12% 5% 4% 11% -6% 15% -7% -31% -30% -8% 25% --- -5% 23% 13% -15% 2%% New of Total Sales 1% 1% 3% 2% 2% 2% 2% 3% 2% 2% 2% 2% 1% 0% 0% 1% 1% 1% 2%% of 9 Cities 13% 12% 11% 12% 15% 13% 11% 11% 11% 9% 8% 8% 8% 9% 8% 10% 11% 11% 11%
Lake Silverwood 758 942 964 1,005 983 1,075 1,079 1,122 1,112 1,189 620 715 986 858 790 748 828 820 988 809 867Growth (%) 24% 2% 4% -2% 9% 0% 4% -1% 7% -48% 15% 38% --- -8% -5% 11% -1% 20%% New of Total Sales 6% 7% 7% 10% 7% 12% 10% 9% 16% 23% 31% 21% 7% 9% 9% 18% 21% 24% 32%% of 9 Cities 10% 9% 8% 8% 10% 9% 8% 7% 8% 10% 7% 8% 9% 8% 7% 7% 7% 8% 10%
Lake Perris 612 789 801 626 633 692 1,055 1,368 1,735 1,555 905 1,483 1,917 1,408 1,028 780 629 639 776 897 1,208Growth (%) 29% 2% -22% 1% 9% 52% 30% 27% -10% -42% 64% 29% --- -27% -24% -19% 2% 21%% New of Total Sales 20% 14% 19% 8% 10% 11% 34% 48% 48% 36% 53% 15% 11% 19% 3% 4% 1% 4% 15%% of 9 Cities 8% 8% 7% 5% 6% 6% 8% 8% 12% 13% 10% 16% 18% 14% 10% 7% 6% 6% 8%
Lake Elsinore 767 967 844 832 831 1,104 1,258 1,180 1,122 1,251 566 1,008 1,343 1,052 880 756 827 853 877 874 966Growth (%) 26% -13% -1% 0% 33% 14% -6% -5% 11% -55% 78% 33% --- -16% -14% 9% 3% 3%% New of Total Sales 28% 25% 8% 6% 5% 21% 26% 21% 10% 32% 27% 9% 7% 5% 4% 9% 19% 23% 22%% of 9 Cities 11% 10% 7% 7% 9% 9% 9% 7% 8% 11% 6% 11% 13% 10% 8% 7% 7% 9% 9%
9 Cities 7,259 9,947 11,814 11,876 9,770 12,521 13,677 16,182 14,430 11,593 9,171 9,181 10,530 10,397 10,813 11,204 11,053 9,893 10,280 10,672 10,827Growth (%) 37% 19% 1% -18% 28% 9% 18% -11% -20% -21% 0% 15% --- 4% 4% -1% -10% 4%% New of Total Sales 16% 19% 20% 19% 20% 23% 22% 21% 25% 30% 25% 15% 7% 5% 4% 4% 5% 6% 8%
Note: Includes detached and attached product types (1) Refer to Exhibit I-1 for CMA and PMA market delineations
15259.00 Analog Macro: HC-Vol Page 2 of 2 the concord groupPage 243 of 332

EXHIBIT III-10B
ANALOG ANALYSIS - HISTORICAL MEDIAN PRICEANALOG MARKETS
1997-2015
Annual AveragePeriod: 1997 1998 1999 2000 2001 2002 2003 2004 2005 2006 2007 2008 2009 2010 2011 2012 2013 2014 2015 5-Yr 10-Yr
Median New Home Price (000s)Big Bear Lake $61 $153 $92 $151 $104 $139 $190 $242 $328 $487 $632 $506 $361 $338 $195 $258 $139 $316 $310 $249 $356
Growth (%) 152% -40% 64% -31% 34% 36% 27% 36% 49% 30% -20% -29% --- -42% 33% -46% 127% -2%% of 9 Cities 32% 68% 35% 50% 37% 47% 61% 69% 75% 105% 152% 145% 116% 112% 64% 82% 33% 68% 69%
Lake Silverwood $140 $148 $157 $159 $180 $176 $196 $269 $434 $526 $405 $358 $298 $305 $279 $306 $366 $393 $405 $330 $367Growth (%) 6% 6% 1% 13% -2% 12% 37% 61% 21% -23% -12% -17% --- -8% 10% 20% 7% 3%% of 9 Cities 73% 66% 60% 53% 64% 59% 63% 77% 99% 113% 97% 103% 96% 101% 91% 97% 86% 85% 90%
Lake Perris $109 $123 $130 $138 $156 $175 $224 $291 $361 $415 $348 $272 $196 $196 $197 $201 $216 $307 $343 $224 $271Growth (%) 13% 6% 6% 13% 12% 28% 30% 24% 15% -16% -22% -28% --- 1% 2% 7% 42% 12%% of 9 Cities 57% 54% 49% 46% 55% 58% 72% 83% 82% 89% 84% 78% 63% 65% 65% 64% 51% 67% 76%
Lake Elsinore $137 $142 $155 $180 $187 $221 $275 $363 $354 $386 $361 $284 $261 $276 $235 $253 $292 $342 $344 $279 $304Growth (%) 4% 9% 17% 4% 18% 24% 32% -3% 9% -7% -21% -8% --- -15% 7% 15% 17% 1%% of 9 Cities 71% 63% 59% 60% 66% 74% 88% 104% 81% 83% 87% 82% 84% 92% 77% 80% 69% 74% 77%
9 Cities $191 $225 $264 $300 $283 $298 $311 $350 $438 $465 $416 $348 $312 $301 $306 $314 $424 $461 $449 $361 $378Growth (%) 18% 17% 14% -6% 5% 4% 12% 25% 6% -11% -16% -10% --- 2% 3% 35% 9% -3%
Median Resale Home Price (000s)Big Bear Lake $95 $104 $108 $121 $130 $159 $191 $235 $300 $337 $334 $268 $233 $206 $177 $180 $210 $227 $248 $200 $247
Growth (%) 9% 4% 12% 7% 22% 20% 23% 28% 12% -1% -20% -13% --- -14% 2% 17% 8% 9%% of 9 Cities 78% 79% 77% 74% 73% 79% 80% 74% 77% 79% 81% 89% 112% 90% 82% 78% 77% 74% 82%
Lake Silverwood $80 $84 $90 $92 $115 $127 $155 $219 $305 $343 $331 $196 $131 $139 $142 $150 $193 $228 $253 $170 $216Growth (%) 5% 7% 2% 25% 10% 22% 41% 39% 13% -4% -41% -33% --- 2% 6% 29% 18% 11%% of 9 Cities 66% 64% 64% 56% 65% 63% 65% 69% 78% 80% 80% 65% 63% 61% 66% 65% 71% 75% 84%
Lake Perris $76 $76 $79 $95 $115 $135 $224 $240 $320 $372 $335 $176 $140 $152 $149 $150 $187 $223 $242 $172 $220Growth (%) 0% 4% 21% 21% 17% 66% 7% 33% 16% -10% -47% -21% --- -2% 1% 25% 19% 9%% of 9 Cities 62% 58% 56% 58% 65% 67% 94% 76% 82% 87% 81% 59% 67% 67% 69% 65% 68% 73% 80%
Lake Elsinore $84 $95 $109 $126 $143 $168 $208 $275 $347 $380 $338 $194 $141 $154 $159 $160 $208 $249 $269 $186 $233Growth (%) 13% 15% 16% 14% 17% 24% 32% 26% 10% -11% -43% -27% --- 3% 1% 30% 20% 8%% of 9 Cities 69% 72% 78% 76% 81% 83% 88% 87% 89% 89% 82% 65% 68% 68% 74% 69% 76% 82% 89%
9 Cities $122 $131 $140 $164 $177 $202 $238 $316 $389 $428 $414 $300 $208 $227 $215 $232 $274 $305 $303 $251 $299Growth (%) 8% 7% 17% 8% 14% 18% 33% 23% 10% -3% -28% -31% --- -6% 8% 18% 12% -1%
Note: Includes detached and attached product types (1) Refer to Exhibit I-1 for CMA and PMA market delineations
New home prices in most analog markets are above 10-year averages.
Residential market area defined by zip codes surrounding lakes.
15259.00 Analog Macro: HC-Med the concord groupPage 244 of 332

EXHIBIT III-10C
ANALOG ANALYSIS - NEW HOME INVENTORY MAPANALOG MARKETS
FEBRUARY 2016
Map TotalKey Project Name Builder UnitsBig Bear Lake
1 Ridgeview Legacy Homes 58
Lake Silverwood
2 Sycamore at Rosena Ranch Lennar 03 Silverleaf at Rosena Ranch D.R. Horton 684 Chaparral at Rosena Ranch Lennar 05 Cypress at Rosena Ranch Cal Atlantic Homes 976 Aster at Rosena Ranch Lennar 07 Sage at Rosena Ranch Lennar 0
Lake Perris
8 Steeplechase Richmond American Homes 09 Avelina Pulte Homes 300
Lake Elsinore
10 Monarch Grove at Summerly Cal Atlantic Homes 6411 Daybreak at Summerly McMillin Communities 15212 St. Andrews at Summerly Woodside Homes 7813 Meridian at Summerly Meritage Homes 10614 Sunrise Springs Cal Atlantic Homes 152
Source: Appendix IV-1A
2-7
1011-13
1
8
9
15259.00 Analog Comps: Loc-Analog The Concord GroupPage 245 of 332

EXHIBIT III-10D
ANALOG ANALYSIS - PERFORMANCEANALOG MARKETS
FEBRUARY 2016
Sales FloorplansMap Product Lot Units Month Home Base Price TaxKey Project Name Builder Type Size Total Rem. Start Sold Rate Num. Size $ $/sf HOA Rate
Big Bear Lake
1 Ridgeview Legacy Homes SFD 10,000 58 24 Nov-13 34 1.2 4 1,839 $371,500 $202 $0 1.3%
Subtotal/Average: 58 24 34 1.2 4 1,839 $371,500 $202 $0 1.3%
Lake Silverwood
2 Sycamore at Rosena Ranch Lennar SFD 0 0 0 Jan-00 0 0.0 3 3,625 $474,690 $131 $0 0.0%3 Silverleaf at Rosena Ranch D.R. Horton SFD 7,200 68 18 Dec-14 50 3.5 5 3,143 $439,186 $140 $117 2.2%4 Chaparral at Rosena Ranch Lennar SFD 0 0 0 Jan-00 0 0.0 5 2,773 $422,222 $152 $0 0.0%5 Cypress at Rosena Ranch Cal Atlantic Homes SFD 6,700 97 40 Jun-14 57 2.8 3 2,748 $421,450 $153 $97 1.3%6 Aster at Rosena Ranch Lennar SFD 0 0 0 Jan-00 0 0.0 3 2,319 $392,244 $169 $0 0.0%7 Sage at Rosena Ranch Lennar SFD 0 0 0 Jan-00 0 0.0 3 1,898 $373,057 $197 $0 0.0%
Subtotal/Average: 165 58 107 1.1 22 2,911 $428,759 $147 $105 1.7%
Lake Perris
8 Steeplechase Richmond American Homes SFD 0 0 0 Jan-00 0 0.0 5 2,832 $334,190 $118 $0 0.0%9 Avelina Pulte Homes SFD 7,200 300 210 Oct-14 90 5.5 5 2,629 $316,990 $121 $43 2.0%
Subtotal/Average: 300 210 90 2.8 10 2,629 $316,990 $121 $43 2.0%
Lake Elsinore
10 Monarch Grove at Summerly Cal Atlantic Homes SFD 0 64 64 Jan-00 0 0.0 3 2,876 $386,842 $135 $117 1.8%11 Daybreak at Summerly McMillin Communities SFD 18,000 152 142 Mar-14 10 0.4 4 2,756 $351,718 $128 $0 0.0%12 St. Andrews at Summerly Woodside Homes SFD 5,000 78 33 Nov-14 45 2.9 3 2,025 $324,990 $160 $118 1.9%13 Meridian at Summerly Meritage Homes TH --- 106 103 Mar-15 3 0.3 4 2,472 $335,240 $136 $0 1.3%14 Sunrise Springs Cal Atlantic Homes SFD 12,000 152 135 Mar-14 17 0.7 3 1,718 $312,545 $182 $0 0.0%
Subtotal/Average: 551 476 75 0.9 17 2,327 $338,073 $145 $30 0.7%
Total/Average: 1,074 768 306 1.5 53 2,474 $347,921 $141 $44 1.3%
Source: Appendix CNote: Weighted averages
15259.00 Analog Comps: Inv-Analog The Concord GroupPage 246 of 332

EXHIBIT III-10E
ANALOG ANLYSIS - INVENTORY RESALE - BUILT POST 2000 ANALOG MARKETS
LAST ONE YEAR ENDING FEBRUARY 2016
LocationWaterfront Inland
Map Year Home Sale Price Waterfront Premium % Year Home Sale PriceKey Neighborhood Sales Built Size $ $/Sf $ $/Sf Sales Built Size $ $/SfA Big Bear 13 2000 2,972 $889,538 $299 67% 16% 9 2008 2,069 $532,544 $257B Canyon Lake 32 2004 3,221 $400,142 $124 14% -4% 24 2009 2,708 $349,877 $129C Perris 19 2009 2,574 $298,653 $116 14% 14% 6 2005 2,561 $260,833 $102D Lake Elsinore 31 2005 2,212 $288,111 $130 -8% 1% 20 2001 2,427 $313,565 $129
95 2005 2,728 $410,257 $150 14% 0% 59 2005 2,500 $345,216 $138
AC
B
D
Homes closer to bodies of water earned a 14% price premium on average.
15259.00 Analog Resales: Analog Resales The Concord GroupPage 247 of 332

The Concord Group
IV. INDUSTRIAL
Page 248 of 332

EXHIBIT IV-1-A
MAP OF MAJOR INDUSTRIAL - CURRENT AND PLANNEDCOACHELLA VALLEY
FEBRUARY 2016
Color = Status
Yellow = ExistingGreen = Under Construction
Blue = Planned
A majority of the planned industrial projects are north of the Interstate 10-fwy in Desert Hot Springs. All of the existing projects are located south of the Interstate
10-fwy.
15529.00 Industrial Maps: Industrial- Current and Planned The Concord GroupPage 249 of 332

EXHIBIT IV-1-B
MAP OF MAJOR INDUSTRIAL - CURRENT AND PLANNEDIMPERIAL COUNTY
MARCH 2016
*** Currently no industrial inventory existing or planned in the Imperial County Opportunity Areas ***
Color = Status
Yellow = ExistingGreen = Under Construction
Blue = Planned
15529.00 Industrial Maps Ph. 2: Industrial- Current and Planned The Concord GroupPage 250 of 332

EXHIBIT IV-2-A
INDUSTRIAL MACRO MARKET PERFORMANCECOACHELLA VALLEY
2007 THROUGH 2015
AverageMarket Factor (SF) 2007 2008 2009 2010 2011 2012 2013 2014 2015 5- Year 2007-2015
Total RBA 10,385,916 10,970,468 11,108,118 11,113,118 11,113,118 11,090,703 11,090,703 11,099,824 11,194,363 11,117,742 11,018,481% Growth 5.6% 1.3% 0.0% 0.0% -0.2% 0.0% 0.1% 0.9% 0.2% 0.9%
Net Deliveries 584,552 137,650 5,000 0 (22,415) 0 9,121 94,539 16,249 101,056
Occupancy Rate 90.7% 85.4% 84.3% 85.2% 88.9% 90.4% 93.6% 92.2% 90.9% 91.2% 89.1%% Growth -5.8% -1.3% 1.1% 4.3% 1.7% 3.5% -1.5% -1.4% 1.3% 0.1%
Occupied Stock 9,420,026 9,368,780 9,364,143 9,468,377 9,879,562 10,025,996 10,380,898 10,234,038 10,175,676 10,139,234 9,813,055% Growth -0.5% 0.0% 1.1% 4.3% 1.5% 3.5% -1.4% -0.6% 0.7% 1.0%
Net Absorption (51,246) (4,636) 104,233 411,185 146,434 354,902 (146,860) (58,362) 141,460 94,456
Lease Rate $11.12 $9.70 $8.38 $7.34 $7.40 $7.05 $7.12 $7.48 $8.40 $7.49 $8.22% Growth -12.8% -13.6% -12.4% 0.8% -4.7% 1.0% 5.1% 12.3% 3.2% -3.4%
Note: "RBA" - Rentable Building AreaSource: CoStar
585
138
5 0
-22
0 9
9590.7%
85.4% 84.3% 85.2%
88.9%
90.4%
93.6%
92.2%90.9%
83.0%
85.0%
87.0%
89.0%
91.0%
93.0%
95.0%
97.0%
(100)
0
100
200
300
400
500
600
2007 2008 2009 2010 2011 2012 2013 2014 2015
Coachella Valley Deliveries and Occupancy
Deliveries Occupancy
Squa
re F
eet (
000'
s)
$11.12
$9.70
$8.38
$7.34 $7.40$7.05 $7.12
$7.48
$8.40
$6.00
$7.00
$8.00
$9.00
$10.00
$11.00
$12.00
2007 2008 2009 2010 2011 2012 2013 2014 2015
Lease
94k s.f. of industrial space delivered in 2015, the first significant delivery of industrial space
since 2009. Currently at 91% occupancy, above 10-year average.
15259.00 Industrial Macro Market Trends: Macro Market - CV The Concord GroupPage 251 of 332

EXHIBIT IV-2-B
INDUSTRIAL MACRO MARKET PERFORMANCECOACHELLA VALLEY, RIVERSIDE COUNTY, IMPERIAL COUNTY
2007 THROUGH 2015
AverageMarket Factor (SF) 2007 2008 2009 2010 2011 2012 2013 2014 2015 5- Year 2007-2015
Total RBARiverside County 149,615,332 157,664,933 160,576,153 160,517,560 162,810,451 165,647,110 168,735,762 177,021,111 181,071,230 171,057,133 164,851,071Coachella Valley 10,385,916 10,970,468 11,108,118 11,113,118 11,113,118 11,090,703 11,090,703 11,099,824 11,194,363 11,117,742 11,018,481
% Riverside County 7% 7% 7% 7% 7% 7% 7% 6% 6% 6% 7%Imperial County 3,132,209 3,382,009 3,382,009 3,382,009 3,382,009 3,382,009 3,382,009 3,488,505 3,488,505 3,424,607 3,377,919
% Riverside County 2% 2% 2% 2% 2% 2% 2% 2% 2% 2% 2%
Net DeliveriesRiverside County 8,049,601 2,911,220 (58,593) 2,292,891 2,836,659 3,088,652 8,285,349 4,050,119 4,110,734 3,931,987Coachella Valley 584,552 137,650 5,000 0 (22,415) 0 9,121 94,539 16,249 101,056
% Riverside County 7% 5% -9% 0% -1% 0% 0% 2% 0% 3%Imperial County 249,800 0 0 0 0 0 106,496 0 21,299 44,537
% Riverside County 3% 0% 0% 0% 0% 0% 1% 0% 1% 1%
Occupancy RateRiverside County 92.7% 89.2% 86.7% 89.2% 91.7% 92.3% 94.5% 95.2% 95.7% 93.9% 91.9%Coachella Valley 90.7% 85.4% 84.3% 85.2% 88.9% 90.4% 93.6% 92.2% 90.9% 91.2% 89.1%Imperial County 95.8% 92.1% 81.9% 88.1% 84.8% 82.4% 83.1% 80.9% 80.2% 82.3% 85.5%
Occupied StockRiverside County 138,693,413 140,637,120 139,219,525 143,181,664 149,297,184 152,892,283 159,455,295 168,524,098 173,285,167 160,690,805 151,687,305Coachella Valley 9,420,026 9,368,780 9,364,143 9,468,377 9,879,562 10,025,996 10,380,898 10,234,038 10,175,676 10,139,234 9,813,055
% Riverside County 7% 7% 7% 7% 7% 7% 7% 6% 6% 6% 6%Imperial County 3,000,656 3,114,830 2,769,865 2,979,550 2,867,944 2,786,775 2,810,449 2,822,201 2,797,781 2,817,030 2,883,339
% Riverside County 2% 2% 2% 2% 2% 2% 2% 2% 2% 2% 2%
Net AbsorptionRiverside County 1,943,707 (1,417,596) 3,962,139 6,115,520 3,595,099 6,563,013 9,068,803 4,761,069 6,020,701 4,323,969Coachella Valley (51,246) (4,636) 104,233 411,185 146,434 354,902 (146,860) (58,362) 141,460 94,456
% Riverside County -3% 0% 3% 7% 4% 5% -2% -1% 2% 2%Imperial County 114,174 (344,965) 209,685 (111,606) (81,168) 23,674 11,751 (24,420) (36,354) (25,359)
% Riverside County 6% 24% 5% -2% -2% 0% 0% -1% -1% -1%
Lease RateRiverside County $6.32 $5.73 $4.60 $4.34 $4.43 $4.98 $4.52 $5.33 $5.68 $4.99 $5.10
% Growth -10% -25% -6% 2% 11% -10% 15% 6% 3% -3%Coachella Valley $11.12 $9.70 $8.38 $7.34 $7.40 $7.05 $7.12 $7.48 $8.40 $7.49 $8.22
% Growth -15% -16% -14% 1% -5% 1% 5% 11% 3% -3%Imperial County $5.10 $4.90 $5.00 $5.00 $4.19 $2.80 $5.06 $5.09 $5.08 $4.44 $4.69
% Growth -4% 2% 0% -19% -50% 45% 1% 0% 3% -3%
Source: CoStar
Coachella Valley has a larger share of industrial inventory rentable building area than Imperial
County. Imperial County had more deliveries in the last 5 years than Coachella Valley. Lease
rates have increased by 3% in all market areas in the last 5 years.
15259.00 Industrial Macro Market Trends: Macro Market - CV,IV,RC The Concord GroupPage 252 of 332
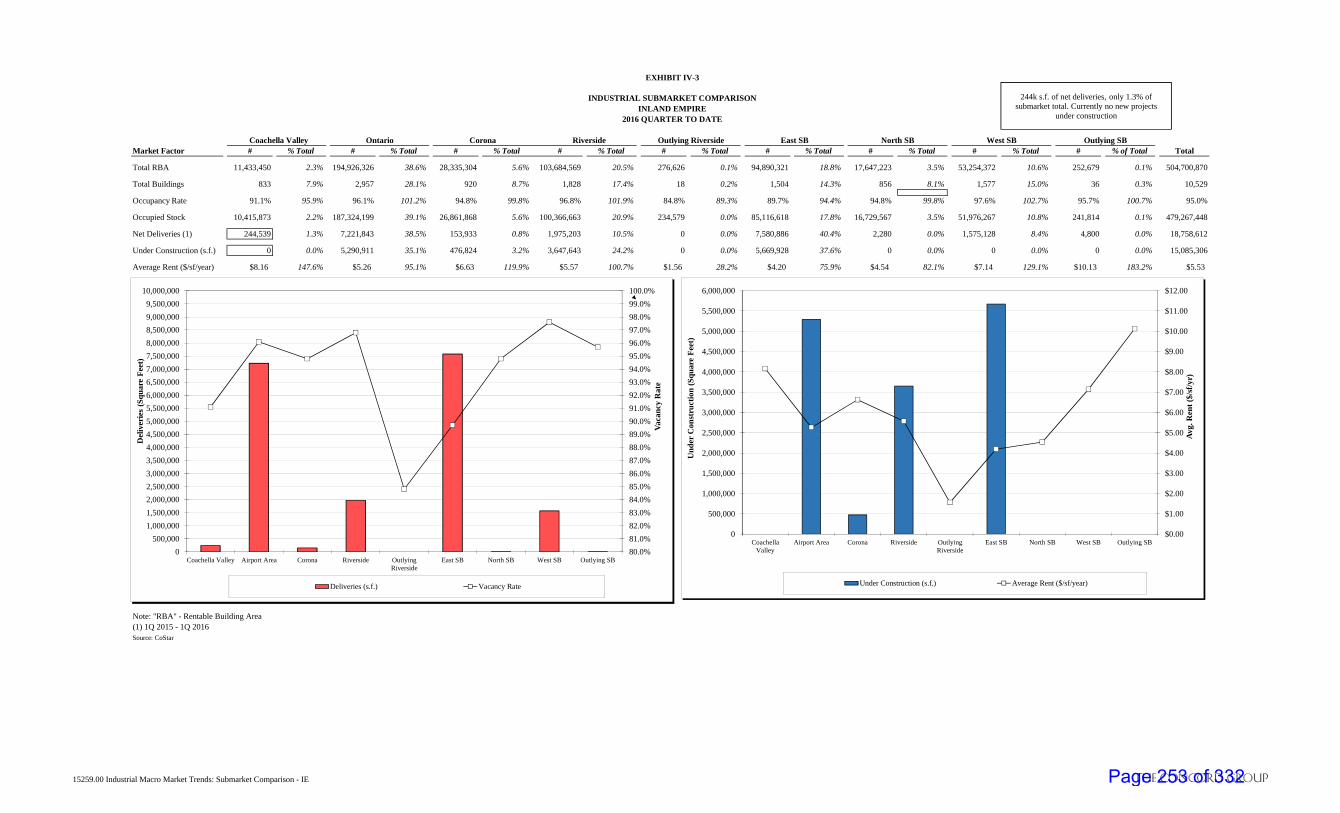
EXHIBIT IV-3
INDUSTRIAL SUBMARKET COMPARISONINLAND EMPIRE
2016 QUARTER TO DATE
Coachella Valley Ontario Corona Riverside Outlying Riverside East SB North SB West SB Outlying SBMarket Factor # % Total # % Total # % Total # % Total # % Total # % Total # % Total # % Total # % of Total Total
Total RBA 11,433,450 2.3% 194,926,326 38.6% 28,335,304 5.6% 103,684,569 20.5% 276,626 0.1% 94,890,321 18.8% 17,647,223 3.5% 53,254,372 10.6% 252,679 0.1% 504,700,870
Total Buildings 833 7.9% 2,957 28.1% 920 8.7% 1,828 17.4% 18 0.2% 1,504 14.3% 856 8.1% 1,577 15.0% 36 0.3% 10,529
Occupancy Rate 91.1% 95.9% 96.1% 101.2% 94.8% 99.8% 96.8% 101.9% 84.8% 89.3% 89.7% 94.4% 94.8% 99.8% 97.6% 102.7% 95.7% 100.7% 95.0%
Occupied Stock 10,415,873 2.2% 187,324,199 39.1% 26,861,868 5.6% 100,366,663 20.9% 234,579 0.0% 85,116,618 17.8% 16,729,567 3.5% 51,976,267 10.8% 241,814 0.1% 479,267,448
Net Deliveries (1) 244,539 1.3% 7,221,843 38.5% 153,933 0.8% 1,975,203 10.5% 0 0.0% 7,580,886 40.4% 2,280 0.0% 1,575,128 8.4% 4,800 0.0% 18,758,612
Under Construction (s.f.) 0 0.0% 5,290,911 35.1% 476,824 3.2% 3,647,643 24.2% 0 0.0% 5,669,928 37.6% 0 0.0% 0 0.0% 0 0.0% 15,085,306
Average Rent ($/sf/year) $8.16 147.6% $5.26 95.1% $6.63 119.9% $5.57 100.7% $1.56 28.2% $4.20 75.9% $4.54 82.1% $7.14 129.1% $10.13 183.2% $5.53
Note: "RBA" - Rentable Building Area(1) 1Q 2015 - 1Q 2016Source: CoStar
80.0%
81.0%
82.0%
83.0%
84.0%
85.0%
86.0%
87.0%
88.0%
89.0%
90.0%
91.0%
92.0%
93.0%
94.0%
95.0%
96.0%
97.0%
98.0%
99.0%
100.0%
0
500,000
1,000,000
1,500,000
2,000,000
2,500,000
3,000,000
3,500,000
4,000,000
4,500,000
5,000,000
5,500,000
6,000,000
6,500,000
7,000,000
7,500,000
8,000,000
8,500,000
9,000,000
9,500,000
10,000,000
Coachella Valley Airport Area Corona Riverside OutlyingRiverside
East SB North SB West SB Outlying SB
Vac
ancy
Rat
e
Del
iver
ies
(Sq
uar
e F
eet)
Deliveries (s.f.) Vacancy Rate
$0.00
$1.00
$2.00
$3.00
$4.00
$5.00
$6.00
$7.00
$8.00
$9.00
$10.00
$11.00
$12.00
0
500,000
1,000,000
1,500,000
2,000,000
2,500,000
3,000,000
3,500,000
4,000,000
4,500,000
5,000,000
5,500,000
6,000,000
CoachellaValley
Airport Area Corona Riverside OutlyingRiverside
East SB North SB West SB Outlying SB
Avg
. Ren
t ($
/sf/
yr)
Un
der
Con
stru
ctio
n (
Sq
uar
e F
eet)
Under Construction (s.f.) Average Rent ($/sf/year)
244k s.f. of net deliveries, only 1.3% of submarket total. Currently no new projects
under construction
15259.00 Industrial Macro Market Trends: Submarket Comparison - IE The Concord GroupPage 253 of 332

EXHIBIT IV-4-A
INDUSTRIAL INVENTORY TABLEEASTERN COACHELLA VALLEY
FEBRUARY 2016
Year $/SFBuilding Name Address Built Renov. Property Type RBA Occ. Yr Mo. Lease Type
Coachella
85177 Peter Rabbit Ln Manufacturing 142,574 100.0% --- ---85901 Avenue 53 Manufacturing 140,000 100.0% --- ---86770 Industrial Way Warehouse 73,264 100.0% --- ---85215 Avenue 50 Manufacturing 72,002 100.0% --- ---
Coca-Cola New Sales Center @ Coachella 86375 Industrial Way 2009 Manufacturing 61,512 100.0% --- ---Rancho Coachella Business Center 53462 Enterprise Way 2008 Warehouse 48,000 100.0% --- ---
86650 Industrial Way 2015 Warehouse 41,909 100.0% --- ---86301 Industrial Way 2015 Manufacturing 40,232 100.0% --- ---
Rancho Coachella Business Center 2 86705 Avenue 54 1991 Warehouse 31,600 100.0% $9.00 $0.75 Direct - Modified Gross1255 Grapefruit Blvd Refrigeration/Cold Storage 29,558 100.0% --- ---52112 Industrial Way 1989 Warehouse 27,433 100.0% --- ---84701 Avenue 48 1983 Manufacturing 26,672 100.0% --- ---
Rancho Coachella Business Center 3 86695 Avenue 54 1991 Manufacturing 18,960 100.0% --- --- Direct - Industrial Gross16,100 SF Industrial Building 85400 Grapefruit Blvd Warehouse 16,100 100.0% --- ---
49970 Grapefruit Blvd Warehouse 13,284 100.0% --- ---53800 Polk St 1975 Warehouse 13,200 100.0% --- ---85610 Grapefruit Blvd Warehouse 11,011 100.0% --- ---49600 Oates Ln Warehouse 8,854 100.0% --- ---53600 Polk St 8,550 100.0% --- ---86998 Avenue 52 Warehouse 8,250 100.0% --- ---
Rancho Coachella Business Center 4 86665 Avenue 54 1991 Warehouse 7,908 100.0% --- ---Rancho Coachella Business Center 5 86675 Avenue 54 1991 Warehouse 7,060 100.0% $6.00 $0.50 Direct - Industrial Gross
52050 Industrial Way Warehouse 7,020 100.0% --- ---49959 Grapefruit Blvd Warehouse 6,645 100.0% --- ---
Rancho Coachella Business Center 6 86685 Avenue 54 1991 6,196 100.0% --- ---84969 Avenue 48 Warehouse 5,500 100.0% --- ---85096 Avenue 50 Service 5,442 100.0% --- ---
Anthony Vineyards 52301 Enterprise Way 1989 Manufacturing 4,500 100.0% --- ---50503 Van Buren St 1989 4,200 100.0% --- ---51686 Harrison St Warehouse 3,846 100.0% --- ---1190 Orchard St Warehouse 3,791 100.0% --- ---52101 Industrial Way 3,500 100.0% --- ---85591 Hwy 111 1940 3,400 100.0% --- ---
Coachella Professional Center 941 Orchard Ave Warehouse 3,000 100.0% --- ---85980 Grapefruit Blvd Warehouse 2,594 100.0% --- ---85591 Grapefruit Blvd Warehouse 2,565 100.0% --- ---53225 Harrison St Warehouse 2,021 100.0% --- ---1577 1st St 1989 Manufacturing 2,000 100.0% --- ---85677 Grapefruit Blvd Warehouse 1,934 100.0% --- ---
Presision Gunite 86010 Tyler Ln Service 1,632 0.0% Withheld ---Coachella Total/Average: 917,719 99.8% $7.50 $0.63
4.9 million s.f. of in East Coachella Valley at 90.5% occupancy. $7.32 annual rent or
$.61 per month.
15259.00 Industrial RecComps:Inv Page 1 of 7 The Concord GroupPage 254 of 332

EXHIBIT IV-4-A
INDUSTRIAL INVENTORY TABLEEASTERN COACHELLA VALLEY
FEBRUARY 2016
Year $/SFBuilding Name Address Built Renov. Property Type RBA Occ. Yr Mo. Lease Type
4.9 million s.f. of in East Coachella Valley at 90.5% occupancy. $7.32 annual rent or
$.61 per month.
Indio
82851 Avenue 45 Distribution 213,952 100.0% --- ---82585 Showcase Pky Manufacturing 102,000 80.6% $7.29 $0.61 Direct - Industrial Gross84401 Cabazon Center Dr 2008 Warehouse 59,800 100.0% --- ---
Golden Triangle Park - Imperial Space 82579 Fleming Way 2002 Warehouse 53,512 71.2% $8.28 $0.69 Direct - Modified Gross45585 Commerce St 1969 Manufacturing 50,700 100.0% $5.40 $0.45 Direct - Industrial Gross
Indio Industrial Building 82309 Market St 1989 Warehouse 46,600 100.0% Withheld ---Indio Industrial Park 83680 Citrus Ave 1985 Manufacturing 46,200 100.0% $4.68 $0.39 Direct - Modified GrossGolden Triangle Business Park 82611 Fleming Way 2007 Manufacturing 45,522 0.0% $8.28 $0.69 Direct - Modified GrossFerguson Enterprises 81925 Industrial Pl 2006 Manufacturing 42,000 100.0% --- ---
82355 Market St 2003 Manufacturing 37,364 100.0% --- ---83925 Fir St 1955 2007 Service 36,200 100.0% --- ---83775 Citrus Ave 2009 Manufacturing 36,055 100.0% --- ---
Golf Center Business Park 44903-44909 Golf Center Pky Warehouse 35,800 77.2% $5.46 $0.46 Direct - Triple Net45435 Van Buren St 1987 Warehouse 35,390 100.0% --- --- Direct - Triple Net45605 Citrus Ave 1989 Warehouse 35,000 100.0% --- ---
Menage Building 83-711 Peach St 1965 Distribution 34,200 71.4% $3.47 $0.29 Direct - Triple Net83637 Doctor Carreon Blvd Warehouse 33,411 100.0% --- ---82613 Indio Blvd Warehouse 32,500 35.1% $4.68 $0.39 Direct - Modified Gross44752 Jackson St 1951 Service 32,186 100.0% --- ---
Citrus Business Center 83750 Citrus Ave 2007 Warehouse 32,000 61.9% $6.60 $0.55 Direct - Modified Gross83855 Tamarisk Ave 1996 Manufacturing 31,654 100.0% --- ---
Ac Houston Lumber Company 84391 Cabazon Rd 1970 Manufacturing 31,000 100.0% --- ---82025 Avenue 44 2000 Manufacturing 30,000 100.0% --- ---83810 Vin Deo Cir 1990 Warehouse 28,500 100.0% --- --- Direct - Modified Gross83480 Avenue 45 Warehouse 27,500 100.0% --- ---83241 Highway 111 Truck Terminal 25,732 100.0% --- ---42805 Madio St Warehouse 25,352 0.0% $9.96 $0.83 Direct - Triple Net
Golf Center Industrial Plaza- Bldg F (II) 45100 Golf Center Pky 2007 Warehouse 24,000 100.0% --- ---Golden Triangle Park - Fulton Distribution 82689 Avenue 45 Warehouse 23,627 100.0% --- ---Madison Business Park 81077 Indio Blvd 2007 Manufacturing 23,617 90.4% $6.60 $0.55 Direct - Modified GrossGolden Triangle Park - Bldg 2 82733 Market St 1996 Manufacturing 22,719 100.0% --- --- Direct - Modified Gross
43850 Monroe St Warehouse 22,510 64.5% $4.56 $0.38 Direct - Modified Gross(Southland Insulation, Inc.) 45630 Citrus Ave 1989 Warehouse 22,430 100.0% $8.10 $0.68 Direct - Industrial Gross
83311 Avenue 45 2009 Service 21,953 100.0% --- ---80975 Indio Blvd Warehouse 21,910 100.0% --- ---
Golf Center Business Park Phase II 45090 Golf Center Pky 2006 Warehouse 21,000 100.0% $7.20 $0.60 Direct - Modified Gross81800 Trader Pl 1989 Warehouse 20,950 100.0% --- ---45116 Commerce St 1987 Service 20,565 93.0% $7.80 $0.65 Direct - Triple Net81161 Indio Blvd 1986 Warehouse 20,400 100.0% --- ---45610 Citrus Ave Warehouse 20,163 100.0% --- ---82860 Avenue 45 2002 Warehouse 20,000 100.0% --- ---45600 Citrus Ave Warehouse 20,000 100.0% --- ---83740 Citrus Ave 1989 Service 20,000 90.0% $6.00 $0.50 Direct - Industrial Gross
15259.00 Industrial RecComps:Inv Page 2 of 7 The Concord GroupPage 255 of 332

EXHIBIT IV-4-A
INDUSTRIAL INVENTORY TABLEEASTERN COACHELLA VALLEY
FEBRUARY 2016
Year $/SFBuilding Name Address Built Renov. Property Type RBA Occ. Yr Mo. Lease Type
4.9 million s.f. of in East Coachella Valley at 90.5% occupancy. $7.32 annual rent or
$.61 per month.
Madison Center 80975 Indio Blvd 1989 Warehouse 20,000 100.0% --- ---81781-81791 Oleander Ave 1990 Manufacturing 19,760 100.0% --- ---82219 Market St Warehouse 19,599 100.0% --- ---84464 Cabazon Center Dr 2001 Warehouse 19,476 100.0% --- ---
Oates Industrial Park - Bldg I 82855 Market St 2008 Warehouse 19,398 74.2% Withheld --- Direct - Modified GrossIndio Industrial Center 45480 Commerce St 1980 Warehouse 19,000 100.0% --- ---
83795 Date Ave Food Processing 18,731 100.0% --- ---Oates Industrial Park - Bldg J 82855 Market St 2008 Warehouse 18,709 0.0% Withheld --- Direct - Modified GrossSelect Build Building 45311 Golf Center Pky Warehouse 18,682 100.0% $7.08 $0.59 Direct - Industrial Gross
45050 Golf Center Pky 2003 Warehouse 18,400 100.0% --- ---79431 Country Club Dr Warehouse 17,485 100.0% --- ---42250 Spectrum St Warehouse 17,155 100.0% --- ---
Uptown Business Park 82680 Showcase Pky 2006 Warehouse 17,100 53.5% $9.48 $0.79 Direct - Modified GrossCitrus Business Bldgs 45625 Citrus Ave Warehouse 16,909 60.1% $8.10 $0.68 Direct - Industrial GrossGolden Trianlge Park - Taymar Space 82775 Market St 1990 Warehouse 16,718 13.4% $8.16 $0.68 Direct - Modified Gross
83651 Avenue 45 2005 Warehouse 16,190 54.5% $8.28 $0.69 Direct - Modified GrossThe Hub Building 81760 Oleander Ave 2006 Warehouse 16,000 100.0% --- ---
83777 Avenue 45 Warehouse 15,514 100.0% --- ---Golden Trianlge Park - Bldg C 82579 Fleming St Warehouse 15,461 100.0% --- ---Golden Trianlge Park - Bldg 3 44596 Patton Way Warehouse 15,085 100.0% --- --- Direct - Industrial GrossOates Industrial Park - Bldg B 82855 Market St 2008 Warehouse 15,022 66.7% Withheld --- Direct - Modified GrossOates Industrial Park - Bldg A 82855 Market St 2008 Warehouse 15,022 66.7% Withheld --- Direct - Modified GrossSpectrum Business Park - Bldg 3 42270 Spectrum St 2007 Warehouse 15,020 100.0% --- ---
43181 Sunburst St Warehouse 14,650 100.0% --- ---81500 Industrial Pl 1978 Warehouse 14,520 100.0% --- ---44909 Golf Center Pky Warehouse 14,379 100.0% --- ---
Precision Cabinets 81101 Indio Blvd Manufacturing 14,212 100.0% --- ---Golf Center Business Park - Phase 1 45080 Golf Center Pky Warehouse 14,189 100.0% --- ---
44907 Golf Center Pky Warehouse 14,182 100.0% --- ---81-735 Oleander Rd 2006 Warehouse 14,160 0.0% $7.92 $0.66 Direct - Modified Gross
Bollman Building 83211 Hwy 111 1989 Warehouse 14,000 48.6% $5.52 $0.46 Direct - Modified Gross44925 Jackson St 1989 Manufacturing 13,800 0.0% $8.40 $0.70 Direct - Industrial Gross43180 Sunburst St Warehouse 13,101 100.0% --- ---
Hertz Equipment Rental 81495 Industrial Pl Warehouse 13,008 100.0% --- ---83801 Citrus Ave Warehouse 12,810 100.0% --- ---
Golf Center Business Park 44901 Golf Center Pky 1981 Warehouse 12,441 75.9% $8.40 $0.70 Direct - Triple Net83420 Indio Blvd Warehouse 12,142 100.0% --- ---81501 Industrial Pl 1989 Warehouse 12,000 100.0% --- ---
Oates Industrial Park - Bldg F 82855 Market St 2008 Warehouse 12,000 100.0% --- --- Direct - Modified GrossOates Industrial Park - Bldg D 82855 Market St 2008 Warehouse 12,000 50.0% Withheld --- Direct - Modified GrossGolf Center Industrial Plaza- Bldg C (II) 45120 Golf Center Pky 2007 Warehouse 11,600 100.0% --- ---
79893 Country Club Dr Service 11,502 100.0% --- ---79253 Country Club Dr 1994 Warehouse 11,500 100.0% --- ---
15259.00 Industrial RecComps:Inv Page 3 of 7 The Concord GroupPage 256 of 332

EXHIBIT IV-4-A
INDUSTRIAL INVENTORY TABLEEASTERN COACHELLA VALLEY
FEBRUARY 2016
Year $/SFBuilding Name Address Built Renov. Property Type RBA Occ. Yr Mo. Lease Type
4.9 million s.f. of in East Coachella Valley at 90.5% occupancy. $7.32 annual rent or
$.61 per month.
Spectrum Business Park - Bldg 5 82625 Showcase Pky 2007 Warehouse 11,353 100.0% --- ---Spectrum Business Park - Bldg 6 82645 Showcase Pky 2007 Warehouse 11,250 100.0% --- ---
83876 Avenue 45 1981 Warehouse 11,000 100.0% --- ---Golf Center Industrial Plaza- Bldg G (II) 45130 Golf Center Pky 2007 Warehouse 11,000 100.0% --- ---
45875 Commerce St 2007 Manufacturing 10,800 100.0% --- ---79833 Country Club Dr 1994 Warehouse 10,800 100.0% --- ---
Enterprise Industrial Park 83930 Dr. Carreon Blvd 1966 2007 Warehouse 10,800 100.0% --- ---Elm Equipment Rentals, Inc. 81531 Industrial Pl Warehouse 10,450 100.0% --- ---
45900 Commerce St 2007 Manufacturing 10,400 100.0% $6.00 $0.50 Direct - Industrial GrossDeser County Plaza - Building #9 79225 Country Club Dr Warehouse 10,300 100.0% --- ---
79345 Country Club Dr 1987 Warehouse 10,228 100.0% $7.80 $0.65 Direct - Industrial Gross83888 45th Ave 2002 Warehouse 10,000 0.0% $7.20 $0.60 Direct - Plus Electric79521 Country Club Dr 1989 Warehouse 10,000 100.0% --- ---
Oates Industrial Park - Bldg H 82855 Market St 2008 Warehouse 10,000 100.0% --- ---Oates Industrial Park - Bldg E 82855 Market St 2008 Warehouse 10,000 0.0% $7.80 $0.65 Direct - Modified Gross
81101 Indio Blvd Warehouse 10,000 100.0% Withheld ---Oates Industrial Park - Bldg G 82855 Market St 2008 Warehouse 10,000 50.0% Withheld --- Direct - Modified GrossOates Industrial Park - Bldg C 82855 Market St 2008 Warehouse 10,000 25.0% Withheld --- Direct - Modified Gross
83752 Avenue 45 Manufacturing 9,975 100.0% --- ---81785 Trader Pl Warehouse 9,898 100.0% --- ---79607 Country Club Dr 1985 Service 9,777 83.6% $8.40 $0.70 Direct - Industrial Gross79919 Country Club Dr Warehouse 9,725 100.0% --- ---82740 Atlantic Ave 2005 Warehouse 9,563 100.0% $8.28 $0.69 Direct - Modified Gross82750 Atlantic Ave Warehouse 9,563 100.0% --- ---79141 Country Club Dr Warehouse 9,300 100.0% --- --- Direct - Modified Gross
Golden Triangle Park - A 82579 Fleming Way Warehouse 9,260 100.0% --- ---83900 Avenue 45 1979 Warehouse 9,200 100.0% --- ---79867 Country Club Dr Warehouse 8,522 100.0% --- ---
Bldg A 81824 Trader Pl 1979 2008 Warehouse 8,400 0.0% $5.40 $0.45 Direct - Modified GrossBldg B 81824 Trader Pl 1980 Manufacturing 8,400 100.0% --- ---Bldg D 81824 Trader Pl 1980 Warehouse 8,400 57.1% $7.08 $0.59 Direct - Modified Gross
83810 Vin Deo Cir Warehouse 8,324 100.0% --- ---45524 Towne St Manufacturing 8,281 100.0% --- ---83860 Tamarisk Ave Manufacturing 8,048 100.0% --- ---83256 Indio Blvd Warehouse 8,000 100.0% --- ---45920 Commerce St 2007 Warehouse 7,954 100.0% --- --- Direct - Industrial Gross83792 Avenue 45 1970 Manufacturing 7,850 0.0% $4.80 $0.40 Direct - Modified Gross79811B Country Club Dr Warehouse 7,830 100.0% --- ---
Van Buren Business Park 46299 Van Buren St Warehouse 7,764 46.2% $7.08 $0.59 Direct - Modified GrossVan Buren Business Park 46211 Van Buren Blvd 2007 Warehouse 7,740 100.0% Withheld ---Anderson Facility II 46167 Van Buren St 2006 Warehouse 7,606 0.0% Withheld ---
83651 Doctor Carreon Blvd 1969 Warehouse 7,600 100.0% --- ---44300 Sun Gold St 1970 Warehouse 7,600 100.0% --- ---83963 Indio Blvd Warehouse 7,557 100.0% --- ---
15259.00 Industrial RecComps:Inv Page 4 of 7 The Concord GroupPage 257 of 332

EXHIBIT IV-4-A
INDUSTRIAL INVENTORY TABLEEASTERN COACHELLA VALLEY
FEBRUARY 2016
Year $/SFBuilding Name Address Built Renov. Property Type RBA Occ. Yr Mo. Lease Type
4.9 million s.f. of in East Coachella Valley at 90.5% occupancy. $7.32 annual rent or
$.61 per month.
Pacific Industrial Park - Bldg 8 42921 E Madio St 2008 Warehouse 7,525 100.0% --- ---46341 Commerce St 2006 Warehouse 7,392 100.0% --- ---42900 Madio St Warehouse 7,346 100.0% --- ---
Morbark 45252 Commerce St 1989 Truck Terminal 7,260 100.0% --- ---Golf Center Business Park 44915 Golf Center Pky Warehouse 7,223 100.0% --- --- Direct - Triple Net
84235 Cabazon Rd 2008 Manufacturing 7,205 100.0% --- ---Pacific Industrial Park - Bldg 7 42925 Madio St 2008 Warehouse 6,918 100.0% --- ---
79811A Country Club Dr Service 6,882 100.0% --- ---82375 Market St Warehouse 6,543 66.4% $7.80 $0.65 Direct - Industrial Gross82314 Market St Warehouse 6,480 100.0% --- ---81770 Oleander Ave Warehouse 6,479 100.0% --- ---83828 Avenue 45 Warehouse 6,432 100.0% --- ---44911 Golf Center Pky Warehouse 6,228 100.0% --- ---
Madison Bldg C 43010 Madison St Warehouse 6,035 100.0% --- ---Madison Bldg D 43036 Madison St Warehouse 6,035 100.0% --- ---Madison Bldg E 43052 Madison St Warehouse 6,035 100.0% --- ---Madison Bldg F 43088 Madison St 2007 Warehouse 6,035 100.0% --- ---Madison Bldg B 42936 Madison St 2007 Warehouse 6,000 0.0% $9.66 $0.81 Direct - Modified GrossBldg C 81824 Trader Pl 1980 Warehouse 6,000 60.0% $7.08 $0.59 Direct - Modified Gross
45435 Van Buren St 1989 Warehouse 6,000 100.0% --- ---81245 Highway 111 Warehouse 5,797 100.0% --- ---82940 Market St Warehouse 5,720 100.0% --- ---
Pacific Industrial Park - Bldg 5 42933 Madio St 2008 Warehouse 5,679 100.0% --- ---Pacific Industrial Park - Bldg 4 42937 Madio St 2008 Warehouse 5,679 100.0% --- ---Pacific Industrial Park - Bldg 1 42949 Madio St 2008 Warehouse 5,679 100.0% --- ---
46590 Calhoun St 1982 Distribution 5,640 100.0% --- ---81780 Trader Pl 2005 Warehouse 5,600 100.0% --- ---82375 Market St Warehouse 5,596 100.0% --- ---42550 Aegean St 2006 Warehouse 5,200 100.0% --- ---43539 Spruce St Warehouse 5,144 100.0% --- ---
Pacific Industrial Park 42929 Madio St 2008 Warehouse 5,118 100.0% --- ---Pacific Industrial Park - Bldg 3 42941 Madio St 2008 Warehouse 5,118 66.3% $9.00 $0.75 Direct - Modified GrossPacific Industrial Park - Bldg 2 42945 Madio St 2008 Warehouse 5,074 100.0% Withheld ---
42700 Aegean St Warehouse 5,050 100.0% --- ---Madison Industrial Park 43156 Madison St 2008 Warehouse 5,046 100.0% --- ---Madison Street Business Center - Bldg 3 43160 Madison St 2008 Warehouse 5,046 100.0% --- ---Madison Street Business Center - Bldg 6 43172 Madison St 2008 Warehouse 5,046 100.0% --- ---Shadow Hills Business Park 42604 Aegean St Warehouse 5,040 100.0% --- ---Madison Industrial Park 43164 Madison St 2008 Warehouse 5,034 100.0% --- ---Madison Industrial Park - Bldg 5 43168 Madison St 2008 Warehouse 5,034 0.0% $7.80 $0.65 Direct - Modified GrossMadison Industrial Park 43176 Madison St 2008 Warehouse 5,001 100.0% --- ---
83852 Avenue 45 1978 Warehouse 5,000 100.0% --- ---83501 Peach St 1975 Manufacturing 4,916 100.0% --- ---
15259.00 Industrial RecComps:Inv Page 5 of 7 The Concord GroupPage 258 of 332

EXHIBIT IV-4-A
INDUSTRIAL INVENTORY TABLEEASTERN COACHELLA VALLEY
FEBRUARY 2016
Year $/SFBuilding Name Address Built Renov. Property Type RBA Occ. Yr Mo. Lease Type
4.9 million s.f. of in East Coachella Valley at 90.5% occupancy. $7.32 annual rent or
$.61 per month.
Bldg 2 81854 Industrial Pl 1990 Warehouse 4,800 100.0% --- ---43763 Jackson St Warehouse 4,800 100.0% Withheld ---
Monroe Business Park - Bldg 7 81837 Oleander Ave Warehouse 4,800 100.0% --- ---83525 Date Ave Warehouse 4,760 100.0% --- ---44905 Golf Center Pky Warehouse 4,631 100.0% --- ---45491 Golf Center Pky Manufacturing 4,565 100.0% --- ---42660 Aegean St Warehouse 4,548 100.0% --- ---83764 Avenue 45 Warehouse 4,503 100.0% --- ---42510 Aegean St Warehouse 4,500 100.0% --- ---
Lupine Auto Body & Paint 83816 45th Ave Service 4,400 100.0% --- ---83840 Avenue 45 Warehouse 4,389 100.0% --- ---
Madison Street Business Center - Bldg 1 43152 Madison St 2008 Warehouse 4,385 0.0% $8.28 $0.69 Direct - Industrial GrossMadison Industrial Park - Bldg 8 43180 Madison St 2008 Warehouse 4,385 100.0% --- ---Shadow Hills Business Park 42602 Caspian St 2008 Warehouse 4,300 100.0% --- ---
81920 Industrial Pl 1989 Service 4,204 100.0% --- ---43549 Wheel Rd 2014 Warehouse 4,121 100.0% --- ---
(culligan) 83804 Avenue 45 1980 Distribution 4,085 100.0% --- ---42750 Aegean St Warehouse 4,000 100.0% --- ---83232 Avenue 44 Warehouse 4,000 100.0% --- ---44812 Deglet Noor St Manufacturing 4,000 100.0% --- ---83535 Peach St 2002 Warehouse 4,000 100.0% --- ---83534 Avenue 45 Truck Terminal 3,960 100.0% $7.80 $0.65 Direct - Modified Gross83695 Avenue 45 Warehouse 3,789 100.0% --- ---80962 Hwy 111 Warehouse 3,582 100.0% --- ---83260 Indio Blvd Warehouse 3,528 100.0% --- ---83565 Peach St Manufacturing 3,488 100.0% --- ---
Monroe Business Park - Bldg 3 81837 Oleander Ave 2006 Warehouse 3,300 100.0% --- ---81149 Indio Blvd 2006 Warehouse 3,200 100.0% --- ---43269 Sunburst St Warehouse 3,017 100.0% --- ---82780 Indio Blvd 1989 Warehouse 3,000 100.0% --- ---44250 Monroe Blvd 1989 Warehouse 3,000 100.0% --- ---
Monroe Business Park - Bldg 1 81854 Industrial Pl 1990 Service 2,944 100.0% --- ---Monroe Business Park - Bldg 3 81854 Industrial Pl 1990 Warehouse 2,944 100.0% --- ---Monroe Business Park - Bldg 5 81837 Oleander Ave 1990 Warehouse 2,944 100.0% --- ---Monroe Business Park - Bldg 1 81837 Oleander Ave 2007 Warehouse 2,944 100.0% --- ---Monroe Business Park - Bldg 6 81837 Oleander Ave Warehouse 2,944 100.0% --- ---Monroe Business Park - Bldg 8 81837 Oleander Ave Warehouse 2,944 100.0% --- ---
43542 Commerce St Service 2,862 100.0% --- ---45050 Pacific St Warehouse 2,853 100.0% --- ---
Bldg 2 81837 Oleander Ave 2007 Warehouse 2,760 100.0% --- ---La Hacienda Nursery & Landscaping 80900 Miles Ave 1989 2,500 100.0% --- ---Bldg 4 81837 Oleander Ave 2,400 100.0% --- ---
83037 Avenue 45 2,337 100.0% --- ---83597 Peach St 2,270 100.0% --- ---
15259.00 Industrial RecComps:Inv Page 6 of 7 The Concord GroupPage 259 of 332

EXHIBIT IV-4-A
INDUSTRIAL INVENTORY TABLEEASTERN COACHELLA VALLEY
FEBRUARY 2016
Year $/SFBuilding Name Address Built Renov. Property Type RBA Occ. Yr Mo. Lease Type
4.9 million s.f. of in East Coachella Valley at 90.5% occupancy. $7.32 annual rent or
$.61 per month.
43639 Jackson St 2,234 100.0% --- ---44655 Jackson St 1965 2,145 100.0% --- ---83591 Peach St 2,142 100.0% --- ---83019 Avenue 45 2,008 100.0% --- ---81933 Indio Blvd 1,905 100.0% --- ---81900 Industrial Pl 1,901 100.0% --- ---
Armstrong Growers 78325 Hidden River Rd 1989 1,400 100.0% --- ---83600 Peach St 1972 1,040 100.0% --- ---84275 Cabazon Rd 1989 1,000 100.0% --- ---
Vintage Nursery 78755 Darby Rd 1989 800 100.0% --- ---Indio Total: 3,090,695 87.9% $7.21 $0.60
Mecca
65500 Lincoln St Food Processing 201,302 100.0% --- ---93400 Hammond Rd Food Processing 59,146 100.0% --- ---67200 Johnson St Distribution 57,279 100.0% --- ---64405 Lincoln St Food Processing 44,848 100.0% --- ---91715 66th Ave Service 8,530 100.0% --- ---
Mecca Total: 371,105 100.0% --- ---
Thermal
Airport Packing & Distribution 87500 Airport Blvd 1969 Refrigeration/Cold Storage 137,770 58.4% $6.74 $0.56 Direct - Modified Gross88100 58th Ave Food Processing 80,068 100.0% --- ---54895 Fillmore St 1995 Distribution 71,000 100.0% --- ---87770 62nd Ave Refrigeration/Cold Storage 45,021 5.9% $12.00 $1.00 Direct - Triple Net88200 58th Ave Warehouse 42,750 100.0% --- ---64225 Highway 111 Food Processing 40,617 100.0% --- ---82249 Ave 61 1996 Distribution 35,000 100.0% --- ---90333 63rd Ave Manufacturing 34,259 100.0% --- ---87400 Airport Blvd Service 27,462 100.0% --- ---57300 Desert Cactus Dr Warehouse 21,000 100.0% --- ---
Date Packing Facility 82291 Avenue 61 Distribution 16,788 100.0% --- ---88200 Dunlap Ave Refrigeration/Cold Storage 12,901 100.0% --- ---62285 Gene Welmas Way Warehouse 9,590 100.0% --- ---87425 Airport Blvd Service 9,521 100.0% --- ---54150 Shady Ln 2004 Warehouse 7,500 100.0% --- ---55755 Tyler St 1982 Warehouse 7,500 100.0% --- ---87316 Airport Blvd Service 2,356 100.0% --- ---
Thermal Total: 601,103 83.4% $9.37 $0.78
East Coachella Valley Total: 4,980,622 90.5% $7.32 $0.61
Source: CoStar
15259.00 Industrial RecComps:Inv Page 7 of 7 The Concord GroupPage 260 of 332

EXHIBIT IV-4-B
INDUSTRIAL INVENTORY TABLEIMPERIAL COUNTY
MARCH 2016
Year $/SFBuilding Name Address Built Renov. Property Type RBA Occ. Yr Mo. Lease Type
*** Currently no industrial inventory in the Imperial County Opportunity Areas ***
15259.00 Industrial RecComps Ph. 2:Inv The Concord GroupPage 261 of 332

EXHIBIT IV-5-A
FUTURE INDUSTRIAL SUPPLYCOACHELLA VALLEY
FEBRUARY 2016
Building EstimatedName Park Address City Property Type Completion RBA
Under Construction
** NO PROJECTS CURRENTLY UNDER CONSTRUCTION **
Proposed
Bldg 1 & 2 West CV Logistic Center Indian Canyon Dr Desert Hot Springs Distribution 2017 2,117,50165173 San Jacinto Ln 65173 San Jacinto Ln Desert Hot Springs Manufacturing 2017 190,000Bldg 2 West CV Logistic Center Indian Canyon Dr @ Indian AvDesert Hot Springs Distribution 1,170,859Bldg 1 West CV Logistic Center Indian Canyon Ave @ Indian ADesert Hot Springs Distribution 946,642Bldg 3 West CV Logistic Center Indian Canyon Ave @ 18th Av Desert Hot Springs Distribution 270,900Bldg 4 West CV Logistic Center Indian Canyon Ave @ 18th Av Desert Hot Springs Distribution 257,216Date Palm Dr Date Palm Dr Cathedral City Distribution 200,000A1 DHS Research & Development Park Little Morongo Rd Desert Hot Springs Distribution 31,008A2 DHS Research & Development Park Little Morongo Rd Desert Hot Springs 28,458Build-to-Suit Sheryl Ave & Caroline Ct Palm Desert 20,00073665 Dinah Shore Dr 73665 Dinah Shore Dr Palm Desert Showroom 18,823B1 DHS Research & Development Park Little Morongo Rd Desert Hot Springs 16,082B2 DHS Research & Development Park Little Morongo Rd Desert Hot Springs 16,082C1 DHS Research & Development Park Little Morongo Rd Desert Hot Springs 6,026C2 DHS Research & Development Park Little Morongo Rd Desert Hot Springs 6,026C3 DHS Research & Development Park Little Morongo Rd Desert Hot Springs 6,026C4 DHS Research & Development Park Little Morongo Rd Desert Hot Springs 6,026C5 DHS Research & Development Park Little Morongo Rd Desert Hot Springs 6,026C6 DHS Research & Development Park Little Morongo Rd Desert Hot Springs 6,026
Total Proposed: 5,319,727
5.3 million s.f. proposed, currently no projects under construction.
15259.00 Industrial RecComps:P&P The Concord GroupPage 262 of 332

EXHIBIT IV-5-B
FUTURE INDUSTRIAL SUPPLYIMPERIAL COUNTY
MARCH 2016
Building EstimatedName Park Address City Property Type Completion RBA
*** Currently no industrial inventory in the Imperial County Opportunity Areas ***
15259.00 Industrial RecComps Ph. 2:P&P The Concord GroupPage 263 of 332

EXHIBIT IV-6
COMPARISON OF LEASE RATES OF SELECTED INDUSTRIAL DEVELOPMENTSCOACHELLA VALLEY
FEBRUARY 2016
$0.75
$0.50
$0.69
$0.39
$0.46
$0.29
$0.55
$0.60
$0.55 $0.56
$1.00
$0.00
$0.10
$0.20
$0.30
$0.40
$0.50
$0.60
$0.70
$0.80
$0.90
$1.00
$1.10
Rancho CoachellaBusiness Center 2
Rancho CoachellaBusiness Center 5
Golden TrianglePark - Imperial
Space
Indio Industrial Park Golf CenterBusiness Park
Menage Building Citrus BusinessCenter
Golf CenterBusiness Park Phase
II
Madison BusinessPark
Airport Packing &Distribution
87770 62nd Ave
Mon
thly
Lea
se $
/SF
Color = Location
Blue = CoachellaRed = Indio
Yellow = Thermal
Industrial lease rates under $1.00 per s.f. Lease rates higher in
Thermal and Coachella.
15259.00 Industrial RecComps: Lease Rates the concord groupPage 264 of 332

The Concord Group
V. HOSPITALITY/RESORT
Page 265 of 332

EXHIBIT V-1
LOCATION OF SELECTED CASINOSCOACHELLA VALLEY
FEBRUARY 2016
Source: casenet.com, relative casino websites
Fantasy Springs Resort Casino· 265,000 sq ft Gaming & Entertainment· 2,000 Slots, 40 Gaming Tables, & Bingo· 250 Room Hotel, 6 Restaurants· 18-hole Golf Course· 24 Lane Bowling Center, 100,000 sq ft Special Events Center
Subject Site
Red Earth Casino· 10,000 sq ft Casino· 349 Slots, 6 Gaming Tables· 640 Acre Prospect of Second Casino with 1,650 Slots,· 1 Restaurant, 1 Bar· Free overnight RV Parking
Augustine Casino· 32,000 sq ft· 349 Slots, Table Games, and Video Poker· 3 Restaurants
Spotlight 29 Casino· 1,600 Slots, 30 Game Tables, & Bingo· 2,200 Seat Showroom, 4 Restaurants· 5,000 sq ft banquet room
Agua Caliente Casino· 45,000 sq ft Casino· 1,300 Slots, 36 Gaming Tables, & Bingo· 344 Room Hotel, 3 Restaurants· 1,000 Seat Showroom
Spa Resort Casino Palm Springs· 1,000 Slots, 29 Gaming Tables, · 11 Poker Tables, & Bingo· 4 Restaurants, 1 Lounge
Morongo Casino Resort & Spa· Built on 44 acres, 150,000 sq ft Gaming· 2,600 Slots, 74 Gaming Tables, & 22 Table Private Poker Room· 304 Room Hotel , Cocktail Lounge, 6 Restaurants· 24 Lane Bowling Center, 12,000 sq ft Special Events Center
10 miles
15259.00 Casino: CompMap The Concord GroupPage 266 of 332

EXHIBIT V-2-A
LOCATION OF SELECTED HOTELS - CURRENT AND PLANNEDEAST COACHELLA VALLEY
FEBRUARY 2016
Map Key
Red = Resort HotelsYellow = Large HotelsOrange = Small Hotels
Green = MotelsBlue = Planned and Proposed
A majority of planned hotel projects are located in Palm
Springs.
15259.00 HotelCompMap:Hotel Map THE CONCORD GROUPPage 267 of 332

EXHIBIT V-2-B
LOCATION OF SELECTED HOTELS - CURRENT AND PLANNEDWEST SHORES / SALTON CITY
MARCH 2016
Map Key
Red = Resort HotelsYellow = Large HotelsOrange = Small Hotels
Green = MotelsBlue = Planned and Proposed
Only two motels located in West Shores / Salton City
1
2
15259.00 HotelCompMap Ph. 2:Hotel Map THE CONCORD GROUPPage 268 of 332

EXHIBIT V-3-A
SUMMARY CHARACTERISTICS OF SELECTED HOTELSCOACHELLA VALLEY AND ANALOG MARKETS
FEBRUARY 2016
*** Hotels located in East Coachella Valley and selected hotels in nearby La Quinta***
Map Zip No. Off Peak Rates Peak Rates AAAKey Hotel City Address Code Rooms Low High Low High Type Rating
Coachella Valley
1 Best Western Date Tree Hotel Indio 81-909 Indio Blvd 92201 119 $69 $99 $89 $249 Motel 22 Fantasy Springs Resort Casino Indio 84245 Indio Springs Pkwy 92203 251 $99 $169 $129 $249 Large Hotel 33 Holiday Inn Express Indio 84054 Indio Springs 92203 89 $85 $85 $99 $359 Small Hotel 34 Indian Palms Country Club & Resort Indio 48-630 Monroe St. 92201 59 $84 $109 $154 $199 Resort Hotel 25 Palm Shadow Inn Indio 80-761 Hwy 111 92201 18 $59 $97 $84 $144 Motel 26 Quality Inn Indio 43505 Monroe St. 92201 62 $75 $85 $89 $255 Motel 27 Quality Inn and Suites Indio 84096 Indio Springs Dr. 92203 125 $68 $76 $85 $119 Motel ---8 Super 8 Motel Indio 81753 Hwy 111 92201 92 $55 $79 $65 $195 Motel 29 Homewood Suites La Quinta 200 Washington St #45 92253 129 $110 $119 $117 $179 Small Hotel 310 Waldorf Astoria La Quinta Resort & Club La Quinta 49-499 Eisenhower Dr. 92253 920 $99 $185 $310 $435 Resort Hotel 411 Lake La Quinta Inn La Quinta 78-120 Caleo Bay 92253 13 $109 $329 $229 $499 B&B 3
Subtotal: 1,877 $91 $150 $207 $329
Analog Markets
12 Lagonita Lodge @ Big Bear Lake Big Bear Lake 183 Lagunita Ln 92315 98 $164 199$ 179$ 318$ Condo-Hotel 313 Best Western Chateau @ Big Bear Lake Big Bear Lake 42200 Moonridge Rd 92315 80 $126 166$ 196$ 250$ Motel 314 Best Western Plus @ Lake Elsinore Lake Elsinore 31781 Casino Drive 92530 71 $80 140$ 80$ 140$ Small Hotel 315 Hampton Inn & Suites @ Lake Perris Moreno Valley 12611 Memorial Way 92553 115 $128 199$ 128$ 136$ Small Hotel ---16 London Bridge Resort @ Lake Havasu Lake Havasu 1477 Queens Bay 86403 122 $139 200$ 109$ 129$ Resort Hotel 3
Subtotal: 486 $131 $185 $138 $190
Total: 2,363 $99 $130 $164 $272
Hotel rates during Peak Season (Jan-Apr) Hotels in East CV are higher than in Analog Markets
lake side hotels.
15259.00 HotelComps:Old-Comps THE CONCORD GROUP
Page 269 of 332

EXHIBIT V-3-B
SUMMARY CHARACTERISTICS OF SELECTED HOTELSWEST SHORES / SALTON CITY
MARCH 2016
Map Zip No. Off Peak Rates Peak Rates AAAKey Hotel City Address Code Rooms Low High Low High Type Rating
1 Sea & Sun Motel Desert Shores 79 Desert Shores 92274 16 $45 $50 $60 $65 Motel2 Ray & Carol's Motel by the Sea Salton City 1008 Ontario Ave 92275 4 $55 $65 $65 $75 Motel
Total/Weighted Average: 20 $47 $53 $61 $67
15259.00 HotelComps Ph. 2:Hotel - Comps THE CONCORD GROUP
Page 270 of 332

EXHIBIT V-4-A
SUMMARY CHARACTERISTICS OF PLANNED HOTEL DEVELOPMENTSCOACHELLA VALLEY
FEBRUARY 2016
Est.Hotel City Address Type Rooms Status Open Date
Planned & Proposed
Staybridge Suites Cathedral City Extended Stay 197 U/C 2016Kimpton Hotel Palomar Palm Springs Tahquitz Canyon & Palm Canyon Dr. Boutique 190 U/C 2017El Paseo Palm Desert South of El Paseo Boutique 150 U/C 2017Andaz Palm Springs 400 N. Palm Dr. Luxury 150 U/C 2016Infusion Beach & Hotel Palm Springs 1875 N Palm Canyon Dr Boutique 124 U/C 2016Arrive Palm Palm Springs 1551 N. Palm Canyon Dr. Boutique 32 U/C 2017Silver Rock Resort La Quinta Jefferson & Ave. 52 Resort Hotel 340 Approved 2018Dolce Selene Palm Springs N. Avenida Caballeros and E. Amado Rd. Large Hotel 200 Approved 2017Port Lawrence Hotel Palm Springs North Palm Canyon Drive Boutique 150 Approved 2016Thunderbird Resort and Spa Rancho Mirage 69855-69883 CA Hwy 111 Large Hotel 125 Approved 2018TBD - CIIF Hotel Group Indio 120 Approved TBDSpringHill Suites Palm Desert 72-322 CA Hwy 111 Small Hotel 112 Approved 2016Orchid Tree Resort Palm Springs 283 S, Cahullia Rd. Boutique 98 Approved TBD750 Lots - Alcazar Lofts Palm Springs 50 N. Palm Canyon Dr. Boutique 38 Approved TBDPark Hotel Palm Springs Main St. and Belardo Rd. Boutique 175 Proposed 2017Section 19 - Quorum Properties Rancho Mirage TBD TBD Conceptual TBDReturn to Aztalan Theme Park Hotel Coachella Hwy 10 TBD TBD Conceptual TBDCathedral City Mixed Use Cathedral City TBD TBD Conceptual TBDCitrus Ranch/Grand Valley - Saxony GroIndio W. of Dillon Rd. btw. Ave. 37 and 41 Boutique TBD Conceptual TBDBoom Boutique Hotel Rancho Mirage Boutique TBD Conceptual TBDVision Agua Caliente Palm Springs 401 E Amado Rd Resort TBD Conceptual TBDIndian Oasis Resort Palm Springs Dinah Shore Dr. & Crossley Resort Hotel 400 Conceptual TBDNorth Star Palm Desert Unincorporated Varner, N of I-10 Resort Hotel 350 Stalled TBDCanyon Hotel Palm Springs Indian Canyon Dr. &Indian Cyns. Resort Hotel 450 Stalled TBDSheraton Hotel & Conference Center Cathredral City Date Palm & Hwy 111 Resort Hotel 300 Stalled TBDW Hotel Rancho Mirage Desert Willows Site 275 Stalled TBDSheraton Hotel Thousand Palms Shenandoah Springs Village 207 Stalled TBDSpotlight 29 Casino Indio 46200 Harrison Street Resort Hotel 200 Stalled TBDTBD - Desert Resort Partners Cathredral City Date Palm & E. Palm Cyn. Dr. Condo-Hotel 180 Stalled TBDTahquitz Creek Hotel Palm Springs Tahquitz Creek Golf Course 150 Stalled TBDAC by Marriott Palm Springs Boutique 135 Stalled 2021Hampton Inn & Suites Cathredral City Hwy 111, near Civic Center 90 Stalled TBD
Total: 4,938Total Under Construction: 843
Total Approved: 1,183Total Proposed: 175
Total Conceptual: 400Total Stalled: 2,337
Source: TCG, Palm Springs Hotel Market Report (HVS Consulting, Mar 2015)
4,938 rooms planned in Coachella Valley, 47% or 2,337 rooms stalled.
15259.00 HotelComps:P&P THE CONCORD GROUP
Page 271 of 332

EXHIBIT V-4-B
SUMMARY CHARACTERISTICS OF PLANNED HOTEL DEVELOPMENTSIMPERIAL COUNTY
MARCH 2016
Est.Hotel City Address Type Rooms Status Open Date
Planned & Proposed
Radisson Hotel Imperial El Centro 1480 North Imperial Ave Small Hotel 108 U/C 2016
Total: 108Total Under Construction: 108
Total Approved: 0Total Proposed: 0
Total Conceptual: 0Total Stalled: 0
Source: TCG, STR Global
Currently one project under construction in El Centro and no hotel projects projects proposed
in Imperial County.
15259.00 HotelComps Ph. 2:P&P THE CONCORD GROUPPage 272 of 332

EXHIBIT V-5
COMPARISON OF DAILY RATES FOR SELECTED HOTELS - PEAK SEASONCOACHELLA VALLEY
FEBRUARY 2016
Source: The Concord Group
$0 $100 $200 $300 $400 $500 $600 $700 $800 $900
Best Western Date Tree Hotel
Fantasy Springs Resort Casino
Holiday Inn Express
Indian Palms Country Club & Resort
Palm Shadow Inn
Quality Inn
Quality Inn and Suites
Super 8 Motel
Homewood Suites
Waldorf Astoria La Quinta Resort & Club
Lake La Quinta Inn
Lagonita Lodge @ Big Bear Lake
Best Western Chateau @ Big Bear Lake
Best Western Plus @ Lake Elsinore
Hampton Inn & Suites @ Lake Perris
London Bridge Resort @ Lake Havasu
Average Daily Rate (Peak Season)
Color = Location
Red = IndioOrange = La Quinta
Grey = Analog Markets
15259.00 HotelComps: LS The Concord GroupPage 273 of 332

EXHIBIT V-6-A
HOTEL INVENTORY COACHELLA VALLEY
1982 THROUGH 2015Room Hotel
Year Rooms Growth Hotels Growth
1982 6,304 --- 81 ---1983 6,593 289 82 11984 6,853 260 84 21985 7,389 536 88 41986 8,426 1,037 94 61987 10,010 1,584 100 61988 10,701 691 106 61989 11,701 1,000 111 51990 11,701 0 111 01991 12,213 512 112 11992 12,213 0 112 01993 12,213 0 112 01994 12,343 130 114 21995 12,343 0 114 01996 12,343 0 114 01997 12,343 0 114 01998 12,343 0 114 01999 12,687 344 117 32000 12,839 152 119 22001 12,933 94 120 12002 13,053 120 121 12003 13,245 192 123 22004 13,580 335 126 32005 13,580 0 126 02006 13,726 146 127 12007 13,855 129 128 12008 14,195 340 129 12009 14,336 141 131 22010 14,336 0 131 02011 14,336 0 131 02012 14,336 0 131 02013 14,336 0 131 02014 14,440 104 133 22015 14,440 0 133 0
Source: STR Global
102
104
106
108
110
112
0
50
100
150
200
250
300
350
400
450
500
550
Ave
rage
Roo
ms
Per
Hot
el
Hot
el R
oom
s A
dded
Ann
ually
Hotel Rooms Added Annually Average Rooms Per Hotel
15259.00 Info Hotel: Inventory The Concord GroupPage 274 of 332

EXHIBIT V-6-B
HOTEL INVENTORY IMPERIAL COUNTY1982 THROUGH 2015
Room HotelYear Rooms Growth Hotels Growth
1982 1,154 --- 21 ---1983 1,305 151 23 21984 1,345 40 24 11985 1,395 50 25 11986 1,441 46 26 11987 1,518 77 28 21988 1,518 0 28 01989 1,518 0 28 01990 1,518 0 28 01991 1,608 90 29 11992 1,608 0 29 01993 1,608 0 29 01994 1,608 0 29 01995 1,718 110 30 11996 1,776 58 31 11997 1,776 0 31 01998 1,834 58 32 11999 1,834 0 32 02000 1,834 0 32 02001 1,834 0 32 02002 1,934 100 33 12003 2,057 123 35 22004 2,057 0 35 02005 2,057 0 35 02006 2,057 0 35 02007 2,145 88 36 12008 2,299 154 38 22009 2,299 0 38 02010 2,299 0 38 02011 2,299 0 38 02012 2,299 0 38 02013 2,299 0 38 02014 2,379 80 39 12015 2,379 0 39 0
Source: STR Global
50
52
54
56
58
60
62
0
50
100
150
200
250
300
350
400
450
500
550
Ave
rage
Roo
ms
Per
Hot
el
Hot
el R
oom
s A
dded
Ann
ually
Hotel Rooms Added Annually Average Rooms Per Hotel
15259.00 Info Hotel Ph. 2: Inventory The Concord GroupPage 275 of 332

EXHIBIT V-7-A
HOTEL VISITORSCOACHELLA VALLEY
1984 THROUGH 2004
Demand Demand Dem. Per RoomYear Demand % Growth Per Room % Growth
1984 908,208 --- 144 ---1985 959,346 6% 146 1%1986 1,061,819 11% 155 6%1987 1,268,398 19% 172 11%1988 1,491,599 18% 177 3%1989 1,666,640 12% 166 -6%1990 1,764,322 6% 165 -1%1991 1,771,461 0% 151 -8%1992 1,865,181 5% 159 5%1993 1,855,465 -1% 152 -5%1994 1,954,169 5% 160 5%1995 2,060,951 5% 169 5%1996 2,138,909 4% 173 3%1997 2,049,799 -4% 166 -4%1998 2,131,221 4% 173 4%1999 2,203,723 3% 179 3%2000 2,860,867 30% 232 30%2001 2,749,211 -4% 217 -7%2002 2,776,549 1% 216 0%2003 2,755,826 -1% 213 -1%2004 2,955,385 7% 226 6%2005 2,986,124 1% 225 0%2006 3,067,685 3% 226 0%2007 2,854,259 -7% 210 -7%2008 2,776,863 -3% 202 -4%2009 2,566,507 -8% 185 -8%2010 2,625,689 2% 185 0%2011 2,815,349 7% 196 6%2012 2,925,087 4% 204 4%2013 2,963,922 1% 207 1%2014 3,054,368 3% 213 3%2015 3,118,822 2% 218 2%
Note: Demand is occupied room nightsSource: 1984-1999 Wheeler's Desert Letter; 2000-2015 STR Global
-15%
-10%
-5%
0%
5%
10%
15%
20%
25%
30%
35%
-10%
-5%
0%
5%
10%
15%
20%
25%
30%
35%
Dem
and
Per
Roo
m G
row
th
Per
cent
age
Ann
ual
Gro
wth
Demand % Growth Dem. Per Room % Growth
15259.00 Info Hotel: Demand The Concord Group
Page 276 of 332

EXHIBIT V-7-B
HOTEL VISITORSIMPERIAL COUNTY2010 THROUGH 2015
Demand Demand Dem. Per RoomYear Demand % Growth Per Room % Growth
2010 400,605 --- 174 ---2011 441,613 10% 192 10%2012 457,857 4% 199 4%2013 428,983 -6% 187 -6%2014 413,381 -4% 174 -7%2015 453,733 10% 191 10%
Note: Demand is occupied room nightsSource: STR Global
-8%
-6%
-4%
-2%
0%
2%
4%
6%
8%
10%
12%
-8%
-6%
-4%
-2%
0%
2%
4%
6%
8%
10%
12%
Dem
and
Per
Roo
m G
row
th
Per
cent
age
Ann
ual
Gro
wth
Demand % Growth Dem. Per Room % Growth
15259.00 Info Hotel Ph. 2: Demand The Concord Group
Page 277 of 332

EXHIBIT V-8-A
HOTEL OCCUPANCYCOACHELLA VALLEY
1982 THROUGH 2015
Year ADR Occupancy(2016 dollars)
2000 $120 62%2001 $119 59%2002 $114 59%2003 $112 57%2004 $114 61%2005 $120 60%2006 $130 64%2007 $133 61%2008 $133 56%2009 $121 50%2010 $118 51%2011 $122 55%2012 $129 57%2013 $132 58%2014 $140 58%2015 $148 59%
Source: STR Global
0%
10%
20%
30%
40%
50%
60%
70%
$100
$105
$110
$115
$120
$125
$130
$135
$140
$145
$150
$155
2000 2001 2002 2003 2004 2005 2006 2007 2008 2009 2010 2011 2012 2013 2014 2015
Occ
upan
cy
Ave
rage
Dai
ly H
otel
Roo
m R
ate
ADR Occupancy
15259.00 Info Hotel: Occupancy The Concord GroupPage 278 of 332
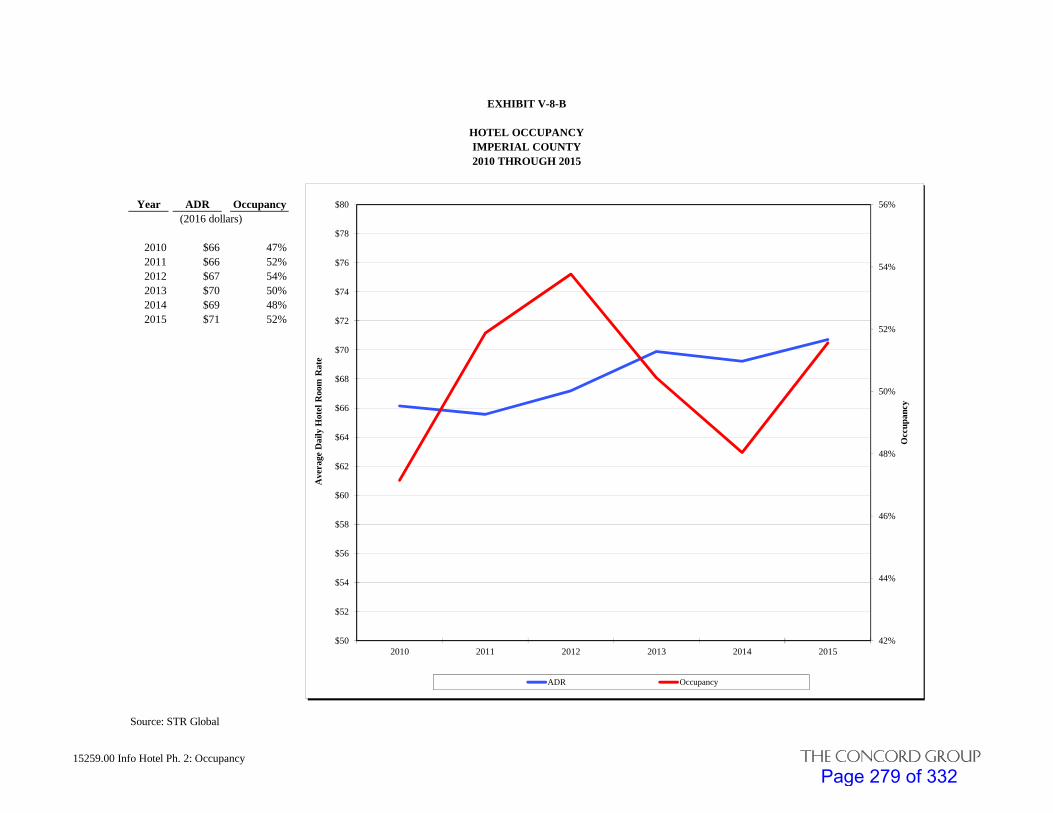
EXHIBIT V-8-B
HOTEL OCCUPANCYIMPERIAL COUNTY2010 THROUGH 2015
Year ADR Occupancy(2016 dollars)
2010 $66 47%2011 $66 52%2012 $67 54%2013 $70 50%2014 $69 48%2015 $71 52%
Source: STR Global
42%
44%
46%
48%
50%
52%
54%
56%
$50
$52
$54
$56
$58
$60
$62
$64
$66
$68
$70
$72
$74
$76
$78
$80
2010 2011 2012 2013 2014 2015
Occ
upan
cy
Ave
rage
Dai
ly H
otel
Roo
m R
ate
ADR Occupancy
15259.00 Info Hotel Ph. 2: Occupancy The Concord GroupPage 279 of 332

EXHIBIT V-9-A
HOTEL REVENUECOACHELLA VALLEY
1982 THROUGH 2006
No. Room Sales Revenue RevenueYear Sales Growth Per Room Growth
(Hotel Sales in 2016 dollars)
2000 $343,866,136 --- $26,783 ---2001 $326,555,573 -5% $25,250 -6%2002 $316,791,946 -3% $24,270 -4%2003 $309,993,037 -2% $23,405 -4%2004 $337,135,930 9% $24,826 6%2005 $358,779,951 6% $26,420 6%2006 $397,381,101 11% $28,951 10%2007 $380,534,185 -4% $27,465 -5%2008 $369,958,007 -3% $26,063 -5%2009 $311,119,361 -16% $21,702 -17%2010 $308,877,983 -1% $21,546 -1%2011 $344,789,607 12% $24,051 12%2012 $376,519,973 9% $26,264 9%2013 $391,166,198 4% $27,286 4%2014 $427,877,308 9% $29,631 9%2015 $462,314,019 8% $32,016 8%
Source: STR Global
-0.2
-0.15
-0.1
-0.05
0
0.05
0.1
0.15
0.2
-0.2
-0.15
-0.1
-0.05
0
0.05
0.1
0.15
2001 2002 2003 2004 2005 2006 2007 2008 2009 2010 2011 2012 2013 2014 2015
Per
cent
age
Gro
wth
of
Hot
el R
oom
s
Per
cent
age
Gro
wth
of
Hot
el R
oom
Tot
al S
ales
Sales Growth Revenue Growth
15259.00 Info Hotel: Revenue The Concord Group
Page 280 of 332

EXHIBIT V-9-B
HOTEL REVENUEIMPERIAL COUNTY2010 THROUGH 2015
Sales Revenue RevenueYear Revenue Growth Per Room Growth
(Hotel Sales in 2016 dollars)
2010 $26,500,565 --- $11,527 ---2011 $28,956,402 9% $12,595 9%2012 $30,761,600 6% $13,380 6%2013 $29,981,578 -3% $13,041 -3%2014 $28,613,507 -5% $12,028 -8%2015 $32,086,717 12% $13,487 12%
Source: STR Global
-0.2
-0.15
-0.1
-0.05
0
0.05
0.1
0.15
0.2
-0.2
-0.15
-0.1
-0.05
0
0.05
0.1
0.15
2011 2012 2013 2014 2015
Per
cent
age
Gro
wth
of
Hot
el R
oom
s
Per
cent
age
Gro
wth
of
Hot
el R
oom
Tot
al S
ales
Sales Growth Revenue Growth
15259.00 Info Hotel Ph. 2: Revenue The Concord Group
Page 281 of 332

The Concord Group
VI. RETAIL
Page 282 of 332

EXHIBIT VI-1-A
TAXABLE RETAIL SALESCOACHELLA VALLEY
2000 THROUGH 2014
Retail GrowthBillion $ Sales $ %
2000 $3.882001 $3.98 $0.10 2.6%2002 $4.12 $0.14 3.5%2003 $4.57 $0.45 10.9%2004 $5.22 $0.65 14.2%2005 $5.71 $0.49 9.4%2006 $5.98 $0.27 4.7%2007 $5.86 ($0.12) -2.0%2008 $5.26 ($0.60) -10.2%2009 $4.47 ($0.79) -15.0%2010 $4.63 $0.16 3.6%2011 $5.06 $0.43 9.3%2012 $5.41 $0.35 6.9%2013 $5.75 $0.34 6.3%2014 $6.12 $0.37 6.4%
Historical Average
5-Year $0.33 7.2%10-Year $0.09 0.8%15-Year $0.16 3.4%2014 vs. 2006 $0.14 2.3%2014 vs. 2011 $1.06 20.9%
Source: 2014 Coachella Valley Economic Report
-20.0%
-18.0%
-16.0%
-14.0%
-12.0%
-10.0%
-8.0%
-6.0%
-4.0%
-2.0%
0.0%
2.0%
4.0%
6.0%
8.0%
10.0%
12.0%
14.0%
16.0%
18.0%
20.0%
-$1.00
-$0.90
-$0.80
-$0.70
-$0.60
-$0.50
-$0.40
-$0.30
-$0.20
-$0.10
$0.00
$0.10
$0.20
$0.30
$0.40
$0.50
$0.60
$0.70
$0.80
$0.90
$1.00
2001 2002 2003 2004 2005 2006 2007 2008 2009 2010 2011 2012 2013 2014
Retail Sales Growth
$ %
Page 283 of 332

EXHIBIT VI-1-B
TAXABLE RETAIL SALESIMPERIAL COUNTY
2000 THROUGH THIRD QUARTER 2014
Retail GrowthBillion $ Sales $ %
2000 $1.402001 $1.38 ($0.02) -1.6%2002 $1.46 $0.08 5.9%2003 $1.53 $0.07 4.5%2004 $1.69 $0.16 10.5%2005 $2.00 $0.31 18.4%2006 $2.15 $0.15 7.4%2007 $2.25 $0.10 4.9%2008 $2.18 ($0.07) -3.3%2009 $1.77 ($0.41) -18.6%2010 $1.97 $0.20 11.1%2011 $2.18 $0.21 10.7%2012 $2.36 $0.17 8.0%2013 $3.66 $1.31 55.4%3Q14 $1.88 --- ---
Historical Average
5-Year $0.47 19.9%10-Year $0.22 9.0%14-Year $0.17 7.7%2013 vs. 2006 $1.51 70.4%2013 vs. 2011 $1.48 67.8%
Note: 2014 Data incompleteSource: CA Board of Equalization
-20.0%
-15.0%
-10.0%
-5.0%
0.0%
5.0%
10.0%
15.0%
20.0%
25.0%
30.0%
35.0%
40.0%
45.0%
50.0%
55.0%
60.0%
-$1.00
-$0.90
-$0.80
-$0.70
-$0.60
-$0.50
-$0.40
-$0.30
-$0.20
-$0.10
$0.00
$0.10
$0.20
$0.30
$0.40
$0.50
$0.60
$0.70
$0.80
$0.90
$1.00
2001 2002 2003 2004 2005 2006 2007 2008 2009 2010 2011 2012 2013 2014
Retail Sales Growth
$ %
Retail sales increased 55% from 2012 to 2013.
Page 284 of 332

EXHIBIT VI-2
RETAIL DEMAND IN KEY SPENDING CATEGORIESCOACHELLA VALLEY AND SOUTHERN CALIFORNIA
2015
Demand OpportunitySpending Category Population $ Per Capita Expenditures (1) Retail Sales (2) Gap/Surplus (3)
Coachella ValleyGroceries and Other Foods 477,703 $3,021 $1,443,319,737 $1,139,440,838 $303,878,899Meals and Snacks 477,703 $1,488 $711,043,829 $882,165,142 ($171,121,313)Men's Wear 477,703 $200 $95,592,750 $123,609,742 ($28,016,992)Women's, Juniors' and Misses' Wear 477,703 $346 $165,363,499 $233,003,511 ($67,640,012)Children's Wear 477,703 $194 $92,650,076 $104,422,220 ($11,772,144)Footwear 477,703 $208 $99,340,167 $101,233,339 ($1,893,172)Major Household Appliances 477,703 $138 $65,848,285 $66,323,358 ($475,073)Small Electric Appliances 477,703 $30 $14,284,966 $10,929,412 $3,355,554Televisions, Video Recorders, Video Cameras 477,703 $91 $43,669,763 $36,168,830 $7,500,933Furniture and Sleep Equipment 477,703 $270 $129,093,509 $148,499,763 ($19,406,254)Flooring and Floor Coverings 477,703 $76 $36,243,745 $19,700,711 $16,543,034Kitchenware and Home Furnishings 477,703 $157 $75,125,541 $53,043,478 $22,082,063Hardware, Tools, Plumbing, Electrical 477,703 $38 $17,916,626 $33,657,813 ($15,741,187)Lumber and Building Materials 477,703 $254 $121,233,054 $58,372,959 $62,860,095Lawn, Garden, and Farm Equipment & Supplies 477,703 $161 $76,999,850 $46,887,777 $30,112,073Cars, Trucks, Other Powered Transportation 477,703 $61 $28,920,213 $17,883,689 $11,036,524Automotive Fuels 477,703 $1,765 $842,960,746 $609,924,349 $233,036,397
Total From Current Population $8,498 $4,059,606,356 $3,685,266,931 $374,339,425
Southern CaliforniaGroceries and Other Foods 22,290,209 $2,953 $65,814,660,571 $50,517,837,741 $15,296,822,830Meals and Snacks 22,290,209 $1,558 $34,728,577,507 $40,722,529,729 ($5,993,952,222)Men's Wear 22,290,209 $230 $5,117,711,249 $5,020,870,244 $96,841,005Women's, Juniors' and Misses' Wear 22,290,209 $416 $9,266,158,064 $9,484,321,858 ($218,163,794)Children's Wear 22,290,209 $206 $4,594,292,413 $4,669,370,553 ($75,078,140)Footwear 22,290,209 $236 $5,261,643,159 $4,640,494,901 $621,148,258Major Household Appliances 22,290,209 $132 $2,932,975,560 $2,905,232,564 $27,742,996Small Electric Appliances 22,290,209 $29 $650,077,625 $518,618,419 $131,459,206Televisions, Video Recorders, Video Cameras 22,290,209 $102 $2,282,908,196 $2,307,044,011 ($24,135,815)Furniture and Sleep Equipment 22,290,209 $284 $6,337,478,688 $5,579,308,471 $758,170,217Flooring and Floor Coverings 22,290,209 $55 $1,215,161,972 $1,116,596,732 $98,565,240Kitchenware and Home Furnishings 22,290,209 $162 $3,618,124,780 $2,411,943,756 $1,206,181,024Hardware, Tools, Plumbing, Electrical 22,290,209 $83 $1,858,532,640 $1,303,694,320 $554,838,320Lumber and Building Materials 22,290,209 $211 $4,698,480,972 $3,897,170,199 $801,310,773Lawn, Garden, and Farm Equipment & Supplies 22,290,209 $150 $3,336,900,523 $2,248,153,056 $1,088,747,467Cars, Trucks, Other Powered Transportation 22,290,209 $49 $1,100,636,344 $1,021,358,757 $79,277,587Automotive Fuels 22,290,209 $1,806 $40,250,235,024 $27,664,634,296 $12,585,600,728
Total From Current Population $8,661 $193,064,555,287 $166,029,179,607 $27,035,375,680
(1) Estimated spending per Claritas(2) Taxable sales(3) Demand Expenditures (1) less Retail Sales (2)
$374 million retail opportunity gap in Coachella Valley, indicating a
surplus demand for retail spending.
15529.00 Retail Gap Analysis: Opp Gap THE CONCORD GROUP
Page 285 of 332

EXHIBIT VI-3-A
MAP OF MAJOR RETAIL - CURRENT AND PLANNEDCOACHELLA VALLEY
FEBRUARY 2016
Color = Status
Yellow = ExistingGreen = Under Construction
Blue = Planned
Majority of retail centrally located within developed areas.
15529.00 Retail Maps: Retail - Current and Planned The Concord GroupPage 286 of 332

EXHIBIT VI-3-B
MAP OF MAJOR RETAIL - CURRENT AND PLANNEDWEST SHORES / SALTON SEA
MARCH 2016
Color = Status
Yellow = ExistingGreen = Under Construction
Blue = Planned
No projects planned or proposed at this time.
15529.00 Retail Maps Ph. 2: Retail - Current and Planned The Concord GroupPage 287 of 332
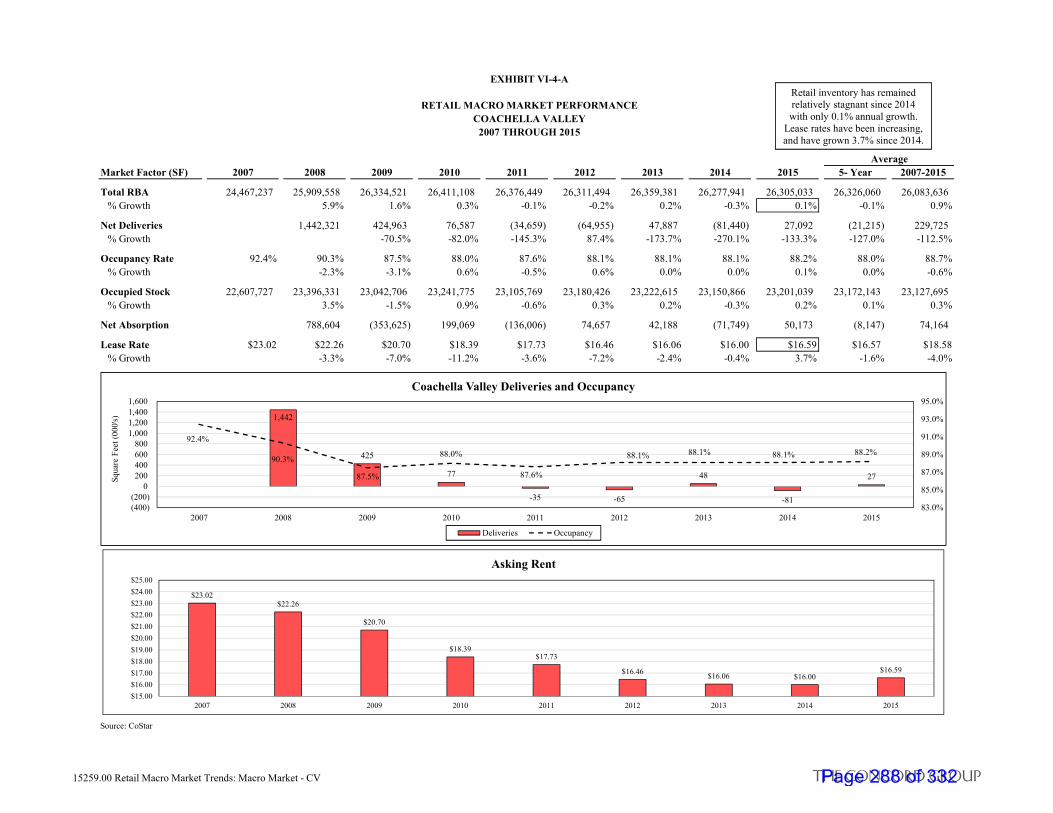
EXHIBIT VI-4-A
RETAIL MACRO MARKET PERFORMANCECOACHELLA VALLEY
2007 THROUGH 2015
AverageMarket Factor (SF) 2007 2008 2009 2010 2011 2012 2013 2014 2015 5- Year 2007-2015
Total RBA 24,467,237 25,909,558 26,334,521 26,411,108 26,376,449 26,311,494 26,359,381 26,277,941 26,305,033 26,326,060 26,083,636% Growth 5.9% 1.6% 0.3% -0.1% -0.2% 0.2% -0.3% 0.1% -0.1% 0.9%
Net Deliveries 1,442,321 424,963 76,587 (34,659) (64,955) 47,887 (81,440) 27,092 (21,215) 229,725% Growth -70.5% -82.0% -145.3% 87.4% -173.7% -270.1% -133.3% -127.0% -112.5%
Occupancy Rate 92.4% 90.3% 87.5% 88.0% 87.6% 88.1% 88.1% 88.1% 88.2% 88.0% 88.7%% Growth -2.3% -3.1% 0.6% -0.5% 0.6% 0.0% 0.0% 0.1% 0.0% -0.6%
Occupied Stock 22,607,727 23,396,331 23,042,706 23,241,775 23,105,769 23,180,426 23,222,615 23,150,866 23,201,039 23,172,143 23,127,695% Growth 3.5% -1.5% 0.9% -0.6% 0.3% 0.2% -0.3% 0.2% 0.1% 0.3%
Net Absorption 788,604 (353,625) 199,069 (136,006) 74,657 42,188 (71,749) 50,173 (8,147) 74,164
Lease Rate $23.02 $22.26 $20.70 $18.39 $17.73 $16.46 $16.06 $16.00 $16.59 $16.57 $18.58% Growth -3.3% -7.0% -11.2% -3.6% -7.2% -2.4% -0.4% 3.7% -1.6% -4.0%
Source: CoStar
1,442
425
77
-35 -65
48
-81
27
92.4%
90.3%
87.5%
88.0%
87.6%
88.1% 88.1% 88.1% 88.2%
83.0%
85.0%
87.0%
89.0%
91.0%
93.0%
95.0%
(400)(200)
0200400600800
1,0001,2001,4001,600
2007 2008 2009 2010 2011 2012 2013 2014 2015
Coachella Valley Deliveries and Occupancy
Deliveries Occupancy
Squa
re F
eet (
000'
s)
$23.02$22.26
$20.70
$18.39$17.73
$16.46 $16.06 $16.00$16.59
$15.00$16.00$17.00$18.00$19.00$20.00$21.00$22.00$23.00$24.00$25.00
2007 2008 2009 2010 2011 2012 2013 2014 2015
Asking Rent
Retail inventory has remained relatively stagnant since 2014 with only 0.1% annual growth.
Lease rates have been increasing, and have grown 3.7% since 2014.
15259.00 Retail Macro Market Trends: Macro Market - CV The Concord GroupPage 288 of 332

EXHIBIT VI-4-B
RETAIL MACRO MARKET PERFORMANCECOACHELLA VALLEY, RIVERSIDE COUNTY, IMPERIAL COUNTY
2007 THROUGH 2015
AverageMarket Factor (SF) 2007 2008 2009 2010 2011 2012 2013 2014 2015 5- Year 2007-2015
Total RBA (000s)Riverside County 93,275,100 96,920,762 98,365,113 98,529,060 98,337,404 98,510,222 98,725,031 98,910,842 98,991,538 98,695,007 97,840,564Coachella Valley 24,467,237 25,909,558 26,334,521 26,411,108 26,376,449 26,311,494 26,359,381 26,277,941 26,305,033 26,326,060 26,083,636
% Riverside County 26% 27% 27% 27% 27% 27% 27% 27% 27% 27% 27%Imperial County 6,673,057 7,084,188 7,118,038 7,118,038 7,118,038 7,122,462 7,406,669 7,425,837 7,391,095 7,292,820 7,161,936
% Riverside County 7% 7% 7% 7% 7% 7% 8% 8% 7% 7% 7%
Net DeliveriesRiverside County 3,645,662 1,444,351 163,947 (191,656) 172,818 214,809 185,811 80,696 92,496 714,555Coachella Valley 1,442,321 424,963 76,587 (34,659) (64,955) 47,887 (81,440) 27,092 (21,215) 229,725
% Riverside County 40% 29% 47% 18% -38% 22% -44% 34% -23% 32%Imperial County 411,131 33,850 0 0 4,424 284,207 19,168 (34,742) 54,611 89,755
% Riverside County 11% 2% 0% 0% 3% 132% 10% -43% 59% 13%
Occupancy RateRiverside County 94.3% 92.4% 90.7% 90.8% 90.7% 91.0% 91.3% 91.7% 91.7% 91.3% 91.6%Coachella Valley 92.4% 90.3% 87.5% 88.0% 87.6% 88.1% 88.1% 88.1% 88.2% 88.0% 88.7%Imperial County 96.2% 95.0% 94.3% 92.5% 91.2% 90.5% 91.4% 90.8% 89.7% 90.7% 92.4%
Occupied StockRiverside County 87,958,419 89,554,784 89,217,157 89,464,386 89,192,025 89,644,302 90,135,953 90,701,242 90,775,240 90,089,753 89,627,057Coachella Valley 22,607,727 23,396,331 23,042,706 23,241,775 23,105,769 23,180,426 23,222,615 23,150,866 23,201,039 23,172,143 23,127,695
% Riverside County 26% 26% 26% 26% 26% 26% 26% 26% 26% 26% 26%Imperial County 6,419,481 6,729,979 6,712,310 6,584,185 6,491,651 6,445,828 6,769,695 6,742,660 6,629,812 6,615,929 6,613,956
% Riverside County 7% 8% 8% 7% 7% 7% 8% 7% 7% 7% 7%
Net AbsorptionRiverside County 1,596,365 (337,627) 247,229 (272,361) 452,277 491,651 565,289 73,998 262,171 352,103Coachella Valley 788,604 (353,625) 199,069 (136,006) 74,657 42,188 (71,749) 50,173 (8,147) 74,164
% Riverside County 49% 105% 81% 50% 17% 9% -13% 68% -3% 21%Imperial County 310,498 (17,669) (128,125) (92,534) (45,823) 323,867 (27,035) (112,848) 9,125 26,291
% Riverside County 19% 5% -52% 34% -10% 66% -5% -153% 3% 7%
Lease RateRiverside County $22.10 $21.77 $20.53 $18.75 $17.85 $16.57 $16.23 $16.54 $17.05 $16.85 $18.60
% Growth -2% -6% -9% -5% -8% -2% 2% 3% -2% -4%Coachella Valley $23.02 $22.26 $20.70 $18.39 $17.73 $16.46 $16.06 $16.00 $16.59 $16.57 $18.58
% Growth -3% -8% -13% -4% -8% -2% 0% 4% -2% -4%Imperial County $21.01 $13.59 $17.15 $16.99 $16.03 $15.86 $14.06 $11.85 $13.44 $14.25 $15.55
% Growth -55% 21% -1% -6% -1% -13% -19% 12% -2% -4%
Source: CoStar
5 year occupancy rates in all 3 market areas average 90%. Lease rates have increased in all
market areas from 2014-2015, the largest increase being 12% Imperial County .
15259.00 Retail Macro Market Trends Ph. 2: Macro Market - CV,IV,RC The Concord GroupPage 289 of 332

EXHIBIT VI-5
RETAIL SUBMARKET COMPARISONINLAND EMPIRE
2016 QUARTER TO DATE
Coachella Valley Ontario Corona Riverside Outlying Riverside East SB North SB West SB Outlying SBMarket Factor # % Total # % Total # % Total # % Total # % Total # % Total # % Total # % Total # % of Total Total
Total RBA 26,372,051 16.5% 24,834,104 15.6% 6,199,819 3.9% 34,743,452 21.8% 980,840 0.6% 29,373,077 18.4% 17,480,889 10.9% 16,881,681 10.6% 2,807,733 1.8% 159,673,646
Total Buildings 2,042 14.8% 1,908 13.8% 490 3.5% 3,127 22.6% 121 0.9% 2,994 21.7% 1,718 12.4% 1,058 7.7% 357 2.6% 13,815
Occupancy Rate 88.6% 96.4% 94.0% 102.3% 94.2% 102.5% 93.5% 101.7% 92.8% 101.0% 90.5% 98.5% 89.9% 97.8% 93.1% 101.3% 93.7% 102.0% 91.9%
Occupied Stock 23,365,637 15.9% 23,344,058 15.9% 5,840,229 4.0% 32,485,128 22.2% 910,220 0.6% 26,582,635 18.1% 15,715,319 10.7% 15,716,845 10.7% 2,630,846 1.8% 146,590,916
Net Deliveries (1) 27,092 12.1% -37,063 --- -191,441 --- -13,519 --- 9,000 4.0% 322,985 143.7% 92,369 41.1% 6,295 2.8% 9,100 4.0% 224,818
Under Construction (s.f.) 133,926 27.2% 61,700 12.5% 3,324 0.7% 155,486 31.6% 0 0.0% 26,046 5.3% 46,500 9.4% 65,655 13.3% 0 0.0% 492,637
Average Rent ($/sf/year) $16.59 103.4% $17.30 107.8% $21.87 136.3% $17.11 106.6% $7.47 46.5% $13.24 82.5% $12.85 80.1% $18.82 117.3% $13.15 81.9% $16.05
(1) 1Q 2015 - 1Q 2016Source: CoStar
80.0%
82.0%
84.0%
86.0%
88.0%
90.0%
92.0%
94.0%
96.0%
98.0%
-200,000
-150,000
-100,000
-50,000
0
50,000
100,000
150,000
200,000
250,000
300,000
350,000
400,000
Coachella Valley Airport Area Corona Riverside OutlyingRiverside
East SB North SB West SB Outlying SB
Vac
ancy
Rat
e
Del
iver
ies
(Sq
uar
e F
eet)
Deliveries (s.f.) Vacancy Rate
$5.00
$7.50
$10.00
$12.50
$15.00
$17.50
$20.00
$22.50
$25.00
0
25,000
50,000
75,000
100,000
125,000
150,000
175,000
200,000
CoachellaValley
Airport Area Corona Riverside OutlyingRiverside
East SB North SB West SB Outlying SB
Avg
. Ren
t ($
/sf/
yr)
Un
der
Con
stru
ctio
n (
Sq
uar
e F
eet)
Under Construction (s.f.) Average Rent ($/sf/year)
27k s.f. of new deliveries in 2015, representing 12% of total submarket deliveries. Currently 133k s.f. of
inventory under construction in Coachella Valley, 27% of the submarket.
15259.00 Retail Macro Market Trends: Submarket Comparison - IE The Concord GroupPage 290 of 332

EXHIBIT VI-6-A
RETAIL INVENTORY TABLEEASTERN COACHELLA VALLEY
FEBRUARY 2016
Year $/SF (NNN)Building Name Address Built Renov. Property Type RBA Occ. Yr Mo. Anchor Tenants
Coachella
50,000+ SFFood 4 Less 49171-49249 Grapefruit Blvd 2003 Community Center 138,660 82.0% --- --- Fallas Paredes, Food 4 Less, MelroseCoachella Plaza 50249 Harrison St 1992 2008 Community Center 85,202 83.8% $15.00 $1.25 99 Cents OnlyCardenas Market 50037 Harrison St 1992 2005 Community Center 50,625 100.0% --- --- Cardenas Market
Subtotal/Weighted Average: 274,487 85.9% $15.00 $1.25
Coachella Shopping Center 49617-49829 Harrison St 1973 1990 Neighborhood Center 125,835 57.0% $13.80 $1.15 Rite AidAlbertson's 83053 Avenue 48 Neighborhood Center 52,443 100.0% $12.00 $1.00
Subtotal/Weighted Average: 178,278 69.6% $13.27 $1.11
Total/Weighted Average: 452,765 79.5% $13.83 $1.15
10,000 SF - 50,000 SF (1)Coachella Gateway Center 49251-49301 Grapefruit Blvd Community Center 31,406 100.0% Withheld ---
Harrison Plaza - Bldg 1 52565 Harrison St 2008 Neighborhood Center 32,165 100.0% $15.00 $1.25Plaza Tonala 51335 Harrison St Neighborhood Center 20,000 79.2% $16.91 $1.41Van Buren Plaza - Fresh & Easy 84076 Avenue 50 Neighborhood Center 13,969 0.0% $12.00 $1.00Jackson Square - Shops 1 83103 Avenue 48 St 2006 Neighborhood Center 13,800 100.0% $21.00 $1.75Harrison Plaza - Bldg 2 52669 Harrison St 2008 Neighborhood Center 13,200 100.0% $15.00 $1.25
Subtotal/Weighted Average: 93,134 80.5% $15.85 $1.32
Coachella Center 1014-1030 6th St 1969 2005 Strip Center 10,268 94.0% Withheld ---
Total/Average: 134,808 86.1% $15.85 $1.32
Coachella Total/ Weighted Average: 587,573 81.0% $14.36 $1.20
Indio
50,000+ SFSuper Target 42625 Jackson St 2008 Power Center 173,981 100.0% --- --- TargetThe Home Depot 42100 Jackson St Power Center 141,192 100.0% --- --- Home DepotThe Showcase at Indio 42225 Jackson St 2009 Power Center 98,368 89.8% Withheld --- Big Lots, Dollar TreeBldg D 42225 Jackson St Power Center 96,548 92.3% Withheld --- Ross Dress for LessWinco Foods 42600 Jackson St 2008 Power Center 94,642 100.0% --- --- Winco Foods
Subtotal/Weighted Average: 604,731 97.1% --- ---
31% of retail inventory are Community Centers, 27% are Power Centers, and 27% are Neighborhood Centers. Power Centers
have the highest occupancy at 95%
15529.00 Retail RecComps:Inv Page 1 of 3 THE CONCORD GROUPPage 291 of 332

EXHIBIT VI-6-A
RETAIL INVENTORY TABLEEASTERN COACHELLA VALLEY
FEBRUARY 2016
Year $/SF (NNN)Building Name Address Built Renov. Property Type RBA Occ. Yr Mo. Anchor Tenants
31% of retail inventory are Community Centers, 27% are Power Centers, and 27% are Neighborhood Centers. Power Centers
have the highest occupancy at 95%
Indio Fashion Mall 82001-83227 Hwy 111 1976 1990 Community Center 214,869 20.6% $12.78 $1.07Indio Plaza 82124-82136 Hwy 111 1971 2001 Community Center 76,600 92.2% --- --- Food 4 Less SupermarketTown & Country Center 81691 Highway 111 1983 Community Center 73,735 100.0% --- --- Kmart
82280 Highway 111 Community Center 54,351 100.0% --- --- CardenasSubtotal/Weighted Average: 419,555 57.9% $12.78 $1.07
81743 Avenue 46 1980 Neighborhood Center 75,000 100.0% --- ---Indio Plaza 45800-45858 Rubidoux St 1979 2006 Neighborhood Center 58,904 25.2% $12.00 $1.00Imperial Furniture 82462 Highway 111 1972 Neighborhood Center 52,630 100.0% --- ---
Subtotal/Weighted Average: 186,534 76.4% $12.00 $1.00
44199 Monroe St General Retail 90,142 100.0% --- ---Ralphs 49908 Jefferson St 2003 General Retail 50,602 100.0% --- ---Fiesta Ford Lincoln Mercury 78990 Varner Rd General Retail 50,000 100.0% --- ---
Subtotal/Weighted Average: 190,744 100.0% --- ---
Total/Weighted Average: 1,401,564 83.0% $12.61 $1.05
10,000 SF - 50,000 SF (1)The Showcase at Indio - Bldg B 42425 Jackson St 2008 Power Center 39,234 100.0% Withheld ---The Showcase at Indio - Bldg C 42425 Jackson St Power Center 17,400 66.2% Withheld ---Indio Towne Center - Shops 3 42150 Jackson St Power Center 12,350 26.3% $18.77 $1.56
Subtotal/Weighted Average: 68,984 78.3% $18.77 $1.56
82204 Highway 111 1978 Community Center 15,136 88.9% Withheld ---Town & County South - Bldg C 81-557 Doctor Carreon Blvd Community Center 12,000 75.0% $16.20 $1.35Town & County South - Bldg B 81-577 Doctor Carreon Blvd Community Center 12,000 100.0% $14.40 $1.20Town & Country South - Californ81701 Highway 111 Community Center 10,901 8.3% $12.00 $1.00
Subtotal/Weighted Average: 50,037 70.7% $14.27 $1.19
Former Imperial Furnishings 82490 Highway 111 1978 Neighborhood Center 44,000 0.0% Withheld ---Heritage Court 44100 Jefferson St 2006 Neighborhood Center 41,438 67.8% $18.00 $1.50Kristen Plaza 81850-81940 Highway 111 Neighborhood Center 38,523 45.5% $12.00 $1.00Shadow Hills Plaza - Shops G 82900 Avenue 42 2008 Neighborhood Center 17,865 100.0% $12.00 $1.00Desert Hills Plaza 81580-81614 Highway 111 1967 2006 Neighborhood Center 14,179 82.5% $12.00 $1.00Shadow Hills Plaza -Fresh & Eas 82900 Avenue 42 2008 Neighborhood Center 13,969 0.0% $24.00 $2.00Madison Plaza 81096 Highway 111 Neighborhood Center 12,780 79.4% $21.00 $1.75
Subtotal/Weighted Average: 182,754 46.7% $15.83 $1.32
Jefferson Commerical Plaza - Bld80150 Hwy 111 Strip Center 14,779 70.3% $18.22 $1.52
15529.00 Retail RecComps:Inv Page 2 of 3 THE CONCORD GROUPPage 292 of 332

EXHIBIT VI-6-A
RETAIL INVENTORY TABLEEASTERN COACHELLA VALLEY
FEBRUARY 2016
Year $/SF (NNN)Building Name Address Built Renov. Property Type RBA Occ. Yr Mo. Anchor Tenants
31% of retail inventory are Community Centers, 27% are Power Centers, and 27% are Neighborhood Centers. Power Centers
have the highest occupancy at 95%
Dollar Tree 82001-82025 Hwy 111 General Retail 29,165 79.4% $12.29 $1.0245151 Oasis St General Retail 27,000 44.4% $6.60 $0.55
Granada Professional Building 81730 Hwy 111 1979 General Retail 25,000 84.7% $14.40 $1.2045742 Oasis St 2000 General Retail 22,800 0.0% Withheld ---
Castle City 82530 Hwy 111 1996 General Retail 20,259 60.5% $12.00 $1.00Plaza Center 81955 US Highway 111 1964 General Retail 19,866 64.8% Withheld ---
45013-45073 Oasis St General Retail 14,398 44.7% $6.60 $0.55Subtotal/Weighted Average: 158,488 55.5% $10.66 $0.89
Total/Weighted Average: 475,042 57.5% $13.99 $1.17
Indio Total/ Weighted Average: 1,876,606 76.5% $13.35 $1.11
Eastern Coachella Valley Total: 2,464,179 77.6% $13.73 $1.14Power Center: 673,715 95.2% $18.77 $1.56 Power Center
Community Center: 775,485 70.3% $13.50 $1.12 Community CenterNeighborhood Center: 640,700 66.6% $14.38 $1.20 Neighborhood Center
Strip Center: 25,047 80.0% $18.22 $1.52 Strip CenterGeneral Retail: 349,232 79.8% $10.66 $0.89 General Retail
Source: CoStar
15529.00 Retail RecComps:Inv Page 3 of 3 THE CONCORD GROUPPage 293 of 332

EXHIBIT VI-6-B
RETAIL INVENTORY TABLEWEST SHORES / SALTON CITY
MARCH 2016
Year $/SF (NNN)Building Name Address Built Renov. Property Type RBA Occ. Yr Mo. Anchor Tenants
Salton City
Family Dollar 2108 Highway 86 Service Rd 2007 2012 General Retail 11,592 100.0% --- --- Family Dollar--- 2116 S Marina Dr 2006 --- General Retail 4,480 100.0% --- ---West Shores Market 2113 S Marina Dr --- --- General Retail 3,500 100.0% --- --- West Shores Market
Subtotal/Weighted Average: 19,572 100.0% --- ---
Desert Shores
--- 3788 Scott Dr 1970 --- General Retail 3,000 100.0% --- ------ 12 Monterey Ave --- --- General Retail 1,300 100.0% --- ---
Subtotal/Weighted Average: 4,300 100.0% --- ---
Total/Weighted Average: 23,872 100.0% --- ---
Retail inventory consists of General Retail stores with 100% occupancy.
15529.00 Retail RecComps Ph. 2:Inv THE CONCORD GROUPPage 294 of 332

EXHIBIT VI-7-A
FUTURE RETAIL SUPPLYCOACHELLA VALLEY
FEBRUARY 2016
Building EstimatedName Park Address City Property Type Completion RBA
Under Construction
La Quinta Square 78611 Highway 111 La Quinta General Retail 2016 20,46178613 Highway 111 Way La Quinta General Retail 2016 6,230
Sleep Train 67525 E Palm Canyon Dr Cathedral City General Retail 2016 4,99469060 Vista Chino Cathedral City General Retail 2016 2,241
Pierson Plaza 65755 Pierson Blvd Desert Hot Springs General Retail 2017 100,000Total Under Construction: 133,926
Proposed
Rancho Las Palmas 42370 Bob Hope Dr Rancho Mirage Community Center 2016 48,100Bldg 3 The Mission Lakes Market Place 64949 Mission Lakes Blvd Desert Hot Springs Neighborhood Center 2016 13,231Bldg 5 World Plaza Dr. Carreon Blvd Indio General Retail 2016 11,40014866 Palm Dr 14866 Palm Dr Desert Hot Springs General Retail 2016 75,000Taco Bell 50060 Harrison St Coachella General Retail 2016 2,100Bldg G Madison Street Business Center 48755 Madison St Indio Community Center 2017 28,265Bldg F2 Madison Street Business Center 48755 Madison St Indio Community Center 2017 7,485Bldg A Madison Street Business Center 48755 Madison St Indio Community Center 2017 7,300Bldg D Madison Street Business Center 48755 Madison St Indio Community Center 2017 6,900Bldg J Madison Street Business Center 48755 Madison St Indio Community Center 2017 6,320Bldg F1 Madison Street Business Center 48755 Madison St Indio Community Center 2017 5,420Bldg C Madison Street Business Center 48755 Madison St Indio Community Center 2017 5,100Bldg M Madison Street Business Center 48755 Madison St Indio Community Center 2017 5,090Bldg N Madison Street Business Center 48755 Madison St Indio Community Center 2017 5,090Bldg E Madison Street Business Center 48755 Madison St Indio Community Center 2017 4,560Bldg L Madison Street Business Center 48755 Madison St Indio Community Center 2017 4,040Bldg K Madison Street Business Center 48755 Madison St Indio Community Center 2017 3,980Bldg B Madison Street Business Center 48755 Madison St Indio Community Center 2017 3,500Bldg P Madison Street Business Center 48755 Madison St Indio Community Center 2017 3,500Bldg O Madison Street Business Center 48755 Madison St Indio Community Center 2017 3,500Bldg 3 World Plaza Calhoun St Indio General Retail 2017 3,000Pad B Caleo Bay Park 47875 Caleo Bay Dr La Quinta Strip Center 3,674Coachella Gateway Center Coachella Gateway Center 49415 Grapefruit Blvd Coachella General Retail 2,271Convention Center Commons Convention Center Commons 1080 Tahquitz Canyon Way Palm Springs General Retail 9,680A Date Palm Square NWC Highway 111 @ Date Pa Cathedral City Neighborhood Center 22,700B Date Palm Square NWC Highway 111 Cathedral City Neighborhood Center 15,500C Date Palm Square NWC Highway 111 Cathedral City Neighborhood Center 10,000
1.7 million s.f. proposed, 54% or 922k s.f. of planned and proposed
retail projects in East CV.
15529.00 Retail RecComps:P&P Page 1 of 4 The Concord GroupPage 295 of 332

EXHIBIT VI-7-A
FUTURE RETAIL SUPPLYCOACHELLA VALLEY
FEBRUARY 2016
Building EstimatedName Park Address City Property Type Completion RBA
1.7 million s.f. proposed, 54% or 922k s.f. of planned and proposed
retail projects in East CV.
D Date Palm Square NWC Highway 111 Cathedral City Neighborhood Center 5,000E Date Palm Square NWC Highway 111 Cathedral City Neighborhood Center 3,200Pad 22 Desert Gateway Monterey Ave Palm Desert Power Center 6,500Bldg A Destination Ramon 701 Crossley Rd Palm Springs Community Center 30,000Bldg E El Paseo Square 73397 El Paseo Palm Desert Neighborhood Center 4,968Bldg F El Paseo Square El Paseo Palm Desert Neighborhood Center 3,655El Paseo Square - Pad B El Paseo Square 73470 El Paseo Palm Desert General Retail 3,448DB-1 Indian Wells Crossing Highway 111 Indian Wells Lifestyle Center 35,600DB-7 Indian Wells Crossing Highway 111 Indian Wells Lifestyle Center 15,000DB-8 Indian Wells Crossing Highway 111 Indian Wells Lifestyle Center 10,000DB-3 Indian Wells Crossing Highway 111 Indian Wells Lifestyle Center 7,500OP-3 Indian Wells Crossing Highway 111 Indian Wells Lifestyle Center 7,000DB-5 Indian Wells Crossing Highway 111 Indian Wells Lifestyle Center 6,400DB-6 Indian Wells Crossing Highway 111 Indian Wells Lifestyle Center 5,500Pad A Indio Pit Center 84121 Indio Springs Dr Indio Strip Center 6,500Pad B Indio Pit Center 84119 Indio Springs Dr Indio Strip Center 4,800Pad D Indio Pit Center 84115 Indio Springs Dr Indio Strip Center 3,500Pad C Indio Pit Center 84117 Indio Springs Dr Indio Strip Center 3,500Major 3 - 6 Indio Towne Center 42200-42500 Jackson St Indio Power Center 98,160Major 9 Indio Towne Center 42850 Jackson St Indio Power Center 25,000Major 11 Indio Towne Center 42550 Jackson St Indio Power Center 10,000Restaurant 3 Indio Towne Center 42550 Jackson St Indio Power Center 7,800Applebee's Indio Towne Center 42250 G Jackson St Indio Power Center 7,376Phase II Indio Towne Center 42150 Jackson St Indio Power Center 7,060Bldg 300 Indio Towne Center 42860 Jackson St Indio Power Center 4,000Jefferson Street Plaza Jefferson Street Plaza Jefferson St Indio Neighborhood Center 65,500Jefferson Street Plaza Jefferson Street Plaza Jefferson St Indio Neighborhood Center 15,000Jefferson Street Plaza Jefferson Street Plaza Jefferson St Indio Neighborhood Center 6,000Jefferson Street Plaza Jefferson Street Plaza Jefferson St Indio Neighborhood Center 4,500Jefferson Street Plaza Jefferson Street Plaza Jefferson St Indio Neighborhood Center 4,000Jefferson Street Plaza Jefferson Street Plaza Jefferson St Indio Neighborhood Center 3,500Retail 1 Monterey Crossroads Power Center Monterey Ave Palm Desert Strip Center 15,000Retail 2 Monterey Crossroads Power Center Monteey Ave Palm Desert Strip Center 9,880Pad 4 Monterey Crossroads Power Center Monterey Ave Palm Desert Strip Center 6,000Pad 1 Monterey Crossroads Power Center Monterey Ave @ I-10 Palm Desert Strip Center 4,668Pad 2 Monterey Crossroads Power Center Monterey Ave Palm Desert Strip Center 4,000Pad 3 Monterey Crossroads Power Center Monterey Ave Palm Desert Strip Center 3,000Fast Food Pad Palm Springs Marketplace 1717 E Vista Chino Palm Springs Community Center 5,000
15529.00 Retail RecComps:P&P Page 2 of 4 The Concord GroupPage 296 of 332
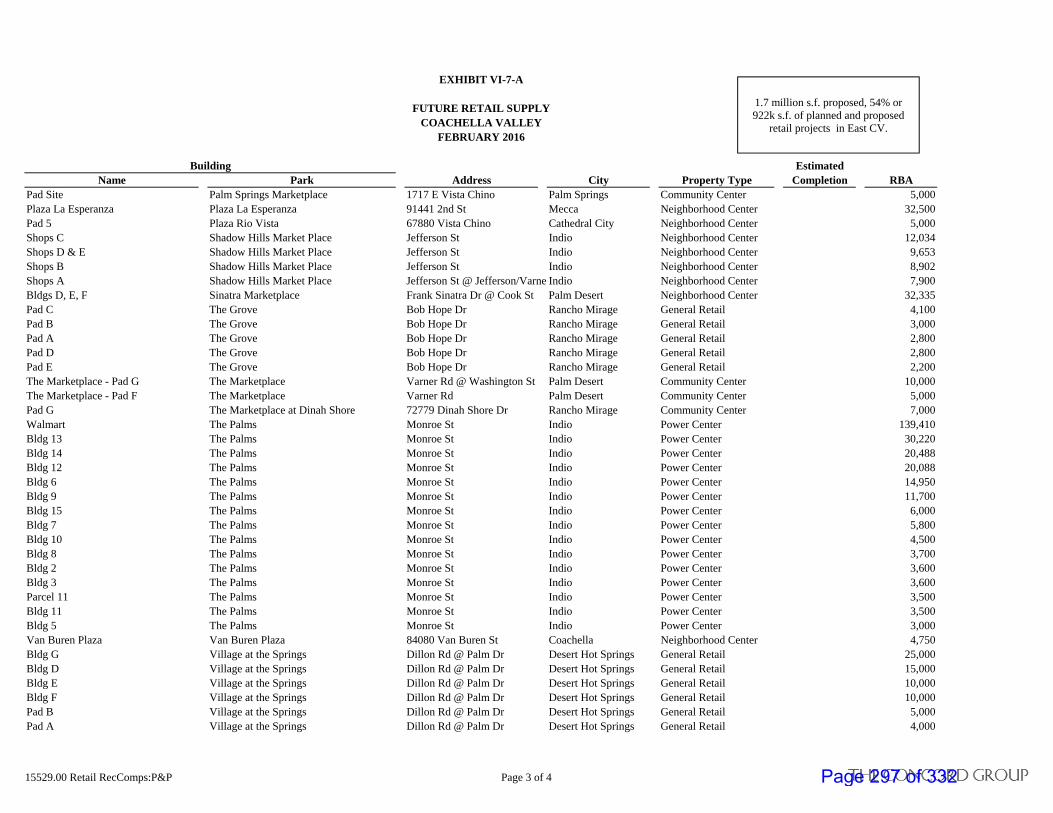
EXHIBIT VI-7-A
FUTURE RETAIL SUPPLYCOACHELLA VALLEY
FEBRUARY 2016
Building EstimatedName Park Address City Property Type Completion RBA
1.7 million s.f. proposed, 54% or 922k s.f. of planned and proposed
retail projects in East CV.
Pad Site Palm Springs Marketplace 1717 E Vista Chino Palm Springs Community Center 5,000Plaza La Esperanza Plaza La Esperanza 91441 2nd St Mecca Neighborhood Center 32,500Pad 5 Plaza Rio Vista 67880 Vista Chino Cathedral City Neighborhood Center 5,000Shops C Shadow Hills Market Place Jefferson St Indio Neighborhood Center 12,034Shops D & E Shadow Hills Market Place Jefferson St Indio Neighborhood Center 9,653Shops B Shadow Hills Market Place Jefferson St Indio Neighborhood Center 8,902Shops A Shadow Hills Market Place Jefferson St @ Jefferson/Varne Indio Neighborhood Center 7,900Bldgs D, E, F Sinatra Marketplace Frank Sinatra Dr @ Cook St Palm Desert Neighborhood Center 32,335Pad C The Grove Bob Hope Dr Rancho Mirage General Retail 4,100Pad B The Grove Bob Hope Dr Rancho Mirage General Retail 3,000Pad A The Grove Bob Hope Dr Rancho Mirage General Retail 2,800Pad D The Grove Bob Hope Dr Rancho Mirage General Retail 2,800Pad E The Grove Bob Hope Dr Rancho Mirage General Retail 2,200The Marketplace - Pad G The Marketplace Varner Rd @ Washington St Palm Desert Community Center 10,000The Marketplace - Pad F The Marketplace Varner Rd Palm Desert Community Center 5,000Pad G The Marketplace at Dinah Shore 72779 Dinah Shore Dr Rancho Mirage Community Center 7,000Walmart The Palms Monroe St Indio Power Center 139,410Bldg 13 The Palms Monroe St Indio Power Center 30,220Bldg 14 The Palms Monroe St Indio Power Center 20,488Bldg 12 The Palms Monroe St Indio Power Center 20,088Bldg 6 The Palms Monroe St Indio Power Center 14,950Bldg 9 The Palms Monroe St Indio Power Center 11,700Bldg 15 The Palms Monroe St Indio Power Center 6,000Bldg 7 The Palms Monroe St Indio Power Center 5,800Bldg 10 The Palms Monroe St Indio Power Center 4,500Bldg 8 The Palms Monroe St Indio Power Center 3,700Bldg 2 The Palms Monroe St Indio Power Center 3,600Bldg 3 The Palms Monroe St Indio Power Center 3,600Parcel 11 The Palms Monroe St Indio Power Center 3,500Bldg 11 The Palms Monroe St Indio Power Center 3,500Bldg 5 The Palms Monroe St Indio Power Center 3,000Van Buren Plaza Van Buren Plaza 84080 Van Buren St Coachella Neighborhood Center 4,750Bldg G Village at the Springs Dillon Rd @ Palm Dr Desert Hot Springs General Retail 25,000Bldg D Village at the Springs Dillon Rd @ Palm Dr Desert Hot Springs General Retail 15,000Bldg E Village at the Springs Dillon Rd @ Palm Dr Desert Hot Springs General Retail 10,000Bldg F Village at the Springs Dillon Rd @ Palm Dr Desert Hot Springs General Retail 10,000Pad B Village at the Springs Dillon Rd @ Palm Dr Desert Hot Springs General Retail 5,000Pad A Village at the Springs Dillon Rd @ Palm Dr Desert Hot Springs General Retail 4,000
15529.00 Retail RecComps:P&P Page 3 of 4 The Concord GroupPage 297 of 332

EXHIBIT VI-7-A
FUTURE RETAIL SUPPLYCOACHELLA VALLEY
FEBRUARY 2016
Building EstimatedName Park Address City Property Type Completion RBA
1.7 million s.f. proposed, 54% or 922k s.f. of planned and proposed
retail projects in East CV.
Pad C Village at the Springs Dillon Rd @ Palm Dr Desert Hot Springs General Retail 1,200Submajor 6-8 Washington Park Washington St La Quinta Regional Mall 74,000Shops 1 Washington Park 78955 Highway 111 La Quinta Regional Mall 17,586Shops 5 Washington Park 46800 Washington St La Quinta Regional Mall 15,000Shops 6 Washington Park 46975 La Quinta Dr La Quinta Regional Mall 12,475Pad 8 Washington Park Washington St La Quinta Regional Mall 6,600Pad Washington Park Highway 111 @ Adams St La Quinta Regional Mall 6,424Pad 7 Washington Park 46920 Highway 111 La Quinta Regional Mall 6,000Pad 2 Washington Square 39175 Washington St Indio Neighborhood Center 2,400Bldg 1 World Plaza Calhoun St Indio General Retail 14,700NEC I-10 & Monroe Ave NEC I-10 & Monroe Ave Indio General Retail 110,000Pads/Shops/Inline 42225-42425 Jackson St Indio General Retail 40,00072-091 Highway 111 72-091 Highway 111 Rancho Mirage General Retail 22,000128 Gene Autry Trl 128 Gene Autry Trl Palm Springs General Retail 19,60272950 Highway 111 72950 Highway 111 Palm Desert General Retail 15,000Palm Village Gourmet Food Court 42455 Washington St Palm Desert General Retail 13,300Pad 4 Washington St Palm Desert General Retail 7,20030900 Date Palm Dr 30900 Date Palm Dr Cathedral City General Retail 6,93350080 Harrison St 50080 Harrison St Coachella General Retail 6,517The Waterfront Highway 111 & East Veldt Rancho Mirage General Retail 6,000Proposed Retail 79840 Hwy 111 La Quinta General Retail 6,000Pad 5 39565 Washington St Palm Desert General Retail 4,80074880 Gerald Ford Dr 74880 Gerald Ford Dr Palm Desert General Retail 4,50066th Ave 66th Ave Thermal General Retail 3,100Restaurant Pad 75144 Gerald Ford Dr Palm Desert General Retail 3,00051298 Harrison St 51298 Harrison St Coachella General Retail 479
Total Proposed: 1,707,067Total East CV: 922,008
Coachella 16,117Indio 870,291
Mecca 32,500Thermal 3,100
15529.00 Retail RecComps:P&P Page 4 of 4 The Concord GroupPage 298 of 332

EXHIBIT VI-7-B
FUTURE RETAIL SUPPLYIMPERIAL COUNTY
MARCH 2016
Building EstimatedName Park Address City Property Type Completion RBA
*** Currently no projects planned or proposed in the Imperial County Opportunity Areas ***
15529.00 Retail RecComps Ph. 2:P&P THE CONCORD GROUPPage 299 of 332

EXHIBIT VI-8
COMPARISON OF LEASE RATES OF SELECTED RETAIL DEVELOPMENTSCOACHELLA VALLEY
FEBRUARY 2016
$1.25
$1.07
$1.35
$1.20
$1.00
$1.20
$1.00
$1.15
$1.25
$1.41
$1.00
$1.75
$1.25
$1.50
$1.00 $1.00 $1.00
$2.00
$1.75
$1.56 $1.52
$0.00
$0.25
$0.50
$0.75
$1.00
$1.25
$1.50
$1.75
$2.00
$2.25
$2.50
Coa
chel
laPl
aza
Indi
o Fa
shio
nM
all
Tow
n &
Cou
nty
Sou
th-
Bld
g C
Tow
n &
Cou
nty
Sou
th-
Bld
g B
Tow
n &
Cou
ntry
Sou
th-
Cal
ifor
nia
Ban
k &
Tru
st
Gra
nada
Prof
essi
onal
Bui
ldin
g
Cas
tle C
ity
Coa
chel
laSh
oppi
ngC
ente
r
Har
riso
n P
laza
- B
ldg
1
Plaz
a T
onal
a
Van
Bur
enPl
aza
- Fr
esh
& E
asy
Jack
son
Squa
re -
Sho
ps 1
Har
riso
n P
laza
- B
ldg
2
Her
itag
e C
ourt
Kri
sten
Pla
za
Sha
dow
Hil
lsPl
aza
- Sh
ops
G
Des
ert H
ills
Plaz
a
Sha
dow
Hil
lsPl
aza
-Fre
sh &
Eas
y
Mad
ison
Pla
za
Indi
o T
owne
Cen
ter
- S
hops
3
Jeff
erso
nC
omm
eric
alPl
aza
- B
ldg
C
Mon
thly
Lea
se $
/SF
Color = Location
Blue = CoachellaRed = Indio
Community Center GeneralRetail
Neighborhood Center
PowerCenter
StripCenter
Retail lease rates in Indio are slightly higher than in Coachella.
15529.00 Retail RecComps: Lease Rates the concord groupPage 300 of 332

The Concord Group
VII. OFFICE
Page 301 of 332

EXHIBIT VII-1-A
MAP OF MAJOR OFFICE - CURRENT AND PLANNEDCOACHELLA VALLEY
FEBRUARY 2016
Color = Status
Yellow = ExistingGreen = Under Construction
Blue = Planned
15529.00 Office Maps: Office - Current and Planned Page 1 of 2 The Concord GroupPage 302 of 332

EXHIBIT VII-1-B
MAP OF MAJOR OFFICE - CURRENT AND PLANNEDWEST SHORES / SALTON CITY
MARCH 2016
Total office square fo
Color = Status
Yellow = ExistingGreen = Under Construction
Blue = Planned
1
Currently no office projects under construction or planned.
15529.00 Office Maps Ph. 2: Office - Current and Planned The Concord GroupPage 303 of 332

EXHIBIT VII-2-A
OFFICE MACRO MARKET PERFORMANCECOACHELLA VALLEY
2007 THROUGH 2015
AverageMarket Factor (SF) 2007 2008 2009 2010 2011 2012 2013 2014 2015 5- Year 2007-2015
Total RBA 7,773,106 8,008,521 8,071,061 8,073,361 8,066,600 8,058,564 8,067,589 8,109,404 8,107,904 8,082,012 8,037,346% Growth 3.0% 0.8% 0.0% -0.1% -0.1% 0.1% 0.5% 0.0% 0.1% 0.5%
Net Deliveries 235,415 62,540 2,300 (6,761) (8,036) 9,025 41,815 (1,500) 6,909 41,850% Growth -73.4% -96.3% -394.0% 18.9% -212.3% 363.3% -103.6% -65.5% -71.1%
Occupancy Rate 89.0% 85.2% 82.8% 85.0% 87.5% 87.8% 89.9% 90.1% 89.6% 89.0% 87.4%% Growth -4.3% -2.8% 2.7% 2.9% 0.3% 2.4% 0.2% -0.6% 1.1% 0.1%
Occupied Stock 6,918,064 6,823,260 6,682,839 6,862,357 7,058,275 7,075,419 7,252,763 7,306,573 7,264,682 7,191,542 7,027,137% Growth -1.4% -2.1% 2.7% 2.9% 0.2% 2.5% 0.7% -0.6% 0.7% 0.6%
Net Absorption (94,804) (140,421) 179,518 195,918 17,144 177,343 53,810 (41,891) 80,465 43,327
Lease Rate $23.89 $21.17 $17.62 $16.59 $16.57 $15.04 $14.87 $15.15 $14.90 $15.31 $17.31% Growth -11.4% -16.8% -5.8% -0.1% -9.2% -1.1% 1.9% -1.7% -2.6% -5.7%
Source: CoStar
235
632
-7 -8
942
-2
89.0%
85.2% 82.8%
85.0%
87.5%
87.8%89.9% 90.1% 89.6%
75.0%77.0%79.0%81.0%83.0%85.0%87.0%89.0%91.0%93.0%95.0%
(250)
(150)
(50)
50
150
250
2007 2008 2009 2010 2011 2012 2013 2014 2015
Coachella Valley Deliveries and Occupancy
Deliveries Occupancy
Squa
re F
eet (
000'
s)
$23.89
$21.17
$17.62$16.59 $16.57
$15.04 $14.87 $15.15 $14.90
$13.00
$15.00
$17.00
$19.00
$21.00
$23.00
$25.00
2007 2008 2009 2010 2011 2012 2013 2014 2015
Asking Rent
There has been no growth in office inventory from 2014. However
occupancy remains high at 90%, slightly above the 2007-2015 average
15259.00 Office Macro Market Trends: Macro Market - CV The Concord GroupPage 304 of 332

EXHIBIT VII-2-B
OFFICE MACRO MARKET PERFORMANCECOACHELLA VALLEY, RIVERSIDE COUNTY, IMPERIAL COUNTY
2007 THROUGH 2015
AverageMarket Factor (SF) 2007 2008 2009 2010 2011 2012 2013 2014 2015 5- Year 2007-2015
Total RBA (000s)Riverside County 30,041,786 31,977,579 33,202,224 33,407,488 33,486,201 33,587,881 33,595,137 33,827,116 33,973,510 33,693,969 33,010,991Coachella Valley 7,773,106 8,008,521 8,071,061 8,073,361 8,066,600 8,058,564 8,067,589 8,109,404 8,107,904 8,082,012 8,037,346
% Riverside County 26% 25% 24% 24% 24% 24% 24% 24% 24% 24% 24%Imperial County 971,064 992,836 1,016,217 1,016,217 1,009,747 1,009,747 1,009,747 1,009,747 1,069,747 1,021,747 1,011,674
% Riverside County 3% 3% 3% 3% 3% 3% 3% 3% 3% 3% 3%
Net DeliveriesRiverside County 1,935,793 1,224,645 205,264 78,713 101,680 7,256 231,979 146,394 113,204 491,466Coachella Valley 235,415 62,540 2,300 (6,761) (8,036) 9,025 41,815 (1,500) 6,909 41,850
% Riverside County 12% 5% 1% -9% -8% 124% 18% -1% 6% 9%Imperial County 21,772 23,381 0 (6,470) 0 0 0 60,000 10,706 12,335
% Riverside County 1% 2% 0% -8% 0% 0% 0% 41% 9% 3%
Occupancy RateRiverside County 90.0% 84.8% 82.6% 83.4% 85.4% 86.4% 88.4% 89.3% 90.0% 87.9% 86.7%Coachella Valley 89.0% 85.2% 82.8% 85.0% 87.5% 87.8% 89.9% 90.1% 89.6% 89.0% 87.4%Imperial County 97.9% 93.0% 94.9% 95.9% 95.0% 92.7% 91.3% 93.8% 93.4% 93.2% 94.2%
Occupied StockRiverside County 27,037,607 27,116,987 27,425,037 27,861,845 28,597,216 29,019,929 29,698,101 30,207,615 30,576,159 29,619,804 28,615,611Coachella Valley 6,918,064 6,823,260 6,682,839 6,862,357 7,058,275 7,075,419 7,252,763 7,306,573 7,264,682 7,191,542 7,027,137
% Riverside County 26% 25% 24% 25% 25% 24% 24% 24% 24% 24% 25%Imperial County 950,672 923,337 964,390 974,552 959,260 936,035 921,899 947,143 999,144 952,696 952,937
% Riverside County 4% 3% 4% 3% 3% 3% 3% 3% 3% 3% 3%
Net AbsorptionRiverside County 79,380 308,050 436,808 735,371 422,714 678,172 509,513 368,544 542,863 442,319Coachella Valley (94,804) (140,421) 179,518 195,918 17,144 177,343 53,810 (41,891) 80,465 43,327
% Riverside County -119% -46% 41% 27% 4% 26% 11% -11% 15% 10%Imperial County (27,334) 41,052 10,162 (15,292) (23,224) (14,136) 25,244 52,001 4,918 6,059
% Riverside County -34% 13% 2% -2% -5% -2% 5% 14% 1% 1%
Lease RateRiverside County $25.32 $23.59 $21.14 $18.71 $17.56 $17.05 $17.41 $18.08 $18.53 $17.73 $19.71
% Growth -7% -12% -13% -7% -3% 2% 4% 2% -3% -6%Coachella Valley $23.89 $21.17 $17.62 $16.59 $16.57 $15.04 $14.87 $15.15 $14.90 $15.31 $17.31
% Growth -13% -20% -6% 0% -10% -1% 2% -2% -3% -6%Imperial County $10.85 $9.99 $15.50 $14.57 $14.32 $11.97 $13.75 $14.45 $19.22 $14.74 $13.85
% Growth -9% 36% -6% -2% -20% 13% 5% 25% -3% -6%
Occupancy rates in Imperial County and Coachella Valley are higher than
Riverside County. 100k sf delivered occurred in Coachella Valley and
Imperial County in the past two years.
15259.00 Office Macro Market Trends Ph. 2: Macro Market - CV,IV,RC The Concord GroupPage 305 of 332

EXHIBIT VII-3
OFFICE SUBMARKET COMPARISONINLAND EMPIRE
2016 QUARTER TO DATE
Coachella Valley Ontario Corona Riverside Outlying Riverside East SB North SB West SB Outlying SBMarket Factor # % Total # % Total # % Total # % Total # % Total # % Total # % Total # % Total # % of Total Total
Total RBA 8,122,571 12.7% 13,105,135 20.5% 3,377,809 5.3% 13,828,274 21.6% 71,377 0.1% 15,430,869 24.1% 5,504,316 8.6% 4,181,893 6.5% 428,787 0.7% 64,051,031
Total Buildings 785 14.2% 774 14.0% 219 4.0% 1,066 19.3% 16 0.3% 1,324 24.0% 853 15.4% 412 7.5% 77 1.4% 5,526
Occupancy Rate 89.2% 97.1% 89.1% 97.0% 88.3% 96.1% 90.4% 98.4% 96.9% 105.4% 87.6% 95.3% 94.1% 102.4% 90.8% 98.8% 92.5% 100.7% 91.9%
Occupied Stock 7,245,333 12.6% 11,676,675 20.4% 2,982,605 5.2% 12,500,760 21.8% 69,164 0.1% 13,517,441 23.6% 5,179,561 9.0% 3,797,159 6.6% 396,628 0.7% 57,365,327
Net Deliveries (s.f.) (1) 0 0.0% 40,040 --- 0 --- 100,094 --- 0 0.0% 9,795 6.1% 10,000 6.2% 875 0.5% 0 0.0% 160,804
Under Construction (s.f.) 0 0.0% 0 0.0% 17,000 8.1% 19,636 9.3% 0 0.0% 150,000 71.3% 23,780 11.3% 0 0.0% 0 0.0% 210,416
Average Rent ($/sf/year) $18.55 115.6% $20.56 128.1% $24.12 150.3% $20.68 128.8% $20.01 124.7% $17.30 107.8% $17.38 108.3% $20.68 128.8% $14.03 87.4% $16.05
(1) 1Q 2015 - 1Q 2016Source: CoStar
80.0%
82.0%
84.0%
86.0%
88.0%
90.0%
92.0%
94.0%
96.0%
98.0%
-50,000
0
50,000
100,000
150,000
200,000
Coachella Valley Airport Area Corona Riverside OutlyingRiverside
East SB North SB West SB Outlying SBV
acan
cy R
ate
Del
iver
ies
(Squ
are
Fee
t)
Deliveries (s.f.) Vacancy Rate
$5.00
$7.50
$10.00
$12.50
$15.00
$17.50
$20.00
$22.50
$25.00
0
25,000
50,000
75,000
100,000
125,000
150,000
175,000
200,000
CoachellaValley
Airport Area Corona Riverside OutlyingRiverside
East SB North SB West SB Outlying SB
Avg
. Ren
t ($
/sf/
yr)
Und
er C
onst
ruct
ion
(Squ
are
Fee
t)Under Construction (s.f.) Average Rent ($/sf/year)
Currently no net deliveries or projects under construction in Coachella
Valley.
15259.00 Office Macro Market Trends: Submarket Comparison - IE The Concord GroupPage 306 of 332

EXHIBIT VII-4-A
OFFICE INVENTORY TABLEEASTERN COACHELLA VALLEY
FEBRUARY 2016
Year $/SF (NNN)Building Name Address Built Renov. Property Type RBA Occ. Yr Mo.
Coachella
Built Before 20001650 1st St 1945 Office 2,631 100% --- ---1460 5th St Office 576 100% --- ---1478 5th St 1959 Office 1,724 100% --- ---1293 6th St Office 7,000 100% --- ---1441 6th St Office 474 100% --- ---1457 6th St Office 862 100% --- ---1460 6th St Office 2,700 100% --- ---1482 6th St Office 1,000 100% --- ---1517 6th St Office 2,418 100% --- ---1560 6th St Office 2,700 100% --- ---1648 6th St Office 2,394 100% --- ---1657 6th St Office 1,738 100% --- ---1694 6th St 1989 Office 8,000 100% --- ---1467 7th St Office 800 100% --- ---1538 7th St 1989 Office 6,100 100% --- ---1604 7th St Office 4,750 100% --- ---1684 9th St Office 2,398 100% --- ---
Anthony Vineyards 52301 Enterprise Way 1989 Office 1,700 100% --- ---Desert Communities Empowerment Zone 53900 Enterprise Way Office 13,904 100% --- ---Center For Employment Training 49111 Grapefruit Blvd 1990 Office 23,537 100% --- ---
85735 Grapefruit Blvd Office 1,736 100% --- ---51544 Harrison St Office 12,445 74% $18.00 $1.5051596 Harrison St Office 7,259 100% --- ---51678 Harrison St Office 996 100% --- ---52191 Harrison St Office 1,571 100% --- ---791 Orchard St Office 4,080 $7.08 $0.5952447 Us Highway 86 1985 Office 18,188 100% --- ---722 Vine Ave Office 823 100% --- ---752 Vine Ave Office 467 100% --- ---790 Vine Ave Office 716 100% --- ---
Nueva Clinica California 1490 6th St Office 4,000 Withheld ---
Coachella Total/ Weighted Average: 139,687 91.9% $12.54 $1.05
There is currently 1 million s.f. of office inventory in East CV. 72% of all inventory was built
before 2000.
15529.00 Office RecComps:Inv Page 1 of 4 THE CONCORD GROUPPage 307 of 332

EXHIBIT VII-4-A
OFFICE INVENTORY TABLEEASTERN COACHELLA VALLEY
FEBRUARY 2016
Year $/SF (NNN)Building Name Address Built Renov. Property Type RBA Occ. Yr Mo.
There is currently 1 million s.f. of office inventory in East CV. 72% of all inventory was built
before 2000.
Indio
Built Before 2000Norman Seto Optometry 45655-55 1/2 Oasis St. 1962 Office 2,085 100% --- ---
45700 Aladdin St Office 15,152 100% --- ---46247 Arabia St Office 1,680 100% --- ---79650 Avenue 42 Office 3,575 100% --- ---83791 Avenue 45 2001 Office 5,338 100% --- ---83912 Avenue 45 Office 14,400 73% $7.07 $0.5981840 Avenue 46 1980 Office 11,985 59% $12.00 $1.0079013 Bayside Ct 1984 Office 1,672 100% --- ---82901 Bliss Ave 1976 Office 13,000 100% --- ---
Riverside County Offices 79733 Country Club Dr 1987 Office 22,880 85% $13.20 $1.10Bldg B 81709 Doctor Carreon Blvd Office 6,200 100% --- ---Bldg C 81709 Doctor Carreon Blvd Office 11,143 100% --- ---Bldg A 81709 Doctor Carreon Blvd Office 4,390 100% --- ---Bldg E 81709 Doctor Carreon Blvd Office 3,355 100% --- ---Bldg D 81709 Doctor Carreon Blvd 1980 Office 3,900 100% Withheld ---
81715 Doctor Carreon Blvd Office 5,364 100% --- ---81715 Doctor Carreon Blvd Office 5,330 100% --- ---81719 Doctor Carreon Blvd Office 28,000 43% $15.00 $1.2581863 Doctor Carreon Blvd Office 14,722 100% $7.80 $0.65
Bldg 2 81863 Doctor Carreon Blvd 1980 Office 10,657 100% --- ---Building #1 81833 Dr Carreon Blvd 1980 Office 10,658 100% --- ---Carreon Professional Plaza 81880 Dr Carreon Blvd 1982 Office 34,890 45% $11.88 $0.99
82013 Dr Carreon Blvd 1988 Office 22,999 91% $15.00 $1.25Building #3 81893 Dr. Carreon Blvd 1980 Office 10,669 100% --- ---
45900 Fargo St Office 2,746 100% --- ---45550 Grace St 1970 Office 5,019 100% --- ---
Valley Children Medical Center 80495 Highway 111 Office 9,808 71% $23.10 $1.9380545 Highway 111 Office 7,879 100% --- ---81703 Highway 111 Office 4,589 100% --- ---81711 Highway 111 1965 Office 26,726 91% $7.80 $0.6582632 Highway 111 Office 4,257 100% --- ---81953 Hwy 111 Office 4,668 66% $12.00 $1.00
Las Adelfas 82365 Hwy 111 1979 Office 12,079 87% $13.20 $1.1082500 Hwy 111 1980 Office 8,280 100% $15.00 $1.2580916 Hwy. 111 1950 Office 1,760 100% --- ---82674 Hwy. 111 1960 Office 2,831 61% $7.47 $0.6281178 Indio Blvd Office 1,233 100% --- ---82660 Indio Blvd Office 1,201 100% --- ---
15529.00 Office RecComps:Inv Page 2 of 4 THE CONCORD GROUPPage 308 of 332

EXHIBIT VII-4-A
OFFICE INVENTORY TABLEEASTERN COACHELLA VALLEY
FEBRUARY 2016
Year $/SF (NNN)Building Name Address Built Renov. Property Type RBA Occ. Yr Mo.
There is currently 1 million s.f. of office inventory in East CV. 72% of all inventory was built
before 2000.
43612 Jackson St 1989 2014 Office 5,000 100% --- ---43715 Jackson St Office 1,078 100% --- ---43752 Jackson St Office 9,450 12% $11.88 $0.9943907 Jackson St Office 2,366 100% --- ---
Department Of Motor Vehicles 44480 Jackson St 1990 Office 6,239 100% --- ---44631 Jackson St Office 23,750 100% --- ---42760 Madio St Office 11,739 100% --- ---
St. Theresa Medical Group 82420 Miles Ave Office 2,927 100% --- ---McIntosh Pharmacy 82422 Miles Ave 1972 Office 1,586 100% --- ---Building #4 47001 Monroe 1980 Office 10,724 100% ---
45691 Monroe Blvd Office 17,287 36% $9.27 $0.7745701 Monroe Blvd 1978 Office 17,288 100% --- ---44200 Monroe St Office 1,791 100% --- ---44521 Monroe St 1949 Office 1,265 100% --- ---47797 Monroe St 1959 Office 2,235 100% --- ---44840 Oasis St Office 2,089 100% --- ---44926 Oasis St Office 7,000 7% $11.88 $0.9944967 Oasis St Office 1,190 100% --- ---45305 Oasis St Office 8,600 100% --- ---45497 Oasis St 1940 Office 1,600 100% --- ---45541 Oasis St Office 4,412 100% --- ---45841 Oasis St 1982 Office 9,078 100% --- ---
Oasis Professional Building 45895 Oasis St Office 2,934 100% --- ---45902 Oasis St Office 5,128 100% --- ---45915 Oasis St 1961 Office 3,720 100% --- ---45926 Oasis St 1978 Office 7,000 100% --- ---83057 Requa Ave 1978 Office 3,223 100% --- ---83115 Requa Ave 1977 Office 8,800 100% --- ---83135 Requa Ave Office 4,411 100% --- ---83180 Requa Ave Office 7,495 100% --- ---
82362-648 Ave. 46 82651 Saidy Ave 1960 Office 8,303 100% --- ---45495 Smurr St 1951 Office 1,000 100% --- ---45720 Smurr St Office 390 100% --- ---45140 Towne St 1948 Office 14,152 100% --- ---45160 Towne St Office 8,815 100% --- ---45235 Towne St Office 4,335 100% --- ---45450 Towne St Office 2,498 100% --- ---45835 Towne St 1960 Office 2,222 100% --- ---47159 Youngs Ln Office 2,900 100% --- ---45561 Oasis St 1955 Office 3,947 77% Withheld ---45677 Oasis St Office 3,250 46% Withheld ---
Total/Weighted Average: 600,337 85.4% $12.10 $0.42
15529.00 Office RecComps:Inv Page 3 of 4 THE CONCORD GROUPPage 309 of 332

EXHIBIT VII-4-A
OFFICE INVENTORY TABLEEASTERN COACHELLA VALLEY
FEBRUARY 2016
Year $/SF (NNN)Building Name Address Built Renov. Property Type RBA Occ. Yr Mo.
There is currently 1 million s.f. of office inventory in East CV. 72% of all inventory was built
before 2000.
Built After 200080531 Avenida San Ignacio 2004 Office 3,655 100% --- ---80646 Avenida San Ignacio 2004 Office 2,778 100% --- ---83473 Avenue 45 2007 Office 89,880 100% --- ---40504 Calle Santa Monica 2004 Office 2,085 100% --- ---80525 Camino San Gregorio 2004 Office 2,260 --- ---80619 Camino San Gregorio 2004 Office 2,800 --- ---80671 Camino San Gregorio 2004 Office 2,800 --- ---80739 Camino San Lucas 2004 Office 2,778 --- ---80911 Camino San Lucas 2005 Office 3,254 100% --- ---80634 Camino Santa Elise 2005 Office 2,260 --- ---80783 Camino Santa Paula 2006 Office 2,882 100% --- ---
Medallion Medical Building 81767 Doctor Carreon Blvd 2007 Office 26,000 100% --- ---Sedona Medical Plaza 81812 Doctor Carreon Blvd 2004 Office 12,646 100% --- ---
81800 Dr Carreon Blvd 2007 Office 43,000 95% $18.00 $1.5081713 Highway 111 2005 Office 6,096 77% $18.00 $1.50
DEPARTMENT OF PUBLIC SOCIAL SE 48113 Jackson St 2007 Office 31,171 100% --- ---46883 Monroe St 2008 Office 10,653 62% $18.00 $1.50
Bldg B 46900 Monroe St 2006 Office (Neighborhood Cent 6,840 100% --- ---45524 Oasis St 2014 Office 41,815 93% --- ---
Total/Weighted Average: 295,653 92.2% $18.00 $1.50
Indio Total/ Weighted Average: 895,990 87.6% $14.04 $0.77
Mecca
Built Before 200091275 66th Ave Office 20,695 100% --- ---
Mecca Total/ Weighted Average: 20,695 100% --- ---
Thermal
Built Before 200056589 111 Office 1,256 100% --- --56860 Higgins Dr Office 3,248 100% --- --
Thermal Total/ Weighted Average: 4,504 100.0% --- ---
Eastern Coachella Valley Total: 1,060,876 88.5% $12.98 $1.08Built Before 2000 Total: 765,223 87.1% $12.15 $1.01
Built After 2000 Total: 295,653 92.2% $18.00 $1.50
15529.00 Office RecComps:Inv Page 4 of 4 THE CONCORD GROUPPage 310 of 332

EXHIBIT VII-4-B
OFFICE INVENTORY TABLEIMPERIAL COUNTY
MARCH 2016
Map Year $/SF (NNN)Key Building Name Address Built Renov. Property Type RBA Occ. Yr Mo.
Salton City
1 Salton Sea Financial Center 2101 S Marina Dr --- --- Office 5,250 100% --- ---
Thermal Total/ Weighted Average: 5,250 100.0% --- ---
*** Currently no projects planned or proposed in the Imperial County Opportunity Areas ***
15529.00 Office RecComps Ph. 2:Inv The Concord GroupPage 311 of 332
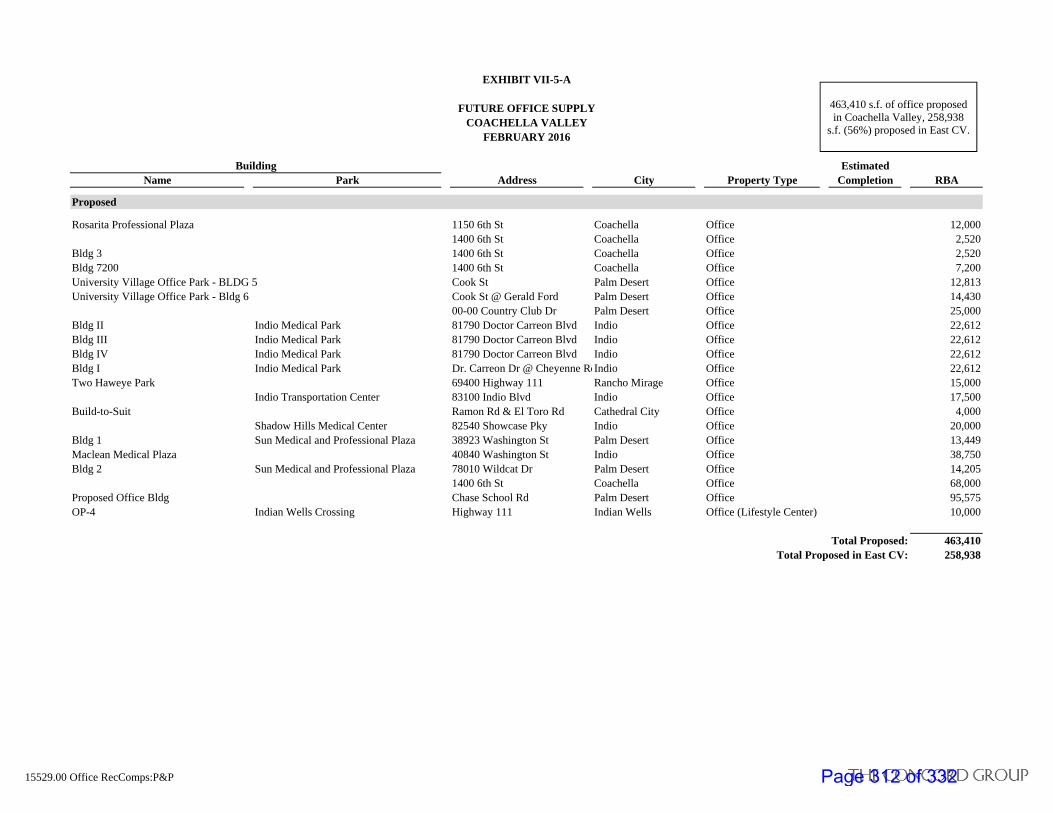
EXHIBIT VII-5-A
FUTURE OFFICE SUPPLYCOACHELLA VALLEY
FEBRUARY 2016
Building EstimatedName Park Address City Property Type Completion RBA
Proposed
Rosarita Professional Plaza 1150 6th St Coachella Office 12,0001400 6th St Coachella Office 2,520
Bldg 3 1400 6th St Coachella Office 2,520Bldg 7200 1400 6th St Coachella Office 7,200University Village Office Park - BLDG 5 Cook St Palm Desert Office 12,813University Village Office Park - Bldg 6 Cook St @ Gerald Ford Palm Desert Office 14,430
00-00 Country Club Dr Palm Desert Office 25,000Bldg II Indio Medical Park 81790 Doctor Carreon Blvd Indio Office 22,612Bldg III Indio Medical Park 81790 Doctor Carreon Blvd Indio Office 22,612Bldg IV Indio Medical Park 81790 Doctor Carreon Blvd Indio Office 22,612Bldg I Indio Medical Park Dr. Carreon Dr @ Cheyenne RdIndio Office 22,612Two Haweye Park 69400 Highway 111 Rancho Mirage Office 15,000
Indio Transportation Center 83100 Indio Blvd Indio Office 17,500Build-to-Suit Ramon Rd & El Toro Rd Cathedral City Office 4,000
Shadow Hills Medical Center 82540 Showcase Pky Indio Office 20,000Bldg 1 Sun Medical and Professional Plaza 38923 Washington St Palm Desert Office 13,449Maclean Medical Plaza 40840 Washington St Indio Office 38,750Bldg 2 Sun Medical and Professional Plaza 78010 Wildcat Dr Palm Desert Office 14,205
1400 6th St Coachella Office 68,000Proposed Office Bldg Chase School Rd Palm Desert Office 95,575OP-4 Indian Wells Crossing Highway 111 Indian Wells Office (Lifestyle Center) 10,000
Total Proposed: 463,410Total Proposed in East CV: 258,938
463,410 s.f. of office proposed in Coachella Valley, 258,938
s.f. (56%) proposed in East CV.
15529.00 Office RecComps:P&P The Concord GroupPage 312 of 332

EXHIBIT VII-5-B
FUTURE OFFICE SUPPLYIMPERIAL COUNTY
MARCH 2016
Building EstimatedName Park Address City Property Type Completion RBA
*** Currently no projects planned or proposed in the Imperial County Opportunity Areas ***
15529.00 Office RecComps Ph. 2:P&P The Concord GroupPage 313 of 332

EXHIBIT VII-6
COMPARISON OF LEASE RATES OF SELECTED OFFICE DEVELOPMENTSCOACHELLA VALLEY
FEBRUARY 2016
Office lease rates are higher in Coachella than Indio.
$1.50
$0.59 $0.59
$1.00
$1.10
$1.25
$0.65
$0.77
$1.50 $1.50 $1.50
$0.00
$0.25
$0.50
$0.75
$1.00
$1.25
$1.50
$1.75
$2.00
51544 Harrison St 791 Orchard St 83912 Avenue 45 81840 Avenue 46 79733 Country ClubDr
81719 DoctorCarreon Blvd
81863 DoctorCarreon Blvd
45691 Monroe Blvd 81800 Dr CarreonBlvd
81713 Highway 111 46883 Monroe St
Mon
thly
Lea
se $
/SF
Color = Location
Blue = CoachellaRed = Indio
Built Before 2000Built After 2000
15529.00 Office RecComps: Lease Rates the concord groupPage 314 of 332

The Concord Group
VII. APPENDICES
Page 315 of 332

APPENDIX A
RESIDENTIAL SURVEY - NEW HOMESEASTERN COACHELLA VALLEY
FEBRUARY 2016
Project Name/ Prod./ Units Sales FloorplanBuilder/ Lot Plan'd/ Start/ Bed/ Elev./ Home Base Price TaxLocation Size Sold Rate Name Bath Garage Size $ $/sf HOA Rate Notes
IndioDesert Trace SFD 85 Aug-14 1 3 / 2.0 1 / 2.0 2,000 $277,990 $139 $102 1.4% Incentives: $6,500Woodside Homes 8,000 33 1.8 2 4 / 2.0 1 / 2.0 2,088 $290,990 $139 Move in: $2,500Indio 3 3 / 2.5 1 / 2.0 2,226 $297,990 $134 In Phase 9 of 1741-429 Doyle St 4 4 / 2.5 1 / 2.0 2,469 $309,990 $126 Each phase 4-5 units(760) 342-4001http://woodsidehomes.com/community-woo
Gallery Links SFD 86 Feb-15 1 2 / 2.0 1 / 2.0 1,858 $269,990 $145 $254 1.4% Incentives: $0Gallery Homes 6,500 20 1.7 2 3 / 2.5 1 / 2.0 1,999 $294,100 $147Indio 3 3 / 2.5 1 / 2.0 2,233 $311,900 $14049-645 Beatty Street(760) 844-2440http://www.gallerylinks.info/index.html
Palazzo at Shadow Hills SFD 61 Sep-14 Plan 1 Lot 10 3 / 2.5 1 2.0 2,181 $292,990 $134 1.4% Incentives:Woodside Homes 7,500 58 3.4 Final Phase, Builder close outIndio81-839 Villa Palazzo(760) 342-4001http://woodsidehomes.com/Community-Pala
Bermuda DunesVibrante SFD 12 May-15 Residence 1 3 / 2.5 1 / 3.0 2,828 $485,000 $171 $161 1.23% Incentives: $0Corman Leigh 10,500 0 0.0 Residence 2 3 / 2.5 1 / 3.0 3,200 $490,900 $153 Model home price lowered Bermuda Dunes Model has 100k in upgrades42855-42889 Rachel Ct(760) 289-9078http://livevibrante.com/vibrante-community.
Yorkville SFD 29 Jan-16 1 3 / 2.5 1 / 2.0 1,809 $450,000 $249 $150 1.23% Incentives: $0GHA 9,000 4 3.9 2 3 / 2.5 1 / 2.0 2,032 $470,000 $231Bermuda Dunes 3 3 / 3.5 1 / 3.0 2,571 $540,000 $21078975 Darby Rd(760) 567-7966http://ghayorkville.com/home-community.ph
15259.00 RecComps: Comps-N Page 1 of 3 The Concord GroupPage 316 of 332

APPENDIX A
RESIDENTIAL SURVEY - NEW HOMESEASTERN COACHELLA VALLEY
FEBRUARY 2016
Project Name/ Prod./ Units Sales FloorplanBuilder/ Lot Plan'd/ Start/ Bed/ Elev./ Home Base Price TaxLocation Size Sold Rate Name Bath Garage Size $ $/sf HOA Rate NotesLa QuintaDarby Estates SFD 19 Dec-14 Plan 1X 3 / 3.5 1 2.0 2,698 $499,900 $185 $76 1.25% Incentives: $0GHA 8,400 17 1.2 Final Phase, Builder close outLa Quinta43335 Croisette Court(760) 625-6210http://ghadarby.com/darby-community.html
Alta Verde at Coral Mountain SFD 70 Jul-14 Arcadia 3 / 3.5 1 2.0 2,803 $649,900 $232 $195 1.25% Incentives: $0Alta Verde Group 9,583 65 3.4 Modern Breeze 3 / 3.5 1 2.0 2,814 $675,000 $240 5 leftLa Quinta80-750 Castillo Del Areana(760) 219-2197http://www.altaverdecoralmountain.com/
Andalusia at Coral Mountain SFD 420 2006 Cypress 4 / 4.5 1 3.0 3,560 $1,390,000 $390 $710 1.25% Incentives: $0TD Desert Development 15,000 185 0.1 Larkspur 4 / 4.5 1 3.0 3,612 $1,395,000 $386 Phase 1- 420 unitsLa Quinta Coralstone 4 / 4.5 1 3.0 4,331 $1,655,000 $382 Phase 2- 380 unitsMadison St & 58th Ave Greystone 4 / 4.5 1 3.0 4,184 $1,675,000 $400(760) 777-1000 Santa Rosa 4 / 4.5 1 3.0 5,131 $1,930,000 $376http://www.andalusiaatcoralmountain.com/c
Belmont Griffin Ranch SFD 152 Mar-14 Residence 1X 3 / 3.5 1 2.0 2,913 $930,000 $319 $653 1.25% Incentives: $5,000Lennar 12,000 17 0.7 Residence 1 Model 3 / 3.5 1 2.0 2,967 $803,483 $271 Upon Buildout HOA: $440La Quinta Residence 2 3 / 3.5 1 2.0 3,153 $843,000 $26754-835 Damascus Drive Residence 3 Model 4 / 4.5 1 2.0 3,475 $930,000 $268(760) 501-2960 Residence 4 Model 4 / 4.5 1 2.0 3,771 $1,027,202 $272http://www.lennar.com/new-homes/californi
Pimlico Griffin Ranch SFD 152 Mar-14 Residence 1 Model 4 / 4.5 1 3.0 4,036 $978,200 $242 $653 1.25% Incentives: $5,000Lennar 18,000 10 0.4 Residence 2 3 / 3.5 1 2.0 4,525 $1,097,543 $243 Upon Buildout HOA: $440La Quinta Residence 4 Model 4 / 4.5 1 3.0 4,820 $1,120,600 $23254-835 Damascus Drive Residence 3 4 / 4.5 1 3.0 4,882 $1,065,304 $218(760) 501-2960http://www.lennar.com/new-homes/californi
Santerra SFD 28 1 2 / 2.5 1 2.0 2,431 $499,990 $206 $177 1.25% Incentives: $0Legacy Homes --- 21 0.0 2 3 / 2.5 1 2.0 2,471 $499,900 $202 Phase 2La Quinta 3 3 / 3.5 1 3.0 2,624 $514,990 $19657-925 Barristo Circle 4 3 / 3.5 1 3.0 3,117 $584,990 $188(760) 771-5100http://www.legacyhomesusa.com/our-comm
Villas - Signature at PGA West TH 106 Mar-15 Residence 1 2 / 2.0 1 / 2.0 1,446 $421,000 $291 $530 1.25% Incentives: $5,000California West --- 3 0.3 Residence 2 3 / 3.0 2 / 2.0 1,987 $460,000 $232 Membership $5,000La Quinta Residence 3 3 / 3.5 2 / 2.0 2,038 $470,000 $231 Upgrades $20,00056-151 Platinum Way Residence 4 3 / 3.5 2 / 2.0 2,295 $488,000 $213(760) 296-3473http://www.signatureatpgawest.com/contact/
15259.00 RecComps: Comps-N Page 2 of 3 The Concord GroupPage 317 of 332

APPENDIX A
RESIDENTIAL SURVEY - NEW HOMESEASTERN COACHELLA VALLEY
FEBRUARY 2016
Project Name/ Prod./ Units Sales FloorplanBuilder/ Lot Plan'd/ Start/ Bed/ Elev./ Home Base Price TaxLocation Size Sold Rate Name Bath Garage Size $ $/sf HOA Rate NotesEstates - Signature at PGA West SFD 68 Mar-15 Residence 1 2 / 3.5 1 / 2.0 2,528 $776,000 $307 $380 1.25% Incentives: $5,000California West 7,900 3 0.3 Residence 2 3 / 3.5 1 / 2.0 2,760 $792,000 --- Membership $5,000La Quinta Residence 3 3 / 3.5 2 / 2.0 2,921 $816,000 $279 Upgrades $40,00056-151 Platinum Way Residence 4 3 / 3.5 2 / 2.0 3,479 $840,000 $241(760) 296-3473http://www.signatureatpgawest.com/contact/
Haciendas - Signature at PGA West SFD 56 Mar-15 Residence 1 2 / 2.5 1 / 2.0 1,941 $634,000 $327 $380 1.25% Incentives: $5,000California West 7,900 3 0.3 Residence 2 2 / 2.5 1 / 2.0 2,042 $610,000 $299 Membership $5,000La Quinta Residence 3 3 / 3.5 2 / 2.0 2,423 $657,000 $271 Upgrades $30,00056-151 Platinum Way Residence 4 3 / 3.5 2 / 2.0 2,429 $685,000 $282(760) 296-3473http://www.signatureatpgawest.com/contact/
Monterra SFD 39 Feb-16 Residence 1 3 / 4.5 1 2.0 3,180 $792,000 $249 $391 1.25% Incentives: $0Woodbridge Pacific Group 12,000 0 0.0 Residence 2 3 / 4.5 1 2.0 3,220 $799,000 $248 Start Selling Feb 20, 2016La Quinta Residence 3 3 / 4.5 1 2.0 3,370 $825,000 $24556150 PGA Boulevard Residence 4 3 / 4.5 1 2.0 3,642 $985,000 $270(760) 771-2100http://woodbridgepacific.com/neighborhood
15259.00 RecComps: Comps-N Page 3 of 3 The Concord GroupPage 318 of 332

APPENDIX B
RESIDENTIAL PLANNED AND PROPOSED NEW HOMESCOACHELLA VALLEY
FEBRUARY 2016
*** Projects over 100 units ***
% Est.Community Builder Location VDL Future Total Status Likely Units
zBermuda Dunes
*** No Planned Developments in Bermuda Dunes ***
Cathedral CityRio Vista Village Ashbrook Communities/Burnett Deve N. of Verona End of Landau 0 554 554 Approved - MPC 70% 388Rio Vista Village / 32614-TT World Development, Inc N/O Verona Rd W/O Guadalupe Rd Rio Vista Village 0 408 408 Approved - MPC 70% 286Lantana Cimarron (TH) --- E/O Da Vall Rd. & N/O Ramon Rd. 0 206 202 Approved - MPC 70% 144Campanile --- Hwy.111 @ Bankside 0 159 285 Approved - MPC 70% 11132463-TT --- SWC Landau Blvd & Quijo Rd 0 158 206 Approved - TT 70% 11131696-TT --- 30th Ave W/O Landau Rd south side 0 154 159 Approved - TT 70% 10835759-TT Condo --- 405 Ramon Rd @ Milano 0 142 158 Approved - TT 70% 9932464-TT --- E/O Da Vall Rd. & N/O Ramon Rd. 0 127 127 Approved - TT 70% 8933668-TT --- S/O East Palm Canyon Dr W/O Cathedral Cyn Flood 0 102 102 Approved - TT 70% 71
Total Under Construction - Tract: 0 0 0Total Under Construction - MPC: 0 0 0
Total Approved - Tract: 0 683 752Total Approved - MPC 0 1,327 1,449
Total Pending: 0 0 0
Total Planned Units: 0 2,010 2,201 1,407
15259.00 Pipeline PWR: P&P CVPage 1 of 7 THE CONCORD GROUP
Page 319 of 332

APPENDIX B
RESIDENTIAL PLANNED AND PROPOSED NEW HOMESCOACHELLA VALLEY
FEBRUARY 2016
*** Projects over 100 units ***
% Est.Community Builder Location VDL Future Total Status Likely Units
z
CoachellaSP La Entrada / McNaughton --- Between Storm Channel & Buchanan 0 8,000 8,000 Approved - MPC 70% 5,600Valencia --- N of Ave 51/ W of Filmore/ E of Polk 0 129 129 Approved - MPC 70% 90Villa Palmeras --- N of Ave 51/ W of Filmore/ E of Polk 0 129 129 Approved - MPC 70% 90Vista Escondida --- S/S Ave 50 Btwn Jackson & Calhoun Streets 0 111 111 Approved - MPC 70% 7833875-TT Desert Highlands SEC of Ave 54 & Fillmore 0 807 807 Approved - TT 70% 565Travata --- On Frederick, S/O Ave. 52 0 170 170 Approved - MPC 70% 11935005-TT --- 54th Ave/ W of Tyler/ E of Harrison 0 210 258 Approved - TT 70% 147Serenata - CV --- SEC Jackson/ Ave 49 0 171 171 Approved - MPC 70% 12034174-TT Coachella Valley Housing Coalition SEC of Ave 53 & Frederick St. 96 0 168 Approved - TT 70% 032417-TT --- SWC Ave 50 & 86 Expressway 0 477 477 Approved - TT 70% 334Vineyard / Villas --- SEC Ave 50 & Polk St 0 1,086 1,086 Approved - MPC 70% 760Shadow View TR Partners, LLC. SE Dillon Rd./ btwn 10 fwy & 86 Expwy 0 1,600 1,600 Approved - MPC 70% 1,12034293-TT Centennial Homes, Inc. Ave. 52, E/O Van Buren St. & W/O Navarra Homes 0 152 152 Approved - MPC 70% 106Rancho Coachella --- S/O Ave.44 E/O Dillon 0 140 140 Approved - MPC 70% 98Sundate --- N of Vista Del Norte / E of Dillon 0 123 123 Approved - MPC 70% 86Bellissima Centennial Homes, Inc. S/O Ave 52 N/O Ave 54 E/O Van Buren 0 469 469 U/C - MPC 80% 375Barcelona --- N/O Ave. 54 & W/O Van Buren St. 0 235 235 Approved - MPC 70% 16534174-1 TT Centennial Homes, Inc. SWC Frederick St. & Ave 52 0 160 160 Approved - TT 70% 11234174-2 TT Dillon Vineyard Estates NEC of Vista Del Norte & Tyler St. 6 211 306 Approved - MPC 70% 148La Obra --- Ave. 50 & Frederick St. 0 20 112 Approved - MPC 70% 14Nickel Creek Centennial Homes, Inc. On Frederick, S/O Ave. 52 0 137 137 Approved - MPC 70% 9634556-TT --- Northside of Ave. 51 between Van Buren & Chaiapas 0 107 107 Approved - TT 70% 7534166-TT --- Ave 44 W of Dillon 0 322 322 Approved - MPC 70% 225Rancho Las Flores --- N/O Ave. 56, E/O Van Buren St. & W/O Harrison St. 0 301 301 Approved - MPC 70% 21134512-TT Beazer Homes W/O Jackson on 50th (S/S) 0 138 138 Approved - TT 70% 97Prado --- N Of Ave 49 On Jasmin St 0 124 282 Approved - MPC 70% 87Los Suenos --- NEC of Van Buren St. & Ave. 50 0 167 167 Approved - MPC 70% 11734434-1 --- SEC Ave 50/Calhoun 0 155 155 Approved - TT 70% 10931508-TT --- SWC of Tyler & Ave 53 0 349 349 Approved - TT 70% 244La Colonia II --- SEC of Calhoun & Ave 49 0 143 143 Approved - MPC 70% 100Rancho Mariposa --- S/O Ave. 50 btw. Van Buren St. & Frederick St. 0 61 123 Approved - MPC 70% 43
Total Under Construction - Tract: 0 0 0Total Under Construction - MPC: 0 469 469
Total Approved - Tract: 96 2,403 2,619Total Approved - MPC 6 13,532 13,939
Total Pending: 0 0 0
Total Planned Units: 102 16,404 17,027 11,530
15259.00 Pipeline PWR: P&P CVPage 2 of 7 THE CONCORD GROUP
Page 320 of 332

APPENDIX B
RESIDENTIAL PLANNED AND PROPOSED NEW HOMESCOACHELLA VALLEY
FEBRUARY 2016
*** Projects over 100 units ***
% Est.Community Builder Location VDL Future Total Status Likely Units
z
Desert Hot SpringsSP Vista Del Monte --- NWC West Dr & Ave Jalisco Dr 0 234 234 Approved - MPC 70% 164Summit - CV --- NEC Mesa Ave & Little Morongo Rd 20 317 477 Approved - MPC 70% 222Indian Highlands --- N/O Dillon Rd E/O Avenida Manzana 0 148 148 Approved - MPC 70% 104SP Skyborne --- SWC Indian & Mission Lakes to Little Morongo Rd. 0 488 488 U/C - MPC 80% 390Indigo Lakes Pulte Home Corp. N Ave.20/ E Palm/ W Bubbling Wells Rd. 0 2,250 2,250 Approved - MPC 70% 1,575Eagle Pointe --- N/S Pierson Blvd E/O Foxdale Dr 0 2,200 2,200 Approved - MPC 70% 1,54034773-TT --- E/S Palm Dr At Camino Aventura Rd 0 115 115 Approved - TT 70% 8134277-TT --- SW Of Indian Ave, N Of Mission Lakes Blvd 0 112 112 Approved - TT 70% 78Paradise Springs --- E Of Little Morongo Rd, N Of Mission Lakes Blvd 0 395 395 U/C - MPC 80% 31634934-TT --- Pierson Rd & Hwy 62 0 2,148 2,148 Approved - TT 70% 1,504SP Desert Dunes --- NWC of Indian Ave & Pierson Blvd 0 310 310 Approved - MPC 70% 217SP Tuscan Hills Skyborne Ventures Pearson just before Hwy. 62 179 1,616 1,830 Approved - MPC 70% 1,13133174-TT --- IndianCanyon Dr. & Hwy. 62 0 1,268 1,268 Approved - TT 70% 88834306-TT --- Karen St N/O Pierson Blvd 0 499 499 Approved - TT 70% 349SP Highland Falls --- N Mission Lakes & Indian Ave E of Mission Lakes CC 0 230 230 Approved - MPC 70% 161SP Palmwood Colony Capital LLC NWC Golden Eagle & Pearson 0 151 220 Approved - MPC 70% 106Desert Ridge - CV --- NWC Indian Ave. & Mission Lakes Blvd. 0 296 296 Approved - MPC 70% 207
Total Under Construction - Tract: 0 0 0Total Under Construction - MPC: 0 883 883
Total Approved - Tract: 0 4,142 4,142Total Approved - MPC 199 7,752 8,195
Total Pending: 0 0 0
Total Planned Units: 199 12,777 13,220 9,032
Indian Wells*** No Planned Developments in Indian Wells ***
15259.00 Pipeline PWR: P&P CVPage 3 of 7 THE CONCORD GROUP
Page 321 of 332

APPENDIX B
RESIDENTIAL PLANNED AND PROPOSED NEW HOMESCOACHELLA VALLEY
FEBRUARY 2016
*** Projects over 100 units ***
% Est.Community Builder Location VDL Future Total Status Likely Units
z
IndioSP Citrus Ranch --- W Dillon & Ave 38 0 3,200 3,200 Approved - MPC 70% 2,240Haciendas --- Monroe St. N/O Ave 42 0 490 490 Approved - MPC 70% 34332869-TT --- N Vista Norte/ S Ave 45/ W Harrison 0 127 127 Approved - TT 70% 89Polo Club / Trilogy RSI N. on Golf Ctr. Pkwy. L on Hacienda Wy 0 137 284 U/C - MPC 80% 110SP Brandenburg Butters Beazer Homes NEC Jefferson & Ave 40 0 238 238 Approved - MPC 70% 167SP Fiesta De Vida Shea Homes 51088 Sorrel CtIndio,CA 92201 N/O 52 W/O Jackson 107 561 817 Approved - MPC 70% 393Avante - CV --- S/O Indio Blvd W/O Burr St 0 486 486 Approved - MPC 70% 34031974-TT --- Ave 44 / Harrison St 0 126 126 Approved - TT 70% 88Shadow Hills / Shadow Lakes - A--- Ave 42/ Madison/ Monroe 0 132 132 Approved - MPC 70% 92Terra Lago / Lido Global Investment & Development NEC of Adams & Ave. 40 0 427 480 Approved - MPC 70% 29930463-TT - CV Brookfield Residential SEC Ave 50 & Polk St. 0 1,381 1,381 Approved - TT 70% 96734297-TT --- N of I-10E Of Harrison 0 388 388 Approved - TT 70% 27232910 Touchstone Communities Varner to Adams/N to End of Adams 0 1,200 1,200 Approved - TT 70% 84034191-TT --- Ave 44 & Dillon 0 296 296 Approved - TT 70% 20734192-TT --- NWC Ave. 49 & Monroe 0 420 420 Approved - TT 70% 294Espana Rilington Communities NWC of Burr St. and Varner Rd. 0 161 161 Approved - MPC 70% 113Victoria Palms Condo --- W side Golf Center Pkwy N/O Ave 43 0 147 147 Approved - MPC 70% 103SP Eagle Falls Inland Communities Jackson @ northern most end 0 140 140 Approved - MPC 70% 98Monte Vina --- Golf Center Pkwy. & Ave. 42 0 113 133 Approved - MPC 70% 7933932-TT Condo S & D Indian Palms California, LTD. SEC Monroe Street & Avenue 48 0 120 120 Approved - TT 70% 8433089-TT Condo Cameo Homes Fred Waring & Hoover Ave 0 100 100 Approved - MPC 70% 70
Total Under Construction - Tract: 0 0 0Total Under Construction - MPC: 0 137 284
Total Approved - Tract: 0 4,058 4,058Total Approved - MPC 107 6,195 6,524
Total Pending: 0 0 0
Total Planned Units: 107 10,390 10,866 7,287
La Quinta32398-TT Village Properties NWC of Monroe & 58th 0 115 130 Approved - TT 70% 81Capistrano - CV Rilington Communities SWC Ave 52 & Clinton St. 0 208 208 Approved - MPC 70% 146SP Coral Mountain Drummond R.E. 58th & Monroe St. 0 758 758 Approved - MPC 70% 531Hideaway --- NEC Ave. 60 and Monroe 0 394 394 U/C - MPC 80% 315La Quinta / Palizada East of Madison, LLC. Jefferson/ S of 52 /Left to Entrance 24 300 506 Approved - MPC 70% 21033444-TT KB Home South Monroe/SEC of Ave 60 0 322 322 Approved - TT 70% 22533240-TT --- S. of the Quarry, near bisection by Jefferson. 0 218 218 Approved - TT 70% 15331434-TT --- 60-995 Monroe St. S. of Ave. 60 0 118 118 Approved - TT 70% 83
Total Under Construction - Tract: 0 0 0Total Under Construction - MPC: 0 394 394
Total Approved - Tract: 0 773 788Total Approved - MPC 24 1,266 1,472
Total Pending: 0 0 0
Total Planned Units: 24 2,433 2,654 1,743
15259.00 Pipeline PWR: P&P CVPage 4 of 7 THE CONCORD GROUP
Page 322 of 332

APPENDIX B
RESIDENTIAL PLANNED AND PROPOSED NEW HOMESCOACHELLA VALLEY
FEBRUARY 2016
*** Projects over 100 units ***
% Est.Community Builder Location VDL Future Total Status Likely Units
z
Mecca*** No Planned Developments in Mecca ***
Palm Desert34651-TT --- W/O Washington St on Varner Rd along I-10 & Ave 38 0 1,764 1,764 Approved - TT 70% 1,23535271-TT / 35272-TT Condo --- Gerald Ford Dr. & Frank Sinatra Dr. 0 591 591 Approved - TT 70% 414Desert Wells Global Investment & Development SS Of 35th Btwn Gateway & Misty Falls 0 221 241 Approved - MPC 70% 155SP Mirasera 338 --- N/O I-10 S/O 38Th St W/O Washington St 0 416 416 Approved - MPC 70% 291Spanish Walk / 33837 --- 73-750 Country Club Dr 0 331 331 Approved - MPC 70% 232Falling Waters Condo Encore Homes N/O Ave 40/S/O Morongate Rd/E Washington St. 0 216 216 Approved - MPC 70% 151Domani RJT Homes E/O Portola & S/O Frank Sinatra 0 159 159 Approved - MPC 70% 111Palm Desert / Catavina --- E/O Gerald Ford Dr E/On Fut Pacific Ave 0 141 141 Approved - MPC 70% 9934057-TT --- 74-255 Gerald Ford Drive 0 440 440 Approved - TT 70% 308University Park --- S. of Gerald Ford between Cook and Portola 0 270 270 Approved - MPC 70% 189Harvard Square (DU) --- Gerald Ford and Cook Street 0 129 129 Approved - MPC 70% 90Desert Willow / Retreat Condos --- Frank Sinatra Dr and Portola Ave 0 112 112 Approved - MPC 70% 78
Total Under Construction - Tract: 0 0 0Total Under Construction - MPC: 0 0 0
Total Approved - Tract: 0 2,795 2,795Total Approved - MPC 0 1,995 2,015
Total Pending: 0 0 0
Total Planned Units: 0 4,790 4,810 3,353
Palm Springs35623-TT Condo Rilington Group SEC Gene Autry Trail & Vista Chino 52 135 187 Approved - TT 70% 95Pedregal / 132 Condo --- 450-490 S Palm Canyon Dr. (NEC w/ Ramon) 0 125 125 Approved - MPC 70% 8834190-TT Condo --- SW/S Hwy 111 NW/O Tramway Rd 0 459 459 Approved - TT 70% 321Cove --- C/O Matthew Dr & E Palm Canyon Dr 0 184 184 U/C - MPC 80% 147Jul Palm Springs --- Camino Canpesino 0 114 114 Approved - MPC 70% 80Avalon - CV --- 414 N Palm Canyon Drive 0 132 132 Approved - MPC 70% 92Escena Palm Springs / Umbria --- SWC N Palm Canyon Drive & Tramway Road 0 132 132 U/C - MPC 80% 10633514-TT Condo --- 2500 Whitewater Club Dr 0 441 441 Approved - TT 70% 309SP Tuscany Falls RY Properties INC W Of 111 Off Of Range View Dr 84 268 390 Approved - MPC 70% 18831744-TT Condo --- W/O S Palm Canyon Dr, N & S Of Ext Bogart Trail 0 230 230 Approved - TT 70% 161Serena Park Family Development SEC Tahquitz and Farrell 0 126 126 Approved - MPC 70% 88Eagle Canyon --- N/O Avenida Caballeros & San Rafael Dr. 0 1,236 1,236 Approved - MPC 70% 865Desert Palisades --- Tramway Rd where the road curves to the left 0 110 110 Approved - MPC 70% 77Rimrock Village --- Hwy 111 / Golf Club Dr / Palm Hills Dr 0 105 105 Approved - MPC 70% 74Cameron (TH) Davidson Communities NEC S.Palm Canyon And Mesquite 0 102 102 Approved - MPC 70% 71
Total Under Construction - Tract: 0 0 0Total Under Construction - MPC: 0 316 316
Total Approved - Tract: 52 1,265 1,317Total Approved - MPC 84 2,318 2,440
Total Pending: 0 0 0
Total Planned Units: 136 3,899 4,073 2,761
15259.00 Pipeline PWR: P&P CVPage 5 of 7 THE CONCORD GROUP
Page 323 of 332

APPENDIX B
RESIDENTIAL PLANNED AND PROPOSED NEW HOMESCOACHELLA VALLEY
FEBRUARY 2016
*** Projects over 100 units ***
% Est.Community Builder Location VDL Future Total Status Likely Units
z
Rancho MirageDolce Global Investment & Development NEC Gateway Dr & Gerald Ford 0 132 159 Approved - MPC 70% 92
Total Under Construction - Tract: 0 0 0Total Under Construction - MPC: 0 0 0
Total Approved - Tract: 0 0 0Total Approved - MPC 0 132 159
Total Pending: 0 0 0
Total Planned Units: 0 132 159 92
Thousand Palms30596-TT Regency Homes S of Ramon Rd./ E of Desert moon Dr. 0 466 466 Approved - TT 70% 32629150-TT --- N/O Varner Rd S/O Boca Chica Trai l E/O Bell Rd 0 257 257 Approved - TT 70% 18030200-TT Crosspointe Development N Ramon/ E to Desert Moon 0 214 214 Approved - TT 70% 15030199-TT --- El Centro Way & Roberts Rd 0 148 205 Approved - TT 70% 104Ridge View --- Ramon Rd. E/O Desert Moon 0 139 139 Approved - MPC 70% 97
Total Under Construction - Tract: 0 0 0Total Under Construction - MPC: 0 0 0
Total Approved - Tract: 0 1,085 1,142Total Approved - MPC 0 139 139
Total Pending: 0 0 0
Total Planned Units: 0 1,224 1,281 857
ThermalTravertine Pointe --- Hwy 86 & Ave 84 0 16,655 16,655 Approved - MPC 70% 11,659Kohl Ranch --- N/O 66th Ave E/O Harrison St W/O Polk St S/O 60th Av 0 7,171 7,171 Approved - MPC 70% 5,020Panorama --- N/O 60th Ave E/O Hwy 86 W/O Lincoln S/O Ave 60 0 2,560 2,560 Approved - MPC 70% 1,792Thermal 551 --- N/O 60th Ave E/O Polk St W/O Filmore 0 2,354 2,354 Approved - MPC 70% 1,648SP 355 --- N/O 64Th Ave E/O Hwy 86 & Harrison St W/O Tyler St 0 2,525 2,525 Approved - MPC 70% 1,768SP Oasis 349 / Vineyards --- N/O 68Th S/O 66Th Ave E/O Pierce St 0 1,363 1,363 Approved - MPC 70% 954SP 350 --- N/O 62Nd Ave S/O 60Th Ave E/O Pierce W/O Buchanan 0 1,177 1,177 Approved - MPC 70% 824Rancho Santa Rosa --- W/Van Buren St S/Ave 62 E/Calhoun St N/Ave 63 0 775 775 Approved - MPC 70% 54333982-TT --- NEC Monroe and Ave. 62 0 474 474 NApproved - TT 70% 33234087-TT --- NWC of Ave 55 & Pierce 0 272 272 Approved - TT 70% 19033045-TT --- S/O Ave. 54, E/O Calhoun St., W/O Van Buren 0 270 270 Approved - TT 70% 18933558-TT --- N/O Ave. 59, E/O Harry Rau Rd. & W/O Jackson St. 0 231 231 Approved - TT 70% 16234360-TT --- Between Ave. 60 and Ave. 61, E. of Monroe 0 209 209 Approved - TT 70% 14632861-TT --- N/O Airport Rd. W/O Jackson St. E/O Monroe St. 0 158 158 Approved - TT 70% 11133559-TT --- N/O Ave. 54, E/O Monroe St. & W/O Jackson St. 0 123 123 Approved - TT 70% 86
Total Under Construction - Tract: 0 0 0Total Under Construction - MPC: 0 0 0
Total Approved - Tract: 0 1,737 1,737Total Approved - MPC 0 34,580 34,580
Total Pending: 0 0 0
Total Planned Units: 0 36,317 36,317 25,422
15259.00 Pipeline PWR: P&P CVPage 6 of 7 THE CONCORD GROUP
Page 324 of 332

APPENDIX B
RESIDENTIAL PLANNED AND PROPOSED NEW HOMESCOACHELLA VALLEY
FEBRUARY 2016
*** Projects over 100 units ***
% Est.Community Builder Location VDL Future Total Status Likely Units
z
Unincorporated Coachella Valley35009-TT --- E/S Hwy 62, N/O Pierson Blvd 0 923 923 Approved - TT 70% 64634588-TT Colfax Villas LP Mission Creek Rd. W SR 62 0 107 107 Approved - TT 70% 75
Total Under Construction - Tract: 0 0 0Total Under Construction - MPC: 0 0 0
Total Approved - Tract: 0 1,030 1,030Total Approved - MPC 0 0 0
Total Pending: 0 0 0
Total Planned Units: 0 1,030 1,030 721
Coachella Valley Planned Units: 568 91,406 93,638 64,2049 Cities Planned Units: 568 52,835 55,010 37,204
Coachella, Indio, Mecca, Thermal Planned Units: 209 63,111 64,210 44,238
15259.00 Pipeline PWR: P&P CVPage 7 of 7 THE CONCORD GROUP
Page 325 of 332

APPENDIX C
ANALOG SURVEY - NEW FOR SALEANALOG MARKETS
FEBRUARY 2016
Project Name/ Prod./ Units Sales FloorplanBuilder/ Lot Plan'd/ Start/ Bed/ Elev./ Home Base Price TaxLocation Size Sold Rate Name Bath Garage Size $ $/sf HOA Rate Notes
Big Bear LakeRidgeview SFD 58 Nov-13 Residence 1 2 / 2.0 1 / 2.0 1,570 $339,000 $216 $0 1.30% Incentives: $5,000Legacy Homes 10,000 34 1.2 Residence 2 3 / 2.5 2 / 3.0 1,832 $348,000 $190Big Bear Residence 3 3 / 3.0 2 / 2.0 2,122 $393,000 $185287 Maple Ridge Road Residence 4 3 / 2.5 2 / 3.0 1,832 $406,000 $222(909) 878-5522http://www.legacyhomesusa.com/our-comm
Lake SilverwoodSilverleaf at Rosena Ranch SFD 68 Dec-14 1 4 / 2.0 1 / 2.0 2,467 $408,734 $166 $117 2.2% Incentives: e in-house lenderD.R. Horton 7,200 50 3.5 2 5 / 3.0 1 / 2.0 2,812 $428,890 $153San Bernardino 3 5 / 3.0 2 / 3.0 3,114 $428,390 $13818067 Tanzanite Road 4 4 / 3.0 2 / 2.0 3,529 $457,675 $130(909) 441-7084 5 5 / 3.5 2 / 3.0 3,794 $472,240 $124http://www.drhorton.com/California/Inland‐Em
Aster at Rosena Ranch SFD 1 3 / 2.0 1 / 2.0 1,920 $375,490 $196 Incentives: $0Lennar 0.0 3 4 / 3.0 2 / 2.0 2,389 $391,190 $164San Bernardino 4 4 / 3.5 2 / 3.0 2,649 $410,053 $1554095 Grand Fir Lane(909) 350-0197http://www.lennar.com/new-homes/californi
Sage at Rosena Ranch SFD 2 3 / 2.5 2 2.0 1,597 $355,940 $223 Incentives:Lennar 0.0 3 3 / 2.5 1 2.0 1,821 $371,240 $204San Bernardino 4 4 / 3.0 2 2.0 2,277 $391,990 $1724095 Grand Fir Lane(909) 350-0197http://www.lennar.com/new‐homes/california/
Sycamore at Rosena Ranch SFD 1 5 / 3.0 2 2.0 3,187 $435,290 $137 Incentives:Lennar 0.0 2 5 / 3.0 2 2.0 3,489 $461,490 $132San Bernardino 4199 6 / 4.0 3 2.0 4,199 $527,290 $1264095 Grand Fir Lane(909) 350-0197http://www.lennar.com/new-homes/californi
Chaparral at Rosena Ranch SFD 1 3 / 2.0 1 2.0 2,129 $401,840 $189 Incentives:Lennar 0.0 2 4 / 3.0 2 2.0 2,690 $412,440 $153San Bernardino 3 4 / 3.0 2 3.0 2,899 $421,190 $1454095 Grand Fir Lane 2994 5 / 4.0 2 3.0 2,994 $454,450 $152(909) 350-0197 3152 5 / 4.0 2 3.0 3,152 $421,190 $134http://www.lennar.com/new-homes/californi
Cypress at Rosena Ranch SFD 97 Jun-14 1 5 / 3.0 2 2.0 2,637 $402,900 $153 $97 1.3% Incentives: $5,000Cal Atlantic Homes 6,700 57 2.8 2 5 / 3.0 2 2.0 2,703 $413,830 $153San Bernardino 3 5 / 3.0 2 3.0 2,903 $447,620 $1543975 Black Cottonwood Way(909) 357-1268http://www.calatlantichomes.com/find‐your‐ne
15259.00 Analog Comps: Comps-Analog Page 1 of 2 The Concord GroupPage 326 of 332

APPENDIX C
ANALOG SURVEY - NEW FOR SALEANALOG MARKETS
FEBRUARY 2016
Project Name/ Prod./ Units Sales FloorplanBuilder/ Lot Plan'd/ Start/ Bed/ Elev./ Home Base Price TaxLocation Size Sold Rate Name Bath Garage Size $ $/sf HOA Rate Notes
Lake PerrisAvelina SFD 300 Oct-14 Gateway 3 / 2.0 1 2.0 1,959 $283,990 $145 $43 2.00% Incentives: $0Pulte Homes 7,200 90 5.5 Pathmaker 4 / 2.5 2 2.0 2,392 $303,990 $127Perris Bridgeview 4 / 2.5 2 2.5 2,688 $319,990 $1191181 Viscano Court Visionary 5 / 3.0 2 2.0 2,810 $325,990 $116(866) 741-7170 Prodigy 5 / 4.0 2 3.0 3,296 $350,990 $106http://www.pulte.com/communities/CA/perr
Steeplechase SFD Timothy 3 / 2.0 1 2.0 2,320 $308,990 $133 Incentives: $0Richmond American Homes 0.0 Paige 3 / 2.5 1 2.0 2,491 $326,990 $131Perris Trent 3 / 2.5 2 3.0 2,827 $331,990 $1174665 Formosa Way Thomas 4 / 2.5 2 2.0 3,059 $341,990 $112(951) 226-0807 Tracy 5 / 3.0 2 3.0 3,464 $360,990 $104http://www.richmondamerican.com/Californ
Lake ElsinoreMonarch Grove at Summerly SFD 64 1 3 / 2.5 2 3.0 2,589 $381,950 $148 $117 1.80% Incentives:Cal Atlantic Homes 0.0 2 4 / 3.5 2 3.0 2,854 $390,410 $137Lake Elsinore 3 4 / 3.0 2 3.0 3,184 $388,165 $12229278 First Green(951) 245-6837http://www.calatlantichomes.com/find‐your‐ne
Sunrise Springs SFD 152 Mar-14 1 3 / 2.0 1 2.0 1,520 $299,350 $197 Incentives:Cal Atlantic Homes 12,000 17 0.7 2 3 / 2.0 1 2.0 1,765 $311,840 $177 Upon Buildout HOA: $440Lake Elsinore 3 3 / 2.0 2 2.0 1,870 $326,445 $17529475 Village Parkway(951) 674-1524http://www.calatlantichomes.com/find-your-
Daybreak at Summerly SFD 152 Mar-14 Dawn 3 / 2.5 1 3.0 2,482 $339,900 $137 Incentives:McMillin Communities 18,000 10 0.4 Coral 4 / 3.5 1 2.0 2,792 $360,990 $129 Upon Buildout HOA: $440Lake Elsinore Amber 4 / 3.0 2 3.0 2,877 $362,990 $12629303 Fenway Park Topaz 4 / 3.0 2 3.0 2,874 $342,990 $119(951) 226-3480http://www.mcmillinhomes.com/lake-elsinor
St. Andrews at Summerly SFD 78 Nov-14 1 3 / 2.0 1 2.0 1,832 $314,990 $172 $118 1.90% Incentives: 0 in closing costsWoodside Homes 5,000 45 2.9 2 4 / 2.5 2 2.0 2,043 $324,990 $159 \Lake Elsinore 3 4 / 3.0 2 2.0 2,200 $334,990 $15229218 St. Andrews(951) 777-2525http://woodsidehomes.com/community-st-an
Meridian at Summerly TH 106 Mar-15 McQueen 3 / 2.5 1 / 2.0 2,376 $338,990 $143 1.25% Incentives: $5,000Meritage Homes --- 3 0.3 Ortega 4 / 2.5 2 / 2.0 2,480 $326,990 $132 Membership $5,000Lake Elsinore Laguna 4 / 3.0 2 / 2.0 2,481 $342,990 $138 Upgrades $20,00029606 Rawlings Way Santiago 3 / 2.5 2 / 3.0 2,551 $331,990 $130(877) 575-6374http://www.meritagehomes.com/search/south
15259.00 Analog Comps: Comps-Analog Page 2 of 2 The Concord GroupPage 327 of 332

APPENDIX - D
ANALOG SURVEY - RESALESANALOG MARKETS
LAST ONE YEAR ENDING FEBRUARY 2016
Zip Year Home List Price Sale Price Sale vs. Sale Short Active orStreet Address Neighborhood Type Code Built Bed / Bath Size $ $/sf $ $/sf List Date Sale? Sale
Big Bear - Waterfront387 Oriole Dr Big Bear - Waterfront Single Family Residential 92315 2000 3 / 2 1,653 $0 $0 $432,000 $261 --- 1/8/16 1/0/00 Past Sale218 Avon Ct Big Bear - Waterfront Single Family Residential 92315 2015 4 / 4 4,360 $2,250,000 $516 $1,750,000 $401 -22% 2/11/16 FALSE Past Sale174 Round Dr Big Bear - Waterfront Single Family Residential 92315 1947 4 / 3 2,938 $0 $0 $1,800,000 $613 --- 12/9/15 1/0/00 Past Sale370 Gibralter Rd Big Bear - Waterfront Single Family Residential 92315 2015 4 / 5.25 4,856 $2,400,000 $494 $2,200,000 $453 -8% 4/21/15 FALSE Past Sale208 Knoll Rd Big Bear - Waterfront Single Family Residential 92315 2003 4 / 2.75 2,276 $499,000 $219 $479,000 $210 -4% 11/25/15 FALSE Past Sale406 Wren Dr Big Bear - Waterfront Single Family Residential 92315 2005 3 / 2 1,322 $0 $0 $400,000 $303 --- 10/14/15 1/0/00 Past Sale120 Stonebridge Cir Big Bear - Waterfront Single Family Residential 92315 2000 3 / 3.5 2,892 $699,900 $242 $650,000 $225 -7% 8/20/15 FALSE Past Sale118 Marina Point Dr Big Bear - Waterfront Single Family Residential 92315 2000 4 / 3.5 4,053 $899,900 $222 $899,000 $222 0% 8/4/15 FALSE Past Sale39821 Forest Rd Big Bear - Waterfront Single Family Residential 92315 2002 4 3.5 4,178 $0 $515,000 $123 --- 7/30/15 1/0/00 Past Sale230 Eagle Dr Big Bear - Waterfront Single Family Residential 92315 2000 3 / 2.5 2,801 $0 $0 $695,000 $248 --- 7/24/15 1/0/00 Past Sale39692 Lake Dr Big Bear - Waterfront Single Family Residential 92315 2008 3 / 2.5 2,311 $579,900 $251 $570,000 $247 -2% 7/16/15 FALSE Past Sale42445 Eagle Ridge Dr (Unable to mapBig Bear - Waterfront Single Family Residential 92315 2003 3 2.5 2,394 $0 $0 $635,000 $265 --- 7/2/15 1/0/00 Past Sale511 Lakewood Ln Big Bear - Waterfront Single Family Residential 92315 2007 3 / 2.5 2,604 $539,900 $207 $539,000 $207 0% 4/2/15 FALSE Past Sale
Big Bear40932 Seneca Trl Big Bear Single Family Residential 92315 2013 4 / 3 2,463 $599,900 $244 $578,000 $235 -4% 12/8/15 FALSE Past Sale40158 Hillcrest Rd Big Bear Single Family Residential 92315 2008 2 / 1 1,032 $259,900 $252 $235,000 $228 -10% 12/28/15 FALSE Past Sale738 Hammond Rd Big Bear Single Family Residential 92315 2004 4 / 3 1,703 $339,000 $199 $315,000 $185 -7% 9/25/15 FALSE Past Sale873 Cameron Dr Big Bear Single Family Residential 92315 2004 4 / 3.5 2,500 $619,000 $248 $599,900 $240 -3% 9/15/15 FALSE Past Sale40221 Esterly Big Bear Single Family Residential 92315 2014 3 / 2.5 1,316 $295,900 $225 $276,000 $210 -7% 3/3/15 FALSE Past Sale40643 Ironwood Dr Big Bear Single Family Residential 92315 2004 4 / 3.5 3,361 $1,300,000 $387 $1,105,000 $329 -15% 3/3/15 FALSE Past Sale41949 Tamarack Dr Big Bear Single Family Residential 92315 2005 3 / 2 1,502 $0 $0 $479,000 $319 --- 10/9/15 1/0/00 Past Sale40728 Cherry Ln Big Bear Single Family Residential 92315 2003 3 / 2 1,292 $0 $0 $365,000 $283 --- 7/24/15 1/0/00 Past Sale903 Great Spirits Big Bear Single Family Residential 92315 2014 4 3.5 3,450 $879,000 $255 $840,000 $243 -4% 5/15/15 FALSE Past Sale
15259.00 Analog Resales: c-Resales Page 1 of 5 The Concord Group
Page 328 of 332

APPENDIX - D
ANALOG SURVEY - RESALESANALOG MARKETS
LAST ONE YEAR ENDING FEBRUARY 2016
Zip Year Home List Price Sale Price Sale vs. Sale Short Active orStreet Address Neighborhood Type Code Built Bed / Bath Size $ $/sf $ $/sf List Date Sale? Sale
Perris Waterfront813 Amaya Dr Perris - Waterfront Single Family Residential 92571 2007 5 / 2.75 3,477 $0 $0 $320,000 $92 --- 1/13/16 1/0/00 Past Sale4459 Candelaria Way Perris - Waterfront Single Family Residential 92571 2008 3 / 2 2,275 $279,900 $123 $275,000 $121 -2% 11/30/15 FALSE Past Sale4375 Candelaria Way Perris - Waterfront Single Family Residential 92571 2007 / 3 3,108 $330,000 $106 $330,000 $106 0% 9/9/15 FALSE Past Sale4568 Almaterra Dr Perris - Waterfront Single Family Residential 92571 2007 4 / 3 2,424 $304,900 $126 $305,000 $126 0% 4/13/15 FALSE Past Sale852 Amaya Dr Perris - Waterfront Single Family Residential 92571 2007 5 / 3 3,108 $339,500 $109 $325,000 $105 -4% 4/3/15 FALSE Past Sale4345 Almaterra Dr Perris - Waterfront Single Family Residential 92571 2010 5 / 3.5 2,149 $0 $0 $225,000 $105 --- 2/24/15 1/0/00 Past Sale855 Amadova Dr Perris - Waterfront Single Family Residential 92571 2010 5 / 3.5 2,149 $296,000 $138 $296,000 $138 0% 11/18/15 FALSE Past Sale4370 Candelaria Way Perris - Waterfront Single Family Residential 92571 2007 4 / 2.75 2,709 $320,000 $118 $310,000 $114 -3% 11/30/15 FALSE Past Sale4545 Candelaria Way Perris - Waterfront Single Family Residential 92571 2010 4 / 2 1,523 $249,000 $163 $260,000 $171 4% 12/1/15 FALSE Past Sale837 Vianca Ct Perris - Waterfront Single Family Residential 92571 2010 5 / 3 2,345 $299,500 $128 $300,000 $128 0% 9/14/15 FALSE Past Sale847 Navarra Ln Perris - Waterfront Single Family Residential 92571 2007 4 / 2.5 2,709 $330,000 $122 $310,000 $114 -6% 8/28/15 FALSE Past Sale868 Volande Ct Perris - Waterfront Single Family Residential 92571 2007 3 / 2 2,181 $326,000 $149 $300,000 $138 -8% 7/31/15 FALSE Past Sale4357 Almaterra Dr Perris - Waterfront Single Family Residential 92571 2010 3 / 2 1,523 $211,000 $139 $227,000 $149 8% 6/26/15 FALSE Past Sale885 Cantabria Ct Perris - Waterfront Single Family Residential 92571 2007 5 / 2.75 3,477 $0 $0 $225,000 $65 --- 5/29/15 1/0/00 Past Sale874 Corisante Perris - Waterfront Single Family Residential 92571 2015 5 4 2,491 $369,093 $350,881 $141 -5% 5/22/15 FALSE Past Sale868 Corisante Perris - Waterfront Single Family Residential 92571 2015 4 / 3 2,800 $360,868 $129 $345,794 $123 -4% 6/10/15 FALSE Past Sale821 Valleverde Way Perris - Waterfront Single Family Residential 92571 2007 5 / 3 3,320 $349,900 $105 $335,000 $101 -4% 6/19/15 FALSE Past Sale850 Corisante Perris - Waterfront Single Family Residential 92571 2015 3 / 2.5 3,050 $369,203 $121 $360,736 $118 -2% 5/6/15 FALSE Past Sale819 Amadova Dr Perris - Waterfront Single Family Residential 92571 2010 4 / 3 2,084 $271,000 $130 $274,000 $131 1% 4/15/15 FALSE Past Sale
Perris684 Allepo Pine St Perris Single Family Residential 92571 2006 3 / 2 2,256 $275,000 $122 $260,000 $115 -5% 11/19/15 FALSE Past Sale2165 Murrieta Rd Perris Single Family Residential 92571 2004 4 / 3 2,499 $230,000 $92 $230,000 $92 0% 11/25/15 FALSE Past Sale2354 Willowbrook Ln Perris Single Family Residential 92571 2003 6 / 2.75 2,852 $279,900 $98 $290,000 $102 4% 8/14/15 FALSE Past Sale700 Allepo Pine St Perris Single Family Residential 92571 2007 5 / 3 2,615 $225,000 $86 $230,000 $88 2% 5/29/15 TRUE Past Sale2186 Willowbrook Ln Perris Single Family Residential 92571 2004 4 / 2 2,028 $259,900 $128 $260,000 $128 0% 5/15/15 FALSE Past Sale746 Albizia Ct Perris Single Family Residential 92571 2007 5 3 3,115 $200,000 $295,000 $95 48% 3/27/15 FALSE Past Sale
Canyon Lake - Waterfront3 Ponte Verde Canyon Lake - Waterfront Single Family Residential 92532 2001 4 2.5 2,696 $339,900 $325,000 $121 -4% 1/25/16 FALSE Past Sale6 Plaza Valenza Canyon Lake - Waterfront Single Family Residential 92532 2005 4 / 3.5 3,404 $429,990 $126 $420,000 $123 -2% 1/20/16 FALSE Past Sale66 Via De La Valle Canyon Lake - Waterfront Single Family Residential 92532 2005 4 / 3 3,006 $0 $0 $360,000 $120 --- 12/22/15 1/0/00 Past Sale19 Plaza Lucerna Canyon Lake - Waterfront Single Family Residential 92532 2006 4 / 2.5 3,235 $415,000 $128 $400,000 $124 -4% 12/31/15 FALSE Past Sale68 Volta Del Tintori St Canyon Lake - Waterfront Single Family Residential 92532 2005 / 4.5 3,711 $479,000 $129 $449,500 $121 -6% 12/31/15 FALSE Past Sale5 Plaza Valenza Canyon Lake - Waterfront Single Family Residential 92532 2006 / 3 3,006 $488,888 $163 $455,000 $151 -7% 9/25/15 FALSE Past Sale23 Plaza Avila Canyon Lake - Waterfront Single Family Residential 92532 2004 4 / 3.5 3,208 $399,900 $125 $365,000 $114 -9% 3/20/15 FALSE Past Sale32 Plaza Avila Canyon Lake - Waterfront Single Family Residential 92532 2004 5 / 4 3,208 $380,000 $118 $385,000 $120 1% 4/30/15 FALSE Past Sale45 Volta Del Tintori St Canyon Lake - Waterfront Single Family Residential 92532 2005 5 / 4.5 3,880 $495,000 $128 $465,000 $120 -6% 4/30/15 FALSE Past Sale1 Via Niccolo Ct Canyon Lake - Waterfront Single Family Residential 92532 2006 4 3 3,353 $498,000 $485,000 $145 -3% 4/27/15 FALSE Past Sale24 Via De La Valle Canyon Lake - Waterfront Single Family Residential 92532 2004 4 3.25 3,208 $325,000 $325,000 $101 0% 4/17/15 FALSE Past Sale9 Plaza Valenza Canyon Lake - Waterfront Single Family Residential 92532 2006 4 3.5 3,404 $459,000 $135 $430,000 $126 -6% 4/14/15 FALSE Past Sale1 Del Copparo Canyon Lake - Waterfront Single Family Residential 92532 2000 3 2 2,015 $310,000 $154 $295,000 $146 -5% 3/12/15 FALSE Past Sale28 Via De La Valle Canyon Lake - Waterfront Single Family Residential 92532 2004 4 3 2,580 $349,000 $135 $306,000 $119 -12% 2/26/15 FALSE Past Sale
15259.00 Analog Resales: c-Resales Page 2 of 5 The Concord Group
Page 329 of 332
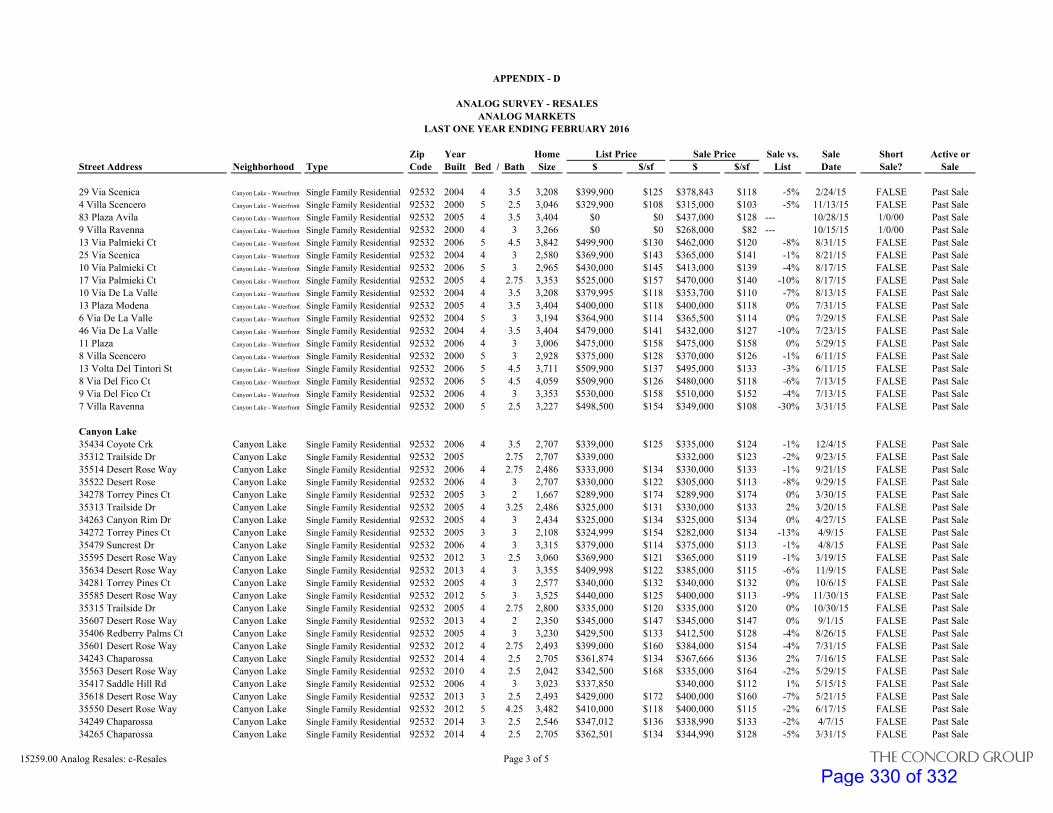
APPENDIX - D
ANALOG SURVEY - RESALESANALOG MARKETS
LAST ONE YEAR ENDING FEBRUARY 2016
Zip Year Home List Price Sale Price Sale vs. Sale Short Active orStreet Address Neighborhood Type Code Built Bed / Bath Size $ $/sf $ $/sf List Date Sale? Sale
29 Via Scenica Canyon Lake - Waterfront Single Family Residential 92532 2004 4 3.5 3,208 $399,900 $125 $378,843 $118 -5% 2/24/15 FALSE Past Sale4 Villa Scencero Canyon Lake - Waterfront Single Family Residential 92532 2000 5 2.5 3,046 $329,900 $108 $315,000 $103 -5% 11/13/15 FALSE Past Sale83 Plaza Avila Canyon Lake - Waterfront Single Family Residential 92532 2005 4 3.5 3,404 $0 $0 $437,000 $128 --- 10/28/15 1/0/00 Past Sale9 Villa Ravenna Canyon Lake - Waterfront Single Family Residential 92532 2000 4 3 3,266 $0 $0 $268,000 $82 --- 10/15/15 1/0/00 Past Sale13 Via Palmieki Ct Canyon Lake - Waterfront Single Family Residential 92532 2006 5 4.5 3,842 $499,900 $130 $462,000 $120 -8% 8/31/15 FALSE Past Sale25 Via Scenica Canyon Lake - Waterfront Single Family Residential 92532 2004 4 3 2,580 $369,900 $143 $365,000 $141 -1% 8/21/15 FALSE Past Sale10 Via Palmieki Ct Canyon Lake - Waterfront Single Family Residential 92532 2006 5 3 2,965 $430,000 $145 $413,000 $139 -4% 8/17/15 FALSE Past Sale17 Via Palmieki Ct Canyon Lake - Waterfront Single Family Residential 92532 2005 4 2.75 3,353 $525,000 $157 $470,000 $140 -10% 8/17/15 FALSE Past Sale10 Via De La Valle Canyon Lake - Waterfront Single Family Residential 92532 2004 4 3.5 3,208 $379,995 $118 $353,700 $110 -7% 8/13/15 FALSE Past Sale13 Plaza Modena Canyon Lake - Waterfront Single Family Residential 92532 2005 4 3.5 3,404 $400,000 $118 $400,000 $118 0% 7/31/15 FALSE Past Sale6 Via De La Valle Canyon Lake - Waterfront Single Family Residential 92532 2004 5 3 3,194 $364,900 $114 $365,500 $114 0% 7/29/15 FALSE Past Sale46 Via De La Valle Canyon Lake - Waterfront Single Family Residential 92532 2004 4 3.5 3,404 $479,000 $141 $432,000 $127 -10% 7/23/15 FALSE Past Sale11 Plaza Canyon Lake - Waterfront Single Family Residential 92532 2006 4 3 3,006 $475,000 $158 $475,000 $158 0% 5/29/15 FALSE Past Sale8 Villa Scencero Canyon Lake - Waterfront Single Family Residential 92532 2000 5 3 2,928 $375,000 $128 $370,000 $126 -1% 6/11/15 FALSE Past Sale13 Volta Del Tintori St Canyon Lake - Waterfront Single Family Residential 92532 2006 5 4.5 3,711 $509,900 $137 $495,000 $133 -3% 6/11/15 FALSE Past Sale8 Via Del Fico Ct Canyon Lake - Waterfront Single Family Residential 92532 2006 5 4.5 4,059 $509,900 $126 $480,000 $118 -6% 7/13/15 FALSE Past Sale9 Via Del Fico Ct Canyon Lake - Waterfront Single Family Residential 92532 2006 4 3 3,353 $530,000 $158 $510,000 $152 -4% 7/13/15 FALSE Past Sale7 Villa Ravenna Canyon Lake - Waterfront Single Family Residential 92532 2000 5 2.5 3,227 $498,500 $154 $349,000 $108 -30% 3/31/15 FALSE Past Sale
Canyon Lake35434 Coyote Crk Canyon Lake Single Family Residential 92532 2006 4 3.5 2,707 $339,000 $125 $335,000 $124 -1% 12/4/15 FALSE Past Sale35312 Trailside Dr Canyon Lake Single Family Residential 92532 2005 2.75 2,707 $339,000 $332,000 $123 -2% 9/23/15 FALSE Past Sale35514 Desert Rose Way Canyon Lake Single Family Residential 92532 2006 4 2.75 2,486 $333,000 $134 $330,000 $133 -1% 9/21/15 FALSE Past Sale35522 Desert Rose Canyon Lake Single Family Residential 92532 2006 4 3 2,707 $330,000 $122 $305,000 $113 -8% 9/29/15 FALSE Past Sale34278 Torrey Pines Ct Canyon Lake Single Family Residential 92532 2005 3 2 1,667 $289,900 $174 $289,900 $174 0% 3/30/15 FALSE Past Sale35313 Trailside Dr Canyon Lake Single Family Residential 92532 2005 4 3.25 2,486 $325,000 $131 $330,000 $133 2% 3/20/15 FALSE Past Sale34263 Canyon Rim Dr Canyon Lake Single Family Residential 92532 2005 4 3 2,434 $325,000 $134 $325,000 $134 0% 4/27/15 FALSE Past Sale34272 Torrey Pines Ct Canyon Lake Single Family Residential 92532 2005 3 3 2,108 $324,999 $154 $282,000 $134 -13% 4/9/15 FALSE Past Sale35479 Suncrest Dr Canyon Lake Single Family Residential 92532 2006 4 3 3,315 $379,000 $114 $375,000 $113 -1% 4/8/15 FALSE Past Sale35595 Desert Rose Way Canyon Lake Single Family Residential 92532 2012 3 2.5 3,060 $369,900 $121 $365,000 $119 -1% 3/19/15 FALSE Past Sale35634 Desert Rose Way Canyon Lake Single Family Residential 92532 2013 4 3 3,355 $409,998 $122 $385,000 $115 -6% 11/9/15 FALSE Past Sale34281 Torrey Pines Ct Canyon Lake Single Family Residential 92532 2005 4 3 2,577 $340,000 $132 $340,000 $132 0% 10/6/15 FALSE Past Sale35585 Desert Rose Way Canyon Lake Single Family Residential 92532 2012 5 3 3,525 $440,000 $125 $400,000 $113 -9% 11/30/15 FALSE Past Sale35315 Trailside Dr Canyon Lake Single Family Residential 92532 2005 4 2.75 2,800 $335,000 $120 $335,000 $120 0% 10/30/15 FALSE Past Sale35607 Desert Rose Way Canyon Lake Single Family Residential 92532 2013 4 2 2,350 $345,000 $147 $345,000 $147 0% 9/1/15 FALSE Past Sale35406 Redberry Palms Ct Canyon Lake Single Family Residential 92532 2005 4 3 3,230 $429,500 $133 $412,500 $128 -4% 8/26/15 FALSE Past Sale35601 Desert Rose Way Canyon Lake Single Family Residential 92532 2012 4 2.75 2,493 $399,000 $160 $384,000 $154 -4% 7/31/15 FALSE Past Sale34243 Chaparossa Canyon Lake Single Family Residential 92532 2014 4 2.5 2,705 $361,874 $134 $367,666 $136 2% 7/16/15 FALSE Past Sale35563 Desert Rose Way Canyon Lake Single Family Residential 92532 2010 4 2.5 2,042 $342,500 $168 $335,000 $164 -2% 5/29/15 FALSE Past Sale35417 Saddle Hill Rd Canyon Lake Single Family Residential 92532 2006 4 3 3,023 $337,850 $340,000 $112 1% 5/15/15 FALSE Past Sale35618 Desert Rose Way Canyon Lake Single Family Residential 92532 2013 3 2.5 2,493 $429,000 $172 $400,000 $160 -7% 5/21/15 FALSE Past Sale35550 Desert Rose Way Canyon Lake Single Family Residential 92532 2012 5 4.25 3,482 $410,000 $118 $400,000 $115 -2% 6/17/15 FALSE Past Sale34249 Chaparossa Canyon Lake Single Family Residential 92532 2014 3 2.5 2,546 $347,012 $136 $338,990 $133 -2% 4/7/15 FALSE Past Sale34265 Chaparossa Canyon Lake Single Family Residential 92532 2014 4 2.5 2,705 $362,501 $134 $344,990 $128 -5% 3/31/15 FALSE Past Sale
15259.00 Analog Resales: c-Resales Page 3 of 5 The Concord Group
Page 330 of 332

APPENDIX - D
ANALOG SURVEY - RESALESANALOG MARKETS
LAST ONE YEAR ENDING FEBRUARY 2016
Zip Year Home List Price Sale Price Sale vs. Sale Short Active orStreet Address Neighborhood Type Code Built Bed / Bath Size $ $/sf $ $/sf List Date Sale? Sale
Lake Elsinore - Waterfront1005 Meadowlake Ln Lake Elsinore - Waterfront Single Family Residential 92530 2004 4 2.5 2,073 $305,000 $147 $312,500 $151 2% 2/10/16 TRUE Past Sale30995 Verona St Lake Elsinore - Waterfront Single Family Residential 92530 2006 4 3 2,517 $289,900 $115 $277,500 $110 -4% 12/30/15 FALSE Past Sale33141 Leeward Way Lake Elsinore - Waterfront Single Family Residential 92530 2003 4 3 2,272 $325,000 $143 $320,000 $141 -2% 12/31/15 FALSE Past Sale16637 North Escavera St Lake Elsinore - Waterfront Single Family Residential 92530 2006 4 3 2,517 $240,000 $95 $217,500 $86 -9% 12/24/15 TRUE Past Sale33012 Seville St Lake Elsinore - Waterfront Single Family Residential 92530 2006 2.5 1,942 $249,900 $129 $247,000 $127 -1% 10/1/15 FALSE Past Sale16524 Badalona St Lake Elsinore - Waterfront Single Family Residential 92530 2007 2 1,520 $217,500 $143 $207,000 $136 -5% 3/27/15 TRUE Past Sale33115 Molly Ct Lake Elsinore - Waterfront Single Family Residential 92530 2003 4 2 1,794 $345,000 $192 $333,000 $186 -3% 4/27/15 FALSE Past Sale16533 Sedona St Lake Elsinore - Waterfront Single Family Residential 92530 2006 3 2.5 2,197 $269,900 $123 $230,000 $105 -15% 4/2/15 FALSE Past Sale16513 Badalona St Lake Elsinore - Waterfront Single Family Residential 92530 2006 3 2.5 2,197 $264,900 $121 $258,000 $117 -3% 3/16/15 FALSE Past Sale33430 Macy St Lake Elsinore - Waterfront Single Family Residential 92530 2000 3 3 2,287 $309,900 $136 $299,900 $131 -3% 3/4/15 FALSE Past Sale16635 Alviso Ct Lake Elsinore - Waterfront Single Family Residential 92530 2006 3 2 1,520 $232,750 $153 $234,000 $154 1% 11/10/15 FALSE Past Sale16630 Escavera St Lake Elsinore - Waterfront Single Family Residential 92530 2006 4 3 2,517 $289,000 $115 $289,000 $115 0% 11/6/15 FALSE Past Sale31001 Sedona St Lake Elsinore - Waterfront Single Family Residential 92530 2006 4 3 2,517 $289,900 $115 $289,900 $115 0% 11/20/15 FALSE Past Sale16628 ESCAVERA Lake Elsinore - Waterfront Single Family Residential 92530 2006 3 2.5 2,197 $299,900 $137 $283,000 $129 -6% 10/23/15 FALSE Past Sale31018 Sedona St Lake Elsinore - Waterfront Single Family Residential 92530 2006 3 2 1,520 $229,000 $151 $235,000 $155 3% 10/23/15 FALSE Past Sale33118 Shoreline Dr Lake Elsinore - Waterfront Single Family Residential 92530 2004 5 3 2,505 $329,990 $132 $310,000 $124 -6% 11/27/15 FALSE Past Sale31011 Sedona St Lake Elsinore - Waterfront Single Family Residential 92530 2006 4 3 2,517 $284,900 $113 $285,000 $113 0% 10/14/15 FALSE Past Sale33405 Walham Pl Lake Elsinore - Waterfront Single Family Residential 92530 2000 4 2 1,910 $287,000 $150 $285,000 $149 -1% 11/30/15 FALSE Past Sale33165 Leeward Way Lake Elsinore - Waterfront Single Family Residential 92530 2003 4 3 2,505 $347,000 $139 $339,145 $135 -2% 11/3/15 FALSE Past Sale32905 Kevin Pl Lake Elsinore - Waterfront Single Family Residential 92530 2002 4 2 2,232 $342,900 $154 $322,500 $144 -6% 10/20/15 FALSE Past Sale34009 Leon St Lake Elsinore - Waterfront Single Family Residential 92530 2006 4 2.5 2,197 $257,000 $117 $260,000 $118 1% 10/20/15 FALSE Past Sale16634 Escavera St Lake Elsinore - Waterfront Single Family Residential 92530 2006 4 2.5 2,197 $274,900 $125 $253,000 $115 -8% 8/11/15 FALSE Past Sale15301 Tiller Ln Lake Elsinore - Waterfront Single Family Residential 92530 2008 4 3 2,182 $305,900 $288,500 $132 -6% 8/31/15 FALSE Past Sale15311 Tiller Ln Lake Elsinore - Waterfront Single Family Residential 92530 2008 3 3 2,041 $285,900 $270,000 $132 -6% 6/3/15 FALSE Past Sale15321 Tiller Ln Lake Elsinore - Waterfront Single Family Residential 92530 2008 4 2.5 2,052 $287,000 $140 $282,000 $137 -2% 5/29/15 FALSE Past Sale33400 Walham Pl Lake Elsinore - Waterfront Single Family Residential 92530 2000 3 3 2,287 $309,900 $136 $281,000 $123 -9% 7/10/15 TRUE Past Sale15192 Laguna Ave Lake Elsinore - Waterfront Single Family Residential 92530 2007 4 2 2,615 $359,000 $137 $300,000 $115 -16% 5/22/15 FALSE Past Sale331 Laura Lake Dr (Unable to map) Lake Elsinore - Waterfront Single Family Residential 92530 2002 3 2.5 1,953 $339,500 $174 $320,000 $164 -6% 6/30/15 FALSE Past Sale30648 Via Lakistas Lake Elsinore - Waterfront Single Family Residential 92530 2004 4 2.5 2,902 $444,000 $153 $430,000 $148 -3% 7/13/15 FALSE Past Sale1025 Meadowlake Ln Lake Elsinore - Waterfront Single Family Residential 92530 2004 4 3.5 2,408 $320,000 $133 $325,000 $135 2% 6/19/15 FALSE Past Sale29474 Stadium Way (Unable to map) Lake Elsinore - Waterfront Single Family Residential 92530 2014 3 2.5 2,480 $331,990 $134 $346,990 $140 5% 3/27/15 FALSE Past Sale
15259.00 Analog Resales: c-Resales Page 4 of 5 The Concord Group
Page 331 of 332

APPENDIX - D
ANALOG SURVEY - RESALESANALOG MARKETS
LAST ONE YEAR ENDING FEBRUARY 2016
Zip Year Home List Price Sale Price Sale vs. Sale Short Active orStreet Address Neighborhood Type Code Built Bed / Bath Size $ $/sf $ $/sf List Date Sale? Sale
Lake Elsinore31719 Canyon Ridge Dr Lake Elsinore Single Family Residential 92532 2001 4 2.5 1,780 $304,900 $171 $292,000 $164 -4% 12/3/15 FALSE Past Sale31736 Canyon Ridge Dr Lake Elsinore Single Family Residential 92532 2001 6 2.5 2,358 $0 $0 $202,500 $86 --- 12/16/15 1/0/00 Past Sale31760 Canyon Estates Dr Lake Elsinore Single Family Residential 92532 2000 2.5 2,123 $333,999 $340,000 $160 2% 12/16/15 FALSE Past Sale31736 Indian Spring Rd Lake Elsinore Single Family Residential 92532 2000 4 2.5 1,780 $309,000 $305,000 $171 -1% 10/2/15 FALSE Past Sale21035 Canyon Ridge Dr Lake Elsinore Single Family Residential 92532 2000 4 2.5 2,486 $339,900 $137 $346,000 $139 2% 9/24/15 FALSE Past Sale31670 Sundance Way Lake Elsinore Single Family Residential 92532 2000 4 3 2,531 $359,000 $142 $349,900 $138 -3% 9/22/15 FALSE Past Sale31791 Indian Spring Rd Lake Elsinore Single Family Residential 92532 2000 6 2.5 2,358 $325,000 $138 $275,000 $117 -15% 3/20/15 TRUE Past Sale31768 Canyon Estates Dr Lake Elsinore Single Family Residential 92532 2000 4 2.5 1,780 $269,900 $152 $280,000 $157 4% 4/30/15 FALSE Past Sale31669 Chaparral Way Lake Elsinore Single Family Residential 92532 2001 4 2 2,068 $305,000 $147 $305,000 $147 0% 4/10/15 FALSE Past Sale31662 Hidden Canyon Rd Lake Elsinore Single Family Residential 92532 2001 5 3 2,647 $320,000 $121 $300,000 $113 -6% 4/8/15 FALSE Past Sale31528 Canyon View Dr Lake Elsinore Single Family Residential 92532 2002 5 3 2,880 $299,900 $104 $299,900 $104 0% 3/17/15 FALSE Past Sale21106 Scenic Ridge Dr Lake Elsinore Single Family Residential 92532 2001 4 3 2,727 $359,000 $132 $359,000 $132 0% 3/9/15 FALSE Past Sale31776 Canyon Estates Dr Lake Elsinore Single Family Residential 92532 2000 4 2.5 2,486 $339,000 $136 $322,000 $130 -5% 3/5/15 FALSE Past Sale31701 Ridgeview Dr Lake Elsinore Single Family Residential 92532 2000 4 2.5 2,123 $225,000 $106 $225,000 $106 0% 2/27/15 TRUE Past Sale21058 Kimberly Ct Lake Elsinore Single Family Residential 92532 2001 4 2.5 2,338 $320,000 $137 $315,000 $135 -2% 11/13/15 FALSE Past Sale31549 Canyon Vw Lake Elsinore Single Family Residential 92532 2001 5 3 3,439 $499,000 $145 $425,000 $124 -15% 10/20/15 FALSE Past Sale21112 Scenic Ridge Dr Lake Elsinore Single Family Residential 92532 2001 5 3 2,867 $339,000 $118 $330,000 $115 -3% 7/22/15 FALSE Past Sale31537 Stoney Creek Dr Lake Elsinore Single Family Residential 92532 2000 5 3 2,880 $429,000 $149 $385,000 $134 -10% 5/18/15 FALSE Past Sale31745 Canyon Estates Dr Lake Elsinore Single Family Residential 92532 2000 6 3 2,358 $312,900 $133 $295,000 $125 -6% 6/24/15 FALSE Past Sale31657 Hidden Canyon Rd Lake Elsinore Single Family Residential 92532 2001 4 3 2,531 $329,880 $130 $320,000 $126 -3% 6/11/15 FALSE Past Sale
15259.00 Analog Resales: c-Resales Page 5 of 5 The Concord Group
Page 332 of 332