tax increment financing feasibility study - struever fidelco cappelli
TRANSCRIPT

Tax Increment Financing
Feasibility Study and
Preliminary Redevelopment Plan
Appendix 1.F
PRELIMINARY DRAFT
ENVIRONMENTAL
IMPACT STATEMENT
for the
River Park Center, Cacace Center, Larkin Plaza and Palisades Point
in the City of Yonkers, New York
Submitted by: Struever Fidelco Cappelli LLC (SFC)
Submitted to: City Council of the City of Yonkers, New York
July 11, 2007
Revised January 2008

Tax Increment Financing Feasibility Study
and Preliminary Redevelopment Plan
Yonkers, New York
Prepared for the City Council of the City of Yonkers
Prepared by Struever Fidelco Cappelli, LLC
(SFC)
Saccardi and Schiff, Inc. Economic Research Associates
Municap Cushman & Wakefield
The Marketing Directors, Inc. Urgo Hotels
July 2007 Revised January 2008

TABLE OF CONTENTS I INTRODUCTION ........................................................................................................... I-1
II BLIGHT STUDY .......................................................................................................... II-1
III MARKET FACTORS ................................................................................................ III-1
IV FINANCIAL CONSIDERATIONS ........................................................................... IV-1
V AFFECTS ON OTHER PROPERTIES ..................................................................... V-1
VI PRELIMINARY PLAN ............................................................................................... VI-1
VII APPENDICES ............................................................................................................ VII-1
A. Hotel Market Reports
B. Office Space Market Reports
C. Residential Market Reports
D. Phase 1 TIF Bond Projections

Saccardi & Schiff, Inc. I-1
I. INTRODUCTION
Struever Fidelco Cappelli, LLC (the “Redeveloper”) has proposed a comprehensive mixed-use redevelopment project (the “SFC Project’) at sites in the downtown and at the Hudson River waterfront of the City of Yonkers described in the Draft Environmental Impact Statement (“DEIS”) for the Project submitted by Redeveloper to the Yonkers City Council, as lead agency for review of the Project under the State Environmental Quality Review Act, as Palisades Point, River Park Center (which includes Government Center and the Palisade Avenue Office Building site) Cacace Center and Larkin Plaza.1 Pursuant to a Master Developer Designation Agreement (“MDDA”) dated as of May 17, 2006, and made between Redeveloper, the City, the Yonkers Community Development Agency (“CDA”), the City of Yonkers Industrial Development Agency (“YIDA”), and the City of Yonkers Parking Authority, Redeveloper is the designated “master developer” of the sites. In May, 2006, Redeveloper was also designated by the CDA as the “qualified and eligible sponsor” of the Project under the Modified Urban Renewal Plan for N.D.P. Area 1 and N.D.P. Area 2 (the “Riverview Urban Renewal Plan”) and the Urban Renewal Plan for the Getty Square Urban Renewal Area (“Getty Square Urban Renewal Plan”). About the Project The development of the SFC Project is a public-private partnership, and without the City’s financial participation and support, the SFC Project could not be constructed as described in the MDDA. An essential component of the City’s participation is City funding for the construction of the approximately 5,000 public parking spaces at Palisades Point, River Park Center and Cacace Center, and the public sewer, water, road and other infrastructure improvements needed to support the SFC Project (or any other comprehensive redevelopment of the downtown), all of which is currently estimated to cost approximately $160,000,000 or more.2 The Redeveloper’s cost estimates have been reviewed by Bluestone Engineering, the City’s consultant. Bluestone Engineering estimates costs in excess of $160,000,000 for public infrastructure and parking, based on a higher estimated construction cost per structured parking space. As the SFC Project moves through the approval process and the public infrastructure and structured parking are designed, more accurate cost estimates will be made.. Municipal Redevelopment Law The City has made it clear that City funding for these public improvements must be supported by the tax revenues generated by the Project, and not by the general revenues of the City. The vehicle through which this can be accomplished is “tax increment financing” under the New York Municipal Redevelopment Law (New York General Municipal Law Article 18-C) (the “Municipal Redevelopment Law”). Although infrequently utilized in New York,3 tax increment financing is an indispensable self-financing tool used throughout the United States to help local governments 1 There is no private redevelopment proposed at Larkin Plaza. Larkin Plaza is proposed to be a public improvement project of the City, the cost
of which is paid for by tax increment bonds and federal, State and Westchester County grants. 2 The $160,000,000 estimate includes hard and anticipated soft (i.e., design) construction costs, but not the costs of issuance of tax increment
bonds, including, but not limited to, underwriter’s discount and required capitalized interest, if any. 3 The most significant reason is that the statute does not permit school taxes to be allocated to the tax increment. Therefore, except in the “big
five” cities of the State in which school taxes are part of the general real property tax levied and collected by the municipal government, the available increment is not large enough to support debt service on the tax increment bonds issued by the municipality.

Introduction
Saccardi & Schiff, Inc. I-2
successfully redevelop urban renewal areas and encourage economic development.4 In tax increment financing, the current real property tax assessed value of all properties in a designated project area (“tax increment financing district”) is established as the “base value.” As redevelopment in the tax increment financing district increases the assessed values of the redeveloped properties, a portion of the additional tax revenue generated by the increase in assessed value over the base value is set aside and committed by the City (and, as proposed here, the County) for debt service on tax increment bonds, the proceeds of which would be used for the construction of the required public improvements and infrastructure. However, the tax revenue generated by the base value in the tax increment financing district would continue to be general revenues of the City and County useable for any purpose. Tax increment financing is permitted only in connection with a “redevelopment plan” duly adopted by the City. The process is set forth in the Municipal Redevelopment Law, and is generally as follows: The City Council first finds that it is feasible to prepare a study to determine if a redevelopment
project within a specified area is feasible, and then designates the area as a survey area and authorizes the preparation of a feasibility (“survey area”) study. Any person may request the City Council to designate a tax increment financing district. (See Municipal Redevelopment Law Section 970-c).
Based on the results of the feasibility study, the City Council may select one or more project areas for redevelopment pursuant to the Municipal Redevelopment Law and provide for the preparation of a “preliminary plan” for the redevelopment project in the selected area(s). The preliminary plan must include, among other things: (a) a description of the boundaries of the project area; (b) a general statement of the land uses and the standards proposed as the basis for the redevelopment of the project area; (c) a statement of how the purposes of the Municipal Redevelopment Law would be achieved by the redevelopment; (d) a description of how the preliminary plan conforms to “Connections,” the comprehensive plan of the City; (e) a general statement of the impact of the project on residents of the project area and the surrounding neighborhood; and (f) a statement of why redevelopment of the project area would not be undertaken were it not for the purposes and provisions of the Municipal Redevelopment Law (i.e., tax increment financing). The preliminary plan must be accompanied by an environmental impact statement analyzing the potential impacts of the proposed redevelopment project. (See Municipal Redevelopment Law Section 970-e).
The City Council must refer the preliminary plan to the City Planning Board and all other City departments and agencies “with responsibility for zoning or land use planning” for review and advisory report and recommendation. (See Municipal Redevelopment Law Section 970-e).
If the City Council approves the preliminary plan, the City Council must authorize the preparation of a final “redevelopment plan” for the project area. Among other things, the redevelopment plan must contain: (a) a legal description of the boundaries of the project area; (b) by “diagram and in general terms”: (i) the approximate amount of open space to be provided and the street layout; (ii) limitations on the type, size, height, number and proposed use of buildings;
4 Tax increment financing has been successfully utilized in Baltimore, Pittsburgh, Providence, Atlanta, St. Louis, Memphis, St. Paul, Kansas City,
Dallas, Indianapolis, Louisville and Bridgeport, among other cities.

Introduction
Saccardi & Schiff, Inc. I-3
(iii) the approximate number of dwelling units; and (iv) the property to be devoted to public purposes and the nature of such purposes; (c) a “neighborhood impact statement” describing the physical, social and economic conditions existing in the project area and describing the impact of the project on residents of the district and surrounding areas in terms of relocation, traffic circulation, environmental quality, availability of community facilities and services, impact on school population and quality of education, property assessments and taxes, and other matters affecting the physical and social quality of the neighborhood; (d) a description of the proposed method of financing the redevelopment of the project area in detail sufficient to determine the economic feasibility of the plan; (e) adequate safeguards that the work of redevelopment will be carried out pursuant to the plan and provide for the retention of controls and the establishment of any restrictions or covenants running with the land sold or leased by the City for private use for such periods of time and under such conditions as the City Council deems necessary; and (f) a plan for relocation of families and persons to be temporarily or permanently displaced from housing in the project area.
The redevelopment plan may, among other things, also provide for: (1) participation in the redevelopment project by owners of all or part of the property in the project area; (2) the issuance of tax increment bonds and the use of the proceeds of such bonds to carry out the plan (and if it does, then the plan must also contain adequate provision for the payment of debt service on the bonds); (3) the City to acquire by gift, purchase, lease or condemnation all or part of the land in the district; and (4) the expenditure of money by the City and for the City to undertake and complete any proceedings necessary to carry out the project. (See Municipal Redevelopment Law Section 970-f).
Before the redevelopment plan is approved by the City Council, it must be referred to the City Planning Board for review and recommendations, which must consider the conformity of the plan with “Connections,” the comprehensive plan of the City. The Planning Board has thirty (30) days in which to file its report with the City Council.
Before the redevelopment plan is approved, the City Council must hold a public hearing on the plan in accordance with the requirements of Municipal Redevelopment Law Section 970-h.
The redevelopment plan may be approved after the close of the public hearing and after the report of the Planning Board has been filed, provided, however, that if the Planning board fails to file its report within the thirty (30) day period, then the City Council may approve the plan in the absence of the report.
After the redevelopment plan is approved, the City Council is authorized to issue by resolution tax increment bonds “for the purpose of carrying out or administering a redevelopment plan” but only for: (a) acquisition of land; (b) demolition and removal of buildings, structures and improvements and site preparation; (c) installation, construction or reconstruction of streets, walkways, docks, drainage, parking facilities, flood control facilities, water and sewer systems and other public utilities, parks and playgrounds; and (d) other public improvements or services integral to the redevelopment plan authorized by or for which a period of probable usefulness has been established by Section 11.00 of the New York Local Finance Law. (See Municipal Redevelopment Law Section 970-o).

Introduction
Saccardi & Schiff, Inc. I-4
It should be noted that it is proposed that Westchester County and the City enter into a so-called “joint undertaking” under the Municipal Redevelopment Law in which the County would appoint the City as its agent for the purposes of preparing the preliminary plan and redevelopment plan for the project area, each of which would be separately approved by the City Council and the Westchester County Board of Legislators. After the County Board approved the redevelopment plan, it would by resolution irrevocably pledge its tax increment revenues to the debt service on the City’s tax increment bonds. (See Municipal Redevelopment Law Section 970-n). The County Board must comply with the same procedures as the City Council, i.e., the preliminary plan and redevelopment plan must be referred to the Westchester County Planning Board and the County Department of Planning, and hold a public hearing on the proposed redevelopment plan). The Redeveloper has requested that the City issue tax increment bonds in the amount necessary to cover the costs of construction of the public improvements, infrastructure and parking and bond issuance and related financing costs (including capitalized interest and a reserve fund). Bond issuance and financing costs are estimated to be $32,000,000, making the total estimated amount of the bonds approximately $192,000,000. As discussed in Section IV of this document and shown in Appendix D of this report, the amount of initial annual debt service on this amount of bonds is estimated to be $9,504,128,5 and would increase to approximately $18,696,610 in the 30th and final year. The fund to pay the debt service on the bonds will be comprised of approximately 75% of the incremental additional real property tax revenue to the City and County6 generated by the SFC Project (i.e., the amount of additional tax generated by the increased assessed value of the Project above the current “base assessed value” of all of the SFC Project sites except Larkin Plaza) and the revenues from the new public parking facilities, which are estimated to be approximately $2,957,765 in the first year, rising to approximately $5,048,568 in the final year. The real property tax attributable to the base assessed value and the approximately 25% of the City tax increment that will not be devoted to tax increment bond debt service will be more than sufficient to cover the costs of the SFC Project for school, police, fire and other City services.7 The Redeveloper has agreed to “backstop” the debt service on the bonds, and will secure its obligation by providing the kind of security that is typical and customary in connection with tax increment bonding. This document has been prepared on behalf of the City and is both the feasibility (“survey area”) study required under Municipal Redevelopment Law Section 970-c (Sections I through V), and, because the study concludes that the proposed project area described herein is “blighted” within the meaning of the Municipal Redevelopment Law and that a redevelopment project (proposed to be the SFC Project) in the project area is feasible, is also the draft preliminary plan for the proposed redevelopment project (Section VI). This study/draft preliminary plan is accompanied by, and includes by reference, the DEIS for the Project submitted by Redeveloper to the Yonkers City Council. The draft preliminary plan is intended to facilitate the SFC Project that is described in the DEIS. Because the draft preliminary plan is narrowly tailored to the SFC Project, the potential environmental impacts that might arise as a result of the implementation of the proposed 5 This is the “gross” annual debt service payment (i.e., before applying debt service reserve fund income and income from operations). Although debt
service schedules are uncertain at this point, it is expected that the first payment of debt service from City revenues and not from capitalized interest would be 3 and ½ years after issuance, i.e., after the Project is constructed and has begun operating. Interest expense during the construction period would be capitalized.
6 As previously indicated, Westchester County participation in “joint undertaking” will be requested, and the County will be asked to pledge 75% of its tax increment to the repayment of the City bonds.
7 Sales and income tax revenues generated by the Project are additional sources for payment of City services.
Introduction
Saccardi & Schiff, Inc. I-5
redevelopment project are generally indistinguishable from the potential impacts of the SFC Project, and analysis of these impacts is therefore subsumed in the DEIS analyses of SFC Project impacts.

Saccardi & Schiff, Inc. II-1
II. BLIGHT STUDY
This section presents an analysis of existing building and lot conditions within the proposed redevelopment project area (the “Study Area”). The Study Area is depicted in Exhibit II-1, “Proposed Municipal Redevelopment Project Area Boundary.”
Section 970-c of Municipal Redevelopment Law defines “project area,” in part, as follows:
“Project area means an area of a community which is a blighted area, the redevelopment of which is necessary to effectuate the purposes of this article (Municipal Redevelopment) A project area need not be restricted to buildings, improvement or lands which are detrimental or inimical to the public health, safety or welfare, but may consist of an area in which such conditions predominate and adversely affect the entire area…and may include lands, buildings or improvements which are not detrimental or inimical to the public health, safety or welfare, but whose inclusion is found necessary by the municipality for the effective redevelopment of the area of which they are a part…”
This study: (1) surveys and analyzes the Study Area to determine if it is blighted within the meaning of the Municipal Redevelopment Law; and (2) assesses the feasibility of conducting a redevelopment project (which is proposed to be the SFC Project) in the Study Area in accordance with Municipal Redevelopment Law. Field inspections of the Study Area were conducted in August 2006 and November 2006. Surveys were undertaken by professional planners and architects. In addition, aerial photographs and City land use and property data were reviewed, and building and site conditions, existing land uses, including under-utilization of land, parcel sizes and configurations, and other factors which may contribute to blighting were analyzed. The redevelopment project proposed for the Study Area is the SFC Project, which consists of 1,386 dwelling units, approximately 1.3 million square feet of non-residential development, over 6,000 parking spaces (of which over 5,000 spaces are for public parking), a minor league ballpark, “daylighting” of, and improvements to, portions of the Saw Mill River at River Park Center and, if the City elects to make them, at Larkin Plaza, construction of a publicly accessible riverwalk along the Saw Mill River at River Park Center and, potentially, a public riverwalk at Larkin Plaza and the creation of a publicly accessible open space along the Hudson River at Palisades Point. In order to facilitate the comprehensive revitalization of the downtown, tax increment bonds are proposed to issued by the City to fund the costs of construction of the public parking facilities and public road, sewer, water and other improvements required to sustain the SFC Project, including the costs of daylighting and improving the Saw Mill River and of construction of the riverwalk at River Park Center and Larkin Plaza. The proposed redevelopment project is being considered in accordance with the provisions of the Municipal Redevelopment Law, which grants municipalities the power to redevelop blighted areas or cause them to be redeveloped by private parties, and fund the costs of public improvements through the issuance of tax increment bonds and/or notes. The legislative findings of the Municipal Redevelopment Law include the following:

Blight Study
Saccardi & Schiff, Inc. II-2
“It is hereby found and declared that there exists in many communities blighted area which threaten the economic and social well being of the people of the state…For these reasons it is declared to be the policy of the state to protect and promote the sound development and redevelopment of blighted areas and whenever the redevelopment of such areas cannot be accomplished by private enterprise alone without public participation and assistance in the acquisition of land, in planning and in the financing of land assembly, in the work of clearance, and in the making of improvements necessary therefore, it is in the public interest to employ the power of eminent domain, to advance or expend public funds for these purposes, and to provide a means by which blighted areas may be redeveloped or rehabilitated.”
Specifically, Section 970-c of the Municipal Redevelopment Law defines “blighted area,” in part, as follows:
“Blighted area means an area within a municipality in which one or more of the following conditions exist: (i) a predominance of building and structures which are deteriorated or unfit or unsafe for use or occupancy; or (ii) a predominance of economically unproductive lands, buildings or structures, the redevelopment of which is needed to prevent further deterioration which would jeopardize the economic well being of the people.”
The following conditions were observed in the Study Area: 1) deteriorated private properties, including residential and commercial structures; 2) inadequate maintenance of buildings and surrounding yards; 3) fully and partially vacant parcels and buildings; 4) underutilized parcels; and, 5) incidence of significant deterioration in public infrastructure including roads, sidewalks and curbs. The detailed results of the survey are presented below. The conclusion of this study is that the Study Area is a blighted area within the meaning of the Municipal Redevelopment Law. It is noted that the vast majority of the land in the Study Area is located within the Riverview Urban Renewal Plan area or the Getty Square Urban Renewal Plan area, which were both adopted by the City of Yonkers approximately 30 years ago. Both areas have therefore previously been determined by the CDA and the City Council to be blighted and suitable for urban renewal under the New York State Urban Renewal Law (New York General Municipal Law Article 15). The Riverview Urban Renewal Plan was last amended in October 2004. The Riverview Urban Renewal Area is generally the area along the waterfront and west of South Broadway, primarily between Dock Street and Prospect Street. The Riverview Urban Renewal Area overlaps with the majority of the western portion of the subject Study Area. The Getty Square Urban Renewal Plan was last amended July 10, 1978. The Getty Square Urban Renewal Area is generally the area east of South Broadway and west of Linden Street, primarily between Columbus Place and Guion Street. The Getty Square Urban Renewal Area overlaps with the majority of the eastern portion of the subject Study Area. See Exhibit II-2, “Existing Urban Renewal Area Boundaries.” The Getty Square Urban Renewal Area has seen relatively little redevelopment since the Urban Renewal Plan

Blight Study
Saccardi & Schiff, Inc. II-3
was adopted 30-years ago, and much of the blighted conditions remain. In contrast, portions of the Riverview Urban Renewal Area have been redeveloped, particularly the areas along the Hudson River shoreline that are approximate to the Metro North Railroad station. Blight Study Methodology
Section II of this report comprises the Blight Study for the Study Area. The following summarizes the methodology for the information compiled in the Blight Study. Study Area Boundary: The Study Area boundary encompasses each of the SFC Project sites, as well as other properties that would likely benefit from the public improvements proposed to be made in the Study Area. (See Exhibit II-1.) A full description of the Study Area boundary is provided on Page II-3. Field Surveys Field surveys of the Study Area were conducted by Planners from Saccardi & Schiff, Inc. on August 15 and August 23, 2006. Field survey verification was undertaken on November 28, 2006. The surveys included visual inspections of lots, buildings and public improvements, and exterior physical conditions as well as review of occupancy, property uses, and intensity of current use. The characterization of a building as being in “good,” “fair” or “poor” condition was based on the level of visible deterioration and by the characteristics outlined in Table II-3. Sources: • General Municipal Law, Article 18-C, Municipal Redevelopment Law • City of Yonkers GIS base map and parcel data • Field Surveys conducted by Saccardi & Schiff, Inc. (8/15/06; 8/23/06; and 11/28/06)8
Existing Conditions
1. Background and Definition of the Study Area
The Study Area boundary, as shown in Exhibit II-1, “Proposed Municipal Redevelopment Project Area Boundary,” was drawn to include the SFC Project sites, and other properties likely to benefit directly and indirectly, from the public improvements proposed to be made in the Study Area. The boundary of the Study Area encompasses all tax parcels within the boundary described generally as follows: The boundary starts at a point which is formed by the intersection of Linden Street and Elm Street then proceeds south to a point formed by the intersection of Linden Street and Maple Street. At this point, the boundary proceeds west along Maple Street to the intersection of Maple Street and Nepperhan Avenue and proceeds southwest along Nepperhan Avenue to
8 Saccardi & Schiff, Inc. is a planning consultant firm located in White Plains, New York. In the past 20 years, the firm has completed approximately 25 blight studies for communities in Westchester, Rockland, Nassau and Suffolk Counties. Prior to establishing the firm, David Schiff and John Saccardi had been actively involved in urban renewal project planning, including preparation of blight studies, with service to communities dating back to 1970.

Blight Study
Saccardi & Schiff, Inc. II-4
the intersection of New Main Street at which point it proceeds south along New Main Street to Guion Street. From this point, the boundary follows Guion Street to the intersection of South Broadway, at which point it proceeds north along South Broadway to the intersection of Nepperhan Avenue and Prospect Street. The boundary proceeds west along Prospect Street to the intersection of Prospect Street and Buena Vista Avenue. At this point, the boundary proceeds north along Buena Vista Avenue inclusive of those tax parcels on the west side of Buena Vista Avenue whose rear lot lines adjoin the Metro North Railroad right of way between Prospect Street and Dock Street, and includes those parcels identified in the City’s Downtown Waterfront Master Plan as Parcels H and I (the Palisades Point site) on the west side of the Metro North Railroad tracks. From the intersection of Buena Vista Avenue and Dock Street, the boundary proceeds eastward along Dock Street where it intersects North Broadway at which point it proceeds south along North Broadway to Getty Square (the intersection of North Broadway, Main Street, South Broadway and Palisade Avenue). From Getty Square, the boundary proceeds eastward along Palisade Avenue to where it intersects with Elm Street, at which point it proceeds southward, returning to the starting point at the intersection of Elm Street and Linden Avenue. The Study Area also includes the following parcels that adjoin the boundary described above: at the intersection of Maple Avenue and School Street, the first three tax parcels on the southeast corner heading southbound along School Street; the first four tax parcels on the southwest corner heading southbound along School Street; on Nepperhan Avenue, the tax parcels that front on the south side of Nepperhan Avenue between School Street and New Main Street, and several parcels that adjoin the rear lot lines of these parcels; on Prospect Street, the tax parcels that front on the south side of Prospect Street between Hawthorne Avenue and Buena Vista Avenue; the first three tax parcels on the west side of Buena Vista Avenue south of Prospect Street; the tax parcels that form the block bounded by Dock Street to the south, Wells Avenue to the north, Bashford to the west, and Woodworth Avenue to the east; the first four tax parcels that front on the east side of North Broadway, north of Getty Square, and the tax parcels that front on the north side of Palisades Avenue, east of Getty Square to the intersection of Palisade Avenue, School Street, and Elm Street; the first two tax parcels on the west side and the first four tax parcels on the east side of Locust Hill Avenue north of the intersection of Locust Hill Avenue and Palisade Avenue; and the first four tax parcels on the west side and the first two tax parcels on the east side of Palisade Avenue north of the intersection of Palisade Avenue and Elm Street.

Blight Study
Saccardi & Schiff, Inc. II-5
2. Existing Land Use
The Study Area comprises a total of 344 tax lots and contains residential, commercial, public, and religious land uses (See Table II-1, “Existing Land Uses in the Study Area”, and Exhibit II-3, “Existing Land Use”).
Table II-1
Existing Land Uses in the Study Area
Characteristic Lots Percentage Area (Acres) Percentage Study Area 344 100% 75.75 100% Residential 134 39% 14.1 19% Commercial 43 13% 12.0 16% Community Service 27 8% 16.7 22% Industrial/Utilities 25 7% 3.0 4% Vacant Land 94 27% 20.0 26% Parking 6 2% 7.5 10% Road/Street/Hwy 15 4% 2.5 3%
Source: City of Yonkers Parcel Data
The Study Area can be defined as “mixed-use” in nature. Residential and commercial land uses are distributed throughout the Study Area, but residential land uses predominate at the edges of the area, while commercial land uses are most prevalent in the central blocks, including Getty Square and vicinity, Main Street and around the intersection of Riverdale Avenue and Prospect Street. Public/quasi-public land uses, including community services, religious, government and recreation uses are also distributed throughout the Study Area. These include Yonkers City Hall, the U.S. Post Office, Yonkers Police and Fire Headquarters, and the Cacace Justice Center. Five religious uses and six benevolent uses, including the YMCA and Salvation Army, are found within the Study Area. According to tax parcel data, there are 94 vacant properties in the Study Area, with and without existing structures. Fifteen (15) parcels serve as public street rights-of-way, and 26 are identified as CDA urban renewal properties, 19 of which are vacant. Commercial uses in the Study Area include six auto-repair/service stations, 24 restaurant/retail businesses, and 13 office buildings.
With a total of 134 residential uses in the Study Area, multifamily is the primary residential use. Concentrations of two- and three- family residences are mostly found within the Hawthorne and Buena Vista area to the east of Metro North tracks; and within the blocks surrounded by Palisade Avenue to the north. Relatively few single-family uses exist in the Study Area. Large parcels of industrial land are predominantly found in the western sections of the Study Area along the riverfront.
Blight and Blighting Factors
In order to assess the presence of blighting factors, field surveys of the Study Area were conducted with visual inspections of lots, buildings and public improvements. Tax parcel data and ownership records and other public records were also researched. All lots and buildings were then classified by occupancy and use as: “occupied building,” “underutilized building,”
Blight Study
Saccardi & Schiff, Inc. II-6
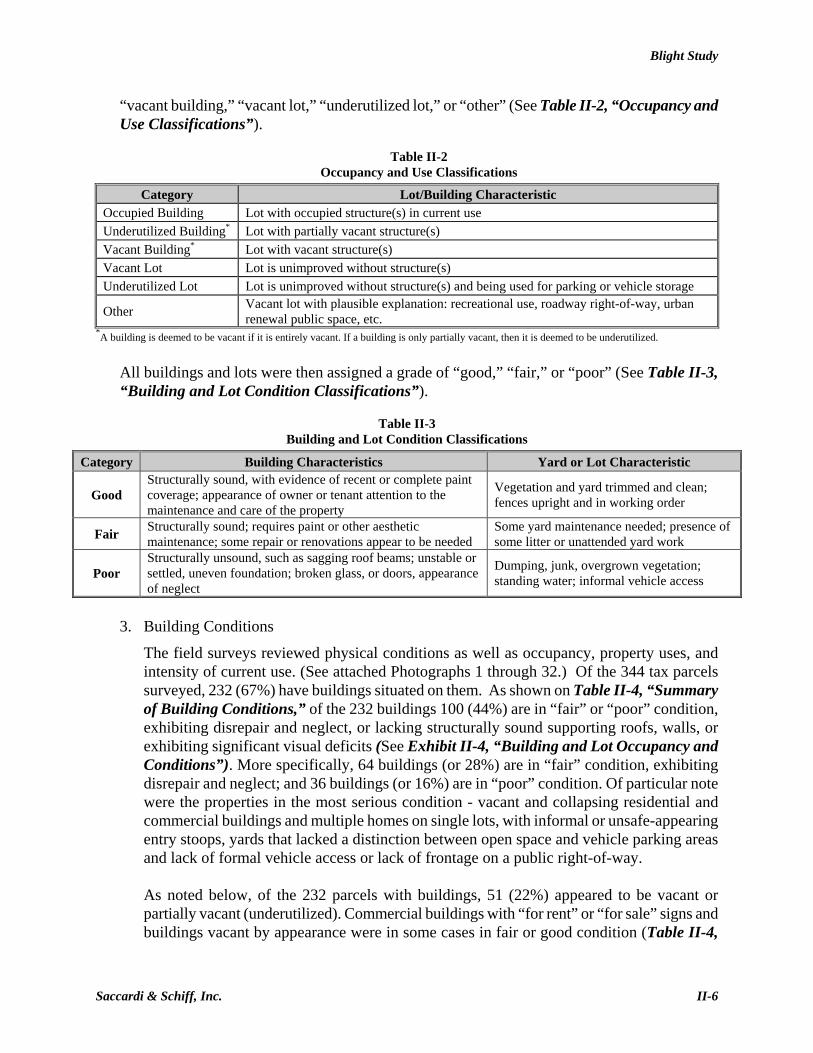
“vacant building,” “vacant lot,” “underutilized lot,” or “other” (See Table II-2, “Occupancy and Use Classifications”).
Table II-2
Occupancy and Use Classifications Category Lot/Building Characteristic
Occupied Building Lot with occupied structure(s) in current use Underutilized Building* Lot with partially vacant structure(s) Vacant Building* Lot with vacant structure(s) Vacant Lot Lot is unimproved without structure(s) Underutilized Lot Lot is unimproved without structure(s) and being used for parking or vehicle storage
Other Vacant lot with plausible explanation: recreational use, roadway right-of-way, urban renewal public space, etc.
*A building is deemed to be vacant if it is entirely vacant. If a building is only partially vacant, then it is deemed to be underutilized. All buildings and lots were then assigned a grade of “good,” “fair,” or “poor” (See Table II-3, “Building and Lot Condition Classifications”).
Table II-3
Building and Lot Condition Classifications Category Building Characteristics Yard or Lot Characteristic
Good Structurally sound, with evidence of recent or complete paint coverage; appearance of owner or tenant attention to the maintenance and care of the property
Vegetation and yard trimmed and clean; fences upright and in working order
Fair Structurally sound; requires paint or other aesthetic maintenance; some repair or renovations appear to be needed
Some yard maintenance needed; presence of some litter or unattended yard work
Poor Structurally unsound, such as sagging roof beams; unstable or settled, uneven foundation; broken glass, or doors, appearance of neglect
Dumping, junk, overgrown vegetation; standing water; informal vehicle access
3. Building Conditions
The field surveys reviewed physical conditions as well as occupancy, property uses, and intensity of current use. (See attached Photographs 1 through 32.) Of the 344 tax parcels surveyed, 232 (67%) have buildings situated on them. As shown on Table II-4, “Summary of Building Conditions,” of the 232 buildings 100 (44%) are in “fair” or “poor” condition, exhibiting disrepair and neglect, or lacking structurally sound supporting roofs, walls, or exhibiting significant visual deficits (See Exhibit II-4, “Building and Lot Occupancy and Conditions”). More specifically, 64 buildings (or 28%) are in “fair” condition, exhibiting disrepair and neglect; and 36 buildings (or 16%) are in “poor” condition. Of particular note were the properties in the most serious condition - vacant and collapsing residential and commercial buildings and multiple homes on single lots, with informal or unsafe-appearing entry stoops, yards that lacked a distinction between open space and vehicle parking areas and lack of formal vehicle access or lack of frontage on a public right-of-way. As noted below, of the 232 parcels with buildings, 51 (22%) appeared to be vacant or partially vacant (underutilized). Commercial buildings with “for rent” or “for sale” signs and buildings vacant by appearance were in some cases in fair or good condition (Table II-4,

Blight Study
Saccardi & Schiff, Inc. II-7
“Summary of Building Conditions”). The most severe building conditions were found to be concentrated in the core of the Study Area, but the entire area was found to contain properties in “fair” and “poor” condition. The following photographs illustrate the range of these conditions.
Table II-4 Summary of Building Conditions
Type Poor Condition Fair Condition Good Condition Summary
Count % % of Total Count % % of Total Count % % of Total Total % of TotalOccupied Buildings 27 15% 8% 42 23% 12% 112 62% 33% 181 53%
Underutilized Buildings 4 12% 1% 13 39% 4% 16 48% 5% 33 10%
Vacant Buildings 5 28% 1% 9 50% 3% 4 22% 1% 18 5%
TOTAL 36 16% 10% 64 28% 19% 132 57% 38% 232 67% Source: Field Survey, Saccardi & Schiff, Inc. (8/15/06, 8/23/06 and 11/28/06)
The field surveys confirm that buildings and structures in the Study Area are predominantly deteriorated or unfit or unsafe for use or occupancy.
4. Vacant and Underutilized Properties
The Study Area contains 58 vacant parcels, totaling approximately 7.2 acres. (See Photographs 1, 2, 9, 10, 11, 12, 25, and 32 for examples of vacant and underutilized properties.) This represents 17 percent of the Study Area’s 344 lots, or 9 percent by area (See Table II-5, “Summary of Vacant Land”). Forty lots are underutilized, functioning as surface parking or vehicle storage lots, including Chicken Island parking lot, which is the largest surface parking lot in the downtown area. These lots are underutilized, and comprise 23 acres, or 30 percent of the Study Area. Taken together, vacant and underutilized tax lots, and lots with underutilized (partially vacant) building total approximately 38.5 acres, or 50 percent of the Study Area land. In addition to these lots, there are 51 vacant or underutilized buildings. Therefore, of the 344 parcels in the Study Area, 149 (or 43%) are vacant or underutilized. When coupled with the buildings in fair and poor condition, the need for redevelopment in the Study Area is evident (See Table II-6, “Summary of Blight and Blighting Factors,” Exhibit II-5, “Property Conditions in Study Area,” and Exhibit II-6, “Vacancy and Underutilization in Study Area”).

Blight Study
Saccardi & Schiff, Inc. II-8
Table II-6 Summary of Blight and Blighting Factors (Area by Acres)
Type Poor Condition Fair Condition Good Condition Summary
Count Area Area
% % of Total Count Area
Area %
% of Total Count Area
Area %
% of Total Total Area
Area %
Occupied Buildings 27 2.3 3% 8% 42 6.62 9% 12% 112 25.9 34% 33% 181 34.78 45% Underutilized Bldgs 4 2.2 3% 1% 13 1.11 1% 4% 16 5.23 7% 5% 33 8.54 11% Vacant Buildings 5 0.3 0% 1% 9 1.03 1% 3% 4 0.42 1% 1% 18 1.73 2%
TOTAL 36 4.8 6% 10% 64 8.76 11% 19% 132 31.5 41% 38% 232 45.05 59%
Vacant Lots 58 7.2 9% 17% 58 7.18 9% Under Utilized Lots 40 23 30% 12% N/A N/A 40 22.76 30%
Other 14 1.5 2% 4% 14 1.49 2%
TOTAL 112 31 41% 33% 112 31.43 41%
TOTAL 344 76.48 1.00
5. Lot and Yard Conditions
Some yards surrounding existing buildings exhibited dumping, lack of vegetation and landscaping maintenance, and other signs of neglect. Overall, few vacant lots were observed to be in “good” condition—these were mainly City-owned and maintained parcels, including public open space areas and other parcels fronting on the south side of Elm Street and on the south side of Nepperhan Avenue. As described in Table II-3, the lots that are classified as being in “poor” condition were found to contain dumping, junk, overgrown vegetation, standing water, and/or informal vehicle access. Yards in “fair” and “poor” condition tended to also contain buildings in “fair” and “poor” condition. In some cases, multiple vacant lots in “poor” or “fair” condition are adjacent to one another, compounding the conditions.
Table II-5 Summary of Vacant Land
Type Count Area Area% % of Total Vacant Lots 58 7.2 9% 17% Underutilized Lots 40 23 30% 12% Other * 14 1.5 2% 4% TOTAL 112 31 41% 33%
Source: Field Survey, Saccardi & Schiff, Inc. *As addressed in Table II-2, “Other” is defined by vacant lots with plausible explanation: recreational use, roadway right-of-way, urban renewal public space, etc.
The number of vacant and underutilized lots shows that a significant portion of the Study Area id comprised of unproductive lands.

Blight Study
Saccardi & Schiff, Inc. II-9
6. Public Improvements
The existing infrastructure systems in the Study Area, including the water mains and combined storm and sanitary sewer lines are old, obsolete and inadequate for any comprehensive redevelopment program. The area suffers from water pressure problems and the combined sewer system overflows and causes capacity problems at the nearby Yonkers Sewerage Treatment Plant. This results in serious problems with untreated sewage entering the Hudson River and the Saw Mill River, which flows through a flume throughout most of the Study Area and is an untapped resource that could be vastly improved if daylighted as part of a redevelopment program. Curbs and gutters and visible crosswalks are generally found to be in satisfactory condition in many locations such as those along the major thoroughfares of Nepperhan Avenue and the shopping district around Getty Square, but not along many of the smaller streets that comprise much of the Study Area. It was noted that in many areas sidewalks and curbs were in need of repair and fencing, and walls and other public/private boundaries were in disrepair. (See Photographs 1, 3, 4, 10, 11, 25, and 28.) The roads are in fair condition, but do to appear to need significant repair. The road system providing access to the Study Area is made up of busy roads with fast-moving traffic, and stands in contrast to the internal road network of smaller streets, many of which are fronted with residential and mixed uses buildings. Double parking and on-street loading add congestion to these narrow roads.
CONCLUSIONS
As summarized in Table II-5, nearly 33% of all lots and buildings are determined to be in “poor” condition. In addition, as shown in Table II-5, vacant and underutilized lots, and lots with underutilized buildings total approximately 50% (or 38.5 acres) of the Study Area. This confirms that the Study Area is characterized by a predominance of buildings which are deteriorated or unfit or unsafe for use or occupancy, and of vacant or underutilized lands (See Exhibit II-7, “Substandard Conditions in Study Area”). The Study Area is therefore a blighted area under the criteria set forth in the Municipal Redevelopment Law, and the existing conditions warrant the preparation by the City of a preliminary plan for a redevelopment project in the Study Area.

Prospect St
Wells Ave
Ann St
Overlook Terrace
Karl
Hoy
oS
t
Terrace Pl
Engine Pl
Mill
St
John St
Morgan
St
Baldwin Pl
Nepperhan St
Edw
inLa
Willow
St
Wells Ave
Sain
t Cas
imir
Ave
School St
Gui
onS
t
Maple St
Hudson St
Main St
Met
ro-N
orth
Rai
lroad W
averlyS
t
Bue
naV
ista
Ave
Elm St
Haw
thor
neA
ve
MarketP
l
Riv
erda
leA
ve
Dock St
South
Broa
dway
NewM
ainSt
James
St
Lind
enSt
Columbus Pl
HenryHerz St
Nepperhan Ave
Locu
stH
illAv
e
RIV
War
burto
nA
ve
Athe
rton
St
New
Main S
t
Palisade Ave
Brook St
South Broadway
0 100’
PROPOSED MUNICIPALREDEVELOPMENT PROJECT
AREA BOUNDARY
Exhibit II-1
TIF FEASIBILITY STUDYCity of Yonkers, New York
Saccardi & Schiff, Inc. - Planning and Development Consultants

Prospect St
Wells Ave
Ann St
Overlook Terrace
Karl
Hoy
oS
t
Terrace Pl
Engine Pl
Mill
St
John St
Morgan
St
Baldwin Pl
Nepperhan St
Edw
inLa
Willow
St
Wells Ave
Sain
t Cas
imir
Ave
School St
Gui
onS
t
Maple St
Hudson St
Main St
Met
ro-N
orth
Rai
lroad W
averlyS
t
Bue
naV
ista
Ave
Elm St
Haw
thor
neA
ve
MarketP
l
Riv
erda
leA
ve
Dock St
South
Broa
dway
NewM
ainSt
James
St
Lind
enSt
Columbus Pl
HenryHerz St
Nepperhan Ave
Locu
stH
illAv
e
RIV
War
burto
nA
ve
Athe
rton
St
New
Main S
t
Palisade Ave
Brook St
South Broadway
Getty Square Urban Renewal AreaRiverview Urban Renewal AreaProposed Study Area Boundary
0 100’EXISTING URBAN RENEWAL
AREA BOUNDARIES
Exhibit II-2
TIF FEASIBILITY STUDYCity of Yonkers, New York
Saccardi & Schiff, Inc. - Planning and Development Consultants

VARK ST
MAIN ST
LIN
DEN
ST
BU
ENA
VIST
A AV
E
ELM ST
S BROADWAY
RIV
ERD
ALE
AVE
PALI
SAD
E AV
E
HAW
THO
RN
E AV
E
WAV
ERLY
ST
N BR
OADW
AY
HUDSON ST
MAPLE ST
DOCK ST
WIL
LOW
ST
LOCU
ST H
ILL
AVE
PARK HILL AVE
WA
RB
UR
TON
AVE
GU
ION
ST
BR
OO
K ST
ST C
ASIM
ER A
VE
NEW MAIN ST
NEPPERHAN ST
PROSPECT ST
MO
RG
AN
ST
WAT
ER G
RA
NT
ST NEW
SC
HO
OL
ST
RIVE
R ST
BELL
PL
POPLAR ST
ASH ST
ATHE
RTON
ST
ALEX
ANDE
R ST
BA
SHFO
RD
ST
BALDWIN PL
CROMWELL PL
WO
OD
WO
RTH
AVE
MT CARMEL PL
OVERLOOK TER
CLI
NTO
N S
T
ST MARYS ST
MA
RK
ET PL
SCH
OO
L ST
HER
RIO
T PL
WAVERLY PL
JAC
KSO
N S
T
MANOR HOUSE SQ
WELLS AVE
NEPP
ERHA
N AV
E
NEW
MA
IN ST
NEPPERHAN AVE
RIVER ST
WO
OD
WO
RTH
AVE
ANN ST
JAMES ST
MAIN ST
SOUT
H
BROADWAY
ENGINE PL
Existing Land Use MapResidential
One Family Residence
Two/Three Family Residences
Mixed Use
Multifamily
Commercial
Auto Repair/Gas Station
Office
Restaurant/Retail
Warehouse/Manufacturing
Industrial
Community Services/Other
Recreation Facilities
Public/Quasi-Public
Parking
Vacant Land
Utilities
Other
Right-Of-Way Parcels
EXISTING LAND USEExhibit II-3
TIF FEASIBILITY STUDYCity of Yonkers, New York
Saccardi & Schiff, Inc. - Planning and Development Consultants
0 270’

Lind
enSt
Main St
Riv
erda
leAv
e
Buen
aV
ista
Ave
LindenS
t
New
Main
St
Main St
Willow
St
Waverly
St
Waverly
St
Dock St
Gui
onSt
Sain
t Cas
imir
Ave
Hudson St
Poplar St
Karl
Hoy
oS
tBaldwin Pl
Nepperhan St
Morgan
St
John St
Cromwell Pl
HenryHerz St
Bell
St
Mill
St
Engine Pl
Terrace Pl
James St
Overlook Terrace
Wells Ave
Saint Mary St
Columbus Pl
Saint Mary St
Manor House Sq
William Schroeder St
Prospect St
NewMain
St
School S
t
Elm St
Haw
thor
neAv
e
Athe
rton
St
War
burto
nA
ve
Nor
thB
road
way
South
Broa
dway
Brook St
Met
ro-N
orth
R
ailro
ad
Larkin Plaza
Palisade Ave
Nepperhan A
ve
South Broadway
Ann St
School St
Maple St
New
Market P
l
TIF Boundary 4
Occupied Building - Fair Condition
Occupied Building - Poor Condition
Occupied Building - Good Condition
Other Use (Recreation, Roadway, Urban Renewal, Public Space)
Underutilized Building - Fair Condition
Underutilized Building - Poor Condition
Underutilized Building - Good Condition
Underutilized Lot - Used for Parking
Vacant Building - Fair Condition
Vacant Building - Poor Condition
Vacant Building -Good Condition
Vacant Lot
0 260’
BUILDING AND LOTOCCUPANCY AND CONDITIONS
Exhibit II-4
TIF FEASIBILITY STUDYCity of Yonkers, New York
Saccardi & Schiff, Inc. - Planning and Development Consultants

BU
ENA
VIST
A AV
ENU
E
NEPPERHAN AVENUE
LIN
DEN
STR
EET
MAIN STREET
PALI
SAD
E AV
ENU
E
RIV
ERD
ALE
AVE
NU
E
SOUTH BROADWAY
WAV
ERLY
STR
EET
NORTH BRO
ADWAY
SCH
OO
L STREET
DOCK STREET
MAPLE STREET
LOCU
ST H
ILL
AVEN
UE
MA
IN S
TREE
T EX
TEN
SIO
N
ELM STREET
WA
RB
UR
TON
AVE
NU
E
GU
ION
STR
EET
EDW
IN L
AN
E
HAW
THO
RN
E AV
ENU
E
SAIN
T CA
SIM
IR A
VENU
E
HUDSON STREET
NEW MAIN STREET
WIL
LOW
STR
EET
BALDWIN PLACE
NEPPERHAN STREET
KA
RL
HO
YO S
TREE
T
MO
RG
AN
STREET
JOHN STREET
CROMWELL PLACE
HENRY HERZ STREET
BELL
STR
EET
MIL
L ST
REET
ENGINE PLACE
TERRACE PLACE
POPLAR STREET
JAMES STREET
ST. MARY STREET
COLUMBUS PLACE
MANOR HOUSE SQ.
WAVERLY PLACE
MAIN STREET
HUDSON STREET
ELM STREET
HAW
THO
RN
E AV
ENU
E
NEW
MA
IN STR
EETRIV
ERD
ALE
AVE
NU
E
SCH
OO
L ST
REE
T
PROSPECT STREET
PROSPECT STREET
LegendProposed TIF District Boundary
Property Condition
Good Condition
Fair Condition
Poor Condition
PROPERTY CONDITIONS IN STUDY AREA
Exhibit II-5
TIF FEASIBILITY STUDYCity of Yonkers, New York
Saccardi & Schiff, Inc. - Planning and Development Consultants
0 260’

LIN
DEN
STR
EET
BU
ENA
VIST
A AV
ENU
E
NEPPERHAN AVENUE
MAIN STREET
RIV
ERD
ALE
AVE
NU
E
PALI
SAD
E AV
ENU
E
SOUTH BROADWAY
WAV
ERLY
STR
EET
SCH
OO
L STREET
MAPLE STREET
NORTH BRO
ADWAY
DOCK STREET
MA
IN S
TREE
T EX
TEN
SIO
N
ELM STREET
LOCU
ST H
ILL
AVEN
UE
WA
RB
UR
TON
AVE
NU
E
GU
ION
STR
EET
HAW
THO
RN
E AV
ENU
E
NEW
MA
IN STR
EET
SAIN
T CA
SIM
IR A
VENU
E
EDW
IN L
AN
E
HUDSON STREET
WIL
LOW
STR
EET
VARK STREET
BALDWIN PLACE
NEPPERHAN STREET
MO
RG
AN
STREET
JOHN STREET
CROMWELL PLACE
KA
RL
HO
YO S
TREE
T
HENRY HERZ STREET
BELL
STR
EET
POPLAR STREET
MIL
L ST
REET
ENGINE PLACE
ASH STREET
TERRACE PLACE
JAMES STREET
WELLS AVENUE (PRIVATE DRIVE)
YONKER
S AV
ENUE
ST. MARY STREET
COLUMBUS PLACE
MANOR HOUSE SQ.
MAIN STREET
NEW MAIN STREET
RIV
ERD
ALE
AVE
NU
E
SCH
OO
L ST
REE
T
HAW
THO
RN
E AV
ENU
E
HUDSON STREET
PROSPECT STREET
ELM STREET
PROSPECT STREET
LegendProposed TIF District Boundary
Underutilized Building
Underutilized Lot
Vacant Building
Vacant Lot
0 260’
VACANCY AND UNDERUTILIZATIONIN STUDY AREA
Exhibit II-6
TIF FEASIBILITY STUDYCity of Yonkers, New York
Saccardi & Schiff, Inc. - Planning and Development Consultants

BU
ENA
VIST
A AV
ENU
E
NEPPERHAN AVENUE
LIN
DEN
STR
EET
MAIN STREET
PALI
SAD
E AV
ENU
E
RIV
ERD
ALE
AVE
NU
E
SOUTH BROADWAY
WAV
ERLY
STR
EET
NORTH BRO
ADWAY
SCH
OO
L STREET
DOCK STREET
MAPLE STREET
LOCU
ST H
ILL
AVEN
UE
MA
IN S
TREE
T EX
TEN
SIO
N
ELM STREET
WA
RB
UR
TON
AVE
NU
E
GU
ION
STR
EET
EDW
IN L
AN
E
HAW
THO
RN
E AV
ENU
E
SAIN
T CA
SIM
IR A
VENU
E
HUDSON STREET
NEW MAIN STREET
WIL
LOW
STR
EET
BALDWIN PLACE
NEPPERHAN STREET
KA
RL
HO
YO S
TREE
T
MO
RG
AN
STREET
JOHN STREET
CROMWELL PLACE
HENRY HERZ STREET
BELL
STR
EET
MIL
L ST
REET
ENGINE PLACE
TERRACE PLACE
POPLAR STREET
JAMES STREET
ST. MARY STREET
COLUMBUS PLACE
MANOR HOUSE SQ.
WAVERLY PLACE
MAIN STREET
HUDSON STREET
ELM STREET
HAW
THO
RN
E AV
ENU
E
NEW
MA
IN STR
EETRIV
ERD
ALE
AVE
NU
E
SCH
OO
L ST
REE
T
PROSPECT STREET
PROSPECT STREET
LegendProposed TIF District Boundary
Poor Building Condition
Underutilized Building
Underutilized Lot
Vacant Building
Vacant Lot
SUBSTANDARD CONDITIONS IN STUDY AREA
Exhibit II-7
TIF FEASIBILITY STUDYCity of Yonkers, New York
Saccardi & Schiff, Inc. - Planning and Development Consultants
0 260’

2
Feasibility Study for the Proposed Municipal Redevelopment Area, City of Yonkers, NY
1
The area known as “Chicken Island,” in the center of the Study Area, is deteriorated and has been an underutilized municipal parking lot in recent decades. Signs of deterioration include eroded and cracked pavement.

Feasibility Study for the Proposed Municipal Redevelopment Area, City of Yonkers, NY
3
4
The single-story, shuttered building and fenced parking lot at the intersection of Buena Vista Avenue and Hudson Street is poorly maintained. In addition, the sidewalk and curbs are in poor condition as evidenced by cracking and jagged-ness of the cement.

Feasibility Study for the Proposed Municipal Redevelopment Area, City of Yonkers, NY
5
6
Two wood-frame residences remain on Hawthorne Avenue, with a shared garage in poor condition as evidenced by the sagging roof and unkept ground.

Feasibility Study for the Proposed Municipal Redevelopment Area, City of Yonkers, NY
7
8
At the corner of Prospect Street and Hawthorne Avenue, a vacant lot is used for tandem parking. Next door is a residence in sound condition but with evidence of neglect, as seen by overgrowth and storage of an abandoned car on-site.

Feasibility Study for the Proposed Municipal Redevelopment Area, City of Yonkers, NY
9
10
Vacant lots fronting on Prospect Street between Hawthorne and Buena Vista Avenues have collapsed fencing and dumping.

Feasibility Study for the Proposed Municipal Redevelopment Area, City of Yonkers, NY
11
12
Adjacent to one of the two remaining residences on Hawthorne Avenue is a vacant lot which is overgrown and lacking adequate sidewalks.

Feasibility Study for the Proposed Municipal Redevelopment Area, City of Yonkers, NY
13
14
The yards of former industrial buildings on Buena Vista Avenue near Hudson Street are strewn with trash.
A commercial building on Riverdale Avenue is vacant.

Feasibility Study for the Proposed Municipal Redevelopment Area, City of Yonkers, NY
15
16
The surrounding properties at the intersection of John and James Streets are somewhat neglected as evidenced by the cracks in the building faces and unkept lot.

Feasibility Study for the Proposed Municipal Redevelopment Area, City of Yonkers, NY
17
18
One-story retail buildings, a municipal parking garageand other uses front on New Main Street between Palisade and Nepperhan Avenues.

Feasibility Study for the Proposed Municipal Redevelopment Area, City of Yonkers, NY
19
20
Guion Street lacks adequate sidewalks, and adjacent properties appear to be neglected. Portions of the sidewalks and properties are overgrown and the sidewalks contain cracks.

Feasibility Study for the Proposed Municipal Redevelopment Area, City of Yonkers, NY
21
22
Properties on Morgan Street show signs of blight and deterioration as evi-denced by overgrown lots and cracks in the siding.

Feasibility Study for the Proposed Municipal Redevelopment Area, City of Yonkers, NY
23
24
School Street contains older industrial buildings, some vacant, with sidewalks and curbs in poor condition.

Feasibility Study for the Proposed Municipal Redevelopment Area, City of Yonkers, NY
25
26
The block contained by Maple Street, Waverly Street and Nepperhan Avenue is comprised of two residences and vacant lots. Site conditions are poor with over-grown lots and junk stored on-site.

Feasibility Study for the Proposed Municipal Redevelopment Area, City of Yonkers, NY
27
28
The parking lot at the intersection of Linden and Maple Streets is overgrown, and surrounding sidewalks and curbs are in poor condition. Sidewalks are over-grown and uneven.

Feasibility Study for the Proposed Municipal Redevelopment Area, City of Yonkers, NY
29
30
A wood-surfaced bridge structure crosses the Saw Mill River off of New School Street behind the fi re department headquarters. The bridge provides access to an isolated parcel that is used for parking and storage, and is unimproved.

Feasibility Study for the Proposed Municipal Redevelopment Area, City of Yonkers, NY
31
32
Buildings fronting on Nepperhan Avenue, near the intersection with Elm Street, show serious problems. The building’s facade contains sig-nifi cant damage and is deteriorated.
Small shuttered buildings on Riverdale Avenue are vacant and deteriorated, as evidenced by eroding siding and growth on the lot.

Saccardi & Schiff, Inc. III-1
III. MARKET FACTORS
The SFC Project will include a mix of retail, office, hotel, residential and entertainment uses. Market factors for each use are presented in this section with an emphasis on the market for retail and restaurant uses, analyzing the effects of the proposed development on other shopping areas in Yonkers, given the trade area’s purchasing power.
Retail Market Analysis
Retail Trade Areas and the Competitive Landscape
1. Consumer Markets and Trade Areas
The retail market demand analysis identifies two key trade areas that comprise the core group of consumers that will generate demand for goods and services at the SFC Project. The extent of each trade area is largely based on the potential scale of the SFC Project and the competitive landscape. The trade area analysis also reflects residential density, willingness to travel, physical barriers posed by the Hudson River and its bridges, and the north/south-oriented travel corridor in southern Westchester County. Specifically, the analysis considers the following factors to determine the extent of the trade areas: Number of households required to support the magnitude of retail development
proposed; Amount of time consumers are willing to travel for specific retail offerings; Modes of transportation and transportation routes in the local and regional area
(including consideration of traffic and congestion); and The competitive landscape, including the type and location of existing retail
establishments available to consumers. The trade areas for the SFC Project retail component are based on US Postal Service zip codes:
Those zip codes, which include residents living within about a five-minute drive from the site, are defined as the trade area for convenience goods purchases. Convenience purchases include groceries, health care products, or other regularly-purchased goods.
Those zip codes, which include residents living within about 15-minutes drive, excluding zip codes in White Plains and zip codes below 155th Street in Manhattan, are defined as the trade area for comparison goods. Comparison goods include electronics, clothing, sporting goods, or other goods for which shoppers are willing to travel further to get the right product or price.
Table III-1, “Trade Area by Retail Category” defines the extent of the trade area for each retail category considered by this analysis.

Market Factors
Saccardi & Schiff, Inc. III-2
Table III-1 Trade Area by Retail Category
a. Convenience Goods Trade Area Those zip codes located closest to the SFC Project contain the households that are most likely to travel to the SFC Project for convenience retail. Convenience retail, typically found in neighborhood shopping centers, relies on households making frequent trips to purchase goods for day-to-day consumption. This distinction applies to three of the ten retail categories analyzed, including food and beverage stores, health and personal care stores, and miscellaneous store retailers (e.g., florists, office supply store, pet/pet supply stores).
b. Comparison Goods Trade Area The Comparison Goods Trade Area is significantly larger than the Convenience Goods Trade Area and includes those households that are most likely to travel to the SFC Project for comparison purchases. Consumers are willing to travel longer distances to make purchases, which require a comparison of products and prices at a variety of stores. Seven of the ten retail categories considered by this analysis fit this description, including furniture and home furnishings stores; electronics and appliance stores; building material and garden equipment stores; clothing and clothing accessories stores; sporting goods, hobby, book, and music stores; general merchandise stores; and foodservice and drinking places.
Trade Area Definition Exhibit III-1, “Convenience and Comparison Goods Trade Areas” and Exhibit III- 2, “Convenience and Comparison Goods Trade Areas by Zip Code” graphically depict the two trade areas analyzed as part of this retail market study. As shown, the Convenience Goods Trade Area consists of four zip codes near the SFC Project. The Convenience Goods Trade Area includes those zip codes located within approximately five minutes drive from the SFC Project. The linear nature of the Convenience Goods Trade Area reflects the north/south transportation corridor along the Hudson River.
Retail CategoryConvenience Goods
Trade AreaComparison Goods
Trade Area
Furniture and Home Furnishings StoresElectronics and Appliance StoresBuilding Material, Garden Equip StoresFood and Beverage StoresHealth and Personal Care StoresClothing and Clothing Accessories StoresSporting Goods, Hobby, Book, Music StoresGeneral Merchandise StoresMiscellaneous Store RetailersFoodservice and Drinking Places
Source: Economics Research Associates

Market Factors
Saccardi & Schiff, Inc. III-3
The Comparison Goods Trade Area encompasses 38 zip codes within about 15 minutes drive from the SFC Project. Despite their proximity to the SFC site, zip codes in White Plains and zip codes south of 155th Street in Manhattan are excluded from the retail market analysis. White Plains residents are excluded from the trade area as consumers in this area will generally choose to do their shopping in downtown White Plains, given the availability of similar products. Households below 155th Street in Manhattan are excluded due the competitive retail landscape there and because these households have more limited access to private automobiles. Exhibit III-3, “Spheres of Influence – White Plains and Yonkers” presents the SFC Project’s trade areas in their locational context. The graphic depicts a sphere of influence for Yonkers and White Plains, based on a simple six-mile radius. As shown, the Comparison Goods Trade Area is tailored to exclude households living in zip codes that are fully within White Plains’ sphere of influence. Exhibit III-4, “Overlapping Trade Areas” presents the trade areas for retailers at Ridge Hill Village and the Cross County Shopping Center, as provided by leasing agents marketing these retail spaces. As shown, the trade areas for the Ridge Hill Village and Cross County Shopping Center are larger than the SFC Project’s trade area. The SFC Project trade area is entirely within both the Ridge Hill Village and Cross County Shopping Center trade areas. Table III-2, “Yonkers Market Sufficiency Test” provides the population density requirements for a number of top US retailers. The retailers included in Table III-2 are representative of the types of retailers that might be included at the SFC Project. However, this is not a tenant roster. The requirements show the population within a specified radius deemed necessary by the retailer to warrant selection of a site. According to Claritas, there are approximately 61,000 people within one mile, 201,000 people within three miles, 800,000 people within five miles, and 3.05 million people within 10 miles of the SFC Project area. These population counts are sufficient to make the SFC Project attractive to most retailers.

Market Factors
Saccardi & Schiff, Inc. III-4
Exhibit III-1 Convenience and Comparison Goods Trade Areas
Source: Economics Research Associates

Market Factors
Saccardi & Schiff, Inc. III-5
Exhibit III-2 Convenience and Comparison Goods Trade Areas by Zip Code
Source: Economics Research Associates

Market Factors
Saccardi & Schiff, Inc. III-6
Exhibit III-3 Spheres of Influence - White Plains and Yonkers
Source: Economics Research Associates
Interstate 87 / 287
Inte
rsta
te 9
5
Hutchinso
n
PrkwyBr
onx R
iver
Prkw
ySpra
in B
rook
Prk
wy
I-87
/ Saw
Mill
Prk
wy
Cross CountyPrkwy
Cross Bronx Prkwy
Interstate 87 / 287
Inte
rsta
te 9
5
Hutchinso
n
PrkwyBr
onx R
iver
Prkw
ySpra
in B
rook
Prk
wy
I-87
/ Saw
Mill
Prk
wy
Cross CountyPrkwy
Cross Bronx Prkwy

Market Factors
Saccardi & Schiff, Inc. III-7
Exhibit III-4 Overlapping Trade Areas
Source: Forest City Ratner Companies (Ridege Hill Village); Macerich (Cross County Shopping Center)
Ridge Hill Village Trade Area Cross County Center Trade AreaRidge Hill Village Trade Area Cross County Center Trade AreaRidge Hill Village Trade Area Cross County Center Trade Area

Market Factors
Saccardi & Schiff, Inc. III-8
Table III-2 Market Sufficiency Based on Population Density
Retail Category/ Retailer
Population Requirement
Market Area Radius
Market Sufficiency
Apparel
Body Shop 200,000 3-mileBurlington Coat Factory 250,000 5-mileFashion Bug 100,000 5-mileChico's 150,000 5-mileDress Barn 100,000 3-mileEddie Bauer 600,000 10-mileForever 21 350,000 5-mileJ.Crew 350,000 10-mileMen's Warehouse 225,000 5-milePacific Sunware 300,000 3-mile -
Shoes
The Athlete's Foot 50,000 3-mileEasy Spirit 400,000 5-milePayless ShoeSource 60,000 3-mile
Restaurants
Applebee's 35,000 5-mileAu Bon Pain 50,000 3-mileBaskin-Robbins 20,000 1-mileBen & Jerry's 50,000 3-mileBoston Market 40,000 3-mileBruegger's Bagel Bakery 15,000 3-mileCalifornia Pizza Kitchen 250,000 5-mileCheesecake Factory 250,000 5-mileChevy's Fresh Mex 250,000 5-mileChipotle Mexican Grill 15,000 3-mileChurch's Chicken 20,000 3-mileCinnabon 65,000 3-mileCosi 60,000 1-mileDunkin' Doughnuts 15,000 1-mileIHOP 37,500 3-mileLitt le Ceasar's 25,000 3-mileBennigan's 75,000 5-mileOutback Steak House 70,000 5-milePanera Bread 50,000 3-milePapa Gino's 30,000 3-milePizza Hut 20,000 1-mileQuizno's 45,000 3-mileTaco Bell 25,000 3-milePizzaria Uno 75,000 5-mileWendy's 20,000 3-mile
Supermarkets
Whole Foods 130,000 3-mile
Department Stores
Lord & Taylor 250,000 10-mileStein Mart 150,000 5-mile
Source: Economics Research Associates
Market Factors
Saccardi & Schiff, Inc. III-9
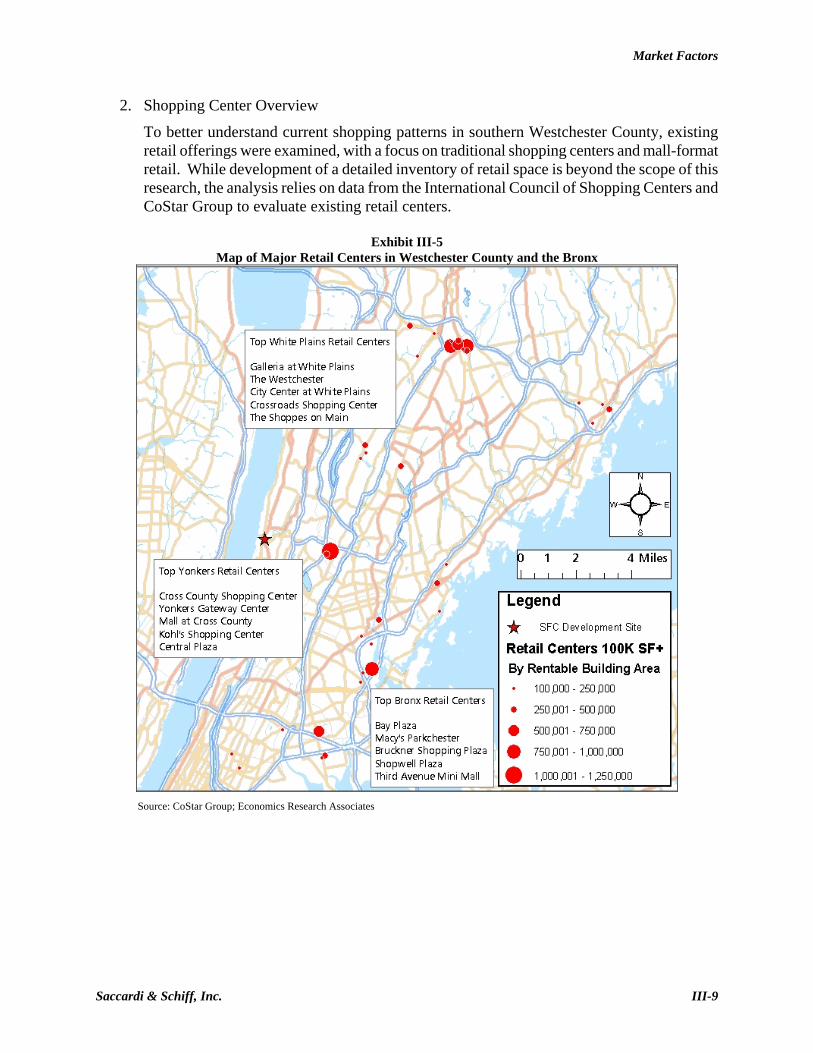
2. Shopping Center Overview
To better understand current shopping patterns in southern Westchester County, existing retail offerings were examined, with a focus on traditional shopping centers and mall-format retail. While development of a detailed inventory of retail space is beyond the scope of this research, the analysis relies on data from the International Council of Shopping Centers and CoStar Group to evaluate existing retail centers.
Exhibit III-5 Map of Major Retail Centers in Westchester County and the Bronx
Source: CoStar Group; Economics Research Associates

Market Factors
Saccardi & Schiff, Inc. III-10
Table III-3 Major Retail Centers in Westchester County and the Bronx
Center Name City Anchor Tenants RBA1
Cross County Shopping Center YonkersMacy's, Sears, Cross County Mult iplex Theaters 1,190,000
Galleria at White Plains White Plains H&M, Macy's, Old Navy, Sears 900,000
Bay Plaza BronxJC Penney, Big Kmart, Pathmark, AMC Theatres 900,000
The Westchester White Plains Neiman Marcus, Nordstrom 827,695
Cortlandt Towne Center Mohegan LakeA&P, Home Depot, Linens-N-Things, UA Cinema, Wal-Mart 642,354
Jefferson Valley Mall Yorktown HeightsH&M, Macy's, Sears, Trademark Cinemas 588,385
City Center At White Plains White PlainsBarnes & Noble, Circuit City, Filene's Basement, NA Cinema, Target 547,434
Macy's-Parkchester Bronx Macy's 520,000
Yonkers Gateway Center YonkersBest Buy, Levitz Furniture, Pathmark, Movieland 1234 500,000
Bruckner Plaza Shopping Center Bronx Kmart, Toys-R-Us, Modell's, Old Navy 498,480 New Roc City New Rochelle New Roc Family Entertainment Center 466,076 Vernon Hills Shopping Center Scarsdale Lord & Taylor 350,000 Crossroads Shopping Center White Plains A&P, Kmart, Modell's Sporting Goods 310,644
Waterfront at Port Chester Port ChesterBest Buy, Bed, Bath & Beyond, Target, TJ Maxx 294,868
The Shoppes On Main White Plains Wal-Mart 275,169 The Source at White Plains White Plains Fortunoff, Whole Foods Market 270,000
Mall at Cross County YonkersCircuit City, National Wholesale Liquidators, Sports Authority, TJ Maxx 263,567
Port Chester Shopping Center Port ChesterA&P, Kohl's, Linens-N-Things, Modell's Sporting Goods 250,000
River Plaza Bronx Target, Marshalls 235,000 Pelham Manor Shopping Plaza Pelham Home Depot 234,822 Concourse Plaza Bronx National Amusements Cinema 228,638 Shopwell Plaza Bronx Basha Furniture 225,000 Beach Shopping Center Peekskill Super Stop & Shop 220,915 Mt. Kisco Commons Mount Kisco A&P, Target 217,133 Triangle Shopping Center Yorktown Heights TJ Maxx 208,000 Midway Shopping Center Scarsdale Linens-N-Things, CVS 295,000 Staples Plaza Yorktown Heights Bed Bath & Beyond, BJs, Staples 220,000
Dalewood Shopping Center HartsdaleChristmas Tree Shops, Pathmark, TJ Maxx 189,285
Yorktown Green Shopping Center Yorktown Heights Food Emporium 187,000
The Westchester Pavilion White PlainsDaffy's, The Sports Authority, Toys-R-Us 185,242
Third Avenue Mini Mall Bronx Conway Stores 175,197 Kohls Shopping Center Yonkers Petco, Kohl's 175,000 Shops at Gun Hill Road Bronx Home Depot 152,000
Central Plaza YonkersBest Buy, Burlington Coat Factory, DSW Shoe Warehouse, Gap 151,055
Peartree Square Shopping Plaza Bronx National Wholesale Liquidators 150,000
Source: CoStar Group; Internat ional Council of Shopping Centers; Economics Research Associates
1 Rentable Building Area in square feet.

Market Factors
Saccardi & Schiff, Inc. III-11
a. Retail Centers in Yonkers Cross County Shopping Center (Value and Mid-market Offerings) Developed in 1954, Cross County Shopping Center was one of the first open-air shopping malls in the nation. The center is anchored by Macy’s, Sears, a movie theater, and Super Stop & Shop supermarket. The center includes other national tenants, such as GAP, Express, and more recently, Old Navy. The Cross County Shopping Center is currently approximately 1.2 million square feet in size. In February 2006, Brook Shopping Center LLC completed the Final Environmental Impact Statement (FEIS) detailing the proposed expansion of the Cross County Shopping Center. It is expected that the proposed expansion, which calls for 245,000 square feet of new retail and restaurant space, will be approved in the near future. Under the plan, Macy’s will add 50,000 square feet and Sears will add 11,400 square feet. Additional improvements include a five-story parking garage containing over 1,900 spaces. The Mall at Cross County (Value and Mid-market Offerings) To the south of the Cross County Shopping Center is the Mall at Cross County. This mall, opened in 1986 and expanded in 1997, currently contains over 260,000 square feet of retail space. Tenants include Circuit City, TJ Maxx, Sports Authority, and National Wholesale Liquidators, as well as smaller-format retail stores including LensCrafters and GNC. Central Park Avenue (Value and Mid-market Offerings) Central Park Avenue in Yonkers is characterized by a typical commercial strip development pattern with a combination of strip-mall shopping centers and stand-alone stores. Surface parking lots are generally located between the roadway and the retail stores. The Yonkers Gateway Center is the largest shopping center on Central Avenue in Yonkers. Located near the Greenburgh town line, the Gateway Center consist of roughly 500,000 square feet of space containing a combination of big-box tenants, such as Burlington Coat Factory, Best Buy, Levitz Furniture and DSW, as well as in-line tenants, including Radio Shack, Payless ShoeSource, and Hallmark. Also, there is a 23,000-square-foot, six-screen, United Artists cinema at the rear corner of the site. Other significant centers along Central Park Avenue in Yonkers include Central Plaza and the Kohl’s Shopping Center. Central Plaza consists of about 150,000 square feet of retail space. The center is anchored by a 17,500-square-foot, four-screen, Clearview Cinema and a Barnes and Noble Booksellers store. The Kohl’s Shopping Center consists of about 175,000 square feet and includes Kohl’s, Regency Furniture, Petco, and Pearl Vision. Located just north of the Yonkers city line, the Midway Shopping Center is about 295,000 square feet in size. The center is anchored by Linens ‘n Things and includes a CVS and The Door Store.

Market Factors
Saccardi & Schiff, Inc. III-12
b. Retail Centers in White Plains Downtown White Plains has emerged as a hub of retail activity for central Westchester County. Much of the retail space is located within several indoor shopping centers, including the Galleria at White Plains, The Westchester, and City Center at White Plains. Bloomingdales, Fortunoff, and Wal-Mart also have stores in White Plains. The Galleria at White Plains (Mid-market Offerings) The Galleria at White Plains is a 900,000-square-foot, mid-market shopping center that features anchor tenants including H&M, Macy’s, Old Navy, and Sears. The Westchester (Up-market and Luxury Offerings) The Westchester is an 827,695-square-foot shopping mall with high-end retailers including Neiman Marcus, Nordstrom, Tiffany, Louis Vuitton, Coach, Mark Jacobs and Gucci, in addition to other tenants such as Abercrombie and Fitch, Restoration Hardware, and the Apple Store. City Center at White Plains (Value and Mid-market Offerings) City Center at White Plains is a 1.1 million-square-foot mixed-use project including national retail tenants such as Target, Filene’s Basement, Circuit City, and Barnes and Noble Booksellers. In addition, there are destination restaurants including Zanaros and Legal Seafood as well as a 15-screen cinema.
c. Other Retail Centers in Westchester County Cortlandt Towne Center (Value and Mid-market Offerings) Cortlandt Towne Center is a 642,354-square-foot power center in Mohegan Lake that features an A&P supermarket and big-box retailers such as Home Depot, Linens ‘n Things, and Wal-Mart. There is also a United Artists Cinema on site. Jefferson Valley Mall (Value and Mid-market Offerings) Jefferson Valley Mall is a 588,385-square-foot traditional shopping mall in Yorktown Heights that is anchored by H&M, Macy’s, and Sears, in addition to Trademark Cinemas. Stew Leonards (Mid-market Offerings) Stew Leonards is a big-box supermarket located at a site near Austin Avenue, off of the New York State Thruway, in Yonkers. The 122,000-square-foot store is part of larger retail complex that also includes a 103,000-square-foot Home Depot and a 135,000-square-foot Costco. Other Big-Box Retail Locations (Value and Mid-market Offerings) Retail development near Weyman Avenue in New Rochelle, off of Route 95, includes Home Depot and Costco. In Mt. Vernon, retail development on East Sandford Boulevard, off of the Hutchinson River Parkway, includes Target, Best Buy, and TJ Maxx.

Market Factors
Saccardi & Schiff, Inc. III-13
d. Retail Centers in the Bronx Bay Plaza (Value and Mid-market Offerings) Near Co-op City, Bay Plaza is a 900,000 square foot shopping center comprised of big-box anchors and a strip-mall-style corridor of smaller, in-line tenants. The center’s anchor tenants include JC Penney, Big Kmart, and a Pathmark supermarket. Other major retailers include Marshall’s, PC Richards, Toys “R” Us, Linens ‘n Things, Modell’s Sporting Goods, Staples, Barnes & Noble, and Old Navy. The shopping center also includes a 13-screen movie theater. Parkchester Retail District (Mid-market Offerings) Located in the Parkchester section of The Bronx, this shopping complex was built between 1938 and 1942 by MetLife as part of its Parkchester development. Macy’s opened its first branch outside Manhattan at the site in the 1940s, and the department store remains the retail center’s anchor tenant. Bruckner Plaza Shopping Center (Value and Mid-market Offerings) Bruckner Plaza Shopping Center is a 498,480 square foot center anchored by Kmart and Toys “R” Us. Other tenants include Modell’s Sporting Goods, Old Navy, and Key Foods. Other Big-Box Retail Locations (Value and Mid-market Offerings) Target has a location on West 225th Street, near Riverdale, in the southwestern Bronx. Sears has a store near East Fordham Road, centrally located within the Bronx. Home Depot has two locations in the eastern Bronx, one to the north near Route 95 and the other to the south, near the Bruckner Expressway. In addition to the location at Bay Plaza, Marshall’s has a store in the southwestern Bronx at River Plaza, near Route 87.

Market Factors
Saccardi & Schiff, Inc. III-14
3. Competing Retailers
A map depicting the location of retailers that are likely to be tenants at the SFC Project shows that these retailers are not currently found in or around downtown Yonkers.
Exhibit III-6 Competitive Landscape
Source: Economics Research Associates
Retail Demand Analysis The retail demand model relies on household spending and current retail sales data to calculate supportable retail square footage within the trade areas. The basic outline of the model is as follows:
Project trade area spending potential in 2011; Estimate current trade area sales volume; Determine unmet spending potential; Evaluate sales productivity (sales per square foot); and Calculate supportable square footage from unmet spending potential.

Market Factors
Saccardi & Schiff, Inc. III-15
4. Household Expenditure Potential
Table III-4, “Trade Area Households” presents historical and projected trends in household growth within the Convenience Goods Trade Area and the Comparison Goods Trade Area, 2000 through 2011. As shown, Claritas reports that there are currently about 53,000 households in the Convenience Goods Trade Area and almost 588,000 households in the Comparison Goods Trade Area. Based on the planned residential development projects in Downtown Yonkers presented in Table III-5, “Planned Residential Projects in Downtown Yonkers” it is estimated that the number of households in the Convenience Goods Trade Area will grow to over 55,800 by 2011.9 Based on analysis of demographic trends, Claritas projects there will be about 595,000 households living in the Comparison Goods Trade Area by 2011.
Table III-4 Trade Area Households
Table III-5 Planned Residential Development Projects in Downtown Yonkers1
9 The analysis assumes that the proposed development projects included in Table III-4 will be completed by 2011.
Trade Area 2000 2006 2011 1 2000-2006 2006-2011
Convenience Goods Trade Area 53,740 53,054 55,839 -0.2% 1.0%Comparison Goods Trade Area 577,910 587,682 595,001 0.3% 0.2%
Source: Claritas; Economics Research Associates
Annualized Growth
1 Projected household growth in the Covenience Goods Trade Area assumes that planned residential development projects there are 95 percent occupied by 2011. Claritas provides data concerning projected household growth in the Comparison Goods Trade Area.
Project Name Units
River Park Center 950Palisades Point 436Buena Vista Phase 2 60Stan-Lou Building 15Old Furniture Storage/Cooks 12Main Street Lofts 171Collins Phase 2 312Greystone/North Broadway Lofts 100Ginsburg 353Yonkers Green 124179 Riverdale Avenue 831077 Warburton Avenue 71Ashburton Ave Redevelopment 2 245Total 2,932
Source: Struever Fidelco Cappelli LLC; Saccardi & Schiff;Economics Research Associates1 Includes those planned residential projects in Downtown Yonkers with pending approvals.2 The Ashburton Avenue Redevelopment replaces 552 units of public housing with 797 new units. This table presents the net increase of 245 housing units at tributable to this project .

Market Factors
Saccardi & Schiff, Inc. III-16
The analysis estimates the future retail expenditure potential of households in the trade areas (i.e., dollars available to be spent on the ten retail categories) using 2006 consumer spending data and the projected number of trade area households in 2011, and based on the conservative assumption that spending potential remains constant, in real dollars, in the future. By 2011, households in the trade areas will have the potential to spend approximately $8.39 billion (2006$) on retail purchases each year. Table III-6, “Household Expenditure Potential by 2011 (2006$)” presents the average and aggregate household expenditure potential in each of the ten retail categories analyzed. As shown, the projections indicate that there will be over $410 million in convenience-goods expenditure potential and nearly $7.98 billion in comparison-goods expenditure potential by 2011.
Table III-6 Household Expenditure Potential by 2011 (2006$)
Retail Category Average Aggregate
Convenience Goods Trade Area
Food and Beverage Stores 4,819$ 269,072,157$ Health and Personal Care Stores 1,680 93,801,556 Miscellaneous Store Retailers 860 48,013,307 Convenience Goods Trade Area Total 7,358$ 410,887,021$
Comparison Goods Trade Area
Furniture and Home Furnishings Stores 708$ 421,373,658$ Electronics and Appliance Stores 748 445,152,956 Building Material, Garden Equip Stores 2,149 1,278,679,331 Clothing and Clothing Accessories Stores 1,729 1,028,621,812 Sport ing Goods, Hobby, Book, Music Stores 544 323,799,186 General Merchandise Stores 4,205 2,501,755,151 Foodservice and Drinking Places 3,328 1,980,372,212 Comparison Goods Trade Area Total 13,411$ 7,979,754,308$
Combined Trade Area Total 20,770$ 8,390,641,328$
Source: Claritas; Economics Research Associates
Household Expenditure Potential
5. Current Retail Sales
In order to determine market potential for new retail space, the retail demand model assesses current retail sales in the trade areas based on 2006 data from Claritas. Table III-7, “Retail Sales in 2006” presents retail sales in the Convenience and Comparison Goods Trade Areas in 2006. As shown, retail sales at food and beverage stores, health and personal cares stores, and miscellaneous retailers within the Convenience Goods Trade Area total about $319 million each year. Retail sales at furniture and home furnishings stores, electronics and appliance stores, building material and garden equipment stores, clothing and clothing accessories stores, sporting goods, hobby, book, and music stores, general merchandise stores, and foodservice and drinking places within the Comparison Goods Trade Area total about $5.14 billion annually.

Market Factors
Saccardi & Schiff, Inc. III-17
Table III-7 Retail Sales in 2006
Retail Category Retail Sales 2006
Convenience Good Trade Area
Food and Beverage Stores 201,626,346$ Health and Personal Care Stores 95,834,895 Miscellaneous Store Retailers 21,502,588 Convenience Good Trade Area Total 318,963,829$
Comparison Good Trade Area
Furniture and Home Furnishings Stores 347,810,036$ Electronics and Appliance Stores 286,700,459 Building Material, Garden Equip Stores 870,239,127 Clothing and Clothing Accessories Stores 933,647,872 Sporting Goods, Hobby, Book, Music Stores 197,276,893 General Merchandise Stores 1,462,044,958 Foodservice and Drinking Places 1,045,478,264 Comparison Good Trade Area Total 5,143,197,609$
Combined Trade Area Total 5,462,161,438$
Source: Claritas; Economics Research Associates
6. Leakage of Retail Sales
In order to determine the amount of unmet spending potential in the trade areas, household expenditure potential in 2011 is compared to existing sales within each retail category. The difference between expenditure potential and current sales (when expenditure potential exceeds current sales) represents the sales leakage that might be captured by new and existing retailers. Table III-8, “Unmet Expenditure Potential by 2011 (2006$) presents the projected retail leakage from the Convenience Goods and Comparison Goods Trade Areas by 2011.

Market Factors
Saccardi & Schiff, Inc. III-18
Table III-8 Unmet Expenditure Potential by 2011 (2006$)
Retail CategoryAggregate
Expenditure Potential Current Retail SalesUnmet Expenditure
Potential(a) (b) (c) = (a) - (b)
Convenience Goods Trade Area
Food and Beverage Stores 269,072,157$ 201,626,346$ 67,445,811$ Health and Personal Care Stores 93,801,556 95,834,895 - Miscellaneous Store Retailers 48,013,307 21,502,588 26,510,719 Convenience Goods Trade Area Total 410,887,021$ 318,963,829$ 93,956,530$
Comparison Goods Trade Area
Furniture and Home Furnishings Stores 421,373,658$ 347,810,036$ 73,563,622$ Electronics and Appliance Stores 445,152,956 286,700,459 158,452,497 Building Material, Garden Equip Stores 1,278,679,331 870,239,127 408,440,204 Clothing and Clothing Accessories Stores 1,028,621,812 933,647,872 94,973,940 Sporting Goods, Hobby, Book, Music Stores 323,799,186 197,276,893 126,522,293 General Merchandise Stores 2,501,755,151 1,462,044,958 1,039,710,193 Foodservice and Drinking Places 1,980,372,212 1,045,478,264 934,893,948 Comparison Goods Trade Area Total 7,979,754,308$ 5,143,197,609$ 2,836,556,699$
Combined Trade Area Total 8,390,641,328$ 5,462,161,438$ 2,930,513,229$
Source: Claritas; Economics Research Associates

Market Factors
Saccardi & Schiff, Inc. III-19
7. Sales Productivity
Adjusted unmet retail sales are converted to an estimate of supportable square footage using sales data regarding productivity per square foot, by retail category. The analysis relies on industry standards published in the Urban Land Institute’s Dollars & Cents of Shopping Centers 2006. Low and high estimates of productivity show the range in sales per square foot that might be achieved at the SFC Project. The low estimates reflect the median sales productivity for regional shopping centers across the United States. The high estimate reflects the sales productivity premium achieved by the top tier (i.e., top ten percent) of US retail tenants. The retail market analysis relies on the midpoint estimates presented in Table III-9, “Sales Productivity (Annual Sales Per Square Foot, 2006$) to calculate unmet demand for retail space.
Table III-9 Sales Productivity (Annual Sales Per Square Foot, 2006$)
8. Estimate of Unmet Demand for Retail Space
Table III-10, “Optimistic Estimate of Unmet Retail Development Potential by 2011” and Table III-11, “Conservative Estimate of Unmet Retail Development Potential by 2011” present the optimistic and conservative estimates of unmet retail potential, respectively. The optimistic estimate assumes that all households in the trade areas have access to the SFC Project. The conservative estimate assumes that access to the SFC Project from outlying areas within the Comparison Goods Trade Area will require an automobile, thus reducing potential unmet expenditure potential and demand for retail space. Both the conservative and optimistic estimates indicate that there is sufficient unmet demand for retail space to accommodate SFC Project retail and additional retail projects proposed within the trade areas. Additional retail development proposals within the trade areas include Ridge Hill Village (1.2 million square feet of retail), the Cross County Shopping Center expansion (245,000 square feet of retail), and the potential development on Tuckahoe Road (at the Mark Buick site) of 375,000 square feet of retail.
Retail CategoryUS
Median MidpointUpper Decile
Furniture and Home Furnishings Stores $227 $326 $425Electronics and Appliance Stores $319 $458 $597Building Material, Garden Equip Stores $315 $452 $589Food and Beverage Stores $362 $520 $677Health and Personal Care Stores $439 $631 $822Clothing and Clothing Accessories Stores $312 $449 $585Sporting Goods, Hobby, Musical Instrument Stores $224 $322 $420General Merchandise Stores $158 $226 $295Miscellaneous Store Retailers $207 $297 $388Foodservice and Drinking Places $421 $604 $788
Source: Urban Land Inst itute; Economics Research Associates

Market Factors
Saccardi & Schiff, Inc. III-20
a. Optimistic Estimate of Unmet Demand for Retail Space As shown in Table III-10, the projected spending leakage of approximately $2.93 billion within the trade areas in 2011 indicates unmet demand for about 8.4 million square feet of retail space. This estimate is considered optimistic because it assumes that all households in the trade areas will have access to retail offerings throughout the trade areas.
b. Conservative Estimate of Unmet Demand for Retail Space
To develop a conservative estimate of supportable square footage of new retail space in the Trade Area, potential transportation access constraints were evaluated. Households within the Convenience Goods Trade Area have access to the SFC Project by foot, bicycle, automobile, or the Westchester County Bus System. However, it is anticipated that households located outside of the Convenience Goods Trade Area will generally use a private vehicle to visit the SFC Project, as public transit is more limited in outlying areas. To account for varying access to the SFC Project, the conservative estimate of unmet demand for retail space relies on zip-code-level vehicle ownership data from Census 2000 to calculate that 47.8 percent of households within the Comparison Goods Trade Area will have access to the SFC Project. As shown in Table III-11, spending potential attributable to households without access to the SFC Project is excluded from the conservative estimate of unmet retail demand. Adjusting unmet expenditure potential to reflect access to an automobile reduces unmet expenditure potential to $1.45 billion. This conservative estimate of unmet expenditure potential translates to unmet demand for approximately 4.1 million square feet of retail space.

Market Factors
Saccardi & Schiff, Inc. III-21
Table III-10 Estimate of Unmet Retail Potential (2011)
Retail Category
Optimistic Unmet Expenditure Potential
Retail Productivity1
Optimistic Unmet Retail Potential (SF)
(a) (b) (c) = (a) / (b)
Convenience Goods Trade Area
Food and Beverage Stores 67,445,811$ $520 129,786 Health and Personal Care Stores - $631 - Miscellaneous Store Retailers 26,510,719 $297 89,116 Convenience Goods Trade Area Total 93,956,530$ 218,902
Comparison Goods Trade Area
Furniture and Home Furnishings Stores 73,563,622$ $326 225,633 Electronics and Appliance Stores 158,452,497 $458 345,860 Building Material, Garden Equip Stores 408,440,204 $452 903,411 Clothing and Clothing Accessories Stores 94,973,940 $449 211,662 Sporting Goods, Hobby, Book, Music Stores 126,522,293 $322 392,754 General Merchandise Stores 1,039,710,193 $226 4,591,067 Foodservice and Drinking Places 934,893,948 $604 1,547,534 Comparison Goods Trade Area Total 2,836,556,699$ 8,217,921
Combined Trade Area Total 2,930,513,229$ 8,436,822
Source: Claritas, Inc.; Economics Research Associates
1 Sales productivity is reported as gross revenue per square foot

Market Factors
Saccardi & Schiff, Inc. III-22
Retail CategoryOptimistic Unmet
Expenditure PotentialAccess to SFC Site1
Conservative Unmet Expenditure Potential
Retail Productivity1
Conservative Unmet Retail Potential (SF)
(a) (b) (c) = (a) x (b) (d) (e) = (c) / (d)
Convenience Goods Trade Area
Food and Beverage Stores 67,445,811$ 100% 67,445,811$ $520 129,786 Health and Personal Care Stores - 100% - $631 - Miscellaneous Store Retailers 26,510,719 100% 26,510,719 $297 89,116 Convenience Goods Trade Area Total 93,956,530$ 93,956,530$ 218,902
Comparison Goods Trade Area
Furniture and Home Furnishings Stores 73,563,622$ 47.8% 35,163,411$ $326 107,852 Electronics and Appliance Stores 158,452,497 47.8% 75,740,294 $458 165,321 Building Material, Garden Equip Stores 408,440,204 47.8% 195,234,417 $452 431,830 Clothing and Clothing Accessories Stores 94,973,940 47.8% 45,397,544 $449 101,174 Sporting Goods, Hobby, Book, Music Stores 126,522,293 47.8% 60,477,656 $322 187,737 General Merchandise Stores 1,039,710,193 47.8% 496,981,472 $226 2,194,530 Foodservice and Drinking Places 934,893,948 47.8% 446,879,307 $604 739,721 Comparison Goods Trade Area Total 2,836,556,699$ 1,355,874,102$ 3,928,166
Combined Trade Area Total 2,930,513,229$ 1,449,830,632$ 4,147,068
Source: Claritas, Inc.; Economics Research Associates1 The conservat ive est imate of unmet spending potent ial reflects the conservat ive assumption that trade area households located outside the Comparison Goods Trade Area must have access to an automobile in order to visit the SFC site. The Convenience Good Trade Area is well-served by the Westchester County Bus System and thus residents within this Trade Area have convenient access to the SFC site. However, access to the SFC site from out lying areas within the Comparison Goods Trade Area will require an automobile. The conservat ive est imate of unmet spending potent ial relies on vehicle usage data from Census 2000 (zip code level) to determine the proport ion of households that have access to the site from the Comparison Goods Trade Area.
Table III-11 Conservative Estimate of Unmet Retail Development Potential by 2011

Market Factors
Saccardi & Schiff, Inc. III-23
9. Required Capture of Unmet Demand
Table III-12, “Required Capture of Unmet Retail Potential” presents the conservative and optimistic estimates of unmet demand for retail space in the trade areas, compares potential unmet demand to the proposed SFC Project retail program, and calculates what capture of unmet demand must be achieved to support the proposed program. As shown, proposed food and beverage stores at the SFC Project would need to capture about 70 percent of unmet demand from the Convenience Goods Trade Area. Comparison-goods stores at the SFC Project would need to capture between 5 percent and 30 percent of unmet demand from the Comparison Goods Trade Area, depending on the specific retail store type. Overall, the SFC Project retail program must capture between 7 percent and 14 percent of total unmet demand, across all retail categories. Site characteristics, including proximity to residential populations and ease of access, as well as the current and future competitive landscape within the trade areas suggest that a significant share of the estimated unmet retail potential could be captured at the SFC Project. Assuming that the SFC Project retail component achieves a unique and attractive tenant mix and that the revitalization of downtown Yonkers elevates the visibility of the area, it is very reasonable to expect that the SFC Project could capture 70 percent of unmet demand in the Convenience Goods Trade Area and 30 percent of unmet demand in the Comparison Goods Trade Area. It is anticipated that the convenience retail offerings at the SFC Project will attract a high proportion of households from the Convenience Goods Trade Area. The successful capture of unmet demand will result from the selection of retailers that are uniquely positioned in the market. That is, differentiation from existing retailers in the area will allow SFC Project convenience goods retailers to capture sales that would otherwise occur elsewhere. In addition, it is expected that SFC Project convenience goods retailers will target new households locating at the SFC Project and in downtown Yonkers.
Comparison retail will benefit from visitation to the proposed ballpark and cinema. These attractions will draw consumers from throughout the Comparison Goods Trade Area. Customers will dine and shop before and after events at the SFC Project. Further, the hotel component of the SFC Project will attract additional visitors that will make purchases at the Project’s retail establishments. The retail offerings, in combination with the on-site entertainment and hotel, will create a vibrant destination that will attract more consumers than the retail would alone. Additionally, the retail component will provide a greater awareness and potential customer base for the ballpark and hotel. The variety of activities (i.e., shopping, dining, event going, etc.) and the on-site lodging will encourage customers to spend more time at the SFC Project. The ballpark, restaurants, and hotel will keep the project area active during later evening hours, when other retail centers have closed for the day. The increased customer time spent at the SFC Project significantly improves the revenue potential of the retail establishments there. The SFC Project will be a special place where the mix of uses creates a unique experience

Market Factors
Saccardi & Schiff, Inc. III-24
not currently found in the New York metropolitan area. The diversity of offerings and the mix of uses will have broad appeal, thereby maximizing potential synergies (e.g., cross marketing) and patronage. As evidenced by the successful development of stadium projects around the US, a ballpark in downtown Yonkers, in combination with mixed-use development, will promote revitalization of the area. In Columbus, Ohio, for example, a new sports franchise and an arena have been the drivers of a downtown revival. The Columbus project has been cited as an example of successful “mixed-use master planning that can result in a critical mass of sports, entertainment, commercial, and residential uses.”10 In Columbus, “the creation of a residential neighborhood helped activate the Arena District 24/7 and increased traffic to the restaurants, entertainment venues, and service retailers.”11 “With restaurants, shops, and special events year round, the area is a magnet for people.”12
It is anticipated that the SFC Project will act as a catalyst that improves public perception of downtown Yonkers. The SFC Project will build on redevelopment projects that have already begun on the waterfront in downtown Yonkers, including residential, retail, and office development. The revitalization of downtown Yonkers will increase the popularity area as a destination, thus increasing the potential for SFC Project retailers to capture sales. The amenities offered as part of the SFC Project, including the “riverwalk,” hotel and the ballpark will enhance the area’s competitive position, attracting additional visitors, as well as new residents and employees who will utilize the new retail facilities.
10 Stein, David F., Entertaining Entertainment Districts, Urban Land, January 2007. 11 Ibid. 12 Ibid.

Market Factors
Saccardi & Schiff, Inc. III-25
Table III-12 Required Capture of Unmet Retail Potential
ProposedRetail Category Conservative Optimistic Program (SF) Low High
Convenience Goods Trade Area
Food and Beverage Stores 129,786 129,786 90,000 69% 69%Health and Personal Care Stores 7,417 7,417 - 0% 0%Miscellaneous Store Retailers 89,116 89,116 - 0% 0%Convenience Goods Trade Area Total 226,318 226,318 90,000 40% 40%
Comparison Goods Trade Area
Furniture and Home Furnishings Stores 107,852 225,633 30,000 13% 28%Electronics and Appliance Stores 165,321 345,860 30,000 9% 18%Building Material, Garden Equip Stores 431,830 903,411 - 0% 0%Clothing and Clothing Accessories Stores 101,174 211,662 30,000 14% 30%Sporting Goods, Hobby, Book, Music Stores 187,737 392,754 33,000 8% 18%General Merchandise Stores 2,194,530 4,591,067 250,000 5% 11%Foodservice and Drinking Places 739,721 1,547,534 100,000 6% 14%Comparison Goods Trade Area Total 3,928,166 8,217,921 473,000 6% 12%
Combined Trade Area Total 4,154,485 8,444,239 563,000 7% 14%
Source: Economics Research Associates
Estimated Unmet Retail Potential (SF)
Required SFC Capture Rate
10. Retail Rents
Retail rents in Yonkers vary significantly based on locational factors and the characteristics of the space. Through an informal survey of real estate brokerages and leasing agents, it has been determined that asking rents for good- to high-quality retail space in Yonkers range from about $30 to $150 per square foot (net) annually. Lower asking rents were observed in downtown Yonkers, which has not historically been
a shopping destination. Retail spaces ranging from about 2,500 to 25,000 square feet are available for about $30 on Main Street.
On Central Avenue in Yonkers, asking rents range from $35 to $50 per square foot annually. These retail spaces are contained within strip mall centers and range from less than 1,000 square feet to 2,500 square feet.
At the Cross County Shopping Center, retail rents range from about $65 to $80 per square foot annually. An apparel retailer would pay about $75 per square foot for a well-positioned 3,000 square-foot store. Larger-format tenants would pay about $70 for an 11,000 square foot space.
The highest asking rents in Yonkers are at Ridge Hill Village, which is slated to open in 2009. Rents there range from about $65 to $150 annually. Some retailers will also pay a percentage of their annual sales, in addition to the fixed rent. A typical retailer at Ridge Hill Village would pay about $75 per square foot annually for a 3,000 square foot space.
Based on available information, retail rents of $50 and higher could be achieved at the SFC Project. As discussed above, retail centers in highly competitive areas within Yonkers are

Market Factors
Saccardi & Schiff, Inc. III-26
achieving lease rates of about $75. Due to the a location off the most heavily traveled vehicular corridors in southern
Westchester County, rents at the SFC Project will be slightly less. However, retail lease rates at the SFC Project will be significantly greater than current
rates in downtown Yonkers. It is anticipated that the proposed SFC Project will transform downtown Yonkers into an entertainment and shopping destination. The depth of the trade area, breadth of retail offerings, and potential for incidental shopping visits will make the SFC Project very attractive to a variety of retailers.
Other SFC Project Components
11. Office
Office uses within the Study Area are primarily limited to the upper floors of downtown Yonkers commercial buildings. The CBRE Market View for Westchester County (1st Quarter 2006) estimated that there is only 2.5 million square feet of office space in the “South” market segment that includes Yonkers as well as Bronxville, Larchmont, Mamaroneck, Mt. Vernon, New Rochelle, and Pelham. The total amount of space in this large geographic area is only 7.7% of the entire inventory in Westchester County. Much of the office space in the County is centered around the White Plains Central Business District and the area to the east of White Plains.
The leasing activity in Yonkers for the most part is dictated by corporate decision-making, which results in larger transactions. The vast majority of these larger spaces are located well beyond the Study Area in and around Executive Boulevard, approximately three miles north of the Study Area. The proposed SFC Project is expected to add 532,7000 square feet of new office space, including the relocation of existing City offices. Cushman and Wakefield reviewed the proposal development and opined that: “the commercial space planned by SFC will be successful due to Yonkers’ exceptional location, strength of the market and ability to draw employees”. See Appendix for two Cushman and Wakefield reports, including responses to specific concerns raised by the City’s consultant.
12. Hotel
There are over 5,300 hotel rooms in full or limited service hotels throughout Westchester County. Approximately 35% are facilities with 100 to 200 rooms. Many are located near White Plains, Rye and Tarrytown, along the I-287 corridor. In Yonkers, there are three hotels, all located on Tuckahoe Road (beyond the Study Area): Ramada Inn (103 Rooms), Royal Regency (91 Rooms), Tuckahoe Motor Inn (82 Rooms). The proposed SFC Project includes a 110-150-room hotel to be located on the Cacace Center site. It is expected that the hotel would benefit from the downtown Yonkers location, in direct proximity to the City’s government center where there is currently no existing competition. A market study was performed by Urgo Associates and is in the Appendix.

Market Factors
Saccardi & Schiff, Inc. III-27
13. Residential
Yonkers enjoys an attractive location on the most historic river in the country. Located in Westchester, residents benefit from the multitude of County recreation facilities including parks, golf courses and beaches. The comparatively lower taxes also make Yonkers more attractive than other river towns. Yonkers schools, which have struggled due to lack of funds, have been improving year to year and will benefit further from an increased tax base, making this a negligible issue for new residents. Additional market rate residential housing is needed in the downtown. The 436 condominiums planned on the waterfront at Palisades Point and the 950 units planned at River Park Center will start to fill this need. A report prepared by The Marketing Directors, Inc. concludes that “these homes will be absorbed prior to occupancy in a two-year pre-sale effort for each tower. They will enjoy the same success as Trump Tower in White Plains and Trump Plaza in New Rochelle.” The sweeping river views and the surrounding parks, shopping and dining will help create demand for these much needed additions to the housing market. See Appendix for The Marketing Directors Inc. report. According to Marketing Directors, Inc., young buyers will include professional singles who are priced out of the Manhattan market but want the proximity to the downtown center and the easy commuting via the nearby Metro North Railroad station. Professional couples, without children, will enjoy the services and amenities and the parks along the waterfront where they can cycle and kayak. Couples with small children will be drawn to the convenience of the downtown location. Finally, empty nesters who are ready to sell their large home but want to stay in Yonkers will see this as a welcome option. They will be drawn by the services, amenities and views. The Appendix of this study includes a report from Economic Research Associates with respect to competitive projects, absorption, and other market issues.
14. Baseball Stadium
The SFC Project includes a 6,500 seat minor league ballpark at River Park Center and related support infrastructure (e.g., concession space, office and locker room facilities, maintenance and storage areas, etc.). The ballpark would be located on the roof of the main River Park Center “podium” building and would share some of the infrastructure components of the rest of the structure (e.g., parking facilities, ingress and egress access stairwells and elevators, stormwater and drainage controls, etc.). Additionally, the ballpark is being developed for alternative uses, such as concerts, fairs and festivals, and other public gatherings. The economic viability of the ballpark is tied to the mixed-use nature of the SFC Project as well as the multiple uses of the facility for greater utilization beyond baseball games. Minor league baseball games compete as both alternatives to major league baseball games (in this case, the New York Yankees and Mets) and entertainment events such as movies, bowling and other family-focused offerings. Minor league baseball competes for patrons of sports events at a price point far below that of many of its competition. The Yankees ticket price
Market Factors
Saccardi & Schiff, Inc. III-28
for mid-level seats range between $50-90 per ticket; a baseball ticket in Yonkers should be around $10. Minor league baseball’s summer-time, outdoor offering is designed as an attractive alternative to similarly priced indoor family activities such as movies, bowling, etc. The ballpark at River Park Center is positioned for economic success because of the density of the surrounding population, the mixed-use design of the River Park Center site, and the non-baseball events envisioned for the facility. Yonkers has demonstrated success attracting large audiences to events in its downtown (e.g., annual Riverfest festivals, Independence Day fireworks, and ethnic/season parades) and is adding the infrastructure (e.g., improved road network, ample public parking) as part of the SFC Project to support the success of the stadium. The proposed ballpark will have 6,500 seats, including luxury suites. In addition, the facility will offer food services and retail opportunities. As discussed in detail in Section III.I of the DEIS, Economic Research Associates relied on data provided by Westchester Baseball, LLC (the anticipated operator of the ballpark) to estimate the potential economic and fiscal impact attributable to the proposed ballpark. The team owned and operated by Westchester Baseball LLC will be a member of the Atlantic League of Professional Baseball Clubs, Inc. (“Atlantic League”). The league is headquartered in Camden, New Jersey and consisted of eight teams in the 2007 season:
Bridgeport Bluefish Stadium: Harbor Yard (capacity: 5,300) Bridgeport, Connecticut www.bridgeportbluefish.com
Camden Riversharks
Stadium: Campbell’s Field (capacity: 6,425) Camden, New Jersey www.riversharks.com
Lancaster Barnstormers
Stadium: Clipper Magazine Stadium (capacity: 6,200+) Lancaster, Pennsylvania www.lancasterbarnstormers.com
Long Island Ducks
Stadium: Citibank Park (capacity: 6,002) Central Islip, New York www.liducks.com
Newark Bears
Bears & Eagles Riverfront Stadium (capacity: 6,200) Newark, New Jersey

Market Factors
Saccardi & Schiff, Inc. III-29
www.newarkbears.com
Somerset Patriots Commerce Bank Ballpark (capacity: 6,100) Bridgewater, New Jersey www.somersetpatriots.com
Southern Maryland Blue Crabs Stadium: Regency Furniture Stadium (capacity: 6,000) Waldorf, Maryland www.somdbluecrabs.com
York Revolution Stadium: Sovereign Bank Stadium (capacity: 5,200) York, Pennsylvania www.yorkrevolution.com
Westchester Baseball LLC has an ownership interest in the Bridgeport Bluefish. The financial assumptions included below are based in part on the operating experience of the Bridgeport Bluefish as well as the unique market conditions of Yonkers. In addition to the operating experience of Westchester Baseball LLC, the Redeveloper partnership includes the owner/operator of the Newark Bears team (the Fidelco Group). The financial assumptions included below are also based in part on the operating experience of the Newark Bears as well as the unique market conditions of Yonkers. Revenue for a typical Atlantic League minor league team comes from a variety of sources. In addition to the ticket sales from spectators, revenue is derived from food, beverage and merchandise sales to game attendees. Sponsorship serves as a key revenue source; advertising on the stadium scoreboard and billboards, promotions and print advertising all contribute to revenue. Additionally, revenue can be derived stadium naming rights and stadium rental income for other events. Operating expenses for a minor league baseball team are similar to a traditional business. A team has administrative costs associated with operating a business (office, insurance, IT/telephony, etc.); facilities expenses tied to the operations of a stadium; baseball operating including travel expenses, salaries, wages, and other employee-related costs; and rent payable for the use of the baseball stadium. The revenue and expense assumptions in the projections detailed below are a compilation of the experiences of Westchester Baseball LLC, the Fidelco Group, and third-party sources of information specified in the table and text. The ballpark will host 68 minor league home games each season. The 2008 Atlantic League schedule calls for each team to play 140 games (70 home dates and 70 road dates). In addition, it will support other events such as college and high school-level games, youth

Market Factors
Saccardi & Schiff, Inc. III-30
clinics, fantasy camps, and concerts. There will be approximately 50 of these other events each year. Westchester Baseball LLC estimates that an average of nearly 4,900 home game tickets will be sold to each game. This average game attendance assumption is supported by 2007 figures from the Atlantic League teams results. Other events will average roughly 500 ticket sales each (e.g., concerts, college/high school events, etc.). In sum, Westchester Baseball, LLC anticipates that over 354,000 tickets will be sold for baseball games and other events at the proposed ballpark. These projections are consistent with the general operating results of other Atlantic League teams. Westchester Baseball, LLC estimates that stadium-related revenues will total nearly $7.4 million, annually. These revenues include approximately $3.1 million in revenue from home game ticket sales, $2.1 million in revenue from food concessions, $1.0 million in revenue from advertising, $500,000 in revenue from merchandise sales, $300,000 in revenue from parking, $300,000 in revenue from the sale of tickets to other events, and $40,000 in revenue from television and radio contracts. Westchester Baseball, LLC estimates that operating expenses (excluding yet-to-be-determined lease payments) will be about $6.0 million, annually. These costs include salaries paid to players, managers, and trainers; full-time administrative staff members, maintenance staff, and grounds keepers; and part-time security personnel, food service workers, and ticket agents. Operating costs also include materials and supplies as well as the cost of goods sold. In addition to on-site revenue, the ballpark will support additional revenue generation in Westchester County. In particular, visiting umpires and teams will spend money at local hotels and restaurants. In total, Westchester Baseball, LLC projects that umpires will add $24,000 in spending and visiting teams will add $93,000 in spending within Westchester County each season.
15. Parking
Please refer to III.E.1 of the SFC Project DEIS for detailed discussion of parking issues related to the SFC Project including parking supply and demand factors and utilization of shared parking concepts to establish the number of parking spaces appropriate for each land use. The proposed parking structures have not yet been designed; however, cost estimates per space have been developed by the Redeveloper and the City’s outside consultant. The potential impact of any green building requirements or standards for parking structures have not been assessed, but are generally considered higher that the costs estimates developed by the Redeveloper and City’s consultant.

Saccardi & Schiff, Inc. IV-1
IV. FINANCIAL CONSIDERATIONS
Estimated Cost for Public Infrastructure and Public Parking
A detailed breakdown of the estimated costs for the construction of the public infrastructure and improvements and public parking proposed to be financed through the issuance of tax increment bonds is attached hereto as Appendix E.
Necessity for Tax Increment Bond Financing
Tax increment bond financing will enable the City of Yonkers to provide the public improvements and public parking that are necessary to attract major private sector investments in the Study Area. Although the majority of the Study Area is already designated as urban renewal area, the Study Area suffers from continued disinvestment. Public infrastructure in the Study Area continues to deteriorate and become obsolete. Some recent efforts to renew the area near the Metro-North Railroad station have realized positive results. However, this re-use/redevelopment is not of sufficient scale to induce the comprehensive redevelopment of the Study Area as a whole as envisioned by the City in its urban renewal and planning studies. The Redeveloper has informed the City that in the absence of tax increment financing for the construction of public improvements and infrastructure, the SFC Project would not be economically viable and would not be developed.
Tax Increment Bond Financing without County Participation
If the County of Westchester does not participate and the incremental additional County property tax revenues generated by the SFC Project are not devoted to bond debt service, then the amount of bonding will be adjusted so that debt service can be supported solely from the City tax increment and the revenues from the public parking at the SFC Project. Risk to the City
The tax increment bonds would not be backed by the full faith and credit of either the City or the County, and are not general obligation bonds. The tax increment bonds would be payable from, and secured by, the incremental additional real property taxes generated by the SFC Project (and as a result of the increased value of any other properties in the Study Area improved after the City Council and County Board of Legislators authorize the allocation of the Study Area tax increment to bond debt service), and the revenues of the public parking facilities constructed with the bond proceeds. The bond underwriters may require the Redeveloper provide additional security to enable the sale of the bonds in the market. However, in no case will the general revenues of the City or the County be pledged to the repayment of the bonds. Bond Issuance, Debt Service and Market Value Projections
The Redeveloper has requested that the City issue tax increment bonds in the amount necessary to cover the costs of construction of public infrastructure, improvements and parking and bond issuance and related financing costs (including capitalized interest and a reserve fund), currently estimated to total approximately $186,903,000. The amount of initial annual debt service on this

Financial Considerations
Saccardi & Schiff, Inc. IV-2
amount of bonds is estimated to be $11,786,438,13 and would increase to approximately $19,593,563 in the 30th and final year. The fund to pay the debt service on the bonds will be comprised of approximately 75% of the incremental additional real property tax revenue to the City and County14 generated by the SFC Project (i.e., the amount of additional tax generated by the increased assessed value of the Project above the current “base assessed value” of all of the SFC Project sites except Larkin Plaza) and the revenues from the new public parking facilities, which are estimated to be approximately $2,957,765 in the first year, rising to approximately $5,048,568 in the final year. Attached as Appendix D are documents entitled “Phase I – City of Yonkers – TIF Bond Projections No.23A and 23B” (the “Bond Projections”). Among other things, the Bond Projections show sources and uses of funds and bond issuance assumptions, debt service projections, market value and property tax projections and public parking net operating income projections. The Bond Projections show that based on conservative assumptions regarding bond maturity, bond coupon (interest) rate, reinvestment rates and other factors, the debt service on the requested bond amount can be covered by 75% of the City and County tax increment and the public parking revenues. The Bond Projections also show that the net revenue to the City (25% of the tax increment plus the surplus over and above the 75% needed to service the debt, but not including a) the tax revenue attributable to the “base value” in the project area, or b) any tax increment which might be generated by any other improved property in the project area) ranges from $2,359,479 in the fourth year after bond issuance and rises to $11,443,142 in the next to last year (with County participation in the TIF).15 Tax Rate Neutrality
The bonds will be structured so that the City has no moral obligation to bond holders. A moral obligation may arise when an issuer makes a promise to bond holders that it will pay the debt from sources of funds other than project funds (in this case, the tax increment revenues and public parking revenues) even though the obligation is otherwise not legally enforceable. To ensure that no moral obligation arises, the bonds will include specific disclosure to the buyers that the bonds are not backed by the full faith and credit of the City and that the buyers of the bonds will be able to rely only on project funds for payment of the debt. The bonds will be sold to sophisticated institutional investors who understand the financial risk, are able to evaluate and manage the risk, and for whom the risk is appropriate. These investors typically have billions of dollars of assets and are therefore actually in a better position than the City to assume this risk. In these circumstances, there is no moral obligation for the City to protect the investors. Other local issuers typically address the issue of a potential moral obligation in the same manner; that is, by structuring and selling the bonds in such a manner that there was express or implied promise by the issuer to pay the debt.
13 This is the “gross” annual debt service payment (i.e., before applying debt service reserve fund income and income from operations. Although debt
service schedules are uncertain at this point, it is expected that the first payment of debt service from City revenues and not from capitalized interest would be 3 and ½ years after issuance, i.e., after the Project is constructed and has begun operating. Interest expense during the construction period would be capitalized.
14 As previously indicated, Westchester County participation in “joint undertaking” will be requested, and the County will be asked to pledge 75% of its tax increment to the repayment of the City bonds.
15 The surplus is approximately $27,290,265 in the final year because net debt service in that year is significantly less (approximately $206,857).

Financial Considerations
Saccardi & Schiff, Inc. IV-3
Comparable TIF Projects
Table IV-1 presents several examples of tax increment financing projects similar in scale to the scale of the proposed SFC Project and the estimated amount of bonds:
Table IV-1
Comparable Projects with TIF Bonds
Project Location TIF Bonds Amount Project Value Westport City of Baltimore, MD $120 million $1.2 billion Harbor Point City of Baltimore, MD $124 million $821 million Steel Point Bridgeport, CT $190 million $1.5 billion Harbor Point Stamford, CT $155 million $2.3 billion Source: MuniCap, Inc.
Project value is used as a proxy for total investment, as total investment is not readily available for all projects. The amount of tax increment invested will vary by project as a result of other revenues applied to the bonds (e.g., it is proposed here that public parking income will pay for about 28% of the bonds), other public investment, the type of investment (for example, on-site, off-site, general public facilities, project specific facilities), and extent of distress of the area. TIF Projections
The projections from in Appendix D assume an interest rate of 6.25%. The interest rate environment has been dynamic recently, with frequent fluctuations and a lack of stability in rates, which makes it difficult to estimate the rate at which the bonds will be sold. The interest rate will not be largely affected by the City of Yonkers financial history, since the City is not backing the bonds and bond holders will not be looking to Yonkers to repay the bonds. The location of the project in Yonkers will be a much more important issue, and this location will be viewed as a premier location, given the proximity to New York City and the lack of supply and expense of housing in the market. Key credit issues will include:
• The feasibility of the SFC Project, including the location of the SFC Project, status of permitting, contamination issues, and other issues that may affect the feasibility of the SFC Project;
• The development team, its experience, financial resources, and ability to make the SFC Project happen;
• Other investment in the SFC Project that will be subordinate to the bonds, such as Redeveloper’s equity and other financing;
• The value of the property compared to the bonds supported by the property; • The structure of the financing; and • Tax collection procedures and collection history.
The assumed rate of 6.25% is high by historical standards for this type of bond issue and expected credit profile of the SFC Project. However, this rate should be appropriate for the

Financial Considerations
Saccardi & Schiff, Inc. IV-4
current market, given pricing on other recent tax increment bonds in the market. It is impossible to know what the state of the market will be at the time the bonds will be sold. Project Risk Analysis and Timing Issues
The potential of the City having a moral obligation to pay the debt was addressed in the preceding section regarding “Tax Rate Neutrality.” As previously indicated, there will be no promises made to the buyers of the bonds suggesting the City will be responsible for repaying the bonds in the absence of sufficient project revenues. To the contrary, the buyers of the bonds will be explicitly informed that the City will not be responsible for repaying the bonds if project revenues are insufficient. The proposed tax increment bonds will be sold to sophisticated institutional buyers for whom the risk is appropriate. These buyers look for bonds with higher risk for the opportunity to earn higher yields. They buy these types of bonds because they are in a position to manage the risk, much like an insurance company that receives a premium to provide fire insurance. The investors do not expect the bonds to be risk free; they understand they are receiving additional compensation for taking the risk associated with the bonds.

Saccardi & Schiff, Inc. V-1
V. AFFECTS ON OTHER PROPERTIES
Basis for Study Area Boundary
The Study Area boundary has been drawn to encompass the SFC Project and other proximate areas that are blighted under the criteria set forth in the Municipal Redevelopment Law and that would benefit from the public improvements proposed to be financed by tax increment bonds. It is possible that there may be additional development within the Study Area that results in an additional incremental tax revenues that could be utilized for bond repayment. However, to be conservative, the financial analyses and projections presented in the Appendix of this report are based solely on the anticipated revenues from the SFC Project. Property Taxes and Rates
Establishing a redevelopment project in the Study Area will not cause assessed values of properties in the project area to be increased unless and until a property is improved, as would be the case for any property not located in the Study Area, and whether or not tax increment financing is implemented. Assessed values in the Study Area will be determined by the City assessor in accordance with State law based on the same methodologies and criteria applied to property outside of the Study Area. The mere fact that a property is located in the Study Area is not a basis for reassessment under applicable State law. Eminent Domain
Under Section 970-f(j) of the Municipal Redevelopment Law, a municipality that establishes a redevelopment project may acquire property for project purposes through condemnation (the exercise of the power of eminent domain). However, the establishment of a redevelopment project does not, by itself, increase the threat that any property would be condemned. With respect to the Study Area, it should be noted that the City already has the power to condemn the vast majority of the properties in the Study Area that are also located in the Getty Square Urban Renewal Plan area and Riverview Urban Renewal Plan area. Secondary Displacement
The DEIS for the SFC Project includes a socio-economic analysis that evaluates potential displacement of residential and commercial uses in the Study Area. There is no eminent domain contemplated and therefore no direct residential or commercial displacement by the City or any other governmental entity. The private purchase of property by Redeveloper will, however, result in the displacement of 22 dwelling units and 32 businesses. In addition, it is recognized that some secondary displacement may occur, but it would not be significant given the overall demographics of the Study Area, on-going City initiatives (e.g., planning study for Nodine Hill), and certain mitigation measures, including: The provision by the Redeveloper of affordable/workforce units equal to 6% of the total
number of residential units at the SFC Project; either new affordable units will be constructed, or the Redeveloper will contribute equivalent value to an affordable housing fund to assist in the rehabilitation of housing and/or storefronts in the immediate vicinity of the proposed development.

Affects on Other Properties
Saccardi & Schiff, Inc. V-2
The preparation by the Redeveloper of a study, in conjunction with the Downtown Business
Improvement District, of recommended business marketing and management strategies and techniques that will help enable existing retail and service establishments increase business activity as a result of their proximity to the proposed development.
Patterned after a similar program developed in New Rochelle, the Redeveloper will create an
employment initiative for construction workers, focusing on pre-apprenticeship training. This program will be designed to help local residents participate in various aspects of the construction program in downtown Yonkers.
Many of the 13,000 direct and indirect construction jobs and 5,000 direct and indirect
permanent jobs resulting from the development will be filled by Yonkers residents. The permanent jobs will include positions in management, office, hospitality, retail sales, restaurant, entertainment and services.
Continued support by the Redeveloper for public services organizations. In 2006, the
Redeveloper and its related entities funded an extensive number of community organizations in Yonkers that needed assistance in their efforts to address a variety of issues in the City. Among many others, these included the YMCA, YWCA, American Red Cross, Hudson River Museum, Beczak Environmental Education Center, Yonkers Public Schools, Family Service Society, Groundwork Yonkers, Inc. My Sister’s Place, Yonkers Community Action Program and Nepperhan Community Center, Inc.

Saccardi & Schiff, Inc. VI-1
VI. PRELIMINARY PLAN
As more fully set forth in Sections I through V, the Study Area is a “blighted area” within the meaning of the Municipal Redevelopment Law and a redevelopment project in the project area (proposed to be the SFC Project) in the Study Area is feasible. In 2007, the City Council adopted a resolution selecting the Study Area as a “project area” for redevelopment and authorizing the preparation of a preliminary plan for the redevelopment project. Under Municipal Redevelopment Law Section 970-e, the preliminary plan must include: (a) a description of the boundaries of the project area; (b) a general statement of the land uses, layout of principal streets and population densities and standards proposed as the basis for the redevelopment of the project area; (c) a statement of how the purposes of the Municipal Redevelopment Law would be achieved by the redevelopment; (d) a description of how the preliminary plan conforms to “Connections,” the comprehensive plan of the City; (e) a general statement of the impact of the project on residents of the project area and the surrounding neighborhood; and (f) a statement of why redevelopment of the project area would not be undertaken were it not for the purposes and provisions of the Municipal Redevelopment Law (i.e., in the absence of tax increment financing). The preliminary plan for the proposed redevelopment project is set forth below.16 A. Boundary Description
The boundaries of the project area are the same as the boundaries of the Study Area shown on Exhibit II-1, “Proposed Municipal Redevelopment Project Area Boundary, and are described in Section II.A.1.
B. Proposed Land Uses, Traffic Circulation and Redevelopment Standards
The City proposes that the SFC Project be developed as the first phase of the redevelopment project in the project area. As discussed in detail in the DEIS, the SFC Project is a proposed mixed-use development, with residential, retail, restaurant, hotel, office, entertainment and recreational uses, including a minor league ballpark. The total number of proposed dwelling units is 1,386 with 950 units at River Park Center and 436 units at Palisades Point. The total square footage of non-residential uses is approximately 1.3 million square feet. Palisades Point is located on the Hudson River waterfront on a site long identified by the City for private mixed-use residential and commercial redevelopment under the City’s Riverview Urban Renewal Plan, and which is also identified for redevelopment in the Master Plan & Design Guidelines for the Yonkers Downtown Waterfront approved by the CDA on December 16, 1998 and by the City Council on April 17, 1999 (the “Waterfront Master Plan”). To the immediate north of the Palisades Point site is the Schrimshaw House, a waterfront condominium development. To the east is the Metro-North Railroad tracks and beyond the tracks, a mostly residential community along Buena Vista Avenue. To the south of Palisades Point is the American Sugar Refinery, Inc. plant, an industrial facility.
16 The preliminary plan incorporates Section I through V, above, by reference.

Preliminary Plan
Saccardi & Schiff, Inc. VI-2
Palisades Point is proposed to be approved as a specially permitted Planned Urban Redevelopment (“PUR”). A PUR special permit must be approved by the Planning Board and City Council, based on a “comprehensive development plan” for the proposed use. The approval of a PUR supersedes the use and dimensional regulations of the zoning district in which the use is located. The Waterfront Master Plan is proposed to be amended to conform to the PUR special permit ultimately approved by the Planning Board and City Council. In contrast, the proposed mixed-use development at the River Park Center and Cacace Center sites will require amendments to the existing regulations of the CB-Central Business and GC-Government Center Districts to allow the range of uses proposed (e.g., the ballpark and housing are currently not permitted in the CB District), and also to allow greater density and building height than currently permitted in certain instances. The River Park Center and Cacace Center sites are subject to the Getty Square Urban Renewal Plan. The Getty Square Urban Renewal Plan is proposed to be amended to conform to the amendments to the regulations of the CB District and GC District. Although the areas surrounding the River Park Center and Cacace Center sites are currently mixed-use in character, the SFC Project, with the “riverwalk” to be created by daylighting the Saw Mill River, ballpark and two 50 story residential towers, will become the most prominent land use in the area. Similarly, the two 25 story buildings at Palisades Point, along with the expansive publicly accessible open space to be preserved along the Hudson River, will become a dominant land use in that portion of the City. In order to provide access to the SFC Project development sites, road and intersection improvements are planned. Among these are a new one-way routing of streets that serve the multiple access points for River Park Center; a new bridge across the Metro-North Railroad tracks leading into the Palisades Point site and other riverfront parcels; and expanded southbound access from the Saw Mill River Parkway to Yonkers Avenue. A trolley is also proposed, connecting the development sites with the Yonkers Railroad Station. Traffic circulation and proposed road and intersection improvements are discussed in detail in the DEIS. The proposed land use controls and redevelopment standards for the redevelopment project (including the SFC Project) are: (1) the regulations of the CB District and GC District, as they are proposed to be amended; (2) the regulations of the DW District; (3) the Riverview Urban Renewal Plan; (4) the Getty Square Urban Renewal Plan, as proposed to be amended; and the Waterfront Master Plan, as proposed to be amended. Proposed land use controls and standards and densities of development are discussed in detail in the DEIS. As shown on Exhibit II-1, the project area is also proposed to include other parcels of property in downtown Yonkers not currently proposed for private redevelopment as a part of the SFC Project. These parcels are in the CB District, GC District and the DW-Downtown Waterfront District of the City.
C. Statement of Purposes

Preliminary Plan
Saccardi & Schiff, Inc. VI-3
As more fully set forth in Sections I through V, the Study Area is a “blighted area” within the meaning of the Municipal Redevelopment Law. The establishment of a redevelopment project in the project area and the development of the SFC Project would alleviate blighting conditions, increase spending in the downtown, increase sales and other tax revenues to the City, and provide significant job opportunities. The establishment of a redevelopment project in the project area would be beneficial to the general welfare of the City and would effectuate the purposes and promote the objectives set forth in Section 970-b of the Municipal Redevelopment Law. As the first phase of the redevelopment project, the SFC Project will bring new commercial and residential uses to the downtown thereby revitalizing and strengthening the area and preventing further deterioration of the heart of the City.
D. Relationship to the City’s Comprehensive Plan
The proposed SFC Project would be the first phase of the redevelopment project. The SFC Project is consistent with “Connections,” the City’s recently adopted Comprehensive Plan. The overall “theme” of Connections is to relate and connect plan proposals to the City’s history, to its place in the region, to its neighborhoods, economic centers, parks and natural resources, and to its transportation systems and community facilities.The SFC Project meets the goals of Connections, which calls for the City to:
Strengthen shopping areas, including Getty Square Solidify partnerships with the real estate community Increase the amount of green space and formalize visitors along the waterfront Coordinate development planning with downtown planning efforts Explore new opportunities for city services and facilities (e.g., Larkin Plaza, Fire
Department Headquarters) Provide affordable homeownership opportunities
The SFC Project is also consistent with the goals and objectives of the Riverview Urban Renewal Plan and is generally consistent with the goals and objectives of the Getty Square Urban Renewal Plan, objectives that have largely not been achieved over the last thirty years. However, the two residential buildings at Palisades Point are not consistent with the building height and density described in the Waterfront Master Plan. The Waterfront Master Plan is proposed to be amended to accommodate the proposed plan for Palisades Point. E. Neighborhood Impacts
It is anticipated that the redevelopment project will be the catalyst that will bring the long-awaited revitalization of downtown Yonkers to fruition. Although some notable redevelopment has occurred along the Hudson River and nearby portions of Main Street, most of the City’s vision for the downtown as expressed in Connections, the Riverview Urban Renewal Plan, the Getty Square Urban Renewal Plan and the Waterfront Master Plan has not been realized. A major destination retail facility, an expanded Hudson River waterfront esplanade and public open space area, the daylighting of the Saw Mill River in the downtown, and a minor league ballpark have been eagerly anticipated by City officials and residents. These attractions, along with the restaurant, office, hotel and residential uses, will bring existing

Preliminary Plan
Saccardi & Schiff, Inc. VI-4
and new residents, shoppers and visitors together in downtown Yonkers, and will help induce the additional development activity that has been envisioned by the City. In order to respond to potential growth in the downtown, the City has undertaken several initiatives to make certain that surrounding areas are improved. These actions include existing and proposed master plans for the nearby Nodine Hill, Ashburton Avenue, Ravine Avenue and Alexander Street areas. The Nodine Hill and Ravine Avenue plans identify potential opportunities for affordable infill housing and for rehabilitation of existing housing. The Ashburton Avenue plan includes a HOPE VI component, with new housing affordable replacing the Mulford Gardens public housing complex. In addition to these efforts, the City Council has required the Redeveloper to prepare, on behalf of the City Council, a conceptual plan for the redevelopment of additional areas in downtown Yonkers including the balance of the central Hudson River waterfront, the Alexander Street area, the Ludlow area and the Nepperhan Valley industrial area. The conceptual plan calls for additional housing, industrial development, and open space including a continuous publicly accessible open space and esplanade along the Hudson River. Palisades Point is located on vacant land owned by the CDA. River Park Center and Cacace Center are proposed to be developed on private land already acquired or being acquired by the Redeveloper and land to be acquired from the City and CDA, including City-owned buildings, parking facilities and streets. No condemnations are proposed to assemble the SFC Project development sites. No existing residences will be displaced as a result of the SFC Project. Secondary displacement is not anticipated given the City’s efforts in areas like Nodine Hill where plans are being devised to strengthen the neighborhood and create new affordable housing opportunities. In addition, The SFC Project will also contribute to the affordable housing stock of the City, either through the construction of affordable units, or through contribution to a fund to be used to facilitate infill development or rehabilitation of existing residences within the downtown area.
F. Need for the Redevelopment Project (Tax Increment Financing)
The SFC Project would not be developed as the first phase of the redevelopment project without City financial assistance for the construction of the new public parking facilities and public infrastructure improvements needed to support the development. The vehicle for that assistance is the tax increment financing authorized by the Municipal Redevelopment Law. Although infrequently utilized in New York, tax increment financing is an indispensable self-financing tool used throughout the United States to help local governments successfully redevelop urban areas and encourage economic development. When originally conceived, urban renewal projects included State and federal funding for virtually all public improvements, land acquisition, demolition and site preparation costs. Federal funding for urban renewal was eliminated prior to the establishment of the

Preliminary Plan
Saccardi & Schiff, Inc. VI-5
Community Development Block Grant (“CDBG”) Program. Although CDBG funds can be utilized for urban renewal activities, they can also fund other activities, many having greater immediate priority. Given reduced CDBG funding allocations and the virtual elimination of other federal and State urban renewal assistance, many localities permitted urban renewal programs to languish, anticipating private sector investment. With the tax increment financing, long-overdue improvements to the obsolete infrastructure systems in downtown Yonkers would be realized – improvements that are required not only for the SFC Project, but for the revitalization of the entire project area. Roads and utilities would be upgraded. Together these improvements would make the project area attractive for redevelopment. See also Section IV, above.
G. SEQRA Compliance
Pursuant to Section 970-e of the Municipal Redevelopment law, the potential environmental impacts of a proposed preliminary plan must addressed in a draft environmental impact statement. This preliminary plan is intended to facilitate the SFC Project that is described in the SFC Project DEIS. Because the preliminary plan is narrowly tailored to the SFC Project, the potential environmental impacts that might arise as a result of the implementation of the proposed preliminary plan are generally indistinguishable from the potential impacts of the SFC Project, and analysis of these impacts is therefore subsumed in the analyses of SFC Project impacts contained in the SFC Project DEIS. The City Council of the City of Yonkers is the Lead Agency for the SEQRA review of the SFC Project, including this preliminary plan and the proposed tax increment financing. This preliminary plan cannot be approved by the City until the SEQRA review of the SFC Project, including the review of this preliminary plan, is completed by the City Council..

Saccardi & Schiff, Inc. VII-1
VII. APPENDICES

Saccardi & Schiff, Inc. VIII-1
APPENDIX A: Hotel Market Report


EXECUTIVE SUMMARY
Urgo Hotels is a family owned real estate development and management company specializing in hotel projects. As an owner/operator of leading brands, Urgo Hotels has a proven track record of providing its owners, investors, lenders and franchisors with solid returns on their investment; investing in associates and providing them with the highest quality work environment available in the industry; and providing guests with superior product and exceptional service.
Urgo Hotels develops, owns and operates distinctive hotels in significant markets which consistently outperform their primary competitors and achieve outstanding financial returns for ownership. The company and its affiliates presently have ownership interests in and/or operate 16 hotels with a total of 2,329 rooms in five north-eastern and Mid-Atlantic States, the District of Columbia and the provinces of Quebec and Newfoundland, Canada. Urgo generated more than $113 million of revenue in 2006.
Under the stewardship of its senior management team, Urgo Hotels has been recognized as one of the top 100 hotel developers by Hotel Business Magazine, a leading industry publication, and by the Marriott and Hilton franchise communities as one of the top performing hotel operators within their respective franchise groups.
Urgo Hotels currently owns and/or manages six hotels in the NY and NJ area and has extensive experience in these markets, including many hotels that have been developed and sold in previous years. A full list of our current portfolio is attached hereto.
The Urgos have an extensive relationship with Louis Cappelli ranging from the development and management of the Residence Inn, New Rochelle to the current development of the Ritz Carlton, White Plains.
Project Description
Urgo Hotels would like to incorporate a 150 room Courtyard by Marriott with meeting space and related facilities and amenities into the proposed Yonkers redevelopment project. The large scale development planned for Yonkers, the dynamic economic climate and hotel market of Westchester County, as well as the close proximity to Manhattan make this a perfect site for a Courtyard by Marriott hotel.
The Marriott branded hotels have consistently been among the performance leaders in their respective markets. A combination of the strength of the Marriott brand, and the cross selling of these products has contributed to annual occupancies and average daily rates that substantially exceed market wide levels. The RevPAR penetration rate for Courtyard by Marriott branded products is approximately 124% for 2006.
The fact that there currently is no high end branded product in the vicinity of Yonkers along with the hotel’s affiliation to the Marriott Courtyard brand will provide the recommended hotel with a tremendous competitive advantage and gives the property

immediate awareness in the market. This advantage will allow the property to gain and quickly surpass its fair market share of occupancy and average daily rate.
The Courtyard by Marriott product will be an integral part of this development and an enhancement to the overall value and image of the development. In addition, this hotel will bring roughly 75 full and part time jobs to Yonkers.
Market Overview
Yonkers is the fourth largest city in the State of New York with a population of 196,425 in 2005 and the largest city in Westchester County. Yonkers is merely 2 miles from Manhattan and borders the borough of the Bronx. The city runs along the banks of the Hudson River and rises into hills as you head away from the river.
Yonkers has four Hudson-Line Metro-North Railroad stations providing service directly into Manhattan as well as one station that provides Amtrak service. Starting this spring, the New York Port Authority will begin fast ferry service directly from Yonkers to Manhattan.
Competition
The hotel’s affiliation to the Marriott Courtyard brand will provide the hotel with a tremendous competitive advantage and gives the property immediate awareness in the market. As previously mentioned, this advantage will allow the property to gain and quickly surpass its fair market share of occupancy and average daily rate.
There is no direct competition for a hotel of this quality and brand level in the immediate vicinity of Yonkers. This hotel will supply a market demand that currently has no options in Yonkers.
The competitive set for this hotel will consist of The Residence Inn-New Rochelle, The Ramada-Yonkers, The Radisson Hotel-New Rochelle, Hampton Inn-Tarrytown, The Crowne Plaza-White Plains, The Marriott-Westchester, The Courtyard-Tarrytown, and the Springhill Suites-Tarrytown. As of April 2007, the competitive supply achieved 12 month moving average annual occupancy of 78.2% and the average daily rate (ADR) for the competitive set was $154.58. Summaries of the Historical Operating Results of the Comp Set and the Westchester County Market Tract are provided below and full star reports are attached hereto.

TIF Feasibility Study Appendix A: Hotel Market Report
1
Appendix A: Hotel Market Report by Urgo Hotels, Inc. Bethesda, Maryland 20814 Responses to Lamont Blackstone’s Comments
1. According to Smith Travel Research, There are 57 hotels with 7,076 rooms in the Rockland/Westchester market area. A list of the properties is attached hereto as Exhibit A. The delineation of size and percentage of total are as follows.
Number of Hotels
Number of Rooms
Percent of Total Number of Hotels
27 0-99 47% 22 100-199 39% 8 200+ 14%
2. The demand turndowns and exceptional occupancy at the Marriott branded hotels
and other high quality hotels in the surrounding area indicate that there is demand in Yonkers that is forced to stay outside of Yonkers due to the lack of accommodations. Yonkers City officials and planning officials have indicated there is a need for lodging accommodations to house (both short term and long term stays) people visiting their offices from outside the area. Other significant demand generators are the large corporate demand generators in the area listed in number 3.
3. The demand generators are listed below.
One Executive Blvd. Yonkers, NY
• AVR Realty • Cybra Corp. • Levitt-Fuirst Associates • McKesson Corp. • Motion Picture Assoc. of America • PHC Services • Progressive Casualty Insurance Co. • SP Cooper & Company • York International Agency
Six Executive Plaza Yonkers, NY
• C & I Collectibles • Cablevision Systems Corp. • Mid Atlantic Waterproofing • Montefiore Medical Center • News 12 Westchester • The Speiser Organization

TIF Feasibility Study Appendix A: Hotel Market Report
2
35 E. Grassy Sprain Rd. Yonkers, NY Andrew Brieman, DDS
• Bestcare of Westchester, Inc. • Hudson Valley Bank • Hudson Valley Dental Arts • New York State Assemblyman, Louis A. Mosiello • Paul W. Meyer, Jr., Esq. • St. John's Riverside Hospital-Employee Assistance Program • State Farm Insurance • Summit Financial Consultants, Inc. • Techwood • The Thomas & Agnes Carvel Foundation • Thomas G. Cascione, Esq. • United Food Workers Union #464A • Wieder & Wieder, Esq. • Yonkers Federation of Teachers
86 Main St. Station Plaza Yonkers, NY
• Magnificat USA • Citibank • Hudson River Art Gallery
470 Nepperhan Ave. Yonkers, NY
• Pace University (1) • Computer Tech Service • LPL Financial Services • Next Level, Inc. • Web Vision
One Odell Plaza Yonkers, NY
• Court Sports II • Dr. Scott Newman • Ecker Window Corp. • K&R Home Medical Equipment Co. • Market Dynamics Group • Multigon Industries • Thyssen Krupp Access, Inc.
Tarrytown IBM Pepsi Bayer

TIF Feasibility Study Appendix A: Hotel Market Report
3
Siemens Fuji Ciba New York Life Ampacet Kraft Foods Marymount College Irvington
• Mostly residential with Churches, Schools and Temples Ardsley on the Hudson
• Ardsley County Club Dobbs Ferry
• Mercy College • Akzo Nobel
Hastings on the Hudson
• Mostly residential with Churches, Schools and Temples Yonkers
• American Sugar Holdings, Inc • Yonkers Contracting Co Inc • Yonkers City School District • Consumers Union Of United States Inc • C & H Sugar Company, Inc • Hudson Valley Holding Corp • Jac Vandenberg, Inc • St Josephs Hospital, Yonkers • Ford Smith-Cairns Inc • Pop Displays Usa, Llc • Sohel Distributor Inc • Evci Career Colleges Holding Corp • Leake And Watts Services, Inc • Riverside Health Care System Inc • Stanlou Tobacco, Inc • St John's Riverside Hospital Inc • Cosner Construction Corp • Belmay, Inc • Merex Food Corp • General Motors Training Facility • Yonkers Avenue Dodge, Inc • Westchester Community College (Branch) • Kawasaki • Channel 12 Westchester News (HQ)

TIF Feasibility Study Appendix A: Hotel Market Report
4
• Empire City Casino/ Yonkers Raceway Riverdale
• Manhattan College • College of Mount Saint Vincent • Temples • Churches • Schools • Very Upscale Homes • Bronx Zoo
Marble Hill University Heights Morris Heights Harlem (125th) Grand Central Terminal
Marriott has a franchise approval process, which consists of the submission of a franchise application which includes basic background information regarding the proposed project, such as a map showing the location of the site and a site plan and floor plans for the proposed hotel.
4. Background information pertaining to Urgo Hotels including a list of properties is
attached hereto as Exhibit B.
5. Westchester County’s location, just north of Manhattan, has been a key factor in the region’s attractiveness. Major Fortune 500 companies and international business corporations including IBM, MasterCard International, PepsiCo, Nokia, Kraft Foods, Starwood Hotels & Resorts Worldwide, and Hitachi America have operations in Westchester County. In addition, the county is home to a number of biotechnology and pharmaceutical firms such as Progenics, Regeneron Pharmaceutical, Pfizer, and Bayer Diagnostics. The following table indicates the top ten employers in Westchester County.
Major Employers
Firm Number of Employees
Westchester County Health Care Corporation 4,000 IBM – TJ Watson Research Center 3,000 IBM 2,500

TIF Feasibility Study Appendix A: Hotel Market Report
5
AT&T Corporation 2,500 Payroll Services Plus Inc. 1,800 Hillbrook Insurance Company 1,500 Kraft Foods 1,200 General Cinema Bevs of WVA (Pepsi) 1,200 Riverside/St. Johns Hospital (Andrus Pavilion) 1,114 Northern Westchester Hospital Center 1,098 Total 19,912 Source: Dunn & Bradstreet, Imarket Data
The economic growth of Westchester County is directly associated with the quality of the transportation infrastructure linking the area to the metropolitan area and major markets. Westchester County is home to more than 3,390 miles of state and local highways. Interstate 95 runs through southern Westchester County into Connecticut, and Interstate 87 runs parallel with the Hudson River connecting Westchester to New York City. Interstate 684 is a major highway running north to south that connects many of Westchester’s northern and central suburbs before continuing into neighboring Putnam County. The interstate highway runs northeast to central New England and southwest to Pennsylvania.
MTA’s Metro-North Railroad, the second largest commuter railroad in the United States, provides approximately 250,000 customer trips each weekday and some 73 million trips per year. Metro-North’s three lines – Harlem, Hudson, and New Haven – offer service to and from Grand Central Terminal in Manhattan. Westchester County Airport is owned and operated by Westchester County and provides airlines and charter passenger services. Considered a vital force in the local community, Westchester County Airport employs over 1,500 people and provides an economic impact of more than $600 million annually.
Westchester County’s high quality of life is a key element in the region’s economic success. Visitors lured by the county’s historical, cultural, and natural charms spend almost $1 billion each year and generate about $42.8 million in local tax revenues. Westchester County is home to numerous museums, historical sites, theatres, performing arts centers, and forty county-owned parks. In addition, Westchester County features numerous sporting events including the annual PGA Barclay Classic and the LPGA’s Sybase Classic at the Westchester Country Club. The Westchester sports scene boasts the annual Yonkers Marathon and the New York Training Center in Greenburg serves as the combined training facility for the New York Rangers (NHL), New York Knicks (NBA), and New York Liberty (WNBA).
6. Revpar stands for “Rooms Revenue Per Available Room” and may be more
correctly defined as total guestroom revenue per available room per day. It is typically calculated by multiplying Occupancy by Average Daily Rate (ADR), as in the following example.

TIF Feasibility Study Appendix A: Hotel Market Report
6
70% Occupancy x $150 ADR = $105 Revpar Because Occupancy and Average Daily Rate are highly correlated, the relationship between the two is best illustrated by Rooms Revenue Per Available Room (Revpar), which reflects a property’s ability to maximize rooms revenue. A properties Revpar penetration rate is a true measure of how a property is performing in its competitive market place. If a property is achieving a 100% Revpar penetration rate, it is capturing its fair share in the market place. If a property is achieving a penetration rate of 124%, then it is capturing 24% more than its fair share. The following table illustrates the performance of several Marriott Brand Systems versus their respective group of competitors in Occupancy, Average Daily Rate, and Revpar for the calendar year 2006.
Marriott Brand
Occupancy Occupancy Penetration
Rate
ADR ADR Penetration
Rate
Revpar Revpar Penetration
Rate Marriott Hotels and Resorts
71% 102% $154 110% $109 112%
Renaissance Hotels and Resorts
72% 104% $152 111% $110 116%
Courtyard by Marriott
73% 108% $117 115% $85 124%
Residence Inn by Marriott
79% 115% $114 112% $90 128%
7. Urgo Hotels believes that the achievable rate for a 150 room Courtyard by Marriott in Yonkers at stabilization (three years after opening) is $195.
8. The historical operating results are attached hereto as Exhibit C.

Participation List: Rockland/Westchester
Job Number: 149455 Staff: CH Created: June 11, 2007
STR Code Name of Establishment City & State Zip Code Aff Date
Open Date Rooms
Chg in Rms J F M A M J J A S O N D J F M A M J J A S O N D J F M A M J J A S O N D
20429 Ardsley Acres Hotel Court Ardsley, NY 10502 6020430 Apple Motor Inn Ardsley, NY 10502 Jun 1975 Jun 1975 4952006 The IBM Learning Center Armonk, NY 10504 Jun 1978 Jun 1978 182 ○ ○ ○ ○ ○ ○ ○ ○ ○ ○ ○ ○ ○ ○ ○ ○ ○ ○ ○ ○ ○ ○ ○ ○ ○ ○ ○ ○7838 La Quinta Inns Armonk Armonk, NY 10504 Feb 2007 Jan 1973 140 ● ● ● ● ● ● ● ● ● ● ● ● ● ● ● ● ● ● ● ● ● ● ● ● ● ● ● ●20434 Closed Fox Ridge Motor Inn Brewster, NY 10509 020435 Heidi`s Inn Brewster, NY 10509 Jun 1960 Jun 1960 4045135 Belaire Motor Inn Brewster, NY 10509 2732501 Edith Macy Conference Center Briarcliff Manor, NY 10510 Apr 1999 Dec 1982 60 Y ● ● ● ● ● ● ● ● ● ● ● ● ● ● ● ● ● ● ● ● ● ● ● ● ● ● ● ●48264 Country Side Motel Cold Spring, NY 10516 Jun 1983 Jun 1983 2230864 Watergate Motor Inn Croton On Hudson, NY 10520 Jun 1965 Jun 1965 447842 La Quinta Inns Elmsford Elmsford, NY 10523 Mar 2007 Jan 1975 101 ● ● ● ● ● ● ● ● ● ● ● ● ● ● ● ● ● ● ● ● ● ● ● ● ● ● ● ●110 Hampton Inn White Plains Tarrytown Elmsford, NY 10523 May 1996 Jun 1957 156 ● ● ● ● ● ● ● ● ● ● ● ● ● ● ● ● ● ● ● ● ● ● ● ● ● ● ● ●
41187 Extended Stay America Elmsford Elmsford, NY 10523 Dec 2000 Dec 2000 136 ● ● ● ● ● ● ● ● ● ● ● ● ● ● ● ● ● ● ● ● ● ● ● ● ● ● ● ●11590 Saw Mill River Motel Elmsford, NY 10523 Jun 1940 Jun 1940 1204446 Elmsford Motel Elmsford, NY 10523 Apr 1994 Jan 1963 48 Y35360 Comfort Inn & Suites Hawthorne Hawthorne, NY 10532 Dec 2000 Dec 2000 85 ● ● ● ● ● ● ● ● ● ● ● ● ● ● ● ● ○ ○ ○ ○ ○ ○ ○ ○ ○ ○ ○ ○4240 Closed Quality Inn Inn Hawthorne Hawthorne, NY 10532 Aug 1963 Aug 1963 020474 Closed Larchmont Motel Larchmont, NY 10538 045963 Budget Motor Inn Motel Mahopac, NY 10541 2445579 Tuxedo Motel Mamaroneck, NY 10543 2346105 Mamaroneck Motel Mamaroneck, NY 10543 Jun 1946 Jun 1946 34
76 Holiday Inn Mount Kisco Westchester County Mount Kisco, NY 10549 May 1972 May 1972 122 ● ● ● ● ● ● ● ● ● ● ● ● ● ● ● ● ● ● ● ● ● ● ● ● ● ● ● ●16999 Closed Hudson River Inn & Conf C Ossining, NY 10562 020504 Peekskill Motor Inn Peekskill, NY 10566 Jun 1957 Jun 1957 539852 Hilton Rye Town Rye Brook, NY 10573 Apr 1973 Apr 1973 446 ● ● ● ● ● ● ● ● ● ● ● ● ● ● ● ● ● ● ● ● ● ● ● ● ● ● ● ●20514 Doral Arrowwood Conference Ctr Rye Brook, NY 10573 May 2002 Jun 1983 374 ○ ○ ○ ○ ○ ○ ○ ○ ○ ○ ○ ○ ○ ○ ○ ○ ○ ○ ○ ○ ○ ○ ○ ○ ○ ○ ○ ○16187 Courtyard Rye Rye, NY 10580 Mar 1988 Mar 1988 145 ● ● ● ● ● ● ● ● ● ● ● ● ● ● ● ● ● ● ● ● ● ● ● ● ● ● ● ●6854 Marriott Westchester Tarrytown, NY 10591 Nov 1981 Nov 1981 444 ● ● ● ● ● ● ● ● ● ● ● ● ● ● ● ● ● ● ● ● ● ● ● ● ● ● ● ●55707 Sheraton Hotel Tarrytown Tarrytown, NY 10591 Jan 2007 Jan 2007 150 ○ ● ● ●44884 Springhill Suites Tarrytown Greenburgh Tarrytown, NY 10591 Feb 2004 Feb 2004 145 ● ● ● ● ● ● ● ● ● ● ● ● ● ● ● ● ● ● ● ● ● ● ● ● ● ● ● ●38605 Castle On The Hudson Tarrytown, NY 10591 Jun 1996 Jun 1996 3126363 Tarrytown House Tarrytown, NY 10591 Jun 1965 Jun 1965 212 Y ● ● ● ● ● ● ● ● ● ● ● ● ● ● ● ● ● ● ● ● ● ● ● ● ● ● ● ●18495 Courtyard Tarrytown Greenburgh Tarrytown, NY 10591 Jan 1988 Jan 1988 139 ● ● ● ● ● ● ● ● ● ● ● ● ● ● ● ● ● ● ● ● ● ● ● ● ● ● ● ●9853 Doubletree Tarrytown Tarrytown, NY 10591 Jun 2007 Jan 1961 0 ● ● ● ● ● ●32503 Closed IBM Thornwood Conference Ctr Thornwood, NY 10594 015402 Residence Inn White Plains Westchester Cnty White Plains, NY 10601 Jun 1996 Jun 1982 133 ● ● ● ● ● ● ● ● ● ● ● ● ● ● ● ● ● ● ● ● ● ● ● ● ● ● ● ●15403 Closed Esplanade White Plains White Plains, NY 10601 Dec 1989 Jun 1966 0
2005 2006 2007
3881 Crowne Plaza White Plains Downtown Area White Plains, NY 10601 Dec 1985 Dec 1985 401 ● ● ● ● ● ● ● ● ● ● ● ● ● ● ● ● ● ● ● ● ● ● ● ● ● ● ● ●38312 Hyatt Summerfield Suites White Plains Westchester White Plains, NY 10604 Jan 2000 Jan 2000 159 ● ● ● ● ● ● ● ● ● ● ● ● ● ● ● ● ● ● ● ● ● ● ● ● ● ● ● ●10344 Renaissance Westchester Hotel White Plains, NY 10604 May 1995 Apr 1981 347 ● ● ● ● ● ● ● ● ● ● ● ● ● ● ● ● ● ● ● ● ● ● ● ● ● ● ● ●46800 Central Motel Court White Plains, NY 10606 2823549 Closed County Center Motel White Plains, NY 10607 043172 Tuckahoe Motor Inn Yonkers, NY 10710 Jan 1996 Jan 1996 82
80 Ramada Yonkers Yonkers, NY 10710 May 2005 Nov 1962 103 ● ● ● ● ● ● ● ● ● ● ● ● ● ● ● ● ● ● ● ● ● ● ● ● ● ● ●20531 Royal Regency Yonkers, NY 10710 Jun 1996 91 Y39450 Residence Inn New Rochelle New Rochelle, NY 10801 Jan 2000 Jan 2000 124 ● ● ● ● ● ● ● ● ● ● ● ● ● ● ● ● ● ● ● ● ● ● ● ● ● ● ● ●1753 Radisson Hotel New Rochelle New Rochelle, NY 10801 Jun 2004 Jun 1974 129 ● ● ● ● ● ● ● ● ● ● ● ● ● ● ● ● ● ● ● ● ● ● ● ● ● ● ● ●10071 Howard Johnson Suffern Suffern, NY 10901 Oct 2006 Jun 1985 95 ● ● ● ● ● ● ● ● ● ● ● ● ● ● ● ● ● ● ● ● ● ○ ○ ○ ○ ○ ○ ○
79 Holiday Inn Suffern Suffern, NY 10901 Oct 1990 Jun 1979 243 ● ● ● ● ● ● ● ● ● ● ● ● ● ● ● ● ● ● ● ● ● ● ● ● ● ● ● ●15283 Bear Mountain Inn Bear Mountain, NY 10911 Jun 1914 Jun 1914 46 Y48170 Raintree Motel Congers, NY 10920 2051265 New Rockland Motel Garnerville, NY 10923 5045165 Closed Ramapo Hillside Motel Hillburn, NY 10931 0
77 Closed The Nanuet Inn Nanuet, NY 10954 Nov 1995 Jun 1968 019737 Days Inn Nanuet Nanuet, NY 10954 Oct 1999 70 ● ● ● ● ● ● ● ● ● ● ● ● ● ● ● ● ● ● ● ● ● ● ● ● ● ● ● ●50682 Hilton Garden Inn Nanuet Nanuet, NY 10954 Oct 2003 Oct 2003 88 ● ● ● ● ● ● ● ● ● ● ● ● ● ● ● ● ● ● ● ● ● ● ● ● ● ● ● ●1752 Comfort Inn Nanuet Nanuet, NY 10954 Apr 1993 Jun 1960 152 Y ○ ○ ○ ○ ○ ○ ○ ○ ○ ○ ● ● ● ● ● ● ● ● ● ● ● ● ● ● ● ● ● ●55239 Hampton Inn Nanuet Nanuet, NY 10954 Jan 2007 Jan 2007 84 ● ● ● ●40472 Candlewood Suites Nanuet Rockland County Nanuet, NY 10954 May 2001 May 2001 124 ● ● ● ● ● ● ● ● ● ● ● ● ● ● ● ● ● ● ● ● ● ● ● ● ● ● ● ●20498 Best Western Nyack On Hudson Nyack, NY 10960 Jul 1989 Jun 1963 808758 Super 8 Nyack Nyack, NY 10960 Aug 1985 Aug 1985 43 ● ● ● ● ● ● ● ● ● ● ● ● ● ● ● ● ● ● ● ● ● ● ● ● ● ● ● ●22955 Closed Quality Inn Tappan Zee Nyack, NY 10960 0
95 Holiday Inn Orangeburg Orangeburg, NY 10962 Apr 1971 Apr 1971 167 ● ● ● ● ● ● ● ● ● ● ● ● ● ● ● ● ● ● ● ● ● ● ● ● ● ● ● ●32502 Dolce IBM Palisades JCC Palisades, NY 10964 Jun 2000 Apr 1989 206 ● ● ● ● ● ● ● ● ● ● ● ○ ● ● ● ● ● ● ● ● ● ● ● ○ ● ● ● ●12648 Hilton Pearl River Pearl River, NY 10965 Jun 1988 Jun 1988 150 ● ● ● ● ● ● ● ● ● ● ● ● ● ● ● ● ● ● ● ● ● ● ● ● ● ● ● ●20553 Closed Best Western Chestnut Ridge Chestnut Ridge, NY 10977 Mar 1989 07378 Fairfield Inn Spring Valley Spring Valley, NY 10977 Dec 2000 Apr 1988 105 ● ● ● ● ● ● ● ● ● ● ● ● ● ● ● ● ● ● ● ● ● ● ● ● ● ● ● ●45141 Stony Point Motel Stony Point, NY 10980 3320497 Nyack Motor Lodge West Nyack, NY 10994 Jun 1960 Jun 1960 111
Total Properties: 69 7076 ○ - Monthly data received by STR● - Monthly and daily data received by STRBlank - No data received by STRY - (Chg in Rms) Property has experienced a room addition or drop during the time period of the report
No representation is made as to the completeness or accuracy of the information in this report. The information is in no way to be construed as a recommendation by Smith Travel Research of any industry standard and is intended solely for the internal purposes of your company. It should not be published in any manner unless authorized by Smith Travel Research. A blank row indicates insufficient data. Copyright © 2007 Smith Travel Research, Inc. All rights reserved.

URGO HOTELS
Urgo Hotels develops, owns and operates distinctive hotels in significant markets which consistently outperform their primary competitors and achieve outstanding financial returns for ownership. The company and its affiliates presently have ownership interests in and/or operate 18 hotels with a total of 2,651 rooms in six north-eastern and Mid-Atlantic States, the District of Columbia and the provinces of Quebec and Newfoundland in Canada. Urgo Hotels generated more than $113 million of revenue in 2006.
Since the early 1980’s, Urgo Hotels and predecessor entities, have been involved in the development, acquisition, rehabilitation, re-positioning, and management of hotel properties. Starting in 1982 with the construction and financing of the 617 room Marriott Hotel & Conference Center in Uniondale, New York, and continuing up to the August 2005 opening of the 15-story, 188 unit “Residence Inn at the Inner Harbor” in downtown Baltimore, Maryland, as well as the August 2006 opening of the “Marriott Residence Inn and Marriott Courtyard Montreal Airport”. Urgo Hotels and its predecessors have been involved in all aspects of ground-up development, conversion and renovated properties from acquisition, entitlement and design to financing. Today, there are eighteen hotels in this portfolio as well as involvement in multiple mixed-use developments across the east coast and in the Caribbean, including proposed Ritz Carlton projects in Antigua, Bermuda and Costa Rica and three five-star luxury hotel and residential developments as a part of a 500 acre mixed-use development on the Island of Eleuthera in the Bahamas which includes an 18-hole golf course and a 200 slip marina, and multiple hotels under development in North America, two property interests having been disposed in 2001 and two more in 2006. These hotels are listed in the attached property list and all of them, except for the Bethesda “Residence Inn by Marriott” are managed by Urgo Hotels.
As hotel developers, investment advisors, and managers, the principals of Urgo Hotels have shown a unique ability to create and arrive at solutions for their clients and partners. Over the years, Urgo Hotels and its predecessor - Urgo Butts & Company - have acted as counsel and advisors to a number of institutional, development, and operating clients including, among others, the Marriott Corporation, Hyatt Corporation, Hilton International Hotels, Howard Johnson, the World Bank, the IMF, the Trammel Crow organization, Ted Lerner Enterprises, Americana Hotels and Realty Corporation, Hanover Trust Company, The Bank of New York, The Riggs National Bank of Washington, D.C., Chemical Bank, The Travelers Insurance Company and Merrill Lynch. Airline clients have included Northwest, Pan Am, TWA, Aer Lingus, BWIA and LIAT.
Operations
Under the stewardship of its senior management team, Urgo Hotels has been recognized as one of the top 100 hotel developers by Hotel Business Magazine, an industry publication, and by the Marriott and Hilton franchise communities as one of the top performing hotel operators within their respective franchise groups.

As an integral part of its comprehensive range of hospitality services, Urgo Hotels and its affiliates have achieved outstanding operating results for hotel properties under their management including hotels affiliated with Marriott, Hilton, Sheraton, Radisson and Choice. Hotels within the Urgo portfolio have consistently ranked among the top performers within their respective franchise systems in several key categories. The following illustrates a sample of some of the awards from Marriott International Inc. and affiliated companies won by some of these hotels (several on multiple occasions) in recognition of outstanding operating performance: Chairman’s Award, Regional Hotel of the Year, Highest Extended Stay Occupancy, Quality Assurance Award, Gold and Silver Awards, Highest RevPAR, Highest Occupancy, Highest ADR, General Manager of the Year, Sales Team of the Year, Superstar Development Award, Revenue Management Team of the Year, Combined Sales and Operations Team of the Year, Highest Guest Satisfaction, Highest Occupancy Penetration Index, Highest ADR penetration index, and Highest Revpar penetration index. Our hotels consistently outperform their competitors in their respective markets.
Development, Acquisition and Rehabilitation/Repositioning Process and Expertise
Urgo Hotels pursues opportunities to develop or acquire and rehabilitate or reposition hotels under premium brands, usually with Marriott and Hilton franchise affiliations. Urgo Hotels’ ground up development and acquisition philosophy is based on an opportunistic strategy of establishing hotels in major metropolitan markets where there are multiple demand generators which meet the following criteria: (1) the barriers to entry have proven too difficult for most hotel firms to overcome; (2) hotel demand is substantially greater than supply; (3) the competitive hotels exhibit economic obsolescence; and/or (4) Urgo Hotels is able to gain a competitive advantage through superior franchise affiliation. Throughout the development process, Urgo Hotels assembles the development team and co-ordinates each aspect of the process including conception, hotel operations, personnel, investors, lenders, and market consultants.
Urgo Hotels has extensive experience in ground up development and adaptive re-use projects (i.e converting existing residential and office buildings to hotel use). Once a site is chosen, Urgo Hotels assembles and co-ordinates the due diligence team including legal, engineering, testing, construction estimating/budgeting, management and marketing consultants. Urgo Hotels draws upon its historical database for budgeting development costs and operating projections, usually supported by independent, third-party market analysis. Additionally, design and construction is performed by independent, third-party architects, engineers and contractors, co-coordinated by Urgo Hotels. Urgo Hotels then selects and coordinates the efforts of the management team in conjunction with the general contractor through the pre-opening phases of construction. Throughout the development process, Urgo Hotels deploys the hotel operations team which participates in the planning of the facilities program and management of the pre-opening process which includes oversight of hotel staffing, marketing plans and operating and capital budgets.
Urgo Hotels’ development process consists of the following elements:

- Identify site
- Negotiate acquisition and conduct due diligence
- Obtain third-party feasibility, environmental, geotechnical and design studies
- Develop construction budget and initial five-year operations budget
- Work up preliminary drawings; prepare and complete entitlement process
- Arrange franchise license
- Conduct and complete interviewing and bidding process for contractor
- Commence construction
- Provide construction project management services
- Begin pre-opening process approximately one hundred and twenty to one hundred and eighty days prior to completing project
- “Punch out” final building and obtain certificate of occupancy
Urgo Hotels also targets acquisition opportunities that exhibit potential for increased value through (1) repositioning, (2) rehabilitation and/or (3) more affective management. Urgo’s process for acquiring and rehabilitating or repositioning hotel properties is very similar to the above development process in terms of sourcing opportunities, assembling and orchestrating the right development team, and managing the execution of the property improvement plan and take-over. The repositioning and rehabilitation processes typically require significant capital investment to expedite major improvements such as replacement of furniture, fixtures and equipment, procurement and installation of franchise operating supplies and reservation and property management systems, upgrades to building exteriors, as well as to public space, common areas and back of house space. Rehabilitation projects call for substantial construction related activities; therefore the process usually necessitates the closure of all or part of the property for some time.
Urgo Hotels also looks for opportunities to acquire mismanaged assets in which the operating performance of a hotel is not reaching its full potential as a result of ineffective management practices.
Senior Management
Urgo Hotels’ senior team members average over 20 years of professional experience in all aspects of the hospitality industry. In addition to the development, acquisition, financing and operation of several hotels for Urgo Hotels, members of senior management have encountered and resolved complex financing, investment, acquisition,

development and redevelopment issues relating to all hotel property types for several clients over the years.
Donald J. Urgo, Sr. – President & CEO
Mr. Urgo received his undergraduate and law degrees from Fordham University in New York and began his law practice in 1962 with the New York law firm of Hughes, Hubbard and Reed. He developed a specialty in international business transactions with emphasis on the hotel and airlines industries.
In 1972, Mr. Urgo was retained by the Marriott Corporation to spearhead an effort to expand the Company’s operations throughout the world. During the next 15 years, he was directly responsible for a number of key acquisitions and joint ventures including the acquisition of the Sun Line Cruise Line; the acquisition of the Howard Johnson Company and divestment of the Howard Johnson franchise group to Prime Motors Inns; and the development and acquisition of numerous hotels and air catering facilities throughout the world. Mr. Urgo also played a key role in the conversion of the Essex House Tower in New York and the Camelback Inn in Scottsdale, Arizona to condominium hotels.
In addition to his work for Marriott, Mr. Urgo has acted as counsel and advisor to a number of institutional, development and operating clients including, among others, Howard Johnson, the Trammel Crow Organization, Ted Lerner Enterprises, Americana Hotels and Realty Corporation, the Bank of New York, Riggs National Bank of Washington, DC, the Travelers Insurance Company and Merrill Lynch.
Throughout his career, Mr. Urgo has also rendered professional services regarding hotel and other matters to a number of airline clients including TWA, Northwest, Pan American, Aer Lingus, and BWIA.
As an integral part of his comprehensive range of advisory and investment services, Mr. Urgo co-founded a hotel management company whose primary role has been to manage hotel assets for clients and investment partnerships in which he participates.
While over the years Mr. Urgo has maintained a close working relationship with Marriott that has enabled his firm to maximize the value of the Marriott Hotels in which he is involved, he also has established solid relationships with executive management throughout the hotel industry which enhance his ability to develop and operate additional brands when and where appropriate.
Donald J. Urgo, Jr. – Senior Vice President, General Counsel
Don Urgo, Jr. received a B.B.S. in Finance from the University of Notre Dame followed by a law degree from the Columbia School of Law, Catholic University of America in 1990. He spent six years in private practice as a litigation attorney practicing in the state and federal courts of Maryland and the District of Columbia. While

concentrating in the areas of contract and commercial law, torts and workers' compensation matters, Mr. Urgo’s clients included companies such as Bell Atlantic/Verizon, Marriott International, Inc., Liberty Mutual Insurance Company and the Travelers Insurance Company.
Mr. Urgo left private practice to join Integrated Communications Corporation in 1996. A privately held firm headquartered in Delray Beach, Florida, ICC is a communications marketing and management company that specializes in servicing the hospitality industry and handles a wide array of communications services for more than 2,300 hotels and motels nationwide. As General Counsel for ICC, Mr. Urgo handled all of the firm’s legal and regulatory affairs. He was directly responsible for negotiating and handling the company's agreements with all of its current carriers, agents and customers, including contracts with MCI Communications Corporation worth approximately $150 million in revenue.
Since joining Urgo Hotels in 1998, Mr. Urgo’s role has expanded from handling the day-to-day legal affairs of the organization to include active participation in the company’s corporate and management activities. His legal background and entrepreneurial experience are a perfect complement to the industry expertise of the firm’s other executive team members.
Kevin M. Urgo - Senior Vice President, Development and Finance
Since joining Urgo Hotels in August of 1998, Kevin Urgo has been actively involved in all aspects of the company’s development and management activities. Mr. Urgo’s primary focus is the oversight of the company’s acquisition, development, strategic planning and corporate and project financing activities.
Prior to joining Urgo Hotels, Mr. Urgo was Vice President of Acquisitions and Development with Sunburst Hospitality Corporation, a New York Stock Exchange company and a spin-off company of Choice Hotels International and Manor Care, Inc. While at Sunburst Hospitality and its predecessors since 1995, Mr. Urgo was responsible for the company’s acquisition and development activities in the Southeast and Mid-Atlantic regions, which included the active involvement and oversight of more than 25 hotel acquisitions and development projects.
Prior to joining Sunburst Hospitality, Mr. Urgo worked as a consultant with Arthur Consulting Group International, acting as advisor to several institutional groups, various domestic and international governmental organizations and private developers including, among others, Hyatt Corporation, Choice Hotels International, Industria Nacional Hotelera, the World Bank, Organization of American States, the City of Oakland, CA and the City of Quincy, MA. While with Arthur Consulting Group, Mr. Urgo conducted hotel and restaurant market and feasibility studies, appraisals and economic impact studies, as well as tourism area development studies and strategic planning assignments. Prior to his tenure with Arthur Consulting Group International, Mr. Urgo worked for various financial institutions.

Collin D. Urgo – Senior Vice President, Operations/Marketing
Collin Urgo began his career with Residence Inn by Marriott in 1990 as a member of the opening team at the Plainview Residence Inn by Marriott, the first extended stay property ever to be converted by Residence Inn, or any other major hotel chain. Since then he has been a member of, or managed, the conversion or opening of more than 15 upscale extended stay, select service and focused service hotels for Marriott and Hilton.
His experience with Marriott began in housekeeping and took him through maintenance, meetings / banquets, food service, front office and sales from 1990 to 1995. After serving as Business Travel Sales Manager on the opening team at the Gaithersburg Washingtonian Center Marriott in 1992 and serving as a Regional Sales Manager for twenty-five Courtyard and Fairfield Inn by Marriott hotels in Washington, DC, Maryland and Virginia from 2003 to 2005, he joined Urgo Hotels to open the White Plains, New York Residence Inn by Marriott as Director of Sales.
Collin became the General Manager of the White Plains Residence Inn by Marriott in 1999. He was named General Manager of the Year 2001 for Residence Inn by Marriott’s northeast region and the “Business Person of the Year 2001” for Westchester County, New York while holding that position until 2002, when he became V. P. Operations for Urgo Hotels.
He has spent the better part of his fifteen years in the industry representing high end branded extended stay, select service and focused service hotels such as Residence Inn, Courtyard, Spring Hill Suites and Fairfield Inn by Marriott and Homewood Suites and Hilton Garden Inn by Hilton. He is one of the most experienced executives in the industry when it comes to positioning, marketing, selling and operating these atypical hotels.
Phil Daniel – Senior Vice President, Finance
Phil Daniel worked for Americana Hotels Corporation from 1973 to 1987, holding a variety of positions including Vice President, Accounting; Director of Financial Services; Northeast Regional Controller, Property Controller, and Assistant General Manager.
From 1985 to 1987, Mr. Daniel assisted Americana Hotels Corporation, Americana Hotels & Realty Corporation, and Bass Enterprises in Ft. Worth, Texas, with the sale and disposition of 36 Hotels, Resorts and Inns.
Since joining Urgo Hotels in 1987, Mr. Daniel has served as Corporate Controller and Chief Financial Officer for 19 Hotels and several affiliates and partnerships. During that time, he continued to assist Americana Hotels & Realty Corporation in Boston with the sale of its hotels and liquidation of its Real Estate Investment Trust.
Presently, Mr. Daniel supervises the operations of Urgo Hotels’ managed properties as well as the financial and accounting administration.

Richard Riccio - Vice President, US Operations
Richard Riccio received a B.S. in Marketing and Finance form the University of Connecticut in 1989. He has been a presence in the hotel industry since 1987. He started in the industry as a front line employee, a Bellman at the Marriott Trumbull, CT. After joining Residence Inn by Marriott in 1990, he quickly became a General Manager specializing in opening and ramping up hotels throughout the United States. In 1997, Richard was honoured as Marriott's Opening General Manager of the Year.
Richard has been a member of the Residence Inn by Marriott System Standards Board since 1998. The Residence Inn System Board assists Marriott International in setting guidelines and standards for the brand. Richard joined Urgo Hotels in October, of 2003 to head US Operations. Richard continues to focus the portfolio of Marriot and Hilton products on three major themes: revenue generation, exceptional service and return on owner investment.
Serge Primeau – Vice President, Canadian Operations
Serge Primeau has a degree in political science from the University of Ottawa. He has been in the hotel industry for more than 15 years. His career started on the sales side as Account Executive, Director of Sales, and Director of Sales & Marketing for Le Chantecler Resort and Conference Center over the course of 8 years.
He was General Manager of Hotel La Sapiniere, a well-known hotel recognized for its 4-Star service, outstanding dining and wine cellar. He joined Urgo Hotels at the Marriott Residence Inn in Mont-Tremblant in 1997, acting as General Manager while becoming Vice President of Canadian Operations for the company. He has been a board and executive member of Quebec Resort and Country Inns for 3 years, founding member of the Laurentian Convention Bureau and is President of The Maple Route Association (comprised of all Eastern Canada's key suppliers of tourism products to the Japanese market). He is also a board member of the Tremblant Resort Association and is involved in the marketing committee of the Tremblant Resort as well as many other sub-committees. He has a wide knowledge of the national and international markets and has been involved in many tourism missions in Europe, Japan and the United States along with Tourism Quebec and the Canadian Tourism Commission.
Robert Spence – Vice President, Quality Assurance
Robert Spence is presently responsible for Quality Assurance for Urgo Hotels. Robert’s primary focus is to ensure that the high standard of Quality Assurance is consistent throughout the company’s properties. On a daily basis, Robert focuses on the execution of new systems and standards within the hotels. Robert is also heavily involved with new construction projects and property-specific major renovations.
Robert’s corporate responsibilities include, in part, training all Chief Engineers on fire protection and life safety systems within the hotels; understanding and managing departmental budgets and inventories; facilitating communication inside and outside of the hotels; as well as daily job duties and oversight.

Robert brings over 25 years of engineering and general construction expertise to Urgo Hotels. Having formerly served as Regional Director of Engineering for the company, he has mastered all phases of mechanical equipment, including HVAC, electrical, plumbing, carpentry, painting and maintenance for indoor and outdoor pools and spas.
Robert’s overall expertise and command of the hospitality industry, as well as his detailed working knowledge of Marriott and Urgo Hotels systems and procedures, continues to be a major contribution to the current and future success of Urgo Hotels.
Ellen Wimsatt – Corporate Director of Human Resources
As Corporate Director of Human Resources for Urgo Hotels, Ms. Wimsatt works closely with general managers and senior management on management recruiting, staffing, and career development issues. Her responsibilities also cover overall human resources administration and employee relations.
Prior to joining Urgo Hotels in July 2003, Ms. Wimsatt spent 15 years with Marriott International. As Director of Employment and Director of Career Development for the Residence Inn brand, Ms. Wimsatt managed all management staffing and succession planning initiatives for the Regional Operations and Regional Sales teams. She created and facilitated training programs for hotel general managers and sales directors at national conferences. She was the Residence Inn brand liaison on many corporate-wide initiates (eg: Sales 2000; Marriott’s Career Management System; Cross Brand Training; Marriott Lodging Relocation). Her experience with Marriott covers all brands, international and domestic hotels, franchise relations, and corporate and executive staff.
Ms. Wimsatt’s career began in Wichita, Kansas, where she was part of the transition team when Marriott acquired the Residence Inn Company in 1987.

Hotel Market Report Exhibit B.2
Brand Location Year Acquired
Market Type Building Type
Develop. Type
# of Units
West Orange, NJ 2002 Rural 3
Story New Build 128
Mont Tremblant, Can
1997 Resort/ International
3 Story
New Build 127
Plainview, NY 1990 Rural 3 Story Conv. 170
New Rochelle, NY 1998 Urban/
Downtown 10
Story New Build 124
Baltimore, MD 2005 Urban/ Downtown
15 Story
New Build 189
Montreal Airport, Canada
2006 Airport/ Urban/ International
6 Story
New Build 170

Hotel Market Report Exhibit B.2
Mont Tremblant, Canada
2004 Resort/ International
3 Story Conv. 104
Long Island, NY 2002 Airport/
Rural 7
Story New Build 154
Quebec City, Canada 2003
Resort/ Downtown/ International
8 Story Conv. 111
Stamford, CT 2005 Urban/ Downtown
6 Story
New Build 115
St. Johns, Newfoundland, Canada
2005 Resort/ Downtown/ International
6 Story
New Build 87

Hotel Market Report Exhibit B.2
Montreal Airport, Canada
2006 Airport/ Urban/ International
6 Story
New Build 161
Washington, DC 2002 Urban/
Downtown 16
Story Purchase 300
Burlington, MA 2007 Rural Purchase 179
Montreal, Canada 2001
Resort/ Downtown/ International
6 Story
New Build 124
Syosset, NY 1994 Rural 3 Story Conv. 82

Hotel Market Report Exhibit B.2
Garden City, NY
2007 Rural 4
Story Purchase 143

Tab 8 - ClassicRockland/Westchester, All Properties, Starting In 2001Job Number: 149451 Staff: PP Created: June 11, 2007
Date Occupancy ADR RevPar Supply Demand Revenue Census & Sample %
This Year % Chg This Year % Chg This Year % Chg This Year % Chg This Year % Chg This Year % Chg Census Props Census Rooms% Rooms STAR
ParticipantsJan 01 62.7 135.62 85.01 210,428 131,903 17,888,384 56 6,788 78.1Feb 01 67.2 136.14 91.42 190,064 127,629 17,374,971 56 6,788 78.1Mar 01 71.4 134.87 96.27 210,428 150,201 20,257,387 56 6,788 78.1Apr 01 72.7 134.61 97.93 203,640 148,147 19,941,878 56 6,788 78.1May 01 75.4 137.97 104.03 214,272 161,567 22,291,038 57 6,912 76.7Jun 01 78.6 138.05 108.53 207,360 163,024 22,505,352 57 6,912 78.5Jul 01 71.6 131.53 94.13 216,256 154,766 20,356,140 57 6,976 78.7
Aug 01 72.8 128.27 93.41 216,256 157,481 20,200,703 57 6,976 78.7Sep 01 68.2 125.83 85.80 209,280 142,702 17,955,968 57 6,976 78.7Oct 01 77.4 130.19 100.76 216,256 167,366 21,788,875 57 6,976 78.7Nov 01 67.0 123.71 82.94 209,280 140,299 17,356,843 57 6,976 78.7Dec 01 57.1 121.74 69.57 216,256 123,577 15,044,809 57 6,976 78.7
Apr YTD 2001 68.5 135.27 92.64 814,560 557,880 75,462,620Total 2001 70.2 131.72 92.45 2,519,776 1,768,662 232,962,348
Jan 02 57.1 -8.9 125.20 -7.7 71.46 -15.9 212,691 1.1 121,394 -8.0 15,198,987 -15.0 56 6,861 80.0Feb 02 57.8 -14.0 123.73 -9.1 71.46 -21.8 192,108 1.1 110,949 -13.1 13,728,269 -21.0 56 6,861 80.0Mar 02 61.6 -13.7 122.98 -8.8 75.76 -21.3 212,691 1.1 131,026 -12.8 16,113,165 -20.5 56 6,861 82.7Apr 02 69.0 -5.2 127.13 -5.6 87.70 -10.4 205,830 1.1 141,989 -4.2 18,050,973 -9.5 56 6,861 82.7May 02 70.8 -6.0 125.67 -8.9 89.03 -14.4 212,691 -0.7 150,678 -6.7 18,935,069 -15.1 56 6,861 77.2Jun 02 76.4 -2.8 124.09 -10.1 94.83 -12.6 205,830 -0.7 157,295 -3.5 19,518,037 -13.3 56 6,861 77.2Jul 02 73.3 2.4 116.87 -11.1 85.65 -9.0 212,691 -1.6 155,886 0.7 18,217,817 -10.5 56 6,861 77.2
Aug 02 73.2 0.5 116.58 -9.1 85.36 -8.6 212,691 -1.6 155,728 -1.1 18,154,241 -10.1 56 6,861 77.2Sep 02 70.0 2.7 121.81 -3.2 85.29 -0.6 205,830 -1.6 144,120 1.0 17,555,876 -2.2 56 6,861 77.2Oct 02 77.5 0.2 123.80 -4.9 95.98 -4.7 212,691 -1.6 164,899 -1.5 20,413,782 -6.3 56 6,861 77.2Nov 02 65.4 -2.4 115.55 -6.6 75.62 -8.8 205,830 -1.6 134,701 -4.0 15,565,052 -10.3 56 6,861 77.2Dec 02 58.0 1.6 112.60 -7.5 65.35 -6.1 212,691 -1.6 123,444 -0.1 13,899,844 -7.6 56 6,861 77.2
Apr YTD 2002 61.4 -10.4 124.84 -7.7 76.63 -17.3 823,320 1.1 505,358 -9.4 63,091,394 -16.4Total 2002 67.6 -3.7 121.36 -7.9 82.00 -11.3 2,504,265 -0.6 1,692,109 -4.3 205,351,112 -11.9
Jan 03 54.4 -4.7 116.40 -7.0 63.28 -11.4 212,691 0.0 115,631 -4.7 13,459,245 -11.4 56 6,861 77.2Feb 03 60.8 5.3 114.08 -7.8 69.36 -2.9 192,108 0.0 116,796 5.3 13,324,266 -2.9 56 6,861 77.2Mar 03 63.5 3.1 115.42 -6.1 73.32 -3.2 212,691 0.0 135,118 3.1 15,595,007 -3.2 56 6,861 77.2Apr 03 67.9 -1.6 114.31 -10.1 77.59 -11.5 205,830 0.0 139,718 -1.6 15,971,231 -11.5 56 6,861 77.2May 03 74.0 4.5 115.84 -7.8 85.76 -3.7 212,691 0.0 157,456 4.5 18,240,191 -3.7 56 6,861 77.2Jun 03 78.8 3.1 121.29 -2.3 95.53 0.7 205,830 0.0 162,113 3.1 19,662,178 0.7 56 6,861 77.2Jul 03 75.0 2.4 114.53 -2.0 85.94 0.3 212,691 0.0 159,594 2.4 18,278,494 0.3 56 6,861 77.2
Aug 03 74.4 1.6 113.65 -2.5 84.53 -1.0 212,691 0.0 158,194 1.6 17,978,760 -1.0 56 6,861 77.2Sep 03 72.9 4.1 120.75 -0.9 88.05 3.2 205,830 0.0 150,082 4.1 18,122,943 3.2 56 6,861 77.2Oct 03 78.6 1.4 121.59 -1.8 95.57 -0.4 214,458 0.8 168,563 2.2 20,496,163 0.4 56 6,918 76.6Nov 03 63.9 -2.3 114.77 -0.7 73.36 -3.0 207,540 0.8 132,651 -1.5 15,224,838 -2.2 56 6,918 77.9Dec 03 53.0 -8.7 114.62 1.8 60.75 -7.0 214,458 0.8 113,666 -7.9 13,028,373 -6.3 56 6,918 77.9
Apr YTD 2003 61.6 0.4 115.03 -7.9 70.87 -7.5 823,320 0.0 507,263 0.4 58,349,749 -7.5Total 2003 68.1 0.8 116.63 -3.9 79.45 -3.1 2,509,509 0.2 1,709,582 1.0 199,381,689 -2.9
Jan 04 51.4 -5.4 116.26 -0.1 59.81 -5.5 214,458 0.8 110,316 -4.6 12,825,758 -4.7 56 6,918 77.9Feb 04 58 0 -4 6 116 37 2 0 67 53 -2 6 197 764 2 9 114 754 -1 7 13 354 228 0 2 57 7 063 78 3Feb 04 58.0 -4.6 116.37 2.0 67.53 -2.6 197,764 2.9 114,754 -1.7 13,354,228 0.2 57 7,063 78.3Mar 04 63.9 0.6 118.18 2.4 75.56 3.1 218,953 2.9 139,995 3.6 16,544,669 6.1 57 7,063 78.3Apr 04 67.0 -1.3 116.87 2.2 78.28 0.9 211,890 2.9 141,929 1.6 16,587,505 3.9 57 7,063 78.3May 04 70.1 -5.3 119.22 2.9 83.62 -2.5 220,565 3.7 154,699 -1.8 18,442,631 1.1 57 7,115 78.5Jun 04 77.0 -2.2 121.78 0.4 93.81 -1.8 213,450 3.7 164,425 1.4 20,023,761 1.8 57 7,115 78.5Jul 04 72.5 -3.4 120.77 5.4 87.57 1.9 220,565 3.7 159,933 0.2 19,315,068 5.7 57 7,115 83.7
Aug 04 73.5 -1.2 118.25 4.0 86.90 2.8 220,565 3.7 162,093 2.5 19,167,100 6.6 57 7,115 83.7Sep 04 73.9 1.4 124.84 3.4 92.27 4.8 213,450 3.7 157,749 5.1 19,694,150 8.7 57 7,115 83.7Oct 04 80.2 2.1 125.24 3.0 100.48 5.1 220,999 3.1 177,322 5.2 22,207,004 8.3 57 7,129 83.8Nov 04 71.6 12.0 121.48 5.8 86.98 18.6 213,870 3.1 153,123 15.4 18,601,739 22.2 57 7,129 83.8Dec 04 59.9 13.1 115.87 1.1 69.45 14.3 220,999 3.1 132,469 16.5 15,349,304 17.8 57 7,129 83.8
Apr YTD 2004 60.1 -2.4 116.99 1.7 70.35 -0.7 843,065 2.4 506,994 -0.1 59,312,160 1.6Total 2004 68.4 0.3 119.92 2.8 81.98 3.2 2,587,528 3.1 1,768,807 3.5 212,112,917 6.4
Jan 05 58.5 13.8 118.77 2.2 69.50 16.2 220,534 2.8 129,050 17.0 15,327,577 19.5 57 7,114 83.9Feb 05 63.7 9.8 118.11 1.5 75.25 11.4 199,192 0.7 126,907 10.6 14,988,655 12.2 57 7,114 83.9Mar 05 65.4 2.2 120.56 2.0 78.82 4.3 220,534 0.7 144,174 3.0 17,381,654 5.1 57 7,114 83.9Apr 05 73.4 9.7 120.68 3.3 88.64 13.2 213,420 0.7 156,750 10.4 18,917,310 14.0 57 7,114 83.9May 05 70.8 0.9 125.17 5.0 88.61 6.0 220,534 -0.0 156,124 0.9 19,541,921 6.0 57 7,114 82.5Jun 05 76.1 -1.2 129.07 6.0 98.20 4.7 212,640 -0.4 161,777 -1.6 20,880,552 4.3 56 7,088 84.3Jul 05 73.7 1.7 121.83 0.9 89.82 2.6 219,728 -0.4 161,992 1.3 19,735,754 2.2 56 7,088 80.8
Aug 05 75.8 3.2 127.63 7.9 96.77 11.4 212,102 -3.8 160,815 -0.8 20,525,082 7.1 55 6,842 83.7Sep 05 75.4 2.1 129.77 3.9 97.88 6.1 205,260 -3.8 154,815 -1.9 20,090,417 2.0 55 6,842 83.7Oct 05 76.9 -4.1 132.01 5.4 101.52 1.0 212,102 -4.0 163,121 -8.0 21,533,070 -3.0 55 6,842 83.7Nov 05 70.0 -2.2 130.39 7.3 91.32 5.0 205,260 -4.0 143,760 -6.1 18,744,426 0.8 55 6,842 83.7Dec 05 57.2 -4.5 127.22 9.8 72.80 4.8 212,102 -4.0 121,368 -8.4 15,440,042 0.6 55 6,842 83.7
Apr YTD 2005 65.2 8.5 119.62 2.3 78.03 10.9 853,680 1.3 556,881 9.8 66,615,196 12.3Total 2005 69.7 2.0 125.29 4.5 87.38 6.6 2,553,408 -1.3 1,780,653 0.7 223,106,460 5.2
Jan 06 57.7 -1.5 134.20 13.0 77.36 11.3 212,102 -3.8 122,279 -5.2 16,409,253 7.1 55 6,842 83.7Feb 06 59.6 -6.5 133.92 13.4 79.77 6.0 191,576 -3.8 114,121 -10.1 15,282,883 2.0 55 6,842 83.7Mar 06 65.2 -0.2 139.98 16.1 91.31 15.9 212,102 -3.8 138,364 -4.0 19,367,863 11.4 55 6,842 83.7Apr 06 69.8 -4.9 139.57 15.6 97.48 10.0 205,260 -3.8 143,360 -8.5 20,008,101 5.8 55 6,842 83.7May 06 71.8 1.4 145.76 16.5 104.60 18.0 212,102 -3.8 152,210 -2.5 22,186,403 13.5 55 6,842 83.7Jun 06 81.5 7.2 160.62 24.4 130.95 33.4 205,260 -3.5 167,335 3.4 26,877,940 28.7 55 6,842 83.7Jul 06 72.5 -1.7 139.08 14.2 100.82 12.2 212,102 -3.5 153,750 -5.1 21,384,212 8.4 55 6,842 83.7
Aug 06 74.3 -2.0 145.15 13.7 107.90 11.5 212,102 0.0 157,663 -2.0 22,884,767 11.5 55 6,842 83.7Sep 06 80.2 6.3 154.95 19.4 124.23 26.9 205,260 0.0 164,562 6.3 25,499,204 26.9 55 6,842 83.7Oct 06 80.0 4.1 156.65 18.7 125.38 23.5 212,102 0.0 169,763 4.1 26,592,724 23.5 55 6,842 83.7Nov 06 72.1 3.0 155.37 19.2 112.05 22.7 205,260 0.0 148,029 3.0 22,998,674 22.7 55 6,842 83.7Dec 06 59.9 4.6 150.40 18.2 90.03 23.7 212,102 0.0 126,966 4.6 19,095,271 23.7 55 6,842 83.7
Apr YTD 2006 63.1 -3.3 137.16 14.7 86.56 10.9 821,040 -3.8 518,124 -7.0 71,068,100 6.7Total 2006 70.4 1.0 147.06 17.4 103.55 18.5 2,497,330 -2.2 1,758,402 -1.2 258,587,295 15.9
Jan 07 54.7 -5.1 141.13 5.2 77.21 -0.2 219,356 3.4 120,008 -1.9 16,937,118 3.2 57 7,076 84.2Feb 07 62.1 4.3 148.26 10.7 92.08 15.4 198,128 3.4 123,059 7.8 18,244,478 19.4 57 7,076 84.2Mar 07 68.5 5.0 152.00 8.6 104.11 14.0 219,356 3.4 150,247 8.6 22,837,352 17.9 57 7,076 84.2Apr 07 72.7 4.1 151.72 8.7 110.33 13.2 212,280 3.4 154,368 7.7 23,421,275 17.1 57 7,076 84.2
Apr YTD 2007 64.5 2.2 148.70 8.4 95.91 10.8 849,120 3.4 547,682 5.7 81,440,223 14.6
No representation is made as to the completeness or accuracy of the information in this report. The information is in no way to be construed as a recommendation by Smith Travel Research of any industry standard and is intended solely for the internal purposes of your company. It should not be published in any manner unless authorized by Smith Travel Research. A blank row indicates insufficient data. Copyright © 2007 Smith Travel Research, Inc. All rights reserved.

Tab 9 - Response ReportTarrytown, NY Area Selected PropertiesJob Number: 150642 Staff: MS Created: June 18, 2007
STR Code Name of Establishment City & State Zip Code Aff Date Open Date Rooms
Chg in Rms J F M A M J J A S O N D J F M A M J J A S O N D J F M A M J J A S O N D
80 Ramada Yonkers Yonkers, NY 10710 May 2005 Nov 1962 103 ● ● ● ● ● ● ● ● ● ● ● ● ● ● ● ● ● ● ● ● ● ● ● ● ● ● ●110 Hampton Inn White Plains Tarrytown Elmsford, NY 10523 May 1996 Jun 1957 156 ● ● ● ● ● ● ● ● ● ● ● ● ● ● ● ● ● ● ● ● ● ● ● ● ● ● ● ●1753 Radisson Hotel New Rochelle New Rochelle, NY 10801 Jun 2004 Jun 1974 129 ● ● ● ● ● ● ● ● ● ● ● ● ● ● ● ● ● ● ● ● ● ● ● ● ● ● ● ●3881 Crowne Plaza White Plains Downtown Area White Plains, NY 10601 Dec 1985 Dec 1985 401 ● ● ● ● ● ● ● ● ● ● ● ● ● ● ● ● ● ● ● ● ● ● ● ● ● ● ● ●6854 Marriott Westchester Tarrytown, NY 10591 Nov 1981 Nov 1981 444 ● ● ● ● ● ● ● ● ● ● ● ● ● ● ● ● ● ● ● ● ● ● ● ● ● ● ● ●18495 Courtyard Tarrytown Greenburgh Tarrytown, NY 10591 Jan 1988 Jan 1988 139 ● ● ● ● ● ● ● ● ● ● ● ● ● ● ● ● ● ● ● ● ● ● ● ● ● ● ● ●39450 Residence Inn New Rochelle New Rochelle, NY 10801 Jan 2000 Jan 2000 124 ● ● ● ● ● ● ● ● ● ● ● ● ● ● ● ● ● ● ● ● ● ● ● ● ● ● ● ●44884 Springhill Suites Tarrytown Greenburgh Tarrytown, NY 10591 Feb 2004 Feb 2004 145 ● ● ● ● ● ● ● ● ● ● ● ● ● ● ● ● ● ● ● ● ● ● ● ● ● ● ● ●
Total Properties: 8 1641 ○ - Monthly data received by STR● - Monthly and daily data received by STRBlank - No data received by STRY - (Chg in Rms) Property has experienced a room addition or drop during the time period of the report
No representation is made as to the completeness or accuracy of the information in this report. The information is in no way to be construed as a recommendation by Smith Travel Research of any industry standard and is intended solely for the internal purposes of your company. It should not be published in any manner unless authorized by Smith Travel Research. A blank row indicates insufficient data. Copyright © 2007 Smith Travel Research, Inc. All rights reserved.
2005 2006 2007

APPENDIX B: Office Space Market Report

TIF Feasibility Study Appendix B: Office Space Market Report
Cushman & Wakefield, Inc. 800 Westchester Avenue Rye Brook, NY 10573 (914) 997-9391 Tel (914) 997-9548 Fax
Office Component Market Analysis: 1. The disparity between population and available office space is and has been a significant concern in Westchester County for the last 25 years. The high cost of living and the lack of affordable housing throughout most of the County have led to a relatively shallow labor pool. Currently, the available office space in Yonkers is disproportionate to the population of the city as compared with other densely populated cities such as White Plains. If a developer can provide a quality office product, easy access to major thoroughfares and a cheap labor pool the complex will be attractive to employers. Access to quality, relatively inexpensive labor, is a key driver and a significant attraction to occupiers of office space. 2. The commercial real estate market needs to grow in Westchester in order to accommodate the overall economic growth in the County. This is particularly true of quality, Class “A” office space which has seen demand far outstrip supply in Westchester County. There has been a continued flight to quality by tenants searching for Class “A” space that provide a robust amenity package and a location within walking distance to the train. Office markets throughout the metropolitan area are driven by conditions in Midtown Manhattan, the location of choice for most office space users. When the amount of available office space in the Midtown market declines below 7% during periods of economic expansion, rents tend to increase sharply, leading companies to seek less expensive alternatives. Historically, these companies have looked to the Downtown market and, as pricing increased there, moved out to the outer boroughs, New Jersey, Westchester County, and Connecticut. Today, the vacancy rate for Class A office space in Midtown is 5.7%, down from 6.3% a year ago. This decline has pushed rents up to record high levels, with Class A space currently fetching $81.74per sf (“psf”), more than 29% higher than a year earlier. This sharp increase has led many tenants, particularly those with narrow profit margins, to look to less expensive locations. The result has been a rapid tightening of the Downtown market (from 8.0% vacancy a year ago to 5.4% today) and a sharp increase in rents for the Downtown market (Class A rents are up 22% to $52.28psf). As a result, we are now seeing movement to the outer boroughs, Long Island City, New Jersey, Westchester County, and Connecticut. Yonkers has the opportunity to provide a sensible alternative for companies looking outside of Manhattan. It is well positioned to attract companies looking for a low cost alternative and is attractive for its close proximity to NYC and connectivity to the Metro North.

TIF Feasibility Study Appendix B: Office Space Market Report
No warranty representation, express or implied, is made as to the accuracy of the information contained herein, and same is submitted subject to errors, omissions, change of price, rental or other conditions, withdrawal without notice, and to any special listing conditions, imposed by our principals.
3. See attached Market Report. Additionally, below is a list of large blocks of available space currently in the County: Large blocks of current and proposed space in Westchester:
4. Access to the train is a key driver for tenants when considering office locations within Westchester County. It is paramount that a building provides safe and convenient access to the train. Many companies are focused on enticing intellectual capital out of NYC to fill managerial positions within their companies. In order to promote reverse commuting the connectivity to the train must be easy and convenient. Downtown White Plains has office buildings that are up to 15-20 minutes walking distance from the train and still considered within the Central Business District. Those buildings closest to the train have experienced the lowest vacancy rates, with an average vacancy rate of less then 5%. This illustrates that there is pent up demand for large blocks of Class “A” space in buildings located in close proximity to the train. 5 & 8. Projections for rental rates and vacancy rates in the tri-state area will depend on the economic growth of the region and its impact on demand for space, coupled with projected new construction over the time frame. C&W’s demand forecast is based upon employment projections for each market, developed in conjunction with Moody’s Economy.com, a well-known economic consulting and forecasting firm. In summary, the Moody’s forecast calls for a slowdown in employment growth from the strong pace of the past several years as the effects of the national economic slowdown and weakness in the financial sector are felt in the regional economy. However, after a year of moderate growth, there is likely to be a reacceleration of employment growth in the 2009-2012 time frame, as economic performance improves.

TIF Feasibility Study Appendix B: Office Space Market Report
No warranty representation, express or implied, is made as to the accuracy of the information contained herein, and same is submitted subject to errors, omissions, change of price, rental or other conditions, withdrawal without notice, and to any special listing conditions, imposed by our principals.
This continuing employment growth will come into a market that is supply constrained. The Manhattan market supply will increase moderately until 2011-2012. From 2007 to 2010, a total of 6.5 million sf will be delivered to the market, but in 2011 and 2012, as the World Trade Center sites are developed, an additional 18 million sf is likely to be completed. The net result will be continuing rental rate increases until the 2011-2012 period, when new supply will lead to a flattening of rental rates.
We do not expect any significant decline in rents over the next five years, as the fundamental supply/demand drivers will tend to push rents upward. Even if there is a decline in demand, it is likely to be temporary and not affect the overall long-term trend. The fundamental upward trend will carry much of the region along with it. Like Manhattan, significant new construction is not expected in any of these markets, with the exception of Stamford, where there are two major projects under construction. Rental growth will vary substantially from region to region in the metropolitan area. In White Plains, there has been very little change in rents until recently, and we expect a moderate upward trend to develop as a result of rising demand from New York. Similar trends are projected for Fairfield County and New Jersey as well as the boroughs. No area is likely to see rents rise as rapidly as Manhattan; however, as Manhattan prices increase, there will be movement outward with associated upward pressure on rents.

TIF Feasibility Study Appendix B: Office Space Market Report
No warranty representation, express or implied, is made as to the accuracy of the information contained herein, and same is submitted subject to errors, omissions, change of price, rental or other conditions, withdrawal without notice, and to any special listing conditions, imposed by our principals.
Below is a list of the tenants that are currently in the market for office space in the Tri-State area. These are typical of the types of tenants that would consider Yonkers as a viable alternative to relocate their headquarters. Tenants in the Market:

APPENDIX C: Residential Market Report

TIF Feasibility Study Appendix B: Office Space Market Report
No warranty representation, express or implied, is made as to the accuracy of the information contained herein, and same is submitted subject to errors, omissions, change of price, rental or other conditions, withdrawal without notice, and to any special listing conditions, imposed by our principals.
6. See below for requested Submarket statistics:
7. Two examples of mixed use projects that have shown success in the office leasing component are: Vernon Hills Complex, Scarsdale: A 700,000 sf retail and office mixed use complex located in Scarsdale, NY. The complex is home to some of the country’s top retailers including The Gap, Brooks Brothers and American Eagle. The 200,000 sf office portion of the complex has remained between 85%-95% leased over the past 20 years. Triangle Center, Yorktown: A 225,000 sf retail and office mixed use complex located in Yorktown Heights, NY. The 16,000 sf office portion of the complex is currently 100% leased. 9. We believe there will a 12 – 24 month lease up period to bring the property to an equilibrium occupancy rate of 85% - 90%. 10. Cushman and Wakefield is a global real estate firm that has over 11,000-plus worldwide employees, located in 192 offices throughout 58 countries. C&W:
Services more than 200 exclusive or preferred global corporate clients with multiple locations and broad service requirements.
Manage more than 6,800 properties worldwide representing over 385 million square feet. Global: performed 19,200 transactions (leasing and sales)
– More than $69 billion in aggregate value – More than 450 million square feet
United States: performed 9,276 transactions (leasing and sales) – More than $40 billion in aggregate value – More than 323 million square feet

TIF Feasibility Study Appendix B: Office Space Market Report
No warranty representation, express or implied, is made as to the accuracy of the information contained herein, and same is submitted subject to errors, omissions, change of price, rental or other conditions, withdrawal without notice, and to any special listing conditions, imposed by our principals.
Below is a list of C&W’s relevant agency experience in Westchester County:
LEASING AGENCY SIZE (SF)
COMMENTS
44 South Broadway White Plains, NY 850,000
Maintained 85% average occupancy over last five years. Currently responsible for leasing and property management with the building 95% leased.
White Plains Plaza White Plains, NY 700,000 50% leased to 95% leased. Currently responsible for leasing and property
management. 303 South Broadway Tarrytown, NY 180,000 20% leased to 100% leased in 18 months. Building has remained at over
95% leased over the past 10 years. 800 Westchester Avenue Rye Brook, NY 570,000 0% leased to 95% leased in 18 months. Dominated the Eastern
submarket’s transactions in 2006. 120 Bloomingdale Road White Plains, NY 145,000 0% leased to 100% leased in 12 months.
555 Pleasantville Road Briarcliff, NY 138,000 20% leased to 100% leased in 22 months.
Harrison Court White Plains, NY 185,000 60% leased to 100% leased in 12 months. Converted property to all
medical.
900 King Street 200,000 0% leased to 100% in 30 months. Building was vacant for 10 years prior tohiring C&W.
One Theall Road Rye, NY 65,000 Vacant and on the market for lease or sale. Sold the property to a medica
group in 9 months

OFFICE OVERVIEW Third Quarter 2007 WESTCHESTER COUNTY, NEW YORK
M A R K E T B E A T S N A P S H O T
During the third quarter,
activity remained strong
across the county with a
steady demand for office
space.
$26.00
$27.00
$28.00
$29.00
$30.00
$31.00
$32.00
3Q05 4Q05 1Q06 2Q06 3Q06 4Q06 1Q07 2Q07 3Q0710.0%
11.0%
12.0%
13.0%
14.0%
Rental Rate Vacancy Rate
(psf/yr)
The Westchester County office market closed the third quarter showing good activity across the county with a steady demand for office space. Activity out of New York City also continues to remain strong. While there have been a few large transactions, the market year-to-date has been dominated by small transactions, with 65% of square footage and 95% of transactions consisting of deals less than 20,000 square feet (sf). There are, however, a good number of New York relocations and local transactions currently in the pipeline in excess of 75,000 sf that are expected to close in the fourth quarter. The overall class A vacancy rate for the county registered at 17.0%, a slight increase from 16.8% last quarter. The overall vacancy rate for the county registered at 14.7%, a decrease from 14.8% last quarter and 16.3% one year ago. This overall change in vacancy has been somewhat influenced by a few tenants taking sublease space off the market. Though leasing activity remained steady for the quarter at 402,462 sf and 1.3 million square feet (msf) year-to-date, overall absorption was negative for the quarter at 210,206 sf, primarily due to the addition of over 200,000 sf at 440 Mamaroneck Avenue in Harrison. The submarkets that accounted for more than 65% of the leasing activity for the quarter were Eastern (148,159 sf) and White Plains Central Business District (CBD) (120,792 sf). Significant transactions for the quarter included Bank of New York for 78,500 sf at 440 Mamaroneck Avenue in Harrison and Disney Publishing Worldwide for 60,702 sf at 44 South Broadway in White Plains.
The direct average rents for class A space registered at $31.98 per square foot (psf), up from $31.82 psf last quarter and $30.12 psf a year ago. Pricing of rents pressured upwards due to capital market sales and credit availability. The White Plains CBD submarket posted the highest average rent for the county at $35.19 psf, with some buildings averaging over $40.00 psf.
Westchester County property sales totaled more than $200 million at the end of the third quarter. Significant sales included The Centre at Purchase, a four building complex located at Manhattanville Road in Purchase for $166,000,000 or $268.00 psf and 150 Grand Street in White Plains for $6,700,000 or $71.00 psf. Looking ahead, there are several large transactions currently in negotiation that should give the market a “fourth quarter bounce.” This should create a lot of momentum and optimism going into the new year.
Direct Rental vs. Vacancy Rates Direct Rental vs. Vacancy Rates

OFFICE OVERVIEW, WESTCHESTER COUNTY, NEW YORK Third Quarter 2007
For more information, please contact our Research Department Cushman & Wakefield, Inc. of Connecticut 107 Elm Street Stamford, Connecticut 06902 (203) 326-5800
This report contains information available to the public and has been relied upon by Cushman & Wakefield on the basis that it is accurate and complete. Cushman & Wakefield accepts no responsibility if this should prove not to be the case. No warranty or representation, express or implied, is made to the accuracy or completeness of the information contained herein, and same is submitted subject to errors, omissions, change of price, rental or other conditions, withdrawal without notice, and to any special listing conditions imposed by our principals. Copyright © 2007 Cushman & Wakefield, Inc. All rights reserved.
CUSHMAN & WAKEFIELD MARKET HIGHLIGHTS Significant 3Q07 New Lease Transactions
B U I L D I N G S U B M A R K E T T E N A N T S Q U A R E F E E T B U I L D I N G C L A S S
440 Mamaroneck Avenue Harrison Bank of New York 78,500 A 44 South Broadway White Plains Disney Publishing Worldwide 60,702 A 1 North Lexington Avenue White Plains Alliance Bernstein 19,507 A
Significant 3Q07 Sale Transactions
B U I L D I N G S U B M A R K E T B U Y E R S Q U A R E F E E T P U R C H A S E P R I C E
1-4 Manhattanville Road Purchase O’Connor Capital Partners 620,000 $165,000,000 222 Bloomingdale Road White Plains Behringer Harvard 157,000 $22,137,000 150 Grand Street White Plains Reckson Associates 84,000 $6,850,000
Significant 3Q07 Construction Completions
B U I L D I N G S U B M A R K E T M A J O R T E N A N T S Q U A R E F E E T C O M P L E T I O N D A T E
N/A
Significant Projects Under Construction
B U I L D I N G S U B M A R K E T M A J O R T E N A N T S Q U A R E F E E T C O M P L E T I O N D A T E
N/A
CUSHMAN & WAKEFIELD MARKET/SUBMARKET STATISTICS
White Plains CBD 6,256,849 48 13.6% 12.4% 338,437 0 0 (155,410) $35.19Westchester County Non-CBD 22,130,836 230 15.0% 12.7% 966,275 0 0 10,962 $31.10White Plains Non-CBD 4,485,028 34 23.5% 21.5% 174,711 0 0 43,977 $31.29Northern 3,062,920 39 14.0% 13.8% 50,681 0 0 6,651 $31.75Central 5,810,402 66 16.0% 11.6% 273,966 0 0 (52,631) $29.26Eastern 6,437,014 61 12.1% 9.8% 417,458 0 0 (16,219) $32.29Southern 2,335,472 30 5.6% 5.6% 49,469 0 0 29,184 $28.27
Total 28,387,685 278 14.7% 12.7% 1,304,712 0 0 (144,448) $31.98* Rental rates reflect $psf/year
Market/Submarket Inventory
No.of
Bldgs.
OverallVacancy
Rate
YTDOverall
Absorption
Direct Wtd.Avg. Class ARental Rate*
DirectVacancy
Rate
YTDLeasingActivity
UnderConstruction
YTDConstructionCompletions

1 1 Ea s t 26 t h S t re e t , S u i te 1 6 02 N ew Y o r k , New Y or k 1 0 0 1 0 2 1 2 . 4 81 . 6 92 0 F AX 2 12 . 48 1 . 6 9 21 w w w .ec o nr e s . c o m
L os An ge les S a n F r anc i sco Sa n D i eg o Ch i c ag o W as h i ng t on DC Ne w Yo rk Lon d on
Memorandum Date: January 11, 2008
To: Joe Apicella, Cappelli Enterprises
From: Economics Research Associates, New York
RE: Residential Research for SFC Yonkers
CC: John Saccardi, Saccardi & Schiff ERA No. 16727
Dear Joe:
ERA has prepared a brief memorandum presenting information and findings to assist you
with responding to comments on the Marketing Directors’ residential market analysis for
the SFC Yonkers project. Specifically, this memorandum provides data and analysis
concerning competitive projects, absorption, and the potential repositioning of SFC
Yonkers residential units as rentals. Given the short time frame available for this
research, ERA has not conducted a full-scale residential market analysis. The
information contained here is intended to complement existing research. Please do not
hesitate to contact us should you have questions, comments, or require additional
research.

Economics Research Associates Project No. 16727 Page 2
Competitive Analysis
Condominium Projects ERA has collected data on a number of condominium projects that would be competitive
with the SFC project in Yonkers. While there are likely to be additional residential
projects competing for buyers at the time SFC units are delivered, this memorandum
focuses on those projects for which data is currently available. ERA examined a variety
of new condominium projects that are located in urban centers north of New York City
with good access to regional rail lines, similar to Yonkers. Projects were identified in
New Rochelle, White Plains, and Stamford, CT. Figure 1 presents those condominium
projects that are considered by this analysis. Figure 2 presents a map depicting the
location and size of the competitive condominium projects. The following section
describes the competitive projects in detail.
The Residences at Jefferson Place – White Plains The Residences at Jefferson Place is a 281-unit condominium project with prices ranging
from the low $300,000s to the mid $600,000s. Units offer granite countertops, hardwood
flooring, high ceilings, ceramic tile, and a washer and dryer. Building amenities include
24-hour concierge service, a fitness center, a clubroom with a fireplace and a pool table,
a media room, a business center, and conference room.
The Residences at the Ritz-Carleton – White Plains The Residences at the Ritz-Carleton includes 236 units in two 40-story glass towers. The
residences are part of Cappelli Enterprises' Renaissance Square, a new $400 million,
890,000-square-foot mixed-use complex. Pricing at the Residences at the Ritz-Carleton
starts at $800,000. The units offer sweeping views, gourmet kitchens, and luxury
finishes. Amenities include a lounge, fitness center, room service, spa, business center,
children’s play room, and chauffer service. Some units offer extended-stay services such
as housekeeping and concierge services, provided by the Ritz-Carleton hotel.
Trump Tower at City Center – White Plains Trump Tower at City Center is a 203-unit, 35-story condominium project completed in
2005. The building is attached to a municipal parking lot with rooftop amenities for
residents, including a pool and lounge area, two tennis courts and a paddle board court.
The adjacent City Center project includes 450,000 square feet of retail, restaurant, and
entertainment space that houses Target, Circuit City, Filene's Basement, Barnes & Noble,

Economics Research Associates Project No. 16727 Page 3
a 15-screen multiplex, New York Sports Club, and the White Plains Performing Arts
Center.
543 Main Street – New Rochelle The 543 Main Street building is a 90-unit condominium project offering one- and two-
bedroom units, ranging in price from $240,000 to $600,000. Amenities include concierge
service, a resident building manager, fitness center, storage facilities, and on-site
parking. Many of the homes have private terraces or balconies. All units have a washer
and dryer, hardwood flooring, and high ceilings. Kitchens include stainless steel
appliances, maple cabinets, and granite countertops. Baths are equipped with ceramic
tile, marble countertops, and wood vanities.
Trump Plaza – New Rochelle Trump Plaza New Rochelle consists of a 187-unit, 30-story luxury residential
condominium tower with 138,000 square feet of retail space on two levels at the base.
Prices for the condominium units begin in the low $500,000s. The one-, two-, and three-
bedroom units offer sweeping views, hardwood floors, gourmet kitchens, luxury master
bathroom features, and washer and dryer. The project includes a modern parking
garage and easy access to New Roc City retail and entertainment offerings.
Trump Parc – Stamford Trump Parc Stamford is a 170-unit, 34-story glass and cast stone building to be built to
the standards of the U.S. Green Building Council’s Leadership in Energy and
Environmental Design (LEED) program. The residences are priced from $670,000. Units
will be equipped with granite countertops, hardwood floors, top-of-the-line appliances,
designer cabinetry, marble bathrooms and wrap-around terraces that offer views.
Amenities will include a 24-hour concierge/doorman, landscaped terrace, indoor
swimming pool, full-service health club, wireless lounge, billiards room, screening room,
and roof-top observation deck. Trump Parc will also offer a private shuttle bus to the
Stamford train station. On-site valet parking will be located on five levels at the base of
the building and there will be approximately 3,000 square feet of restaurant space
included within the project.

Economics Research Associates Project No. 16727 Page 4
Figure 1: Competitive Condominium Projects
Project NameProject
TypeUnits
PlannedPre-Sales
Open DateTotal Sales
Percentage Sold
Average Monthly
Sales
White Plains
The Residences at Jefferson Place2 Condo 281 Nov-05 281 100% 11.66The Residences at the Ritz-Carleton Condo 236 Sep-06 224 95% 14.93Trump Tower at City Center3 Condo 203 Nov-04 203 100% 16.92
New Rochelle
543 Main Street Condo 90 Feb-05 82 91% 2.41Trump Plaza New Rochelle Condo 187 Feb-06 115 61% 5.23
Stamford, CT
Trump Parc Stamford Condo 170 May-07 39 23% 5.57
Source: Cappelli Enterprises; Hanley Wood Market Intelligence; Economics Research Associates
1 Through November 2007.2 Sold out September 2007.3 Sold out September 2005.
Total Sales1

Economics Research Associates Project No. 16727 Page 5
Figure 2: Map of Competitive Condominium Projects

Economics Research Associates Project No. 16727 Page 6
Absorption
ERA relies on the sales performance of the competitive condominium projects to
estimate potential absorption at the SFC project. The sales performance of the
competitive projects provides a good indication of how similar residential products will
sell in downtown Yonkers. While pricing, project amenities, design, and other factors
may differ from the proposed SFC project, the competitive projects provide a broad view
of condominium sales performance in comparable locations. Additionally, sales data
from the competitive projects reflect differing market conditions, from the robust real
estate market conditions of 2004 through the current, slow-paced market.
As shown in Figure 1, the size of the competitive condominium projects range from 90
units to 236 units. Sales pace at the competitive projects ranges from about two to 17
units per month, with larger projects generally selling a greater number of units each
month. The highest velocity of sales observed occurred at Trump Tower at City Center,
a large-scale project which sold out in September 2005, in advance of the residential
market slump. The slowest sales observed occurred at the smallest project, 543 Main
Street in New Rochelle, which is currently about 90 percent sold.
Based on the historical performance of the competitive condominium projects, ERA
estimates that the residential component of the SFC project will achieve monthly sales
of roughly eight to 12 units per month, 96 to 144 units per year. Assuming that
residential development occurs in phases of between 436 units (Palisades Point) and 475
units (two phases at River Park Center), ERA estimates that each phase of residential
development will sell out in 36 to 60 months (i.e., three to five years). This projected
pace of sales is greater than that of Trump Plaza New Rochelle, a somewhat smaller-
scale project suffering from current market conditions, and less than sales at Trump
Tower at City Center, a project that enjoyed robust market conditions during 2004 and
2005.

Economics Research Associates Project No. 16727 Page 7
Potential for Repositioning as Rental
Research concerning the residential rental market in southwest Westchester County
indicates that residential units could be successfully marketed as rentals. ERA collected
information on a number of Westchester’s newer condominium projects to determine
current market conditions. As shown in Figure 3, vacancy rates at competitive rental
projects range from zero to nine percent, indication of a very healthy rental market. In
Yonkers, the Hudson Terrace Apartments have zero vacancy and achieve rents of $1,600
to $1,800. A map of the competitive rental project is presented in Figure 4.

Economics Research Associates Project No. 16727 Page 8
Figure 3: Competitive Rental Projects
Project NameYear Built Units Vacancy
Unit Type
Size(SF)
Monthly Rent
Rent/SF
Yonkers
Hudson Terrace Apts 1998 48 0.0% 2 BR 900 $1,600 $1.783 BR 1,100 $1,800 $1.64
Bronxville
The Avalon 1999 110 3.6% 1 BR 849 $2,610 $3.072 BR 1,212 $3,977 $3.283 BR 1,924 $5,356 $2.78
Tuckahoe
Riverview Apts 2002 88 1.1% 1 BR 1,120 $3,223 $2.882 BR 1,460 $4,046 $2.77
Scarsdale 3 BR 2,050 $5,473 $2.67
Scarsdale Commons 2004 44 0.0% 1 BR 805 $3,397 $4.222 BR 1,189 $4,389 $3.69
Elmsford
Avalon Green 1995 105 3.8% 1 BR 873 $2,105 $2.412 BR 1,050 $2,293 $2.18
Mamaroneck
Avalon Willow 2000 227 2.2% 1 BR 922 $2,168 $2.352 BR 1,185 $2,858 $2.41
Tarrytown
Talleyrand Crescent 1996 300 1.7% 1 BR 658 $1,856 $2.822 BR 828 $2,400 $2.90
Elmsford
Ridgeview Apts 1996 416 1.7% 1 BR 654 $1,425 $2.182 BR 881 $1,755 $1.993 BR 1,100 $2,400 $2.18
White Plains
Bank Street Commons Ph I 2003 245 5.3% 1 BR 750 $2,035 $2.712 BR 1,055 $2,760 $2.62
Bank Street Commons Ph II 2004 235 5.5% 1 BR 732 $2,035 $2.782 BR 1,050 $2,760 $2.63
One City Place 2004 311 9.0% 1 BR 934 $2,312 $2.482 BR 1,111 $3,427 $3.083 BR 1,441 $4,349 $3.02
City Center at White Plains Ph II 2004 300 9.0% 1 BR 934 $2,332 $2.502 BR 1,111 $3,422 $3.083 BR 1,441 $4,331 $3.01
Clayton Park 2003 260 1.9% 1 BR 730 $1,787 $2.452 BR 1,036 $2,409 $2.33
Source: REIS; Economics Research Associates

Economics Research Associates Project No. 16727 Page 9
Figure 4: Map of Competitive Rental Projects

APPENDIX D: Phase 1 TIF Bond Projections

PHASE ICITY OF YONKERS, NY
TIF BOND PROJECTIONSProjection No. 23-A
Assumptions:75% of City TIF Revenue is Available to pay Debt Service
75% of County TIF Revenue is Available to pay Debt Service$159,064,364 in Public Improvements
5,000 Public Parking Spaces6.25% Interest Rate
Prepared By:
MuniCap, Inc.Public Finance
January 18, 2008
PHASE ICITY OF YONKERS, NY
TIF BOND PROJECTIONSProjection No. 23-A
Table of Contents
I. Bond Issuance Assumptions 1
II. Debt Service Projections 2
III. Details of the Capitalized Interest Account 3
IV. Details of the Improvement Fund 4
V. Absorbtion Schedule 5
VI. Projection of Average Monthly Rent -- Apartments 8
VII. Projection of Market Value 9
VIII. Proposed Market Value 10
IX. Projected Net Incremental Real Property Taxes 13
X. Summary of Parking Spaces 14
XI. Projected Stabilized NOI 15
XII. Projected Parking Garage Total Net Operating Income 16
XIII. Projected Payment of Debt Service 17
XIV. Projected Portion of Debt Service (City and County) 18

PHASE ICITY OF YONKERS, NY
Schedule I: Sources and Uses of Funds and Bond Issuance Assumptions
PercentSources of funds: Total bond proceeds $186,903,000 95.2% Interest earned in the improvement fund (see Schedule IV) $9,407,922 5.0% Total sources of funds $196,310,922 100.0%
Total uses of funds: Public improvements $159,064,364 81.0% Underwriter's discount $1,869,030 1.0% Issuance costs $750,000 0.4% Capitalized interest (see Schedule III) $15,936,780 8.1% Reserve fund $18,690,300 9.5% Rounding $448 0.0% Total uses of funds $196,310,922 100.0%
Assumptions:Maturity 29.4 years Interest only 1.4 years Amortization 28 years
Bond coupon rate 6.25%
Reinvestment rates: Reserve fund 4.00% Improvement fund 4.00% Capitalized interest account 4.00%
Date bonds issued 1-Oct-08Dates payments due: Interest September 1 and March 1 Principal March 1
Capitalized interest: Interest funded through 1-Mar-10 Months interest funded 17MuniCap, Inc. M:\CONSULTING\SBER\Yonkers\[Proj. No. 23-A.xls]I
18-Jan-08
DRAFT Page 1 DRAFT

PHASE ICITY OF YONKERS, NY
Schedule II: Debt Service Projections
Gross Gross Annual Reserve Net AnnualInterest Debt Service Debt Service Capitalized Fund Trustee and Debt
Date Principal Rate Interest Payments Payments Interest Income Admin. Fund Service1-Oct-081-Mar-09 $0 6.25% $5,840,719 $5,840,719 $5,840,719 ($5,559,214) ($311,505) $30,000 $01-Sep-09 $5,840,719 $5,840,719 ($5,466,913) ($373,806)1-Mar-10 $0 6.25% $5,840,719 $5,840,719 $11,681,438 ($5,496,913) ($373,806) $30,000 $01-Sep-10 $5,840,719 $5,840,719 ($373,806)1-Mar-11 $105,000 6.25% $5,840,719 $5,945,719 $11,786,438 ($373,806) $30,000 $11,068,8261-Sep-11 $5,837,438 $5,837,438 ($373,806)1-Mar-12 $336,000 6.25% $5,837,438 $6,173,438 $12,010,875 ($373,806) $30,600 $11,293,8631-Sep-12 $5,826,938 $5,826,938 ($373,806)1-Mar-13 $585,000 6.25% $5,826,938 $6,411,938 $12,238,875 ($373,806) $31,212 $11,522,4751-Sep-13 $5,808,656 $5,808,656 ($373,806)1-Mar-14 $854,000 6.25% $5,808,656 $6,662,656 $12,471,313 ($373,806) $31,836 $11,755,5371-Sep-14 $5,781,969 $5,781,969 ($373,806)1-Mar-15 $1,144,000 6.25% $5,781,969 $6,925,969 $12,707,938 ($373,806) $32,473 $11,992,7981-Sep-15 $5,746,219 $5,746,219 ($373,806)1-Mar-16 $1,457,000 6.25% $5,746,219 $7,203,219 $12,949,438 ($373,806) $33,122 $12,234,9481-Sep-16 $5,700,688 $5,700,688 ($373,806)1-Mar-17 $1,795,000 6.25% $5,700,688 $7,495,688 $13,196,375 ($373,806) $33,785 $12,482,5481-Sep-17 $5,644,594 $5,644,594 ($373,806)1-Mar-18 $2,157,000 6.25% $5,644,594 $7,801,594 $13,446,188 ($373,806) $34,461 $12,733,0361-Sep-18 $5,577,188 $5,577,188 ($373,806)1-Mar-19 $2,548,000 6.25% $5,577,188 $8,125,188 $13,702,375 ($373,806) $35,150 $12,989,9131-Sep-19 $5,497,563 $5,497,563 ($373,806)1-Mar-20 $2,967,000 6.25% $5,497,563 $8,464,563 $13,962,125 ($373,806) $35,853 $13,250,3661-Sep-20 $5,404,844 $5,404,844 ($373,806)1-Mar-21 $3,418,000 6.25% $5,404,844 $8,822,844 $14,227,688 ($373,806) $36,570 $13,516,6451-Sep-21 $5,298,031 $5,298,031 ($373,806)1-Mar-22 $3,902,000 6.25% $5,298,031 $9,200,031 $14,498,063 ($373,806) $37,301 $13,787,7521-Sep-22 $5,176,094 $5,176,094 ($373,806)1-Mar-23 $4,421,000 6.25% $5,176,094 $9,597,094 $14,773,188 ($373,806) $38,047 $14,063,6231-Sep-23 $5,037,938 $5,037,938 ($373,806)1-Mar-24 $4,978,000 6.25% $5,037,938 $10,015,938 $15,053,875 ($373,806) $38,808 $14,345,0711-Sep-24 $4,882,375 $4,882,375 ($373,806)1-Mar-25 $5,576,000 6.25% $4,882,375 $10,458,375 $15,340,750 ($373,806) $39,584 $14,632,7221-Sep-25 $4,708,125 $4,708,125 ($373,806)1-Mar-26 $6,216,000 6.25% $4,708,125 $10,924,125 $15,632,250 ($373,806) $40,376 $14,925,0141-Sep-26 $4,513,875 $4,513,875 ($373,806)1-Mar-27 $6,901,000 6.25% $4,513,875 $11,414,875 $15,928,750 ($373,806) $41,184 $15,222,3221-Sep-27 $4,298,219 $4,298,219 ($373,806)1-Mar-28 $7,635,000 6.25% $4,298,219 $11,933,219 $16,231,438 ($373,806) $42,007 $15,525,8331-Sep-28 $4,059,625 $4,059,625 ($373,806)1-Mar-29 $8,421,000 6.25% $4,059,625 $12,480,625 $16,540,250 ($373,806) $42,847 $15,835,4851-Sep-29 $3,796,469 $3,796,469 ($373,806)1-Mar-30 $9,261,000 6.25% $3,796,469 $13,057,469 $16,853,938 ($373,806) $43,704 $16,150,0301-Sep-30 $3,507,063 $3,507,063 ($373,806)1-Mar-31 $10,160,000 6.25% $3,507,063 $13,667,063 $17,174,125 ($373,806) $44,578 $16,471,0911-Sep-31 $3,189,563 $3,189,563 ($373,806)1-Mar-32 $11,122,000 6.25% $3,189,563 $14,311,563 $17,501,125 ($373,806) $45,470 $16,798,9831-Sep-32 $2,842,000 $2,842,000 ($373,806)1-Mar-33 $12,149,000 6.25% $2,842,000 $14,991,000 $17,833,000 ($373,806) $46,379 $17,131,7671-Sep-33 $2,462,344 $2,462,344 ($373,806)1-Mar-34 $13,247,000 6.25% $2,462,344 $15,709,344 $18,171,688 ($373,806) $47,307 $17,471,3821-Sep-34 $2,048,375 $2,048,375 ($373,806)1-Mar-35 $14,421,000 6.25% $2,048,375 $16,469,375 $18,517,750 ($373,806) $48,253 $17,818,3911-Sep-35 $1,597,719 $1,597,719 ($373,806)1-Mar-36 $15,674,000 6.25% $1,597,719 $17,271,719 $18,869,438 ($373,806) $49,218 $18,171,0441-Sep-36 $1,107,906 $1,107,906 ($373,806)1-Mar-37 $17,012,000 6.25% $1,107,906 $18,119,906 $19,227,813 ($373,806) $50,203 $18,530,4031-Sep-37 $576,281 $576,281 ($373,806)1-Mar-38 $18,441,000 6.25% $576,281 $19,017,281 $19,593,563 ($19,064,106) $51,207 $206,857
Total $186,903,000 $261,059,781 $447,962,781 $447,962,781 ($16,523,039) ($40,682,553) $1,171,536 $391,928,725MuniCap, Inc. M:\CONSULTING\SBER\Yonkers\[Proj. No. 23-A.xls]II
18-Jan-08
DRAFT Page 2 DRAFT

PHASE ICITY OF YONKERS, NY
Schedule III: Details of the Capitalized Interest Account
Disbursement Net WithdrawalBeginning Deposit from for Reserve Trustee and From Capitalized Interest Reinvestment EndingBalance Bond Proceeds Debt Service Fund Income Admin. Fund Interest Account Earnings Rate Balance
1-Oct-08 $0 $15,936,780 $15,936,7801-Mar-09 $15,936,780 ($5,840,719) $311,505 ($30,000) $5,559,214 $265,613 4.00% $10,643,1791-Sep-09 $10,643,179 ($5,840,719) $373,806 $5,466,913 $212,864 4.00% $5,389,1301-Mar-10 $5,389,130 ($5,840,719) $373,806 ($30,000) $5,496,913 $107,783 4.00% $0
Total $15,936,780 ($17,522,156) $1,059,117 ($60,000) $16,523,039 $586,259MuniCap, Inc. M:\CONSULTING\SBER\Yonkers\[Proj. No. 23-A.xls]III
18-Jan-08
DRAFT Page 3 DRAFT

PHASE ICITY OF YONKERS, NY
Schedule IV: Details of the Improvement Fund
DisbursementBeginning Deposit from for Interest Reinvestment Ending
Date Balance Bond Proceeds Construction Earnings Rate Balance1-Oct-08 $0 $149,656,442 4.00% $149,656,4421-Nov-08 $149,656,442 $0 ($4,418,455) $498,855 4.00% $145,736,8421-Dec-08 $145,736,842 $0 ($4,418,455) $485,789 4.00% $141,804,1771-Jan-09 $141,804,177 $0 ($4,418,455) $472,681 4.00% $137,858,4031-Feb-09 $137,858,403 $0 ($4,418,455) $459,528 4.00% $133,899,4771-Mar-09 $133,899,477 $0 ($4,418,455) $446,332 4.00% $129,927,3541-Apr-09 $129,927,354 $0 ($4,418,455) $433,091 4.00% $125,941,9911-May-09 $125,941,991 $0 ($4,418,455) $419,807 4.00% $121,943,3431-Jun-09 $121,943,343 $0 ($4,418,455) $406,478 4.00% $117,931,3661-Jul-09 $117,931,366 $0 ($4,418,455) $393,105 4.00% $113,906,0161-Aug-09 $113,906,016 $0 ($4,418,455) $379,687 4.00% $109,867,2481-Sep-09 $109,867,248 $0 ($4,418,455) $366,224 4.00% $105,815,0181-Oct-09 $105,815,018 $0 ($4,418,455) $352,717 4.00% $101,749,2801-Nov-09 $101,749,280 $0 ($4,418,455) $339,164 4.00% $97,669,9891-Dec-09 $97,669,989 $0 ($4,418,455) $325,567 4.00% $93,577,1021-Jan-10 $93,577,102 $0 ($4,418,455) $311,924 4.00% $89,470,5711-Feb-10 $89,470,571 $0 ($4,418,455) $298,235 4.00% $85,350,3511-Mar-10 $85,350,351 $0 ($4,418,455) $284,501 4.00% $81,216,3981-Apr-10 $81,216,398 $0 ($4,418,455) $270,721 4.00% $77,068,6651-May-10 $77,068,665 $0 ($4,418,455) $256,896 4.00% $72,907,1061-Jun-10 $72,907,106 $0 ($4,418,455) $243,024 4.00% $68,731,6751-Jul-10 $68,731,675 $0 ($4,418,455) $229,106 4.00% $64,542,3261-Aug-10 $64,542,326 $0 ($4,418,455) $215,141 4.00% $60,339,0121-Sep-10 $60,339,012 $0 ($4,418,455) $201,130 4.00% $56,121,6881-Oct-10 $56,121,688 $0 ($4,418,455) $187,072 4.00% $51,890,3061-Nov-10 $51,890,306 $0 ($4,418,455) $172,968 4.00% $47,644,8191-Dec-10 $47,644,819 $0 ($4,418,455) $158,816 4.00% $43,385,1801-Jan-11 $43,385,180 $0 ($4,418,455) $144,617 4.00% $39,111,3431-Feb-11 $39,111,343 $0 ($4,418,455) $130,371 4.00% $34,823,2601-Mar-11 $34,823,260 $0 ($4,418,455) $116,078 4.00% $30,520,8831-Apr-11 $30,520,883 $0 ($4,418,455) $101,736 4.00% $26,204,1641-May-11 $26,204,164 $0 ($4,418,455) $87,347 4.00% $21,873,0571-Jun-11 $21,873,057 $0 ($4,418,455) $72,910 4.00% $17,527,5131-Jul-11 $17,527,513 $0 ($4,418,455) $58,425 4.00% $13,167,4831-Aug-11 $13,167,483 $0 ($4,418,455) $43,892 4.00% $8,792,9201-Sep-11 $8,792,920 $0 ($4,418,455) $29,310 4.00% $4,403,7751-Oct-11 $4,403,775 $0 ($4,418,455) $14,679 4.00% $0
Total $149,656,442 ($159,064,364) $9,407,922MuniCap, Inc. M:\CONSULTING\SBER\Yonkers\[Proj. No. 23-A.xls]IV
18-Jan-08
DRAFTPage 4
DRAFT

PHASE ICITY OF YONKERS, NY
Schedule V: Construction Schedule
ResidentialFinal Bond River Park Center Palisades Point
Assessment Taxes YearDate Due Ending Units Total Units Units Total Units Units Total Units Units Total Units
15-Oct-06 1-Jul-07 1-Mar-08 0 0 0 0 0 0 0 015-Oct-07 1-Jul-08 1-Mar-09 0 0 0 0 0 0 0 015-Oct-08 1-Jul-09 1-Mar-10 0 0 0 0 0 0 0 015-Oct-09 1-Jul-10 1-Mar-11 475 475 475 475 204 204 232 23215-Oct-10 1-Jul-11 1-Mar-12 0 475 0 475 0 204 0 23215-Oct-11 1-Jul-12 1-Mar-13 0 475 0 475 0 204 0 23215-Oct-12 1-Jul-13 1-Mar-14 0 475 0 475 0 204 0 23215-Oct-13 1-Jul-14 1-Mar-15 0 475 0 475 0 204 0 23215-Oct-14 1-Jul-15 1-Mar-16 0 475 0 475 0 204 0 23215-Oct-15 1-Jul-16 1-Mar-17 0 475 0 475 0 204 0 23215-Oct-16 1-Jul-17 1-Mar-18 0 475 0 475 0 204 0 23215-Oct-17 1-Jul-18 1-Mar-19 0 475 0 475 0 204 0 23215-Oct-18 1-Jul-19 1-Mar-20 0 475 0 475 0 204 0 23215-Oct-19 1-Jul-20 1-Mar-21 0 475 0 475 0 204 0 23215-Oct-20 1-Jul-21 1-Mar-22 0 475 0 475 0 204 0 23215-Oct-21 1-Jul-22 1-Mar-23 0 475 0 475 0 204 0 23215-Oct-22 1-Jul-23 1-Mar-24 0 475 0 475 0 204 0 23215-Oct-23 1-Jul-24 1-Mar-25 0 475 0 475 0 204 0 23215-Oct-24 1-Jul-25 1-Mar-26 0 475 0 475 0 204 0 23215-Oct-25 1-Jul-26 1-Mar-27 0 475 0 475 0 204 0 23215-Oct-26 1-Jul-27 1-Mar-28 0 475 0 475 0 204 0 23215-Oct-27 1-Jul-28 1-Mar-29 0 475 0 475 0 204 0 23215-Oct-28 1-Jul-29 1-Mar-30 0 475 0 475 0 204 0 23215-Oct-29 1-Jul-30 1-Mar-31 0 475 0 475 0 204 0 23215-Oct-30 1-Jul-31 1-Mar-32 0 475 0 475 0 204 0 23215-Oct-31 1-Jul-32 1-Mar-33 0 475 0 475 0 204 0 23215-Oct-32 1-Jul-33 1-Mar-34 0 475 0 475 0 204 0 23215-Oct-33 1-Jul-34 1-Mar-35 0 475 0 475 0 204 0 23215-Oct-34 1-Jul-35 1-Mar-36 0 475 0 475 0 204 0 23215-Oct-35 1-Jul-36 1-Mar-37 0 475 0 475 0 204 0 23215-Oct-36 1-Jul-37 1-Mar-38 0 475 0 475 0 204 0 232
Total 475 475 204 232MuniCap, Inc. M:\CONSULTING\SBER\Yonkers\[Proj. No. 23-A.xls]V
18-Jan-08
Tower West Parcel H Residential Units Parcel I Residential UnitsTower East
DRAFT Page 5 DRAFT

PHASE ICITY OF YONKERS, NY
Schedule V: Construction Schedule (continued)
Final BondAssessment Taxes Year
Date Due Ending SF Total SF Rooms Total Rooms SF Total SF SF Total SF15-Oct-06 1-Jul-07 1-Mar-08 0 0 0 0 0 0 0 015-Oct-07 1-Jul-08 1-Mar-09 0 0 0 0 0 0 0 015-Oct-08 1-Jul-09 1-Mar-10 0 0 0 0 0 0 0 015-Oct-09 1-Jul-10 1-Mar-11 475,000 475,000 150 150 80,000 80,000 90,000 90,00015-Oct-10 1-Jul-11 1-Mar-12 0 475,000 0 150 0 80,000 0 90,00015-Oct-11 1-Jul-12 1-Mar-13 0 475,000 0 150 0 80,000 0 90,00015-Oct-12 1-Jul-13 1-Mar-14 0 475,000 0 150 0 80,000 0 90,00015-Oct-13 1-Jul-14 1-Mar-15 0 475,000 0 150 0 80,000 0 90,00015-Oct-14 1-Jul-15 1-Mar-16 0 475,000 0 150 0 80,000 0 90,00015-Oct-15 1-Jul-16 1-Mar-17 0 475,000 0 150 0 80,000 0 90,00015-Oct-16 1-Jul-17 1-Mar-18 0 475,000 0 150 0 80,000 0 90,00015-Oct-17 1-Jul-18 1-Mar-19 0 475,000 0 150 0 80,000 0 90,00015-Oct-18 1-Jul-19 1-Mar-20 0 475,000 0 150 0 80,000 0 90,00015-Oct-19 1-Jul-20 1-Mar-21 0 475,000 0 150 0 80,000 0 90,00015-Oct-20 1-Jul-21 1-Mar-22 0 475,000 0 150 0 80,000 0 90,00015-Oct-21 1-Jul-22 1-Mar-23 0 475,000 0 150 0 80,000 0 90,00015-Oct-22 1-Jul-23 1-Mar-24 0 475,000 0 150 0 80,000 0 90,00015-Oct-23 1-Jul-24 1-Mar-25 0 475,000 0 150 0 80,000 0 90,00015-Oct-24 1-Jul-25 1-Mar-26 0 475,000 0 150 0 80,000 0 90,00015-Oct-25 1-Jul-26 1-Mar-27 0 475,000 0 150 0 80,000 0 90,00015-Oct-26 1-Jul-27 1-Mar-28 0 475,000 0 150 0 80,000 0 90,00015-Oct-27 1-Jul-28 1-Mar-29 0 475,000 0 150 0 80,000 0 90,00015-Oct-28 1-Jul-29 1-Mar-30 0 475,000 0 150 0 80,000 0 90,00015-Oct-29 1-Jul-30 1-Mar-31 0 475,000 0 150 0 80,000 0 90,00015-Oct-30 1-Jul-31 1-Mar-32 0 475,000 0 150 0 80,000 0 90,00015-Oct-31 1-Jul-32 1-Mar-33 0 475,000 0 150 0 80,000 0 90,00015-Oct-32 1-Jul-33 1-Mar-34 0 475,000 0 150 0 80,000 0 90,00015-Oct-33 1-Jul-34 1-Mar-35 0 475,000 0 150 0 80,000 0 90,00015-Oct-34 1-Jul-35 1-Mar-36 0 475,000 0 150 0 80,000 0 90,00015-Oct-35 1-Jul-36 1-Mar-37 0 475,000 0 150 0 80,000 0 90,00015-Oct-36 1-Jul-37 1-Mar-38 0 475,000 0 150 0 80,000 0 90,000
Total 475,000 150 80,000 90,000MuniCap, Inc. M:\CONSULTING\SBER\Yonkers\[Proj. No. 23-A.xls]V (2)
18-Jan-08
Theater RestaurantsOffice Space Hotel
DRAFT Page 6 DRAFT

PHASE ICITY OF YONKERS, NY
Schedule V: Construction Schedule (continued)
Final Bond RetailAssessment Taxes Year
Date Due Ending SF Total SF SF Total SF SF Total SF SF Total SF SF Total SF15-Oct-06 1-Jul-07 1-Mar-08 0 0 0 0 0 0 0 0 0 015-Oct-07 1-Jul-08 1-Mar-09 0 0 0 0 0 0 0 0 0 015-Oct-08 1-Jul-09 1-Mar-10 0 0 0 0 0 0 0 0 0 015-Oct-09 1-Jul-10 1-Mar-11 200,000 200,000 75,000 75,000 65,000 65,000 45,000 45,000 88,000 88,00015-Oct-10 1-Jul-11 1-Mar-12 0 200,000 0 75,000 0 65,000 0 45,000 0 88,00015-Oct-11 1-Jul-12 1-Mar-13 0 200,000 0 75,000 0 65,000 0 45,000 0 88,00015-Oct-12 1-Jul-13 1-Mar-14 0 200,000 0 75,000 0 65,000 0 45,000 0 88,00015-Oct-13 1-Jul-14 1-Mar-15 0 200,000 0 75,000 0 65,000 0 45,000 0 88,00015-Oct-14 1-Jul-15 1-Mar-16 0 200,000 0 75,000 0 65,000 0 45,000 0 88,00015-Oct-15 1-Jul-16 1-Mar-17 0 200,000 0 75,000 0 65,000 0 45,000 0 88,00015-Oct-16 1-Jul-17 1-Mar-18 0 200,000 0 75,000 0 65,000 0 45,000 0 88,00015-Oct-17 1-Jul-18 1-Mar-19 0 200,000 0 75,000 0 65,000 0 45,000 0 88,00015-Oct-18 1-Jul-19 1-Mar-20 0 200,000 0 75,000 0 65,000 0 45,000 0 88,00015-Oct-19 1-Jul-20 1-Mar-21 0 200,000 0 75,000 0 65,000 0 45,000 0 88,00015-Oct-20 1-Jul-21 1-Mar-22 0 200,000 0 75,000 0 65,000 0 45,000 0 88,00015-Oct-21 1-Jul-22 1-Mar-23 0 200,000 0 75,000 0 65,000 0 45,000 0 88,00015-Oct-22 1-Jul-23 1-Mar-24 0 200,000 0 75,000 0 65,000 0 45,000 0 88,00015-Oct-23 1-Jul-24 1-Mar-25 0 200,000 0 75,000 0 65,000 0 45,000 0 88,00015-Oct-24 1-Jul-25 1-Mar-26 0 200,000 0 75,000 0 65,000 0 45,000 0 88,00015-Oct-25 1-Jul-26 1-Mar-27 0 200,000 0 75,000 0 65,000 0 45,000 0 88,00015-Oct-26 1-Jul-27 1-Mar-28 0 200,000 0 75,000 0 65,000 0 45,000 0 88,00015-Oct-27 1-Jul-28 1-Mar-29 0 200,000 0 75,000 0 65,000 0 45,000 0 88,00015-Oct-28 1-Jul-29 1-Mar-30 0 200,000 0 75,000 0 65,000 0 45,000 0 88,00015-Oct-29 1-Jul-30 1-Mar-31 0 200,000 0 75,000 0 65,000 0 45,000 0 88,00015-Oct-30 1-Jul-31 1-Mar-32 0 200,000 0 75,000 0 65,000 0 45,000 0 88,00015-Oct-31 1-Jul-32 1-Mar-33 0 200,000 0 75,000 0 65,000 0 45,000 0 88,00015-Oct-32 1-Jul-33 1-Mar-34 0 200,000 0 75,000 0 65,000 0 45,000 0 88,00015-Oct-33 1-Jul-34 1-Mar-35 0 200,000 0 75,000 0 65,000 0 45,000 0 88,00015-Oct-34 1-Jul-35 1-Mar-36 0 200,000 0 75,000 0 65,000 0 45,000 0 88,00015-Oct-35 1-Jul-36 1-Mar-37 0 200,000 0 75,000 0 65,000 0 45,000 0 88,00015-Oct-36 1-Jul-37 1-Mar-38 0 200,000 0 75,000 0 65,000 0 45,000 0 88,000
Total 200,000 75,000 65,000 45,000 88,000MuniCap, Inc. M:\CONSULTING\SBER\Yonkers\[Proj. No. 23-A.xls]V (3)
18-Jan-08
Boutique RetailBig Box Discount Retailer Fitness CenterGrocery Store
DRAFT Page 7 DRAFT

PHASE ICITY OF YONKERS, NY
Schedule VI: Projection of Average Monthly Rent -- Apartments
River Park CenterPercentage Weighted Average
Types of Apartments Monthly Rent1 of Total Apartments2 Monthly RentStudio $1,500 9% $141
1- Bedroom $2,000 16% $3132-Bedroom $2,500 50% $1,2503-Bedroom $3,000 25% $750
Total 100% $2,453- Expe
Palisades PointPercentage Weighted Average
Types of Apartments Monthly Rent3 of Total Apartments2 Monthly RentStudio $1,725 9% $162
1- Bedroom $2,300 16% $3592-Bedroom $2,875 50% $1,4383-Bedroom $3,450 25% $863
Total 100% $2,821MuniCap, Inc. M:\CONSULTING\SBER\Yonkers\[Proj. No. 23-A.xls]VI (Apartments)
18-Jan-081Based on information from City of Yonkers Appointed Assessor.2Source: Cappelli Enterprises Inc.3Rents for apartments at Palisades Point assume a 15% premium over apartments at River Park Center. Source: Cappelli Enterprises Inc.
DRAFT Page 8 DRAFT

PHASE ICITY OF YONKERS, NY
Schedule VII: Projection of Market Value
Residential1
River Park Center Palisades PointParcel H Parcel I
Tower West Tower East Units Units Office Space2 Theater3 Restaurants4
Income Capitalization Approach to ValueEstimated gross rent $2,453 $2,453 $2,821 $2,821 $24.00 $25.58 $27.00Assumed vacancy rate 5% 5% 5% 5% 5% 0% 5%
Assumed vacancy ($122.66) ($122.66) ($141.05) ($141.05) ($1.20) $0.00 ($1.35)Expense ratio 35.0% 35.0% 35.0% 35.0% 20.0% 15.0% 15.0%
Estimated expenses ($815.66) ($815.66) ($938.01) ($938.01) ($4.56) ($3.84) ($3.85)
Net operating income (Annual) $18,178 $18,178 $20,904 $20,904 $18.24 $21.74 $21.80Capitalization rate 10.00% 10.00% 10.00% 10.00% 10.00% 10.00% 10.00%Estimated capitalized value $181,777 $181,777 $209,043 $209,043 $182 $217 $218
Total estimated market value per unit/SF $181,777 $181,777 $209,043 $209,043 $182 $217 $218
RetailBig Box Retailer5 Grocery Store6 Discount Retailer5 Fitness Center5 Boutique Retail5
Income Capitalization Approach to ValueEstimated gross rent $24.00 $26.00 $30.00 $27.50 $35.00Assumed vacancy rate 5% 0% 5% 5% 5%
Assumed vacancy ($1.20) $0.00 ($1.50) ($1.38) ($1.75)Expense ratio 15.0% 15.0% 15.0% 15.0% 15.0%
Estimated expenses ($3.42) ($3.90) ($4.28) ($3.92) ($4.99)
Net operating income (Annual) $19 $22.10 $24.23 $22.21 $28.26Capitalization rate 10.00% 10.00% 10.00% 10.00% 10.00%Estimated capitalized value $194 $221 $242 $222 $283
Total estimated market value per unit/SF $194 $221 $242 $222 $283
Income Capitalization Approach to Value Hotel1
Daily rate per room $179Other room revenue $25.75Assumed occupancy 75%
Effective daily rate $153.56Departmental expenses 30%Undistributed operating expenses 25%Fixed expenses 15%
Total expense ratio 70%Estimated expenses ($107.49)
Net operating income (annual) $16,815Capitalization rate 11.5%Estimated capitalized value $146,218
Total estimated market value per room $146,218MuniCap, Inc. M:\CONSULTING\SBER\Yonkers\[Proj. No. 23-A.xls]VII
18-Jan-081Based on information from City of Yonkers Appointed Assessor.2Based on values provided by Cappelli Enterprises Inc.3Based on rent for Regal Cinemas in New Roc City.4Based on Zanaro's Italian Restaurant in New Roc City, NY.5Based on rates from "Complete Appraisal of Real Property: City Center at White Plains - Retail & Fitness" prepared by Cushman & Wakefield Inc.6Based on rent for Stop & Shop in New Roc City, NY.
DRAFT Page 9 DRAFT

PHASE ICITY OF YONKERS, NY
Schedule VIII: Proposed Market Value
ResidentialRiver Park Center Palisades Point
Final BondAssessment Taxes Year Inflation Value Total Market Value Total Market Value Total Market Value Total Market
Date Due Ending Factor Units Per Unit Value Units Per Unit Value Units Per Unit Value Units Per Unit Value15-Oct-06 1-Jul-07 1-Mar-08 100.0% 0 $181,777 $0 0 $181,777 $0 0 $209,043 $0 0 $209,043 $015-Oct-07 1-Jul-08 1-Mar-09 100.0% 0 $181,777 $0 0 $181,777 $0 0 $209,043 $0 0 $209,043 $015-Oct-08 1-Jul-09 1-Mar-10 100.0% 0 $181,777 $0 0 $181,777 $0 0 $209,043 $0 0 $209,043 $015-Oct-09 1-Jul-10 1-Mar-11 100.0% 475 $181,777 $86,343,867 475 $181,777 $86,343,867 204 $209,043 $42,644,782 232 $209,043 $48,497,98715-Oct-10 1-Jul-11 1-Mar-12 100.0% 475 $181,777 $86,343,867 475 $181,777 $86,343,867 204 $209,043 $42,644,782 232 $209,043 $48,497,98715-Oct-11 1-Jul-12 1-Mar-13 100.0% 475 $181,777 $86,343,867 475 $181,777 $86,343,867 204 $209,043 $42,644,782 232 $209,043 $48,497,98715-Oct-12 1-Jul-13 1-Mar-14 100.0% 475 $181,777 $86,343,867 475 $181,777 $86,343,867 204 $209,043 $42,644,782 232 $209,043 $48,497,98715-Oct-13 1-Jul-14 1-Mar-15 100.0% 475 $181,777 $86,343,867 475 $181,777 $86,343,867 204 $209,043 $42,644,782 232 $209,043 $48,497,98715-Oct-14 1-Jul-15 1-Mar-16 100.0% 475 $181,777 $86,343,867 475 $181,777 $86,343,867 204 $209,043 $42,644,782 232 $209,043 $48,497,98715-Oct-15 1-Jul-16 1-Mar-17 100.0% 475 $181,777 $86,343,867 475 $181,777 $86,343,867 204 $209,043 $42,644,782 232 $209,043 $48,497,98715-Oct-16 1-Jul-17 1-Mar-18 100.0% 475 $181,777 $86,343,867 475 $181,777 $86,343,867 204 $209,043 $42,644,782 232 $209,043 $48,497,98715-Oct-17 1-Jul-18 1-Mar-19 100.0% 475 $181,777 $86,343,867 475 $181,777 $86,343,867 204 $209,043 $42,644,782 232 $209,043 $48,497,98715-Oct-18 1-Jul-19 1-Mar-20 100.0% 475 $181,777 $86,343,867 475 $181,777 $86,343,867 204 $209,043 $42,644,782 232 $209,043 $48,497,98715-Oct-19 1-Jul-20 1-Mar-21 100.0% 475 $181,777 $86,343,867 475 $181,777 $86,343,867 204 $209,043 $42,644,782 232 $209,043 $48,497,98715-Oct-20 1-Jul-21 1-Mar-22 100.0% 475 $181,777 $86,343,867 475 $181,777 $86,343,867 204 $209,043 $42,644,782 232 $209,043 $48,497,98715-Oct-21 1-Jul-22 1-Mar-23 100.0% 475 $181,777 $86,343,867 475 $181,777 $86,343,867 204 $209,043 $42,644,782 232 $209,043 $48,497,98715-Oct-22 1-Jul-23 1-Mar-24 100.0% 475 $181,777 $86,343,867 475 $181,777 $86,343,867 204 $209,043 $42,644,782 232 $209,043 $48,497,98715-Oct-23 1-Jul-24 1-Mar-25 100.0% 475 $181,777 $86,343,867 475 $181,777 $86,343,867 204 $209,043 $42,644,782 232 $209,043 $48,497,98715-Oct-24 1-Jul-25 1-Mar-26 100.0% 475 $181,777 $86,343,867 475 $181,777 $86,343,867 204 $209,043 $42,644,782 232 $209,043 $48,497,98715-Oct-25 1-Jul-26 1-Mar-27 100.0% 475 $181,777 $86,343,867 475 $181,777 $86,343,867 204 $209,043 $42,644,782 232 $209,043 $48,497,98715-Oct-26 1-Jul-27 1-Mar-28 100.0% 475 $181,777 $86,343,867 475 $181,777 $86,343,867 204 $209,043 $42,644,782 232 $209,043 $48,497,98715-Oct-27 1-Jul-28 1-Mar-29 100.0% 475 $181,777 $86,343,867 475 $181,777 $86,343,867 204 $209,043 $42,644,782 232 $209,043 $48,497,98715-Oct-28 1-Jul-29 1-Mar-30 100.0% 475 $181,777 $86,343,867 475 $181,777 $86,343,867 204 $209,043 $42,644,782 232 $209,043 $48,497,98715-Oct-29 1-Jul-30 1-Mar-31 100.0% 475 $181,777 $86,343,867 475 $181,777 $86,343,867 204 $209,043 $42,644,782 232 $209,043 $48,497,98715-Oct-30 1-Jul-31 1-Mar-32 100.0% 475 $181,777 $86,343,867 475 $181,777 $86,343,867 204 $209,043 $42,644,782 232 $209,043 $48,497,98715-Oct-31 1-Jul-32 1-Mar-33 100.0% 475 $181,777 $86,343,867 475 $181,777 $86,343,867 204 $209,043 $42,644,782 232 $209,043 $48,497,98715-Oct-32 1-Jul-33 1-Mar-34 100.0% 475 $181,777 $86,343,867 475 $181,777 $86,343,867 204 $209,043 $42,644,782 232 $209,043 $48,497,98715-Oct-33 1-Jul-34 1-Mar-35 100.0% 475 $181,777 $86,343,867 475 $181,777 $86,343,867 204 $209,043 $42,644,782 232 $209,043 $48,497,98715-Oct-34 1-Jul-35 1-Mar-36 100.0% 475 $181,777 $86,343,867 475 $181,777 $86,343,867 204 $209,043 $42,644,782 232 $209,043 $48,497,98715-Oct-35 1-Jul-36 1-Mar-37 100.0% 475 $181,777 $86,343,867 475 $181,777 $86,343,867 204 $209,043 $42,644,782 232 $209,043 $48,497,98715-Oct-36 1-Jul-37 1-Mar-38 100.0% 475 $181,777 $86,343,867 475 $181,777 $86,343,867 204 $209,043 $42,644,782 232 $209,043 $48,497,987
MuniCap, Inc. M:\CONSULTING\SBER\Yonkers\[Proj. No. 23-A.xls]VIII18-Jan-08
Tower West Tower East Parcel H Residential Parcel I Residential
DRAFT Page 10 DRAFT

PHASE ICITY OF YONKERS, NY
Schedule VIII: Proposed Market Value (continued)
Final BondAssessment Taxes Year Inflation Value Total Market Value Total Market Value Total Market Value Total Market
Date Due Ending Factor SF Per SF Value Room Per Room Value SF Per SF Value SF Per SF Value15-Oct-06 1-Jul-07 1-Mar-08 100.0% 0 $182 $0 0 $146,218 $0 0 $217 $0 0 $218 $015-Oct-07 1-Jul-08 1-Mar-09 100.0% 0 $182 $0 0 $146,218 $0 0 $217 $0 0 $218 $015-Oct-08 1-Jul-09 1-Mar-10 100.0% 0 $182 $0 0 $146,218 $0 0 $217 $0 0 $218 $015-Oct-09 1-Jul-10 1-Mar-11 100.0% 475,000 $182 $86,640,000 150 $146,218 $21,932,731 80,000 $217 $17,394,400 90,000 $218 $19,622,25015-Oct-10 1-Jul-11 1-Mar-12 100.0% 475,000 $182 $86,640,000 150 $146,218 $21,932,731 80,000 $217 $17,394,400 90,000 $218 $19,622,25015-Oct-11 1-Jul-12 1-Mar-13 100.0% 475,000 $182 $86,640,000 150 $146,218 $21,932,731 80,000 $217 $17,394,400 90,000 $218 $19,622,25015-Oct-12 1-Jul-13 1-Mar-14 100.0% 475,000 $182 $86,640,000 150 $146,218 $21,932,731 80,000 $217 $17,394,400 90,000 $218 $19,622,25015-Oct-13 1-Jul-14 1-Mar-15 100.0% 475,000 $182 $86,640,000 150 $146,218 $21,932,731 80,000 $217 $17,394,400 90,000 $218 $19,622,25015-Oct-14 1-Jul-15 1-Mar-16 100.0% 475,000 $182 $86,640,000 150 $146,218 $21,932,731 80,000 $217 $17,394,400 90,000 $218 $19,622,25015-Oct-15 1-Jul-16 1-Mar-17 100.0% 475,000 $182 $86,640,000 150 $146,218 $21,932,731 80,000 $217 $17,394,400 90,000 $218 $19,622,25015-Oct-16 1-Jul-17 1-Mar-18 100.0% 475,000 $182 $86,640,000 150 $146,218 $21,932,731 80,000 $217 $17,394,400 90,000 $218 $19,622,25015-Oct-17 1-Jul-18 1-Mar-19 100.0% 475,000 $182 $86,640,000 150 $146,218 $21,932,731 80,000 $217 $17,394,400 90,000 $218 $19,622,25015-Oct-18 1-Jul-19 1-Mar-20 100.0% 475,000 $182 $86,640,000 150 $146,218 $21,932,731 80,000 $217 $17,394,400 90,000 $218 $19,622,25015-Oct-19 1-Jul-20 1-Mar-21 100.0% 475,000 $182 $86,640,000 150 $146,218 $21,932,731 80,000 $217 $17,394,400 90,000 $218 $19,622,25015-Oct-20 1-Jul-21 1-Mar-22 100.0% 475,000 $182 $86,640,000 150 $146,218 $21,932,731 80,000 $217 $17,394,400 90,000 $218 $19,622,25015-Oct-21 1-Jul-22 1-Mar-23 100.0% 475,000 $182 $86,640,000 150 $146,218 $21,932,731 80,000 $217 $17,394,400 90,000 $218 $19,622,25015-Oct-22 1-Jul-23 1-Mar-24 100.0% 475,000 $182 $86,640,000 150 $146,218 $21,932,731 80,000 $217 $17,394,400 90,000 $218 $19,622,25015-Oct-23 1-Jul-24 1-Mar-25 100.0% 475,000 $182 $86,640,000 150 $146,218 $21,932,731 80,000 $217 $17,394,400 90,000 $218 $19,622,25015-Oct-24 1-Jul-25 1-Mar-26 100.0% 475,000 $182 $86,640,000 150 $146,218 $21,932,731 80,000 $217 $17,394,400 90,000 $218 $19,622,25015-Oct-25 1-Jul-26 1-Mar-27 100.0% 475,000 $182 $86,640,000 150 $146,218 $21,932,731 80,000 $217 $17,394,400 90,000 $218 $19,622,25015-Oct-26 1-Jul-27 1-Mar-28 100.0% 475,000 $182 $86,640,000 150 $146,218 $21,932,731 80,000 $217 $17,394,400 90,000 $218 $19,622,25015-Oct-27 1-Jul-28 1-Mar-29 100.0% 475,000 $182 $86,640,000 150 $146,218 $21,932,731 80,000 $217 $17,394,400 90,000 $218 $19,622,25015-Oct-28 1-Jul-29 1-Mar-30 100.0% 475,000 $182 $86,640,000 150 $146,218 $21,932,731 80,000 $217 $17,394,400 90,000 $218 $19,622,25015-Oct-29 1-Jul-30 1-Mar-31 100.0% 475,000 $182 $86,640,000 150 $146,218 $21,932,731 80,000 $217 $17,394,400 90,000 $218 $19,622,25015-Oct-30 1-Jul-31 1-Mar-32 100.0% 475,000 $182 $86,640,000 150 $146,218 $21,932,731 80,000 $217 $17,394,400 90,000 $218 $19,622,25015-Oct-31 1-Jul-32 1-Mar-33 100.0% 475,000 $182 $86,640,000 150 $146,218 $21,932,731 80,000 $217 $17,394,400 90,000 $218 $19,622,25015-Oct-32 1-Jul-33 1-Mar-34 100.0% 475,000 $182 $86,640,000 150 $146,218 $21,932,731 80,000 $217 $17,394,400 90,000 $218 $19,622,25015-Oct-33 1-Jul-34 1-Mar-35 100.0% 475,000 $182 $86,640,000 150 $146,218 $21,932,731 80,000 $217 $17,394,400 90,000 $218 $19,622,25015-Oct-34 1-Jul-35 1-Mar-36 100.0% 475,000 $182 $86,640,000 150 $146,218 $21,932,731 80,000 $217 $17,394,400 90,000 $218 $19,622,25015-Oct-35 1-Jul-36 1-Mar-37 100.0% 475,000 $182 $86,640,000 150 $146,218 $21,932,731 80,000 $217 $17,394,400 90,000 $218 $19,622,25015-Oct-36 1-Jul-37 1-Mar-38 100.0% 475,000 $182 $86,640,000 150 $146,218 $21,932,731 80,000 $217 $17,394,400 90,000 $218 $19,622,250
MuniCap, Inc. M:\CONSULTING\SBER\Yonkers\[Proj. No. 23-A.xls]VIII (2)18-Jan-08
Office Space Hotel Theater Restaurant
DRAFT Page 11 DRAFT

PHASE ICITY OF YONKERS, NY
Schedule VIII: Proposed Market Value (continued)
RetailFinal Bond
Assessment Taxes Year Inflation Value Total Market Value Total Market Value Total Market Value Total Market Value Total Market Total MarketDate Due Ending Factor SF Per SF Value SF Per SF Value SF Per SF Value SF Per SF Value SF Per SF Value Value
15-Oct-06 1-Jul-07 1-Mar-08 100.0% 0 $194 $0 0 $221 $0 0 $242 $0 0 $222 $0 0 $283 $0 $015-Oct-07 1-Jul-08 1-Mar-09 100.0% 0 $194 $0 0 $221 $0 0 $242 $0 0 $222 $0 0 $283 $0 $015-Oct-08 1-Jul-09 1-Mar-10 100.0% 0 $194 $0 0 $221 $0 0 $242 $0 0 $222 $0 0 $283 $0 $015-Oct-09 1-Jul-10 1-Mar-11 100.0% 200,000 $194 $38,760,000 75,000 $221 $16,575,000 65,000 $242 $15,746,250 45,000 $222 $9,992,813 88,000 $283 $24,871,000 $515,364,94615-Oct-10 1-Jul-11 1-Mar-12 100.0% 200,000 $194 $38,760,000 75,000 $221 $16,575,000 65,000 $242 $15,746,250 45,000 $222 $9,992,813 88,000 $283 $24,871,000 $515,364,94615-Oct-11 1-Jul-12 1-Mar-13 100.0% 200,000 $194 $38,760,000 75,000 $221 $16,575,000 65,000 $242 $15,746,250 45,000 $222 $9,992,813 88,000 $283 $24,871,000 $515,364,94615-Oct-12 1-Jul-13 1-Mar-14 100.0% 200,000 $194 $38,760,000 75,000 $221 $16,575,000 65,000 $242 $15,746,250 45,000 $222 $9,992,813 88,000 $283 $24,871,000 $515,364,94615-Oct-13 1-Jul-14 1-Mar-15 100.0% 200,000 $194 $38,760,000 75,000 $221 $16,575,000 65,000 $242 $15,746,250 45,000 $222 $9,992,813 88,000 $283 $24,871,000 $515,364,94615-Oct-14 1-Jul-15 1-Mar-16 100.0% 200,000 $194 $38,760,000 75,000 $221 $16,575,000 65,000 $242 $15,746,250 45,000 $222 $9,992,813 88,000 $283 $24,871,000 $515,364,94615-Oct-15 1-Jul-16 1-Mar-17 100.0% 200,000 $194 $38,760,000 75,000 $221 $16,575,000 65,000 $242 $15,746,250 45,000 $222 $9,992,813 88,000 $283 $24,871,000 $515,364,94615-Oct-16 1-Jul-17 1-Mar-18 100.0% 200,000 $194 $38,760,000 75,000 $221 $16,575,000 65,000 $242 $15,746,250 45,000 $222 $9,992,813 88,000 $283 $24,871,000 $515,364,94615-Oct-17 1-Jul-18 1-Mar-19 100.0% 200,000 $194 $38,760,000 75,000 $221 $16,575,000 65,000 $242 $15,746,250 45,000 $222 $9,992,813 88,000 $283 $24,871,000 $515,364,94615-Oct-18 1-Jul-19 1-Mar-20 100.0% 200,000 $194 $38,760,000 75,000 $221 $16,575,000 65,000 $242 $15,746,250 45,000 $222 $9,992,813 88,000 $283 $24,871,000 $515,364,94615-Oct-19 1-Jul-20 1-Mar-21 100.0% 200,000 $194 $38,760,000 75,000 $221 $16,575,000 65,000 $242 $15,746,250 45,000 $222 $9,992,813 88,000 $283 $24,871,000 $515,364,94615-Oct-20 1-Jul-21 1-Mar-22 100.0% 200,000 $194 $38,760,000 75,000 $221 $16,575,000 65,000 $242 $15,746,250 45,000 $222 $9,992,813 88,000 $283 $24,871,000 $515,364,94615-Oct-21 1-Jul-22 1-Mar-23 100.0% 200,000 $194 $38,760,000 75,000 $221 $16,575,000 65,000 $242 $15,746,250 45,000 $222 $9,992,813 88,000 $283 $24,871,000 $515,364,94615-Oct-22 1-Jul-23 1-Mar-24 100.0% 200,000 $194 $38,760,000 75,000 $221 $16,575,000 65,000 $242 $15,746,250 45,000 $222 $9,992,813 88,000 $283 $24,871,000 $515,364,94615-Oct-23 1-Jul-24 1-Mar-25 100.0% 200,000 $194 $38,760,000 75,000 $221 $16,575,000 65,000 $242 $15,746,250 45,000 $222 $9,992,813 88,000 $283 $24,871,000 $515,364,94615-Oct-24 1-Jul-25 1-Mar-26 100.0% 200,000 $194 $38,760,000 75,000 $221 $16,575,000 65,000 $242 $15,746,250 45,000 $222 $9,992,813 88,000 $283 $24,871,000 $515,364,94615-Oct-25 1-Jul-26 1-Mar-27 100.0% 200,000 $194 $38,760,000 75,000 $221 $16,575,000 65,000 $242 $15,746,250 45,000 $222 $9,992,813 88,000 $283 $24,871,000 $515,364,94615-Oct-26 1-Jul-27 1-Mar-28 100.0% 200,000 $194 $38,760,000 75,000 $221 $16,575,000 65,000 $242 $15,746,250 45,000 $222 $9,992,813 88,000 $283 $24,871,000 $515,364,94615-Oct-27 1-Jul-28 1-Mar-29 100.0% 200,000 $194 $38,760,000 75,000 $221 $16,575,000 65,000 $242 $15,746,250 45,000 $222 $9,992,813 88,000 $283 $24,871,000 $515,364,94615-Oct-28 1-Jul-29 1-Mar-30 100.0% 200,000 $194 $38,760,000 75,000 $221 $16,575,000 65,000 $242 $15,746,250 45,000 $222 $9,992,813 88,000 $283 $24,871,000 $515,364,94615-Oct-29 1-Jul-30 1-Mar-31 100.0% 200,000 $194 $38,760,000 75,000 $221 $16,575,000 65,000 $242 $15,746,250 45,000 $222 $9,992,813 88,000 $283 $24,871,000 $515,364,94615-Oct-30 1-Jul-31 1-Mar-32 100.0% 200,000 $194 $38,760,000 75,000 $221 $16,575,000 65,000 $242 $15,746,250 45,000 $222 $9,992,813 88,000 $283 $24,871,000 $515,364,94615-Oct-31 1-Jul-32 1-Mar-33 100.0% 200,000 $194 $38,760,000 75,000 $221 $16,575,000 65,000 $242 $15,746,250 45,000 $222 $9,992,813 88,000 $283 $24,871,000 $515,364,94615-Oct-32 1-Jul-33 1-Mar-34 100.0% 200,000 $194 $38,760,000 75,000 $221 $16,575,000 65,000 $242 $15,746,250 45,000 $222 $9,992,813 88,000 $283 $24,871,000 $515,364,94615-Oct-33 1-Jul-34 1-Mar-35 100.0% 200,000 $194 $38,760,000 75,000 $221 $16,575,000 65,000 $242 $15,746,250 45,000 $222 $9,992,813 88,000 $283 $24,871,000 $515,364,94615-Oct-34 1-Jul-35 1-Mar-36 100.0% 200,000 $194 $38,760,000 75,000 $221 $16,575,000 65,000 $242 $15,746,250 45,000 $222 $9,992,813 88,000 $283 $24,871,000 $515,364,94615-Oct-35 1-Jul-36 1-Mar-37 100.0% 200,000 $194 $38,760,000 75,000 $221 $16,575,000 65,000 $242 $15,746,250 45,000 $222 $9,992,813 88,000 $283 $24,871,000 $515,364,94615-Oct-36 1-Jul-37 1-Mar-38 100.0% 200,000 $194 $38,760,000 75,000 $221 $16,575,000 65,000 $242 $15,746,250 45,000 $222 $9,992,813 88,000 $283 $24,871,000 $515,364,946
MuniCap, Inc. M:\CONSULTING\SBER\Yonkers\[Proj. No. 23-A.xls]VIII(3)18-Jan-08
Boutique RetailBig Box Retailer Grocery Store Discount Retailer Fitness Center
DRAFT Page 12 DRAFT

PHASE ICITY OF YONKERS, NY
Schedule IX: Projected Net Incremental Real Property Taxes
Yonkers Property Tax Property TaxesFinal Bond Incremental Available for Debt Service
Assessment Taxes Year Equalization Assessed Base Assessed City of Westchester Inflation Incremental PercentageDate Due Ending Market Value Rate1 Value2 Value3 Value School Yonkers County Total Factor5 Property Taxes Taxes Total
15-Oct-06 1-Jul-07 1-Mar-08 $0 2.94% $0 ($658,840) $0 $407.40 $120.94 $122.87 $651.21 100.0% $0 75% $015-Oct-07 1-Jul-08 1-Mar-09 $0 2.94% $0 ($658,840) $0 $407.40 $120.94 $122.87 $651.21 100.0% $0 75% $015-Oct-08 1-Jul-09 1-Mar-10 $0 2.94% $0 ($658,840) $0 $407.40 $120.94 $122.87 $651.21 100.0% $0 75% $015-Oct-09 1-Jul-10 1-Mar-11 $515,364,946 2.94% $15,151,729 ($658,840) $14,492,889 $407.40 $120.94 $122.87 $651.21 100.0% $9,437,915 75% $7,078,43615-Oct-10 1-Jul-11 1-Mar-12 $515,364,946 2.94% $15,151,729 ($658,840) $14,492,889 $423.70 $125.78 $127.78 $677.26 104.0% $9,815,431 75% $7,361,57315-Oct-11 1-Jul-12 1-Mar-13 $515,364,946 2.94% $15,151,729 ($658,840) $14,492,889 $440.64 $130.81 $132.90 $704.35 108.2% $10,208,048 75% $7,656,03615-Oct-12 1-Jul-13 1-Mar-14 $515,364,946 2.94% $15,151,729 ($658,840) $14,492,889 $458.27 $136.04 $138.21 $732.52 112.5% $10,616,370 75% $7,962,27815-Oct-13 1-Jul-14 1-Mar-15 $515,364,946 2.94% $15,151,729 ($658,840) $14,492,889 $476.60 $141.48 $143.74 $761.82 117.0% $11,041,025 75% $8,280,76915-Oct-14 1-Jul-15 1-Mar-16 $515,364,946 2.94% $15,151,729 ($658,840) $14,492,889 $495.66 $147.14 $149.49 $792.30 121.7% $11,482,666 75% $8,612,00015-Oct-15 1-Jul-16 1-Mar-17 $515,364,946 2.94% $15,151,729 ($658,840) $14,492,889 $515.49 $153.03 $155.47 $823.99 126.5% $11,941,973 75% $8,956,48015-Oct-16 1-Jul-17 1-Mar-18 $515,364,946 2.94% $15,151,729 ($658,840) $14,492,889 $536.11 $159.15 $161.69 $856.95 131.6% $12,419,652 75% $9,314,73915-Oct-17 1-Jul-18 1-Mar-19 $515,364,946 2.94% $15,151,729 ($658,840) $14,492,889 $557.56 $165.51 $168.16 $891.23 136.9% $12,916,438 75% $9,687,32815-Oct-18 1-Jul-19 1-Mar-20 $515,364,946 2.94% $15,151,729 ($658,840) $14,492,889 $579.86 $172.14 $174.88 $926.87 142.3% $13,433,095 75% $10,074,82115-Oct-19 1-Jul-20 1-Mar-21 $515,364,946 2.94% $15,151,729 ($658,840) $14,492,889 $603.05 $179.02 $181.88 $963.95 148.0% $13,970,419 75% $10,477,81415-Oct-20 1-Jul-21 1-Mar-22 $515,364,946 2.94% $15,151,729 ($658,840) $14,492,889 $627.17 $186.18 $189.15 $1,002.51 153.9% $14,529,236 75% $10,896,92715-Oct-21 1-Jul-22 1-Mar-23 $515,364,946 2.94% $15,151,729 ($658,840) $14,492,889 $652.26 $193.63 $196.72 $1,042.61 160.1% $15,110,405 75% $11,332,80415-Oct-22 1-Jul-23 1-Mar-24 $515,364,946 2.94% $15,151,729 ($658,840) $14,492,889 $678.35 $201.37 $204.59 $1,084.31 166.5% $15,714,821 75% $11,786,11615-Oct-23 1-Jul-24 1-Mar-25 $515,364,946 2.94% $15,151,729 ($658,840) $14,492,889 $705.48 $209.43 $212.77 $1,127.69 173.2% $16,343,414 75% $12,257,56115-Oct-24 1-Jul-25 1-Mar-26 $515,364,946 2.94% $15,151,729 ($658,840) $14,492,889 $733.70 $217.81 $221.28 $1,172.79 180.1% $16,997,151 75% $12,747,86315-Oct-25 1-Jul-26 1-Mar-27 $515,364,946 2.94% $15,151,729 ($658,840) $14,492,889 $763.05 $226.52 $230.13 $1,219.70 187.3% $17,677,037 75% $13,257,77815-Oct-26 1-Jul-27 1-Mar-28 $515,364,946 2.94% $15,151,729 ($658,840) $14,492,889 $793.57 $235.58 $239.34 $1,268.49 194.8% $18,384,118 75% $13,788,08915-Oct-27 1-Jul-28 1-Mar-29 $515,364,946 2.94% $15,151,729 ($658,840) $14,492,889 $825.32 $245.00 $248.91 $1,319.23 202.6% $19,119,483 75% $14,339,61215-Oct-28 1-Jul-29 1-Mar-30 $515,364,946 2.94% $15,151,729 ($658,840) $14,492,889 $858.33 $254.80 $258.87 $1,372.00 210.7% $19,884,262 75% $14,913,19715-Oct-29 1-Jul-30 1-Mar-31 $515,364,946 2.94% $15,151,729 ($658,840) $14,492,889 $892.66 $264.99 $269.22 $1,426.88 219.1% $20,679,633 75% $15,509,72515-Oct-30 1-Jul-31 1-Mar-32 $515,364,946 2.94% $15,151,729 ($658,840) $14,492,889 $928.37 $275.59 $279.99 $1,483.96 227.9% $21,506,818 75% $16,130,11415-Oct-31 1-Jul-32 1-Mar-33 $515,364,946 2.94% $15,151,729 ($658,840) $14,492,889 $965.50 $286.62 $291.19 $1,543.31 237.0% $22,367,091 75% $16,775,31815-Oct-32 1-Jul-33 1-Mar-34 $515,364,946 2.94% $15,151,729 ($658,840) $14,492,889 $1,004.13 $298.08 $302.84 $1,605.05 246.5% $23,261,775 75% $17,446,33115-Oct-33 1-Jul-34 1-Mar-35 $515,364,946 2.94% $15,151,729 ($658,840) $14,492,889 $1,044.29 $310.01 $314.95 $1,669.25 256.3% $24,192,246 75% $18,144,18415-Oct-34 1-Jul-35 1-Mar-36 $515,364,946 2.94% $15,151,729 ($658,840) $14,492,889 $1,086.06 $322.41 $327.55 $1,736.02 266.6% $25,159,935 75% $18,869,95215-Oct-35 1-Jul-36 1-Mar-37 $515,364,946 2.94% $15,151,729 ($658,840) $14,492,889 $1,129.50 $335.30 $340.65 $1,805.46 277.2% $26,166,333 75% $19,624,75015-Oct-36 1-Jul-37 1-Mar-38 $515,364,946 2.94% $15,151,729 ($658,840) $14,492,889 $1,174.68 $348.71 $354.28 $1,877.68 288.3% $27,212,986 75% $20,409,740
Total $471,589,777 $353,692,333MuniCap, Inc. M:\CONSULTING\SBER\Yonkers\[Proj. No. 23-A.xls]IX
18-Jan-081Equalization rate is the 2006 equalization rate, relating to property values in calendar year 2002Newly constructed property in Yonkers is not subsequently reassessed after its initial assessment, regardless of changes to market valu3Base value provided by Cappelli Enterprises Inc., based on an assessed value of $658,840.4City, School and County tax rates correspond to the same time frame as the equalization rate.5These projections assume property tax rates increase at 4 percent annually. According to the City of Yonkers, the actual average increase in property tax rates from FY 2003 to FY 2007 is 7.3
Rates ( Per $1,000 of AV)4
DRAFTPage 13
DRAFT

PHASE ICITY OF YONKERS, NY
Schedule X: Summary of Parking Spaces
PublicNon-Revenue
Revenue Generating Spaces Generating Private TotalParking Type Monthly Transient Total Spaces Total Spaces Spaces
River Park Center 1,646 1,646 3,292 302 3,594 950 4,544
Cacace Center 675 674 1,349 0 1,349 0 1,349
Palisades Point 29 28 57 0 57 669 726
Total 2,350 2,348 4,698 302 5,000 1,619 6,619MuniCap, Inc. M:\CONSULTING\SBER\Yonkers\[Proj. No. 23-A.xls]X
18-Jan-08
DRAFT Page 14 DRAFT

PHASE ICITY OF YONKERS, NY
Schedule XI: Projected Stabilized NOI
Type of Parker Number Duration Rate1 Frequency Gross Revenue(Months) (Occupancy)
Monthly parking 2,350 12 $75 100% $2,115,000(Days) (Turns)
Hourly parking M-F (A.M.) 2,348 260 $1 4 $2,441,920Hourly parking Th.-Sun. (P.M.) 2,348 260 $1 0.25 $152,620Hourly parking Sat.-Sun (A.M.) 2,348 104 $1 0.00 $0Hourly parking Fri.-Sun. (P.M.) 2,348 104 $1 0.25 $61,048
Total annual revenue $4,770,588
CostLess expenses: Per Space CostLabor ($115.54) ($542,817)Benefits ($28.90) ($135,777)Security ($71.70) ($336,831)Utilities ($62.22) ($292,297)Office ($1.54) ($7,253)Insurance ($24.70) ($116,049)Auto damage ($0.62) ($2,901)Supplies ($5.56) ($26,111)Equipment maintenance ($3.71) ($17,407)Elevator maintenance ($46.32) ($217,591)Professional services ($3.09) ($14,506)Advertising ($0.77) ($3,627)Violations ($9.48) ($44,534)Sewer taxes ($6.18) ($29,012)Miscelaneous ($5.56) ($26,111)Total operating expenses ($385.87) ($1,812,823)Operating expenses as a percent of revenue2 38%
Net operating income $2,957,765MuniCap, Inc. M:\CONSULTING\SBER\Yonkers\[Proj. No. 23-A.xls]XI
18-Jan-081Monthly rate, $75/month, and daily rates, $1.00 per hour, are based on information provided byExecutive Director of the Yonkers Parking Authority.2Percentage of Operating Expenses compared to Operating Revenue based on "Proposed White Plains CenterGarage: Market and Financial Analysis" prepared by Walker Parking Consultants.
DRAFT Page 15 DRAFT

PHASE ICITY OF YONKERS, NY
Schedule XII: Projected Parking Garage Total Net Operating Income
Final Bond Total Total TotalAssessment Taxes Year Operating Operating Parking
Date Due Ending Inflation Revenue Expense NOI15-Oct-06 1-Jul-07 1-Mar-08 100% $0 $0 $015-Oct-07 1-Jul-08 1-Mar-09 100% $0 $0 $015-Oct-08 1-Jul-09 1-Mar-10 100% $0 $0 $015-Oct-09 1-Jul-10 1-Mar-11 100% $4,770,588 ($1,812,823) $2,957,76515-Oct-10 1-Jul-11 1-Mar-12 102% $4,866,000 ($1,849,080) $3,016,92015-Oct-11 1-Jul-12 1-Mar-13 104% $4,963,320 ($1,886,062) $3,077,25815-Oct-12 1-Jul-13 1-Mar-14 106% $5,062,586 ($1,923,783) $3,138,80315-Oct-13 1-Jul-14 1-Mar-15 108% $5,163,838 ($1,962,258) $3,201,57915-Oct-14 1-Jul-15 1-Mar-16 110% $5,267,115 ($2,001,504) $3,265,61115-Oct-15 1-Jul-16 1-Mar-17 113% $5,372,457 ($2,041,534) $3,330,92315-Oct-16 1-Jul-17 1-Mar-18 115% $5,479,906 ($2,082,364) $3,397,54215-Oct-17 1-Jul-18 1-Mar-19 117% $5,589,504 ($2,124,012) $3,465,49315-Oct-18 1-Jul-19 1-Mar-20 120% $5,701,294 ($2,166,492) $3,534,80215-Oct-19 1-Jul-20 1-Mar-21 122% $5,815,320 ($2,209,822) $3,605,49815-Oct-20 1-Jul-21 1-Mar-22 124% $5,931,627 ($2,254,018) $3,677,60815-Oct-21 1-Jul-22 1-Mar-23 127% $6,050,259 ($2,299,098) $3,751,16115-Oct-22 1-Jul-23 1-Mar-24 129% $6,171,264 ($2,345,080) $3,826,18415-Oct-23 1-Jul-24 1-Mar-25 132% $6,294,690 ($2,391,982) $3,902,70815-Oct-24 1-Jul-25 1-Mar-26 135% $6,420,583 ($2,439,822) $3,980,76215-Oct-25 1-Jul-26 1-Mar-27 137% $6,548,995 ($2,488,618) $4,060,37715-Oct-26 1-Jul-27 1-Mar-28 140% $6,679,975 ($2,538,390) $4,141,58415-Oct-27 1-Jul-28 1-Mar-29 143% $6,813,574 ($2,589,158) $4,224,41615-Oct-28 1-Jul-29 1-Mar-30 146% $6,949,846 ($2,640,941) $4,308,90415-Oct-29 1-Jul-30 1-Mar-31 149% $7,088,843 ($2,693,760) $4,395,08315-Oct-30 1-Jul-31 1-Mar-32 152% $7,230,620 ($2,747,635) $4,482,98415-Oct-31 1-Jul-32 1-Mar-33 155% $7,375,232 ($2,802,588) $4,572,64415-Oct-32 1-Jul-33 1-Mar-34 158% $7,522,737 ($2,858,640) $4,664,09715-Oct-33 1-Jul-34 1-Mar-35 161% $7,673,191 ($2,915,813) $4,757,37915-Oct-34 1-Jul-35 1-Mar-36 164% $7,826,655 ($2,974,129) $4,852,52615-Oct-35 1-Jul-36 1-Mar-37 167% $7,983,188 ($3,033,612) $4,949,57715-Oct-36 1-Jul-37 1-Mar-38 171% $8,142,852 ($3,094,284) $5,048,568
Total $104,540,188MuniCap, Inc. M:\CONSULTING\SBER\Yonkers\[Proj. No. 23-A.xls]XII
18-Jan-08
DRAFT Page 16 DRAFT

PHASE ICITY OF YONKERS, NY
Schedule XIII: Projected Payment of Debt Service
Total Property Final Bond Net Annual Tax Available Total Total Revenues Total Cumulative Revenue Available to the City of Yonkers Debt Service Coverage
Assessment Taxes Year Debt for Debt Parking Avalable to Repay Surplus Surplus/ Developer Surplus 25% Share Tax Increment TotalDate Due Ending Service Service NOI Debt Service City County Deficit Payment (Deficit) of Increment Surplus Total and Parking NOI Revenues
15-Oct-06 1-Jul-07 1-Mar-08 $0 $0 $0 $0 $0 $0 $0 $0 $0 $0 $0 $0 NA NA15-Oct-07 1-Jul-08 1-Mar-09 $0 $0 $0 $0 $0 $0 $0 $0 $0 $0 $0 $0 NA NA15-Oct-08 1-Jul-09 1-Mar-10 $0 $0 $0 $0 $0 $0 $0 $0 $0 $0 $0 $0 NA NA15-Oct-09 1-Jul-10 1-Mar-11 $11,068,826 $7,078,436 $2,957,765 $10,036,200 $0 $0 ($1,032,625) $1,032,625 $0 $2,359,479 $0 $2,359,479 91% 100%15-Oct-10 1-Jul-11 1-Mar-12 $11,293,863 $7,361,573 $3,016,920 $10,378,493 $0 $0 ($915,370) $915,370 $0 $2,453,858 $0 $2,453,858 92% 100%15-Oct-11 1-Jul-12 1-Mar-13 $11,522,475 $7,656,036 $3,077,258 $10,733,295 $0 $0 ($789,180) $789,180 $0 $2,552,012 $0 $2,552,012 93% 100%15-Oct-12 1-Jul-13 1-Mar-14 $11,755,537 $7,962,278 $3,138,803 $11,101,081 $0 $0 ($654,456) $654,456 $0 $2,654,093 $0 $2,654,093 94% 100%15-Oct-13 1-Jul-14 1-Mar-15 $11,992,798 $8,280,769 $3,201,579 $11,482,348 $0 $0 ($510,450) $510,450 $0 $2,760,256 $0 $2,760,256 96% 100%15-Oct-14 1-Jul-15 1-Mar-16 $12,234,948 $8,612,000 $3,265,611 $11,877,611 $0 $0 ($357,337) $357,337 $0 $2,870,667 $0 $2,870,667 97% 100%15-Oct-15 1-Jul-16 1-Mar-17 $12,482,548 $8,956,480 $3,330,923 $12,287,403 $0 $0 ($195,145) $195,145 $0 $2,985,493 $0 $2,985,493 98% 100%15-Oct-16 1-Jul-17 1-Mar-18 $12,733,036 $9,314,739 $3,397,542 $12,712,280 $0 $0 ($20,756) $20,756 $0 $3,104,913 $0 $3,104,913 100% 100%15-Oct-17 1-Jul-18 1-Mar-19 $12,989,913 $9,687,328 $3,465,493 $13,152,821 $132,171 $30,737 $162,908 $0 $162,908 $3,229,109 $132,171 $3,361,280 101% 101%15-Oct-18 1-Jul-19 1-Mar-20 $13,250,366 $10,074,821 $3,534,802 $13,609,624 $291,473 $67,785 $359,258 $0 $522,166 $3,358,274 $291,473 $3,649,747 103% 103%15-Oct-19 1-Jul-20 1-Mar-21 $13,516,645 $10,477,814 $3,605,498 $14,083,313 $459,749 $106,919 $566,667 $0 $1,088,834 $3,492,605 $459,749 $3,952,354 104% 104%15-Oct-20 1-Jul-21 1-Mar-22 $13,787,752 $10,896,927 $3,677,608 $14,574,535 $638,334 $148,450 $786,784 $0 $1,875,617 $3,632,309 $638,334 $4,270,643 106% 106%15-Oct-21 1-Jul-22 1-Mar-23 $14,063,623 $11,332,804 $3,751,161 $15,083,965 $827,824 $192,518 $1,020,342 $0 $2,895,959 $3,777,601 $827,824 $4,605,425 107% 107%15-Oct-22 1-Jul-23 1-Mar-24 $14,345,071 $11,786,116 $3,826,184 $15,612,300 $1,028,129 $239,100 $1,267,229 $0 $4,163,188 $3,928,705 $1,028,129 $4,956,834 109% 109%15-Oct-23 1-Jul-24 1-Mar-25 $14,632,722 $12,257,561 $3,902,708 $16,160,268 $1,239,329 $288,217 $1,527,546 $0 $5,690,734 $4,085,854 $1,239,329 $5,325,183 110% 110%15-Oct-24 1-Jul-25 1-Mar-26 $14,925,014 $12,747,863 $3,980,762 $16,728,625 $1,463,306 $340,304 $1,803,611 $0 $7,494,344 $4,249,288 $1,463,306 $5,712,594 112% 112%15-Oct-25 1-Jul-26 1-Mar-27 $15,222,322 $13,257,778 $4,060,377 $17,318,155 $1,700,392 $395,441 $2,095,833 $0 $9,590,177 $4,419,259 $1,700,392 $6,119,651 114% 114%15-Oct-26 1-Jul-27 1-Mar-28 $15,525,833 $13,788,089 $4,141,584 $17,929,673 $1,950,285 $453,556 $2,403,840 $0 $11,994,018 $4,596,030 $1,950,285 $6,546,315 115% 115%15-Oct-27 1-Jul-28 1-Mar-29 $15,835,485 $14,339,612 $4,224,416 $18,564,028 $2,213,723 $514,820 $2,728,543 $0 $14,722,561 $4,779,871 $2,213,723 $6,993,594 117% 117%15-Oct-28 1-Jul-29 1-Mar-30 $16,150,030 $14,913,197 $4,308,904 $19,222,101 $2,492,434 $579,637 $3,072,071 $0 $17,794,632 $4,971,066 $2,492,434 $7,463,500 119% 119%15-Oct-29 1-Jul-30 1-Mar-31 $16,471,091 $15,509,725 $4,395,083 $19,904,807 $2,785,844 $647,872 $3,433,716 $0 $21,228,348 $5,169,908 $2,785,844 $7,955,752 121% 121%15-Oct-30 1-Jul-31 1-Mar-32 $16,798,983 $16,130,114 $4,482,984 $20,613,098 $3,094,469 $719,645 $3,814,115 $0 $25,042,463 $5,376,705 $3,094,469 $8,471,174 123% 123%15-Oct-31 1-Jul-32 1-Mar-33 $17,131,767 $16,775,318 $4,572,644 $21,347,962 $3,420,685 $795,510 $4,216,195 $0 $29,258,658 $5,591,773 $3,420,685 $9,012,458 125% 125%15-Oct-32 1-Jul-33 1-Mar-34 $17,471,382 $17,446,331 $4,664,097 $22,110,428 $3,763,752 $875,293 $4,639,045 $0 $33,897,703 $5,815,444 $3,763,752 $9,579,196 127% 127%15-Oct-33 1-Jul-34 1-Mar-35 $17,818,391 $18,144,184 $4,757,379 $22,901,563 $4,124,081 $959,090 $5,083,172 $0 $38,980,875 $6,048,061 $4,124,081 $10,172,143 129% 129%15-Oct-34 1-Jul-35 1-Mar-36 $18,171,044 $18,869,952 $4,852,526 $23,722,478 $4,503,992 $1,047,442 $5,551,434 $0 $44,532,309 $6,289,984 $4,503,992 $10,793,976 131% 131%15-Oct-35 1-Jul-36 1-Mar-37 $18,530,403 $19,624,750 $4,949,577 $24,574,326 $4,903,559 $1,140,365 $6,043,923 $0 $50,576,232 $6,541,583 $4,903,559 $11,445,142 NA NA15-Oct-36 1-Jul-37 1-Mar-38 $206,857 $20,409,740 $5,048,568 $25,458,308 $20,487,019 $4,764,432 $25,251,451 $0 $75,827,683 $6,803,247 $20,487,019 $27,290,265 NA NA
Total $391,928,725 $333,282,593 $104,540,188 $437,822,782 $61,520,551 $14,307,132 $71,352,364 $4,475,319 $117,897,444 $61,520,551 $179,417,995MuniCap, Inc. M:\CONSULTING\SBER\Yonkers\[Proj. No. 23-A.xls]XIII
18-Jan-08
DRAFT Page 17 DRAFT

PHASE ICITY OF YONKERS, NY
Schedule XIV: Projected Portion of Debt Service (City and County)
Final Bond Debt Service Paid by Real Property Tax Revenues Portion of Debt ServiceAssessment Taxes Year Net Annual Less: Total Less: Developer City County
Date Due Ending Debt Service Parking NOI Payment Total Amount Percentage1 County Percentage1
15-Oct-06 1-Jul-07 1-Mar-08 $0 $0 $0 $0 $0 NA $0 NA15-Oct-07 1-Jul-08 1-Mar-09 $0 $0 $0 $0 $0 NA $0 NA15-Oct-08 1-Jul-09 1-Mar-10 $0 $0 $0 $0 $0 NA $0 NA15-Oct-09 1-Jul-10 1-Mar-11 $11,068,826 ($2,957,765) ($1,032,625) $7,078,436 $5,742,880 52% $1,335,556 12%15-Oct-10 1-Jul-11 1-Mar-12 $11,293,863 ($3,016,920) ($915,370) $7,361,573 $5,972,595 53% $1,388,978 12%15-Oct-11 1-Jul-12 1-Mar-13 $11,522,475 ($3,077,258) ($789,180) $7,656,036 $6,211,499 54% $1,444,537 13%15-Oct-12 1-Jul-13 1-Mar-14 $11,755,537 ($3,138,803) ($654,456) $7,962,278 $6,459,959 55% $1,502,319 13%15-Oct-13 1-Jul-14 1-Mar-15 $11,992,798 ($3,201,579) ($510,450) $8,280,769 $6,718,357 56% $1,562,412 13%15-Oct-14 1-Jul-15 1-Mar-16 $12,234,948 ($3,265,611) ($357,337) $8,612,000 $6,987,091 57% $1,624,908 13%15-Oct-15 1-Jul-16 1-Mar-17 $12,482,548 ($3,330,923) ($195,145) $8,956,480 $7,266,575 58% $1,689,904 14%15-Oct-16 1-Jul-17 1-Mar-18 $12,733,036 ($3,397,542) ($20,756) $9,314,739 $7,557,238 59% $1,757,501 14%15-Oct-17 1-Jul-18 1-Mar-19 $12,989,913 ($3,465,493) ($0) $9,524,420 $7,727,357 59% $1,797,063 14%15-Oct-18 1-Jul-19 1-Mar-20 $13,250,366 ($3,534,802) ($0) $9,715,563 $7,882,435 59% $1,833,128 14%15-Oct-19 1-Jul-20 1-Mar-21 $13,516,645 ($3,605,498) ($0) $9,911,147 $8,041,116 59% $1,870,031 14%15-Oct-20 1-Jul-21 1-Mar-22 $13,787,752 ($3,677,608) ($0) $10,110,143 $8,202,566 59% $1,907,577 14%15-Oct-21 1-Jul-22 1-Mar-23 $14,063,623 ($3,751,161) ($0) $10,312,462 $8,366,712 59% $1,945,751 14%15-Oct-22 1-Jul-23 1-Mar-24 $14,345,071 ($3,826,184) ($0) $10,518,887 $8,534,189 59% $1,984,699 14%15-Oct-23 1-Jul-24 1-Mar-25 $14,632,722 ($3,902,708) ($0) $10,730,015 $8,705,481 59% $2,024,534 14%15-Oct-24 1-Jul-25 1-Mar-26 $14,925,014 ($3,980,762) ($0) $10,944,252 $8,879,296 59% $2,064,956 14%15-Oct-25 1-Jul-26 1-Mar-27 $15,222,322 ($4,060,377) ($0) $11,161,945 $9,055,914 59% $2,106,031 14%15-Oct-26 1-Jul-27 1-Mar-28 $15,525,833 ($4,141,584) ($0) $11,384,248 $9,236,274 59% $2,147,975 14%15-Oct-27 1-Jul-28 1-Mar-29 $15,835,485 ($4,224,416) ($0) $11,611,069 $9,420,298 59% $2,190,771 14%15-Oct-28 1-Jul-29 1-Mar-30 $16,150,030 ($4,308,904) ($0) $11,841,125 $9,606,947 59% $2,234,178 14%15-Oct-29 1-Jul-30 1-Mar-31 $16,471,091 ($4,395,083) ($0) $12,076,009 $9,797,513 59% $2,278,496 14%15-Oct-30 1-Jul-31 1-Mar-32 $16,798,983 ($4,482,984) ($0) $12,315,999 $9,992,222 59% $2,323,777 14%15-Oct-31 1-Jul-32 1-Mar-33 $17,131,767 ($4,572,644) ($0) $12,559,124 $10,189,474 59% $2,369,650 14%15-Oct-32 1-Jul-33 1-Mar-34 $17,471,382 ($4,664,097) ($0) $12,807,286 $10,390,813 59% $2,416,473 14%15-Oct-33 1-Jul-34 1-Mar-35 $17,818,391 ($4,757,379) ($0) $13,061,012 $10,596,667 59% $2,464,346 14%15-Oct-34 1-Jul-35 1-Mar-36 $18,171,044 ($4,852,526) ($0) $13,318,517 $10,805,586 59% $2,512,932 14%15-Oct-35 1-Jul-36 1-Mar-37 $18,530,403 ($4,949,577) ($0) $13,580,826 $11,018,402 59% $2,562,424 14%15-Oct-36 1-Jul-37 1-Mar-38 $206,857 ($5,048,568) ($0) $0 $0 NA $0 NA
Total $391,928,725 ($104,540,188) ($4,475,319) $282,706,361 $229,365,456 $53,340,905MuniCap, Inc. M:\CONSULTING\SBER\Yonkers\[Proj. No. 23-A.xls]XIV
18-Jan-081Split between City portion and County portion of debt service is based on a pro rata approach using the current real property tax rates for both City, which includes city and school and County.
DRAFT Page 17 DRAFT

PHASE ICITY OF YONKERS, NY
TIF BOND PROJECTIONSProjection No. 23-B
Assumptions:75% of City TIF Revenue is Available to Pay Debt Service
0% of County TIF Revenue is Available to Pay Debt Service$159,06,364 in Public Improvements
5,000 Public Parking Spaces6.25% Interest Rate
Prepared By:
MuniCap, Inc.Public Finance
January 18, 2008

PHASE ICITY OF YONKERS, NY
TIF BOND PROJECTIONSProjection No. 23-B
Table of Contents
I. Bond Issuance Assumptions 1
II. Debt Service Projections 2
III. Details of the Capitalized Interest Account 3
IV. Details of the Improvement Fund 4
V. Absorbtion Schedule 5
VI. Projection of Average Monthly Rent -- Apartments 8
VII. Projection of Market Value 9
VIII. Proposed Market Value 10
IX. Projected Net Incremental Real Property Taxes 13
X. Summary of Parking Spaces 14
XI. Projected Stabilized NOI 15
XII. Projected Parking Garage Total Net Operating Income 16
XIII. Projected Payment of Debt Service 17

PHASE ICITY OF YONKERS, NY
Schedule I: Sources and Uses of Funds and Bond Issuance Assumptions
PercentSources of funds: Total bond proceeds $186,903,000 95.2% Interest earned in the improvement fund (see Schedule IV) $9,407,922 5.0% Total sources of funds $196,310,922 100.0%
Total uses of funds: Public improvements $159,064,364 81.0% Underwriter's discount $1,869,030 1.0% Issuance costs $750,000 0.4% Capitalized interest (see Schedule III) $15,936,780 8.1% Reserve fund $18,690,300 9.5% Rounding $448 0.0% Total uses of funds $196,310,922 100.0%
Assumptions:Maturity 29.4 years Interest only 1.4 years Amortization 28 years
Bond coupon rate 6.25%
Reinvestment rates: Reserve fund 4.00% Improvement fund 4.00% Capitalized interest account 4.00%
Date bonds issued 1-Oct-08Dates payments due: Interest September 1 and March 1 Principal March 1
Capitalized interest: Interest funded through 1-Mar-10 Months interest funded 17MuniCap, Inc. M:\CONSULTING\SBER\Yonkers\[Proj. No. 23-B.xls]I
18-Jan-08
DRAFT Page 1 DRAFT

PHASE ICITY OF YONKERS, NY
Schedule II: Debt Service Projections
Gross Gross Annual Reserve Net AnnualInterest Debt Service Debt Service Capitalized Fund Trustee and Debt
Date Principal Rate Interest Payments Payments Interest Income Admin. Fund Service1-Oct-081-Mar-09 $0 6.25% $5,840,719 $5,840,719 $5,840,719 ($5,559,214) ($311,505) $30,000 $01-Sep-09 $5,840,719 $5,840,719 ($5,466,913) ($373,806)1-Mar-10 $0 6.25% $5,840,719 $5,840,719 $11,681,438 ($5,496,913) ($373,806) $30,000 $01-Sep-10 $5,840,719 $5,840,719 ($373,806)1-Mar-11 $105,000 6.25% $5,840,719 $5,945,719 $11,786,438 ($373,806) $30,000 $11,068,8261-Sep-11 $5,837,438 $5,837,438 ($373,806)1-Mar-12 $336,000 6.25% $5,837,438 $6,173,438 $12,010,875 ($373,806) $30,600 $11,293,8631-Sep-12 $5,826,938 $5,826,938 ($373,806)1-Mar-13 $585,000 6.25% $5,826,938 $6,411,938 $12,238,875 ($373,806) $31,212 $11,522,4751-Sep-13 $5,808,656 $5,808,656 ($373,806)1-Mar-14 $854,000 6.25% $5,808,656 $6,662,656 $12,471,313 ($373,806) $31,836 $11,755,5371-Sep-14 $5,781,969 $5,781,969 ($373,806)1-Mar-15 $1,144,000 6.25% $5,781,969 $6,925,969 $12,707,938 ($373,806) $32,473 $11,992,7981-Sep-15 $5,746,219 $5,746,219 ($373,806)1-Mar-16 $1,457,000 6.25% $5,746,219 $7,203,219 $12,949,438 ($373,806) $33,122 $12,234,9481-Sep-16 $5,700,688 $5,700,688 ($373,806)1-Mar-17 $1,795,000 6.25% $5,700,688 $7,495,688 $13,196,375 ($373,806) $33,785 $12,482,5481-Sep-17 $5,644,594 $5,644,594 ($373,806)1-Mar-18 $2,157,000 6.25% $5,644,594 $7,801,594 $13,446,188 ($373,806) $34,461 $12,733,0361-Sep-18 $5,577,188 $5,577,188 ($373,806)1-Mar-19 $2,548,000 6.25% $5,577,188 $8,125,188 $13,702,375 ($373,806) $35,150 $12,989,9131-Sep-19 $5,497,563 $5,497,563 ($373,806)1-Mar-20 $2,967,000 6.25% $5,497,563 $8,464,563 $13,962,125 ($373,806) $35,853 $13,250,3661-Sep-20 $5,404,844 $5,404,844 ($373,806)1-Mar-21 $3,418,000 6.25% $5,404,844 $8,822,844 $14,227,688 ($373,806) $36,570 $13,516,6451-Sep-21 $5,298,031 $5,298,031 ($373,806)1-Mar-22 $3,902,000 6.25% $5,298,031 $9,200,031 $14,498,063 ($373,806) $37,301 $13,787,7521-Sep-22 $5,176,094 $5,176,094 ($373,806)1-Mar-23 $4,421,000 6.25% $5,176,094 $9,597,094 $14,773,188 ($373,806) $38,047 $14,063,6231-Sep-23 $5,037,938 $5,037,938 ($373,806)1-Mar-24 $4,978,000 6.25% $5,037,938 $10,015,938 $15,053,875 ($373,806) $38,808 $14,345,0711-Sep-24 $4,882,375 $4,882,375 ($373,806)1-Mar-25 $5,576,000 6.25% $4,882,375 $10,458,375 $15,340,750 ($373,806) $39,584 $14,632,7221-Sep-25 $4,708,125 $4,708,125 ($373,806)1-Mar-26 $6,216,000 6.25% $4,708,125 $10,924,125 $15,632,250 ($373,806) $40,376 $14,925,0141-Sep-26 $4,513,875 $4,513,875 ($373,806)1-Mar-27 $6,901,000 6.25% $4,513,875 $11,414,875 $15,928,750 ($373,806) $41,184 $15,222,3221-Sep-27 $4,298,219 $4,298,219 ($373,806)1-Mar-28 $7,635,000 6.25% $4,298,219 $11,933,219 $16,231,438 ($373,806) $42,007 $15,525,8331-Sep-28 $4,059,625 $4,059,625 ($373,806)1-Mar-29 $8,421,000 6.25% $4,059,625 $12,480,625 $16,540,250 ($373,806) $42,847 $15,835,4851-Sep-29 $3,796,469 $3,796,469 ($373,806)1-Mar-30 $9,261,000 6.25% $3,796,469 $13,057,469 $16,853,938 ($373,806) $43,704 $16,150,0301-Sep-30 $3,507,063 $3,507,063 ($373,806)1-Mar-31 $10,160,000 6.25% $3,507,063 $13,667,063 $17,174,125 ($373,806) $44,578 $16,471,0911-Sep-31 $3,189,563 $3,189,563 ($373,806)1-Mar-32 $11,122,000 6.25% $3,189,563 $14,311,563 $17,501,125 ($373,806) $45,470 $16,798,9831-Sep-32 $2,842,000 $2,842,000 ($373,806)1-Mar-33 $12,149,000 6.25% $2,842,000 $14,991,000 $17,833,000 ($373,806) $46,379 $17,131,7671-Sep-33 $2,462,344 $2,462,344 ($373,806)1-Mar-34 $13,247,000 6.25% $2,462,344 $15,709,344 $18,171,688 ($373,806) $47,307 $17,471,3821-Sep-34 $2,048,375 $2,048,375 ($373,806)1-Mar-35 $14,421,000 6.25% $2,048,375 $16,469,375 $18,517,750 ($373,806) $48,253 $17,818,3911-Sep-35 $1,597,719 $1,597,719 ($373,806)1-Mar-36 $15,674,000 6.25% $1,597,719 $17,271,719 $18,869,438 ($373,806) $49,218 $18,171,0441-Sep-36 $1,107,906 $1,107,906 ($373,806)1-Mar-37 $17,012,000 6.25% $1,107,906 $18,119,906 $19,227,813 ($373,806) $50,203 $18,530,4031-Sep-37 $576,281 $576,281 ($373,806)1-Mar-38 $18,441,000 6.25% $576,281 $19,017,281 $19,593,563 ($19,064,106) $51,207 $206,857
Total $186,903,000 $261,059,781 $447,962,781 $447,962,781 ($16,523,039) ($40,682,553) $1,171,536 $391,928,725MuniCap, Inc. M:\CONSULTING\SBER\Yonkers\[Proj. No. 23-B.xls]II
18-Jan-08
DRAFT Page 2 DRAFT

PHASE ICITY OF YONKERS, NY
Schedule III: Details of the Capitalized Interest Account
Disbursement Net WithdrawalBeginning Deposit from for Reserve Trustee and From Capitalized Interest Reinvestment EndingBalance Bond Proceeds Debt Service Fund Income Admin. Fund Interest Account Earnings Rate Balance
1-Oct-08 $0 $15,936,780 $15,936,7801-Mar-09 $15,936,780 ($5,840,719) $311,505 ($30,000) $5,559,214 $265,613 4.00% $10,643,1791-Sep-09 $10,643,179 ($5,840,719) $373,806 $5,466,913 $212,864 4.00% $5,389,1301-Mar-10 $5,389,130 ($5,840,719) $373,806 ($30,000) $5,496,913 $107,783 4.00% $0
Total $15,936,780 ($17,522,156) $1,059,117 ($60,000) $16,523,039 $586,259MuniCap, Inc. M:\CONSULTING\SBER\Yonkers\[Proj. No. 23-B.xls]III
18-Jan-08
DRAFT Page 3 DRAFT

PHASE ICITY OF YONKERS, NY
Schedule IV: Details of the Improvement Fund
DisbursementBeginning Deposit from for Interest Reinvestment Ending
Date Balance Bond Proceeds Construction Earnings Rate Balance1-Oct-08 $0 $149,656,442 4.00% $149,656,4421-Nov-08 $149,656,442 $0 ($4,418,455) $498,855 4.00% $145,736,8421-Dec-08 $145,736,842 $0 ($4,418,455) $485,789 4.00% $141,804,1771-Jan-09 $141,804,177 $0 ($4,418,455) $472,681 4.00% $137,858,4031-Feb-09 $137,858,403 $0 ($4,418,455) $459,528 4.00% $133,899,4771-Mar-09 $133,899,477 $0 ($4,418,455) $446,332 4.00% $129,927,3541-Apr-09 $129,927,354 $0 ($4,418,455) $433,091 4.00% $125,941,9911-May-09 $125,941,991 $0 ($4,418,455) $419,807 4.00% $121,943,3431-Jun-09 $121,943,343 $0 ($4,418,455) $406,478 4.00% $117,931,3661-Jul-09 $117,931,366 $0 ($4,418,455) $393,105 4.00% $113,906,0161-Aug-09 $113,906,016 $0 ($4,418,455) $379,687 4.00% $109,867,2481-Sep-09 $109,867,248 $0 ($4,418,455) $366,224 4.00% $105,815,0181-Oct-09 $105,815,018 $0 ($4,418,455) $352,717 4.00% $101,749,2801-Nov-09 $101,749,280 $0 ($4,418,455) $339,164 4.00% $97,669,9891-Dec-09 $97,669,989 $0 ($4,418,455) $325,567 4.00% $93,577,1021-Jan-10 $93,577,102 $0 ($4,418,455) $311,924 4.00% $89,470,5711-Feb-10 $89,470,571 $0 ($4,418,455) $298,235 4.00% $85,350,3511-Mar-10 $85,350,351 $0 ($4,418,455) $284,501 4.00% $81,216,3981-Apr-10 $81,216,398 $0 ($4,418,455) $270,721 4.00% $77,068,6651-May-10 $77,068,665 $0 ($4,418,455) $256,896 4.00% $72,907,1061-Jun-10 $72,907,106 $0 ($4,418,455) $243,024 4.00% $68,731,6751-Jul-10 $68,731,675 $0 ($4,418,455) $229,106 4.00% $64,542,3261-Aug-10 $64,542,326 $0 ($4,418,455) $215,141 4.00% $60,339,0121-Sep-10 $60,339,012 $0 ($4,418,455) $201,130 4.00% $56,121,6881-Oct-10 $56,121,688 $0 ($4,418,455) $187,072 4.00% $51,890,3061-Nov-10 $51,890,306 $0 ($4,418,455) $172,968 4.00% $47,644,8191-Dec-10 $47,644,819 $0 ($4,418,455) $158,816 4.00% $43,385,1801-Jan-11 $43,385,180 $0 ($4,418,455) $144,617 4.00% $39,111,3431-Feb-11 $39,111,343 $0 ($4,418,455) $130,371 4.00% $34,823,2601-Mar-11 $34,823,260 $0 ($4,418,455) $116,078 4.00% $30,520,8831-Apr-11 $30,520,883 $0 ($4,418,455) $101,736 4.00% $26,204,1641-May-11 $26,204,164 $0 ($4,418,455) $87,347 4.00% $21,873,0571-Jun-11 $21,873,057 $0 ($4,418,455) $72,910 4.00% $17,527,5131-Jul-11 $17,527,513 $0 ($4,418,455) $58,425 4.00% $13,167,4831-Aug-11 $13,167,483 $0 ($4,418,455) $43,892 4.00% $8,792,9201-Sep-11 $8,792,920 $0 ($4,418,455) $29,310 4.00% $4,403,7751-Oct-11 $4,403,775 $0 ($4,418,455) $14,679 4.00% $0
Total $149,656,442 ($159,064,364) $9,407,922MuniCap, Inc. M:\CONSULTING\SBER\Yonkers\[Proj. No. 23-B.xls]IV
18-Jan-08
DRAFTPage 4
DRAFT

PHASE ICITY OF YONKERS, NY
Schedule V: Construction Schedule
ResidentialFinal Bond River Park Center Palisades Point
Assessment Taxes YearDate Due Ending Units Total Units Units Total Units Units Total Units Units Total Units
15-Oct-06 1-Jul-07 1-Mar-08 0 0 0 0 0 0 0 015-Oct-07 1-Jul-08 1-Mar-09 0 0 0 0 0 0 0 015-Oct-08 1-Jul-09 1-Mar-10 0 0 0 0 0 0 0 015-Oct-09 1-Jul-10 1-Mar-11 475 475 475 475 204 204 232 23215-Oct-10 1-Jul-11 1-Mar-12 0 475 0 475 0 204 0 23215-Oct-11 1-Jul-12 1-Mar-13 0 475 0 475 0 204 0 23215-Oct-12 1-Jul-13 1-Mar-14 0 475 0 475 0 204 0 23215-Oct-13 1-Jul-14 1-Mar-15 0 475 0 475 0 204 0 23215-Oct-14 1-Jul-15 1-Mar-16 0 475 0 475 0 204 0 23215-Oct-15 1-Jul-16 1-Mar-17 0 475 0 475 0 204 0 23215-Oct-16 1-Jul-17 1-Mar-18 0 475 0 475 0 204 0 23215-Oct-17 1-Jul-18 1-Mar-19 0 475 0 475 0 204 0 23215-Oct-18 1-Jul-19 1-Mar-20 0 475 0 475 0 204 0 23215-Oct-19 1-Jul-20 1-Mar-21 0 475 0 475 0 204 0 23215-Oct-20 1-Jul-21 1-Mar-22 0 475 0 475 0 204 0 23215-Oct-21 1-Jul-22 1-Mar-23 0 475 0 475 0 204 0 23215-Oct-22 1-Jul-23 1-Mar-24 0 475 0 475 0 204 0 23215-Oct-23 1-Jul-24 1-Mar-25 0 475 0 475 0 204 0 23215-Oct-24 1-Jul-25 1-Mar-26 0 475 0 475 0 204 0 23215-Oct-25 1-Jul-26 1-Mar-27 0 475 0 475 0 204 0 23215-Oct-26 1-Jul-27 1-Mar-28 0 475 0 475 0 204 0 23215-Oct-27 1-Jul-28 1-Mar-29 0 475 0 475 0 204 0 23215-Oct-28 1-Jul-29 1-Mar-30 0 475 0 475 0 204 0 23215-Oct-29 1-Jul-30 1-Mar-31 0 475 0 475 0 204 0 23215-Oct-30 1-Jul-31 1-Mar-32 0 475 0 475 0 204 0 23215-Oct-31 1-Jul-32 1-Mar-33 0 475 0 475 0 204 0 23215-Oct-32 1-Jul-33 1-Mar-34 0 475 0 475 0 204 0 23215-Oct-33 1-Jul-34 1-Mar-35 0 475 0 475 0 204 0 23215-Oct-34 1-Jul-35 1-Mar-36 0 475 0 475 0 204 0 23215-Oct-35 1-Jul-36 1-Mar-37 0 475 0 475 0 204 0 23215-Oct-36 1-Jul-37 1-Mar-38 0 475 0 475 0 204 0 232
Total 475 475 204 232MuniCap, Inc. M:\CONSULTING\SBER\Yonkers\[Proj. No. 23-B.xls]V
18-Jan-08
Tower West Parcel H Residential Units Parcel I Residential UnitsTower East
DRAFT Page 5 DRAFT

PHASE ICITY OF YONKERS, NY
Schedule V: Construction Schedule (continued)
Final BondAssessment Taxes Year
Date Due Ending SF Total SF Rooms Total Rooms SF Total SF SF Total SF15-Oct-06 1-Jul-07 1-Mar-08 0 0 0 0 0 0 0 015-Oct-07 1-Jul-08 1-Mar-09 0 0 0 0 0 0 0 015-Oct-08 1-Jul-09 1-Mar-10 0 0 0 0 0 0 0 015-Oct-09 1-Jul-10 1-Mar-11 475,000 475,000 150 150 80,000 80,000 90,000 90,00015-Oct-10 1-Jul-11 1-Mar-12 0 475,000 0 150 0 80,000 0 90,00015-Oct-11 1-Jul-12 1-Mar-13 0 475,000 0 150 0 80,000 0 90,00015-Oct-12 1-Jul-13 1-Mar-14 0 475,000 0 150 0 80,000 0 90,00015-Oct-13 1-Jul-14 1-Mar-15 0 475,000 0 150 0 80,000 0 90,00015-Oct-14 1-Jul-15 1-Mar-16 0 475,000 0 150 0 80,000 0 90,00015-Oct-15 1-Jul-16 1-Mar-17 0 475,000 0 150 0 80,000 0 90,00015-Oct-16 1-Jul-17 1-Mar-18 0 475,000 0 150 0 80,000 0 90,00015-Oct-17 1-Jul-18 1-Mar-19 0 475,000 0 150 0 80,000 0 90,00015-Oct-18 1-Jul-19 1-Mar-20 0 475,000 0 150 0 80,000 0 90,00015-Oct-19 1-Jul-20 1-Mar-21 0 475,000 0 150 0 80,000 0 90,00015-Oct-20 1-Jul-21 1-Mar-22 0 475,000 0 150 0 80,000 0 90,00015-Oct-21 1-Jul-22 1-Mar-23 0 475,000 0 150 0 80,000 0 90,00015-Oct-22 1-Jul-23 1-Mar-24 0 475,000 0 150 0 80,000 0 90,00015-Oct-23 1-Jul-24 1-Mar-25 0 475,000 0 150 0 80,000 0 90,00015-Oct-24 1-Jul-25 1-Mar-26 0 475,000 0 150 0 80,000 0 90,00015-Oct-25 1-Jul-26 1-Mar-27 0 475,000 0 150 0 80,000 0 90,00015-Oct-26 1-Jul-27 1-Mar-28 0 475,000 0 150 0 80,000 0 90,00015-Oct-27 1-Jul-28 1-Mar-29 0 475,000 0 150 0 80,000 0 90,00015-Oct-28 1-Jul-29 1-Mar-30 0 475,000 0 150 0 80,000 0 90,00015-Oct-29 1-Jul-30 1-Mar-31 0 475,000 0 150 0 80,000 0 90,00015-Oct-30 1-Jul-31 1-Mar-32 0 475,000 0 150 0 80,000 0 90,00015-Oct-31 1-Jul-32 1-Mar-33 0 475,000 0 150 0 80,000 0 90,00015-Oct-32 1-Jul-33 1-Mar-34 0 475,000 0 150 0 80,000 0 90,00015-Oct-33 1-Jul-34 1-Mar-35 0 475,000 0 150 0 80,000 0 90,00015-Oct-34 1-Jul-35 1-Mar-36 0 475,000 0 150 0 80,000 0 90,00015-Oct-35 1-Jul-36 1-Mar-37 0 475,000 0 150 0 80,000 0 90,00015-Oct-36 1-Jul-37 1-Mar-38 0 475,000 0 150 0 80,000 0 90,000
Total 475,000 150 80,000 90,000MuniCap, Inc. M:\CONSULTING\SBER\Yonkers\[Proj. No. 23-B.xls]V (2)
18-Jan-08
Theater RestaurantsOffice Space Hotel
DRAFT Page 6 DRAFT

PHASE ICITY OF YONKERS, NY
Schedule V: Construction Schedule (continued)
Final Bond RetailAssessment Taxes Year
Date Due Ending SF Total SF SF Total SF SF Total SF SF Total SF SF Total SF15-Oct-06 1-Jul-07 1-Mar-08 0 0 0 0 0 0 0 0 0 015-Oct-07 1-Jul-08 1-Mar-09 0 0 0 0 0 0 0 0 0 015-Oct-08 1-Jul-09 1-Mar-10 0 0 0 0 0 0 0 0 0 015-Oct-09 1-Jul-10 1-Mar-11 200,000 200,000 75,000 75,000 65,000 65,000 45,000 45,000 88,000 88,00015-Oct-10 1-Jul-11 1-Mar-12 0 200,000 0 75,000 0 65,000 0 45,000 0 88,00015-Oct-11 1-Jul-12 1-Mar-13 0 200,000 0 75,000 0 65,000 0 45,000 0 88,00015-Oct-12 1-Jul-13 1-Mar-14 0 200,000 0 75,000 0 65,000 0 45,000 0 88,00015-Oct-13 1-Jul-14 1-Mar-15 0 200,000 0 75,000 0 65,000 0 45,000 0 88,00015-Oct-14 1-Jul-15 1-Mar-16 0 200,000 0 75,000 0 65,000 0 45,000 0 88,00015-Oct-15 1-Jul-16 1-Mar-17 0 200,000 0 75,000 0 65,000 0 45,000 0 88,00015-Oct-16 1-Jul-17 1-Mar-18 0 200,000 0 75,000 0 65,000 0 45,000 0 88,00015-Oct-17 1-Jul-18 1-Mar-19 0 200,000 0 75,000 0 65,000 0 45,000 0 88,00015-Oct-18 1-Jul-19 1-Mar-20 0 200,000 0 75,000 0 65,000 0 45,000 0 88,00015-Oct-19 1-Jul-20 1-Mar-21 0 200,000 0 75,000 0 65,000 0 45,000 0 88,00015-Oct-20 1-Jul-21 1-Mar-22 0 200,000 0 75,000 0 65,000 0 45,000 0 88,00015-Oct-21 1-Jul-22 1-Mar-23 0 200,000 0 75,000 0 65,000 0 45,000 0 88,00015-Oct-22 1-Jul-23 1-Mar-24 0 200,000 0 75,000 0 65,000 0 45,000 0 88,00015-Oct-23 1-Jul-24 1-Mar-25 0 200,000 0 75,000 0 65,000 0 45,000 0 88,00015-Oct-24 1-Jul-25 1-Mar-26 0 200,000 0 75,000 0 65,000 0 45,000 0 88,00015-Oct-25 1-Jul-26 1-Mar-27 0 200,000 0 75,000 0 65,000 0 45,000 0 88,00015-Oct-26 1-Jul-27 1-Mar-28 0 200,000 0 75,000 0 65,000 0 45,000 0 88,00015-Oct-27 1-Jul-28 1-Mar-29 0 200,000 0 75,000 0 65,000 0 45,000 0 88,00015-Oct-28 1-Jul-29 1-Mar-30 0 200,000 0 75,000 0 65,000 0 45,000 0 88,00015-Oct-29 1-Jul-30 1-Mar-31 0 200,000 0 75,000 0 65,000 0 45,000 0 88,00015-Oct-30 1-Jul-31 1-Mar-32 0 200,000 0 75,000 0 65,000 0 45,000 0 88,00015-Oct-31 1-Jul-32 1-Mar-33 0 200,000 0 75,000 0 65,000 0 45,000 0 88,00015-Oct-32 1-Jul-33 1-Mar-34 0 200,000 0 75,000 0 65,000 0 45,000 0 88,00015-Oct-33 1-Jul-34 1-Mar-35 0 200,000 0 75,000 0 65,000 0 45,000 0 88,00015-Oct-34 1-Jul-35 1-Mar-36 0 200,000 0 75,000 0 65,000 0 45,000 0 88,00015-Oct-35 1-Jul-36 1-Mar-37 0 200,000 0 75,000 0 65,000 0 45,000 0 88,00015-Oct-36 1-Jul-37 1-Mar-38 0 200,000 0 75,000 0 65,000 0 45,000 0 88,000
Total 200,000 75,000 65,000 45,000 88,000MuniCap, Inc. M:\CONSULTING\SBER\Yonkers\[Proj. No. 23-B.xls]V (3)
18-Jan-08
Boutique RetailBig Box Discount Retailer Fitness CenterGrocery Store
DRAFT Page 7 DRAFT

PHASE ICITY OF YONKERS, NY
Schedule VI: Projection of Average Monthly Rent -- Apartments
River Park CenterPercentage Weighted Average
Types of Apartments Monthly Rent1 of Total Apartments2 Monthly RentStudio $1,500 9% $141
1- Bedroom $2,000 16% $3132-Bedroom $2,500 50% $1,2503-Bedroom $3,000 25% $750
Total 100% $2,453- Expe
Palisades PointPercentage Weighted Average
Types of Apartments Monthly Rent3 of Total Apartments2 Monthly RentStudio $1,725 9% $162
1- Bedroom $2,300 16% $3592-Bedroom $2,875 50% $1,4383-Bedroom $3,450 25% $863
Total 100% $2,821MuniCap, Inc. M:\CONSULTING\SBER\Yonkers\[Proj. No. 23-B.xls]VI (Apartments)
18-Jan-081Based on information from City of Yonkers Appointed Assessor.2Source: Cappelli Enterprises Inc.3Rents for apartments at Palisades Point assume a 15% premium over apartments at River Park Center. Source: Cappelli Enterprises Inc.
DRAFT Page 8 DRAFT

PHASE ICITY OF YONKERS, NY
Schedule VII: Projection of Market Value
Residential1
River Park Center Palisades PointParcel H Parcel I
Tower West Tower East Units Units Office Space2 Theater3 Restaurants4
Income Capitalization Approach to ValueEstimated gross rent $2,453 $2,453 $2,821 $2,821 $24.00 $25.58 $27.00Assumed vacancy rate 5% 5% 5% 5% 5% 0% 5%
Assumed vacancy ($122.66) ($122.66) ($141.05) ($141.05) ($1.20) $0.00 ($1.35)Expense ratio 35.0% 35.0% 35.0% 35.0% 20.0% 15.0% 15.0%
Estimated expenses ($815.66) ($815.66) ($938.01) ($938.01) ($4.56) ($3.84) ($3.85)
Net operating income (Annual) $18,178 $18,178 $20,904 $20,904 $18.24 $21.74 $21.80Capitalization rate 10.00% 10.00% 10.00% 10.00% 10.00% 10.00% 10.00%Estimated capitalized value $181,777 $181,777 $209,043 $209,043 $182 $217 $218
Total estimated market value per unit/SF $181,777 $181,777 $209,043 $209,043 $182 $217 $218
RetailBig Box Retailer5 Grocery Store6 Discount Retailer5 Fitness Center5 Boutique Retail5
Income Capitalization Approach to ValueEstimated gross rent $24.00 $26.00 $30.00 $27.50 $35.00Assumed vacancy rate 5% 0% 5% 5% 5%
Assumed vacancy ($1.20) $0.00 ($1.50) ($1.38) ($1.75)Expense ratio 15.0% 15.0% 15.0% 15.0% 15.0%
Estimated expenses ($3.42) ($3.90) ($4.28) ($3.92) ($4.99)
Net operating income (Annual) $19 $22.10 $24.23 $22.21 $28.26Capitalization rate 10.00% 10.00% 10.00% 10.00% 10.00%Estimated capitalized value $194 $221 $242 $222 $283
Total estimated market value per unit/SF $194 $221 $242 $222 $283
Income Capitalization Approach to Value Hotel1
Daily rate per room $179Other room revenue $25.75Assumed occupancy 75%
Effective daily rate $153.56Departmental expenses 30%Undistributed operating expenses 25%Fixed expenses 15%
Total expense ratio 70%Estimated expenses ($107.49)
Net operating income (annual) $16,815Capitalization rate 11.5%Estimated capitalized value $146,218
Total estimated market value per room $146,218MuniCap, Inc. M:\CONSULTING\SBER\Yonkers\[Proj. No. 23-B.xls]VII
18-Jan-081Based on information from City of Yonkers Appointed Assessor.2Based on values provided by Cappelli Enterprises Inc.3Based on rent for Regal Cinemas in New Roc City.4Based on Zanaro's Italian Restaurant in New Roc City, NY.5Based on rates from "Complete Appraisal of Real Property: City Center at White Plains - Retail & Fitness" prepared by Cushman & Wakefield Inc.6Based on rent for Stop & Shop in New Roc City, NY.
DRAFT Page 9 DRAFT

PHASE ICITY OF YONKERS, NY
Schedule VIII: Proposed Market Value
ResidentialRiver Park Center Palisades Point
Final BondAssessment Taxes Year Inflation Value Total Market Value Total Market Value Total Market Value Total Market
Date Due Ending Factor Units Per Unit Value Units Per Unit Value Units Per Unit Value Units Per Unit Value15-Oct-06 1-Jul-07 1-Mar-08 100.0% 0 $181,777 $0 0 $181,777 $0 0 $209,043 $0 0 $209,043 $015-Oct-07 1-Jul-08 1-Mar-09 100.0% 0 $181,777 $0 0 $181,777 $0 0 $209,043 $0 0 $209,043 $015-Oct-08 1-Jul-09 1-Mar-10 100.0% 0 $181,777 $0 0 $181,777 $0 0 $209,043 $0 0 $209,043 $015-Oct-09 1-Jul-10 1-Mar-11 100.0% 475 $181,777 $86,343,867 475 $181,777 $86,343,867 204 $209,043 $42,644,782 232 $209,043 $48,497,98715-Oct-10 1-Jul-11 1-Mar-12 100.0% 475 $181,777 $86,343,867 475 $181,777 $86,343,867 204 $209,043 $42,644,782 232 $209,043 $48,497,98715-Oct-11 1-Jul-12 1-Mar-13 100.0% 475 $181,777 $86,343,867 475 $181,777 $86,343,867 204 $209,043 $42,644,782 232 $209,043 $48,497,98715-Oct-12 1-Jul-13 1-Mar-14 100.0% 475 $181,777 $86,343,867 475 $181,777 $86,343,867 204 $209,043 $42,644,782 232 $209,043 $48,497,98715-Oct-13 1-Jul-14 1-Mar-15 100.0% 475 $181,777 $86,343,867 475 $181,777 $86,343,867 204 $209,043 $42,644,782 232 $209,043 $48,497,98715-Oct-14 1-Jul-15 1-Mar-16 100.0% 475 $181,777 $86,343,867 475 $181,777 $86,343,867 204 $209,043 $42,644,782 232 $209,043 $48,497,98715-Oct-15 1-Jul-16 1-Mar-17 100.0% 475 $181,777 $86,343,867 475 $181,777 $86,343,867 204 $209,043 $42,644,782 232 $209,043 $48,497,98715-Oct-16 1-Jul-17 1-Mar-18 100.0% 475 $181,777 $86,343,867 475 $181,777 $86,343,867 204 $209,043 $42,644,782 232 $209,043 $48,497,98715-Oct-17 1-Jul-18 1-Mar-19 100.0% 475 $181,777 $86,343,867 475 $181,777 $86,343,867 204 $209,043 $42,644,782 232 $209,043 $48,497,98715-Oct-18 1-Jul-19 1-Mar-20 100.0% 475 $181,777 $86,343,867 475 $181,777 $86,343,867 204 $209,043 $42,644,782 232 $209,043 $48,497,98715-Oct-19 1-Jul-20 1-Mar-21 100.0% 475 $181,777 $86,343,867 475 $181,777 $86,343,867 204 $209,043 $42,644,782 232 $209,043 $48,497,98715-Oct-20 1-Jul-21 1-Mar-22 100.0% 475 $181,777 $86,343,867 475 $181,777 $86,343,867 204 $209,043 $42,644,782 232 $209,043 $48,497,98715-Oct-21 1-Jul-22 1-Mar-23 100.0% 475 $181,777 $86,343,867 475 $181,777 $86,343,867 204 $209,043 $42,644,782 232 $209,043 $48,497,98715-Oct-22 1-Jul-23 1-Mar-24 100.0% 475 $181,777 $86,343,867 475 $181,777 $86,343,867 204 $209,043 $42,644,782 232 $209,043 $48,497,98715-Oct-23 1-Jul-24 1-Mar-25 100.0% 475 $181,777 $86,343,867 475 $181,777 $86,343,867 204 $209,043 $42,644,782 232 $209,043 $48,497,98715-Oct-24 1-Jul-25 1-Mar-26 100.0% 475 $181,777 $86,343,867 475 $181,777 $86,343,867 204 $209,043 $42,644,782 232 $209,043 $48,497,98715-Oct-25 1-Jul-26 1-Mar-27 100.0% 475 $181,777 $86,343,867 475 $181,777 $86,343,867 204 $209,043 $42,644,782 232 $209,043 $48,497,98715-Oct-26 1-Jul-27 1-Mar-28 100.0% 475 $181,777 $86,343,867 475 $181,777 $86,343,867 204 $209,043 $42,644,782 232 $209,043 $48,497,98715-Oct-27 1-Jul-28 1-Mar-29 100.0% 475 $181,777 $86,343,867 475 $181,777 $86,343,867 204 $209,043 $42,644,782 232 $209,043 $48,497,98715-Oct-28 1-Jul-29 1-Mar-30 100.0% 475 $181,777 $86,343,867 475 $181,777 $86,343,867 204 $209,043 $42,644,782 232 $209,043 $48,497,98715-Oct-29 1-Jul-30 1-Mar-31 100.0% 475 $181,777 $86,343,867 475 $181,777 $86,343,867 204 $209,043 $42,644,782 232 $209,043 $48,497,98715-Oct-30 1-Jul-31 1-Mar-32 100.0% 475 $181,777 $86,343,867 475 $181,777 $86,343,867 204 $209,043 $42,644,782 232 $209,043 $48,497,98715-Oct-31 1-Jul-32 1-Mar-33 100.0% 475 $181,777 $86,343,867 475 $181,777 $86,343,867 204 $209,043 $42,644,782 232 $209,043 $48,497,98715-Oct-32 1-Jul-33 1-Mar-34 100.0% 475 $181,777 $86,343,867 475 $181,777 $86,343,867 204 $209,043 $42,644,782 232 $209,043 $48,497,98715-Oct-33 1-Jul-34 1-Mar-35 100.0% 475 $181,777 $86,343,867 475 $181,777 $86,343,867 204 $209,043 $42,644,782 232 $209,043 $48,497,98715-Oct-34 1-Jul-35 1-Mar-36 100.0% 475 $181,777 $86,343,867 475 $181,777 $86,343,867 204 $209,043 $42,644,782 232 $209,043 $48,497,98715-Oct-35 1-Jul-36 1-Mar-37 100.0% 475 $181,777 $86,343,867 475 $181,777 $86,343,867 204 $209,043 $42,644,782 232 $209,043 $48,497,98715-Oct-36 1-Jul-37 1-Mar-38 100.0% 475 $181,777 $86,343,867 475 $181,777 $86,343,867 204 $209,043 $42,644,782 232 $209,043 $48,497,987
MuniCap, Inc. M:\CONSULTING\SBER\Yonkers\[Proj. No. 23-B.xls]VIII18-Jan-08
Tower West Tower East Parcel H Residential Parcel I Residential
DRAFT Page 10 DRAFT

PHASE ICITY OF YONKERS, NY
Schedule VIII: Proposed Market Value (continued)
Final BondAssessment Taxes Year Inflation Value Total Market Value Total Market Value Total Market Value Total Market
Date Due Ending Factor SF Per SF Value Room Per Room Value SF Per SF Value SF Per SF Value15-Oct-06 1-Jul-07 1-Mar-08 100.0% 0 $182 $0 0 $146,218 $0 0 $217 $0 0 $218 $015-Oct-07 1-Jul-08 1-Mar-09 100.0% 0 $182 $0 0 $146,218 $0 0 $217 $0 0 $218 $015-Oct-08 1-Jul-09 1-Mar-10 100.0% 0 $182 $0 0 $146,218 $0 0 $217 $0 0 $218 $015-Oct-09 1-Jul-10 1-Mar-11 100.0% 475,000 $182 $86,640,000 150 $146,218 $21,932,731 80,000 $217 $17,394,400 90,000 $218 $19,622,25015-Oct-10 1-Jul-11 1-Mar-12 100.0% 475,000 $182 $86,640,000 150 $146,218 $21,932,731 80,000 $217 $17,394,400 90,000 $218 $19,622,25015-Oct-11 1-Jul-12 1-Mar-13 100.0% 475,000 $182 $86,640,000 150 $146,218 $21,932,731 80,000 $217 $17,394,400 90,000 $218 $19,622,25015-Oct-12 1-Jul-13 1-Mar-14 100.0% 475,000 $182 $86,640,000 150 $146,218 $21,932,731 80,000 $217 $17,394,400 90,000 $218 $19,622,25015-Oct-13 1-Jul-14 1-Mar-15 100.0% 475,000 $182 $86,640,000 150 $146,218 $21,932,731 80,000 $217 $17,394,400 90,000 $218 $19,622,25015-Oct-14 1-Jul-15 1-Mar-16 100.0% 475,000 $182 $86,640,000 150 $146,218 $21,932,731 80,000 $217 $17,394,400 90,000 $218 $19,622,25015-Oct-15 1-Jul-16 1-Mar-17 100.0% 475,000 $182 $86,640,000 150 $146,218 $21,932,731 80,000 $217 $17,394,400 90,000 $218 $19,622,25015-Oct-16 1-Jul-17 1-Mar-18 100.0% 475,000 $182 $86,640,000 150 $146,218 $21,932,731 80,000 $217 $17,394,400 90,000 $218 $19,622,25015-Oct-17 1-Jul-18 1-Mar-19 100.0% 475,000 $182 $86,640,000 150 $146,218 $21,932,731 80,000 $217 $17,394,400 90,000 $218 $19,622,25015-Oct-18 1-Jul-19 1-Mar-20 100.0% 475,000 $182 $86,640,000 150 $146,218 $21,932,731 80,000 $217 $17,394,400 90,000 $218 $19,622,25015-Oct-19 1-Jul-20 1-Mar-21 100.0% 475,000 $182 $86,640,000 150 $146,218 $21,932,731 80,000 $217 $17,394,400 90,000 $218 $19,622,25015-Oct-20 1-Jul-21 1-Mar-22 100.0% 475,000 $182 $86,640,000 150 $146,218 $21,932,731 80,000 $217 $17,394,400 90,000 $218 $19,622,25015-Oct-21 1-Jul-22 1-Mar-23 100.0% 475,000 $182 $86,640,000 150 $146,218 $21,932,731 80,000 $217 $17,394,400 90,000 $218 $19,622,25015-Oct-22 1-Jul-23 1-Mar-24 100.0% 475,000 $182 $86,640,000 150 $146,218 $21,932,731 80,000 $217 $17,394,400 90,000 $218 $19,622,25015-Oct-23 1-Jul-24 1-Mar-25 100.0% 475,000 $182 $86,640,000 150 $146,218 $21,932,731 80,000 $217 $17,394,400 90,000 $218 $19,622,25015-Oct-24 1-Jul-25 1-Mar-26 100.0% 475,000 $182 $86,640,000 150 $146,218 $21,932,731 80,000 $217 $17,394,400 90,000 $218 $19,622,25015-Oct-25 1-Jul-26 1-Mar-27 100.0% 475,000 $182 $86,640,000 150 $146,218 $21,932,731 80,000 $217 $17,394,400 90,000 $218 $19,622,25015-Oct-26 1-Jul-27 1-Mar-28 100.0% 475,000 $182 $86,640,000 150 $146,218 $21,932,731 80,000 $217 $17,394,400 90,000 $218 $19,622,25015-Oct-27 1-Jul-28 1-Mar-29 100.0% 475,000 $182 $86,640,000 150 $146,218 $21,932,731 80,000 $217 $17,394,400 90,000 $218 $19,622,25015-Oct-28 1-Jul-29 1-Mar-30 100.0% 475,000 $182 $86,640,000 150 $146,218 $21,932,731 80,000 $217 $17,394,400 90,000 $218 $19,622,25015-Oct-29 1-Jul-30 1-Mar-31 100.0% 475,000 $182 $86,640,000 150 $146,218 $21,932,731 80,000 $217 $17,394,400 90,000 $218 $19,622,25015-Oct-30 1-Jul-31 1-Mar-32 100.0% 475,000 $182 $86,640,000 150 $146,218 $21,932,731 80,000 $217 $17,394,400 90,000 $218 $19,622,25015-Oct-31 1-Jul-32 1-Mar-33 100.0% 475,000 $182 $86,640,000 150 $146,218 $21,932,731 80,000 $217 $17,394,400 90,000 $218 $19,622,25015-Oct-32 1-Jul-33 1-Mar-34 100.0% 475,000 $182 $86,640,000 150 $146,218 $21,932,731 80,000 $217 $17,394,400 90,000 $218 $19,622,25015-Oct-33 1-Jul-34 1-Mar-35 100.0% 475,000 $182 $86,640,000 150 $146,218 $21,932,731 80,000 $217 $17,394,400 90,000 $218 $19,622,25015-Oct-34 1-Jul-35 1-Mar-36 100.0% 475,000 $182 $86,640,000 150 $146,218 $21,932,731 80,000 $217 $17,394,400 90,000 $218 $19,622,25015-Oct-35 1-Jul-36 1-Mar-37 100.0% 475,000 $182 $86,640,000 150 $146,218 $21,932,731 80,000 $217 $17,394,400 90,000 $218 $19,622,25015-Oct-36 1-Jul-37 1-Mar-38 100.0% 475,000 $182 $86,640,000 150 $146,218 $21,932,731 80,000 $217 $17,394,400 90,000 $218 $19,622,250
MuniCap, Inc. M:\CONSULTING\SBER\Yonkers\[Proj. No. 23-B.xls]VIII (2)18-Jan-08
Office Space Hotel Theater Restaurant
DRAFT Page 11 DRAFT

PHASE ICITY OF YONKERS, NY
Schedule VIII: Proposed Market Value (continued)
RetailFinal Bond
Assessment Taxes Year Inflation Value Total Market Value Total Market Value Total Market Value Total Market Value Total Market Total MarketDate Due Ending Factor SF Per SF Value SF Per SF Value SF Per SF Value SF Per SF Value SF Per SF Value Value
15-Oct-06 1-Jul-07 1-Mar-08 100.0% 0 $194 $0 0 $221 $0 0 $242 $0 0 $222 $0 0 $283 $0 $015-Oct-07 1-Jul-08 1-Mar-09 100.0% 0 $194 $0 0 $221 $0 0 $242 $0 0 $222 $0 0 $283 $0 $015-Oct-08 1-Jul-09 1-Mar-10 100.0% 0 $194 $0 0 $221 $0 0 $242 $0 0 $222 $0 0 $283 $0 $015-Oct-09 1-Jul-10 1-Mar-11 100.0% 200,000 $194 $38,760,000 75,000 $221 $16,575,000 65,000 $242 $15,746,250 45,000 $222 $9,992,813 88,000 $283 $24,871,000 $515,364,94615-Oct-10 1-Jul-11 1-Mar-12 100.0% 200,000 $194 $38,760,000 75,000 $221 $16,575,000 65,000 $242 $15,746,250 45,000 $222 $9,992,813 88,000 $283 $24,871,000 $515,364,94615-Oct-11 1-Jul-12 1-Mar-13 100.0% 200,000 $194 $38,760,000 75,000 $221 $16,575,000 65,000 $242 $15,746,250 45,000 $222 $9,992,813 88,000 $283 $24,871,000 $515,364,94615-Oct-12 1-Jul-13 1-Mar-14 100.0% 200,000 $194 $38,760,000 75,000 $221 $16,575,000 65,000 $242 $15,746,250 45,000 $222 $9,992,813 88,000 $283 $24,871,000 $515,364,94615-Oct-13 1-Jul-14 1-Mar-15 100.0% 200,000 $194 $38,760,000 75,000 $221 $16,575,000 65,000 $242 $15,746,250 45,000 $222 $9,992,813 88,000 $283 $24,871,000 $515,364,94615-Oct-14 1-Jul-15 1-Mar-16 100.0% 200,000 $194 $38,760,000 75,000 $221 $16,575,000 65,000 $242 $15,746,250 45,000 $222 $9,992,813 88,000 $283 $24,871,000 $515,364,94615-Oct-15 1-Jul-16 1-Mar-17 100.0% 200,000 $194 $38,760,000 75,000 $221 $16,575,000 65,000 $242 $15,746,250 45,000 $222 $9,992,813 88,000 $283 $24,871,000 $515,364,94615-Oct-16 1-Jul-17 1-Mar-18 100.0% 200,000 $194 $38,760,000 75,000 $221 $16,575,000 65,000 $242 $15,746,250 45,000 $222 $9,992,813 88,000 $283 $24,871,000 $515,364,94615-Oct-17 1-Jul-18 1-Mar-19 100.0% 200,000 $194 $38,760,000 75,000 $221 $16,575,000 65,000 $242 $15,746,250 45,000 $222 $9,992,813 88,000 $283 $24,871,000 $515,364,94615-Oct-18 1-Jul-19 1-Mar-20 100.0% 200,000 $194 $38,760,000 75,000 $221 $16,575,000 65,000 $242 $15,746,250 45,000 $222 $9,992,813 88,000 $283 $24,871,000 $515,364,94615-Oct-19 1-Jul-20 1-Mar-21 100.0% 200,000 $194 $38,760,000 75,000 $221 $16,575,000 65,000 $242 $15,746,250 45,000 $222 $9,992,813 88,000 $283 $24,871,000 $515,364,94615-Oct-20 1-Jul-21 1-Mar-22 100.0% 200,000 $194 $38,760,000 75,000 $221 $16,575,000 65,000 $242 $15,746,250 45,000 $222 $9,992,813 88,000 $283 $24,871,000 $515,364,94615-Oct-21 1-Jul-22 1-Mar-23 100.0% 200,000 $194 $38,760,000 75,000 $221 $16,575,000 65,000 $242 $15,746,250 45,000 $222 $9,992,813 88,000 $283 $24,871,000 $515,364,94615-Oct-22 1-Jul-23 1-Mar-24 100.0% 200,000 $194 $38,760,000 75,000 $221 $16,575,000 65,000 $242 $15,746,250 45,000 $222 $9,992,813 88,000 $283 $24,871,000 $515,364,94615-Oct-23 1-Jul-24 1-Mar-25 100.0% 200,000 $194 $38,760,000 75,000 $221 $16,575,000 65,000 $242 $15,746,250 45,000 $222 $9,992,813 88,000 $283 $24,871,000 $515,364,94615-Oct-24 1-Jul-25 1-Mar-26 100.0% 200,000 $194 $38,760,000 75,000 $221 $16,575,000 65,000 $242 $15,746,250 45,000 $222 $9,992,813 88,000 $283 $24,871,000 $515,364,94615-Oct-25 1-Jul-26 1-Mar-27 100.0% 200,000 $194 $38,760,000 75,000 $221 $16,575,000 65,000 $242 $15,746,250 45,000 $222 $9,992,813 88,000 $283 $24,871,000 $515,364,94615-Oct-26 1-Jul-27 1-Mar-28 100.0% 200,000 $194 $38,760,000 75,000 $221 $16,575,000 65,000 $242 $15,746,250 45,000 $222 $9,992,813 88,000 $283 $24,871,000 $515,364,94615-Oct-27 1-Jul-28 1-Mar-29 100.0% 200,000 $194 $38,760,000 75,000 $221 $16,575,000 65,000 $242 $15,746,250 45,000 $222 $9,992,813 88,000 $283 $24,871,000 $515,364,94615-Oct-28 1-Jul-29 1-Mar-30 100.0% 200,000 $194 $38,760,000 75,000 $221 $16,575,000 65,000 $242 $15,746,250 45,000 $222 $9,992,813 88,000 $283 $24,871,000 $515,364,94615-Oct-29 1-Jul-30 1-Mar-31 100.0% 200,000 $194 $38,760,000 75,000 $221 $16,575,000 65,000 $242 $15,746,250 45,000 $222 $9,992,813 88,000 $283 $24,871,000 $515,364,94615-Oct-30 1-Jul-31 1-Mar-32 100.0% 200,000 $194 $38,760,000 75,000 $221 $16,575,000 65,000 $242 $15,746,250 45,000 $222 $9,992,813 88,000 $283 $24,871,000 $515,364,94615-Oct-31 1-Jul-32 1-Mar-33 100.0% 200,000 $194 $38,760,000 75,000 $221 $16,575,000 65,000 $242 $15,746,250 45,000 $222 $9,992,813 88,000 $283 $24,871,000 $515,364,94615-Oct-32 1-Jul-33 1-Mar-34 100.0% 200,000 $194 $38,760,000 75,000 $221 $16,575,000 65,000 $242 $15,746,250 45,000 $222 $9,992,813 88,000 $283 $24,871,000 $515,364,94615-Oct-33 1-Jul-34 1-Mar-35 100.0% 200,000 $194 $38,760,000 75,000 $221 $16,575,000 65,000 $242 $15,746,250 45,000 $222 $9,992,813 88,000 $283 $24,871,000 $515,364,94615-Oct-34 1-Jul-35 1-Mar-36 100.0% 200,000 $194 $38,760,000 75,000 $221 $16,575,000 65,000 $242 $15,746,250 45,000 $222 $9,992,813 88,000 $283 $24,871,000 $515,364,94615-Oct-35 1-Jul-36 1-Mar-37 100.0% 200,000 $194 $38,760,000 75,000 $221 $16,575,000 65,000 $242 $15,746,250 45,000 $222 $9,992,813 88,000 $283 $24,871,000 $515,364,94615-Oct-36 1-Jul-37 1-Mar-38 100.0% 200,000 $194 $38,760,000 75,000 $221 $16,575,000 65,000 $242 $15,746,250 45,000 $222 $9,992,813 88,000 $283 $24,871,000 $515,364,946
MuniCap, Inc. M:\CONSULTING\SBER\Yonkers\[Proj. No. 23-B.xls]VIII(3)18-Jan-08
Boutique RetailBig Box Retailer Grocery Store Discount Retailer Fitness Center
DRAFT Page 12 DRAFT

PHASE ICITY OF YONKERS, NY
Schedule IX: Projected Net Incremental Real Property Taxes
Yonkers Property Tax Property TaxesFinal Bond Incremental Available for Debt Service
Assessment Taxes Year Equalization Assessed Base Assessed City of Inflation Incremental PercentageDate Due Ending Market Value Rate1 Value2 Value3 Value School Yonkers Total Factor5 Property Taxes Taxes Total
15-Oct-06 1-Jul-07 1-Mar-08 $0 2.94% $0 ($658,840) $0 $407.40 $120.94 $528.34 100.0% $0 75% $015-Oct-07 1-Jul-08 1-Mar-09 $0 2.94% $0 ($658,840) $0 $407.40 $120.94 $528.34 100.0% $0 75% $015-Oct-08 1-Jul-09 1-Mar-10 $0 2.94% $0 ($658,840) $0 $407.40 $120.94 $528.34 100.0% $0 75% $015-Oct-09 1-Jul-10 1-Mar-11 $515,364,946 2.94% $15,151,729 ($658,840) $14,492,889 $407.40 $120.94 $528.34 100.0% $7,657,173 75% $5,742,88015-Oct-10 1-Jul-11 1-Mar-12 $515,364,946 2.94% $15,151,729 ($658,840) $14,492,889 $423.70 $125.78 $549.47 104.0% $7,963,460 75% $5,972,59515-Oct-11 1-Jul-12 1-Mar-13 $515,364,946 2.94% $15,151,729 ($658,840) $14,492,889 $440.64 $130.81 $571.45 108.2% $8,281,999 75% $6,211,49915-Oct-12 1-Jul-13 1-Mar-14 $515,364,946 2.94% $15,151,729 ($658,840) $14,492,889 $458.27 $136.04 $594.31 112.5% $8,613,278 75% $6,459,95915-Oct-13 1-Jul-14 1-Mar-15 $515,364,946 2.94% $15,151,729 ($658,840) $14,492,889 $476.60 $141.48 $618.08 117.0% $8,957,810 75% $6,718,35715-Oct-14 1-Jul-15 1-Mar-16 $515,364,946 2.94% $15,151,729 ($658,840) $14,492,889 $495.66 $147.14 $642.81 121.7% $9,316,122 75% $6,987,09115-Oct-15 1-Jul-16 1-Mar-17 $515,364,946 2.94% $15,151,729 ($658,840) $14,492,889 $515.49 $153.03 $668.52 126.5% $9,688,767 75% $7,266,57515-Oct-16 1-Jul-17 1-Mar-18 $515,364,946 2.94% $15,151,729 ($658,840) $14,492,889 $536.11 $159.15 $695.26 131.6% $10,076,318 75% $7,557,23815-Oct-17 1-Jul-18 1-Mar-19 $515,364,946 2.94% $15,151,729 ($658,840) $14,492,889 $557.56 $165.51 $723.07 136.9% $10,479,370 75% $7,859,52815-Oct-18 1-Jul-19 1-Mar-20 $515,364,946 2.94% $15,151,729 ($658,840) $14,492,889 $579.86 $172.14 $751.99 142.3% $10,898,545 75% $8,173,90915-Oct-19 1-Jul-20 1-Mar-21 $515,364,946 2.94% $15,151,729 ($658,840) $14,492,889 $603.05 $179.02 $782.07 148.0% $11,334,487 75% $8,500,86515-Oct-20 1-Jul-21 1-Mar-22 $515,364,946 2.94% $15,151,729 ($658,840) $14,492,889 $627.17 $186.18 $813.36 153.9% $11,787,866 75% $8,840,90015-Oct-21 1-Jul-22 1-Mar-23 $515,364,946 2.94% $15,151,729 ($658,840) $14,492,889 $652.26 $193.63 $845.89 160.1% $12,259,381 75% $9,194,53615-Oct-22 1-Jul-23 1-Mar-24 $515,364,946 2.94% $15,151,729 ($658,840) $14,492,889 $678.35 $201.37 $879.72 166.5% $12,749,756 75% $9,562,31715-Oct-23 1-Jul-24 1-Mar-25 $515,364,946 2.94% $15,151,729 ($658,840) $14,492,889 $705.48 $209.43 $914.91 173.2% $13,259,746 75% $9,944,81015-Oct-24 1-Jul-25 1-Mar-26 $515,364,946 2.94% $15,151,729 ($658,840) $14,492,889 $733.70 $217.81 $951.51 180.1% $13,790,136 75% $10,342,60215-Oct-25 1-Jul-26 1-Mar-27 $515,364,946 2.94% $15,151,729 ($658,840) $14,492,889 $763.05 $226.52 $989.57 187.3% $14,341,742 75% $10,756,30615-Oct-26 1-Jul-27 1-Mar-28 $515,364,946 2.94% $15,151,729 ($658,840) $14,492,889 $793.57 $235.58 $1,029.15 194.8% $14,915,411 75% $11,186,55915-Oct-27 1-Jul-28 1-Mar-29 $515,364,946 2.94% $15,151,729 ($658,840) $14,492,889 $825.32 $245.00 $1,070.32 202.6% $15,512,028 75% $11,634,02115-Oct-28 1-Jul-29 1-Mar-30 $515,364,946 2.94% $15,151,729 ($658,840) $14,492,889 $858.33 $254.80 $1,113.13 210.7% $16,132,509 75% $12,099,38215-Oct-29 1-Jul-30 1-Mar-31 $515,364,946 2.94% $15,151,729 ($658,840) $14,492,889 $892.66 $264.99 $1,157.66 219.1% $16,777,809 75% $12,583,35715-Oct-30 1-Jul-31 1-Mar-32 $515,364,946 2.94% $15,151,729 ($658,840) $14,492,889 $928.37 $275.59 $1,203.96 227.9% $17,448,922 75% $13,086,69115-Oct-31 1-Jul-32 1-Mar-33 $515,364,946 2.94% $15,151,729 ($658,840) $14,492,889 $965.50 $286.62 $1,252.12 237.0% $18,146,879 75% $13,610,15915-Oct-32 1-Jul-33 1-Mar-34 $515,364,946 2.94% $15,151,729 ($658,840) $14,492,889 $1,004.13 $298.08 $1,302.21 246.5% $18,872,754 75% $14,154,56515-Oct-33 1-Jul-34 1-Mar-35 $515,364,946 2.94% $15,151,729 ($658,840) $14,492,889 $1,044.29 $310.01 $1,354.30 256.3% $19,627,664 75% $14,720,74815-Oct-34 1-Jul-35 1-Mar-36 $515,364,946 2.94% $15,151,729 ($658,840) $14,492,889 $1,086.06 $322.41 $1,408.47 266.6% $20,412,771 75% $15,309,57815-Oct-35 1-Jul-36 1-Mar-37 $515,364,946 2.94% $15,151,729 ($658,840) $14,492,889 $1,129.50 $335.30 $1,464.81 277.2% $21,229,281 75% $15,921,96115-Oct-36 1-Jul-37 1-Mar-38 $515,364,946 2.94% $15,151,729 ($658,840) $14,492,889 $1,174.68 $348.71 $1,523.40 288.3% $22,078,453 75% $16,558,839
Total $382,610,437 $286,957,828MuniCap, Inc. M:\CONSULTING\SBER\Yonkers\[Proj. No. 23-B.xls]IX
18-Jan-081Equalization rate is the 2006 equalization rate, relating to property values in calendar year 2002Newly constructed property in Yonkers is not subsequently reassessed after its initial assessment, regardless of changes to market valu3Base value provided by Cappelli Enterprises Inc., based on an assessed value of $658,840.4City, School and County tax rates correspond to the same time frame as the equalization rate.5These projections assume property tax rates increase at 4 percent annually. According to the City of Yonkers, the actual average increase in property tax rates from FY 2003 to FY 2007 is 7.3
Rates ( Per $1,000 of AV)4
DRAFTPage 13
DRAFT

PHASE ICITY OF YONKERS, NY
Schedule X: Summary of Parking Spaces
PublicNon-Revenue
Revenue Generating Spaces Generating Private TotalParking Type Monthly Transient Total Spaces Total Spaces Spaces
River Park Center 1,646 1,646 3,292 302 3,594 950 4,544
Cacace Center 675 674 1,349 0 1,349 0 1,349
Palisades Point 29 28 57 0 57 669 726
Total 2,350 2,348 4,698 302 5,000 1,619 6,619MuniCap, Inc. M:\CONSULTING\SBER\Yonkers\[Proj. No. 23-B.xls]X
18-Jan-08
DRAFT Page 14 DRAFT

PHASE ICITY OF YONKERS, NY
Schedule XI: Projected Stabilized NOI
Type of Parker Number Duration Rate1 Frequency Gross Revenue(Months) (Occupancy)
Monthly parking 2,350 12 $75 100% $2,115,000(Days) (Turns)
Hourly parking M-F (A.M.) 2,348 260 $1 4 $2,441,920Hourly parking Th.-Sun. (P.M.) 2,348 260 $1 0.25 $152,620Hourly parking Sat.-Sun (A.M.) 2,348 104 $1 0.00 $0Hourly parking Fri.-Sun. (P.M.) 2,348 104 $1 0.25 $61,048
Total annual revenue $4,770,588
CostLess expenses: Per Space CostLabor ($115.54) ($542,817)Benefits ($28.90) ($135,777)Security ($71.70) ($336,831)Utilities ($62.22) ($292,297)Office ($1.54) ($7,253)Insurance ($24.70) ($116,049)Auto damage ($0.62) ($2,901)Supplies ($5.56) ($26,111)Equipment maintenance ($3.71) ($17,407)Elevator maintenance ($46.32) ($217,591)Professional services ($3.09) ($14,506)Advertising ($0.77) ($3,627)Violations ($9.48) ($44,534)Sewer taxes ($6.18) ($29,012)Miscelaneous ($5.56) ($26,111)Total operating expenses ($385.87) ($1,812,823)Operating expenses as a percent of revenue2 38%
Net operating income $2,957,765MuniCap, Inc. M:\CONSULTING\SBER\Yonkers\[Proj. No. 23-B.xls]XI
18-Jan-081Monthly rate, $75/month, and daily rates, $1.00 per hour, are based on information provided byExecutive Director of the Yonkers Parking Authority.2Percentage of Operating Expenses compared to Operating Revenue based on "Proposed White Plains CenterGarage: Market and Financial Analysis" prepared by Walker Parking Consultants.
DRAFT Page 15 DRAFT

PHASE ICITY OF YONKERS, NY
Schedule XII: Projected Parking Garage Total Net Operating Income
Final Bond Total Total TotalAssessment Taxes Year Operating Operating Parking
Date Due Ending Inflation Revenue Expense NOI15-Oct-06 1-Jul-07 1-Mar-08 100% $0 $0 $015-Oct-07 1-Jul-08 1-Mar-09 100% $0 $0 $015-Oct-08 1-Jul-09 1-Mar-10 100% $0 $0 $015-Oct-09 1-Jul-10 1-Mar-11 100% $4,770,588 ($1,812,823) $2,957,76515-Oct-10 1-Jul-11 1-Mar-12 102% $4,866,000 ($1,849,080) $3,016,92015-Oct-11 1-Jul-12 1-Mar-13 104% $4,963,320 ($1,886,062) $3,077,25815-Oct-12 1-Jul-13 1-Mar-14 106% $5,062,586 ($1,923,783) $3,138,80315-Oct-13 1-Jul-14 1-Mar-15 108% $5,163,838 ($1,962,258) $3,201,57915-Oct-14 1-Jul-15 1-Mar-16 110% $5,267,115 ($2,001,504) $3,265,61115-Oct-15 1-Jul-16 1-Mar-17 113% $5,372,457 ($2,041,534) $3,330,92315-Oct-16 1-Jul-17 1-Mar-18 115% $5,479,906 ($2,082,364) $3,397,54215-Oct-17 1-Jul-18 1-Mar-19 117% $5,589,504 ($2,124,012) $3,465,49315-Oct-18 1-Jul-19 1-Mar-20 120% $5,701,294 ($2,166,492) $3,534,80215-Oct-19 1-Jul-20 1-Mar-21 122% $5,815,320 ($2,209,822) $3,605,49815-Oct-20 1-Jul-21 1-Mar-22 124% $5,931,627 ($2,254,018) $3,677,60815-Oct-21 1-Jul-22 1-Mar-23 127% $6,050,259 ($2,299,098) $3,751,16115-Oct-22 1-Jul-23 1-Mar-24 129% $6,171,264 ($2,345,080) $3,826,18415-Oct-23 1-Jul-24 1-Mar-25 132% $6,294,690 ($2,391,982) $3,902,70815-Oct-24 1-Jul-25 1-Mar-26 135% $6,420,583 ($2,439,822) $3,980,76215-Oct-25 1-Jul-26 1-Mar-27 137% $6,548,995 ($2,488,618) $4,060,37715-Oct-26 1-Jul-27 1-Mar-28 140% $6,679,975 ($2,538,390) $4,141,58415-Oct-27 1-Jul-28 1-Mar-29 143% $6,813,574 ($2,589,158) $4,224,41615-Oct-28 1-Jul-29 1-Mar-30 146% $6,949,846 ($2,640,941) $4,308,90415-Oct-29 1-Jul-30 1-Mar-31 149% $7,088,843 ($2,693,760) $4,395,08315-Oct-30 1-Jul-31 1-Mar-32 152% $7,230,620 ($2,747,635) $4,482,98415-Oct-31 1-Jul-32 1-Mar-33 155% $7,375,232 ($2,802,588) $4,572,64415-Oct-32 1-Jul-33 1-Mar-34 158% $7,522,737 ($2,858,640) $4,664,09715-Oct-33 1-Jul-34 1-Mar-35 161% $7,673,191 ($2,915,813) $4,757,37915-Oct-34 1-Jul-35 1-Mar-36 164% $7,826,655 ($2,974,129) $4,852,52615-Oct-35 1-Jul-36 1-Mar-37 167% $7,983,188 ($3,033,612) $4,949,57715-Oct-36 1-Jul-37 1-Mar-38 171% $8,142,852 ($3,094,284) $5,048,568
Total $104,540,188MuniCap, Inc. M:\CONSULTING\SBER\Yonkers\[Proj. No. 23-B.xls]XII
18-Jan-08
DRAFT Page 16 DRAFT

PHASE ICITY OF YONKERS, NY
Schedule XIII: Projected Payment of Debt Service
Total Property Final Bond Net Annual Tax Available Total Total Revenues Total Cumulative Revenue Available to the City of Yonkers Debt Service Coverage
Assessment Taxes Year Debt for Debt Parking Avalable to Repay Surplus/ Developer Surplus 25% Share Tax Increment TotalDate Due Ending Service Service NOI Debt Service City Surplus Deficit Payment (Deficit) of Increment Surplus Total and Parking NOI Revenues
15-Oct-06 1-Jul-07 1-Mar-08 $0 $0 $0 $0 $0 $0 $0 $0 $0 $0 $0 NA NA15-Oct-07 1-Jul-08 1-Mar-09 $0 $0 $0 $0 $0 $0 $0 $0 $0 $0 $0 NA NA15-Oct-08 1-Jul-09 1-Mar-10 $0 $0 $0 $0 $0 $0 $0 $0 $0 $0 $0 NA NA15-Oct-09 1-Jul-10 1-Mar-11 $11,068,826 $5,742,880 $2,957,765 $8,700,644 $0 ($2,368,181) $2,368,181 $0 $1,914,293 $0 $1,914,293 79% 100%15-Oct-10 1-Jul-11 1-Mar-12 $11,293,863 $5,972,595 $3,016,920 $8,989,515 $0 ($2,304,348) $2,304,348 $0 $1,990,865 $0 $1,990,865 80% 100%15-Oct-11 1-Jul-12 1-Mar-13 $11,522,475 $6,211,499 $3,077,258 $9,288,757 $0 ($2,233,718) $2,233,718 $0 $2,070,500 $0 $2,070,500 81% 100%15-Oct-12 1-Jul-13 1-Mar-14 $11,755,537 $6,459,959 $3,138,803 $9,598,762 $0 ($2,156,774) $2,156,774 $0 $2,153,320 $0 $2,153,320 82% 100%15-Oct-13 1-Jul-14 1-Mar-15 $11,992,798 $6,718,357 $3,201,579 $9,919,937 $0 ($2,072,862) $2,072,862 $0 $2,239,452 $0 $2,239,452 83% 100%15-Oct-14 1-Jul-15 1-Mar-16 $12,234,948 $6,987,091 $3,265,611 $10,252,703 $0 ($1,982,245) $1,982,245 $0 $2,329,030 $0 $2,329,030 84% 100%15-Oct-15 1-Jul-16 1-Mar-17 $12,482,548 $7,266,575 $3,330,923 $10,597,498 $0 ($1,885,049) $1,885,049 $0 $2,422,192 $0 $2,422,192 85% 100%15-Oct-16 1-Jul-17 1-Mar-18 $12,733,036 $7,557,238 $3,397,542 $10,954,780 $0 ($1,778,256) $1,778,256 $0 $2,519,079 $0 $2,519,079 86% 100%15-Oct-17 1-Jul-18 1-Mar-19 $12,989,913 $7,859,528 $3,465,493 $11,325,020 $0 ($1,664,892) $1,664,892 $0 $2,619,843 $0 $2,619,843 87% 100%15-Oct-18 1-Jul-19 1-Mar-20 $13,250,366 $8,173,909 $3,534,802 $11,708,711 $0 ($1,541,655) $1,541,655 $0 $2,724,636 $0 $2,724,636 88% 100%15-Oct-19 1-Jul-20 1-Mar-21 $13,516,645 $8,500,865 $3,605,498 $12,106,364 $0 ($1,410,282) $1,410,282 $0 $2,833,622 $0 $2,833,622 90% 100%15-Oct-20 1-Jul-21 1-Mar-22 $13,787,752 $8,840,900 $3,677,608 $12,518,508 $0 ($1,269,244) $1,269,244 $0 $2,946,967 $0 $2,946,967 91% 100%15-Oct-21 1-Jul-22 1-Mar-23 $14,063,623 $9,194,536 $3,751,161 $12,945,696 $0 ($1,117,926) $1,117,926 $0 $3,064,845 $0 $3,064,845 92% 100%15-Oct-22 1-Jul-23 1-Mar-24 $14,345,071 $9,562,317 $3,826,184 $13,388,501 $0 ($956,570) $956,570 $0 $3,187,439 $0 $3,187,439 93% 100%15-Oct-23 1-Jul-24 1-Mar-25 $14,632,722 $9,944,810 $3,902,708 $13,847,517 $0 ($785,205) $785,205 $0 $3,314,937 $0 $3,314,937 95% 100%15-Oct-24 1-Jul-25 1-Mar-26 $14,925,014 $10,342,602 $3,980,762 $14,323,364 $0 ($601,650) $601,650 $0 $3,447,534 $0 $3,447,534 96% 100%15-Oct-25 1-Jul-26 1-Mar-27 $15,222,322 $10,756,306 $4,060,377 $14,816,683 $0 ($405,638) $405,638 $0 $3,585,435 $0 $3,585,435 97% 100%15-Oct-26 1-Jul-27 1-Mar-28 $15,525,833 $11,186,559 $4,141,584 $15,328,143 $0 ($197,690) $197,690 $0 $3,728,853 $0 $3,728,853 99% 100%15-Oct-27 1-Jul-28 1-Mar-29 $15,835,485 $11,634,021 $4,224,416 $15,858,437 $22,952 $22,952 $0 $22,952 $3,878,007 $22,952 $3,900,959 100% 100%15-Oct-28 1-Jul-29 1-Mar-30 $16,150,030 $12,099,382 $4,308,904 $16,408,286 $258,256 $258,256 $0 $281,208 $4,033,127 $258,256 $4,291,384 102% 102%15-Oct-29 1-Jul-30 1-Mar-31 $16,471,091 $12,583,357 $4,395,083 $16,978,440 $507,348 $507,348 $0 $788,556 $4,194,452 $507,348 $4,701,801 103% 103%15-Oct-30 1-Jul-31 1-Mar-32 $16,798,983 $13,086,691 $4,482,984 $17,569,676 $770,693 $770,693 $0 $1,559,249 $4,362,230 $770,693 $5,132,923 105% 105%15-Oct-31 1-Jul-32 1-Mar-33 $17,131,767 $13,610,159 $4,572,644 $18,182,803 $1,051,035 $1,051,035 $0 $2,610,284 $4,536,720 $1,051,035 $5,587,755 106% 106%15-Oct-32 1-Jul-33 1-Mar-34 $17,471,382 $14,154,565 $4,664,097 $18,818,662 $1,347,280 $1,347,280 $0 $3,957,564 $4,718,188 $1,347,280 $6,065,468 108% 108%15-Oct-33 1-Jul-34 1-Mar-35 $17,818,391 $14,720,748 $4,757,379 $19,478,127 $1,659,736 $1,659,736 $0 $5,617,299 $4,906,916 $1,659,736 $6,566,652 109% 109%15-Oct-34 1-Jul-35 1-Mar-36 $18,171,044 $15,309,578 $4,852,526 $20,162,104 $1,991,060 $1,991,060 $0 $7,608,360 $5,103,193 $1,991,060 $7,094,253 111% 111%15-Oct-35 1-Jul-36 1-Mar-37 $18,530,403 $15,921,961 $4,949,577 $20,871,538 $2,341,135 $2,341,135 $0 $9,949,495 $5,307,320 $2,341,135 $7,648,455 NA NA15-Oct-36 1-Jul-37 1-Mar-38 $206,857 $16,558,839 $5,048,568 $21,607,408 $21,400,551 $21,400,551 $0 $31,350,045 $5,519,613 $21,400,551 $26,920,164 NA NA
Total $391,928,725 $270,398,988 $104,540,188 $374,939,177 $31,350,045 $4,617,859 $26,732,186 $95,652,609 $31,350,045 $127,002,655MuniCap, Inc. M:\CONSULTING\SBER\Yonkers\[Proj. No. 23-B.xls]XIII
18-Jan-08
DRAFT Page 17 DRAFT