benchmarking at ubss · benchmarking at ubss page 2 of 51 in essence ubss benchmarks to note where...
TRANSCRIPT
Benchmarking at UBSS
Page 1 of 51
BENCHMARKING AT UBSS 2018
UBSS is actively involved in benchmarking providing it with a solid 360 degree review and
comparsion with like organisations locally, nationally and internationally. The data collected
informs direction and strategy on an ongoing basis.
UBSS activity is compliant with Thresold Standards 1.4.1, 1.4.2, 2.2.2, 5.1.1, 5.1.2, 5.3.1,
5.3.4, 6.2.1 and 6.3.1
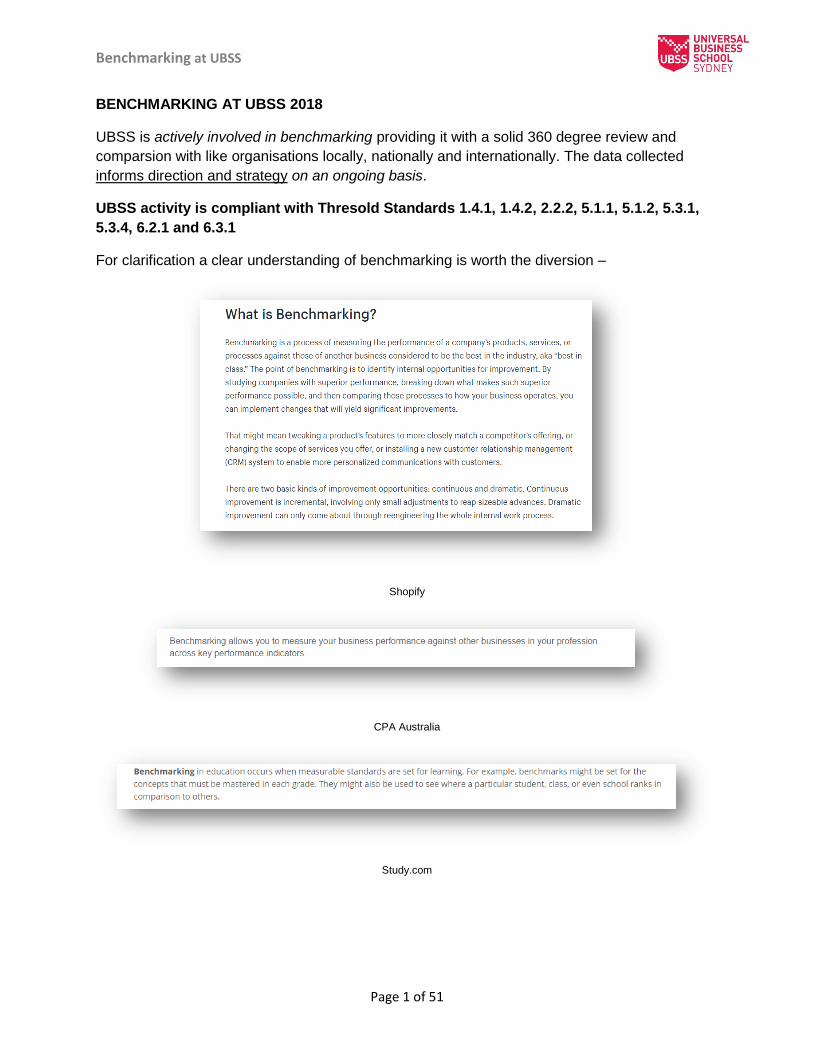
For clarification a clear understanding of benchmarking is worth the diversion –
Shopify
CPA Australia
Study.com

Benchmarking at UBSS
Page 2 of 51
In essence UBSS benchmarks to note where we stand in the like community – and if change
is warranted. Benchmarking does not imply change – it merely puts current practice into
perspective and invites the home institution (in this case UBSS) to examine data in a clear,
efficient way. The outcome of the benchhmarking might in fact be – no change at all. Change
and benchmarking are not synonymous.
In 2016-2018 our benchmarking strategy predominantly aligned itself with COPHE (Council of
Private Higher Education) and HEPP_QN (Higher Education Private Provider – Quality
Network) activity providing us with access to a range of institutions that we could measure
ourselves against and have some confidence that the data being shared was truthful and
accurate.
There are many facets of benchmarking – we identify four categories – and use these for our
purposes.
Internal (Individual)
1.
Many UBSS staff either sit on external Committees and Boards and as a result gain a great deal
of insight into how other Institutions (both public and private) operate and perform across a
range of domains (this constitutes benchmarking).
2.
Many UBSS staff have in fact worked at a number of other institutions (both public and private)
and bring with them considerable benchmarking knowledge across a range of domains.
3.
Many UBSS staff currently teach at other institutions (both public and private) and of course
have access to a range of data across a range of domains (this constitutes benchmarking).
This internal (individual) ongoing benchmarking has been incorrectly and inappropriately
rejected by TEQSA (largely the personal view of the UBSS previous Case Manager) – and this
needs to be acknowledged moving forward as most appropriate and valuable.

Benchmarking at UBSS
Page 3 of 51
Internal (across Institution)
4 Student Feedback on Units UBSS Each Trimester
5 Staff Feedback UBSS Each Trimester
6 Graduate Survey UBSS Each Graduation period – usually 1 time per year
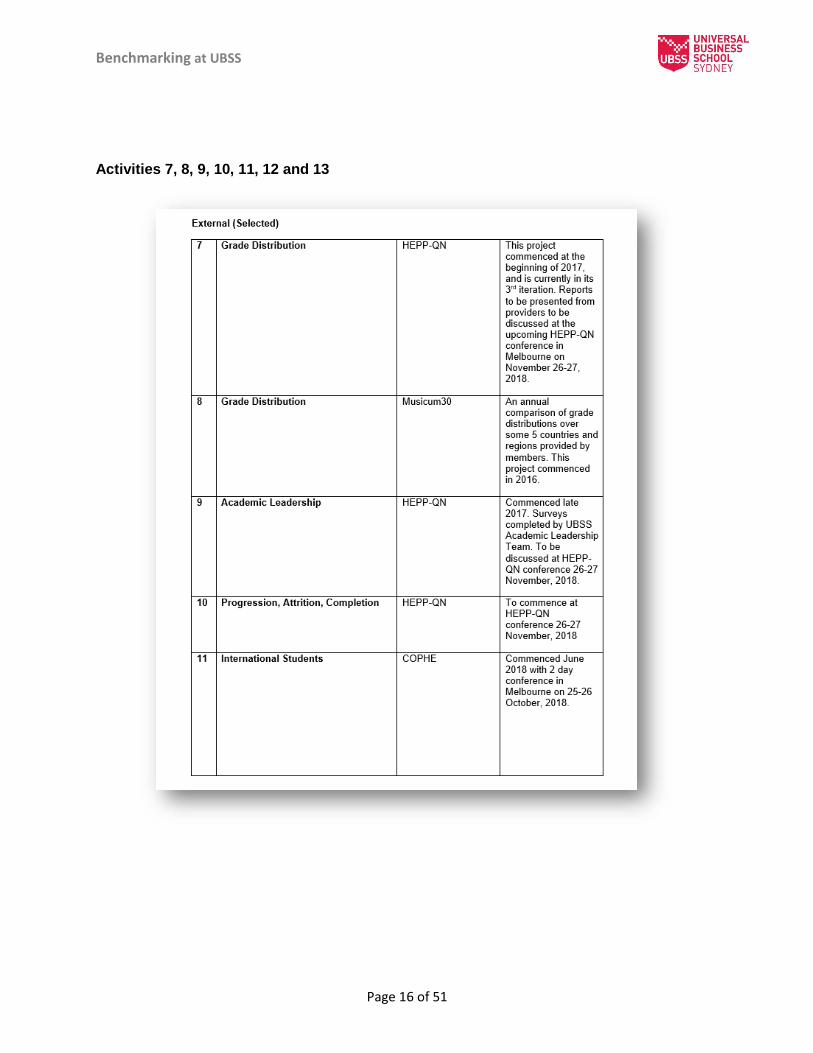
External (Selected)
7 Grade Distribution HEPP-QN This project commenced at the beginning of 2017, and is currently in its 3rd iteration to be delivered in the first half of 2019. 2nd iteration reports presented from providers discussed at HEPP-QN conference in Melbourne on November 26-27, 2018.
8 Grade Distribution Musicum30 An annual comparison of grade distributions over some 5 countries and regions provided by members. This project commenced in 2016.
9 Academic Leadership HEPP-QN Commenced late 2017. Surveys completed by UBSS Academic Leadership Team. Discussed at HEPP-QN conference 26-27 November, 2018.
Benchmarking at UBSS
Page 4 of 51
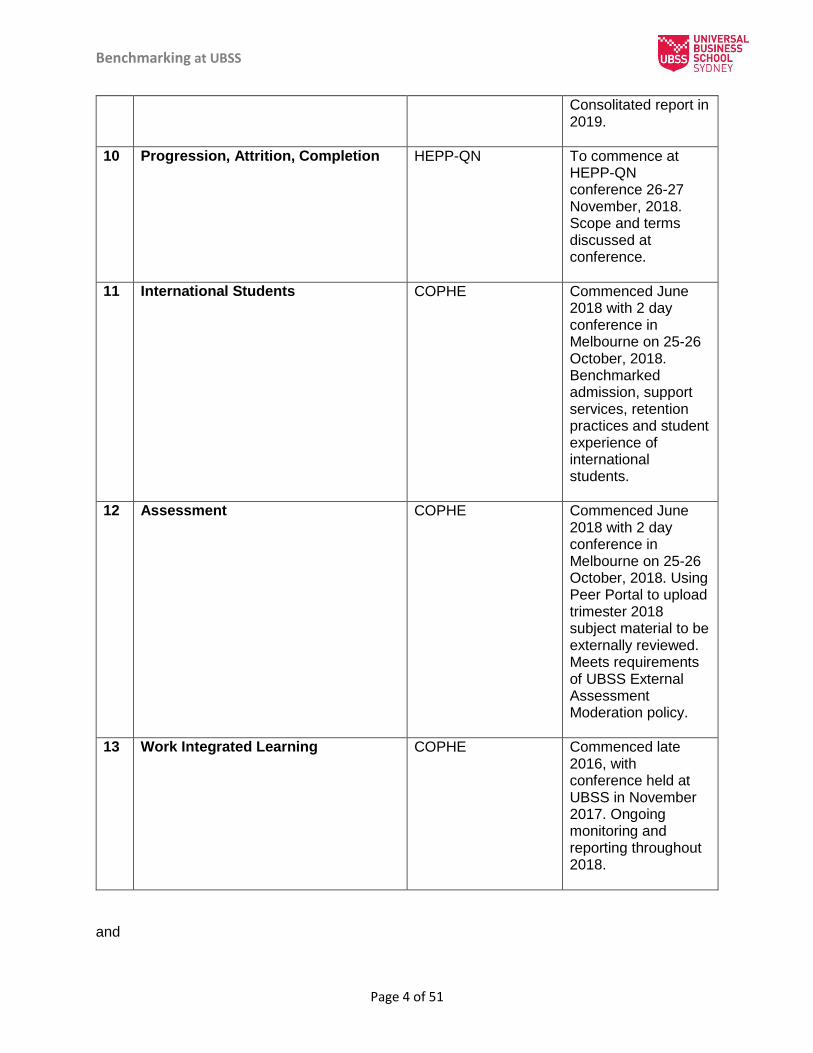
Consolitated report in 2019.
10 Progression, Attrition, Completion HEPP-QN To commence at HEPP-QN conference 26-27 November, 2018. Scope and terms discussed at conference.
11 International Students COPHE Commenced June 2018 with 2 day conference in Melbourne on 25-26 October, 2018. Benchmarked admission, support services, retention practices and student experience of international students.
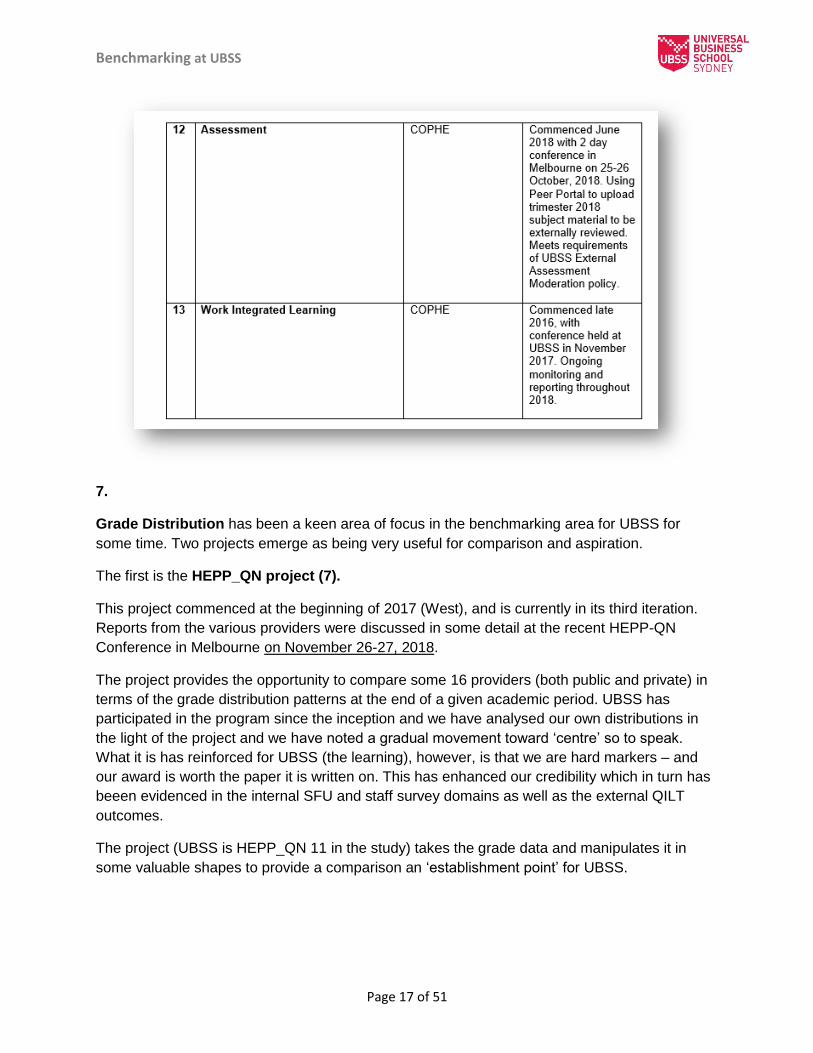
12 Assessment COPHE Commenced June 2018 with 2 day conference in Melbourne on 25-26 October, 2018. Using Peer Portal to upload trimester 2018 subject material to be externally reviewed. Meets requirements of UBSS External Assessment Moderation policy.
13 Work Integrated Learning COPHE Commenced late 2016, with conference held at UBSS in November 2017. Ongoing monitoring and reporting throughout 2018.
and

Benchmarking at UBSS
Page 5 of 51
External (Regulated)
14 SES QILT Undergraduate DET Annually – commenced in 2016
15 SES QILT Postgraduate DET Annually – commenced in 2017
We (UBSS) currently involve ourselves in 15 benchmarking initiatives/projects that provide us
with data to compare longitudinally with ourselves and others; compare ourselves with other like
providers (private and public); and provide us with an imperative to improve (or maintain) our
current activities in the light of information gleaned.This collection of data is shared extensively
with our community and stakeholders.
Benchmarking is about comparing oneself – and if necessary making changes. What often
occurs, though, is a degree of satisfaction with current performance with no change
required.The extensiveness of these activities matched with the range of issues/foci gives
UBSS a good indication of where we stand nationally and internationally.
The current, key foci, then, are –
Current student satsifaction
Staff satisfaction
Graduate satisfaction
Grade Distribution
Academic Leadership
Progression, Attirtion, Completion
International Students
Assessment
Work Integrated Learning
The Undergraduate Student Experience
The Postgraduate Student Experience
This range of foci provides UBSS with a satsifactory overview (and comparison) of performance
and a 360 degree analysis of operations. Anything beyond this would be unnecessary.This
approach is considerably more extensive and informing than anything I have seen in the public
university sector.
I deal with each of the benchmarking elements (projects) in turn –
Benchmarking at UBSS
Page 6 of 51
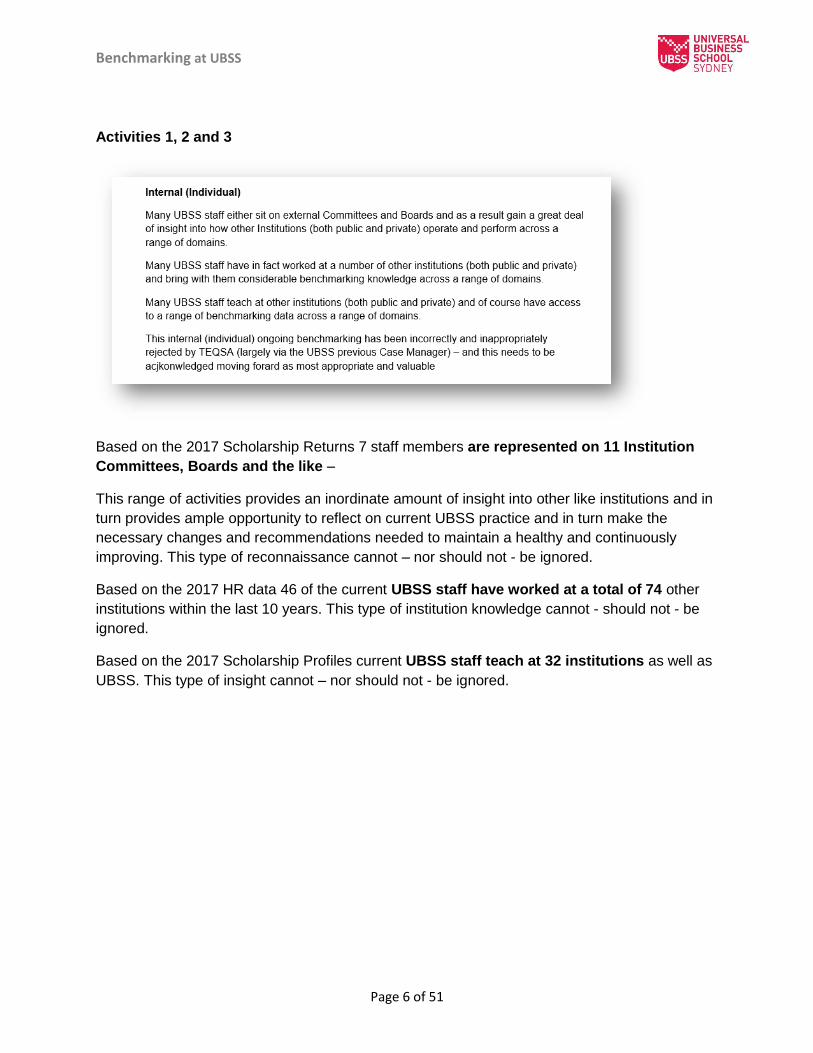
Activities 1, 2 and 3
Based on the 2017 Scholarship Returns 7 staff members are represented on 11 Institution
Committees, Boards and the like –
This range of activities provides an inordinate amount of insight into other like institutions and in
turn provides ample opportunity to reflect on current UBSS practice and in turn make the
necessary changes and recommendations needed to maintain a healthy and continuously
improving. This type of reconnaissance cannot – nor should not - be ignored.
Based on the 2017 HR data 46 of the current UBSS staff have worked at a total of 74 other
institutions within the last 10 years. This type of institution knowledge cannot - should not - be
ignored.
Based on the 2017 Scholarship Profiles current UBSS staff teach at 32 institutions as well as
UBSS. This type of insight cannot – nor should not - be ignored.

Benchmarking at UBSS
Page 7 of 51
Activities 4, 5 and 6
4.
Student Feedback on Units (SFUs) are collected each trimester - usually during Weeks #11
and #12. The data is collected electronically so maximizing anonymity and significantly
increasing the return which has been characteristic over the last 8 trimesters in particular.
The specific focus of the SFUs is around teaching, learning and student support –
The line of questioning is all to do with the quality of the teaching and learning (learner
engagement) that UBSS is distinguishing itself around. This consistency of questioning married
with the 11 consistent issues has provided ample opportunity for comparison across trimester to
trimester, across programs and across subjects. The speedy publication of the outcomes
provides opportunity for remedial action (if required), change of staff (if required) and high
quality manipulation of weak areas to improve on during the next trimester. This is best
practice – and very difficult to achieve in the public university sector (from experience) because
of the time lags and other inefficiencies.
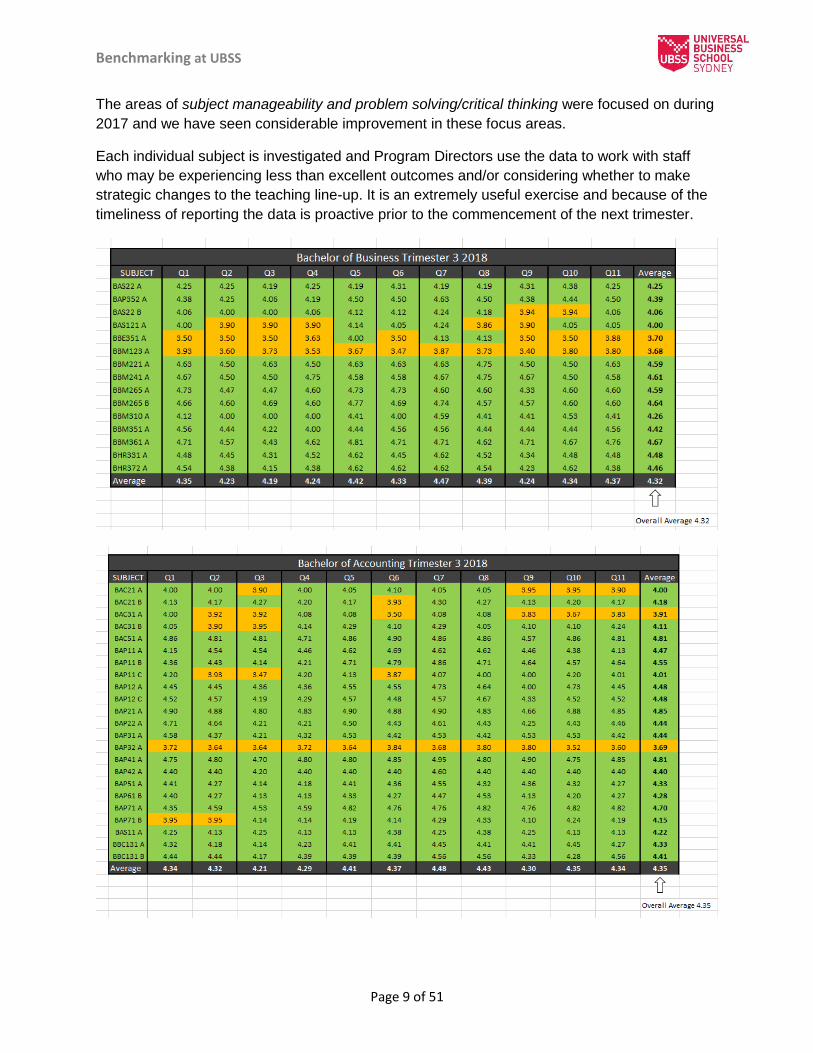
Examining the most recent SFUs available (T3, 2018) at program and subject level there is
significant evidence that UBSS students at both undergraduate and postgraduate levels are
Benchmarking at UBSS
Page 8 of 51
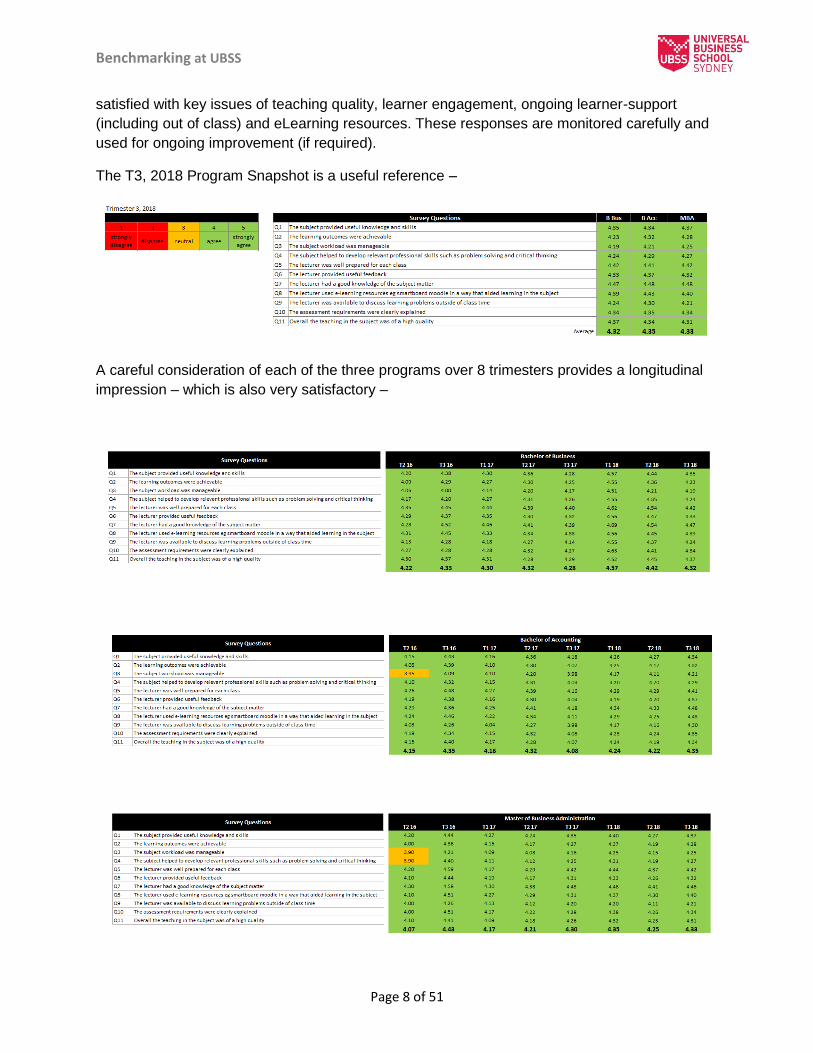
satisfied with key issues of teaching quality, learner engagement, ongoing learner-support
(including out of class) and eLearning resources. These responses are monitored carefully and
used for ongoing improvement (if required).
The T3, 2018 Program Snapshot is a useful reference –
A careful consideration of each of the three programs over 8 trimesters provides a longitudinal
impression – which is also very satisfactory –
Benchmarking at UBSS
Page 9 of 51
The areas of subject manageability and problem solving/critical thinking were focused on during
2017 and we have seen considerable improvement in these focus areas.
Each individual subject is investigated and Program Directors use the data to work with staff
who may be experiencing less than excellent outcomes and/or considering whether to make
strategic changes to the teaching line-up. It is an extremely useful exercise and because of the
timeliness of reporting the data is proactive prior to the commencement of the next trimester.

Benchmarking at UBSS
Page 10 of 51
The SFU data is collected via the UBSS Learning Management System (LMS) which means
individual staff members are able to review the responses for individual subjects and classes.
This has proven most useful and serves as an important part of professional development
(consistent with the UBSS Professional Development Policy).

Benchmarking at UBSS
Page 11 of 51
5.
Staff Surveys are used to monitor the ‘health and well-being’ of staff as well as the support
provided to make doing their job is supported and doable. Outcomes suggest staff members
believe they have the necessary tools to do the job; the supervision provided is appropriate;
staff members are well informed about matters affecting their work; and they are satisfied with
their current role/position/job.
The most recent staff survey was conducted at the end of T3, 2018 –
The data is provided over 8 trimesters – which in turn provides a valuable longitudinal oversight.
The evidence strongly supports the notion that UBSS is a good place to work and that staff are
satisfied with their jobs (currently sitting on 4.9)
The area of involvement in decision making was identified as an area needing work (Q5) in T2,
2016 scoring a 3.9. It is pleasing to see this domain is currently rating at 4.7. The regular
‘Message from the Executive Dean’ (which commenced in T3, 2016 has had a significantly
positive impact on this concern. The publication recently published its 71st edition.
This serves as an example of benchmarking providing direction for improvement – and in this
case evident success.

Benchmarking at UBSS
Page 12 of 51
6.
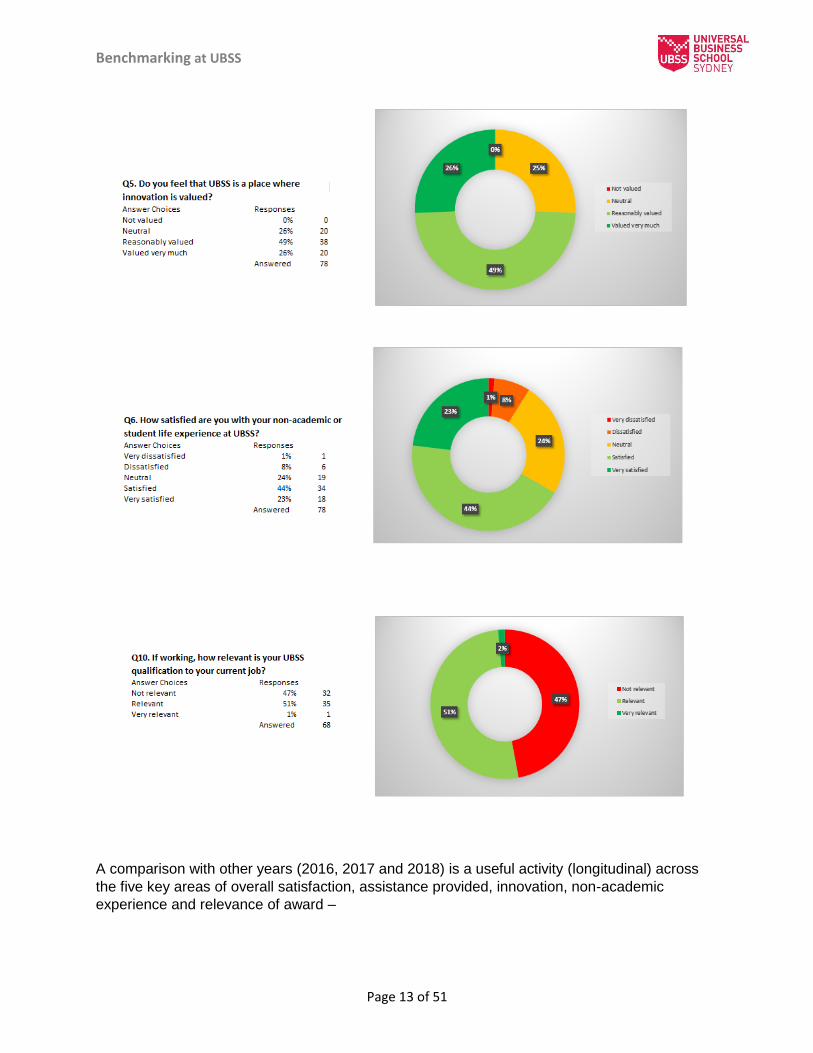
Graduate Surveys
Each year, on graduating, UBSS students are surveyed via a Graduate (Exit) Survey. The most
recent being July 2018. The key outcomes are best expressed in the following images –
Benchmarking at UBSS
Page 13 of 51
A comparison with other years (2016, 2017 and 2018) is a useful activity (longitudinal) across
the five key areas of overall satisfaction, assistance provided, innovation, non-academic
experience and relevance of award –

Benchmarking at UBSS
Page 14 of 51
Key Issues 2016 2017 2018
Satisfaction with overall UBSS experience 73% 84% 78%
Satisfaction with assistance provided 78% 78% 74%
Innovation is valued at UBSS 83% 77% 75%
Satisfaction with non-academic experience 71% 74% 67%
Relevance of the UBSS qualification to work 75% 67% 52%
Naturally we are pleased with the outcomes and they further reinforce (and reiterate) the range
and findings of additional surveys and measures we use throughout each year including SFUs,
Staff Surveys and QILT.
The learning experience, though, is the importance of stressing the relevance of study to
employment. This is a complex issue – and often resolves itself in the long term. In the short
term staff are encouraged to emphasise the issue in all classes – and management provides
video and social media excerpts to stress the relevance of study to work.
Associate Professor Andrew West was also able to analyse the recent Graduate Survey (as
part of the PIR process) and put it in perspective in relation to 2014-2018 (longitudinal). He
wrote -
‘At the UBSS Graduation held on Thursday 12th July, 2018 at the Sydney Opera House, the
annual Graduate Outcomes Survey was conducted. This is completed by all eligible graduates
for that year. The results show a continuing positive outcome for UBSS. The survey was
completed by 78 graduates, representing a 60% response rate. The highest number of
responses and the highest response rate in the collection of this important survey. Set out below
are the results since 2014 -
Graduate Satisfaction
Year 2014 2015 2016 2017 2018
Total responses 43 35 59 50 78
Positive responses 13 20 43 42 61
% Positive Response 30% 57% 73% 84% 78%

Benchmarking at UBSS
Page 15 of 51
To the question “How satisfied are you with your overall educational experience at UBSS?”,
UBSS graduates who were satisfied or very satisfied totaled a healthy 78% in 2018, remaining
at the high level set in 2017 of 84%.
To the question “Following completion of your studies at UBSS, have you either gone into
employment (full time/part-time) or gone on to further study):” 66 graduates indicated they are
either in full time employment or studying. This is the highest level of positive graduate
outcomes since UBSS commenced in 2008. Congratulations to all graduates for their ongoing
success.’
This ability to use longitudinal data to internally view UBSS is extremely useful and informative.
30%
57%
73%84%
78%
0%
20%
40%
60%
80%
100%
-
20
40
60
80
100
2014 2015 2016 2017 2018
% P
osi
tive
Re
spo
nse
s
Nu
mb
er
of
Re
spo
nse
s
Graduate Satisfaction
Total responses Positive responses % Positive Response
Benchmarking at UBSS
Page 16 of 51
Activities 7, 8, 9, 10, 11, 12 and 13
Benchmarking at UBSS
Page 17 of 51
7.
Grade Distribution has been a keen area of focus in the benchmarking area for UBSS for
some time. Two projects emerge as being very useful for comparison and aspiration.
The first is the HEPP_QN project (7).
This project commenced at the beginning of 2017 (West), and is currently in its third iteration.
Reports from the various providers were discussed in some detail at the recent HEPP-QN
Conference in Melbourne on November 26-27, 2018.
The project provides the opportunity to compare some 16 providers (both public and private) in
terms of the grade distribution patterns at the end of a given academic period. UBSS has
participated in the program since the inception and we have analysed our own distributions in
the light of the project and we have noted a gradual movement toward ‘centre’ so to speak.
What it is has reinforced for UBSS (the learning), however, is that we are hard markers – and
our award is worth the paper it is written on. This has enhanced our credibility which in turn has
beeen evidenced in the internal SFU and staff survey domains as well as the external QILT
outcomes.
The project (UBSS is HEPP_QN 11 in the study) takes the grade data and manipulates it in
some valuable shapes to provide a comparison an ‘establishment point’ for UBSS.

Benchmarking at UBSS
Page 18 of 51
The overall data of the 16 institutions (self-accrediting and non-self-accrediting) is compared -
By student type
By AQF type
Benchmarking at UBSS
Page 19 of 51
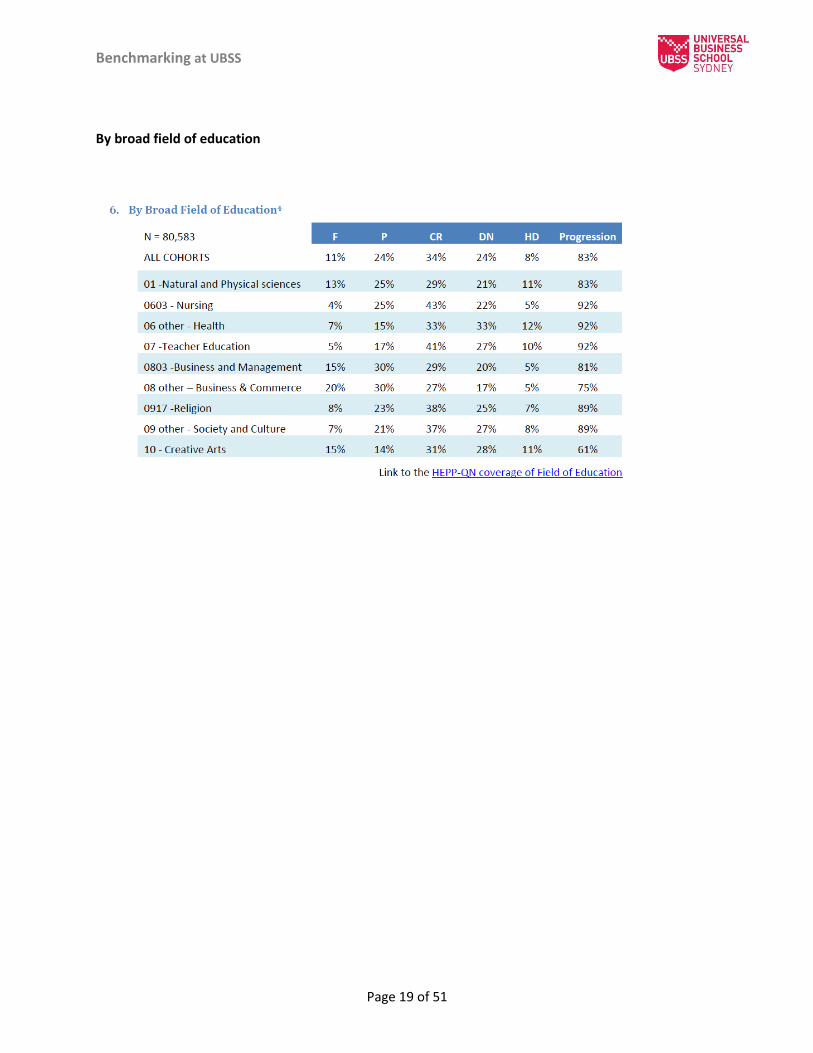
By broad field of education

Benchmarking at UBSS
Page 20 of 51
By Provider
UBSS is HEPPQN 11 in this study

Benchmarking at UBSS
Page 21 of 51
This provides UBSS with an ongoing opportunity to consider our grade distributions (which are
not normalized) with 15 other like institutions. This is a unique opportunity – and not widely used
in public universities who frequently (if not always) moderate to a curve – and adjust raw scores
to achieve that distribution.
Of particular interest is that UBSS’s grade distribution and progression (HEPP-QN 11 from ‘5.
Grade Distribution by Provide’ above) is very similar to the Business cohort from the HEPP-QN
grade distribution cohort (6. By Broad Field of Education).
Detail Fail % Pass % Credit % Distinction %
High Distinction
%
Progression%
UBSS (HEPP-QN 11)
22 39 22 12 5 73
Business Cohort 20 31 27 17 5 75
As can be observed, both the UBSS and HEPP-QN business cohort have a positive skew, not
following a normalized distribution with the mean of credit, as is often the case in normalized
grade distributions. UBSS does not change or moderate the grades to fit a normal distribution.
UBSS relies on the integrity of the assessments and those that mark them, to indicate the level
of proficiency of students to achieve student learning outcomes and course learning outcomes
at UBSS.

Benchmarking at UBSS
Page 22 of 51
8.
A second grade distribution project was initiated in 2016 (Whateley and Bofinger) with a group
of national/international interests who were keen to compare across borders to see what
likenesses and/or differences were apparent. This resulted in a most valuable distribution graph
that UBSS is able to imprint itself each trimester. This is refreshed regularly with participants
(now 11 participants). The most recent exercise was conducted at the end of T3, 2018 –
UBSS is represented with the broken red line. This comparison (benchmarking) is done at
program level as well.
The exercise is most valuable (as can be evidenced) in the fact that the UBSS distributions are
consistent nationally and internationally. UBSS is not an easier marker – but it is consistent. No
change has been recommended – or in fact needed.

Benchmarking at UBSS
Page 23 of 51
9.
Academic Leadership (HEPP_QN)
A presentation was recently given by Dr Kathie Ardzejewska (Manager of the Learning and Teaching Office - University of Notre Dame]) and Dr Albert Haddad Director of Academic Administration Alphacrucis College. The talk covered the input on the academic leadership survey completed by the members of academic leaders from the HEPP-QN. UBSS senior management team provided input into this benchmark project. The Higher Education Private Provider – Quality Network (HEPP-QN) values the diversity of the
Australian Higher Education sector, acknowledging that all Higher Education Providers (HEPs)
operate within the same government regulatory environment. The HEPP-QN also recognises
that there are many and varying ways in which the private sector may demonstrate quality
academic leadership performance and that the scale and size of an institution has no bearing on
quality. Nevertheless, consensus needs to be developed around the expectations of academic
leadership roles for HEPs, especially given differences in mission and size when compared to
public universities.
The Matrix developed by HEPP_QN was designed to provide clarity to academics on indicative
criteria and minimum performance standards of academic leadership. However, recognising that
academic leadership capabilities develop over time, Levels 1 and 2 operate to encourage
academics to work strategically towards developing and achieving academic leadership
capabilities. Levels 3 and 4 demonstrate synergy with the HEPP-QN Academic Leadership
Statement1; i.e. it is intended to guide institutions and academics to formalise recruitment, and
reward and recognition of academic leadership in practice.
The three dimensions of the Matrix comprise the areas of engagement for academic leaders -
1. Governance and Change; 2. Professional Learning Of Self and Others; 3. Engagement in Communities of Practice.
The dimensions and their associated descriptors also take into account the following -
Higher Education Standards Framework (2015);
Australian Institution Teaching Criteria Standards Framework (AUTCAS);
Higher Education Academy Fellowship Scheme and;
Position descriptions and promotion policies of HEPs.
In general, the descriptors should be considered as signals that can be used as evidence of
meeting the expected academic performance quality for a current level of appointment, or to
build a case for reward, recognition and/or promotion. It is not necessary for an academic to be
strong in every one of the three dimensions or all of the descriptors.
1 A penultimate draft was presented at the November 2018 HEPP-QN workshop

Benchmarking at UBSS
Page 24 of 51
This paper was workshopped at the HEPP-QN conference with a final paper due in early 2019. The findings will then be integrated into UBSS Academic Leadership practice.

Benchmarking at UBSS
Page 25 of 51
10. Progression, Attrition Completion (HEPP_QN) A brief overview of the benchmarking project was provided by Dr John Skrzypaszek (Lecturer & Director of E.G. White Centre, Avondale College) and Ms Glenda Hepplewhite (Director Quality Assurance, Alphacrucis College) at the recent (November 2018) HEPP_QN Conference. This presentation was primarily centred on the support to be provided to students to improve retention. The presentation material and the scope of this benchmark project will be released in early 2019. UBSS has noted improved retention and lowered attrition (accompanied by improved progression) in part due to a 10 part strategy put in place in late 2016 and early 2017. The approach and current status is best captured in the table provided –

Benchmarking at UBSS
Page 26 of 51
This strategy and monitoring forms Registration Conditions 4bi, 4bii and 4d.

Benchmarking at UBSS
Page 27 of 51
11.
International Students (COPHE)
This benchmarking project is being completed in conjunction with the members of COPHE, with Dr Sara Booth from Peer Portal the supervisor. In October 26 -27, 2018 the COPHE Conference on ‘internationalisation benchmarking’ was conducted. UBSS provided responses to the initial survey giving us access to both the project and the comparative data. There were 18 institutions involved in this benchmarking project. There were 4 broad KPIS against which COPHE members participating provided responses –
1) Admission and recruitment of international students 2) Business development and strategy 3) Embedding ELICOS Standards at the course level 4) Support for international students
The input from the other COPHE members participating has been absorbed and will be finalized by end of December 2018. The UBSS Academic Senate has been requested to provide feedback to the project – this will be accommodated on December 13, 2018. Project release is scheduled for early 2019.

Benchmarking at UBSS
Page 28 of 51
12. Assessment Benchmarking (COPHE) Assessment benchmarking was also covered at the COPHE conference in Melbourne (October 2018). UBSS is using this assessment benchmarking project as an opportunity to meet its obligations to comply with external moderation of assessment. The three subjects chosen are –
A. Accounting for Business B. Accounting Information Systems C. Human Resource Management
The required documentation has been uploaded to the Peer Portal site for external review by independent providers Polytechnic Institute Australia (PIA) and Australian Institute of Higher Education (AIHE). Results should be available in early 2019.

Benchmarking at UBSS
Page 29 of 51
13. Work Integrated Learning (COPHE) On 14-15 November 2017, UBSS hosted the Work Integrated Learning COPHE Workshop, held over two days. This was held in the premises of UBSS on level 10, 233 Castlereagh Street, Sydney. The Council for Private Higher Education (COPHE)-supported national Work Integrated
Learning (WIL) benchmarking project (2017) involving eighteen higher education (HE)
institutions across Australia. These HE institutions varied in institutional missions and contexts,
ranging in the number of students [72 students to 2900 students; the number of staff [302 staff
to 9 staff and historical context in terms of when they were established (1948 to 2017). The
institutional context played an important role in how key performance indicators and measures
were rated and what resources were available.
The 18 participating HE institutions were -
Adelaide College of Divinity
Alphacrucis College [AC]
Australian College of Christian Studies [ACCS]
Deakin College
Excelsia College
Griffith College
Insearch
International College of Management, Sydney [ICMS]
Le Cordon Bleu, Australia [LCBA]
Marcus Oldham
Moore Theological College
Photography Studies College [PSC]
South Australian Institute of Business and Technology [SAIBT]
Sydney Institute of Business and Technology [SIBT]
Tabor College
Universal Business School, Sydney [UBSS]
UOW College [UOWC]
Wentworth Institute
The specific aims of the COPHE Benchmarking Project were to –
Benchmark institutional processes on working integrated learning and first year transition support; Benchmark at the discipline level assessment inputs/outputs; Build capacity for HE institutions to participate in external referencing activity to improve their own educational performance; and Develop institutional and national recommendations, share good practice and network with other COPHE members and external members.

Benchmarking at UBSS
Page 30 of 51
The key outcomes from the COPHE Benchmarking Project include –
17 Institutional self-review reports [Wentworth Institute focused on discipline level benchmarking only]; Peer Review Workshop and documentation [COPHE WIL Benchmarking Information Booklet, COPHE Pathways Information Booklet; COPHE Benchmarking Overview Presentation; COPHE Day 2 Presentation]; 5 Presentations from workshop participants; External Referencing Schedule 2017-2018 with over 50 units; and Final Report with 3 national recommendations, 90 institutional recommendations or areas for improvement and 131 examples of good practice.
The key themes to emerge from the COPHE Benchmarking Project include:
Work Integrated Learning [WIL] First Year Transition Support
Sector strengths Sector gaps Sector strengths Sector gaps
Information to students, staff and stakeholders on WIL
Dedicated roles and responsibilities in WIL
Industry and volunteer opportunities for WIL
Industry mentors/alumni
Student/staff exchange at national/international levels
Role of research partnerships in WIL
Employer/business incentives
Institutional plans, policies and organisational structures
Financial resources to support students
Help students belong
Opportunities to engage with professions/industry and further study
UBSS Recommendations for the COPHE WIL Benchmarking Report
UBSS
Further development 1 Policies and Procedures
Work Integrated Learning is currently within the UBSS Policies and Procedures the 3.23 Professional Development Policy, but there is more work to include WIL into other policies. UBSS policies are currently being benchmarked against 4 other similar private institutions. From this it is expected a range of policy development initiatives to be recommended. WIL policy may be one of them. This policy benchmarking was completed in March 2018. [1.2 ]
Further development 2 Roles and Responsibilities
Dedicated roles and responsibilities for WIL is an area under development. The current responsibility sits with the Director of the Centre for Entrepreneurship, reporting to the Executive Dean. Program Directors of the 3 programs also have responsibilities to implement and review WIL within their respective programs. [1.3]

Benchmarking at UBSS
Page 31 of 51
Further development 3 Training and Induction
Training and induction on WIL is limited. Currently under review and development. [1.4]
Further development 4 Industry Projects
Trialled industry project work with one external organisation for industry opportunities. This was offered to MBA students. UBSS is looking to broaden this further with industry partners in 2019. [1.5]
Further development 5 Industry Partners
Limited institutional processes to support industry engagement and strategic partnerships, but UBSS is currently reviewing these to develop engagement and relationships with entrepreneurs and larger organisations. This development is expected to continue throughout 2019. [2.1]
Further development 6 Alumni
UBSS has established an alumni association to take effect in 2018. This will assist with WIL relationships into the future. UBSS is also researching other professional memberships for the business programs [2.2]
TEQSA’s definition on WIL is -
“In the context of the Higher Education Standards Framework (Threshold Standards) 2015
(HES Framework), work-integrated learning (WIL) encompasses any arrangement where
students undertake learning in a workplace outside of their higher education provider as a part
of their course of study. Such arrangements may include -
clinical or other professional placements,
internships,
work-place projects.”
Source:
http://www.teqsa.gov.au/sites/default/files/GuidanceNote_WorkIntegratedLearning%201.0.pdf
The COPHE Benchmark project used a different definition of WIL. Work Integrated Learning
(WIL) can be defined as ‘an ‘‘umbrella term for a range of approaches and strategies that
integrate theory with the practice of work within a purposefully designed curriculum’ (NSWIL,
2015). It involves improving the employability of graduates by giving them valuable practical
experience through their course of study. It also improves the transition from university to work
and productivity outcomes for the employer and the economy.

Benchmarking at UBSS
Page 32 of 51
UBSS will not be following this narrow definition of WIL used by TEQSA, that only includes
workplace learning, but rather the broader accepted definition of -
“WIL is delineated as the intentional integration of theory and practice knowledge, and a WIL
program provides the means to enable this integration and may, or may not, include a
placement in a workplace, or a community or civic arena.”
Source: http://www.olt.gov.au/resource-work-integrated-learning-2011
The WIL typology as developed by Lawson, Fallshaw, Papodopoulos, Taylor and Zanko (2011,
p64) has been used to ensure the depth of learning in UBSS subjects (See UBSS Strategic Plan
2016 -2018, pages 6-8). All of the classifications have been implemented in the past by UBSS,
except for Internship.
Classification of WIL
Description
1.Industry case study
An actual business scenario or challenge faced by business, requiring students to apply analytical and problem-solving skills to explore solutions and/or critically evaluate those made by business executives.
2.Industry simulation
Reality-based, experiential learning-centred approaches engaging students in real-time analysis and decision making in real-world situations within the safety of an educational environment.
3.Industry practitioner delivery
Industry practitioners engage in the teaching program to deliver specialized lectures, present in seminar series, conduct professional development workshops or participate in assessment of student projects and presentations.
4.Industry study tour
Includes field trips, site visits and more lengthy tours. Industry study tours aim to create opportunities by travelling to industry-related places and situations, allowing students to apply theory, see theory in practice, ask questions of professionals in situ, compare and contrast different sites of work, and connect curriculum and learning to professional practice.
5. Industry competition
Industry competitions involve individual businesses organizing, judging, sponsoring or in some other way encouraging students (often in teams) to compete against each other to achieve a business-oriented goal in a short timeframe. Industry competitions include marketing strategies, management plans, business start-up ideas and online business games. Recognition and rewards are an important incentive in this category.

Benchmarking at UBSS
Page 33 of 51
6.Industry mentoring
Matching students with a professional role model to enhance skills (instrumental) and attributes (developmental); investigating career options (transition and pathways); increasing understanding of the benefits of coursework (knowing and doing); and exposure to different thinking and learning methods.
7.Industry project
Industry projects include a broad range of activities and typically involve the sort of work undertaken in the workplace. Industry projects include the production of a workplace artefact (for example management plan, business report, market research) and management activities. As well as providing a forum to apply theory to a real-world work issue, projects develop students’ project management skills, team skills, communication skills and problem-solving skills.
8.Industry placement (internship)
Immerses students in a workplace related to their discipline or career goals. Ideally, industry placement combines both class-based learning and structured and supported workplace activity with opportunities to reflect on learning and seek timely feedback on performance.
Source: Lawson R, Fallshaw E, Papodopoulos T, Taylor T and Zanko M(2011) Professional Learning in the Business Curriculum: Engaging Industry, Academics and Students, Asian Social Science, Vol. 7, Iss. 4, pp 61-68.
Drawing on the expertise of the CFE Fellows, the academic leadership of UBSS staff and
representative bodies, UBSS will further introduce WIL throughout the Bachelor and Masters
programs. There will be a phased approach over the year in consultation with the three UBSS
Program Directors Dr Ray Hayek, Dr Felix Stravens and Wayne Smithson. This will lead to a
further integration of WIL though out UBSS and further utilise the CFE Fellows.
UBSS continues to embed WIL initiatives into teaching and learning through various channels in 2018, to be continued in 2019.

Benchmarking at UBSS
Page 34 of 51
Activities 15 and 16

Benchmarking at UBSS
Page 35 of 51
15.
The Australian Government (through the Department of Education) released the 2017 SES
(QILT) outcomes last week.
We have participated in the survey now for two years – and we are delighted (again) with the
outcomes of the survey. This time around, we participated in both the undergraduate and
postgraduate elements. The very nature of the project is to compare performance and this can
be done quite easily on the QILT website – www.qilt.edu.au
On close examination we are delighted to announce three excellent outcomes and boasts
–
#1 Postgraduate School in Australia for Learner Engagement

Benchmarking at UBSS
Page 36 of 51
#1 Postgraduate NUHEI Business School in Australia for Overall Quality of Educational
Experience
#1 Undergraduate NUHEI Business School in the Sydney CBD for all six QILT quality
indicators
I provide an overview – but encourage you to visit the site when you get a moment.
Assistant Professor Kim Sharma provided a very useful 2016 and 2017 performance
comparison for UBSS which is pleasing to see –

Benchmarking at UBSS
Page 37 of 51
The above provides a snapshot of the 2017 (UG and PG) against the 2016 (UG) outcomes for
consideration. The horizontal broken lines give us the opportunity to measure the UBSS
performances against the 2016, 2017 national averages. In essence, the UBSS results are
excellent.
Our teaching, learner engagement and skills development is exemplary. Our student support
mechanisms are excellent.
Our learning resources are below national average – but we will never be able to compete with
the libraries, swimming pools, cafeterias and the like (students often confuse learning with
entertainment).
Using our standard snapshot of some of our neighbours in the CBD and across the domains at
both UG and PG level the outcomes become evident and very satisfying. Remember QILT is
designed to measure against the national averages and be able to compare institutions
(something that Universities simply do not like) –

Benchmarking at UBSS
Page 38 of 51
Undergraduate QILT Outcomes
This is a very pleasing comparison with UBSS (far left in red) the only one of the five to actually
make the national average on overall Quality of Education Experience. This domain is about the
total package of offering at UBSS – teaching, learning and support.

Benchmarking at UBSS
Page 39 of 51
UG Teaching Quality is something for the academic staff to be very proud of – above the
national average - and certainly above our neighbours in the Sydney CBD.
Benchmarking at UBSS
Page 40 of 51
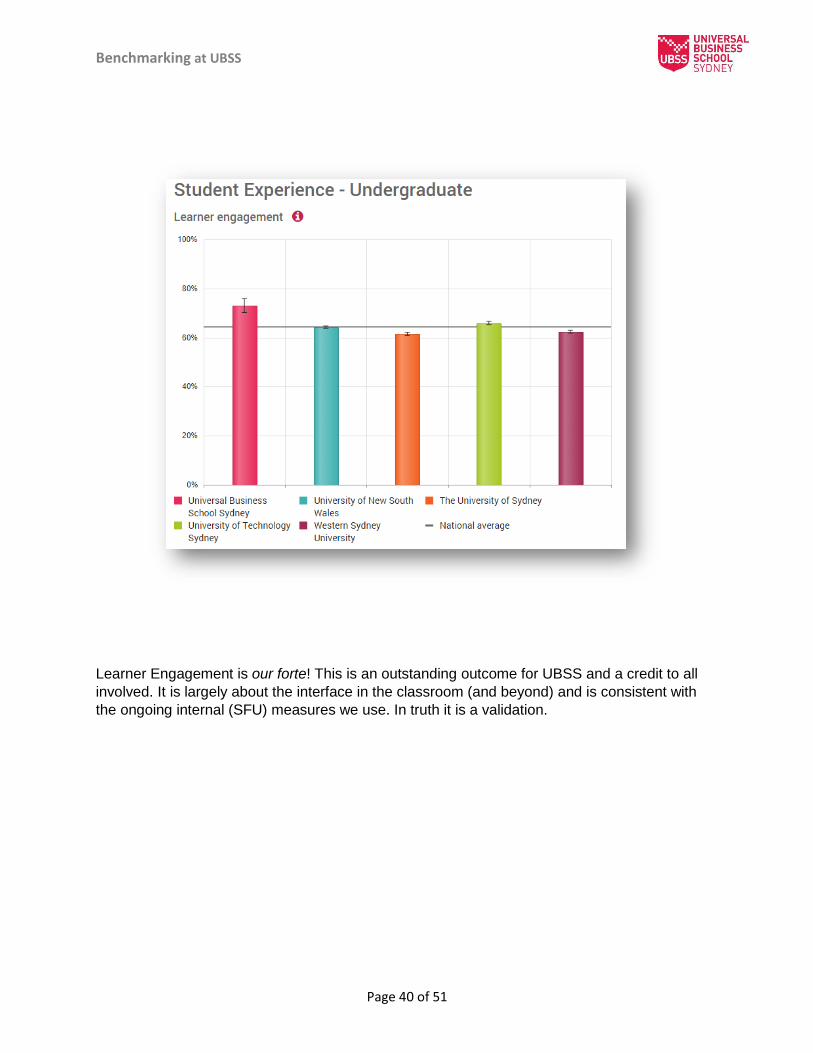
Learner Engagement is our forte! This is an outstanding outcome for UBSS and a credit to all
involved. It is largely about the interface in the classroom (and beyond) and is consistent with
the ongoing internal (SFU) measures we use. In truth it is a validation.

Benchmarking at UBSS
Page 41 of 51
This domain is our weakest performance. I could pump a million dollars into the CBD site and
probably not change the outcome a great deal. It is near impossible to compete with the
massive (some say excessive) tax-payer investment in sites at WSU and USyd for example.

Benchmarking at UBSS
Page 42 of 51
This is another brilliant outcome for UBSS – and a ‘whole of team’ effort. I personally know the
extent of the investment WSU (purple) puts into this domain – and it is massive! At UBSS
students appreciate the support provided by both the professional and academic teams – this
about contact, consideration and action.

Benchmarking at UBSS
Page 43 of 51
This is another very pleasing outcome.
In terms of the undergraduate outcomes (above) we should be very satisfied as a community
that we have the right emphasis and the right strategy for our students – certainly as far as they
perceive.

Benchmarking at UBSS
Page 44 of 51
16.
Postgraduate QILT outcomes
2017 was the first time UBSS participated in the postgraduate survey and the results are very
satisfying indeed. We currently have 600+ students in the MBA program and I suspect the
reasons for this success are evidenced in the QILT deliberations -
This is an excellent overall outcome at both national and neighbour level.

Benchmarking at UBSS
Page 45 of 51
Teaching quality is paramount – UBSS has done so well in this domain. This, again, is
consistent with SFU feedback.

Benchmarking at UBSS
Page 46 of 51
The UBSS strength appears to be in the engagement domain – with our postgraduate students
ranking us well above the national average. And, comparatively, the #1 in the country.

Benchmarking at UBSS
Page 47 of 51
This is, and will remain, our weakest area – we simply cannot compete – but what it does show
is that our postgraduate students are not unhappy with the resources and probably do use the
eLibrary. I suspect they also approve of the CBD location.

Benchmarking at UBSS
Page 48 of 51
An excellent set of outcomes and above the national average.

Benchmarking at UBSS
Page 49 of 51
This is very pleasing indeed – placing UBSS above the national average and performing well
above our neighbours.
In terms of learnings from the QILT exercise – UBSS will remain vigilant across all domains and
will use early data from the internal SFUs to ensure good outcomes.

Benchmarking at UBSS
Page 50 of 51
CONCLUSION
A recent criticism of TEQSA (2016 and 2017) was that our (UBSS) benchmarking activity did
not appear to be actioned. The very notion of conducting this extensive benchmarking regime
and somehow not viewing and analysing the data on a regular basis is ludicrous – the ramblings
of an out of touch TEQSA case manager – arrogance, ignorance or both (no longer with the
Regulator).
UBSS is an active becnhmarking partner and utilises the data effectively. It shares data openly
and honestly with all stakeholders by way of committees, boards and publications. It uses data
copllected to compare with other like organsiations – and where deficiencies are noted – UBSS
acts to remedy or remediate.
Our experience in this domain over the last three years in particular provides a high level of
comfort that we are doing things well. This is further validated by external endorsement by QILT,
CPA, IML, CMI to mention a few.
Professor Greg Whateley
Executive Dean, UBSS
December 2018

Benchmarking at UBSS
Page 51 of 51