benchmarking for action and satisfaction in facility
TRANSCRIPT

BENCHMARKING FOR ACTION AND SATISFACTION IN FACILITY OPERATIONS AND MAINTENANCE
By
Justin Robert Dodd
A thesis submitted to the faculty of the University of North Carolina at Charlotte In partial fulfillment of the requirements For the degree of Master of Science in
Construction and Facilities Management
Charlotte
2018
Approved by:
_____________________________
Dr. Jake Smithwick
_____________________________
Dr. Glenda Mayo
_____________________________
Dr. Nicole Barclay

ii
©2018 Justin Robert Dodd
ALL RIGHTS RESERVED

iii
ABSTRACT
JUSTIN ROBERT DODD. Benchmarking for action and satisfaction in facility operations and maintenance. (Under the direction of DR. JAKE SMITHWICK) While benchmarking is a well-established strategy that organizations have been
using to manage performance and seek continual improvement for almost 4 decades, the
field of facility management has only started using benchmarking in the last 20 years.
While the literature available on organizational benchmarking is readily available from a
multitude of sources, the literature specifically addressing facility-oriented benchmarking
is much harder to find. Literature addressing large external benchmarking surveys is also
scarce. The literature available on the topic was reviewed and several knowledge gaps
were identified as needing clarification for facility benchmarking. The fundamental goal
of benchmarking is to identify best practices (Camp, 1989) and take action (Spendolini,
1992). There is no identified literature addressing how facility managers are taking action
on their benchmarking efforts. In searching the literature for best practices, customer
satisfaction was identified as widely used facility KPI, however, there is not a lot of
research into how the FM field is using the data or how it related to facility performance
management. Customer/Occupant satisfaction was also identified as a regularly utilized
KPI in the FM field and while there exists literature on the topic internationally, there is
very little data on how it is being used in the North American facility industry.
Furthermore, the literature has also identified a gap between facility benchmarking and
general performance management (Simoes et al., 2011). In order to address these
questions, an industry-wide facility operations & maintenance benchmarking survey was

iv
developed and conducted with an FM organization. The survey provides a wide variety of
data on North American facilities representing 2,629,749,032 Exterior Gross Square Feet
(GSF) and 1,782,535,342 Rentable Square Feet (RSF). Hypotheses were developed from
the topic areas and their relationship to a Key Performance Indicator (KPI), maintenance
costs/SF, was tested using a variety of inferential statistical techniques and grouping of
variables for making more useful comparisons. Results from the analyses suggest that
while 66% of facilities utilize customer satisfaction surveys, there is no clear relationship
between their use and facility performance, though differences in survey frequency were
found to relate to facility size. Also, while facilities approach taking action on
benchmarking studies in a variety of ways, there exists some evidence to suggest that
facility managers with unfamiliarity or uncertainty about the benchmarking process may
be significantly underperforming when compared to their peers.

v
ACKNOWLEDGEMENTS
First and foremost, I would like to thank my Advisor and mentor, Dr. Jake
Smithwick, for guidance and support. It’s been a privilege to work with you and I look
forward to the next step of this academic journey with you. I would also like to thank my
committee, Dr. Glenda Mayo and Dr. Nicole Barclay for their support and insight as well.
I would also like to thank my lovely wife, Katie, who has been so understanding and
supporting of my education and the long hours I have put into the pursuit of my goals. I
am also grateful for the support of IFMA and the many opportunities I have been given
by the organization. I also could not have done this without the blessing and support of
my long-term employer and friend, Steve Cameron, who has indirectly enabled this
journey from the start. Last, but not least, I’d like to thank my parents and in-laws for
always being there as well. It’s an absolute privilege to have this academic, professional,
and personal support network.

vi
TABLE OF CONTENTS
LIST OF TABLES…………………………………………………………..…..……….xi
LIST OF FIGURES……………………………………………………….…….………xiii
LIST OF ABBREVIATIONS………………………………………..……….……….…xv
CHAPTER 1: INTRODUCTION………………………………………………………....1
PURPOSE OF STUDY……………………………………………………………..…1
PROBLEM STATEMENT………………………………………………………….…2
RESEARCH GOALS AND OBJECTIVES…………………………………………...3
HYPOTHESES………………………………………………………………………...4
RESEARCH SCOPE…………………………………………………………………..5
RESEARCH METHODOLOGY SUMMARY………………………………………..6
SIGNFICANCE OF STUDY…………………………………………………………..7
DEFINITION OF TERMS…………………………………………………………….8
SUMMARY OF CONTENT…………………………………………………………..9
CHAPTER 2: LITERATURE REVIEW……………………..……………………….…10
INTRODUCTION………………………………………………….………………...10
BENCHMARKING HISTORY & MODELS…………………………..……………11
EFFECTIVENESS OF BENCHMARKING………………………..………………..20
FACILITY MANAGEMENT BENCHMARKING……………………..…………...23
PERFORMANCE MANGMENT AND BENCHMARKING………………….........24
BALANCED SCORECARDS (BSCS)……………………………….…………..25
KEY PERFORMANCE INDICATORS (KPIS)………………………………….26

vii
BENCHMARKING FOR SATISFACTION…………………………………………29
BENCHMARKING FOR ACTION………………………………………………….32
BENCHMARKING SUMMARY……………………………………………………33
CHAPTER 3: RESEARCH METHODOLOGY………………………………….……..35
INTRODUCTION…………………………………….…………….………………..35
IDENTIFICATION OF INDUSTRY NEED…………………………………………37
SURVEY DEVELOPMENT…………………………………………………………38
FM ORGANIZATION CONTRIBUTIONS…………………………………...…38
SME CONTRIBUTIONS…………………………………………………..……..39
SME FEEDBACK INCORPORATION PROCEDURES…………………….….41
RESEARCHER CONTRIBUTIONS…………………………………………..…41
PILOT SURVEY ADMINISTRATION…………………………………………..41
REFINEMENT……………………………………………………………………42
CONSIDERATIONS FOR USING RANGES IN THE INDUSTRY-WIDE
O & M SURVEY………………………………………….………………..43
DEVELOPMENT OF RANGE INTERVALS………………………...………43
RANGE INTERVAL MIDPOINT CALCULATIONS……………….……….44
RANGE INTERVALS DEVELOPED WITHOUT PILOT SURVEY
DATA……………………………………………………………..………..46
TESTING OF INDUSTRY-WIDE O & M SURVEY (ONLINE)……….…....49
DEVELOPMENT OF MANUAL EXCEL COSTS FILE……………….…....52
DATA COLLECTION………………………………………………………….……54

viii
DEPLOYMENT OF INDUSTRY-WIDE O & M SURVEY…………………..…54
DEVELOPMENT OF MULTI-FACILITY COST FILE…………...…………….55
DATA CLEANSING & QUALITY MANAGEMENT……………….……………..57
CHAPTER 4: DATA ANALYSIS………………………………………………………60
INTRODUCTION……………………………………………………………………60
PILOT SURVEY…………………………………………………...……………..60
INDUSTRY-WIDE O & M SURVEY……………………………………………60
RESEARCH OBJECTIVE 1……………………………………..…………………..61
RESEARCH OBJECTIVES 2 & 3………………………………………...…………62
INDEPENDENT VARIABLES…………………………………………….....62
CUSTOMER/OCCUPANT SATISFACTION SURVEY FREQUENCY….…62
SATISFACTION SURVEY USE……………………………………………..64
SATISFACTION ACTION PLANS……………………………………..……65
BENCHMARKING ACTION PLANS………………………………………..66
DEPENDENT VARIABLE…………………………………..………………..67
GROUPING & COANALYSIS VARIABLES…………..……………………69
HYPOTHESES……………………………………………………………………….71
CUSTOMER/OCCUPANT SATISFACTION AND PERFORMANCE
MANAGEMENT………………………………………………………………72
BENCHMARKING PLANS AND PERFORMANCE MANAGEMENT……….72
CHAPTER 5: RESULTS………………………………………………………………...74
PILOT SURVEY RESULTS…………………………………………………………74

ix
COSTS…………………………………………………………………….………76
SATISFACTION………………………………………………………………….78
MAINTENANCE EXPENSE ALLOCATION………………….………………..79
INDUSTRY-WIDE O & M SURVEY RESULTS…………………………………...79
HYPOTHESIS TESTING: RESEARCH OBJECTIVE 2………..……….………80
SATISFACTION USE AND MAINTENANCE COSTS/SF…………...…….80
SATISFACTION FREQUENCY AND MAINTENANCE COSTS/SF…..…..81
SATISFACTION FREQUENCY AND FACILITY SIZE…………...………..82
FACILITY SIZE AND MAINTENANCE COSTS/SF………………………..85
TYPE OF SPACE REPORTED ON AND MAINTENANCE COSTS/SF...…86
HYPOTHESIS TESTING: RESEARCH OBJECTIVE 3………………….…..…89
BENCHMARKING PLANS……………………………….………………….91
PLAN 1: IDENTIFY PERFORMANCE TARGETS (GAUGING
COMPANY PERFORMANCE)………………………..……………….92
PLAN 2: INCORPORATE METRICS INTO A PERFORMANCE
MODEL…………………………………………………..……………..92
PLAN 3: IDENTIFICATION OF BEST-IN-CLASS PERFORMANCE
/BEST PRACTICES……………….………………………………..…..93
CHAPTER 6: DISCUSSION…………………………………………………….……....95
OBJECTIVE 1: FM INDUSTRY BENCHMARKING PROFILE……….………….95
OBJECTIVE 2: THE IMPACT OF CUSTOMER/OCCUPANT SATISFACTION ON
PERFORMANCE MANAGEMENT…………………………………..…………97

x
OBJECTIVE 3: THE IMPACT OF BENCHMARKING PLANS ON
PERFORMANCE MANAGEMENT……………………………………………..99
CONCLUSION………………………………………………………………….…..102
REFERENCES…………………………………………………………………………104
APPENDIX A: INDEPENDENT VARIABLE SURVEY QUESTIONS……….……..108
APPENDIX B: PILOT SURVEY………………………………………………….…...110
APPENDIX C: INDUSTRY WIDE O & M SURVEY………………………………...112
APPENDIX D: SME COMMENTARY………………………………………………..144
APPENDIX E: SURVEY REVISIONS & CHANGES………………………………..154
APPENDIX F: MANUAL EXCEL COSTS FILE……………………………………..164
APPENDIX G: MULTI-FACILITY COSTS FILE…………………………………….170

xi
LIST OF TABLES
Table 1: Schedule of Research Methodology Execution………………………...………36
Table 2: Example Mixed Responses to, “What is the annual cost of external building
maintenance?”……………………………………………………………..…45
Table 3: Previous Report RSF Percentiles…………………………………………….…47
Table 4: Previous Report Costs * RSF Percentiles…………………………………..…..47
Table 5: Industry-Wide O & M Survey Maintenance Costs/RSF…………………….…68
Table 6: Industry-Wide O & M Survey Facility Size (RSF)………………………….....70
Table 7: Spearman’s rho Correlation Analyses of Research Variables………………....79
Table 8: Effect of Satisfaction Use on Maintenance Costs/SF………………………….80
Table 9: Effect of Satisfaction Frequency on Maintenance Costs/SF…………………...81
Table 10: Effect of Facility Size on Satisfaction Survey Frequency………………….…82
Table11: ANOVA Tamhane Post-hoc Comparison of Size Categories(RSF) and
Satisfaction Survey Frequency………………………………………………...83
Table12: Average Maintenance Costs/SF by Type of Space Reported On………….…..87
Table 13: Facility RSF by Type of Space Reported On…………………………….…...87
Table 14: Effect of Type of Space on Maintenance Costs/SF…………………………...87
Table 15: ANOVA Tamhane Post-hoc Type of Space Analyses……………………..…88
Table16: Effect of Benchmarking Uncertainty on Maintenance Cost/SF…………….....89
Table 17: Effect of No Benchmarking Action on Maintenance Costs/SF…………….…90
Table 18: Average Maintenance Costs/SF by Type of Benchmarking Plans……………91
Table 19: Effect of Plan 1 on Maintenance Costs/SF…………………………………....92

xii
Table 20: Effect of Plan 2 on Maintenance Costs/SF……………………………..……..93
Table 21: Effect of Plan 3 on Maintenance Costs/SF…………………………..………..94

xiii
LIST OF FIGURES
Figure 1: Merged Research and Benchmarking Methodologies………….…………….…7
Figure 2: Generic Benchmarking Process (As adapted from Camp, 1989)……………...13
Figure 3: Camp-Xerox Benchmarking Model and Planning Phases (As adapted from
Camp, 1989)………………………………………………….………….….…14
Figure 4: Spendolini’s 5 Stage Benchmarking Model (As Adapted from Spendolini,
1992)………………………………………………………………….…….…16
Figure 5: Previous Report Data: Example Creation of Range Values……………...……48
Figure 6: Industry-Wide O & M Survey Flow………………………….………..………51
Figure 7: Front Page of Excel Cost File……………………………………...…………..53
Figure 8: Email invitation to participate in survey………………………………………54
Figure 9: Multi-Facility Excel File Screenshot…………………………………………..55
Figure 10: Data Merging Process………………………………………………………..56
Figure 11: Frequency of Satisfaction Survey Use (Raw Data)……………………….….63
Figure 12: Frequency of Satisfaction Survey Use (Other Category Integrated)……...….64
Figure 13: Satisfaction Survey Use………………………………………………..……..65
Figure 14: Benchmarking Plans……………………………………………….…………67
Figure 15: O & M Survey: Type of Space Reported On………………….……………..69
Figure 16: O & M Survey: Building Size Category Distribution……………….……….70
Figure 17: Hypotheses and Research Variables………………………………………….71
Figure 18: Pilot Survey Respondent Location…………………………...………………75
Figure 19: Pilot Survey: Respondent’s Highest Level of Educational Attainment…...…75

xiv
Figure 20: Pilot Survey: Respondent’s Primary Role / Job Title………………….……..76
Figure 21: Pilot Survey Janitorial Costs…………………………………………………76
Figure 22: Pilot Survey Utility Costs…………………………………………………….77
Figure 23: Pilot Survey Maintenance Costs………………………………………..…….77
Figure 24: Pilot Survey Satisfaction with Janitorial Services…………………..………..78
Figure 25: Pilot Survey Satisfaction with Energy Management Efforts…………...…….78
Figure 26: Pilot Survey Maintenance Expense Allocation……………………...……….79
Figure 27: Satisfaction Survey Frequency by Facility Size (2,000-5,000,000 RSF)…….84
Figure 28: Satisfaction Survey Frequency by Facility Size (2,000-1,000,000 RSF)…….84
Figure 29: Maintenance Costs/SF by Facility Size (2,000-5,000,000 SF)……………....85
Figure 30: Maintenance Costs/SF by Type of Space Reported on………………………86

xv
LIST OF ABBREVIATIONS
ASTM (American Society for Testing & Materials)
BOMA (Building Owner’s Management Association)
BSC (Balanced Scorecard)
FM (Facilities Management)
GSF (Gross Square Feet)
IFMA (International Facility Management Association)
KPI (Key Performance Indicator)
O & M (Operations & Maintenance)
RSF (Rentable Square Feet)
SF (Square Foot)
TPY (Times Per Year)

CHAPTER 1: INTRODUCTION
PURPOSE OF STUDY
The objective of this thesis was to develop, administer, and analyze an industry-
wide benchmarking survey on facility operations and maintenance costs and practices
and to bridge the knowledge gap between facility benchmarking and performance
management (Simoes et al., 2011). A fundamental function of facility management is to
manage and decrease the costs associated with the operations and maintenance of
physical assets in support of a greater organizational mission. The nature of this function
is such that the pursuit of continual improvement must always be at the forefront to
remain competitive in a quickly changing market with ever increasing costs.
Benchmarking is a widely used strategy to achieve goals of continual improvement, but
not much is known about how the facility management (FM) industry is utilizing these
techniques to guide their performance management strategies. In an effort to address this
knowledge gap, this thesis will provide information on industry trends and best practices
in the use of customer/occupant satisfaction surveys and assess industry awareness and
use of benchmarking plans for continual improvement. Practices in both of these
techniques will be benchmarked and analyzed in terms of their effect on the maintenance
costs/SF, a widely used KPI for the FM industry.

2
PROBLEM STATEMENT
The literature on facility-oriented benchmarking has primarily been published in
the last two decades as the continual improvement technique has been adapted from the
general business community and applied to the practice of managing facilities and
physical assets. In comparison to the amount of literature on benchmarking, facility
benchmarking research tends to be scarce. Camp (1989) and Spendolini (1992) both
considered the purpose of benchmarking to be taking action based on best practices to
seek continual improvement. The literature on this topic, however, is primarily in the
form of brief case summaries or anecdotal tales of success in using the process. This is
because the process of taking organizational action on the results of benchmarking
studies is an internal process undertaken by the organization. Details of this process are
not always readily published as they potentially provide proprietary information about the
inner workings of a company. Consequently, little is known about industry trends in
taking action and even less known about how the FM industry is utilizing benchmarking
data to seek continual improvement. There exists almost no literature on methods for
evaluating large scale industry-wide competitive benchmarking surveys.
Within the FM research literature, a commonly emphasized and utilized KPI, or a
best practice, is that of customer/occupant satisfaction surveys. Customer satisfaction is
consistently considered to be one of the most important KPIs for industry at large, as well
as for FM (Briscoe, 2001; Haveerila, Martinsuo. & Maumann, 2013; BIFM, 2004;
Walters, 1999; Meng & Minogue, 2011; Lavy et. al, 2010; Fibuch & Van Way, 2013).
Surprisingly little is known about how FM organizations approach the use of

3
customer/occupant satisfaction surveys in general and its role in FM performance
management, with some authors noting that it is often difficult to link soft data, such as a
customer satisfaction scores, to hard costs more closely related to primary FM functions
(Wong et al., 2013).
Complicating the issue still further is a noted knowledge gap between facility-
oriented benchmarking and facility performance management (Simoes et al., 2011). In a
review of 251 articles on maintenance performance management, Simoes et al. (2011)
noted that only 11% of articles even mention benchmarking. This suggests there may be a
professional disconnect on how to utilize benchmarking to assist in performance
management and continual improvement.
RESEARCH GOALS AND OBJECTIVES
There are three research objectives for this thesis. One objective was to develop
profile of how FM organizations are implementing customer/occupant satisfaction
surveys as well as FM approaches to taking action on competitive benchmarking surveys.
There is no readily available data on these topics and assessing this information will
further the body of knowledge on this topic.
A second objective of this research was to determine differences in the use of
customer/occupant satisfaction surveys and their effect on the performance KPI of
maintenance costs/SF. As an identified facility best practice, understanding the role that
these surveys play in the management of facility performance helps to bridge the
knowledge gap between benchmarking and facility performance management.

4
A third objective of this research was to assess how various methods for taking
action on benchmarking data representing various levels of benchmarking sophistication
effect maintenance costs/SF. Differences between these methods may help to drive
strategies for bridging the gap between benchmarking and performance management.
HYPOTHESES
A total of six hypotheses were developed based upon the three areas of research
objectives. These hypotheses are grouped into two primary groups, customer satisfaction
and benchmarking plans. The hypotheses were developed to test for differences in the
dependent variable, maintenance costs/SF, caused by the independent variables of
customer satisfaction and benchmarking plans. Differences in the grouping or covariables
of type of space reported on and RSF were also tested to further objective 1 and provide
insight into making meaningful facility benchmarking comparisons in a diverse group of
facilities.
CUSTOMER/OCCUPANT SATISFACTION AND PERFORMANCE MANAGEMENT
HYPOTHESIS 1: The use of satisfaction surveys will have an impact on maintenance
costs/SF. A two-tail t-test was used to assess this hypothesis.
HYPOTHESIS 2: The frequency of use of satisfaction surveys will have an impact on the
maintenance costs/SF. This hypothesis was tested using an ANOVA and post-hoc t-tests.

5
HYPOTHESIS 3: The size of the facilities will affect frequency of satisfaction survey
use. This hypothesis was tested using an ANOVA and post-hoc t-tests.
BENCHMARKING PLANS AND PERFORMANCE MANAGEMENT
HYPOTHESIS 4: Those who are uncertain of how to utilize the benchmarking data will
have higher maintenance costs/SF than their counterparts. A two-tail t-test was used to
assess this hypothesis.
HYPOTHESIS 5: Those who do not intend to take action on the benchmarking data will
have differing maintenance costs/SF than their counterparts. A two-tail t-test was used to
assess this hypothesis.
HYPOTHESIS 6: The following benchmarking plans will not have an effect on
maintenance costs/SF: Gauging company performance, Identification of best practices,
and use in a performance model. A two-tail t-test was used to assess this hypothesis with
each of the three benchmarking plans.
RESEARCH SCOPE
The volume of data contained within the parameters of the industry-wide
benchmarking survey that was developed and administered is immense. The survey
provides data on North American facilities representing over 2,629,749,032 Exterior
Gross Square Feet (GSF) and over 1,782,535,342 Rentable Square Feet (RSF). A total of
2,568 facilities participated in this survey that consisted of over 150 questions. The large

6
dataset necessitated careful management of the thesis scope, and to address only the
information gathered through the literature review that was most pertinent to the
benchmarking plans and the use of customer/occupant satisfaction surveys. The data in
this analysis was limited to North American facilities who completed the questions on the
independent variables in this study. Since not every participant answered these questions,
a total of 1,565 surveys were identified as meeting this criterion for the analysis.
RESEARCH METHODOLOGY SUMMARY
The research methodology for this thesis included a five-phase research
methodology melded with a five-step benchmarking model to guide the process based on
Spendolini’s five stage benchmarking model (1992) (See Figure 1: Merged Research and
Benchmarking Methodologies). This model was selected for its simplicity and origination
in general business consultation. Research into benchmarking models suggests that
despite their differences, they all have a common core of phases that accomplish the same
fundamental steps (Fernandez, McCarthy, & Rakotobe-Joel, 2001).

7
Figure1: Merged Research and Benchmarking Methodologies
SIGNIFICANCE OF STUDY
This thesis provides insight into the current practices and hard costs in facility
operations & maintenance throughout North America as well as providing a documented
example of the development, administration, and analysis of an industry-wide O & M

8
competitive benchmarking survey. This study also provides a snapshot of how the FM
industry is utilizing the best practice of customer/occupant satisfaction and its
relationship to maintenance costs/sf and facility variables related to size. Another
contribution that this thesis makes to the field of facility management is to document and
assess the various approaches that FM organizations are using to take action on their
benchmarking data. This helps to bridge the knowledge gap between benchmarking
efforts and performance management strategies for the FM profession.
DEFINITION OF TERMS
The following terms are defined due to their regular use throughout this thesis.
The survey collected data on both GSF and RSF, as RSF is the basis for the dependent
variable, maintenance costs/RSF. The Subject Matter Experts (SMEs) consulted with the
development of the survey, chose to use the older term, RSF, in the survey, rather than
using the updated terms, Plannable Gross Area. This is discussed further in SME
Contributions in the Research Methodology section of this paper.
Gross Square Footage (GSF) (ASTM E 1836-01): The sum of the floor areas on
all levels of a building that are totally enclosed within a building.
Rentable Square Foot (RSF) (ASTM E1836-08: 2008): Basis for most benchmark
calculations. To measure rentable area, subtract major vertical penetrations, interior
parking space, exterior walls and void areas from the gross area.
Plannable Gross Area (ASTM E1836-08:2016): The gross area minus exterior
walls, major vertical penetrations and interior parking spaces: the portion of a floor that is
totally enclosed within the interior face of perimeter encroachments at the floor plane and

9
where there are no perimeter encroachments enclosed at the inside finished surface of the
exterior walls. This is an updated term replacing RSF as of 2016.
SUMMARY OF CONTENT
This thesis documents the development, administration, and analysis of a facility
operations & maintenance competitive benchmarking survey. It further documents the
identification of industry best practices and the testing of hypotheses to examine the
knowledge gap between facility benchmarking and performance management.
• Chapter 2 is a literature review of facility benchmarking best practices and
discusses the best practices of customer satisfaction and benchmarking
plans.
• Chapter 3 is a detailed explanation of how the benchmarking survey was
developed, administered, cleaned, and managed.
• Chapter 4 presents the raw data and descriptive statistics on the variables
used in hypothesis testing. This section also reviews the hypotheses and
introduces how the analyses were conducted.
• Chapter 5 presents the results from the analyses and hypotheses testing.
• Chapter 6 is a discussion of possible interpretations for the results of the
analyses and draws conclusions from the research.

CHAPTER TWO: LITERATURE REVIEW
INTRODUCTION
Benchmarking is a tool that was developed in industry as a means of comparative
performance evaluation for the purposes of continual improvement (Camp, 1989). There
are a number of different types of benchmarking that have evolved over time in an effort
to keep up with a rapidly changing business environment and organizational needs to
remain ever more competitive. Watson (1993) described the evolution of benchmarking
as having begun in the 1940’s with first generation reverse benchmarking. This was
followed by competitive benchmarking, process benchmarking, strategic benchmarking,
and global benchmarking. Other research proposes that benchmarking can be classified
according to: the nature of the comparison (internal, competitor, industry, generic, &
global); the content of the benchmarking (process, functional, performance, & strategic);
and the purpose of the relationship (competitive or collaborative) (Fong, S., Cheng, E., &
Ho, D., 1988). Functionally, however, benchmarking can be broken down as either
internal or external to the company or organization. Regardless of the subject of the
benchmarking, the partnering or comparison process will always be either internal or
external (Anand & Kodali, 2008).

11
BENCHMARKING HISTORY AND MODELS
Despite having a history dating back to at least the 1940’s, benchmarking did not
become a widely utilized organizational tool until Robert Camp’s book, “Benchmarking:
The search for industry best practices that lead to superior performance” (1989). This
book provided the first detailed description of the benchmarking process to the general
business audience and its publication coincided with the Xerox company receiving a
Malcolm Baldridge Quality Award. The emergence of Camp’s book outlining the Xerox
methodology to benchmarking, along with the publicity and interest brought on by the
Baldridge Award propelled Xerox and their benchmarking methodology to become
highly sought-after by the business public (Spendolini, 1992; Yasin, 2002). Camp, while
working at Xerox in the late 1970s, is credited with having initiated the very first
benchmarking projects to address the higher production costs of photocopiers in the
United States compared to their Japanese counterparts. The efforts of their benchmarking
initiatives were able to provide valuable insights into their production efficiency and
design, which they in turn were able to use to reduce the costs of manufacturing their
equipment. The Baldridge Award recognized this achievement and facilitated the sharing
of Xerox’s knowledge with the business community (Yasin, 2002).
The work of Robert Camp and his associates at Xerox became the basis for the
working definition of benchmarking, “The search for industry best practices that lead to
superior performance” (Camp, 1989, p. 12). Camp considered the basic philosophical
steps to the generic benchmarking process to be:
1. Know your operation

12
2. Know the industry leaders or competitors
3. Incorporate the best practices
4. “Gain Superiority” (Camp, 1989, p.4)
Understanding the generic benchmarking process is crucial to effective benchmarking
(Figure 1: Generic Benchmarking Process). Benchmarking consists both of metrics and
processes (methods). Benchmarking should be initially approached by investigating
industry practices and determination of metrics should be determined based upon those
practices. It is the practices that give rise to differences in performance outcomes and
must be linked to the differences in metrics. Metrics without practices, and practices
without metrics provide little in terms of meaningful methodologies for continual
improvement. Together, however, they provide a quantification of goals and methods for
achieving those goals (Camp, 1989).

13
Figure 2: Generic Benchmarking Process (As adapted from Camp, 1989)
Robert Camp, through his work at Xerox helped to develop a Ten-Stage
Benchmarking Model which provides examples of how the process is applied to logistics
and distribution (Camp, 1989; Spendolini, 1992). He elaborated in great detail upon the
model and example applications based upon his experience with them in his book titled
after the working definition of benchmarking, “The search for industry best practices that
lead to superior performance”. Camp’s Model proposes that there are five primary phases

14
in benchmarking methodology that can best be represented by 10 distinct steps that
through a process lead to maturity and actualization of improvement.
Figure 3: Camp-Xerox Benchmarking Model and Planning Phases (As adapted from
Camp, 1989).
Building upon the spike in public interest brought about by the Baldrige Award
and Camp’s publication, Spendolini (1992) delineated a benchmarking method consisting

15
of five stages based upon his work as a business consultant. His approach to
benchmarking marked the first general business approach to benchmarking, whereas
Camp’s approach had been developed specifically rooted in logistics and supply chain
management (Camp, 1989). Spendolini defined benchmarking as “A continuous,
systematic process for evaluating the products, services, and work processes of
organizations that are recognized as representing best practices for the purpose of
organizational improvement” (Spendolini, M., 1992, p. 9). Spendolini argued that the
ideal shape of the benchmarking model should be circular in nature, so as to reflect the
process of continual improvement and recycling that an organization goes through as it
identifies gaps, makes changes, and remeasures in the pursuit of perfection.
Spendolini’s (1992) five-stage benchmarking methodology. These five stages include:
1. Benchmark Identification
2. Forming a Benchmarking Team
3. Soliciting Benchmarking Partners
4. Collecting and Analyzing Benchmarking Information
5. Taking Action

16
Figure 4: Spendolini’s 5 Stage Benchmarking Model (As Adapted from Spendolini,
1992)
The benchmarking process is a continuous one and is usually depicted as a wheel
of stages for representation of the ongoing nature of the process (Khurrum S. Bhutta &
Faizul Huq, 1999). The initial stage of the planning process includes making a decision as

17
to the benchmarking model that will be employed to guide the benchmarking process.
There are numerous benchmarking models in published literature, all of which contain
common themes but have varied in the number of phases and steps, phases ranging from
two to seven and steps varying from five to twenty-one (Anand & Kodali, 2008). Camp’s
(1989) original model included as many as 10 distinct steps to the benchmarking process.
Building upon the works and models of individuals like Camp and Spendolini,
many benchmarking models have been published and even more have been modified and
incorporated into corporate unpublished models. Many have been created from the core
methodologies and adapted to fit the individual needs of the organization, much like
adaption of best practices. It has been noted that the models simply provide a framework
that must be flexible to adapt to the individual needs of an organization (Emulti &
Kathwala, 1997). In an analysis of six leading published benchmarking models, all
models were found to have five general phases in common despite the varying purposes
or styles of the application. These five phases include planning, analysis & data
collection, comparison & results, change, and verification/ maturity (Fernandez,
McCarthy, & Rakotobe-Joel, 2001).
In a more recent review of benchmarking models, thirty-five published
benchmarking models were compared and classified according to the following
categories: Academic & Research -based Models, Consultant/Expert-based Models, and
Organizationally-based Models (Anand & Kodali, 2008). The Consultant/Expert based
models accounted for 48% of the models studied, which the authors suggest highlights
the use of benchmarking by practitioners, since Academic & Research based models

18
account for 26% of the sample (Anand & Kodali, 2008). All of the models were analyzed
and a universal benchmarking model comprised of twelve phases and fifty-four steps was
created based upon the analysis. This model is proposed to incorporate all best practices
and suitable procedures for all types of benchmarking for the purpose of eliminating
common pitfalls in the benchmarking process (Anand & Kodali, 2008).
The importance of conducting benchmarking in the context of a model is to
ensure that the benchmarking efforts are within the context of a plan for action. Models
provide the guide for turning numbers into metrics and then actions for the purpose of
achieving goals and/or producing results (Stauffer, 2003).
In addition to the identification of best-in-class performance, it is important to
continue to record and compare the worst-in-class performance as well. There is a
tendency in benchmarking to focus on the best, but the worst should be included in
analysis as well for a more accurate picture of performance and how that may change
over time (Stauffer, 2003).
An essential aspect of best practices for facility benchmarking is the identification
of the business needs of the facilities being managed. Benchmarking is purely superficial
unless it is rooted in what is needed, rather than what is easy to acquire. This may require
some creativity but should result in measures that can be applied to action and are linked
to strategic business planning, company goals, and objectives (Stauffer, 2003; IFMA,
2014; Camp, 1989). Part of the process of identifying needs is the formal recognition that
improvements can be made and compared to the best in class processes of similar
buildings (Stauffer, 2003).

19
In order to ensure that the benchmarking process will ultimately lead to increased
performance for company objectives, it is necessary to employ proper participative
mechanisms. Senior leaders and management must be involved in the process in order for
the benchmarking efforts to truly be effective (Camp, 1989). All staff impacted by the
benchmarking should also be brought into the fold in some manner to ensure their
investment in the process. The purpose of the benchmarking and the goals should be
disseminated among the participants and motivational or engagement techniques such as
incentives will help to ensure that the benchmarking is recorded and undertaken for
accuracy, resulting in better performance of the building. Further, the benchmarking
process must be made to be beneficial to all participants involved in the benchmarking
studies to ensure continued involvement from the best-in-class performers (Stauffer,
2003; Spendolini, 1992; Camp, 1989). This means that in order for your data to be truly
representative of industry, it needs to include the best-in-class and worst-in-class, so there
must be incentive for all to continue providing data.
The identification of current best practices in benchmarking for construction and
facility management will need to incorporate the best practices utilized by other fields,
while adapting them to fit their individual needs. Best practices cannot simply be
transferred and imposed, but must be adapted to individual organizations (Bhutta, K.S. &
Huq, F. 1999: Fibuch et al., 2013).

20
EFFECTIVENESS OF BENCHMARKING
There exists an abundance of literature demonstrating the effective use and
application of benchmarking to improve organizational performance. The evidence for its
effectiveness is generally presented in the form of case studies of organizations who
implemented the benchmarking process and saw process improvement over time (Camp,
1989: Spendolini, 1992: Fernandez, McCarthy, & Rakotobe-Joel, 2001).
Some of the documented organizational benefits of benchmarking include:
• Determination of measures of productivity (Allan, 1993)
• Supports competitive performance (Camp, 1989)
• Creates industry awareness of best practices (Camp, 1989: Shetty, 1993)
• Provides dramatic leaps in organizational performance (Sedgwick, 1995)
The literature on the topic of benchmarking is generally geared towards the
practitioner rather than the academic or research scientist. Hard data may often be
missing from these studies as it is often considered proprietary information of a private
organization or a small partnership of organizations. Further, the nature of benchmarking
as a process is often best presented through time-series data to demonstrate the impact
that it has at an organizational level (Camp, 1989). Research and academic studies on the
effectiveness of benchmarking are in need as are studies examining the broader use of
benchmarking, linking it to organizational performance management, and trying to
quantify its effectiveness at an interorganizational competitive level (Collins, Rosetti,
Nachtmann, & Oldham, 2006).

21
A number of researchers have noted that the data analysis aspect of benchmarking is
in need of further research and refinement (Collins et al., 2006: Wong, Leung, &
Gilleard, 2013; Yasin, 2002: Bhutta & Huq, 1999). The typical tools used by practitioners
to study benchmarking results include methods such as, “flow charts, matrix analyses,
spider charts, and Z-charts” (Collins et. al, 2006, p. 432). The problem with the rather
simplistic tools used to conduct benchmarking analyses is that these tools are incapable
of evaluating the data for the purpose of identifying performance gaps and the processes
needed to take action and correct those performance gaps.
Previous research has also indicated that disparate analyses techniques and statistical
methods can make determination of best-in-class performance difficult (Rodier, 2001).
One study proposes the use of multi-attribute utility theory as a means for overcoming the
difficulties in determination of best in class performance (Collins, et. al., 2006). Other
research indicates that the adoption of best practices tends to be governed by similarity of
data, organizational size, and resource constraints (Hinton, Francis, & Holloway, 2000).
A recent study, Wong et al (2013) notes that current facility management
benchmarking tends to be rather simplistic in its analysis and is in need of further
refinement and more complex tools to analyze benchmarking data. The authors note that
relationships between hard cost data and quality focused data such as customer
satisfaction can be complex and tend to be problematic. The true nature of their
relationship may not be detected through simple statistical analysis. They suggest that the
use of more sophisticated techniques that utilize a balanced performance measurement
system will allow facility managers to more effectively manage their performance. One

22
such system that the authors discuss and delineate through a case example is the use of
Data Envelopment Analysis (DEA) in analyzing benchmarking data. This analysis is a
linear programming technique based upon an Input-Process-Output system that can
establish an overall performance evaluation in terms of efficiency.
An early comprehensive review of benchmarking literature from 1986-2000 (Yasin,
2002) uncovered some significant knowledge gaps and problems in the benchmarking
literature:
1. The academic community lacks proper models or frameworks for managing the
complex nature of organizational benchmarking.
2. Benchmarking research and applications lack a system-wide approach.
3. The literature lacks methodologies for quantifying the costs and benefits of
benchmarking.
4. Benchmarking development and utilization occurs primarily in service-based
sectors. Manufacturing organizations are trailing behind the innovations of service
organizations.
There is large-scale interorganizational evidence to support the effectiveness of
benchmarking as a means of improving performance and costs savings. A growing
number of states and cities are requiring benchmarking energy rankings for large
buildings in their jurisdiction. A study on the effects of this public benchmarking process
indicate that in just the first few years since these laws were implemented, there has been
a significant 2-3% reduction in energy consumption in those districts. (Palmer & Walls,
2015).

23
FACILITY MANAGEMENT BENCHMARKING
Facility Management focused benchmarking research tends to be harder to find.
Though it has already been suggested that benchmarking research can be problematic and
is in need of further refinement (Collins, et. al., 2006), facility-based benchmarking
research has the same set of difficulties and even less research literature to work with
(Wong et al., 2013)
Spendolini and Camp had worked extensively for business organizations on
matters of business directly related to the core objectives of the companies (Spendolini,
1992: Camp, 1989). This work was being done at a time when Facility Management was
perceived primarily as cost-center operation, or simply as the cost of doing business.
There exists little research from the 1980s on benchmarking in facility management.
This may largely be due in part to the fact that it was not until there was a significant
amount of outsourcing in the 1990s of facility management services that the profession
really began to develop in an effort to better manage rising building costs (Loosemore &
Hsin, 2001). An early survey given to facility management professionals “Depicts a
fragmented facilities management profession that has an introspective, crude, and
unimaginative approach to measuring facilities performance” (Loosemore & Hsin, 2001,
p. 464). Though benchmarking in FM began to appear in the mid-1980s with IFMA,
early efforts focused primarily on financial indicators and demographics (Pitt & Tucker,
2008).
Since that time facility management research has increased along with an interest
in aligning the goals of facility management to core business objectives through

24
performance management and the utilization of performance modeling techniques
utilizing Balanced Score Cards (BSCs) and Key Performance Indicators (KPIs)
(Amaratunga, Baldry & Sarshar, 2000: Amaratunga, Haigh, Sarshar, and Baldry, 2002:
Rasila, Alho, & Nenonen, 2010; Meng & Minogue, 2011).
PERFORMANCE MANAGEMENT AND BENCHMARKING
Research into the validity of subjective and objective measures suggests that both
have an equivalent construct validity and thus both should be used as a means of
performance measurement (Wall et al., 2004). This benchmarking should incorporate
both type of measures for more accurate assessment.
In an extensive literature review and analysis of 251 articles related to
maintenance performance measurement in the UK manufacturing sector, only 11% of the
articles referred to benchmarking, despite its fundamental importance to the continual
improvement process (Simoes et al., 2011). This suggests that there may be a knowledge
gap in maintenance performance modeling literature and the applied benchmarking
process. As noted by Yasin (2002), the manufacturing industry tends to be significantly
behind service based industries in regard to benchmarking innovation & application.
Many of the functions of Facility Management are evaluated based upon
performance, such as maintenance, utility, and janitorial. A previous study on the
distribution of performance models in the UK Facility Management industry identified
three performance models that have generally found to be more effective than their
counterparts. These are the Balanced Scorecard (BSC), Key Performance Indicators

25
(KPIs) and the Business Excellence Model (BEM). While the BSC and KPI approached
to performance management have seen adoption in North America, the BEM model is
typically only seen in European organizations and research. Selection of the appropriate
performance models and indicators is essential in planning the benchmarking process for
proper evaluation of performance (Meng & Minogue, 2011).
BALANCED SCORECARDS (BSCs)
The Balanced Scorecard (BSC) was developed as a result of a year-long study
completed with 12 business organizations to develop a “set of measures that gives top
managers a fast but comprehensive view of the business” (Kaplan & Norton, 1992, p.71).
The Balanced Scorecard includes financial measures relating to action already undertaken
and operational measures that serve as the drivers of anticipated financial performance
and future actions. The Balanced Scorecard links all these performance measures through
strategy, rather than control, to demonstrate how results are achieved by providing
answers to the following four questions:
1. Customer: how must we look to our customers?
2. Internal processes: what internal processes must we excel at?
3. Financial: how will we look to the shareholders
4. Innovation: how can the organization learn and improve?
The use of the four perspectives is to ensure that major stakeholders in the
business (customers, employees, shareholders) all contribute towards a more holistic
view of the organization and is found to guide management with a balanced view of the

26
business itself. Through the use of the BSC, an organization can monitor its performance
through both hard and soft performance measures, and both quantitative and qualitative
data (Dilanthi Amaratunga, David Baldry, & Marjan Sarshar, 2000). A scorecard may
utilize anywhere from eight to 16 measures (2-4 measures per each perspective), so care
should be taken to utilize only the most important performance indicators (KPIs) or
critical success factors (Rasila, Alho, & Nenonen, 2010). Using this process in the
context of maintenance management ensures that maintenance strategy can be linked to
overall business strategy (Kumar, Galar, Parida, Stenström, & Berges, 2013).
Research has documented that companies who are using an integrated and balanced
performance measurement system, such as the Balanced Scorecard (Kapan & Norris,
1992) perform better than those who do not use such a performance measurement system
(Lingle & Shiemann, 1996; Kennerly & Neely, 2003: Parida & Kumar, 2006). Multiple
applications of the Balanced Scorecard approach to performance management in the FM
industry can be found in the literature, generally supporting improved performance
results with adherence to this methodology (Amaratunga et al., 2002; Rasila et al., 2010;
Amaratunga et al., 2000).
KEY PERFORMANCE INDICATORS (KPIs)
The use of KPIs in an FM setting can provide advantages such as the focusing and
prioritization of managerial efforts, use in service provider selection, and through the
facilitation of a defined outcome along with methodologies for monitoring and control
(Meng & Minogue, 2011).

27
A previous survey indicated that respondents approach the ranking of KPIs
differently from a FM based perspective than they would if they were ranking them from
a business perspective (Hinks, 2004). Lavy et. al, (2010) further reports findings from a
survey conducted at the Facility Management Association “Ideaction” conference that
took place in Melbourne, Australia in 2001 where attendees ranked KPIs differently
according to whether they were engaging in a business vs. a facility management
perspective. One of the only KPIs to be ranked as consistently important despite the
perspective was customer satisfaction.
A survey and interview of seventy-three FM leaders in the UK found the following 10
KPIs as the most utilized across industry (Meng & Minogue, 2011):
1. Client satisfaction
2. Cost-effectiveness
3. Response time
4. Service reliability
5. Health
6. Safety
7. Environmental compliance
8. Staff commitment
9. Client-service provider relationship
10. IT application
A considerable amount of research has gone into the identification and categorization of
KPIs utilized for the purpose of facility management. A previous study (Amaratunga &

28
Baldry, 2003) indicated that KPIs could be organized into the following categories: FM
internal processes, customer relations, learning & growth, and financial implications.
Another study (Augenbroe & Park, 2005) divided facility KPIs into four additional
categories that include energy, lighting, thermal comfort, and maintenance. Parida &
Kumar (2006) identified the following core maintenance performance indicator
categories: customer satisfaction, cost, equipment, maintenance tasks, learning & growth,
health, safety & environment, and employee satisfaction. More traditional approaches to
maintenance performance tended to be dominated by two types of indicators, Key
Performance Indicators evaluated periodically, and detailed indicators, used for
examining deviations in the key indicators (Simoes et al., 2011).
A more comprehensive study (Hinks & McNay, 2005) reviewed over 172 identified
facility KPIs and proposed that those KPIS could be best represented by eight categories:
1. Business benefits
2. Equipment
3. Space
4. Environment
5. Change
6. Maintenance/services
7. Consultancy
8. General
With so many different KPIs being utilized in the diverse spectrum of facilities and
the varying needs of the organizations they represent, the proper categorization of KPIs is

29
important as it provides a valuable way for organizations to quickly develop and utilize
the measures that will best serve them. Some organizations will simply have no use for
KPIs that another facility would see as integral to their operation. Based upon a literature
review of KPI categorization studies, Lavy et. al. (2010) proposes a categorization
strategy of facility KPIs that uses the following four categories: financial, physical,
functional, and survey based.
As a potential solution to the diversity and multitude of KPIs utilized by the facility
management industry, Lavy, Garcia, & Dixit (2014a, 2014b) proposed the development
of wholistic facility KPIs that are more representative of overall facility functioning and
performance. They identified, categorized, and derived expressions for a set of core
indicators that includes:
1. Maintenance efficiency
2. Replacement efficiency
3. Condition Index (CI)
4. Functional index
5. Indoor/outdoor environmental quality (IOEQ)
6. Absenteeism
7. User perception (satisfaction)
BENCHMARKING FOR SATISFACTION
Customer or client satisfaction has been considered critical to the benchmarking
process since it’s origin at Xerox (Fibuch & Van Way, 2013). It has been suggested that

30
the entire benchmarking process should be approached from the customer’s point of view
from the onset (Stauffer, 2003). Customer satisfaction has also been considered the top
KPI for Facility Management for a considerable time (Walters, 1999). Its adoption has
been noticed as a continually growing trend (J.M. Simões, C.F. Gomes, & M.M. Yasin,
2011). A number of authors suggests that customer satisfaction and/or service delivery is
critical to aligning facility performance with overall business objectives (Pitt & Tucker,
2008: Walters, 1999; Tucker & Smith, 2008). It is considered a holistically oriented core
indicator for facility management functions (Lavy et. al, 2014a, 2014b). Customer
satisfaction is without a doubt, the most widely recognized and utilized KPI in both the
general business and facility management industries. Based on the consistency and
volume of reports, it may arguably be the most important KPI for both as well (Briscoe,
2001; Haveerila,et al., 2013; BIFM, 2004; Walters, 1999; Meng & Minogue, 2011; Lavy
et. al, 2010; Fibuch & Van Way, 2013).
Several surveys of CEOs have ranked improving customer satisfaction and
customer loyalty among the top challenges faced by organizations (Briscoe, 2002; IBM,
2012). High levels of satisfaction and loyalty tend to lead to improved revenue and
profitability, as well as improved financial measures and stock prices (Haveerila,
Martinsuo, & Naumann, 2013). The British Institute of Facility Management (BIFM)
published a report in which the promotion of customer satisfaction was found to be one
of the most important facility issues for the next 15 years (BIFM, 2004). Meng &
Minogue (2011) found customer satisfaction to be one of the most widely utilized KPIs in
facility management. Lavy et. al., (2010) reported that facility managers regard customer

31
satisfaction as a top KPI regardless of engaging in a business or facility-based perspective
for ranking.
With customer satisfaction being such an integrally important KPI for facility
management, understanding how that KPI is being used to manage facilities and relating
it to hard performance indicators to quantify its impact upon performance is essential. It
has been noted that benchmarking satisfaction can be rather difficult as relationships
between quality-based soft metrics and the hard cost data essential to facility cost-
savings are difficult to detect through simple statistical analyses (Wong et al., 2013).
There are, however, a number of studies that have found customer satisfaction to be
directly related to functions of facility management. Customer satisfaction has been
found to be one of the major contributing factors towards project success (Cheung et al,
2000; Leung et al., 2004; Wang & Huang, 2006; Nzekwe-Excel et al, 2010; Kärnä, S. &
Junnonen, J., 2016).
Several studies have examined the role of customer satisfaction in relation to
maintenance services and strategy in facility management. User satisfaction was found to
negatively correlate with office maintenance downtime variance in a survey of facility
management professionals (Au-Yong, Ali, & Ahmad, 2015). End user satisfaction was
also found to correlate with proactive maintenance and negatively correlate with
corrective/breakdown maintenance (Rani, Baharum, Akbar, & Nawawi, 2015).
A growing body of research is reinforcing the idea that soft metrics, such as
customer satisfaction are just as essential to managing facility performance as harder
metrics, such as costs. Maintenance decisions tend to come to the optimal solution using

32
heuristics that are supported with qualitative and quantitative assessment data (Kumar et
al., 2013). Tucker & Pitt (2010) suggest that FM performance management should
develop a mixed –model utilizing both qualitative data pertaining to customer perceptions
of FM service, as well as quantitative data such as customer satisfaction. They contend
that simple quantifications of satisfaction are incomplete without gaining insight into the
perceptual processes behind the ratings. Understanding how to better provide facility
services requires a better understanding of the customer’s needs and perceptions. With
customer satisfaction being such a critical KPI for facility management, it is also
imperative to understand the factors that shape perception of services. It was found that
the three main drivers of customer satisfaction are, “the match between order and
outcome of an FM service, the transparency of the process, and solution orientation of
FM service employees regarding customer needs” (Coenen et al., 2013, p. 274).
BENCHMARKING FOR ACTION
Spendolini (1992) considers taking action as the primary purpose of
benchmarking. The motivation for engaging in the effort in the first place is to support a
process of continual improvement which denotes ongoing change. He generally regarded
this stage of the benchmarking process to be the most straight-forward and least
complicated as reported by the companies with whom he had worked (Spendolini, 1992).
Though the focus of a facility-based competitive benchmarking study is to
provide an external comparative basis for determination of performance standing in
comparable facilities, the action phase of the benchmarking process remains a primarily

33
internal organizational matter. Consequently, how companies take action based upon the
results of their external benchmarking studies is largely reported through case studies,
and that data rarely gets published as anything other than examples given in books
(Camp, 1989; Spendolini, 1992).
The academic literature is remarkably scarce, if not nonexistent, when it comes to
larger surveys about how the facility management industry takes action on the results of
their competitive benchmarking studies. It is known from the literature that facilities are
regularly using performance modeling techniques such as Balanced Scorecards and Key
Performance Indicators (Meng & Minogue, 2011) to link facility metrics to actionable
strategies within the organizations they represent. Beyond this, there is little to guide
research efforts on this aspect of benchmarking. With action being the primary purpose of
engaging in benchmarking, this is an area in need of further research and study.
BENCHMARKING SUMMARY
Benchmarking is a tool for performance management and continual improvement
that has readily been embraced by the business community since the late 1980s. Facility
management has trailed that embrace by a number of years as the field has grown and
become more sophisticated. The research literature clearly shows that the industry is
beginning to embrace a variety of techniques and metrics for managing facility
performance. Customer satisfaction is considered to be one of the most important metrics
for managing facility performance, yet there remains difficulty in linking such a metric to
changes in cost data. With the difficulty in linking this data, illumination of how facility’s

34
use and manage by customer satisfaction becomes an ever more important question to
answer. Further still, with the most important phase of the benchmarking process
considered to be the action phase, how are organizations taking action on the results of
their benchmarking studies. These areas are of great importance in understanding the
effectiveness of facility-based benchmarking and in need of further study and refinement.

CHAPTER 3: RESEARCH METHODOLOGY
INTRODUCTION
The methodology followed in this paper features a benchmarking model for guiding
the benchmarking process integrated into a research methodology applied to survey
content for the purposes of quantification of industry trends and testing of research
hypotheses developed from the literature. Spendolini’s (1992) Benchmarking Model was
adapted and customized to fit the unique demands of the researchers and FM
organization. The research methodology utilized in this study consisted of a six phase,
ten-step sequence that will be discussed in the next three chapters.
3.1.Identification of Industry Need: Benchmarking Information, Team, & Partners
3.2.Survey Development
a. Pilot Survey Administration
b. Refinement
c. Testing of Industry-wide O & M survey (Online)
d. Development of Excel Cost File
3.3.Data Collection: Deployment of FM Industry-Wide O & M survey
a. Development of Multi-Facility Costs File
3.4.Data Cleansing & Quality Management

36
The benchmarking model steps were incorporated into the corresponding steps of
the research methodology as they occurred during the timeline of the research
methodology (See Figure 1: Benchmarking Research Methodology). These phases often
overlapped.
The first three phases of the benchmarking model were incorporated into Steps
One and Two of the Research Methodology. In this circumstance, as researchers
participating in a benchmarking exercise, the majority of the fundamental decisions on
the nature of what to benchmark, the team, and the partners, was decided without
researcher influence. These benchmarking model steps, 1-3 (Determine what to
benchmark, Forming a benchmarking team, and Identifying benchmark partners) were
incorporated into the first step of the Research Methodology, with minor modifications
taking place during Step 2 of the Research Methodology. Step Four of the benchmarking
model coincides with Step 3 of the Research Methodology and is carried into Chapter
Four: Data Analysis. The Fifth Benchmarking Model Step, Take Action is incorporated
and carried out in Chapter Five: Results.
Table 1: Schedule of Research Methodology Execution
No Schedule Item or Event Date 1 Identification of Industry Need 08/2016 2 Survey development begins: SME Commentary 08/2016 3 Pilot Survey Administration 10/15/2016 4 Refinement 11/2016 5 Testing of Industry-Wide O & M Survey (Electronic) 01/2017 6 Development of Excel Costs File 01/15/2017 7 Deployment of Industry-Wide O & M Survey 02/13/2017 8 Development of Multi-Facility Costs File 02/15/2017 9 Closing of Industry-Wide O & M Survey 4/19/2017

37
10 Data Cleansing & Quality Management 04/20/2017 11 Analysis 08/15/2017
3.1 IDENTIFICATION OF INDUSTRY NEED: BENCHMARKS, TEAMS, AND PARTNERS
The benchmarking model steps included in this phase of the research were:
Determine What to Benchmark, Forming a Benchmarking Team, and Soliciting
Benchmarking Partners. The content for the subject of the survey was derived out of
industry need and funded by an FM organization for the purposes of updating existing
data. The content of these previous survey was utilized and was updated or revised based
upon input from research personnel at the FM organization and members of the
organization who were identified as Subject Matter Experts (SMEs). Additional content
was added to the survey based upon a research literature review of facility management
benchmarking practices.
This phase of the research methodology overlaps with the benchmarking
methodology in purpose and timeline. The FM organization funded this project out of an
identified industry need to update their benchmarking data that was collected in a
previous benchmarking report on facility operations & maintenance in 2009. This
previous report included information on facility characteristics, settings, and uses; utility
costs and consumption rates; maintenance costs and staffing; janitorial costs and staffing;
sustainability and green initiatives, facility practices and procedures, planning horizons,
and more. (See Appendix C: Industry-Wide O & M Survey). The content of this survey

38
was to be recreated for the purpose of providing their members with updated performance
data on managing the operations & maintenance functions of their facilities. Though the
majority of the survey content suggestions came directly from the FM organization, the
researchers were able to contribute minor suggestions to content based upon literature
reviews of benchmarking practices. Some of the contribution to the benchmarking
content included: Use of cost range value options, inclusion of satisfaction benchmarks,
and inclusion of benchmarking action strategies.
The benchmarking team for the development of this survey consisted of the FM
organization staff, twelve Subject Matter Experts (SMEs), members of the organization,
and researchers at UNC-Charlotte. The benchmarking partners in this process were
members of the FM organization, however, participation was also open to the general
public. Participation in the survey was incentivized by offering a copy of the
benchmarking report to all participants.
3.2 SURVEY DEVELOPMENT
FM ORGANIZATION CONTRIBUTIONS
The FM Organization was the most influential contributor to the development of
this survey. The purpose of the survey was to update an existing Research Report on
Facility O & M practices. The majority of the questions in this survey came from an
established survey question bank tat was established in previous versions of the survey. A
more recent attempt to update the survey in 2012 had resulted in low response rates and

39
survey abandonment leading to an incomplete data update. The goal with this survey was
to produce a survey with a greater response rate and response completion, as well as a
larger number of participants.
In addition to updating the existing data on facility O & M benchmarking, the FM
organization also wanted to add new material to the survey based upon their
identification of industry trends. A new section on security costs and practices was added
to the 2017 survey to capture industry practices regarding facility security. A new section
on technology was also added to capture practices regarding facility technology and
staffing.
SME CONTRIBUTIONS
As the content from the previous survey was developed into the modern survey
content it was repeatedly reviewed and modified according to commentary and input
from twelve identified Subject Matter Experts (SMEs) who assisted in both survey
content development and phrasing of questions. The Subject Matter Experts were
selected by the FM organization to consult on the content in the O & M survey. They
provided the industry expertise to ensure that the survey could be easily completed and
employed a language familiar to the FM industry. Throughout the survey development
process, the SMEs provided feedback on every question included in the Industry-Wide O
& M survey in regard to content, wording, presentation order & appearance, screen
appearance (for electronic comprehensive survey), and survey flow. Detailed notes and
specifics regarding SME conversations and contributions can be found in Appendix D:
SME Commentary and Appendix E: Survey Revisions & Changes. Feedback from the

40
SMEs was noted and incorporated into the survey content through email exchanges
between the FM organization staff, SME’s and the researchers. Some examples of SME
contributions that had significant impacts on the development of the survey include:
• SMEs suggested that the survey request calendar data from the last completed
fiscal year rather than a calendar year to facilitate greater response rates. SMEs
suggested that Facility Managers will not always have the data analyzed or
prepared based upon fiscal years (12/15/16)
• An SME suggested that the comprehensive O & M survey should use the term
“Rentable Square Feet” when referring to Facility Interior Square Footage rather
than the updated term “Plannable Area”. This term was defined by IFMA
originally in 1996 as the “Standard Practice for Building Floor Measurement” and
was later updated into an ASTM standard in 2008 called “E1836-08: Building
Floor Area Measurements for Facility Management,” that multiple FM and
building owner’s organizations could use as a standard by which to compare
buildings. This was primarily done to facilitate terms that could be used both by
IFMA and BOMA. This term was used in the 2009 O & M report. The SME
believed that the more familiar term from the 2009 survey would be more widely
recognized by facility professionals than the recently termed “Plannable Area” as
revised in 2016 under ASTM E18306-09M. Their definitions are effectively
interchangeable.

41
SME FEEDBACK INCORPORATION PROCEDURES
A number of the SMEs submitted question by question commentary and
suggestions. These questions were addressed by the researchers on an individual basis to
ensure that their feedback was understood and addressed into the comprehensive survey.
(See Appendix D: SME Commentary: See also Appendix E: Survey changes based on
SME commentary).
RESEARCHER CONTRIBUTIONS
In addition to the content in the previous benchmarking report, additional content
on organizational structure, agility, customer satisfaction use, action strategies,
performance modeling, security costs and staffing, and technology were added to the
survey based upon reviews of FM research literature. The use of cost range intervals
using the mid-point method was also introduced by the researchers (He & Hu, 2009).
PILOT SURVEY ADMINISTRATION
The pilot survey was developed in cooperation with twelve Subject Matter
Experts (SMEs) over a three-month period for the purpose of administering the survey at
a major FM conference in October 2016 (See Appendix B: Pilot Survey). The survey
consisted of four primary sections printed double-sided on a single sheet of heavy stock
lime green paper. It was distributed to participants at a luncheon workshop at a
conference for facility managers in October of 2016. Ten surveys were provided to each
table at the luncheon along with pencils to complete the survey. Additional surveys and

42
pencils were provided at overflow seating and at the back of the room. Respondents were
asked to simply leave their surveys on the table and at the end of the luncheon, the
surveys were collected by research staff.
The first section of the survey collected selected demographics and background
information (of the respondent and the buildings they manage), including their role / job
title, the number of buildings they manage, level of education, and number of years of
professional experience. The respondents were then asked to answer questions about the
largest and most active building they manage. The second section asked the respondents
to provide the estimated annual cost of janitorial services for their most active building as
well as their overall satisfaction on a 1-5 scale (1 = Very dissatisfied to 5 = Very
satisfied). Similarly, the third section asked about the respondents’ estimated annual
utility cost for their most active facility as well as their satisfaction with their
organization’s energy management / conservation efforts. The final section asked about
the respondents’ estimated annual maintenance cost and how that cost was allocated to
various categories of maintenance tasks (preventive, reactive, or predictive). This survey
was analyzed, and the data used to help refine cost range parameters for the
comprehensive industry survey to follow.
REFINEMENT
Results from the snapshot survey provided estimates of the range of costs
experienced in janitorial, maintenance, and utility functions of facility management.
These values were analyzed and compared to previous data to construct cost range

43
intervals that would result in an approximately normal distribution of frequency
responses.
CONSIDERATIONS FOR USING RANGES IN THE INDUSTRY-WIDE O & M
SURVEY
While the FM organization’s O&M benchmarking study has historically collected a
substantial amount of data, the number and quality of responses was likely being
hampered by the large volume of specific data being requested from the respondents. An
analysis of the abandoned sample data from the 2012 O&M Survey revealed the
following:
• Only 44% of the respondents who started the survey actually provided cost data
for all three major cost areas (janitorial, utilities, and maintenance).
• Fewer responses were received towards the end of the survey (janitorial: 65%
responded, utility: 50% responded, maintenance: 45% responded).The response
rate dropped off as the survey progressed through these blocks of questions.
• From those that actually responded, 39% of the respondents appeared to round
their cost numbers to the nearest $1K (10% of these rounded to nearest $10K).
Janitorial had the highest frequency of rounded values, with 55% of the responses
rounded to the nearest $1K (23% rounded to the near $10K or $100K level).
DEVELOPMENT OF RANGE INTERVALS
The researchers proposed an additional alternative option where respondents
selected from a “range” of values (as opposed to entering a specific number). For

44
example, if the user opted to use the “range” survey format, they would be presented with
the six options shown below for the question of, “What is the annual cost of external
building maintenance?”:
• $0 - $50,000
• $50,001 - $100,000
• $100,001 - $250,000
• $250,001 - $750,000
• $750,001 - $1,500,000
• More than $1,500,000
RANGE INTERVAL MIDPOINT CALCULATIONS
The next step in the process was to calculate the midpoints for each range and
assume that this resultant number was the respondent’s actual cost of external building
maintenance. For instance, a midpoint of the range of “$50,001 - $100,000” would be
$75,000.50 [($50,001 + $100,000) / 2 = $75,000.50). The underlying assumption is that
the ranges offered are based on the normal expected values for each cost category, based
on the historical O&M cost data. The “midpoint” approach assumes that the respondents
are close to the middle of each range. Table 2 below shows a sample of 6 responses and
how an average cost of external building maintenance was calculated.

45
Table 2. Example Mixed Responses to, “What is the annual cost of external building maintenance?”
Respondent Selected Answer Calculated Midpoint
Respondent 1 $50,001 - $100,000 $75,000.50
Respondent 2 $50,001 - $100,000 $75,000.50
Respondent 3 $250,001 - $750,000 $500,000.50
Respondent 4 $100,001 - $250,000 $175,000.50
Respondent 5 $250,001 - $500,000 $375,000.50
Respondent 6 $342,393 [chose to enter specific value]
$342,393
AVERAGE COST OF EXTERNAL BUILDING MAINTENANCE
$257,065.92
The use of ranges and subsequently asking fewer questions (for those who choose
the “range” route) was selected for providing the greatest chance of increasing overall
response rate. However, this comes at a cost of having potentially less accurate data; the
midpoint value is simply an average of each range. This risk was mitigated by providing
range choices based on historical trends and typical cost responses from past surveys.
The range approach will be sufficient to communicate a magnitude of order along various
O&M metrics and has been shown to have an equivalent validity in analysis of data (He
& Hu, 2009).

46
RANGE INTERVALS DEVELOPED WITHOUT PILOT SURVEY DATA
There were a number of cost subcategories that were not included on the pilot survey
for which range intervals had to be created. These costs categories included:
• External Building Maintenance Costs
• Interior Systems Maintenance Costs
• Roads & Grounds Maintenance Costs
• Utility & Central System Maintenance Costs
• Process Treatment/Environmental Systems Costs
The raw data from previous benchmarking reports was not available to the
researchers, so the available data from the older 2009 report had to be analyzed to create
survey choice options for all of the cost subcategories addressed in the comprehensive
2017 O & M Report. The Data available in these reports was in the form of Tables
presenting the Costs/RSF in a percentile ranking from 1-100, which made exact
recreation of the data impossible. The building RSF was also presented in a similar
percentile ranking table. See Table 3: Previous Report RSF Percentiles..
In order to create the range intervals to use in the Industry-Wide O & M Survey, the
size and costs/RSF ranking tables were multiplied to generate a range of possible costs.
The Table on Facility Rentable Area was multiplied by the values on the data table for
each of the subcategories of maintenance costs. See Table 4: Previous Report Costs *
RSF Percentiles.

47
Table 3: Previous Report RSF Percentiles
Facility Rentable Area Percentile Area (sf)
99 3911117 95 1199596 90 722457 75 350000 50 128,050 25 43,501 10 11458
5 5665 1 1982
Table 4: Previous Report Costs * RSF Percentiles
The values generated by this process were then sorted in an ascending order and
grouped into intervals such that the estimated frequency of responses per interval would
approximate a normal distribution of costs. See Figure 5: Previous Report Data: Example
Creation of Range Values.
External Building Maintenance Costs multiplied by Facility Rentable Area
Percentile $/RSF 99th% 95th % 90th% 75th% 50th% 25th% 10th% 5th%99 2.76 10794682.92 3310885 1993981.3 966000 353418 120062.8 31624.08 15635.495 1.11 4341339.87 1331551.6 801927.27 388500 142135.5 48286.11 12718.38 6288.1590 0.59 2307559.03 707761.64 426249.63 206500 75549.5 25665.59 6760.22 3342.3575 0.22 860445.74 263911.12 158940.54 77000 28171 9570.22 2520.76 1246.3
Median 50 0.1 391111.7 119959.6 72245.7 35000 12805 4350.1 1145.8 566.525 0.04 156444.68 47983.84 28898.28 14000 5122 1740.04 458.32 226.610 0.03 117333.51 35987.88 21673.71 10500 3841.5 1305.03 343.74 169.95
5 0.02 78222.34 23991.92 14449.14 7000 2561 870.02 229.16 113.31 0.01 39111.17 11995.96 7224.57 3500 1280.5 435.01 114.58 56.65

48
Figure 5: Previous Report Data: Example Creation of Range Values
The researchers utilized the cost feedback from the pilot survey to create cost
range values for use in the Industry-Wide O & M survey and continued to solicit
feedback from the FM organization and 12 SMEs on the development of the industry-
wide survey over a seven-month period from August 2016 through January of 2017.
External Building Maintenance435.01 0-2500870.021280.5
1305.031740.04
2561 2500-75003500
3841.54350.1
51227000
7224.579570.22 7500-15000
105001280514000
14449.121673.7 15,000-50,00025665.6
2817128898.3
3500048286.172245.7 50,000-150,00075549.5
77000120063142136158941 150,000-500,000206500353418388500426250 500,000-1,000,000801927966000
1993981 >1,000,000

49
The survey was originally developed in MS Word and was later transferred to the
Qualtrics platform for online deployment. The Industry-Wide O & M survey was refined
on the Qualtrics platform through further feedback from organizational staff and SMEs.
After gathering this feedback, the revised pilot version of the Industry-Wide O & M
survey was run live for 46 SMEs and FM organizational participants as the final test run
of the survey. The survey was further revised based upon this test run and was prepared
for deployment.
TESTING OF INDUSTRY-WIDE O & M SURVEY (ONLINE)
The Industry-Wide O & M survey was tested with SMEs and volunteer facility
managers prior to the release of the survey to the public on February 13th, 2017. Feedback
gathered during this period included testing the Qualtrics based online questions for
logic, presentation, and errors. The Survey Questions were piloted and tested with the
SMEs and volunteers for ensure language, style, etc. were appropriate with the audience
and that the survey met the most comprehensive industry needs. SMEs and FM
Organization staff were tasked with trying to crash the survey and intentionally making
errors to check the survey for inconsistencies or other problematic behavior that could
represent an impediment to completing the survey in its entirety. Some of the problems
encountered and fixed during this stage of development included:
• Question order, presentation, and survey flow
• Identification of need to give participants a choice in how they could gather
and input their cost information for the survey (SME Recommendation).

50
Previous surveys allowed users to also submit an excel file of their costs,
allowing for completion of this section of the survey while not online.
The final form of the Qualtrics survey consisted of 134 questions, although not
every participant was asked every question as the survey was developed for presentation
logic that would eliminate unnecessary questions based upon responses to questions
earlier in the survey (See Appendix C: Industry-Wide O & M Survey). This was done to
avoid repetition and to facilitate a faster time to completion to combat survey fatigue. It
was organized into the following sections (blocks): General information, contact name,
facility description, janitorial, maintenance, maintenance plans, sustainability, utilities,
energy management practices, security, technology, organizational, costs section
introduction, costs-from-download management, costs-janitorial, costs-remaining
janitorial, costs-maintenance, costs-utilities, and organizational culture (See Figure 6:
Industry-Wide O & M Survey Flow). This survey required approximately 90 minutes for
the average participant to complete. Respondents did not have to complete the survey in
one sitting due to an IP address computer association tracked by the Qualtrics platform.
Participants could complete the survey in sections as long as they utilized the same
computer throughout the length of the survey. Figure 6 depicts the survey flow of
question presentation.

51
Figure 6: Industry-Wide O & M Survey Flow
The survey further offered a variety of formats for FM organizations to submit
their costs to the Qualtrics site. Respondents were given a choice as to how they would

52
submit their costs; either directly into the Qualtrics survey or manually into a provided
excel file that they could later manually upload to the Qualtrics site.
DEVELOPMENT OF MANUAL EXCEL COST FILE
An additional option of an excel file for providing data on specific facility costs
was provided to participants during the completion of the online survey. SMEs identified
the need for alternate options to provide cost information during the testing of the
Industry-wide O & M survey, as it had been an option in earlier versions of the survey.
Participants were given the option to download an Excel file for their cost information
that they could later upload into the original survey. The intent of the Excel Cost File was
to give participants more options for gathering the cost details they needed to complete
the survey. An Excel file was created to gather this cost information for merging into the
Master data set. See Figure 7: Front Page of Excel Cost File for a snapshot of the file and
see Appendix F: Manual Excel Costs File for screenshots of the complete excel file.

53
Figure 7: Front Page of Excel Cost File

54
3.3 DATA COLLECTION
DEPLOYMENT OF INDUSTRY-WIDE O & M SURVEY
The surveys were administered to IFMA members & the public through the
Qualtrics survey service. Respondents were invited to participate through emails blasts
and links to the online survey. The survey was open for a period of three months from
February 13th, 2017 until April 19th, and reminders were sent out weekly throughout the
period to continue to invite and/or remind people to participate. The originally scheduled
ending data was for March 31st, but the window to complete the survey was extended by
the FM organization to facilitate a greater number of responses. Members were
incentivized to participate in the survey by offering access to the results of the O & M
Benchmarking Report. See Figure 8: Email invitations to participate in survey
Figure 8: Email invitation to participate in survey
Dear Participant.
We are conducting a national benchmarking study on facility Operations & Maintenance and your participation is earnestly requested. The survey is easy to fill out and will be useful to the entire profession. Anyone who completes the full survey will receive a free copy of the FM Organization’s new O & M Benchmarking Report.
Please browse to www.fmorganization.org/omsurvey to complete the survey.
Your responses will be kept confidential.
Please contact me if you have any questions.
Regards
John Hancock
Manager Benchmarking & Analytics
+1-555-555-1234

55
DEVELOPMENT OF MULTI-FACILITY COST FILE During the course of deployment, an additional need for collecting data was
identified. The industry survey being deployed was asking participants to report on their
largest facility for the purposes of identifying facility specific details for proper “apples
to apples” comparisons of benchmarking data. Several members of the FM organization
had data on numerous buildings that they wanted to contribute. A Multi-facility Excel file
was created to provide participants with a means to voluntarily contribute the facility
costs and other information to the benchmarking data set. See Figure 9: Multi-facility
Excel File Screenshot and Appendix G: Multi-Facility Costs File.
Figure 9: Multi-Facility Excel File Screenshot

56
Prior to the closing of the surveys in mid-May, reminders were sent out to inform
potential participants that the survey would be closing. The raw data was exported from
the Qualtrics survey management platform as Excel files for data merging, cleansing,
quality management, initial analysis, and production of the Industry-Wide O & M
Benchmarking Research Report.
Once all the data had been collected from the various sources, it was then merged
in a Master data file that combined all the sources of the data. See Figure 10: Data
Merging Process.
Figure 10: Data Merging Process

57
3.4 DATA CLEANSING AND QUALITY MANAGEMENT
The data was cleansed and managed for quality from Mid-May until August 2017.
The raw data was initially examined and sorted to exclude survey attempts who did not
provide content to participate or provided no facility data and abandoned the survey
early.
The first phase of the data cleansing was merging the various forms in which the
data had been collected into one MS Excel file. Respondents who chose to submit their
costs to the survey in a MS Excel file had to be collected separately through the Qualtrics
platform and they were merged into a Master Excel file for the purposed of transferring
the data to the comprehensive survey data downloaded from Qualtrics. The Multi-facility
Qualtrics survey data was also downloaded as an Excel file and was merged with the
corresponding Excel Multi-Facility Costs Forms. These data points were then merged
into the Master Excel file into the corresponding question columns.
An additional contribution to the data came from an organization providing an
excel file on over 800 buildings managed by the federal government. The data from this
file was also added to the benchmarking database primarily on the form of facility
demographics and characteristics and operating costs.
The second phase of cleansing & quality management consisted of checking he
combined MS Excel data file of respondents’ surveys for errors, typos, and logical
inconsistencies to ensure the quality of the self-report data. Survey responses that
contained unusual data were marked for the purposes of following up and verifying the
content of their responses. Respondents with data that needed to be clarified or confirmed

58
were contacted first through email and asked to verify the data points that were in
question. Respondents that failed to confirm the accuracy of their data through email
were then contacted via telephone for confirmation of their responses. Data that were
confirmed were included in the analysis of the survey and data that were not confirmed
by the respondents were sequestered and excluded from the analysis to ensure the
accuracy of the data for the report.
Some of the common cleaning issues with the data that could be easily identified
and corrected without follow-up included:
• Use of letter abbreviations for numbers reported in the costs sections:
o “1 M” had to be changed to 1,000,000
o “6 million had to be changed to 6,000,000”
o Reported Acres had to be converted to Square Feet and vice-versa
depending upon the measure asked for in the question
• Other assortments of strings representing numbers that had to be changed into
numerical format for analysis
Some of the common mistakes caught during this process that had to be followed
up through email and phone calls with the respondents included:
• Reporting a Rentable Area larger than the reported Exterior Gross Area
• Misunderstanding of the term “Rentable Square Feet or Rentable Area”
• Large differences (>40%) between the Rentable Area and Exterior Gross
Area.
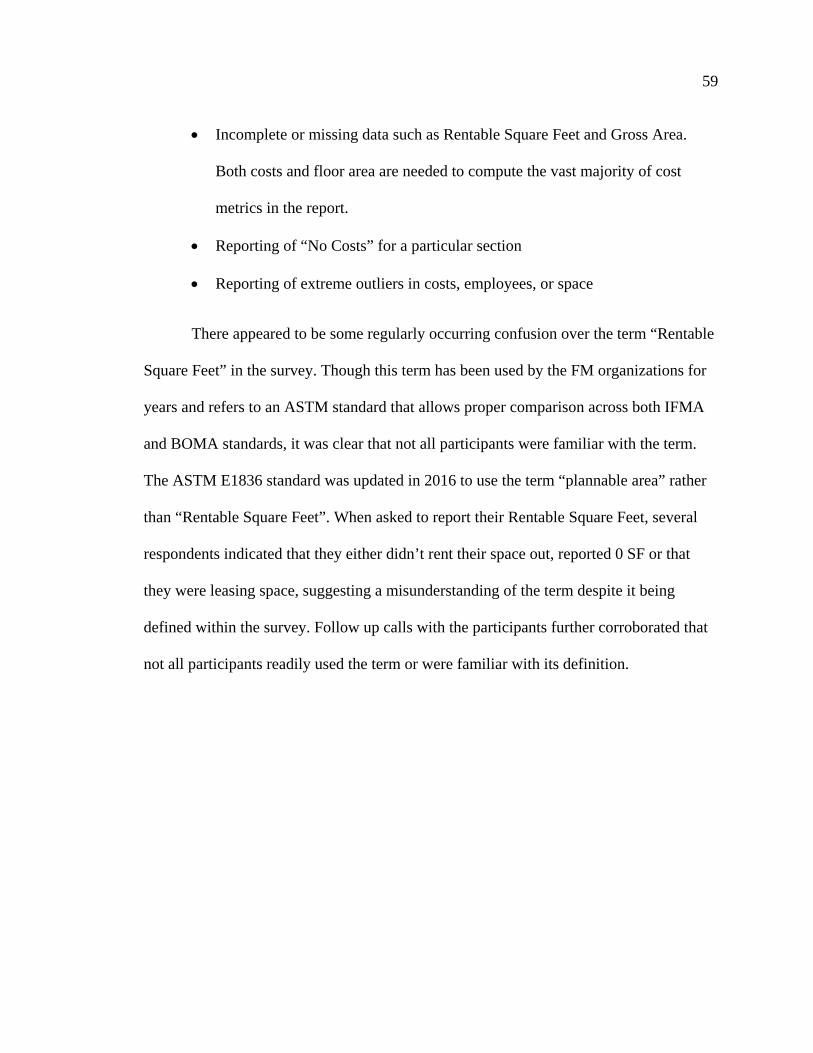
59
• Incomplete or missing data such as Rentable Square Feet and Gross Area.
Both costs and floor area are needed to compute the vast majority of cost
metrics in the report.
• Reporting of “No Costs” for a particular section
• Reporting of extreme outliers in costs, employees, or space
There appeared to be some regularly occurring confusion over the term “Rentable
Square Feet” in the survey. Though this term has been used by the FM organizations for
years and refers to an ASTM standard that allows proper comparison across both IFMA
and BOMA standards, it was clear that not all participants were familiar with the term.
The ASTM E1836 standard was updated in 2016 to use the term “plannable area” rather
than “Rentable Square Feet”. When asked to report their Rentable Square Feet, several
respondents indicated that they either didn’t rent their space out, reported 0 SF or that
they were leasing space, suggesting a misunderstanding of the term despite it being
defined within the survey. Follow up calls with the participants further corroborated that
not all participants readily used the term or were familiar with its definition.

CHAPTER 4: DATA ANALYSIS
INTRODUCTION
A fundamental goal of this research was to explore the knowledge gap between
facility management benchmarking and performance management. More specifically, to
analyze the relationship between the use of satisfaction measures and facility
performance in the terms of maintenance costs/sf. Additionally, the relationship between
various approaches to the use of benchmarking data and their effect on facility
performance in terms of costs/sf will also be analyzed.
PILOT SURVEY
The pilot survey was used to provide information on the type of data that would
be collected for the industry-wide O & M survey and the range of costs that could be
anticipated for creating range intervals for use in the industry-wide O & M survey as
well. The completed surveys (n = 285) were manually entered into MS Excel by research
staff, providing a response rate of about 24 percent. The analysis for the pilot survey was
conducted in Microsoft Excel and consisted of descriptive statistics and frequencies.
INDUSTRY-WIDE O & M SURVEY
A total of 2,368 surveys were downloaded from the Qualtrics Management
Platform. Data from the Manual Excel Cost File and Multi-facility costs file were merged

61
with the Qualtrics data into an excel file that was coded for the variables from the survey
as well as the source of the data. These files were alternative methods for collecting costs
data that were provided to the respondents of the survey based upon individual needs and
preferences in how the organizations reported their data.
The industry Wide O & M survey was prepared for analysis of customer
satisfaction and benchmarking plans by further screening the data for surveys that
contained relevant content for the analysis. Surveys which did not provide information on
these topics were excluded from inclusion and analysis, while incomplete surveys were
excluded from this portion of the analysis. The data in this analysis were also filtered for
U.S data only and to exclude data which had previously been marked as outliers or
unverified data. A total of 1,565 surveys met these criteria and were used for the thesis
topic analysis. This data was transferred into SPSS for analysis.
RESEARCH OBJECTIVE 1
The measures to achieve Research Objective 1 are included throughout this
section of the thesis. In addition to the descriptive statistics covered in this section,
additional measures for this objective can be seen in the Results Section: Correlation
Analyses. Linear relationships among the following variables were tested: facility size,
facility size category, maintenance costs/SF, and satisfaction survey frequency.

62
RESEARCH OBJECTIVES 2 & 3
INDEPENDENT VARIABLES
The independent variables for this thesis were customer/occupant satisfaction and
benchmarking plans.
CUSTOMER/OCCUPANT SATISFACTION SURVEY FREQUENCY
The data for this variable originates from 2 questions included in the industry-wide O
& M benchmarking survey (See Appendix A: Independent Variable Survey Questions).
This question was analyzed for content. Respondent’s direct answers to this question
revealed a high percentage of respondents (N =141) selecting the “Other” response and
providing a frequency of use that was not included in the main answers of the survey (See
Figure 11: Frequency of Satisfaction Survey Use: Raw Data). In order to increase the
effectiveness of the available data in this question, the answers to the Other Category
were reviewed and recoded into quantifiable categories of frequencies. Some answers had
to be excluded because the respondents did not provide an answer that could be
quantified into an annual frequency rate. For example, a number of respondents indicated
an informal use of customer/occupant satisfaction that relied upon more qualitative data
as obtained through meetings and direct contact with staff.

63
Figure 11: Frequency of Satisfaction Survey Use: Raw Data
The following represent the categories of frequencies that were established from
recoding the “other” category from the original question. They are represented in times
per year (tpy)
• Never = 0 • Every 5 years = 0.20 tpy • Every 3-4 years = 0.29 tpy • Every 3 years = 0.33 tpy • Every 2 years = .5 tpy • Every year = 1 tpy • Twice per year = 2 tpy • Quarterly = 4 tpy • Bi-monthly = 6 tpy • Monthly = 12 tpy • After every work order, daily, continuous = 365+ tpy •
Figure 12 lists the frequencies of responses after the data was recoded to include
responses to the “other” category that could be quantified into categories.

64
Figure 12: Frequency of Satisfaction Survey Use (Other Category Integrated)
SATISFACTION SURVEY USE
The data from this question was also recoded to examine whether there were
differences in those who use customer satisfaction surveys vs. those who don’t. Those
who responded to the question with the choice of “Never” were coded into a “No”
category. All other responses of varying frequencies were coded into a “Yes” category.
The purpose of this recoding was to compare differences between those who use
satisfaction surveys and those who don’t. See Figure 13: Satisfaction Survey Use

65
Figure 13: Satisfaction Survey Use
SATISFACTION ACTION PLANS The specific industry-wide O & M survey question that provided that data for this
subject can be found in Appendix A: Independent Variable Survey Questions. This
question was the only open-ended question on the questionnaire. Respondents tended to
provide very brief answers that primarily consisted of statements reflecting some sort of
action plan or follow-up based upon the results of the survey. Some examples of
responses to this question include:
• “Depends-We have union contracts-Each action would be implemented as
appropriate” • “We do follow-up for corrective actions” • “Assign corrective implementation to managers and supervisors” • “Develop action plans” • “Analyze responses and plan corrective actions based on the negative issues
identified in our survey” • “training” • “Surveys are reviewed and action plans are discussed with management staff” • “If deficiencies are identified, they are reviewed for feasibility and/or funding
support”

66
• “Action plan follow-ups-Closure of major customer concerns”
As a result of the variability and complexity of the responses to this question, it was
determined that a proper analysis of the responses was beyond the scope of this thesis.
The nature of the responses may be indicative of the complex nature of customer
satisfaction use in managing facilities and warrants the attention to detail and follow-up
interviews that should be conducted to properly understand how the customer satisfaction
surveys are utilized to manage quality of operations in facilities. Software such as N-Vivo
may provide a good means of shedding light on the classification and organization of
these responses and will be addressed in follow-up research to this thesis.
BENCHMARKING ACTION PLANS The specific survey question that provides the data for this variable can be found
in Appendix A: Independent Variable Survey Questions. The responses to the
benchmarking plans can be seen in Figure 14: Responses to Benchmarking Action Plans.

67
Figure 14: Benchmarking Plans
DEPENDENT VARIABLE
The dependent variable chosen for this thesis is Facility Maintenance Costs/SF.
Though other categories of facility costs were part of the Industry-wide benchmarking
survey, the scope of this project had to be carefully managed and the maintenance
costs/sf were chosen as being the most pertinent to the analysis and topic of the thesis.
Maintenance Costs/SF were calculated using the respondents reported total maintenance
costs and dividing them by the facility’s reported RSF. These costs were screened to
exclude any respondents who reported a $0.00 maintenance costs value. See Table 5:
Industry-Wide O & M Survey Maintenance Costs/RSF.

68
Table 5: Industry-Wide O & M Survey Maintenance Costs/RSF
N 1378 Range $57.03 Minimum $0.01 Maximum $57.03 Mean $3.37 Std. Error $0.12 Std. Deviation $4.39 Variance 19.25
Skewness Statistic 5.49 Std. Error 0.07
Kurtosis Statistic 45.06 Std. Error 0.13
Due to the high (>2) skewness and kurtosis values of the dependent variable,
maintenance costs/sf, an exploratory analysis of the data was undertaken in an effort to
identify factors in the variance of the variable that could potentially interfere with or
mask trends in the analysis of the data and hypotheses testing. Since the distribution of
the dependent variable does not approximate normal, non-parametric inferential statistics
will be used to draw appropriate conclusions from the data.

69
GROUPING & COANALYSIS VARIABLES
Two variables, type of space reported on, and facility size (RSF) were also
included in the analysis of the data. These variables were included to examine the role
that these variables may play in making meaningful comparisons across a diverse group
of facilities. An early preliminary analysis of the data suggested that these variables have
a significant effect on the independent variable of satisfaction survey frequency and the
dependent variable of maintenance costs/RSF. Figure 15: Type of Space Reported On,
shows the frequency of space type in the survey.
Figure 15: O & M Survey: Type of Space Reported On
Table 6: Industry-Wide O & M Survey Facility Size (RSF) lists the descriptive
statistics describing the spread of the RSF across industries in the survey. Figure 16:
Building Size Category Distribution demonstrates the distribution of the RSF scores
when compared using size categories.

70
Table 6: Industry-Wide O & M Survey Facility Size (RSF)
N 1481 Range 4,998,000 SF Minimum 2000 SF Maximum 5,000,000 SF Mean 322,224.11 SF Std. Error 13,792. 08 SF Std. Deviation 530,771 SF Variance 281,700,000,000,000 SF Skewness Statistic 3.93 Std. Error 0.064 Kurtosis Statistic 20.615 Std. Error 0.127
Figure 16: O & M Survey: Building Size Category Distribution
HYPOTHESES

71
This section will review the hypotheses for this study. A total of six hypotheses
were developed to examine the effect of the Independent Variables of customer
satisfaction and benchmarking plans on the dependent variable of maintenance
costs/RSF. The covariables of facility size and type of space were also examined to
determine their effects on the independent and dependent variables. See Figure 17:
Hypotheses and Research Variables. A total of six hypotheses were developed and are
grouped into two major groups representing the independent variables and Research
Objectives discussed in Chapter 1.
Figure 17: Hypotheses and Research Variables

72
CUSTOMER/OCCUPANT SATISFACTION AND PERFORMANCE MANAGEMENT
HYPOTHESIS 1: The use of satisfaction surveys will have an impact on maintenance
costs/sf. A two-tail t-test was used to assess this hypothesis.
H1: µ1-µ2 ≠0: Ho1: µ1-µ2 = 0
HYPOTHESIS 2: The frequency of use of satisfaction surveys will have an impact on the
maintenance costs/sf. This hypothesis was tested using an ANOVA and post-hoc t-tests.
H2: Means are not equal: Ho2: µ1=µ2=µ3=µ4=µ5=µ6=µ7=µ8=µ9=µ10
HYPOTHESIS 3: The size of the facilities will affect frequency of satisfaction survey
use. This hypothesis was tested using an ANOVA and post-hoc t-tests.
H3: Means are not equal: Ho3: µ1=µ2=µ3=µ4=µ5=µ6=µ7=µ8=µ9=µ10
BENCHMARKING PLANS AND PERFORMANCE MANAGEMENT
HYPOTHESIS 4: Those who are uncertain of how to utilize the benchmarking data will
have higher maintenance costs/sf than their counterparts. A two-tail t-test was used to
assess this hypothesis.
H4: µ1-µ2 ≠0: Ho4: µ1-µ2 = 0

73
HYPOTHESIS 5: Those who do not intend to take action on the benchmarking data will
have differing maintenance costs/sf than their counterparts. A two-tail t-test was used to
assess this hypothesis.
H5: µ1-µ2 ≠0: Ho5: µ1-µ2 = 0
HYPOTHESIS 6: Other Benchmarking Plans will not have an effect on maintenance
costs/sf. A two-tail t-test was used to assess this hypothesis.
H6: µ1-µ2 ≠0: Ho6: µ1-µ2 = 0

CHAPTER 5: RESULTS
This section will present the results from the analyses discussed in the previous
section. First the results from the Pilot Survey will be reviewed. This will be followed by
the results from the Industry-Wide O & M survey pertaining to the three research
objectives and hypotheses testing.
PILOT SURVEY RESULTS
Respondents to the pilot survey administered at an FM conference survey
reported on facilities dispersed throughout the continental United States. 81 percent of
the respondents identified as a “Facility Manager”, 15 percent identified as a “Services
Provider”, and the remaining 4 percent identified as “Other”. 37 percent of the
respondents reported having obtained a Bachelor’s degree and 33 reported having
obtained a Master’s degree. Approximately 24 percent reported having obtained an
Associate’s degree or some college education, and the remaining respondents reported
being either high school graduates or having obtained a PhD. On average, the
respondents reported that they manage about 54 buildings (SD = 135 buildings). Most of
the respondents (93 percent) were located in the United States (See Figure 18: Pilot
Survey Respondent Location). Other countries of respondents include Canada, South
Africa, Malaysia, Hong Kong, and Australia.

75
Figure 18: Pilot Survey Respondent Location
Figures 19 & 20 present the respondents educational and primary roles as reported
in the pilot survey. Figures 21-23 present the facility cost category frequencies of
janitorial, maintenance, and utility costs.
Figure 19: Pilot Survey: Respondent’s Highest Level of Educational Attainment
0%
5%
10%
15%
20%
25%
30%
35%
40%
High schoolgraduate, not
college
Somecollege, no
degree
Vocationalschool
Associate'sdegree
Bachleor'sdegree
Master'sdegree
PhD or otherDoctorate
Perc
enta
ge o
f res
pond
ents

76
Figure 20: Pilot Survey: Respondent’s Primary Role / Job Title
COSTS
Figure 21: Pilot Survey Janitorial Costs
0% 5% 10% 15% 20% 25% 30% 35% 40% 45% 50%
Facility Manager
FM Director
C-Suite
Project / Program Manager
Support Function
Director of Real Estate
Knowledge Worker
Other
Percentage of respondents

77
Figure 22: Pilot Survey Utility Costs
Figure 23: Pilot Survey Maintenance Costs
0%
5%
10%
15%
20%
25%
30%
35%
40%
$10,000 or less $10,001 -$30,000
$30,001 -$75,000
$75,001 -$200,000
$200,001 -$500,000
More than$500,000
Perc
enta
ge o
f res
pond
ents
0%
5%
10%
15%
20%
25%
30%
35%
40%
$5,000 or less $5,001 -$12,500
$12,501 -$50,000
$50,001 -$100,000
$100,001 -$500,000
More than$500,000
Per
cen
tage
of
resp
on
den
ts

78
SATISFACTION
Figures 24 & 25 present the frequencies of responses to satisfaction with janitorial
and energy management efforts. Figure 26 presents the average percentage of
maintenance expense allocation as reported in the pilot survey.
Figure 24: Pilot Survey Satisfaction with Janitorial Services
Figure 25: Pilot Survey Satisfaction with Energy Management Efforts
0%
10%
20%
30%
40%
50%
60%
Very dissatisfied Dissatisfied Neutral Satisfied Very satisfied
Perc
enta
ge o
f res
pond
ents
0%
5%
10%
15%
20%
25%
30%
35%
40%
Very dissatisfied Dissatisfied Neutral Satisfied Very satisfied
Perc
enta
ge o
f res
pond
ents

79
MAINTENANCE EXPENSE ALLOCATION
Figure 26: Pilot Survey Maintenance Expense Allocation
INDUSTRY-WIDE O & M SURVEY RESULTS
The following section presents the results from the Industry-Wide O & M survey
and hypothesis testing for the six hypotheses of this study. Table 7: Spearman’s rho
Correlation Analyses of Research Variables presents the results from an initial
exploration of linear trends among the research variables.
Table 7: Spearman’s rho Correlation Analyses of Research Variables
0%
10%
20%
30%
40%
50%
60%
Preventive Reactive Predictive
Perc
enta
ge o
f res
pond
ents

80
HYPOTHESIS TESTING: RESEARCH OBJECTIVE 2
SATISFACTION USE AND MAINTENANCE COSTS/SF
Ho1: µ1-µ2 = 0; H1: µ1-µ2 ≠0
This section will present the results of hypothesis testing for hypotheses 1-3
pertaining to Research Objective 2. This includes analyses of satisfaction use (Table 8:
Effect of Satisfaction Use on Maintenance Costs/RSF) and frequency (Table 9: Effect of
Satisfaction Frequency on Maintenance Costs/RSF). This will be followed by an analysis
of the effect of facility size on satisfaction frequency (Tables 10 & 11, Figures 27 & 28).
Table 8: Effect of Satisfaction Use on Maintenance Costs/SF

81
The Levine’s test for equality of variances between those who use satisfaction and
those who don’t did not indicate a significantly different amount of variance between the
two groups, F = .019, p = .889, α=.05. The t-test did not indicate a significant difference
in mean values between the two groups, t = .788, p = .431, α=.05. As a result, there was
not sufficient evidence to reject the null hypothesis.
SATISFACTION FREQUENCYAND MAINTENANCE COSTS/SF
Ho2: µ1=µ2=µ3=µ4=µ5=µ6=µ7=µ8=µ9=µ10=µ11; H2: Means are not equal
Table 9: Effect of Satisfaction Frequency on Maintenance Costs/SF
An ANOVA was conducted to determine if the different frequencies of satisfaction
survey use had an effect on maintenance costs/sf, F (11,524) = .377, p = .965, α=.05. As a
result, there was not sufficient evidence to reject the null hypothesis.

82
SATISFACTION FREQUENCY AND FACILITY SIZE
H3: Means are not equal: Ho3: µ1=µ2=µ3=µ4=µ5=µ6=µ7=µ8=µ9=µ10
Table 10: Effect of Facility Size on Satisfaction Survey Frequency
The results of the Spearman’s rho correlation between satisfaction frequency and
RSF indicated that there was a significant, but weak positive linear relationship
(Spearman’s rho = .155, p = .000, N = 648). An ANOVA was conducted to determine if
building size using the size category distinction had an effect on satisfaction frequency, F
(6,641) = 4.291, p = .000, α=.05. There is sufficient evidence to reject the null
hypothesis. A Tamhane post-hoc t-test procedure was conducted to determine which size
categories were significantly different from each other. This test does not assume a
parametric distribution (See Table 11: Tamhane Post-hoc Comparison of Size
Categoriesand Satisfaction Survey Frequency).

83
Table 11: Tamhane Post-hoc Comparison of Size Categories and Satisfaction
Survey Frequency
The results of the Tamhane post-hoc analyses indicate that the buildings in the
25,001-50,000 RSF category were significantly different from buildings ranging from
100,001-5,000,000 RSF.
A graph of the facility size category averages was created using the average
satisfaction survey frequency for each of the seven facility size categories to visually
represent the nature of the linear relationship between the two variables. See Figure 27:
Satisfaction Survey Frequency by Facility Size.
Building Size Category and Satisfaction Survey FrequencyTamhane Post-hoc Multiple Comparisons
Mean Difference Std. Error P-Value25,001-50,000 RSF <25,000 RSF -0.217 0.092 0.342
50,001-100,000 RSF -0.188 0.076 0.263100,001-250,000 RSF -0.224 0.071 0.043250,001-500,000 RSF -0.274 0.074 0.006500,001-1,000,000 RSF -0.346 0.074 0.0001,000,001-5,000,000 RSF -0.294 0.080 0.007

84
Figure 27: Satisfaction Survey Frequency by Facility Size (2,000-5,000,000 RSF)
Figure 27 was subsequently recreated to remove the out of trend data from
facilities in the category of 1,000,001-5,000,000 RSF. Removing the largest category
results in a stronger linear relationship between satisfaction survey frequency and facility
size (See Figure 28: Satisfaction Survey Frequency by Facility Size (2,000-1,000,000
RSF).
Figure 28: Satisfaction Survey Frequency by Facility Size (2,000-1,000,000 RSF)

85
FACILITY SIZE AND MAINTENANCE COSTS/SF
The relationship between facility size and maintenance costs/SF was inadvertently
discovered when try to estimate the impact of grouping or covariables for the analyses. A
negative linear relationship was found between the two variables, Spearman’s rho = .068
(p = .013, N = 1339). It does not represent a testing of hypotheses, but understanding the
magnitude of this effect on benchmarking data contributes to Objective 1 of the research.
A graph of the average maintenance costs/SF by facility size category was made to
illustrate the nature of the linear relationship between the two variables. See Figure 29:
Mainteance Costs/SF by Facility Size (2,000-5,000,000 SF).
Figure 29: Maintenance Costs/SF by Facility Size (2,000-5,000,000 SF)

86
TYPE OF SPACE REPORTED ON AND MAINTENANCE COSTS/SF
Another variable that was tested as a potential covariable was that of the type of
space reported on in the benchmarking survey. Figure 30 presents the average
maintenance costs/RSF by type of space reported on. Table 12 presents the same
information along with sample size and standard deviations. Table 13 lists the type of
space reported on and the average size of those spaces, along with sample size and
standard deviations. Table 14 presents the results of the ANOVA to determine if the type
of space reported on has an effect on maintenance costs/RSF. Table 15 presents the post-
hoc analyses of the ANOVA.
Figure 30: Maintenance Costs/Sf by Type of Space Reported on

87
Table 12: Average Maintenance Costs/SF by Type of Space Reported On
Table 13: Facility RSF by Type of Space Reported On
Table 14: Effect of Type of Space on Maintenance Costs/SF
RSF N St. Dev.Space within a facility 240,045.60 68.00 309,506.35 A single Facility 213,753.74 915.00 311,305.67 A Campus Facility 654,990.68 231.00 788,327.05 Multiple facilities in multiple places 589,845.43 172.00 817,410.60
Effect of type of space on Maintenance Costs/SFANOVA
Sum of Squares df Mean Square F PBetween Groups 515.52 3 171.84 10.33 0.00
Within Groups 21,111.91 1269 16.64
Total 21627.43 1272
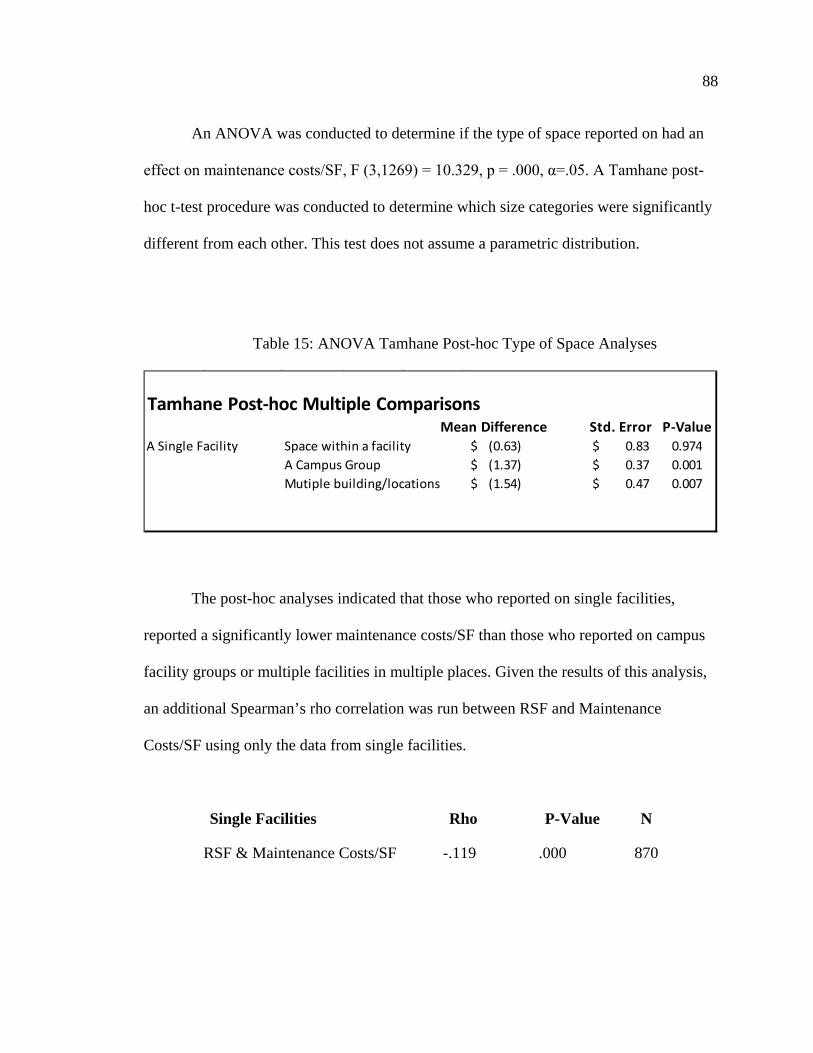
88
An ANOVA was conducted to determine if the type of space reported on had an
effect on maintenance costs/SF, F (3,1269) = 10.329, p = .000, α=.05. A Tamhane post-
hoc t-test procedure was conducted to determine which size categories were significantly
different from each other. This test does not assume a parametric distribution.
Table 15: ANOVA Tamhane Post-hoc Type of Space Analyses
The post-hoc analyses indicated that those who reported on single facilities,
reported a significantly lower maintenance costs/SF than those who reported on campus
facility groups or multiple facilities in multiple places. Given the results of this analysis,
an additional Spearman’s rho correlation was run between RSF and Maintenance
Costs/SF using only the data from single facilities.
Single Facilities Rho P-Value N
RSF & Maintenance Costs/SF -.119 .000 870
Tamhane Post-hoc Multiple ComparisonsMean Difference Std. Error P-Value
A Single Facility Space within a facility (0.63)$ 0.83$ 0.974A Campus Group (1.37)$ 0.37$ 0.001Mutiple building/locations (1.54)$ 0.47$ 0.007

89
These results indicated a significant increase in the Spearman’s rho correlation
value from -.068 to -.119 by limiting the analysis to only single facility respondents.
HPOTHESIS TESTING: RESEARCH OBJECTIVE 3
The results in this section focus on Research Objective 3. This objective is to
determine what effect differing types of benchmarking plans have on maintenance
costs/RSF. This section will present the results from 5 analyses for the testing of 3
hypotheses. The results are presented in Tables 16-21.
HYPOTHESIS 4 H4: µ1-µ2 ≠0: Ho4: µ1-µ2 = 0
Table 16: Effect of Benchmarking Uncertainty on Maintenance Cost/SF

90
The Levine’s test for equality of variances between respondents who indicated
they were uncertain of how to use the benchmarking data and those who did not,
indicated a significantly different amount of variance between the two groups, F =
16.904, p = .000, α=.05. An unequal variance t-test indicated a significant difference in
mean values between the two groups, t = -2.291, p = .023, α=.05. There is sufficient
evidence to reject the null hypothesis. Those respondents who indicated that they were
uncertain of how to use the benchmarking data from the survey reported a statistically
significant (p>.05) higher mean value for maintenance costs/sf than their counterparts,
$5.45/sf vs. $4.11/sf.
HYPOTHESIS 5: H5: µ1-µ2 ≠0: Ho5: µ1-µ2 = 0
Table 17: Effect of No Benchmarking Action on Maintenance Costs/SF

91
The Levine’s test for equality of variances between those who selected this
response and those who didn’t, did not indicate a significantly different amount of
variance between the two groups, F = 2.706, p = .101, α=.05. The t-test indicated a
significant difference in mean values between the two groups, t = 2.019, p = .044, α=.05.
There is sufficient evidence to reject the null hypothesis. Respondents who indicated that
they did not intend to take action based upon the results of the benchmarking survey
reported statistically significant lower mean maintenance costs/sf than their counterparts,
$1.63/sf vs. $4.47.
BENCHMARKING PLANS
HYPOTHESIS 6: Ho6: µ1-µ2 = 0; H6: µ1-µ2 ≠0
There were a total of three benchmarking action plans for respondents to choose
from. They will be presented on an individual plan basis.
Table 18: Average Maintenance Costs/SF by Type of Benchmarking Plans

92
PLAN1: IDENTIFY PERFORMANCE TARGETS (GAUGING COMPANY PERFORMANCE)
Ho6: µ1-µ2 = 0; H6: µ1-µ2 ≠0
Table 19: Effect of Plan 1 on Maintenance Costs/SF
The Levine’s test for equality of variances between those who selected this
response and those who didn’t, did not indicate a significantly different amount of
variance between the two groups, F = 1.132, p = .288, α=.05. The t-test did not indicate a
significant difference in mean values between the two groups, t = 0.899, p = .369, α=.05.
As a result, there was not sufficient evidence to reject the null hypothesis.
PLAN 2: INCORPORATE METRICS INTO A PERFORMANCE MODEL
Ho6: µ1-µ2 = 0; H6: µ1-µ2 ≠0
Plan 1: Identify Performance Targets (Gauging Company Performance)T-test N Mean St. Dev.
Identify Performance Targets 336 4.25$ 4.83$
Did not select response 233 4.62$ 4.84$
t= 0.899 df = 567 2 tailed P = 0.369
Levene's Test for Equality of Variance F = 1.132 p = .288

93
Table 20: Effect of Plan 2 on Maintenance Costs/SF
The Levine’s test for equality of variances between those who selected this
response and those who didn’t, indicates a significantly different amount of variance
between the two groups, F = 3.886, p = .049, α=.05. The unequal variance t-test did not
indicate a significant difference in mean values between the two groups, t = 0.911, p =
.363, α=.05. As a result, there was not sufficient evidence to reject the null hypothesis.
PLAN 3: IDENTIFICATION OF BEST-IN-CLASS PERFORMANCE/BEST PRACTICES
Ho6: µ1-µ2 = 0; H6: µ1-µ2 ≠0
Plan2: Incorporate Metrics into a Performance Model(KPI, Balanced Scorecard, etc.)T-test (unequal variance) N Mean St. Dev.
Incorporate Metrics into a Performance Model 248 4.20$ 4.24$
Did not select response 321 4.56$ 5.25$
t= 0.911 df = 565.925 2 tailed P = 0.363
Levene's Test for Equality of Variance F = 3.886 p = .049

94
Table 21: Effect of Plan 3 on Maintenance Costs/SF
The Levine’s test for equality of variances between those who selected this
response and those who didn’t, did not indicate a significantly different amount of
variance between the two groups, F = 1.798, p = .181, α=.05. A t-test did not indicate a
significant difference in mean values between the two groups, t = 0.443, p = .658, α=.05.
As a result, there was not sufficient evidence to reject the null hypothesis.
Plan 3: Identification of Best-in-Class Performance/Best PracticesT-test N Mean St. Dev.
Identification of Best-in-Class Performance/Best Practices 379 4.34$ 4.63$
Did not select response 190 4.53$ 5.24$
t= 0.443 df = 567 2 tailed P = 0.659
Levene's Test for Equality of Variance F = 1.798 p = .181

CHAPTER 6: DISCUSSION
The discussion on interpretation and significance of these results will be
addressed by first addressing each of the objectives of this research followed by a more
general discussion of the value that this research provides to the FM industry and
directions for future research uncovered in this initial study.
OBJECTIVE 1: FM INDUSTRY BENCHMARKING PROFILE
The measures of Objective 1 were intertwined throughout Objectives 1 & 2 as
they were explored and summarized during the methods and analysis section of this
thesis. This objective was to develop an wide-scale industry profile of how FM
organizations are implementing customer/occupant satisfaction surveys as well as FM
approaches to taking action on competitive benchmarking surveys. This was
accomplished through the analyses and use of descriptive statistics on a large sample that
can be generalized to the North American FM industry. This was further accomplished
through the publication of the results of the industry-wide O & M survey by the facility
management organization for practitioners to use in aiding their benchmarking efforts. A
number of organizations report relying heavily upon the data from these surveys for
assistance in guiding their performance management and in supporting their requests for
funding to provide further costs savings for the organizations they support. This report
provides facility managers with benchmarking data on facility costs and practices
including janitorial, maintenance, utilities, security, sustainability and energy

96
management, as well as demographic data such as: industry, facility use, age, setting,
occupants, operating hours, and much more.
Another interesting result that was inadvertently discovered within this research
objective was the finding of a statistically significant, but weak linear relationship
between facility size and maintenance costs/sf (Spearman rho = -.068, p=.013, N = 1481).
The results of the ANOVA on size categories compared over maintenance costs/SF with
only one category, 25,001-50,000, proving statistically significant from the other, may
suggests that further statistical analyses and consideration should be given to the ranges
used in building size categorization.
The finding of a significant effect of the type of space reported on, with single
facilities reporting a lower maintenance costs/SF than campus facility groups or multiple
facilities in multiple places (F = 10.33 [3,1269], p = .000), is also an informative result
that could help to further the proper analysis of competitive benchmarking surveys.
Those respondents reporting on multiple facilities are reporting total costs/total RSF for
all of their facilities, meaning that best-in-class and worst-in-class are all included in their
data. This means that they are reporting average performance across their facilities, rather
than performance of best-in-class facilities, which may account for the significantly
different maintenance costs/RSF averages among the types of space reported on.
When the linear relationship between maintenance costs/SF and RSF was
analyzed looking only at the respondents who reported on single facilities, the strength of
the linear relationship almost doubled (Spearman’s rho = -.119, p =.000, N = 870). These
results suggest the importance of making reasonable comparisons between facilities, or
“apples to apples” comparisons. Including data from some many dissimilar sources can

97
increase the odds of making Type I or Type II errors in statistical conclusions. Including
data from disparate groups in organizational reports could also lead to organizations
making financial decisions based upon skewed data that could lead to assessment and
correction errors. In short, competitive FM benchmarking surveys should rely upon
single facility comparisons to make informed and accurate performance assessments or
the types of space should be analyzed separately to ensure that these differences aren’t
masking trends.
Future research efforts should try to address why the differences in type of space
reported on effect maintenance costs/SF. Further understanding of the relationship
between maintenance costs/SF and facility size (RSF) should also be addressed.
Understanding the differences in performance caused by these grouping or demographic
variables will help to further the field of facility management benchmarking by helping to
address the largest impacts to performance differences that can occur across industries.
OBJECTIVE 2: THE IMPACT OF CUSTOMER/OCCUPANT SATISFACTION ON
PERFORMANCE MANAGEMENT
The results of these analyses were unexpected, but consistent with previous
researchers’ observations regarding difficulties linking soft measures such as satisfaction
to more performance oriented hard measures, such as costs/SF. There was no statistical
support for the hypotheses that use and frequency of customer satisfaction surveys have
an effect on maintenance costs/sf in a competitive benchmarking survey. This may be
reflective of the nature of its use in the industry as a quality management tool rather than
a performance management tool, but it begs a deeper question. If the core purpose of

98
facility management is to manage performance and keep costs down, is a best practice
that does not contribute directly to this goal truly a best practice. Best practices do not
always translate but must be adapted to fit the needs of an industry (Camp, 1989:
Stauffer, 2003). This could be evidence that it may not be best practice for the FM
industry, despite 66% of respondents indicating that they do use it. Conversely, 34% of
respondents indicated that they do not use it, which may suggest its lack of utility for the
Industry. On the other hand, this may simply be evidence of its lack of utility in an
external competitive benchmarking survey. This survey did not address the particulars on
how the benchmark may be used as an internal benchmark within the company, nor did it
evaluate the methodology with which it is employed within the company, so the
effectiveness with which the measure is utilized to manage quality or performance can’t
be gauged by the information in the survey. The survey also did not distinguish between
the type of surveys people were utilizing. Different respondents indicated they were using
satisfaction surveys after projects and others after work orders. This diverse group of
satisfaction survey use should be examined in greater specificity to differentiate between
these various approaches serving different FM organizations.
Specific research is needed to follow up this study which should include a more
qualitative approach to obtaining information on this subject such as interviews regarding
action plans for customer satisfaction surveys. Additionally, a follow up analysis of the
qualitative answers to how people were planning on taking action should be conducted
using a technique such as N-Vivo software to further the analysis of the responses. This
analysis was beyond the scope of this current thesis.

99
A statistically significant, but weak linear relationship was also found between
facility size and satisfaction survey frequency (Spearman’s rho = .155, p = .000, N =
648). It is believed that this difference in frequency may be accounted for by the
difference in organizational size and the differing strategies that large-scale organizations
use when compared to smaller businesses. In a large organization it is not possible to
have a direct relationship with all members of staff to gather informal qualitative
information about customer/occupant satisfaction. While smaller organizations can gather
this information frequently and informally through meetings and direct contact, larger
organizations most likely have to rely upon more informal gathering of this data such as
obtained with customer satisfaction surveys. Several respondents to the industry-wide O
& M survey reported to use customer satisfaction in this more informal manner.
OBJECTIVE 3: THE IMPACT OF BENCHMARKING PLANS ON PERFORMANCE
MANAGEMENT
There are several interesting results from the analyses conducted in this thesis on
this topic. To begin with only 66% of the respondents who answered the question on
benchmarking data plans selected the identification of best practices as a planned use for
the benchmarking survey data. With the identification of best practices to take action
upon as the fundamental goal of benchmarking, it is rather curious that more respondents
did not select this option. There could be a few possible interpretations as to the
reasoning behind the respondents’ lower than anticipated response to this selection, such
as unfamiliarity with benchmarking methodology, or simply uncertainty about how to use
the data from the FM organization’s O & M Benchmarking Report. This is impossible to

100
determine from the data in the survey but would lend well to follow-up research and in-
depth interviews.
An unexpected result from the survey was that respondents who reported that they
would not be taking action on the benchmarking data reported significantly lower
maintenance costs/sf than their counterparts, $1.62/sf vs. $4.46/sf (t = 2.019, p = .044,
α=.05). Though the results of this analysis were significant at the required alpha level, the
no action group was a very small sample (N=12) when compared to their counterparts (N
= 556). This small sample size may limit the extent to which this result can be
generalized to the population, but it is interesting nonetheless. Clearly, there is something
different about the respondents who answered the question in this manner as they report a
much smaller costs/sf than their counterparts. Understanding why this occurred with the
available data will be speculative at best. It’s impossible to determine the motives for
responding to the question in this manner, which could range from prior incorporation of
best practices and being a best-in-class performer, already having a system in place, or
simply responses from people who are uncertain of how a report could be used to achieve
benchmarking methodology. Again, this result would also be worthy of follow research
and interviews to find out more about the characteristics of the few respondents who did
not intend to take action.
Respondents who indicated they were uncertain about how to take action on the
benchmarking results reported higher maintenance costs/sf than their counterparts, $5.45
vs. $4.11 (t = -2.291, p = .023, α=.05). This result could be interpreted as support for the
idea that those with unfamiliarity with benchmarking methodology or uncertainty over
how to go about the process do not perform as well as their peers. This would certainly be

101
consistent with the literature available on this topic as benchmarking can be a very
effective tool for continual improvement. Some caution should be taken in this
interpretation though. This interpretation does not take into account whether the
respondents were unfamiliar with the benchmarking process or simply unfamiliar with
the FM organization’s O & M benchmarking surveys.
Another interesting result from the analyses was that there does not appear to be
any statistical support for significant differences in maintenance costs/sf for respondents
who indicated that had some sort of plan to take action on the benchmarking data. This
suggests that one individual strategy may not necessarily outperform another one. When
this is taken into consideration with the analysis suggesting that uncertainty about how to
use the data was linked to poor performance in the form of higher costs than their
counterparts, this could be suggestive about the impact of taking action on benchmarking
data. Those respondents who had some sort of plan for taking action on the data
outperformed those who were uncertain of how to go about taking action on the data.
This topic should also be addressed further in follow-up research. Possible limitations on
the interpretation of these results may center around the form of the question itself and
the need for a more in-depth coding and analysis of the data to explore all possible
answer combinations that were given to this question.
The fact that 37% of respondents selected the strategy of incorporating the data
from the survey in a performance model such as a KPI or Balanced Scorecard is also
interesting in and of itself. This may suggest that there is a growing awareness in the FM
filed of the complementary role that benchmarking and performance can play for an

102
organization. It may be that there is a growing need and demand in the field to address
the knowledge gap between these two techniques and the industry is responding.
CONCLUSION
This thesis provides a number of significant contributions to the field of facility
management as well as some interesting insights into the use of customer satisfaction and
benchmarking plans. It further helps to provide information on the potential knowledge
gap between benchmarking and performance management. It provides a profile of how
FM organizations are implementing customer/occupant satisfaction surveys as well as
FM approaches to taking action on competitive benchmarking surveys. It provides no
support for an industry-wide relationship between satisfaction surveys and facility
performance, but raises some interesting questions about how differing facility sizes may
use different approaches to such surveys. The results also suggest that facility managers
who are familiar with benchmarking methodology may actually have a performance
advantage over their peers. In addition, it stimulates directions for future research on the
relationship of size and facility costs, size and cost differences in the type of space
reported on, and their effect on maintenance costs/SF.
Understanding the factors that significantly effect facility performance will help
to contribute to better facility benchmarking and more accurate performance assessments
when making benchmarking comparisons. This research also demonstrates that further
understanding of the role that the use of customer satisfaction plays in managing facilities
is needed, perhaps in a more qualitative form to address the intra-facility use of these
surveys and how they may be used to mange internal benchmarks pertaining to quality,

103
rather than performance. Finally, this study addresses the role that benchmarking plans
may play in facility performance and suggests that further understanding of the internal
organizational processes for taking action is warranted.

104
REFERENCES
Allan, C. F. (1993). “Benchmarking practical aspects for information professionals”. Special Libraries, Vol 84, No. 3, pp. 123-30. Amaratunga, D. & Baldrey, D. (2003). “A conceptual framework to measure facilities management performance”. Property Management, Vol. 21 No.2, pp. 171-89. Amaratunga, D., Baldry, D. & Sarshar, M. (2000). “Assessment of facilities management
performance – what next?” Facilities, 18(1/2), 66–75. https://doi.org/10.1108/02632770010312187
Amaratunga, D., Haigh, R., Sarshar, M., & Baldry, D. (2002). Application of the
balanced score‐card concept to develop a conceptual framework to measure facilities management performance within NHS facilities. International Journal of Health Care Quality Assurance, 15(4), 141–151. https://doi.org/10.1108/09526860210431805
American Society of Testing & Materials (ASTM) (2016). ASTM E1836 / E1836M- 09(2016), Standard Practice for Building Floor Area Measurements for Facility Management, ASTM International, West Conshohocken, PA, 2016, www.astm.org Anand, G., & Kodali, R. (2008). Benchmarking the benchmarking models.
Benchmarking: An International Journal, 15(3), 257–291. https://doi.org/10.1108/14635770810876593
Au-Yong, C. P., Ali, A. S., & Ahmad, F. (2015). Participative Mechanisms to Improve Office Maintenance Performance and Customer Satisfaction. Journal of Performance of Constructed Facilities, 29(4), 4014103. https://doi.org/10.1061/(ASCE)CF.1943-5509.0000609
Augenbroe, G. & Parks, C.S. (2005). Quantification methods of technical building performance”. Building Research and Information, Vol. 33 No. 2, pp. 159-72. British Institute of Facility Management (BIFM) (2004). “Rethinking facilities management: accelerating change through best practice”. www.bifm.org.uk. (Accessed 01/20/2018). Bhutta, K. & Huq, F. (1999). Benchmarking – best practices: an integrated approach.
Benchmarking: An International Journal, 6(3), 254–268. https://doi.org/10.1108/14635779910289261

105
Camp, R. C. (1989). Benchmarking: the search for industry best practices that lead to superior performance. Milwaukee, WI: White Plains, N.Y: Quality Press ; Quality Resources.
Coenen, C., Waldburger, D., & Felten, D. von. (2013). FM Servicebarometer: monitoring
customer perception of service performance. Journal of Facilities Management, 11(3), 266–278. http://dx.doi.org.librarylink.uncc.edu/10.1108/JFM-06-2012-0024
Collins, T., Rosetti, M., Nachtmann, H. & Oldham, J. (2006). “The use of multi-attribute utility theory to determine the overall best-in-class performer in a benchmarking study”. Benchmarking: An International Journal, Vol. 13 No. 4, pp.431-46. Denrell, J. (2005). Selection bias and the perils of benchmarking. Harvard Business
Review, 83(4). p. 114-119. Retrieved from http://content.ebscohost.com.librarylink.uncc.edu/ContentServer.asp?T=P&P=AN&K=16572717&S=R&D=bth&EbscoContent=dGJyMNLr40Sep684zdnyOLCmr06ep7ZSs6i4TbSWxWXS&ContentCustomer=dGJyMPGrtkqwr7VRuePfgeyx44Dt6fIA
Emulti, D. & Kathwala, Y. (1997). “An overview of the benchmarking process: a tool for continuous improvement and competitive advantage”, Benchmarking for Quality Management & Technology, Vol. 4, No. 4, pp.229-43. Fernandez, P., McCarthy, I. P., & Rakotobe-Joel, T. (2001). An evolutionary approach to
benchmarking. Benchmarking, 8(4), 281. Fong, S.W., Cheng, E.W.I., & Ho, D.C.K. (1988). “Benchmarking: a general reading for management practitioners”. Management Decision, Vol. 35, No. 6, pp. 407-418. Fibuch, E., & Van Way, C. W. (2013). Benchmarking’s Role in Driving Performance.
Physician Executive, 39(1), 28–32. Haverila, M. J., Martinsuo, M., & Naumann, E. (2013). Drivers of customer satisfaction
and relationship quality in system delivery projects. Journal of Strategic Marketing, 21(7), 613–636. https://doi.org/10.1080/0965254X.2013.804860
He, L. T., & Hu, C. (2009). Midpoint method and accuracy of variability forecasting.
Empirical Economics, 38(3), 705–715. https://doi.org/10.1007/s00181-009-0286-6
Hinks, J. (2004). “Business-related performance measures for facilities management”. In Alexander, K., Atkin, B., Brochner, J., & Haugen, T. (Eds.), Facilities Management: Innovation and Performance, SPON Press, New York, NY, pp.97- 107.

106
Hinks, J. & McNay, P. (1999). “The creation of a management by variance tool for facilities management performance assessment”. Facilities, 17(1/2), pp. 31-53. Hinton, M., Francis, G., and Holloway, J. (2000). “Best practice benchmarking in the UK”. International Journal of Benchmarking, 7(1), pp.52-62 Hong, S.-M., Paterson, G., Mumovic, D., & Steadman, P. (2014). Improved
benchmarking comparability for energy consumption in schools. Building Research & Information, 42(1), 47–61. https://doi.org/10.1080/09613218.2013.814746
International Facility Management Association (IFMA) (2014). Benchmarking-for-
facility-professionals-ifma-foundation-whitepaper-small.pdf. Retrieved from https://foundation.ifma.org/docs/default-source/Whitepapers/benchmarking-for-facility-professionals-ifma-foundation-whitepaper-
Kaplan, R. S., & Norton, D. P. (1992). The Balanced Scorecard--Measures That Drive
Performance. Harvard Business Review, 70(1), 71–79. Kennerly, M. & Neely, A. (2003). “Measuring performance in a changing business environment”. International Journal of Operation and Production Management, Vol. 23(2), pp.213-229. Kumar, U., Galar, D., Parida, A., Stenström, C., & Berges, L. (2013). Maintenance
performance metrics: a state-of-the-art review. Journal of Quality in Maintenance Engineering, 19(3), 233–277. http://dx.doi.org.librarylink.uncc.edu/10.1108/JQME-05-2013-0029
Lavy, S., Garcia, J., & Dixit, M. (2010). Establishment of KPIs for facility performance
measurement: review of literature. Facilities, 28(9/10), 440–464. https://doi.org/10.1108/02632771011057189
Lavy, S., Garcia, J. A., & Dixit, M. K. (2014a). KPIs for facility’s performance
assessment, Part I: identification and categorization of core indicators. Facilities, 32(5/6), 256–274. http://dx.doi.org.librarylink.uncc.edu/10.1108/F-09-2012-0066
Lavy, S., Garcia, J. A., & Dixit, M. K. (2014b). KPIs for facility’s performance
assessment, Part II: identification of variables and deriving expressions for core indicators. Facilities, 32(5/6), 275–294. http://dx.doi.org.librarylink.uncc.edu/10.1108/F-09-2012-0067
Lavy, S., Garcia, J. A., Scinto, P., & Dixit, M. K. (2014). Key performance indicators for
facility performance assessment: simulation of core indicators. Construction

107
Management and Economics, 32(12), 1183–1204. https://doi.org/10.1080/01446193.2014.970208
Li, Z., Han, Y., & Xu, P. (2014). Methods for benchmarking building energy
consumption against its past or intended performance: An overview. Applied Energy, 124, 325–334. https://doi.org/10.1016/j.apenergy.2014.03.020
Lingle, J.H. & Schiemann, W.A. (1996). “From balanced scorecard to strategy gauge: is measurement worth it?” Management Review, March, pp.56-62. Loosemore, M., & Hsin, Y.Y. (2001). “Customer-focused benchmarking for facilities management”. Facilities, (19), Issue 13/14, pp. 464-476. Massheder, K.& Finch, E. (1998) "Benchmarking methodologies applied to UK facilities management", Facilities, Vol. 16 Issue: 3/4, pp.99-106, https://doi.org/10.1108/02632779810205639 Meng, X. & Minogue, M. (2011). Performance measurement models in facility
management: a comparative study. Facilities, 29(11/12), 472–484. https://doi.org/10.1108/02632771111157141
Palmer, K. & Walls, P. (2015). “Does Information Provision Shrink the Energy Efficiency Gap? A Cross-City Comparison of Commercial Building Benchmarking and Disclosure Laws”. Resources for the Future. Washington, D.C. www.rff.org. Rani, N. A. A., Baharum, M. R., Akbar, A. R. N., & Nawawi, A. H. (2015). Perception of Maintenance Management Strategy on Healthcare Facilities. Procedia - Social and Behavioral Sciences, 170, 272–281. https://doi.org/10.1016/j.sbspro.2015.01.037 Rasila, H., Alho, J., & Nenonen, S. (2010). Using balanced scorecard in operationalising
FM strategies. Journal of Corporate Real Estate, 12(4), 279–288. http://dx.doi.org.librarylink.uncc.edu/10.1108/14630011011094694
Kärnä, S. & Junnonen, J. (2016). Benchmarking construction industry, company and
project performance by participants’ evaluation. Benchmarking: An International Journal. https://doi.org/10.1108/BIJ-05-2015-0050
Rodier, M.M. (2000). “A quest for best practices”. IIE Solutions, Vol 32, No. 2, pp.36- 39. Sedgwick, S. (1995). “Benchmarking and best practice: promise and performance”. Australian Journal of Public Administration, Vol. 54, No. 3, pp. 401-7.

108
Shetty, Y. K. (1993). “Aiming high: competitive benchmarking for superior performance”. Long Range Planning, Vol. 26, No. 1, pp. 39-44. Simões, J.M., Gomes, C.F., & Yasin, M.M. (2011). A literature review of maintenance
performance measurement: A conceptual framework and directions for future research. Journal of Quality in Maintenance Engineering, 17(2), 116–137. https://doi.org/10.1108/13552511111134565
Spendolini, J.M. (1992). The Benchmarking Book. American Management Association, New York. Stauffer, D. (2003). Is Your Benchmarking Doing the Right Work? Harvard
Management Update, 8(9), 3 Tucker, M., & Pitt, M. (2010). Improving service provision through better management
and measurement of customer satisfaction in facilities management. Journal of Corporate Real Estate, 12(4), 220–233. http://dx.doi.org.librarylink.uncc.edu/10.1108/14630011011094667
Tucker, M. & Smith, A. (2008). “User perceptions in workplace productivity and strategic FM delivery”. Facilities, Vol. 26 (5/6), pp. 196-212. Wall, T. D., Michie, J., Patterson, M., Wood, S. J., Sheehan, M., Clegg, C. W., & West,
M. (2004). On the Validity of Subjective Measures of Company Performance. Personnel Psychology, 57(1), 95–118. https://doi.org/10.1111/j.1744-6570.2004.tb02485.x
Walters, M. (1999). “Performance measurement systems – a study of customer satisfaction”. Facilities, Vol. 17, (3/4), pp. 97-104. Watson, G.H. (1993). Strategic Benchmarking. Wiley, New York, NY. Wong, P. Y. L., Leung, S. C. H., & Gilleard, J. D. (2013). Portfolio Performance
Benchmarking with Data Envelopment Analysis. Asia-Pacific Journal of Operational Research, 30(5), 1. https://doi.org/10.1142/S0217595913500115
Yasin, M. M. (2002). The theory and practice of benchmarking: Then and now.
Benchmarking, 9(3), 217–243

109
APPENDIX A: INDEPENDENT VARIABLE SURVEY QUESTIONS
How do you plan on using the benchmarking data from this survey? (select all that apply)
• Identify performance targets (gauging company performance) • Identification of best-in-class performance / best practices • Incorporate Metrics into a performance model (KPI, balanced scorecard, etc.) • Uncertain of how the data will be used • NO action will be taken • Other:_________________________
How often do you conduct a general satisfaction survey of FM customers / general occupants?
• Never - we do not conduct satisfaction surveys • Quarterly • Twice per year • Every year • Other:__________________________
How do you implement corrective / remedial actions (if any) based on the results of the customer survey?

110
APPENDIX B: PILOT SURVEY
FRONT-PAGE 1

111
BACKSIDE – PAGE 2

112
APPENDIX C: INDUSTRY WIDE O & M SURVEY
GENERAL INFORMATION 1. Please select the currency and unit of measure in which you will be providing responses: __ U.S dollars / English (sq. feet) __ Canadian dollars / Metric (sq. meters) __ EURO dollars / Metric (sq. meters) __ Other (please specify currency and units of measure): ________________________________ Please note: In order to guarantee the validity of the data for this survey, it is important that you consistently use the currency and units of measurement that you selected above throughout the survey (unless otherwise stated on a specific question). Example: If you selected “Canadian Dollar,” all currency entries should be in Canadian dollars and all units of measure will be Metric. Throughout the survey, “$” will be used as a common symbol to represent currency.
Option to print out and fill out by hand to gather data (and then input into survey).
Option to do ranges versus specific values
1. Will you be providing responses in: _ English (sq. feet) _ U.S. dollars _ Metric (sq. meters) _ Canadian dollars
2. Please describe the specific product, service or business activity of your organization or the
organization you are contracted to manage:
3. Who will serve as the benchmark contact person for your organization? (Please complete) Name: __________________________________________________ IFMA designation: (CFM, FMP) ______________________
4. IFMA member ID #:____________________________________________ (If respondent is not a member of IFMA please enter 9999.)
Organization: _____________________________________________________________________________________________ Address: _____________________________________________________________________________________________ City, State, Zip/Postal Code: ______________________________________________

113
Country:________________________ Province (if applicable) Phone: ____________________________ E-mail: ________________________________________________________________
5. Would you be interested in participating in future benchmarking activities with others? For example, every three years?
_ Yes (If yes, what three topics or areas do you have an interest in benchmarking?) _ No Area of interest a) ___________________________ b) _________________________ c) ________________________
6. Do you conduct an annual customer satisfaction survey?
__ Yes
__ No
7. What actions are taken as a result of the survey? Choose all that apply:
__ Actions are limited to funding
__ Life Safety are implemented
__ Review only
__ Results reviewed by a board, and actions selected by priority setting process
__ Other
Organizational Information
8. Which one of the following departments does your FM department report to or reside within organizationally? Select as many responses which apply in each column.
Organizational Structure Reports to Resides in
Board or Board Committee
CAO/Administration
CEO/President/Owner/Executive Director
CFO/Finance

114
COO/Operations/Shared Services
Facilities
Human Resources
CIO/Information Technology
GM/business Unit
Chief Risk or Legal Officer/Risk/Legal/General Counsel
Other (Please specify): ______________________
9. Approximately, how many employees are you responsible for overall in your organization?
________________ (Please enter only whole numbers and not ranges).
________ Responsible for direct staff
________ Responsible for indirect staff
FACILITY DESCRIPTION
10. What industry does this facility serve?
(Choose one from the categories listed below that best fits):
SERVICES
__ Banking (Consumer, Commercial, Savings, Credit Unions)
__ Health Care

115
__ Hospitality (Hotel, Restaurants, Hospitality-Related)
__ Information Services (Data Processing, Information Services, E-Commerce)
__ Insurance (Health, Life, Auto, Mutual, Casualty, Flood)
__ Investment Services (Securities and Investment Services)
__ Media (Broadcasting, Entertainment, Gaming, Media, Publishing)
__ Professional Services (Legal, Accounting, Consulting, Engineering, Architecture)
__ Telecommunications (Telecommunication, Internet Services/Products)
__ Trade (Wholesale, Retail)
__ Transportation (Transportation, Freight)
__ Utilities (Water, Gas, Electric, Energy Management)
__Other Services: _______________________________________
MANUFACTURING/PRODUCTION
__ Aircraft/Industrial (Industrial Equipment, Aerospace)
__ Building/Construction (Building, Construction Materials)
__ Chemical/Pharmaceutical (Chemical, Pharmaceutical, Biotech)
__ Consumer Products (Food, Paper or related)
__ Computer (Computer Hardware or Software)
__ Electronics (Electronics, Telecommunications Equipment)
__ Energy (Energy related, Mining or Distribution)
__ Medical Equipment
__ Motor Vehicles
__ Other Manufacturing: __________________________________
OTHER INSTITUTIONS
__ Association (Association, Federation, Non-Profit Foundation, Society)

116
__ Charitable, Foundation
__ Corrections (private, state, federal, city, county)
__ Cultural (Cultural Institutions)
__ Educational (Training Center, K – 12, Higher Education)
__ Educational – University, College, Technical Institute
__ Federal Government
__ State/Provincial Government
__ City/County Government (Law Enforcement, Library)
__ Special District/Quasi-Government (Special Districts, Transportation Authorities, School Boards)
__ Military
__ Religious
__ Research
__ Other institutions: ____________________________________
11. Check the description that best represents the facility on which you are reporting data:
__ Space within a building
__ A single building
__ Multiple buildings in one location. Specify number of buildings _______
__ Multiple buildings in multiple locations.
__ Specify number of buildings and locations ____________________________________________
12. Which of the following best describes the facility that you are reporting on?
__ Own and occupy

117
__ Own and lease to others
__ Lease as a tenant
__ Please specify the _______% Leased, _______% owned (% Leased + % Owned = 100%)
13. Check the predominant use of this facility (check the one category that best fits).
ASSEMBLY
__ Community/Recreation Center
__ Convention Center/Exhibit Hall
__ Religious
__ Stadium/Arena/Auditorium
__ Other, please specify: _________________________________________________________
INDUSTRIAL
__ Manufacturing
__ Warehouse
__ Other, please specify: _________________________________________________________
Office
__ Headquarter
__ Branch/Regional Office
__ Medical office
__Mixed Use (office is dominant component)
__Other, please specify: _________________________________________________________
Other
__ Bank branch
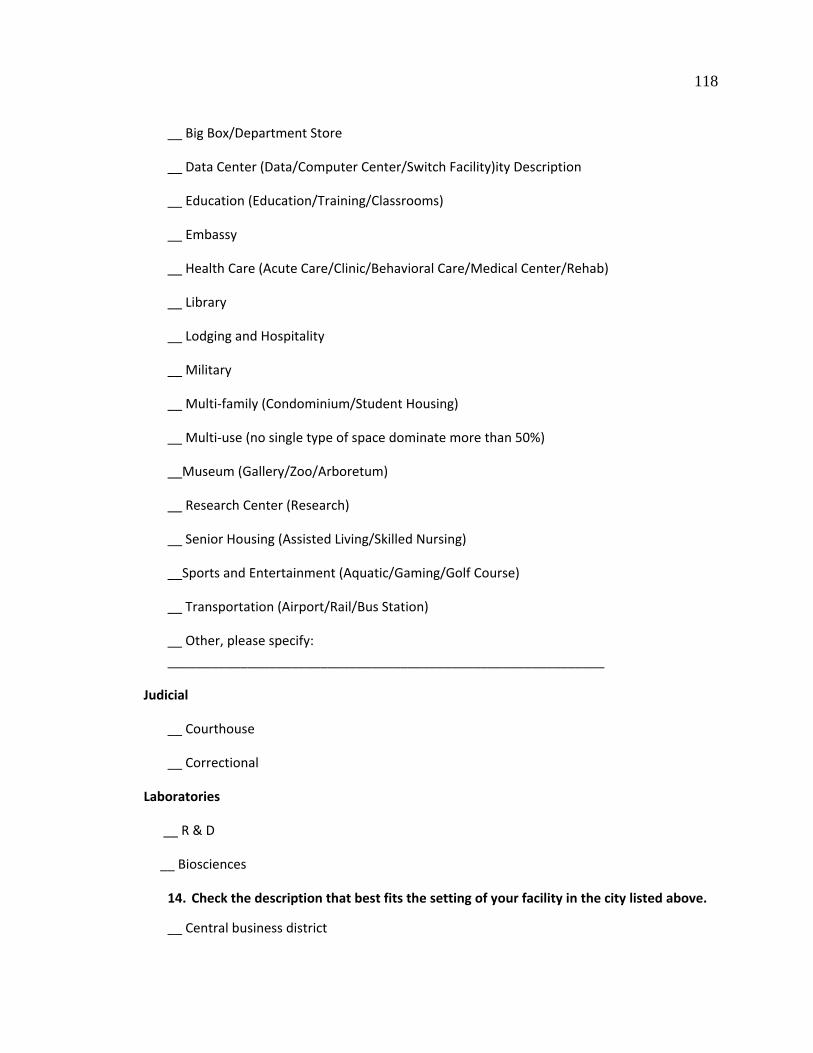
118
__ Big Box/Department Store
__ Data Center (Data/Computer Center/Switch Facility)ity Description
__ Education (Education/Training/Classrooms)
__ Embassy
__ Health Care (Acute Care/Clinic/Behavioral Care/Medical Center/Rehab)
__ Library
__ Lodging and Hospitality
__ Military
__ Multi-family (Condominium/Student Housing)
__ Multi-use (no single type of space dominate more than 50%)
__Museum (Gallery/Zoo/Arboretum)
__ Research Center (Research)
__ Senior Housing (Assisted Living/Skilled Nursing)
__Sports and Entertainment (Aquatic/Gaming/Golf Course)
__ Transportation (Airport/Rail/Bus Station)
__ Other, please specify: ____________________________________________________________
Judicial
__ Courthouse
__ Correctional
Laboratories
__ R & D
__ Biosciences
14. Check the description that best fits the setting of your facility in the city listed above.
__ Central business district

119
__ Secondary downtown location (uptown, midtown, etc.)
__ Suburban area
__ Industrial park
__ Business park
__ Rural area
15. What is the age of this facility? (To be calculated from the year it was built)
__________ years
16. What is the zip or postal code of this facility? ___________________
17. In what year was the last major renovation of any type performed at this facility? __________
a. What type of renovation was this? (roofing, HVAC, windows, etc.)______
18. This facility operates and is heated and cooled for occupant standard use:
Days / week _______ (1-7)
Hours / day _______ (1-24)
19. Does this facility have a central mechanical plant that serves multiple buildings? (electricity, steam, chilled water)
__ Yes
__ No
20. Which of the following best describes the status of your current buildings with respect to green certification?
__ Manage or occupy at least one green certified building
__ Manage or occupy building(s) with green elements but no certification

120
__ Manage or occupy building(s) with no green elements
21. What is the total number of full- and part-time employees, contract workers or
tenants that occupy space at this facility? ___________________
22. What is the average annual vacancy rate at this facility? ___________________ %
23. ___________________ IFMA Exterior Gross Area (ASTM E1836-08)
The area of the floor measured to the outside face of the walls that enclose the floor(s) of the
building. This includes interior areas, exterior gross to dominant portion, interior parking, excluded,
interstitial and restricted headroom areas.
24. ___________________ Plannable Gross Area (ASTM E1836-08)
The gross area minus exterior walls, major vertical penetrations and interior parking spaces
Plannable Gross Area – the portion of a floor that is totally enclosed within the interior face of
perimeter encroachments at the floor plane and where there are no perimeter encroachments
enclosed at the inside finished surface of the exterior walls.
a. If another floor area measurement is used, please specify: ___________________
25. Developed land (built, paved, or landscaped) on facility site __________________
__ Acres

121
__ Hectares
(Include “natural” or “native” areas only if actively maintained.)
JANITORIAL COSTS
26. Please select the method your facility is cleaned: ____ team cleaning (Several specialized (bathroom tech, duster cleaner, etc.) personnel cleaning a specific areas ____ area cleaning (single personnel responsible for all duties i.e., dusting, bathroom etc.)
27. Janitorial costs are costs associated with the cleaning of offices, other work areas, restrooms and common support space. These include wages, benefits, staff support, supervision, administration, supplies, paper goods and non-capital equipment (e.g., brooms, floor polishers). Please include service providers’ costs and/or any supplemental cleaning services provided by landlord.
Total annual Janitorial Costs $ ______________ .00 Non-Capital equipment is defined as tangible, non-consumable property with an acquisition cost of </= $2,000.00. Non-Capital equipment has a normal useful life of at least one year, is not permanently attached to or incorporated in buildings and grounds, and is used to conduct business. The cost of equipment includes the purchase price plus all cost to acquire (tax, shipping and handling), install and prepare equipment for its intended use.
28. Please estimate how your janitorial costs provided in Q27 are divided among the
following categories:
_____ % In-House Staff (to include wages & benefits) _____ % Contracted labor [DEFINE CONTRACTED LABOR HERE] _____ % Supplies (including paper goods, Cleaning supplies, Non capital equipment) = 100%
(INSERT DEFINITION FOR SPECIALIZED CLEANING HERE)
29. Does this facility require specialized cleaning or labor for clean rooms, secured areas
(labs, data centers, etc.) or any other specific areas? Yes, Please Specify Total Cost ______________ Total Plannable Gross Area ______________ No
30. Are specialized cleaning services contracted out (outsourced)?
___ Yes. ___ No

122
JANITORIAL PRACTICES
31. Number of FTEs allocated to janitorial function: ______________ Janitors ______________ Janitorial Supervisors ______________ Project cleaners/special cleaning/floor crew
For contracted services:
32. Number of in-house employees supervising contract: ______________
33. Number of years existing contractor has been in place: ______________
34. When your janitorial contract comes up for renewal, are you likely to: __ Renew the contract with the same provider __ Re-bid the contract __ Move janitorial back to an in-house function
Janitorial 35. What percentage of your janitorial contract is based upon:
_____ % Performance _____ % Tasks and frequency = 100%
36. Does contractor provide: (Check all that apply)
__Supplies __Paper products __Equipment __Background checks __Training
37. When is your primary cleaning done?
__Normal work hours __Before/After work hours
38. Please indicate how often the following janitorial tasks are performed:
1 = More than once a day 5 = Bi-weekly 9 = Annually
2 = Once a day 6 = Monthly 10 = As required
3 = Semi-weekly 7 = Quarterly 11 = Not performed

123
4 = Weekly 8 = Semi-annually
___ Trash removal ____Sweep/mop tile/composition flooring ___ Upholstery vacuuming ___ Recyclables collected (should this be in the sustainability section?) ___ Carpet vacuuming ___ Spot clean glass/entrance doors ___ Spot carpet cleaning ___ Spot clean walls/switch plates ___ Entire carpet cleaning ___ Interior window/window blind cleaning ___ Restroom cleaning ___ Exterior window washing/cleaning (high-rise) ___ Steam cleaning of ceramic walls ___ Clean light fixture/ventilation grilles ___ High dusting (60” or higher) ___ Low dusting (lower than 60”, includes furniture) ___ Dust /clean desk equipment (phones/keyboards) ___ Data center cleaning ___ Sanitize telephones and/or keyboards ___ Kitchen/breakroom cleaning and/or Workroom cleaning
39. Please specify the floor area cleaned (if different from Plannable Area) __________________
MAINTENANCE PRACTICES
40. What type of system are you using for maintenance management? (Check all that apply) __ Building Information Modeling (BIM) __ Computer Aided Facility Management (CAFM) system with maintenance module __ Computerized Maintenance Management System (CMMS) __ Integrated Workplace Management System (IWMS) __ Manual spreadsheets __ Excel spreadsheets __ Other: _________________________________________________________________________
41. Is your maintenance management program managed:
__ In-house __ Contracted Out

124
__ Combination of In-house and Contracted out
42. What type of maintenance productivity metrics do you collect? (Check all that apply) __ Cost/ft2 or m2
__ FTE/ ft2 or m2
__ Response time for work requests __ Utility and/or equipment downtime __ Percentage of work orders closed on time __ Number of service complaints __ Percentage of budget spent on breakdown (unplanned) maintenance [ __ Corrective backlog maintenance completion __ Planned (or preventative) maintenance completion DEFINE THIS] __ Other, please specify ______________________________________________________________
43. For work requests, do your customers: (Check all that apply)
__ Fill out a paper request __ Send request electronically __ Contact a call center or help desk, i.e., a centralized location for all services __ Contact the individual FM function or service needed __ Personally tell maintenance personnel __ Other __________________________________________________________________________
44. Which of the following electronic hand held devices do Service staff use for documentation of work orders, PMs? (Check all that apply) __ PDA __ Smart phone __ Tablet __ Other
The next five entries pertain to maintenance costs. For each of the following five categories, please include all repair, preventive, materials, direct labor and contract costs. For those who manage leased facilities, in both sole-occupant and multi-tenant spaces, some of these costs may appear in common area maintenance (CAM) charges or building operating expenses from the landlord or property manager.
45. Annual cost of external building maintenance $________________.00 (% ______) • Roof • Skin (siding, masonry, sash, glazing, window washing, external doors) • Exterior signage
46. Annual cost of interior systems maintenance $________________.00 (% ______)
• Electrical systems (primary and secondary systems, emergency electrical systems, UPS, lighting systems,
• egress signage, master clocks, fire/life safety systems and alarms and remote monitoring, elevator • maintenance/repair)

125
• Mechanical systems (HVAC, chillers, boilers, plumbing, extinguishing systems, back flow prevention,
• compressed air refrigeration and non-process related pumps) • Building and general maintenance (interior walls, doors, ceilings, partitions and interior finishes,
pest control) • Interior signage • Admin support services – trouble desks
47. Annual cost of roads and grounds maintenance $________________.00 (% ______) • Roadways, sidewalks, parking lots (paving repairs, sealing, striping, parking, roadway lighting, power • washing), snow removal, de-icing • Landscaping (planting, mowing, irrigation) • Parking structures (surface repairs, sealing, striping, lighting and drainage systems) • Storm sewers (catch basins, manholes, sub-surface drainage systems) • Underground fire systems and hydrants
The following two maintenance categories apply primarily to facilities with central plants and/or large
manufacturing plants. Please provide your expenses not already included in line items above if your facility incurs these maintenance costs
48. Annual cost of utility/central system maintenance $________________.00 (% ______) • Electrical (generation/distribution) • Mechanical (steam, hot & cold water systems)
49. Annual cost of process treatment and environmental systems $________________.00
(%_______)
• Process cooling water systems • Process gas systems • Air discharge scrubbers • Waste water systems • Water treatment plants • Incinerator operation • Solid waste management system (not solid waste costs)
50. Annual cost of technology $________________.00 (%_______) • ADD IDENTIFIERS WHAT THIS CONSISTS OF
51. Annual cost of security $________________.00 (%_______) • ADD IDENTIFIERS WHAT THIS CONSISTS OF
52. Total Annual Maintenance Costs $____________________________ (this will total automatically – text for programmers)
53. What percentage of your total annual maintenance costs was spent on preventive
maintenance versus unplanned repair/breakdown maintenance? _____ % spent on preventive maintenance _____ % spent on reactive (repair/breakdown) maintenance _____ % spent on predictive maintenance = 100%

126
CURRENT REPLACEMENT VALUE (CRV)
54. If your facility is owned by your organization, what is the estimated CRV?
55. What is your facility/building area ____________ sq ft or M2 56. 44a. Current Replacement Value $ ________________ .00
Current replacement value is defined as the total amount of expenditure in current dollars required to replace the organization’s facilities to its optimal condition (excluding auxiliary facilities). It should include the full replacement cost for all buildings, grounds, utility systems, and generating plants. Furthermore, it should meet the current acceptable standards of construction and comply with regulatory requirements. Do not use: Insurance replacement values, book values, cost of contents. ((NEED TO MAKE SURE TO INCLUDE DEFINITIONS FOR PREVENTIVE, PREDICTIVE, PLANNED, DEFFERED, CRV, etc)) DEFERRED MAINTENANCE
57. What is your current estimated amount of Deferred Maintenance? Deferred maintenance $ ________________ .00 This estimate should not include projected maintenance, replacement or other types of work, such as program improvements or new construction, as these items are considered capital projects. CAPITAL RENEWAL
58. What is your current budgeted amount for Capital Renewal? Capital Renewal $ ________________ .00 Capital renewal is a systematic management process to plan and budget for known cyclic repair and replacement requirements that extend the life and retain usable condition of facilities and systems and are not normally contained in the annual operating budget. Capital renewal is a planned investment program that ensures that facilities will function at levels commensurate with the academic priorities and missions of an institution. Included are major building and infrastructure systems and components that have a maintenance cycle in excess of one year.
59. Overall Facility Condition Index is ________________ % The facility condition index (FCI) is expressed as a ratio of the cost of remedying existing deficiencies, plus capital renewal required to bring the building to its original design condition to the current replacement value. FCI is often based on a facility condition assessment provided by a qualified professional assessment team. ( FCI = Deferred Maintenance + Capital Renewal) divided by Current Replacement Value) MAINTENANCE PLANNING HORIZON
60. Do you have any type of maintenance plan? __ Yes (If yes, present next group of related questions __ No (if no skip this section
61. What type of a maintenance plan do you support: __ HVAC __ Electric __ Grounds

127
__ [List out other types of plans] __ Other: ________________________
62. If yes, what is your maintenance planning horizon in general overall? __ 1 year __ 5 years __ 10 years __ Other
63. How often are your maintenance plans reviewed?
__ 1 year __ 2 years __ Other
MAINTENANCE STAFFING
64. How many full-time equivalent (FTE) workers are used for base building operations and maintenance at this facility?
You may use fractional FTEs. For example, if your carpenter does 50% carpentry, 25% painting and 25% locksmith work, please allocate 0.5, 0.25 and 0.25 in the corresponding categories. Use the following definitions in providing worker counts. DEFINITIONS: Full-time Equivalent (FTE) – The operational and supervisory “person year” headcount that delivers a facility service on an annual, full-time basis, calculated on a 40-hour work week (2080 hours/year.) Maintenance Workforce – Exclude those who do primarily automotive, grounds or janitorial work in your totals. Administrative Support – Administrative support includes help desk personnel and al other who perform administrative support, including all front office staff, budget, planners, schedulers, receptionists, CMMS administrators, and estimators. Maintenance Management – Group supervisors and salaried managers involved in operation and maintenance of the facility.
65. Maintenance Workforce
# of in-house FTEs
# of contract FTEs
# of shifts per day
# of days per week
Carpenters
Controls & low voltage
Electricians
Generalists

128
HVAC & central plant
Locksmiths
Mechanics
Painters
Plumbers
Stationery engineers
Other FTEs (Please specify)
Maintenance Workforce Totals =
66. Maintenance Management
# of in-house FTEs
# of contract FTEs
Group Supervisor (ex.
Foreman) “first line
supervision”

129
Operations and
Maintenance
Manager “second line
supervision and above”
Other Maintenance
Management FTEs
Maintenance Management Totals =
67. Administrative Support
# of in-house FTEs
# of contract FTEs
Help desk
Administrative
assistant
Other administrative
support FTEs

130
Administrative Support Totals =
68. Total Maintenance Staffing = Staffing =
(have programmer calculate result)
Sustainability Section Definition: Sustainability in Facility Management entails operations and maintenance of the built environment so that organizations thrive and are sustained into the future. Activities are undertaken with consideration of their environmental impact, their cost effectiveness and their contributions to the health and safety of all personnel.
69. Which of the following elements have you incorporated into your janitorial practices? (Check all that apply)
__ Green cleaning certified staff or contracted service __ Implemented a green cleaning training program for janitorial staff __ Green cleaning training is tracked and documented __ Janitorial procedures are audited on a periodical basis __ Green cleaning procedures are documented __ A daytime cleaning program has been implemented in the facility
70. Which of the following green cleaning products and equipment have been
incorporated into your janitorial practices? (Check all that apply)
__ Use cleaning chemicals that meet green cleaning certified standards __ Use automatic chemical dispensers to reduce exposure and ensure proper dilution __ Eliminated all disinfectants and sanitizers, except where specifically required __Reduced or eliminated plastic trash liners (substituting vegetable-based or re-usable liners) __ Use janitorial paper products made with recycled content or rapidly renewable resources __ Replaced multi-fold hand towels with hand dryers

131
__ Use microfiber wipes and mops instead of traditional dusters, dust mops, and damp mops __ Have an effective walk-off mat system outside and inside each entry __Use vacuum cleaners with high-filtration filters __ Utilize Vacuum cleaners with a decibel level less than 70 __Standup/upright vacuum cleaners are still used
NEW QUESTIONS 71. Are there any local legislative mandates that dictate how your facility operates?
__ Yes __ No (skip to Q53)
72. If “yes” check all those that apply
__Water __Electricity __Carbon reporting __Waste stream management __Energy star scores
73. Do you have an environmentally preferred purchasing program?
__ Yes __ No
(NEED DEFINITION WHAT THIS IS. COULD BE CALLED LIFE CYCLE COST ANALYSIS, ROI ANALYSIS)
74. Is a life cycle assessment conducted for purchases? __ Yes __ No
(IS THERE A DEFINITION FOR “MEASUREING AND MONITORING”)
75. Is there a formal measuring and monitoring process in your facility? __ Yes __ No
76. Which of the following best describes the status of your current buildings with respect to green certification? We manage or occupy at least one green certified building We have plans to undertake green building certification in the next 12 months We manage or occupy building(s) with green elements but no certification We manage or occupy buildings with no green elements
77. Does your organization participate in ENERGY STAR or other energy monitoring programs? Yes

132
No
78. Please specify your building’s energy star score ________________________ Click the following link to sign up to share your facility’s ENERGY STAR SCORE with IFMA. ENERGY STAR Sign Up
79. Do you have a recycling program in place? __ Yes __ No (Skip to Q. XX)
80. Which recycling programs do you currently have in place? (Check all that apply)
__Paper __Aluminum cans __Computer parts __Fluorescent light bulbs __Carpet __Batteries __Plastic __Ink cartridges __Cardboard __Kitchen oil __Construction debris __Other, please specify ______________________________________________________________
81. What is your percentage of solid waste diverted from landfill, either through recycling
or composting? ___________ %
UTILITY HEADER
82. Are water costs combined with sewage? __ Yes __ No
83. Utility costs are costs associated with providing electrical power, potable
water, and central heating and cooling and sewage service to the facility. Utility costs include the purchase cost of oil, gas, water and electricity and all associated transmission costs. Utility costs also include sewage service, central steam and cooling. NOTE: To ensure consistency, please continue to report your values (currency and units of measurement) as you did in previous questions.
Annual Cost and Units Consumed Annually
Energy Line Item Annual Cost Unit
Electricity (main grid) $_________ _________ kWh

133
Electricity (renewable) $ _______ _________ kWh
Etc. Etc. Etc.
Electricity (main grid) $ __________________ .00 __________________ kWh Electricity (renewable) ______________ kWh Fuel Oil $ __________________ .00 __________________ gallons/liters Gas $ __________________ .00 __________________ therms/m3 Steam (per 1000) $ __________________ .00 __________________ lbs / kgs Chilled Water $ __________________ .00 __________________ Day - tons Water $ __________________ .00 __________________ gallons/liters (If purchased) Sewage $ __________________ .00 __________________ gallons/liters (If not included with water) Other $ __________________ .00 Please specify ____________________ Total Annual Utility Costs $ ________________________ (this will total automatically)
UTILITY MANAGEMENT PRACTICES
84. Please specify the unit of temperature you use. ___°F ___°C
85. What are your summer and winter space temperature standards?
Summer high: __________ Winter high: __________ Summer low: __________ Winter low: __________
86. Compared to the year prior to the reporting year, by what percentage has
your utility consumption changed, if any? Decreased or Increased > 10.0% 0.1% – 5.0% 5.1% – 10.0% 5.1% – 10.0% 0.1% – 5.0% > 10% No change
87. The difference in utility consumption is primarily the result of:
__Expanding total space __Reducing total space __Implementing specific energy management/conservation practices __Net usage reduction __Increased number of cooling/heating degree days for the year __Decreased number of cooling/heating degree days for the year __Other _____________________________________________________________________
88. Which of the following energy management practices have you undertaken
to reduce utility usage, if any? (Check all that apply)
EQUIPMENT AND CONTROLS __Recommissioned building systems __Installed energy-efficient motors

134
__Installed energy-efficient ventilation equipment __Installed energy-efficient chillers __Installed energy-efficient heating equipment __Set back thermostat __Installed energy efficient air compressors __Adjusted operating hours of HVAC __Repaired compressed air and steam leaks __Increased the number of items monitored/controlled through building automation systems __Require the purchase of energy-efficient selections, e.g., Energy Star-rated equipment __Installed electrical sub-metering for usage tracking of sub-units __Installed variable speed drives for pumps and motors __Monitor power quality to balance loads and reduce waste heat __Implemented smart metering __Implemented smart or automated demand response __Asset direct metering eg. Pumps, Motors, etc. __Change pneumatic controls to digital
ties BUILDING AND ENVELOPE __Installed energy-efficient windows __Improved building shell insulation __Performed thermal imaging study to detect a building’s sources of heat loss, e.g., motors, electrical panels, and building envelope WATER __Installed low flow water fixtures __Installed waterless urinals __Implemented cooling tower blowdown recycling __Implemented rain harvesting __Planted native/drought tolerant plants __Installed computerized irrigation controllers __Reduced or eliminated irrigation __Use gray (reclaimed) water LIGHTING __Replaced existing light fixtures with new light fixtures __Retrofitted existing light fixtures __Installed energy management system __Installed occupancy sensors __Implemented daylight harvesting __Selectively reduced the number of lamps in over-lit areas __Adjusted operating hours of lighting RENEWABLE __Installed solar systems for electric use __Installed solar systems for heat use __Installed a wind generation system for electricity __Installed a geo-thermal system __Purchased green power from an outside source __Uses alternative or renewable energy (solar, geothermal, wind, biomass, fuel cells)

135
__Has onsite power generation __Has electric vehicle charging stations __Solar power for hot water EMPLOYEE AND TENANT TRAINING __Provided training to FM staff to reduce energy use __Promoted energy use reduction to employees/tenants STRATEGY PLANNING __Hired an energy consultant to find ways to improve energy efficiency __Conducted energy-related due diligence for new real estate __Conducted an energy audit __Put into place a strategic energy management plan __Has a written plan for strategic energy management in place
Utilities 89. Do you have a dedicated in-house workforce for energy management
(procurement, conservation, tracking, net usage reduction)? __ Yes __ No (Skip to Q. 70)
90. Please provide the number of In-House FTEs _________
91. Please provide the number of the Outsourced FTE’s ________
92. Is your facility’s utility management program managed by a Building
Automation System (BAS)? Yes No (Skip to Q. 41)
93. Does your BAS provide utility use trends and energy management
summary reports? Yes No
94. Is your BAS system: (Check all that apply)
__Pneumatic __Direct Digital Control (DDC) __DDC/Pneumatic retrofit
95. Is your BAS a single integrated system for multiple buildings?
Yes No
96. Do you use your BAS report output in your decision making or planning
process? Yes No
____________________

136
Output - From a benchmarking perspective, the type of KPI/metric comparative benchmarking data we would like to see as an output in the report is:
1. Energy Utilization Index (kBtu/SF-year) 2. Data reported in terms of region of the country (e.g. climate region), and facility use type. 3. Ranking of Energy Management Practices from most implemented to least implemented. 4. Cost of energy by source ($/SF)
a. Grid-purchased electricity b. Natural gas c. Fuel oil d. Purchased steam e. Purchased renewable resources (solar, wind, hydro, etc.))
SECURITY SECTION
97. Does your facility provide security operations? (((Need filter question here – so if the facility does not support/have security operations participants can skip section))
__ Yes
__ No (Skip to Q 86)
98. In which of the following areas does your enterprise have security operations (check all that apply):
Region No Operations
Operations but no Security
Services
Operations with Security Services
Northwest (Alberta, British Columbia, Idaho, Manitoba, Oregon, Saskatchewan, Washington)
West Coast (California, Hawaii)
Canada East (Ontario, Quebec)
Northwest (Connecticut, Delaware, Massachusetts, New Jersey, New York, Pennsylvania)
Midwest (Illinois, Indiana, Kentucky, Michigan, Ohio)

137
North Central (Iowa, Minnesota, North Dakota, Nebraska, Wisconsin)
South Central (Kansas, Louisiana, Missouri, Oklahoma, Texas)
Southwest (Arizona, Colorado, New Mexico, Nevada, Utah)
Mid-Atlantic (District of Columbia, Maryland, South Carolina, North Carolina, Virginia)
South (Florida, Georgia, Tennessee)
International (Asia Pacific, Caribbean & Latin America, Europe, Africa and Middle East)
99. Number of FTEs (in-house and/or contracted) allocated to security function: ______________ Security supervisors ______________ Security officers
100. Are security services conducted:
__ In-house
__ Contracted (If contracted skip to 74a)
_ Hybrid (In-house and Contracted)
For contracted services: a. Number of in-house security employees supervising contract security:
_____________
b. Number of years existing contractor has been in place: ______________
c. When your security contract comes up for renewal, are you likely to: __ Renew the contract with the same provider __ Re-bid the contract __ Move security back to an in-house function
101. Are your security officers armed?

138
__ Yes
__ No
102. Compared to your 2014 security operating budget how has your budget changed in 2015?
__ Increased
__ Stayed the same
__ Decreased
__ Don’t know
103. By what percent has your security operating budget increased in 2015 compared to 2014?
_______________% (Please enter only whole numbers and not ranges).
104. By what percent has your security operating budget decreased in 2015 compared to 2014?
_______________% (Please enter only whole numbers and not ranges).
105. Approximately, how many employees are in your overall organization?
_______________(Please enter only whole numbers and not ranges).
106. What is your organization’s 2015 security budget? Please provide organization-wide, global security budget including all security staff, hardware, software and depreciation for security equipment.
_________________________ Please enter only whole numbers and not ranges.
107. Do you have closed circuit television security?

139
_ Yes (if yes, ask Q82)
_ No
108. Who controls it?
INSERT OPTIONS
109. Who monitors it?
INSERT OPTIONS
110. Do you use Identification cards for facility access?
_ Yes (If yes, ask Q84a)
_No (if yes, ask Q85)
111. Who controls it?
INSERT OPTIONS
112. Who monitors it?
INSERT OPTIONS
113. Do you use biometrics for facility access?
_ Yes (if yes, ask Q85a)
_ No (if no, ask Q86)
114. Who controls it? ________________
(Insert choices here)
115. Who monitors it? _______________
(Insert choices here)
TECHNOLOGY HEADER
116. Does your company use Computer Monitoring Maintenance System (CMMS):
__ Yes (if yes, check applications used- below)
__ No (Skip to Q88)

140
Preliminary Key Performance Indicators
Yes No
Customer Perspective 1111111111111111 444444444444444444444444444
Work Order Response Time
Percent Rework (Call Backs)
Customer Satisfaction
SLA Performance (APPA LOS)
Process Perspective 1111111111111111 111111111111111111111111111
Craft Utilization/Productivity
PM to CM Ratio
PM/PdM Compliance
Work Order Aging (Trend)
Employee Perspective 1111111111111111 111111111111111111111111111
Staff Turnover
Stewardship Perspective 1111111111111111 111111111111111111111111111
Cost/GSF Benchmarks
Facility Condition (FCI Trend)
Total Cost of Ownership (TCO)
117. Does your company currently use Computer Aided Facility Management (CAFM)?
__ Yes (if yes, check applications used- below)

141
__ No (Skip to Q89)
118. [FOR EACH TECHNOLOGY / IT SYSTEM BELOW, CONSIDER ASKING A QUESTION THAT CAPTURES THE VALUE THE FM ACTUALLY GETS FROM THE TOOL. For example, “What value has [the system] brought to your organization? Or maybe, “What is your level of agreement with the following statement: [the system] make my job easier. “Strongly Disagree Disagree, etc. etc.”
119. Which of the following does your company use CAFM to measure:
Yes No
Asset inventories
Space utilization
Personnel and staff levels
Communication patterns
Real Estate
Project Management
Safety and environmental conditions
120. Does your company presently use Facility Management Information System (FMIS):
__ Yes (if yes, check all applicable options below)
__ No (Skip to Q90)
Yes No
Asset Management
Work Management

142
Space Management
Project Management
Budget Management
121. Does your company presently use Integrated Workplace Management System (IWMS):
__ Yes (if yes, check components/applications used- below)
__ No (Skip to Q92)
Yes No
Real estate and lease management
Facilities and space management
Maintenance management
Project management
Environmental sustainability

143
122. Does your company presently use Building Information Management System (BIMS):
__ Yes (if yes, check applicable items used- below)
__ No (If no, skip to Q93)
Yes No
3D visualization of buildings
Change management
Construction simulation
Data management
Operational management
123. Does your company use Building Management/Building Automation System (BMS/BAS):
__ Yes (if yes, check applications used- below)
__ No
Yes No
Building Automation
Energy Utilization Tracking
Energy Demand Management
Used with EMS component
IFMA would like to thank you for participating in this effort. Provided IFMA attains the sample needed to allow for statistical representation to support different industries, this electronic report should be ready for distribution to participants in late December 201

144
APPENDIX D: SME COMMENTARY
SME 1
O&M Survey
Q22
In intro, say ‘will be provided to you’ instead of ‘participants’ to make it more personal.
The suggestion of sources may be confusing, you ask for 2015-2016 budget but not all orgs have that budget year, many will be calendar. So, should ask for last fiscal year (actuals) or the most recent 12 month actuals. I would suggest the last fiscal and ask them what the period is for if necessary.
Q199
Need different questions.
In House FM Manager OR Outsourced FM Manager
Why ask if they are a consultant, they don’t manage buildings and this is about the buildings.? If you think a consultant is answering FOR the FM, then add a note and ask whether it is for inhouse or outsourced. [Make clear that they don’t have to reply. Option “does not apply”].
Q163
At the bottom suggest they fill In more than one survey for additional buildings. (make sure this will be possible) [note at the end for the end]
Q11 [general industry] + Q10 [service based]+ Q26
I thought we were trying to reduce the #. Did the past responses inform these list? [point of clarification]
Plus, when I indicate Services (banking/hospitality, health care, etc.) in the first Q11, in the next Q (Q10)it then includes media IT, Trade, Transport, Utilities in the next question Seems odd.
Then later it asks me the predominant use of the facility in Q26
This does not make sense and needs to be reconciled. [jd – first line of questioning is on industry that facility serves. Second line of questioning is on the predominant use of facility – this distinction allows for variable use of facilities within industries, such as the office headquarters of a large Healthcare Services company]
Q24

145
You tell them at the intro to chose ONE building, so why are we asking the multiple buildings question? They were not given the choice of reporting on multiple buildings at the start. [take out # of building question]
Q25
These answers will likely be connected closely with Q23 so put them together. [leave as is]
Own and lease to others my be confusing. A company may own and occupy a building + lease space to thers. This was my situation at Bell Canada…
Q26
See above (Q11, etc.)
Q29
This is the 4th or 5th separate question about the type of building use/occupancy. Lets reconcile and make it easier….Adding Medical Office to this list does not make sense, the others relate to the type of occupancy, not the organization’s business function. [leave as is]
Q33
Combine industrial park/business park unless you know you want to analyze/report on these separately. I don’t know why you would want to. . [leave as is]
Q40
Since we ask for a single building, how will this question be used for analysis. It isn’t clear to me. Why is it asked. If you have to ask it, put the NO answer first, it will be the most common by far. [leave as is]
Q41
Again, you ask for one building, this relates to the portfolio so is highly confusing. And why isn’t this Q in the sustainability section? If it is about the portfolio overall, make it clearer in the question directions. [leave as is]
Q42
This will be confusing for some. If they are a tenant, you want the occupancy of the entire building? Yet they won’t be reporting the total cost for the entire building. [clarify of just space they are reporting on]
It needs to be reworded.
Q1
Suggest separate out the currency and metric question.

146
Many Canadians will probably have info by Sq.Ft. since it is still commonly used in facilites in Canada.
And it is not ‘English’ it is ‘Imperial’[make changes]
Q46
Do you mean the total area of the site or the area outside the building (not including the footprint of the building)? [including the footprint of the building]
Cleaning
Q164
Should tell them that the costing will be all asked at the same time at the end of the survey. [clarify at beginning]
Q63
That is sometimes known as ‘Cleanable area’ so perhaps should use that term as well. [add this in]
Q51
How will this question be used for analysis and reporting since we don’t ask how many sq.ft or other details to use for analysis. [leave as is]
Q58
This is not useful unless you ask a question about WHY they are doing that. I.e. contract ending, bad performance, etc. Should consider how and why this information will be used in the analysis / report.
Also, you ask about bringing in-house, but there is no question about moving to outsource. The first two questions don’t do that….[leave as is]
Q60
Clarify about what ‘provides’ means. When I was a contractor for jani, we provided paper products as part of our contract price for some and provided it at an extra cost for others. Clarity is needed. [clarify this]
Why are we asking about background checks? So minor it is not important. .[leave as is]
Maintenance

147
Q155
Same, tell them $ are asked later.
Q64
BIM is not used for Maintenance Management, remove it from the question. .[leave as is]
For the CMMS question, add the word ‘stand-alone’ in front. .[do this]
Q65
Not a clear question.
Do you mean the actual maintenance work or management of the process? Review this again
Remove Utility from the equipment downtime item.
Should not be #FTE/M, it should be M/FTE
Response is only a small part of the measurement, What about asking if they calculate the time to repair, which is more important? [jd – include]
What is Planned Maintenance (time/meter readings) completion ? This is not clear. Clarify
You ask for ‘corrective backlog maintenance completion’ which is a confusing statement, but you don’t ask for the preventive maintenance backlog, which is as important. [jd-include]
Q67
A common term is ‘occupant’, not just customer, so might want to add. [jd-include]
Does ‘send request electronically’ mean by email or a sophisticated web interface or on a mobile app? There is a difference so suggest you ask different questions.
Q68
You need to ask about whether they : use a paper process OR update on a desktop/laptop.
Q84
Do you mean a preventive maintenance plan? If they answerd CMMS/IWMS/CAFM in an earlier question, then the question is likely yes. Perhaps reword and put this with the system question. [jd-review this again – he may have point in using the word preventative – also 85 & 86]
Q85
I don’t understand what this question is. If filling it in, I would not know what to answer.
And grounds is very different from HVAC/Electrical.

148
Q86
What is this question? Again, I would not know how to answer. A Preventive maintenance plan is an annual plan with some periodic items up to about 5 years. That is common.
Do you mean capital replacement?
Q87
Why ask this? Why only 1 or 2 years?
Sustainability
Q90
You ask in the cleaning section about daytime cleaning, don’t ask again.
You ask more about documentation than practices.
Auditing jani processes is not about sustainability.
Needs to be reconciled.
For cleaning questions, should put in the cleaning section..(applies to Q90 and Q91)
Q91
There is some overlap wht the previous question.
Not all these things are about sustainability. Move to jani section.
Q200
Not clear about the formal measuring / monitoring answer – you mean for sustainability likely so add that.
Q97
Is a repeat from a previous question. Reconcile.
Utilities
Q164

149
If you are going to ask about the % change later, mention that. If you don’t, then ask for the% change here. Otherwise it is not helpful for benchmarking. [jd- leave as is comes up in cost section]
Q111
Wording could be better. ‘Do you use a BAS to help you manage energy conservation’ – [jd- change wording]
Security
Q117
Why the definition? Don’t have one anywhere else. It is most often simply called security or security services, not security operations.
In the question, don’t ask is Facility Management responsible’
Ask ‘Are you responsible’ or ‘is your FM department responsible’ – [jd-already changed]
Technology
Q184
I recommend eliminating the neutral answer in the middle but adding a ‘not applicable’ answer. [jd-leave as is]
Q185
I have a hard time understanding this. By software/it, do you mean CMMS/CAFM? If so, how can the answers include multiple times over the past 2 year.
If you are assuming they are involved in IT projects (beyond MACs) then that needs to be clear. But hardly any are….
Q186
Same issue with intent/purpose.
And why the details here when you don’t ask anything like this for other services?
Q186
Same issue.

150
Q170
We don’t ‘partner’ they are supplers. So please change question.[jd- this may need changing]
One answer is ‘we don’t use’ a FM software yet we ask them this exact question further up. Should be skipped. Or ask this question when you ask about FM – [ jd -add skip logic based on 0 answer from 185]
In any case, we should not be naming suppliers in an IFMA questionnaire so this shold be removed. There are many, many other software providers who are not listed and it may look bad as a result. [jd- trying to gather software solution providers, others will be listed in report as they are reported]
Organizational
Q188
Some of these are very similar or essentially the same things.
(performance model, KPI, balanced scorecard) [ jd – they are similar and may overlap: working on reviewing research for specifics to help, may need to revise slightly to help with validity of question for thesis topic – we can discuss]
Q193
Should clarify that you mean a general occupant survey. They may do other things (post occupancy, transaction) that are very different. [jd-include “or general occupants”]
Q194
This is a long form answer, the first (and only?) but the purpose of the survey is to get metrics that can be analysed. Should have choices. [ jd – will be easier to categorize, interpret – but would need to generate list of likely actions – will review research]
Q23
One answer is that the FM department reports to Facilities. That is circular and should not be an answer.
Do you mean Corporate Real Estate department instead? (which may include ]leasing/sales/development not part of the fm department) [jd – second person who has mentioned this?]
Q204
Nobody will understand the difference between this question and the previous one.

151
Q9.
Change question. What if an admin or an FM coordinator or technician is responding?
Do you mean the total FM organization?
Do you mean the FM staff at the building that is being reported on?
What if the fm is regional, won’t apply to the building or the portfolio.
Change this question to be clearer.[jd-could use some clarity]
Costs and Staff Levels
Q173
I strongly disagree with this approach.
If an FM does not have the numbers, they should not be filling in the survey or be an FM! If they don’t have an account code for something specific that needs to be reported, they should estimate, not provide a range.
If you must do this, then don’t tell them that ranges will save them time.
Tell them they can use ranges only if they don’t have the actual numbers to report.
Q174
Change wording, nobody downloads a ‘paper form’
Same on Q190 to download.
I really hope this will be an excel spreadsheet. IF so, tell them….
Q192
Upload a scanned copy? Clarify
What about just uploading the file itself? (i.e. a completed excel form.
Why would they scan it?

152
SME 2
1. What are the Q numbers? They are random in isolation (Q22, Q3, etc) at first, but seem to be more or less sequential later.
2. The first underlined part (“2015-16 FM Budget…”) needs a carriage return in the middle to create a second line.
3. Q12 doesn’t have an obvious business/industry choice – where does, say AMEX’s FM click? I guess “other”, but it seems companies would be a big source of data for this survey – that’s what IFMA members should most be anyway.
4. The running commentary at the top of each new page is good – it makes me smile when I’m taking the survey. Not because they’re accurate, but because you know they’re purposely overly enthusiastic.
5. Q23 is a single choice question. It might be that someone has a dual reporting line though.
6. Q’s 50, 59, 79 let you move on even if the total is not 100% 7. Q71 second bullet (mechanical) needs a comma after “prevention” and optionally
after “refrigeration”. The list starts with HVAC, but lists chillers and boilers separately, which are technically part of HVAC. That might be modified a little: “HVAC/chillers/boilers”, something like that. It would look ok with “HVAC (including chillers, boilers, etc)” except it’s already all in brackets. It’s a fine point, but some FMs will look at that and think we don’t know what our terminology means, while other won’t even notice (or understand themselves possibly). Better to be exacting, I think.
8. Q72 second bullet “de-icing” is capitalized but doesn’t need to be. 9. On maintenance cost questions which have the final option of “exact cost”, how will
they be coded? Will they be lumped in with the pre-defined buckets? If so, what is the purpose of the added detail?
10. Q82 talks about the “academic priorities and missions of an institution”. Did I misunderstand the audience for this survey? I thought it was for all IFMA members, most of which will be with companies.
11. Q104 asks for the data in $, but earlier we had them specify which currency they were going to use.
SME 2 Responses
1. The Q numbers refer to the order in which the questions were entered into the survey. They only show to internal reviewers and are not present for the respondents taking the survey 2. That change has been made. Thank you for catching this. 3. Q12 is a follow up question to question 11. It is meant to further clarify when respondents pick "Other institution" in question 11 and only displays to respondents that make that selection. Business modalities are reflected in other follow up questions that follow question11. 4. Thank you. Hopefully it keeps it light and people motivated to complete it. 5. Thank you. The question is meant to be a single choice. We agree that the possibility could exist, however, even in such an arrangement, there is likely to be a primary department that they formally report to. 6. Thank you for catching this. I will update/revise the validation logic for this question. 7. Thank you for feedback. The changes have been made. 8. The change has been made. 9. The intent of the cost questions is to get the exact cost if they have them and to use the range values if they are uncertain. These values will be analyzed separately using the exact cost. We are in the process of clarifying this issue in the survey.

153
10. Agreed. We have replaced academic with business. Thank you. 11. We are checking on how the data displays and will make the revision.

154
APPENDIX E: SURVEY REVISIONS & CHANGES
November 5, 2016 O&M Detailed Survey Update
General Comments
• All of the major cost sections & detailed FTE counts have been moved to the END of the survey (grouped by custodial, maintenance, and utilities).
• The respondents will have the opportunity to print off a form that lists out the requested cost and FTE information. They can then use this form to input results on the online survey (or just simply upload a scanned copy of their survey – the results will then manually be inputted into the results for that respondent).
Questions for SMEs.
• (my suggestion is for the largest most active building) Can most FMs provide cost data for individual buildings, or is it easier to provide just a single lump sum for all of their buildings? Instruction states “All responses in this survey should be about the largest, most active facility you manage” – is this about the facility overall, or just a single building? Either way will work, just need to be clear.
Suggested Removals (“Q#” refers to the Qualtrics-created question number. The numbers have no specific meaning or relation to question order).
• Q2. Please describe the specific product, service or business activity of your organization or the organization you are contracted to manage
• (reinclude-unless this is covered elsewhere in the survey. We are making a push to include more universities and pharmaceutical companies on this effort) Q51. Does this facility require specialized cleaning or labor for clean rooms, secured areas (labs, data centers, etc.) or any other specific areas
• (This is one of the more asked about sections of the report, prized information. Although, some of these questions are now standard within the industry i.e.,

155
expected to have within buildings, I would highly suggest keeping this).The ENTIRE sustainability section:
o Q90. Which of the following elements have you incorporated into your janitorial practices? (Check all that apply)
o Q91. Which of the following green cleaning products and equipment have been incorporated into your janitorial practices? (Check all that apply)
o Q93. Which legislative mandates dictate how your facility operates (if any)?
o Q94. Do you have an environmentally preferred purchasing program?
o Q95. Is a life cycle assessment conducted for purchases?
o Q96. Is there a formal measuring and monitoring process in your facility?
o Q97. Which of the following best describes the status of your current buildings with respect to green certification
o Q98. Does your organization participate in ENERGY STAR or other energy monitoring programs?
o Q101. Which recycling programs do you currently have in place? (Check all that apply)
o Q102. What is your percentage (%) of solid waste diverted from landfill, either through recycling or composting?
• (Ok to remove) The Building Automation System (BAS) system details:
o Q113. Does your BAS provide utility use trends and energy management summary reports?
o Q112. Is your BAS system?
o Q114. Is your BAS a single integrated system for multiple buildings?
o Q115. Do you use your BAS report output in your decision making or planning process?

156
• (My question/statement is – this is not information the FM would have to find, it would be existing knowledge since s/he provides support for the building unless s/he is a new FM at that location – correct? The survey asks “Q152 which of the following energy management practices have you undertaken” and then lists Equipment and Controls, Building and Envelope, etc. etc. It then proceeds to ask the specific measures that were undertaken for each area selected to reduce energy usage. This detailed section is quite extensive (depending on which options they selected, the user might be asked to evaluate a maximum of 60 activities). Suggested to keep the main areas of energy reduction, but considering removing the details for each of these areas.
• Q110. Do you have a dedicated in-house workforce for energy management (procurement, conservation, tracking, net usage reduction)?
• (Question that comes to mind here is – is it common practice that one building supports multiple buildings? My assumption is yes, its good to know how many buildings support other buildings?) Does this facility have a central mechanical plant that serves multiple buildings? (electricity, steam, chilled water)
• (We should keep this in the survey. Although industry standard has changed from nine years ago, how many buildings still do not have “green certification”?) Which of the following best describes the status of your current buildings with respect to green certification?
• In the utility section, for steam it says “Steam (per 1000)”… what does the “per 1000” mean? Per 1000 _____ ?
Other Revisions / Information Needed
• (this will already be conducted by engaging via the bi-monthly meetings and other communication emails). FM Organization will take care of this. In addition to the normal distribution channels John identified, I think direct personal contact with each FM Organization chapter would help a lot. I would like to personally contact each chapter directly, on behalf of FM Organization. Could you please send me a list that contains the following:
o FM chapter name
o Chapter administrator name, email, & phone #

157
o Chapter president name, email, & phone #
o City
o State
o # of members in the chapter
• Please define “security operations.” (request made from professional development)
• (Should be only about the current building) Is the security operations budget just about the building / facility they are reporting on, or for their ENTIRE organization?
• (No) Can any of the following activities be removed from custodial?
o Trash removal
o Sweep/mop tile/composition flooring
o Upholstery vacuuming
o Recyclables collected
o Carpet vacuuming
o Spot clean glass/entrance doors
o Spot carpet cleaning
o Spot clean walls/switch plates
o Entire carpet cleaning
o Interior window/window blind cleaning
o Restroom cleaning
o Exterior window washing/cleaning (high-rise)
o Steam cleaning of ceramic walls
o Clean light fixture/ventilation grilles
o High dusting (60" or higher)

158
o Low dusting (60" or lower, includes furniture)
o Dust/clean desk equipment (phones/keyboards)
o Data center cleaning
o Sanitize telephones and/or keyboards
o Kitchen/breakroom cleaning and/or workroom cleaning
New Questions Added (I’m ok with the new questions)
Q185

159
(This should be a two part question at minimum. A) does the FM use integrated workplace management systems software– yes or no. If YES, which company(ies) do they purchase the software from? The approach from the company perspective vs

160
specific software is that it would be easier to determine the company and look at the different software’s vs listing all the different software’s out per company – what do you think?
The focus of this question is to get a feel about usage, as FM organization has not ever asked about this in a benchmarking aspect and
•

161
Questions Already Removed (can be added back in if wanted)
• (Reinclude this question) Please specify the _______% Leased, _______% owned (% Leased + % Owned = 100%)
• (Would this not be good to know, so the respondent can know what is the average renovation for facilities of XXXXX thousands of square feet?) In what year was the last major renovation of any type performed at this facility?
• (Lets include the latter part of your response of this question in the summary). The percentage allocation (%)for each maintenance area. The current survey structure does not easily allow for the inclusion of this. Plus, it appears to complicate the survey layout? We can include a percentage calculate as part of the final summary report if needed.
• Administrative support and related functions (in-house FTEs, contract FTEs)
• (Reinclude this question) Energy Star rating. If they even have the result, it will be almost useless because the rating must be in exact same location, reporting time frame as the rest of the survey. It’s almost like an apples vs. oranges comparison.

162
IFMA O&M Survey Changes Feb 4, 2017
• Q210 – changed date to May 2017 • Q216 – purpose of this question is just to identify the actual building or space being
report on. I know some organizations have the same address for all buildings, where as others might have something different. I imagine the responses would be something like “Corporate Headquarters” or “Tenant space – floors 1-3”
• Q24 - The largest most active “facility” the user’s manages could include multiple buildings. Certain parts of FM costs are step functions, so having the number of buildings (for example) might be useful in interpreting the data. Regardless, we are collecting the total square footage of the site (which will be used to calculate $/SF). Also, the intro states (Q163): “if you are unable to provide data about a single facility, you may elect to report data on multiple facilities.”
• Q108 – added “earlier” • Q170 – recommend to keep this as a single question for the sake of brevity. • [multiple questions] – moved “EXACT COST” to be the first option on all cost-related
questions. The reason it was at the end was formatting. The input box adds in some extra space when it’s listed first. We’ll contact Qualtrics about potentially adjusting this issue.
• Q44 & Q45 – clarified that the number should be for “the facility you are reporting on”, which may include either a single building, or multiple buildings.
• Q104 – clarified steam ($ / 1000 lbs) • Q185 – reduced # of projects. Clarified question wording. • Q60 – added “/ pay for” to clarify who pays / brings the products • Q85 – changed “support” to “have” • Q85 & Q86 – reduced time scale, changed options to be in month units • Q90 – change green cleaning training to say “regularly provided and documented” • Q90 – added text box to allow for users to provide other details on their green janitorial
practices. • Q204 & Q23 – still some confusion / merit of the report to vs. reside questions. • O&M Sampling of ranges: The use of cost ranges acknowledges that the quality of data
in exact values might not be as accurate as “+/- 5%”. An analysis of the 2012 O&M survey showed that 40% of all respondents rounded their answers (with almost half of these rounding by $10,000 or more). These ranges fall far outside of a +/- 5% accuracy. Instead, we are looking at the costs as categorical distributions. The expected result is that we will drastically increase the number of responses (and therefore getting a more accurate estimate of actual costs). If the detailed data from those who provide “exact costs” suggest that the costs are trending higher or lower within each range, the average estimates will be adjusted accordingly. The research team will also compare results from this study with the 2009 published report (#32). Any major discrepancies

163
will be subject to additional analysis and investigation. The goal is to have a +/- 5% range on the categorical costs (this is dependent on how many responses are received).
• Q66 – all of the piped text has been added in. • Q128 – year changed to 2016. • Q170 – recommend to keep this as a single question. Brevity. • Q211 – recommend to keep this question as is. The survey allows users to enter data
whether they have it as single numbers for their entire organization, or if they want to do it by individual buildings. This question appears if they say up front they are reporting on multiple buildings.
• Q198, Q59, Q79 – the reason why I did not “force” these to add up to 100 was that it would force the user to answer the question. If they selected “lease and own” (for example), but they don’t know what the percentages are, the survey will not let them move forward. However, I don’t mind forcing them. My recommendation: don’t force them to answer.
• Q1 & Q213 – all questions updated to reflect the currency symbol where appropriate. • Q133 – added question at very end for how they heard about the survey • Q134 – added consent to participate on the first page. OR, I can make this on its own
page. • Q170 – I’m still a bit uncomfortable with the software question. It could be off-putting?

164
APPENDIX F: MANUAL EXCEL COSTS FILE

165

166

167

168

169

170
APPENDIX G: MULTI-FACILITY COSTS FILE