community satisfaction benchmarking research …
TRANSCRIPT

Noosa Customer Satisfaction Survey 2017 MARKET FACTS (QLD) PTY LTD 1
COMMUNITY SATISFACTION BENCHMARKING
RESEARCH REPORT
FOR
NOOSA SHIRE COUNCIL
June 2017

Noosa Customer Satisfaction Survey 2017 MARKET FACTS (QLD) PTY LTD 2
TABLE OF CONTENTS
INTRODUCTION 3 Objectives of Survey 3 Themes of Council Responsibility 4 Structured Sample Survey 9 Briefing Material Supplied to Participants 9 Data Processing and Analysis 9 Reliability of the Findings 10
RESPONDENT PROFILE 11 OVERALL PERFORMANCE RATINGS 14
The Unweighted Overall Performance Rating 14 The Sample as a Whole – Direct Questioning 15 ‘Non-participants’ in the Survey 16 The Weighted Aggregated Total Performance Rating 16 COMPARISON OF PERFORMANCE INDICES 17
ANALYSIS OF KEY POINTS 18 Areas of Lowest Performance Relative to Importance 18 Areas of Highest Performance Relative to Importance 19 Areas of Average Performance 20 Areas of Least Importance 21
EVALUATIONS OF TOTAL PERFORMANCE 22 Weighted Performance Indicators 22 Basic Services & Infrastructure 23 Community Lifestyle Services 24 Managing the Shire 25 Customer Service and Communications 26 Qualities of Council 27
COMMUNITY RATINGS OF COUNCIL RESPONSIBILITY AREAS (THEMES) 28 IMPORTANCE 29
Theme 1: Basic Services & Infrastructure IMPORTANCE 29 Theme 2: Community Lifestyle Services IMPORTANCE 35 Theme 3: Managing the Shire IMPORTANCE 42 Theme 4: Customer Service and Communication IMPORTANCE 47 Theme 5: Quality of Council IMPORTANCE 51
PERFORMANCE 55 Theme 1: Basic Services & Infrastructure PERFORMANCE 55 Theme 2: Community Lifestyle Services PERFORMANCE 61 Theme 3: Managing the Shire PERFORMANCE 68 Theme 4: Customer Service and Communication PERFORMANCE 74 Theme 5: Quality of Council PERFORMANCE 78
PUBLIC OPINION QUESTIONS – KEY FINDINGS 82 SUMMARY 90 APPENDIX 97

Noosa Customer Satisfaction Survey 2017 MARKET FACTS (QLD) PTY LTD 3
INTRODUCTION Market Facts, was commissioned by the Noosa Shire Council in May 2017 to conduct a benchmark survey of community attitudes measuring levels of satisfaction with the services provided by Council. This survey also included ‘supplementary questions’ - public opinion measures of a number of other current issues that the Council requires community feedback on. Objectives of Survey
The objectives are to:
(a) Survey relevant categories of the members of the Noosa Shire Council community, in order to:
(i) provide measurements of residents’ attitudes and opinions, and (ii) provide diagnostic information and analyses,
regarding the extent to which the Council’s provision of works, facilities and relevant administrative services meets the community’s perceived priorities.
(b) Compare the results against the most recent (July 2015) Provincial LGA
‘norms’ established by the LGAQ’s biennial surveys.
(c) Provide number-based detail which can be used to calculate relative priorities between the 41* primary policy areas for which Council is responsible according to the “weighted averages” of community perceptions, after taking into account both existing Council Performance as well as basic community priorities (i.e. ratings for Importance).
*For LGAQ biennial surveys include 42 responsibility/primary policy areas. Noosa CSS deleted responsibility areas: ‘water supply’ and ‘sewerage’ (activities not undertaken by Noosa Shire Council) and included additional responsibility area – ‘disaster management’.
Noosa Customer Satisfaction Survey 2017 MARKET FACTS (QLD) PTY LTD 4
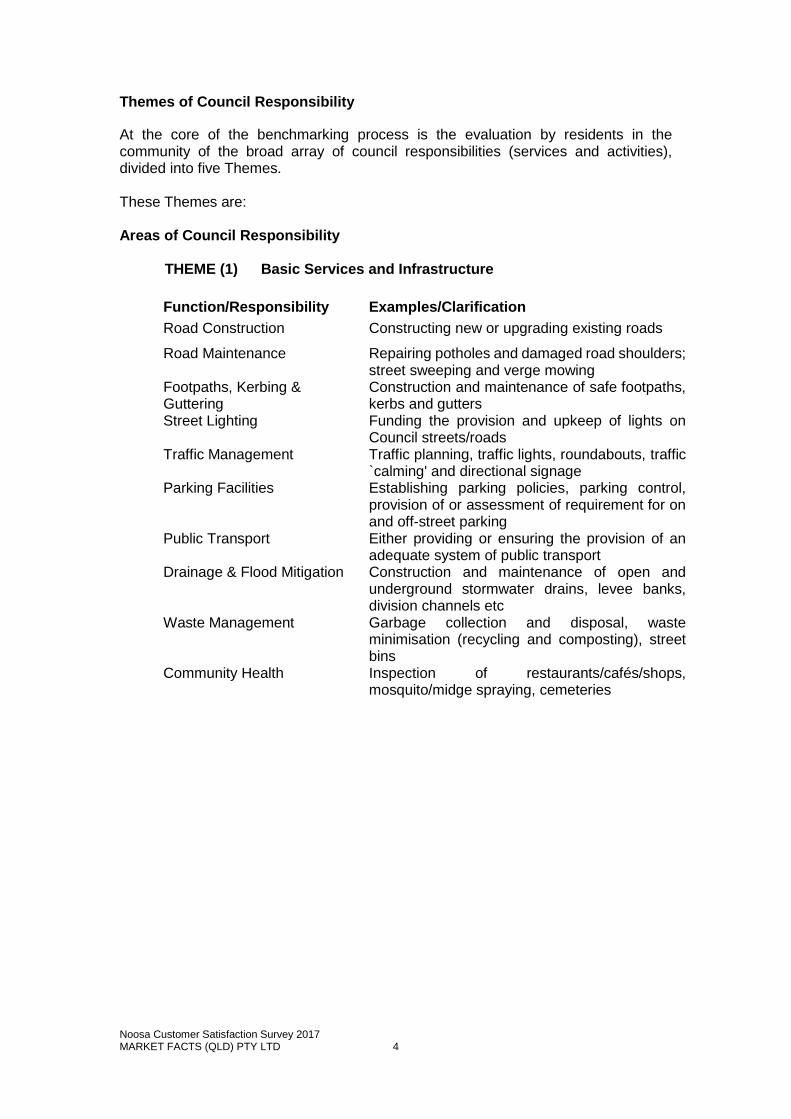
Themes of Council Responsibility At the core of the benchmarking process is the evaluation by residents in the community of the broad array of council responsibilities (services and activities), divided into five Themes. These Themes are: Areas of Council Responsibility
THEME (1) Basic Services and Infrastructure
Function/Responsibility Examples/Clarification
Road Construction Constructing new or upgrading existing roads
Road Maintenance Repairing potholes and damaged road shoulders; street sweeping and verge mowing
Footpaths, Kerbing & Guttering
Construction and maintenance of safe footpaths, kerbs and gutters
Street Lighting Funding the provision and upkeep of lights on Council streets/roads
Traffic Management Traffic planning, traffic lights, roundabouts, traffic `calming' and directional signage
Parking Facilities Establishing parking policies, parking control, provision of or assessment of requirement for on and off-street parking
Public Transport Either providing or ensuring the provision of an adequate system of public transport
Drainage & Flood Mitigation Construction and maintenance of open and underground stormwater drains, levee banks, division channels etc
Waste Management Garbage collection and disposal, waste minimisation (recycling and composting), street bins
Community Health Inspection of restaurants/cafés/shops, mosquito/midge spraying, cemeteries

Noosa Customer Satisfaction Survey 2017 MARKET FACTS (QLD) PTY LTD 5
THEME (2) Community Lifestyle Services
Function/Responsibility Examples/Clarification
Parks, Playgrounds & Public Amenities
Development and maintenance of open space areas, parks, children's play-grounds and public toilets
Environmental Controls Enforcement of regulations on air, water and
noise pollution
Environmental Protection & Conservation
Tree planting, bushland acquisition, noxious weeds eradication, foreshore protection, preservation of natural areas.
Heritage Protection Preservation of historic buildings, monuments,
facilities, artefacts, and indigenous & other records
Sporting & Recreational Facilities
Public swimming pools, sports-fields, land and/or support for clubs & their facilities
Cultural & Entertainment Facilities
Civic centre, public halls, art gallery/museum, community arts programs, community festivals
Libraries & Other Information Access
Public library, Internet access, CD ROM's
Community Safety Safety action plans, safety audits, signage, security patrols & cameras, beach & pool lifeguards, community education & awareness programs
Community Services Programs and facilities that meet the needs of a range of stakeholder groups (such as senior citizens, young people, families, indigenous, disabled, non-English speaking background)
Pet / Animal Control Registration, impounding of strays, control of
feral animals
Shopping Centres Ensuring the provision of adequate shopping
facilities to meet the needs and convenience of local residents
Community Development Working with (& supporting) community organisations and special-interest groups to develop strong, sustainable & self-reliant communities
Noosa Customer Satisfaction Survey 2017 MARKET FACTS (QLD) PTY LTD 6
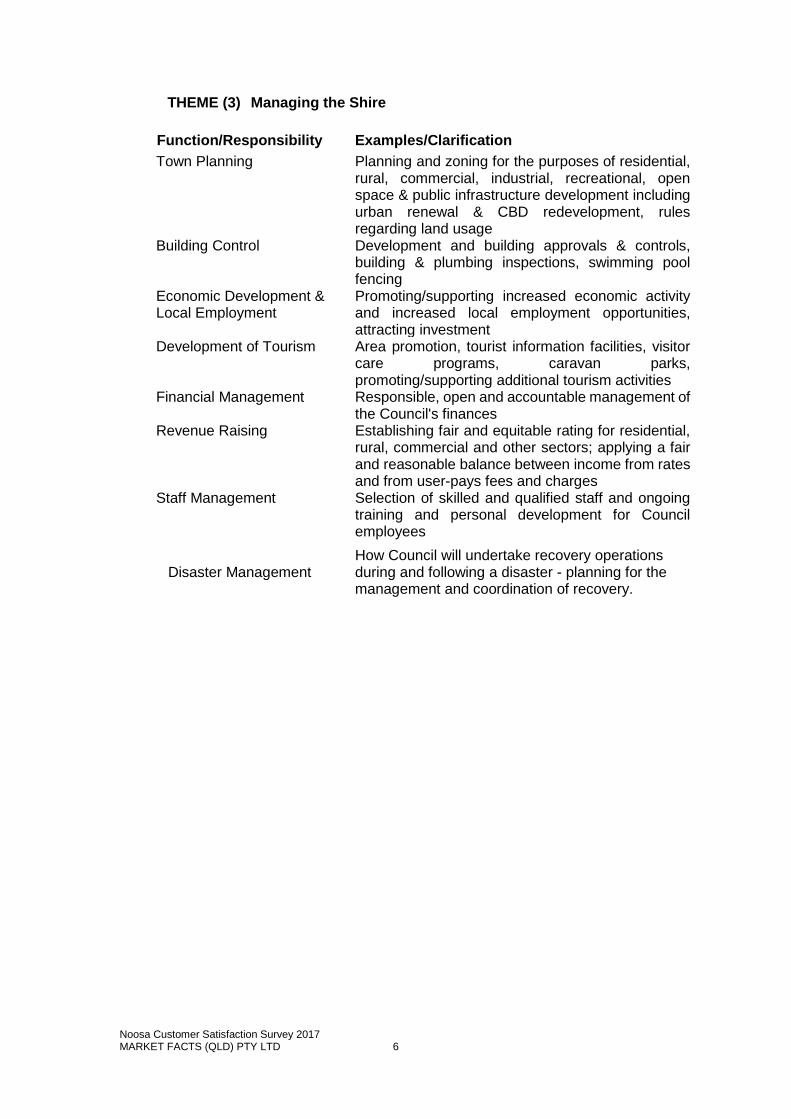
THEME (3) Managing the Shire Function/Responsibility Examples/Clarification
Town Planning Planning and zoning for the purposes of residential, rural, commercial, industrial, recreational, open space & public infrastructure development including urban renewal & CBD redevelopment, rules regarding land usage
Building Control Development and building approvals & controls, building & plumbing inspections, swimming pool fencing
Economic Development & Local Employment
Promoting/supporting increased economic activity and increased local employment opportunities, attracting investment
Development of Tourism Area promotion, tourist information facilities, visitor care programs, caravan parks, promoting/supporting additional tourism activities
Financial Management Responsible, open and accountable management of the Council's finances
Revenue Raising Establishing fair and equitable rating for residential, rural, commercial and other sectors; applying a fair and reasonable balance between income from rates and from user-pays fees and charges
Staff Management Selection of skilled and qualified staff and ongoing training and personal development for Council employees
Disaster Management
How Council will undertake recovery operations during and following a disaster - planning for the management and coordination of recovery.

Noosa Customer Satisfaction Survey 2017 MARKET FACTS (QLD) PTY LTD 7
THEME (4) Customer Services and Communication
Function/Responsibility Examples/Clarification
Customer Service Accessible & adequate facilities for dealing with and responding to contacts from stakeholders and the general public, handling enquiries / requests / complaints
Information Services Maintaining and updating databases on Council facilities & services including rates & property information, water/sewerage/drainage networks, community services, etc
Informing the Community Keeping the community informed of Council policies, plans, programs & activities through newsletters & other means, advising of community issues to be debated
Consulting the Community Ensuring community input into Council policies, plans & programs by regularly canvassing residents’ opinions & priorities and by maintaining effective relationships with the broad range of community groups
Responding to the Community
Providing feedback on community input, taking action where appropriate to implement community priorities, being accessible to all members of the community including minority groups
Providing Leadership & Advocacy
Representing local community needs & interests to other spheres of government (including government authorities) and to other outside organisations whenever relevant, supporting civic pride & local identity, promoting accountability & best practice

Noosa Customer Satisfaction Survey 2017 MARKET FACTS (QLD) PTY LTD 8
THEME (5) Qualities of Council
Function/Responsibility Examples/Clarification
Elected Council (as a whole)
Provides leadership & direction for the community, even-handed, responsive, open & honest
Councillor(s) you deal with Reliable, dedicated, knowledgeable, helpful, readily accessible
Managerial & Supervisory Officers
Skilled & capable leaders and managers in control of their responsibilities and their staff
Outdoor Workers Competent, effective, efficient, get things done Indoor Staff Accessible, courteous, helpful, believe in achieving
solutions, effective, efficient, knowledgeable
OVERALL COUNCIL PERFORMANCE
Delivering a level of services and displaying a quality of performance in fulfilling all responsibilities, regarded as ‘value for money’ for the rates and charges you pay

Noosa Customer Satisfaction Survey 2017 MARKET FACTS (QLD) PTY LTD 9
Structured Sample Survey
Random telephone calls were made to resident households throughout the Shire, using the Electronic White Pages. These calls identified 400 residents aged 18 years and over who indicated that they were ‘interested in discussing local government issues and expressing an opinion about them’ and who were prepared to participate in the survey. In order to enrol the sample of 400 respondents a total of 4202 attempted and 1592 connected telephone calls were made. Of the people we initially actually spoke to 46 were insufficiently interested in local government or were prevented by other constraints from participating but did answer the ratings question.
Briefing Material Supplied to Participants
After despatching preliminary prompt material to those people who had agreed to participate, follow-up telephone interviews were conducted by appointment. The material sent included the explanation of the ‘Themes of Council Responsibility’ set out on the previous pages, the method of rating for Importance and Performance, and also described the methods of rating. A copy of this questionnaire is included in the Appendix of this report.
Data Processing and Analysis
The data has not been weighted. As a matter of course the data, after input, was cleaned and logic-checked to ensure error-free detailed tables. All percentages in the tabular output have been rounded to one decimal point. Significance tests have been applied to identify those differences in response among the various subgroups which were highly unlikely to have occurred due to chance. All responses were coded and computer-analysed by the standard breaks of:
Gender
Age Group
Household Situation
Neighbourhood
Home Ownership
Present Work Status These breaks were established to enable the identification of significant differences in response patterns among the various community sectors represented by the sub-samples. For all analysis of these standard demographic breaks, and for the local issues tables, we have applied significance tests to the differences between the sub-samples and the total sample. These appear in the tables as:
+++ significantly greater than the sample result at the 99% level of confidence ++ significantly greater than the sample result at the 95% level of confidence + significantly greater than the sample result at the 90% level of confidence - - - significantly lower than the sample result at the 99% level of confidence - - significantly lower than the sample result at the 95% level of confidence - significantly lower than the sample result at the 90% level of confidence

Noosa Customer Satisfaction Survey 2017 MARKET FACTS (QLD) PTY LTD 10
Tables included in this Report only show results for the Total Sample. However, a comprehensive printout of all analyses has been closely examined in compiling the commentary. Average ratings for Importance and Performance were calculated - from which Weighted Performance Indicators were derived for each parameter being rated. These were then combined to provide a Weighted Performance Index for each of the five Themes of Council Responsibility and for Overall Performance on all 41 Areas as a whole. Reliability of the Findings
The findings of the survey are obviously subject to Sampling Error. The maximum Probable Error of our total sample is ±3.1% at the 90% level of confidence. Comparisons between categories and subgroups are subject to varying error depending on respondent frequencies and the relative percentages of respondents falling in different response codes. This survey is not designed to deliver definitive findings for individual Council areas. By continuing to use the basic survey instrument and reporting methodology over an extended period of time, data accumulated in the form of ‘norms’ permit ever more accurate and reliable benchmarks to be established.

Noosa Customer Satisfaction Survey 2017 MARKET FACTS (QLD) PTY LTD 11
RESPONDENT PROFILE The following section of the report provides a graphical summary of the demographic profile of the respondents who participated in the survey. The sample averages for the following demographic characteristics are reported, as follows by:
Gender
Age Group
Household Situation
Neighbourhood
Home Ownership
Present Work Status The following profile of the survey respondents in Noosa Shire Council is important as it provides an overview of the community members who have provided their opinion and perceptions about Council in the following sections of this report. In terms of gender, the screened sample of ‘interested’ respondents comprised (49.3%) males and (50.7%) females.
Due to the low incidence of the youngest age group (18-24 age group), it has been added to the 25-34 years age group for the analysis in this report. This low response is typical and indicates a much lower interest in local government matters.

Noosa Customer Satisfaction Survey 2017 MARKET FACTS (QLD) PTY LTD 12
The majority (47%) of respondents were ‘living as a couple’ households.
Just over half (54%) of the respondents live in built up areas, close to
neighbours.
built up area, living close to
neighbours54%
Truly Rural (Like living on a farm)
17%
Acreage12%
Rural Residential
17%
Neighbourhood

Noosa Customer Satisfaction Survey 2017 MARKET FACTS (QLD) PTY LTD 13
Renters account for 11% of respondents.
88% of respondents were home-owners.
39% of the sample are either working in full or part time employment.
46% of respondents were retired.
own home88%
rent11%
refused/other1% Home Ownership
working full time
20%
retired46%
home duties7%
working part time
19%
other8%
Present Work Status

Noosa Customer Satisfaction Survey 2017 MARKET FACTS (QLD) PTY LTD 14
OVERALL PERFORMANCE RATINGS This Survey Method uses two different measurements of community perceptions of their level of satisfaction with current Council performance – ‘direct’ and ‘calculated’.
The Unweighted Overall Performance Rating This is obtained from a direct question to all survey participants. This question is the final one in the rating procedure, and comes after having obtained respondents’ ratings for both the Importance of each of the 41 Responsibility Areas the survey is about, and for Council Performance in delivering each one of these Areas In this final question, we ask our survey sample to give a rating of Overall Council Performance, using as a basis for judgement the criterion of whether Council is:
‘delivering a level of services and displaying a quality of performance in fulfilling all responsibilities, regarded as ‘value for money’ for the rates and charges you pay’.
During the initial enrolment process for the survey, we contact a number of residents who - for one reason or another - are not prepared to undertake the main survey. We also ask all these contacts - if we can start a conversation with them, and if they qualify as respondents - to give a similar overall judgement before the contact is terminated. There were 46 of these contacts in the process of enrolling our sample of 400. The ratings of the two groups are presented together in the table below and then graphically (overleaf) for this benchmark survey. A comparison with LGAQ 2015 survey results is also be provided in the table below and will be updated when results are available for LGAQ 2017 (approximately August 2017).
TOTAL Very Good
Good Fair Only
Poor Very Poor
Don't Know
Not App.
Mean
Total Queensland (LGAQ 2015)
700 3.6% 47.9% 43.3% 3.7% 1.6% 0.0% 0.0% 3.48
FIRST CONTACT Noosa 2017
46 26.1% 41.3% 13.0% 6.5% 4.3% 8.7% 0.0% 3.86
Overall Rating Noosa 2017
400 16.5% 54.5% 24.0% 3.5% 1.0% 0.5% 0.0% 3.82
Provincial (LGAQ 2015)
280 2.9% 50.4% 41.4% 3.9% 1.4% 0.0% 0.0% 3.49

Noosa Customer Satisfaction Survey 2017 MARKET FACTS (QLD) PTY LTD 15
The Sample as a Whole – Direct Questioning
The result for this survey is 3.82 , which is higher than that for Queensland - 3.48 and Provincial Councils – 3.49, as measured in the LGAQ 2015 State-wide Survey. A mean score of 3.82, translates to almost three quarters of respondents viewing Council’s performance as ‘good’ (55%) and ‘very good’ (17%). It is also 76.4% of the ‘Optimum’ score of 5 which means that Council is generally viewed as being effective in delivering services to the community.
Very Good 17%
Good 55%
Fair Only 24%
Poor 3%
Very Poor 1%
Overall Performance - Direct Questioning

Noosa Customer Satisfaction Survey 2017 MARKET FACTS (QLD) PTY LTD 16
‘Non-participants’ in the Survey Those not prepared / unable to do the survey, but prepared to give a rating, have given a higher rating of 3.86. The Weighted Aggregated Total Performance Rating
This second measurement of overall satisfaction is calculated by summarising all Performance ratings of each of the 41 Responsibility Areas into one (1) number, weighted by the relative Importance of each Area. It is computed by using all Importance scores, all Performance scores and all weighted Performance Indicators for all 41 Responsibility Areas and then calculating the weighted Total Performance Index from the resultant totals, using the standard formula. It is close to, but not the same as, the average of all Performance means expressed as a share of the Optimum performance score. This ‘summary number’ is called the ‘Average Total Performance Index’ or the Aggregated Overall Performance (Weighted). Despite being calculated from 84 different mean ratings, the resultant Average TPI has a value that is quite close to that obtained from the Direct Question given above. Average Total Performance Index (TPI) for the survey was calculated at 73.24% By comparison, with LGAQ State-wide survey Provincial averages in 2015, TPIs of 70.96% and 70.89% were achieved, so Noosa’s TPI of 73.24% for 2017 is tracking above both Queensland wide and Provincial TPIs. (A further comparison with LGAQ 2017 State-wide survey will be provided in an updated report, when these results are released in August 2017). Such a high degree of correspondence between the two measurements (Direct Questioning and Average TPI) suggests that both methods are successfully measuring the same thing. Total Performance Indexes can be examined from two general perspectives - the composition (i.e. the average scores for the individual Importance and Performance scores for each of the Responsibility Areas in each of the Themes) and a comparison of the overall index scores over time (for future ongoing tracking surveys).
Very Good 26%
Good 41%
Fair Only 13%
Poor 7%
Very Poor 4%
Don't Know9%
Ratings - Non-participants in survey

Noosa Customer Satisfaction Survey 2017 MARKET FACTS (QLD) PTY LTD 17
COMPARISON OF PERFORMANCE INDICES The following charts show comparison of the Total Performance Index (TPI) for Noosa 2017 with LGAQ 2015. (This chart will be updated with Queensland wide and Provincial TPI’s from the LGAQ 2017 State-wide survey when available).
The chart above, shows the Noosa TPI (73.2%) for 2017 compared to TPI for the 5 key themes. As can be seen from the chart above, Noosa is well exceeding overall average TPI in 4 out of the 5 areas namely:
Qualities of Council (76.03%)
Customer Service and Communication (72.94%)
Managing the Shire (72.31%)
Community Lifestyle Services (75.17%)
For Noosa’s Basic Services and Infrastructure TPI (69.91%), it is only just below Provincial TPI (69.95)% and LGAQ State-wide (71.82%).

Noosa Customer Satisfaction Survey 2017 MARKET FACTS (QLD) PTY LTD 18
ANALYSIS OF KEY POINTS Areas of Lowest Performance Relative to Importance
The Table shows the 7 Responsibility Areas where there are the greatest gaps between Performance and Importance - ranked inversely by the level of rated Performance.
Responsibility Area Importance Performance Share of Optimum Mean Rank Mean Rank
Providing Leadership & Advocacy
4.25 18 3.54 22 70.7%
Road Construction 4.32 14= 3.49 23= 69.8%
Responding to the Community
4.42 6= 3.49 23= 69.7%
Consulting the community
4.39 8= 3.48 24 69.6%
Road Maintenance 4.53 3 3.43 26 68.7%
Economic Development/Local Employment
4.36 10 3.20 27 63.9%
Parking Facilities 4.22 21 2.99 29 59.7%
*Responsibility Areas shown in shading were rated in ‘top ten’ in overall importance
These 7 Responsibility Areas have been selected on the basis that
their Importance rating is at least 3.96 (on the border-line of ‘4’= ‘Important’), and
their Performance is more than 1.5% below Average (where Average Total Performance Index is 73.2%).
The size of the job to be done can be defined in two ways:
Move the Performance Mean from the current rating up to the Optimum level (‘a score of ‘5’). Current Performance as a share of Optimum is shown in the Share of Optimum column. The difference between ‘Share of Optimum’ and 100.0% shows how actual performance has to improve to achieve a score of ‘5’.
Achieve Equilibrium between Performance and Importance by closing the ‘gap’ between their respective Mean scores. If the gap between the average ratings for Importance and Performance were to close, there would be a significant improvement in community perceptions of Overall Performance.

Noosa Customer Satisfaction Survey 2017 MARKET FACTS (QLD) PTY LTD 19
Areas of Highest Performance Relative to Importance There are 15 Responsibility Areas (out of the total of 41) on which Council performed best in relation to their judged importance. In this case, ‘best’ is defined as having:
an Importance rating of at least 3.96 (on the border-line of ‘4’= ‘Important’), and
Performance more than 1.5% above Average (where Average Performance is 73.2% - the (calculated) Average Total Performance Index).
*Responsibility Areas shown in shading were rated in ‘top ten’ in overall importance
Responsibility Area Importance Performance Share of Optimum Mean Rank Mean Rank
Libraries & Other Information Access
4.20 22 4.15 1 83.0%
Waste Management 4.49 4 4.06 2 81.2%
Sporting & Recreational Facilities
3.98 28 3.94 3 78.8%
Customer Service 4.37 9= 3.93 4= 78.6%
Quality & Performance of Outdoor Workers
4.32 14= 3.93 4= 78.5%
Quality & Performance of Indoor Staff
4.32 14= 3.92 5= 78.4%
Parks, Playgrounds & Public Amenities
4.23 20 3.92 5= 78.3%
Disaster Management 4.45 5 3.91 6 78.3%
Development of Tourism
4.01 27 3.83 7 76.6%
Community Safety 4.37 9= 3.81 8 76.1%
Managerial & Supervisory Officers
4.41 7 3.80 9 76.0%
Information services 4.24 19 3.78 10 75.7%
Quality of Elected Council
4.60 1 3.75 11= 75.1%
Environment Protection & Conservation
4.35 11 3.75 11= 74.9%
Financial Management 4.56 2 3.74 12 74.8%

Noosa Customer Satisfaction Survey 2017 MARKET FACTS (QLD) PTY LTD 20
Areas of Average Performance
There are only 12 Responsibility Areas (out of the total of 41) on which Council has received an average score which is defined as having;
an Importance rating of at least 3.96 (on the border-line of ‘4’= ‘Important’), and
Performance not more than 1.5% below or above Average (where Average Performance 73.2% - the (calculated) Average Total Performance Index).
Responsibility Area Importance Performance Share of Optimum Mean Rank Mean Rank
Environmental Controls
4.33 13 3.71 13 74.3%
Building Control 4.39 8= 3.68 14= 73.7%
Community Services 4.29 17 3.68 14= 73.6%
Informing the Community
4.34 12 3.67 15 73.4%
Revenue-raising 4.13 24 3.65 16 73.0%
Town Planning 4.39 8= 3.62 19= 72.5%
Community Health 4.31 15 3.62 19= 72.4%
Pet/Animal Control 4.07 26 3.62 19= 72.3%
Quality of Councillor(s) Dealt with
4.42 6= 3.62 19= 72.3%
Human Resources Management
4.14 23 3.60 20= 71.9%
Traffic Management 4.09 25 3.60 20= 71.9%
Drainage & Flood Mitigation
4.30 16 3.59 21= 71.7%
*Responsibility Areas shown in shading were rated in ‘top ten’ in overall importance

Noosa Customer Satisfaction Survey 2017 MARKET FACTS (QLD) PTY LTD 21
Areas of Least Importance Only 7 of the 41 Responsibility Areas have not been considered in formulating the previous three lists (Highest Performers, Lowest Performers and Average Performers) because they did not have an Importance rating greater than 3.96, or 4 when rounded (i.e.= ‘Important’). Nevertheless, they do exist, and are listed below - ranked by their Performance score, as used in the previous three tables. Despite their Importance rating being regarded as fairly low, by the Community at large, Councils cannot avoid expending resources upon them, as they are very Important to some members of the community (e.g. Community Development is rated as ‘important’ by 43.3% of respondents). Hence, the detailed data on these particular areas has to be examined, to formulate priorities - as these show the proportions of the community who have varying priorities.
Responsibility Area Importance Performance Share of Optimum Mean Rank Mean Rank
Heritage Protection 3.93 30 3.64 17= 72.7%
Cultural & Entertainment Facilities
3.82 33 3.64 17= 72.7%
Shopping Facilities 3.79 34 3.63 18 72.7%
Community Development
3.92 31 3.59 21= 71.8%
Street Lighting 3.76 35 3.59 21= 71.8%
Footpaths, Kerbing, Guttering
3.87 32 3.46 25 69.2%
Public Transport 3.94 29 3.07 28 61.5%

Noosa Customer Satisfaction Survey 2017 MARKET FACTS (QLD) PTY LTD 22
EVALUATIONS OF TOTAL PERFORMANCE The following pages present tables showing performance indices (used to benchmark successive measures of performance). These can be used to guide plans and policies in order to improve the levels of satisfaction of the residents of Noosa Shire Council.
Weighted Performance Indicators
The tabular calculations give the results for each Responsibility Area within each Theme as a Weighted Performance Indicator (WPI). The table then combines these individual Weighted Performance Indicators to produce an overall Total Performance Index (TPI) for each Theme. Individual Weighted Performance Indicators are produced by multiplying the average Performance Rating awarded to a council for each Responsibility Area within a particular Theme by the average Importance Rating given to it. This ‘weights’ each individual Performance score by the level of community priority for that specific Area. To obtain the Total Performance Index (TPI) for each Theme, the individual Weighted Performance Indicators are summed, as an Achieved Score, and percentaged against a Possible Score - which could be achieved only if all respondents gave their council a ‘5’ rating (‘Very Good’) for Performance on all the Responsibility Areas in that Theme. These TPI’s become a benchmark against which Council can track, over individual and successive surveys, the effectiveness with which they have addressed community expectations. They also provide objective numerical data which can be used to crystallise - from the viewpoint of residents - Objectives set out in council Strategic or Corporate Plans. They describe ‘what is’ - actual performance, adjusted for relative importance priorities.

Noosa Customer Satisfaction Survey 2017 MARKET FACTS (QLD) PTY LTD 23
Basic Services & Infrastructure
Weighted Performance Index (in order of Importance)
Theme 1 Basic Services/Infrastructure
2017 Survey
Importance Means
Performance Means
Performance Indexes
Road Maintenance 4.53 3.43 68.7%
Waste Management 4.49 4.06 81.2%
Road Construction 4.32 3.49 69.8%
Community Health 4.31 3.62 72.4%
Drainage & Flood Mitigation
4.30 3.59 71.7%
Parking Facilities 4.22 2.99 59.7%
Traffic Management 4.09 3.60 71.9%
Public Transport 3.94 3.07 61.5%
Footpaths, Kerbing, Guttering
3.87 3.46 69.2%
Street Lighting 3.76 3.59 71.8%
Means 4.18 3.49
Total Performance Index 69.91%
The weighted Total Performance Index (TPI) for Basic Services & Infrastructure is one number, which sums up the whole interaction between Performance and Priorities for this particular Theme. In 2017, the actuality of the interaction between these two forces gives a result of 69.91% of what might have been achieved if Noosa were to achieve perfect performance for every Responsibility Area. The table shows a comparison of how the community actually judges Council performance, as it makes allowance for the relative Importance of each of the Activity Areas judged. This ‘reality’ is shown in the Weighted Performance Indicator numbers. However, the rank order of these WPIs is clearly at variance with the priorities with which the community wants matters to be handled (the table is formatted in the rank order of Importance scores).

Noosa Customer Satisfaction Survey 2017 MARKET FACTS (QLD) PTY LTD 24
Community Lifestyle Services
Weighted Performance Index (in order of Importance)
Theme 2 Community Lifestyle Services
2017 Survey
Importance Means
Performance Means
Performance Indexes
Community Safety 4.37 3.81 76.1%
Environment Protection & Conservation
4.35 3.75 74.9%
Environmental Controls
4.33 3.71 74.3%
Community Services 4.29 3.68 73.6%
Parks, Playgrounds & Public Amenities
4.23 3.92 78.3%
Libraries & other Information Access
4.20 4.15 83.0%
Pet/Animal Control 4.07 3.62 72.3%
Sporting & Recreational Facilities
3.98 3.94 78.8%
Heritage Protection 3.93 3.64 72.7%
Community Development
3.92 3.59 71.8%
Cultural & Entertainment Facilities
3.82 3.64 72.7%
Shopping Facilities 3.79 3.63 76.1%
Means 4.11 3.76
Total Performance Index
75.2%
The weighted Total Performance Index (TPI) for Community Lifestyle Services in 2017 is 75.2% of the Optimum. Weighted Performance Indicator scores vary from survey to survey, as they are affected by changes to Importance scores as well as Performance scores. Therefore, they can be used as a way of ensuring that planning targets for both Importance and Performance are kept within realistic achievable ranges. They also clearly show where the community’s resources should be allocated to achieve planning objectives
Noosa Customer Satisfaction Survey 2017 MARKET FACTS (QLD) PTY LTD 25
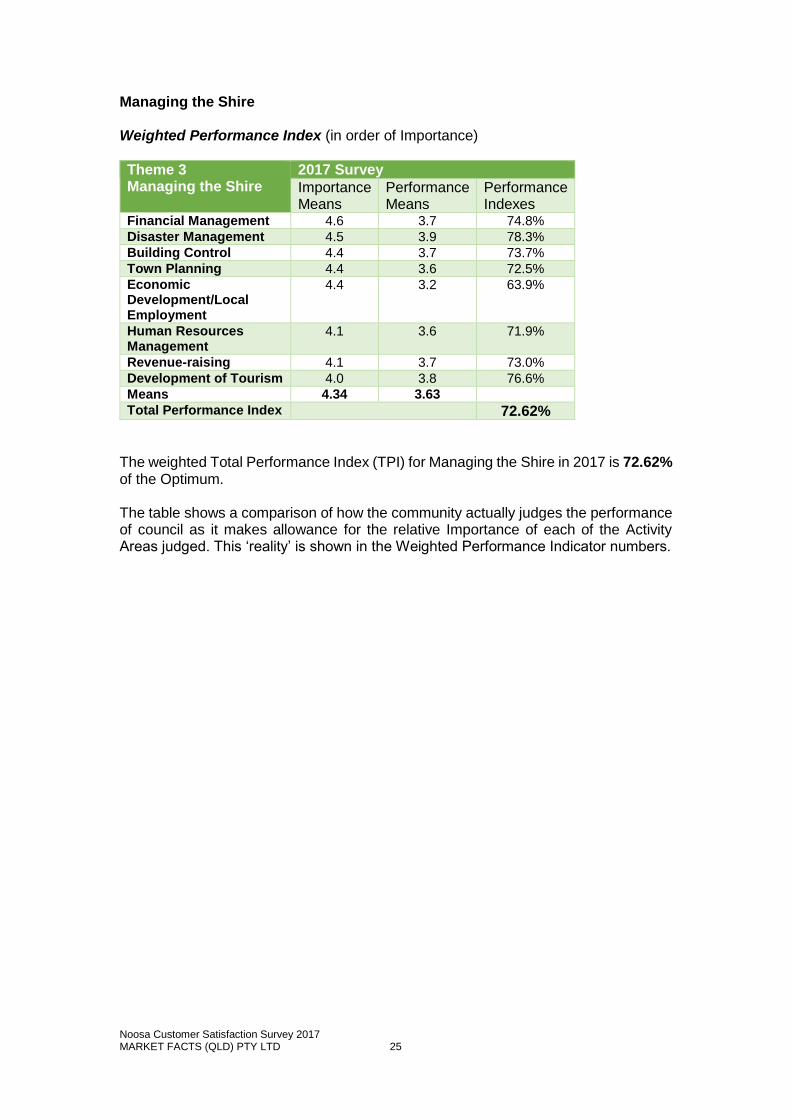
Managing the Shire Weighted Performance Index (in order of Importance)
Theme 3 Managing the Shire
2017 Survey
Importance Means
Performance Means
Performance Indexes
Financial Management 4.6 3.7 74.8%
Disaster Management 4.5 3.9 78.3%
Building Control 4.4 3.7 73.7%
Town Planning 4.4 3.6 72.5%
Economic Development/Local Employment
4.4 3.2 63.9%
Human Resources Management
4.1 3.6 71.9%
Revenue-raising 4.1 3.7 73.0%
Development of Tourism 4.0 3.8 76.6%
Means 4.34 3.63
Total Performance Index 72.62%
The weighted Total Performance Index (TPI) for Managing the Shire in 2017 is 72.62% of the Optimum. The table shows a comparison of how the community actually judges the performance of council as it makes allowance for the relative Importance of each of the Activity Areas judged. This ‘reality’ is shown in the Weighted Performance Indicator numbers.

Noosa Customer Satisfaction Survey 2017 MARKET FACTS (QLD) PTY LTD 26
Customer Service and Communications Weighted Performance Index (in order of Importance)
Theme 4 Customer Service and Communication
2017 Survey
Importance Means
Performance Means
Performance Indexes
Responding to the Community
4.42 3.49 69.7%
Consulting the community
4.39 3.48 69.6%
Customer Service 4.37 3.93 78.6%
Informing the Community
4.34 3.67 73.4%
Providing Leadership & Advocacy
4.25 3.54 70.7%
Information services 4.24 3.78 75.7%
Means 4.33 3.65
Total Performance Index
72.94%
The weighted Total Performance Index (TPI) for Customer Service & Communications for 2017 is 72.94%. The table shows a comparison of how the community actually judges Council performance for this theme, as it makes allowance for the relative Importance of each of the Activity Areas judged. This ‘reality’ is shown in the Weighted Performance Indicator numbers. However, the rank order of these WPIs is clearly at variance with the priorities with which the community wants matters to be handled (shown by the rank order of Importance scores).

Noosa Customer Satisfaction Survey 2017 MARKET FACTS (QLD) PTY LTD 27
Qualities of Council Weighted Performance Index (in order of Importance)
Theme 5 Qualities of Council
2017 Survey
Importance Means
Performance Means
Performance Indexes
Quality of Elected Council 4.60 3.75 75.1%
Quality of Councillor(s) Dealt with
4.42 3.62 72.3%
Managerial & Supervisory Officers
4.41 3.80 76.0%
Quality & Performance of Outdoor Workers
4.32 3.93 78.5%
Quality & Performance of Indoor Staff
4.32 3.92 78.4%
Means 4.42 3.80 75.1%
Total Performance Index 76.03%
The 2017 weighted Total Performance Index (TPI) for Qualities of Council is 76.03%. The table shows how the community actually judges Council performance, as it makes allowance for the relative Importance of each of the Activity Areas judged. This ‘reality’ is shown in the Weighted Performance Indicator numbers. However, the rank order of these WPIs is again at variance with Importance priorities (shown by the rank order of Importance scores).

Noosa Customer Satisfaction Survey 2017 MARKET FACTS (QLD) PTY LTD 28
COMMUNITY RATINGS OF COUNCIL RESPONSIBILITY AREAS (THEMES) This section comprises two sets of tables and commentary:
the first set of tables deals with the community’s priorities - the IMPORTANCE of each Area of Responsibility/Service;
the second set of tables deals with the community’s perceptions of what is actually the case - the ratings for COUNCIL PERFORMANCE in each Area of Responsibility / Service.
N.B. In the following tables, the Responsibility Areas being rated are presented in the order of consideration by respondents, not in rank order of Importance or Performance. Explanation of Importance & Performance Ratings In the tables, the MEAN column or row is an average of the IMPORTANCE or PERFORMANCE ratings given by all respondents, using 5-point scales with clarifying semantic differentials as follows:
IMPORTANCE PERFORMANCE
Crucial (5) Very Good (5) Important (4) Good (4)
Nice to Have (3) Fair Only (3) Unimportant (2) Poor (2) Quite Unimportant (1) Very Poor (1)
In both measurements, provision was also made for unprompted ‘Don't Know’ or ‘Not Applicable’ responses. These were factored out of the calculations by giving them a value = 0. While the words used in the Performance Scales each have an obvious meaning, those used in the Importance Scales were explained in detail to all respondents by the interviewers:
‘Crucial’ means that it is a service or activity that the community must have and that it is vital for the council either to do or to get involved in to make sure that it is done by someone.
‘Important’ is for something that you certainly expect your council to do, provide or make sure that somebody else provides it.
‘Nice To Have’ means just that, as does ‘Not Very Important’.
‘Quite Unimportant’ means unnecessary - something that in any council cutbacks would be the first to go.
Achieved MEAN scores should thus be considered in relation to the scale being applied. For example:
a MEAN of 4.5 on Importance indicates that the particular responsibility/quality is adjudged mid-way between Important and Crucial.
a MEAN of 3.5 for Performance means that the Council is seen as mid-way between Fair Only and Good in being effective/delivering service on that particular criterion.
Noosa Customer Satisfaction Survey 2017 MARKET FACTS (QLD) PTY LTD 29
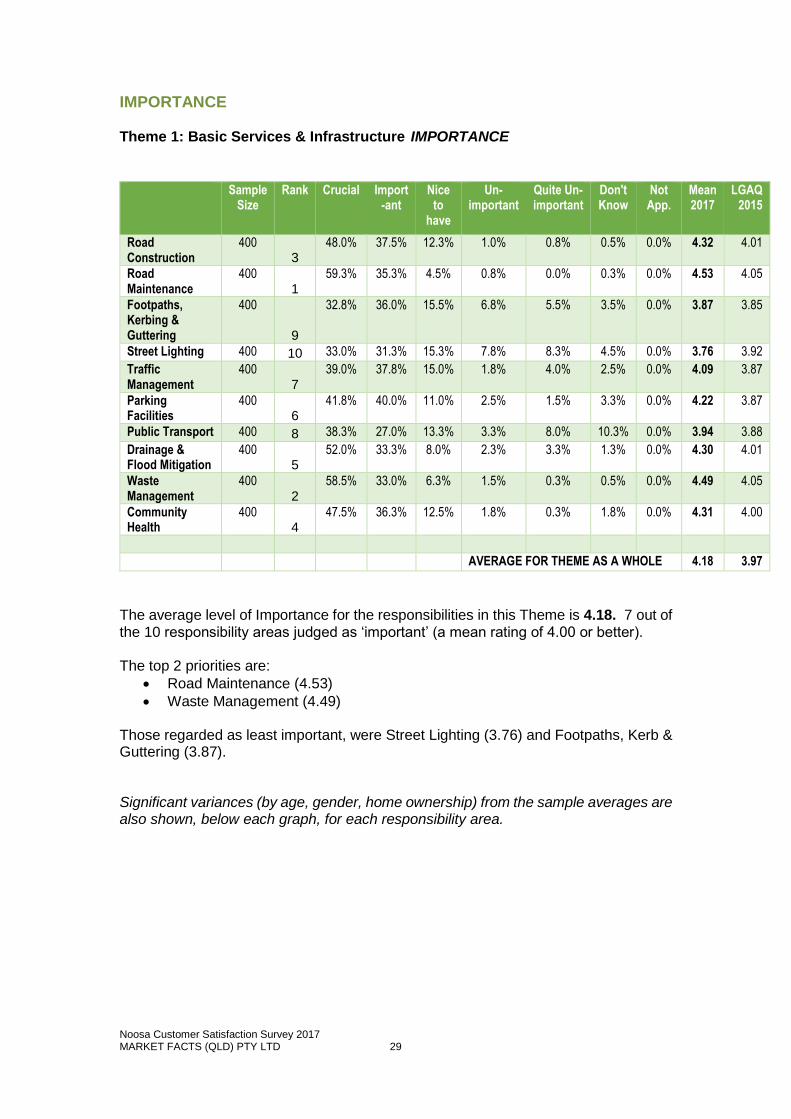
IMPORTANCE Theme 1: Basic Services & Infrastructure IMPORTANCE
Sample
Size Rank Crucial Import
-ant Nice
to have
Un-important
Quite Un- important
Don't Know
Not App.
Mean 2017
LGAQ 2015
Road Construction
400 3
48.0% 37.5% 12.3% 1.0% 0.8% 0.5% 0.0% 4.32 4.01
Road Maintenance
400 1
59.3% 35.3% 4.5% 0.8% 0.0% 0.3% 0.0% 4.53 4.05
Footpaths, Kerbing & Guttering
400
9
32.8% 36.0% 15.5% 6.8% 5.5% 3.5% 0.0% 3.87 3.85
Street Lighting 400 10 33.0% 31.3% 15.3% 7.8% 8.3% 4.5% 0.0% 3.76 3.92
Traffic Management
400 7
39.0% 37.8% 15.0% 1.8% 4.0% 2.5% 0.0% 4.09 3.87
Parking Facilities
400 6
41.8% 40.0% 11.0% 2.5% 1.5% 3.3% 0.0% 4.22 3.87
Public Transport 400 8 38.3% 27.0% 13.3% 3.3% 8.0% 10.3% 0.0% 3.94 3.88
Drainage & Flood Mitigation
400 5
52.0% 33.3% 8.0% 2.3% 3.3% 1.3% 0.0% 4.30 4.01
Waste Management
400 2
58.5% 33.0% 6.3% 1.5% 0.3% 0.5% 0.0% 4.49 4.05
Community Health
400 4
47.5% 36.3% 12.5% 1.8% 0.3% 1.8% 0.0% 4.31 4.00
AVERAGE FOR THEME AS A WHOLE 4.18 3.97
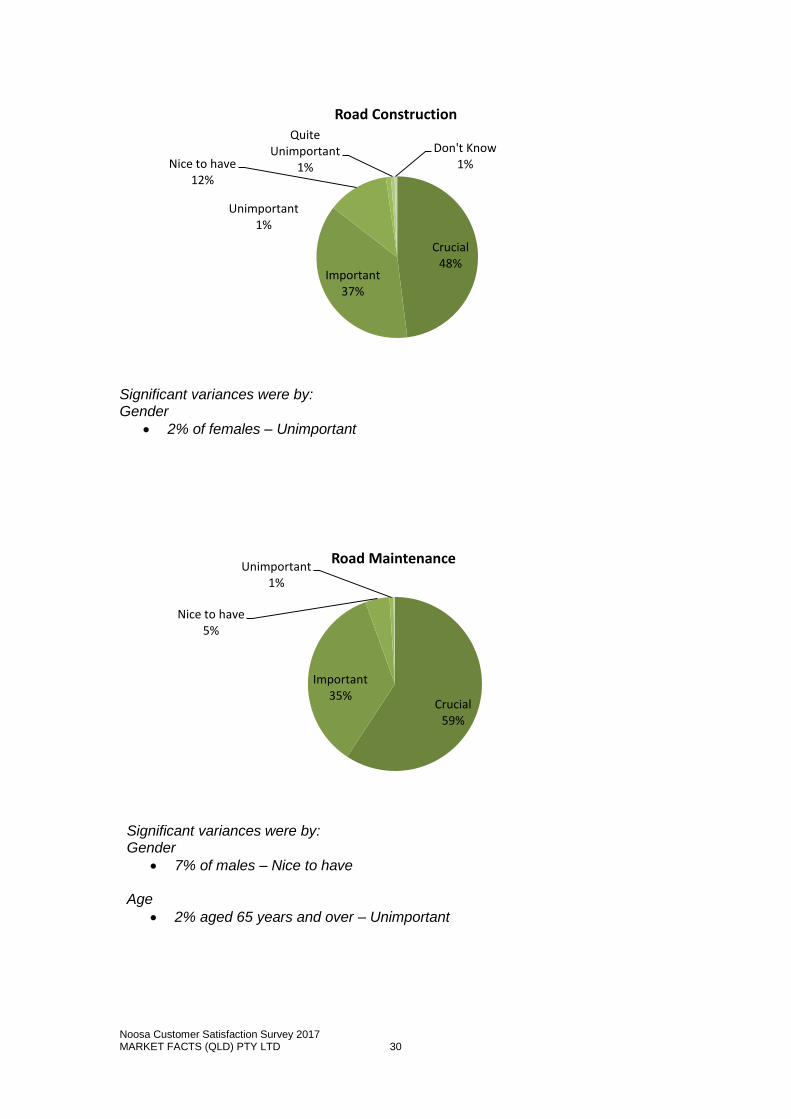
The average level of Importance for the responsibilities in this Theme is 4.18. 7 out of the 10 responsibility areas judged as ‘important’ (a mean rating of 4.00 or better). The top 2 priorities are:
Road Maintenance (4.53)
Waste Management (4.49) Those regarded as least important, were Street Lighting (3.76) and Footpaths, Kerb & Guttering (3.87). Significant variances (by age, gender, home ownership) from the sample averages are also shown, below each graph, for each responsibility area.
Noosa Customer Satisfaction Survey 2017 MARKET FACTS (QLD) PTY LTD 30
Significant variances were by: Gender
2% of females – Unimportant
Significant variances were by: Gender
7% of males – Nice to have Age
2% aged 65 years and over – Unimportant
Crucial 48%
Important 37%
Nice to have 12%
Unimportant1%
Quite Unimportant
1%
Don't Know1%
Road Construction
Crucial 59%
Important 35%
Nice to have 5%
Unimportant1%
Road Maintenance

Noosa Customer Satisfaction Survey 2017 MARKET FACTS (QLD) PTY LTD 31
Significant variances were by: Gender
22% of males – Nice to have
8% of males – Quite unimportant
45% of females - important Age
13% of 45-54 years – Unimportant
Significant variances were by: Gender
20% of males – Nice to have
11% of females – Quite unimportant Age
46% aged 35-44 years - Important
15% aged 45-54 years - Unimportant
22% aged 55-64 years – Nice to have
39% aged 65 years and over - Crucial
Home Ownership
48% renting - Crucial
Crucial 33%
Important 36%
Nice to have 15%
Unimportant7%
Quite Unimportant
5%
Don't Know4%
Footpaths, Kerbing & Guttering
Crucial 33%
Important 31%
Nice to have 15%
Unimportant8%
Quite Unimportant
8%
Don't Know5%
Street Lighting

Noosa Customer Satisfaction Survey 2017 MARKET FACTS (QLD) PTY LTD 32
There were no significant variances
Significant variances were by: Gender
4% of males – Unimportant
46% of females - Important Age
4% aged 55-64 years – Quite unimportant
Crucial 39%
Important 38%
Nice to have 15%
Unimportant2%
Quite Unimportant
4%
Don't Know2%
Traffic Management
Crucial 42%
Important 40%
Nice to have 11%
Unimportant2%
Quite Unimportant
2%
Don't Know3%
Parking Facilities

Noosa Customer Satisfaction Survey 2017 MARKET FACTS (QLD) PTY LTD 33
Significant variances were by: Age
8% aged 45-54 years – Unimportant
15% aged 45-54 years – Quite unimportant
Age
8% aged 45-54 years – Unimportant
Crucial 39%
Important 27%
Nice to have 13%
Unimportant3%
Quite Unimportant
8%
Don't Know10%
Public Transport
Crucial 52%
Important 34%
Nice to have 8%
Unimportant2%
Quite Unimportant
3%
Don't Know
1%
Drainage & Flood Mitigation
Noosa Customer Satisfaction Survey 2017 MARKET FACTS (QLD) PTY LTD 34
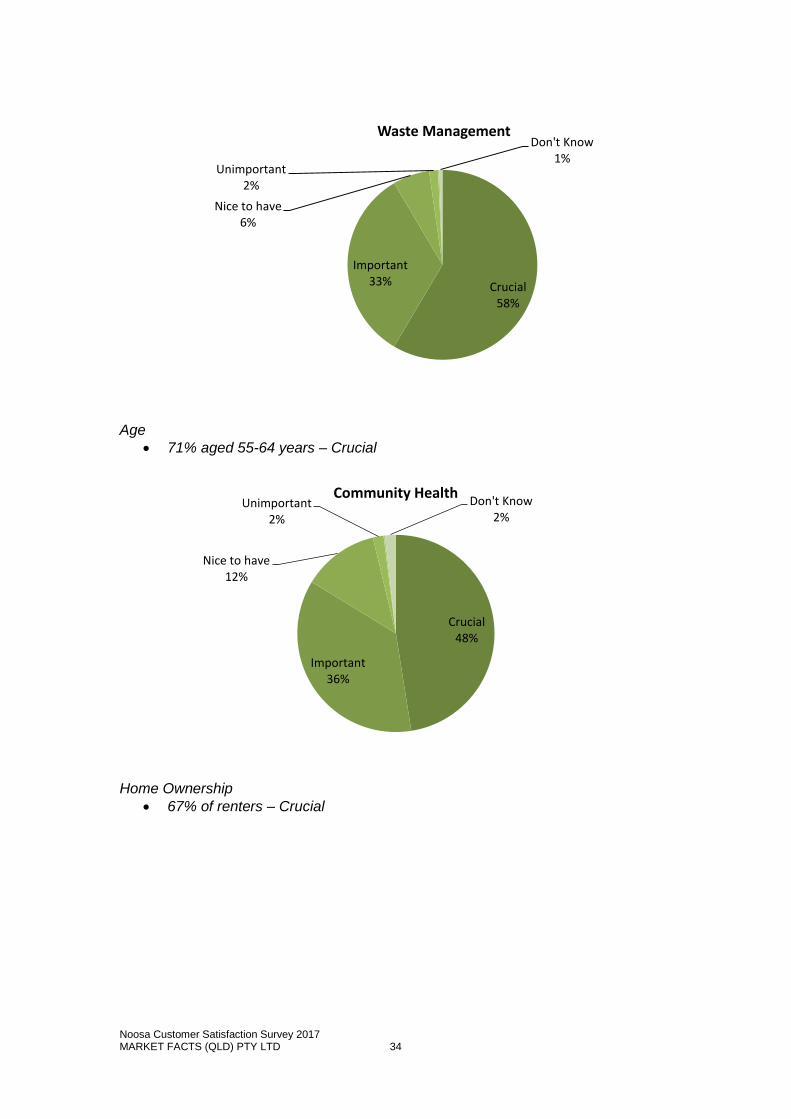
Age
71% aged 55-64 years – Crucial
Home Ownership
67% of renters – Crucial
Crucial 58%
Important 33%
Nice to have 6%
Unimportant2%
Don't Know1%
Waste Management
Crucial 48%
Important 36%
Nice to have 12%
Unimportant2%
Don't Know2%
Community Health

Noosa Customer Satisfaction Survey 2017 MARKET FACTS (QLD) PTY LTD 35
Theme 2: Community Lifestyle Services IMPORTANCE
TOTAL RANK Crucial Import Nice to
have Un-
important Quite Un-
important
Don't Know
Not App
Mean 2017
LGAQ 2015
Parks, Playgrounds & Public Amenities
400
5
42.0% 40.0% 14.3% 1.8% 0.5% 1.5% 0.0% 4.23 3.85
Environmental Controls
400 3
50.8% 34.0% 11.0% 2.8% 0.5% 1.0% 0.0% 4.33 3.91
Environmental Protection & Conservation
400
2
52.5% 34.0% 9.0% 3.8% 0.5% 0.3% 0.0% 4.35 3.88
Heritage Protection
400 9
32.8% 36.5% 21.3% 6.8% 1.5% 1.3% 0.0% 3.93 3.82
Sporting & Recreational Facilities
400
8
34.0% 37.0% 21.5% 2.5% 3.0% 2.0% 0.0% 3.98 3.89
Cultural & Entertainment Facilities
400
11
25.8% 38.5% 26.3% 6.5% 1.3% 1.8% 0.0% 3.82 3.88
Libraries & Other Information Access
400
6
44.3% 36.3% 13.3% 4.3% 1.0% 1.0% 0.0% 4.20 3.95
Community Safety
400 1
54.8% 31.5% 9.5% 2.8% 1.0% 0.5% 0.0% 4.37 3.96
Community Service
400 4
44.5% 41.0% 12.8% 0.5% 0.5% 0.8% 0.0% 4.29 3.88
Pet/Animal Control
400 7
33.3% 45.0% 16.8% 2.8% 1.5% 0.8% 0.0% 4.07 3.80
Shopping Facilities
400 12
24.3% 44.0% 21.8% 5.5% 4.0% 0.5% 0.0% 3.79 3.84
Community Development
400 10
27.8% 43.3% 20.8% 6.5% 0.5% 1.3% 0.0% 3.92 3.84
AVERAGE FOR THEME AS A WHOLE 4.11 3.88
The average level of Importance for the responsibilities in this Theme is 4.11. The following three responsibility areas were rated most important:
Community Safety (4.37) Environmental Protection & Conservation (4.35) Environmental Controls (4.33)
Shopping Facilities (3.79) was awarded the lowest priority. Significant variances from the sample averages are also shown, below each graph, for each responsibility area.

Noosa Customer Satisfaction Survey 2017 MARKET FACTS (QLD) PTY LTD 36
Significant variances were by: Gender
18% of males – Nice to have
48% of females - Crucial Age
7% aged 35-44 years - Unimportant
22% aged 45-54 years – Nice to have
54% aged 55-64 years - Crucial
Age
66% aged 55-64 years - Crucial
5% aged 65 years and over - Unimportant
Crucial 42%
Important 40%
Nice to have 14%
Unimportant2%
Quite Unimportant
1%Don't Know
2%
Parks, Playgrounds & Public Amenities
Crucial 51%Important
34%
Nice to have 11%
Unimportant3%
Quite Unimportant
1%Don't Know1%
Environmental Controls

Noosa Customer Satisfaction Survey 2017 MARKET FACTS (QLD) PTY LTD 37
Significant variances were by: Gender
13% of males – Nice to have Age
10% aged 35-44 years - Unimportant
71% aged 55-64 years - Crucial
44% aged 65 years and over – Important
Significant variances were by: Gender
11% of males – Unimportant
38% of females - Crucial
Home Ownership
54% of renters – Crucial
23% of home owners – Nice to have
Crucial 53%
Important 34%
Nice to have 9%
Unimportant4%
Quite Unimportant
1%
Environmental Protection & Conservation
Crucial 33%
Important 36%
Nice to have 21%
Unimportant7%
Quite Unimportant
2%
Don't Know1%
Heritage Protection

Noosa Customer Satisfaction Survey 2017 MARKET FACTS (QLD) PTY LTD 38
Significant variances were by: Age
10% aged 35-44 years - Unimportant
9% aged 45-54 years – Quite unimportant
45% aged 55-64 years -Crucial
Significant variances were by: Gender
46% of females – Important
38% of males – Nice to have Age
34% aged 55-64 years - Crucial
Crucial 34%
Important 37%
Nice to have 21%
Unimportant3%
Quite Unimportant
3%
Don't Know
2%
Sporting & Recreational Facilities
Crucial 26%
Important 39%
Nice to have 26%
Unimportant6%
Quite Unimportant
1%
Don't Know2%
Cultural & Entertainment Facilities

Noosa Customer Satisfaction Survey 2017 MARKET FACTS (QLD) PTY LTD 39
Significant variances were by: Gender
2% of males – Quite unimportant Age
12% aged 35-44 years –Unimportant
51% aged 45-54 years - Important
Significant variances were by: Gender
2% of males – Quite unimportant Age
5% aged 65 years and over - Unimportant Home Ownership
70% of renters – Crucial
Crucial 45%
Important 36%
Nice to have 13%
Unimportant4%
Quite Unimportant
1%
Don't Know1%
Libraries & Other Information Access
Crucial 55%
Important 31%
Nice to have 9%
Unimportant3% Quite
Unimportant 1%
Don't Know1%
Community Safety

Noosa Customer Satisfaction Survey 2017 MARKET FACTS (QLD) PTY LTD 40
Significant variances were by: Age
50% aged 65 years and over - Important
Home Ownership
59% of renters – Crucial
Significant variances were by: Age
29% aged 35-44 years – Nice to have
51% aged 65 years and over - Important
3% aged 65 years and over – Quite unimportant
Crucial 45%
Important 41%
Nice to have 13%
Unimportant1%
Quite Unimportant
1%
Don't Know1%
Community Service
Crucial 33%
Important 45%
Nice to have 17%
Unimportant3%
Quite Unimportant
1%
Don't Know1%
Pet/Animal Control

Noosa Customer Satisfaction Survey 2017 MARKET FACTS (QLD) PTY LTD 41
Significant variances were by: Gender
7% of males – Quite Unimportant Age
9% aged 65 years and over - Unimportant
There were no significant variances.
Crucial 24%
Important 44%
Nice to have 22%
Unimportant5%
Quite Unimportant
4%
Don't Know1%
Shopping Facilities
Crucial 28%
Important 43%
Nice to have 21%
Unimportant7%
Quite Unimportant
1%Don't Know
1%
Community Development

Noosa Customer Satisfaction Survey 2017 MARKET FACTS (QLD) PTY LTD 42
Theme 3: Managing the Shire IMPORTANCE
TOTAL RANK Crucial Import. Nice
to have
Un-important
Quite Un-important
Don't Know
Not App.
Mean 2017
LGAQ 2017
Town Planning 400 3= 55.0% 30.0% 11.8% 2.5% 0.0% 0.8% 0.0% 4.39 3.98
Building Control 400 3= 54.3% 32.8% 10.5% 2.0% 0.3% 0.3% 0.0% 4.39 3.94
Economic Development & Local Employment
400
4
51.8% 32.3% 12.0% 2.0% 0.3% 1.8% 0.0% 4.36 4.01
Development of Tourism
400 7
34.3% 42.0% 15.3% 6.5% 1.8% 0.3% 0.0% 4.01 4.05
Financial Management
400 1
63.0% 28.5% 5.5% 1.3% 0.0% 1.8% 0.0% 4.56 4.05
Revenue-raising 400 6 37.5% 42.3% 12.5% 3.8% 1.8% 2.3% 0.0% 4.13 4.01
Staff Management 400 5 33.5% 45.3% 13.5% 2.8% 0.3% 4.8% 0.0% 4.14 3.93
Disaster Management
400 2
55.3% 34.5% 8.3% 0.8% 0.3% 1.0% 0.0% 4.45 3.93
AVERAGE FOR THEME AS A WHOLE 4.30 4.00
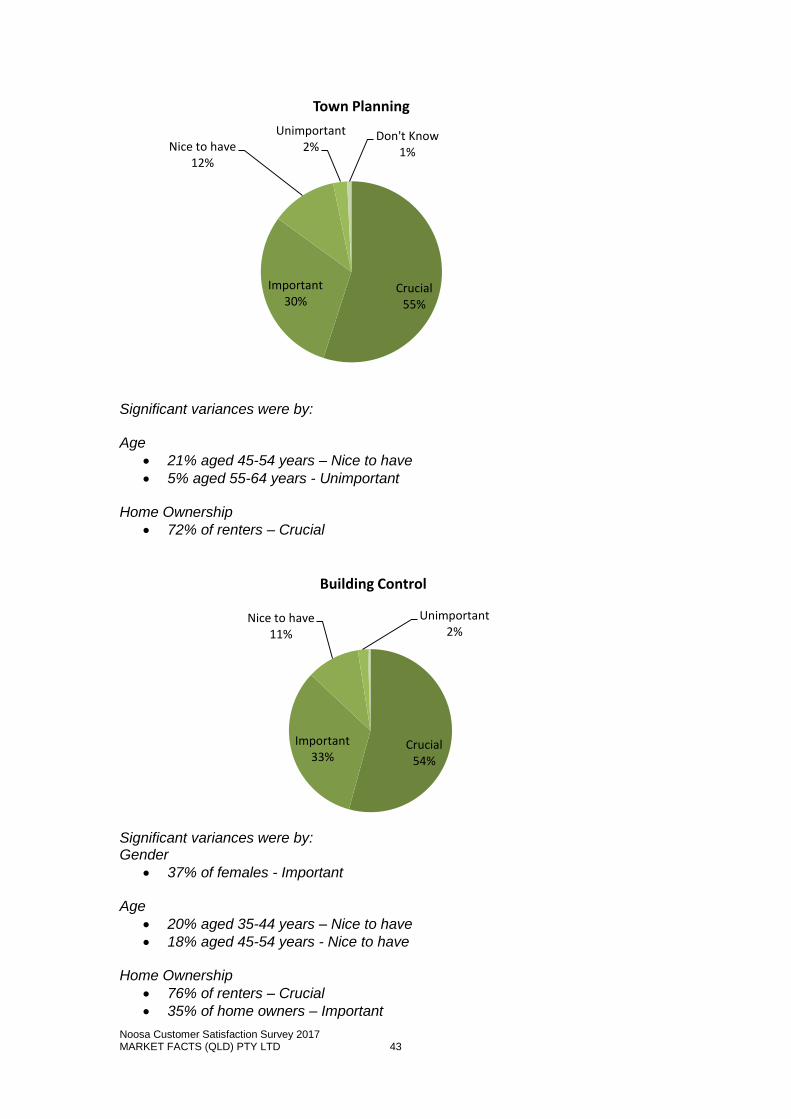
The average level of Importance for the responsibilities in this Theme is 4.30. Financial Management (4.56) was accorded the highest priority and Disaster Management second highest (4.45). Town Planning and Building Control, equal third highest priority (4.39). Development of Tourism was the lowest priority (4.01). Significant variances from the sample averages are also shown, below each graph, for each responsibility area.
Noosa Customer Satisfaction Survey 2017 MARKET FACTS (QLD) PTY LTD 43
Significant variances were by: Age
21% aged 45-54 years – Nice to have
5% aged 55-64 years - Unimportant
Home Ownership
72% of renters – Crucial
Significant variances were by: Gender
37% of females - Important Age
20% aged 35-44 years – Nice to have
18% aged 45-54 years - Nice to have
Home Ownership
76% of renters – Crucial
35% of home owners – Important
Crucial 55%
Important 30%
Nice to have 12%
Unimportant2%
Don't Know1%
Town Planning
Crucial 54%
Important 33%
Nice to have 11%
Unimportant2%
Building Control

Noosa Customer Satisfaction Survey 2017 MARKET FACTS (QLD) PTY LTD 44
Significant variances were by: Age
64% aged 45-54 years - Crucial
61% aged 55-64 years - Crucial
39% aged 65 years and over - Important
Home Ownership
22% of renters – Nice to have
Significant variances were by: Gender
48% of females – Important
Crucial 52%
Important 32%
Nice to have 12%
Unimportant2%
Don't Know2%
Economic Development & Local Employment
Crucial 34%
Important 42%
Nice to have 15%
Unimportant7%
Quite Unimportant
2%
Development of Tourism

Noosa Customer Satisfaction Survey 2017 MARKET FACTS (QLD) PTY LTD 45
Significant variances were by: Age
12% aged 35-44 years – Nice to have
5% aged 35-44 years - Unimportant
12% aged 45-54 years – Nice to have
Significant variances were by: Age
10% aged 35-44 years - Unimportant
24% aged 45-54 years – Nice to have
8% aged 45-54 years – Quite Unimportant
44% aged 65 years and over - Crucial
Crucial 63%
Important 29%
Nice to have 6%
Unimportant1% Don't Know
2%
Financial Management
Crucial 38%
Important 42%
Nice to have 12%
Unimportant4%
Quite Unimportant
2%
Don't Know2%
Revenue-raising

Noosa Customer Satisfaction Survey 2017 MARKET FACTS (QLD) PTY LTD 46
Significant variances were by: Age
10% aged 35-44 years - Unimportant
Significant variances were by: Age
71% aged 35-44 years - Crucial
40% aged 65 years and over - Important
Crucial 33%
Important 45%
Nice to have 14%
Unimportant3% Don't Know
5%
Staff Management

Noosa Customer Satisfaction Survey 2017 MARKET FACTS (QLD) PTY LTD 47
Theme 4: Customer Service and Communication IMPORTANCE
TOTAL RANK Crucial Import
-ant Nice
to have
Un-important
Quite Un-important
Don't Know
Not App.
Mean 2017
LGAQ 2015
Customer Service
400 3
49.0% 39.0% 11.0% 0.8% 0.0% 0.3% 0.0% 4.37 4.03
Information Services
400 6
39.8% 46.3% 12.3% 1.3% 0.3% 0.3% 0.0% 4.24 3.96
Informing the Community
400 4
45.8% 43.5% 9.3% 1.5% 0.0% 0.0% 0.0% 4.34 3.98
Consulting the Community
400 2
50.5% 39.0% 8.0% 1.8% 0.0% 0.8% 0.0% 4.39 4.03
Responding to the Community
400 1
50.3% 40.0% 8.3% 0.3% 0.0% 1.3% 0.0% 4.42 3.99
Providing Leadership & Advocacy
400
5
41.3% 41.5% 13.8% 0.8% 0.5% 2.3% 0.0% 4.25 3.96
AVERAGE FOR THEME AS A WHOLE 4.33 3.99
The average level of Importance for the responsibilities in this Theme is 4.33. The top scores were:
Responding to the Community (4.42)
Consulting the Community (4.39) Information Services (4.24) was given lowest priority. However, all responsibility areas were judged as high, with a mean of 4 or more. Significant variances from the sample averages are also shown, below each graph, for each responsibility area.

Noosa Customer Satisfaction Survey 2017 MARKET FACTS (QLD) PTY LTD 48
Significant variances were by: Age
18% aged 45-54 years – Nice to have
Significant variances were by: Gender
45% of females – Crucial Age
29% aged 35-44 years –Nice to have
60% aged 45-54 years - Important
Very Good 23%
Good 50%
Fair Only 19%
Poor 4%
Very Poor 1%
Don't Know3% Customer Service
Very Good 16%
Good 49%
Fair Only 22%
Poor 5%
Very Poor 2%
Don't Know6%
Information Services

Noosa Customer Satisfaction Survey 2017 MARKET FACTS (QLD) PTY LTD 49
Significant variances were by: Age
7% aged 35-44 years - Unimportant
55% aged 55-64 years – Crucial
Significant variances were by: Age
7% aged 35-44 years - Unimportant
Very Good 13%
Good 51%
Fair Only 24%
Poor 7%
Very Poor 2%
Don't Know
3%
Informing the Community
Crucial 50%
Important 39%
Nice to have 8%
Unimportant2%
Don't Know1%
Consulting the Community

Noosa Customer Satisfaction Survey 2017 MARKET FACTS (QLD) PTY LTD 50
Significant variances were by: Age
2% aged 35-44 years - Unimportant
62% aged 55-64 years - Crucial
Significant variances were by: Gender
18% of males – Nice to have
Very Good 10%
Good 41%
Fair Only 29%
Poor 9%
Very Poor 4%
Don't Know7%
Responding to the Community
Very Good 9%
Good 41%Fair Only
26%
Poor 7%
Very Poor 3%
Don't Know15%
Providing Leadership & Advocacy

Noosa Customer Satisfaction Survey 2017 MARKET FACTS (QLD) PTY LTD 51
Theme 5: Quality of Council IMPORTANCE
TOTAL RANK Crucial Import. Nice
to have
Un-important
Quite Un-important
Don't Know
Not App.
Mean 2017
LGAQ 2015
Quality of Elected Council
400 1
66.3% 27.8% 4.8% 0.5% 0.3% 0.5% 0.0% 4.60 4.05
Quality of Councillor(s) Dealt with
400
3
38.8% 28.0% 5.8% 1.0% 0.3% 26.3% 0.0% 4.41 4.01
Managerial & Supervisory Officers
400
2
49.3% 37.8% 7.0% 0.8% 0.3% 5.0% 0.0% 4.42 3.96
Quality/Performance of Outdoor Workers
400 4=
41.8% 47.3% 8.3% 0.5% 0.3% 2.0% 0.0% 4.32 3.94
Quality/Performance of Indoor Staff
400 4=
41.3% 44.8% 9.8% 0.0% 0.3% 4.0% 0.0% 4.32 3.93
AVERAGE FOR THEME AS A WHOLE 4.42 3.98
The average level of Importance for the responsibilities in this Theme is 4.42. Quality of Elected Council (4.60) was accorded the highest priority.
The Quality and Performance of Indoor Staff and Quality and Performance of Outdoor Staff was given equal lowest priority, with a mean score of 4.32. However, all responsibility areas rated between important and crucial for this theme. Significant variances from the sample averages are also shown, below each graph, for each responsibility area.

Noosa Customer Satisfaction Survey 2017 MARKET FACTS (QLD) PTY LTD 52
Significant variances were by: Age
2% aged 45-54 years – Quite Unimportant
Significant variances were by: Gender
33% of males – Important
2% of males - Unimportant
44% of females – Crucial Age
Very Good 15%
Good 48%
Fair Only 26%
Poor 6%
Don't Know5%
Quality of Elected Council
Very Good 14%
Good 27%
Fair Only 16%
Poor 3%
Very Poor 1%
Don't Know39%
Quality of Councillor(s) Dealt with

Noosa Customer Satisfaction Survey 2017 MARKET FACTS (QLD) PTY LTD 53
5% aged 35-44 years – Unimportant
2% aged 45-54 years – Quite unimportant
Significant variances were by: Age
5% aged 35-44 years – Unimportant
2% aged 45-54 years – Quite Unimportant
There were no significant variances
Very Good 7%
Good 38%
Fair Only 23%
Poor 3%
Very Poor 2%
Don't Know27%
Managerial & Supervisory Officers
Very Good 21%
Good 50%
Fair Only 20%
Poor 3%
Very Poor 1%
Don't Know5%
Quality/Performance of Outdoor Workers
Noosa Customer Satisfaction Survey 2017 MARKET FACTS (QLD) PTY LTD 54
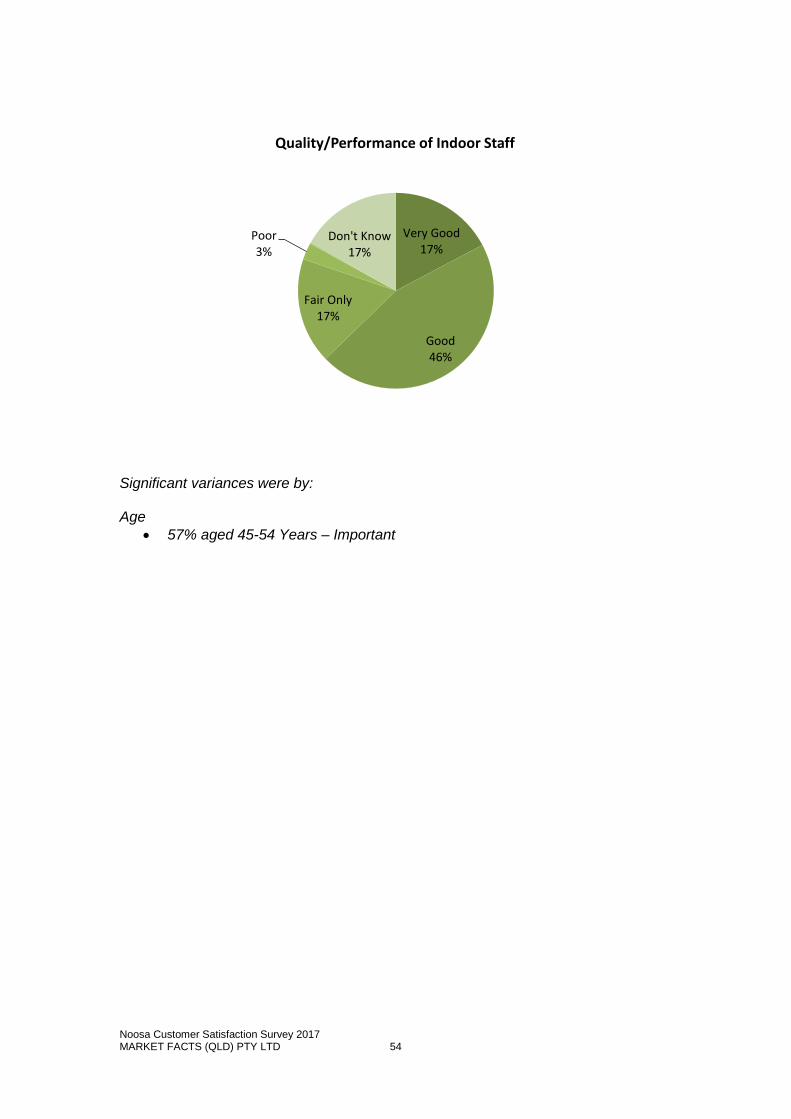
Significant variances were by: Age
57% aged 45-54 Years – Important
Very Good 17%
Good 46%
Fair Only 17%
Poor 3%
Don't Know17%
Quality/Performance of Indoor Staff

Noosa Customer Satisfaction Survey 2017 MARKET FACTS (QLD) PTY LTD 55
PERFORMANCE
Theme 1: Basic Services & Infrastructure PERFORMANCE
Sample
Size RANK Very
Good Good Fair
Only Poor Very
Poor Don't Know
Not App.
Mean 2017
LGAQ 2015
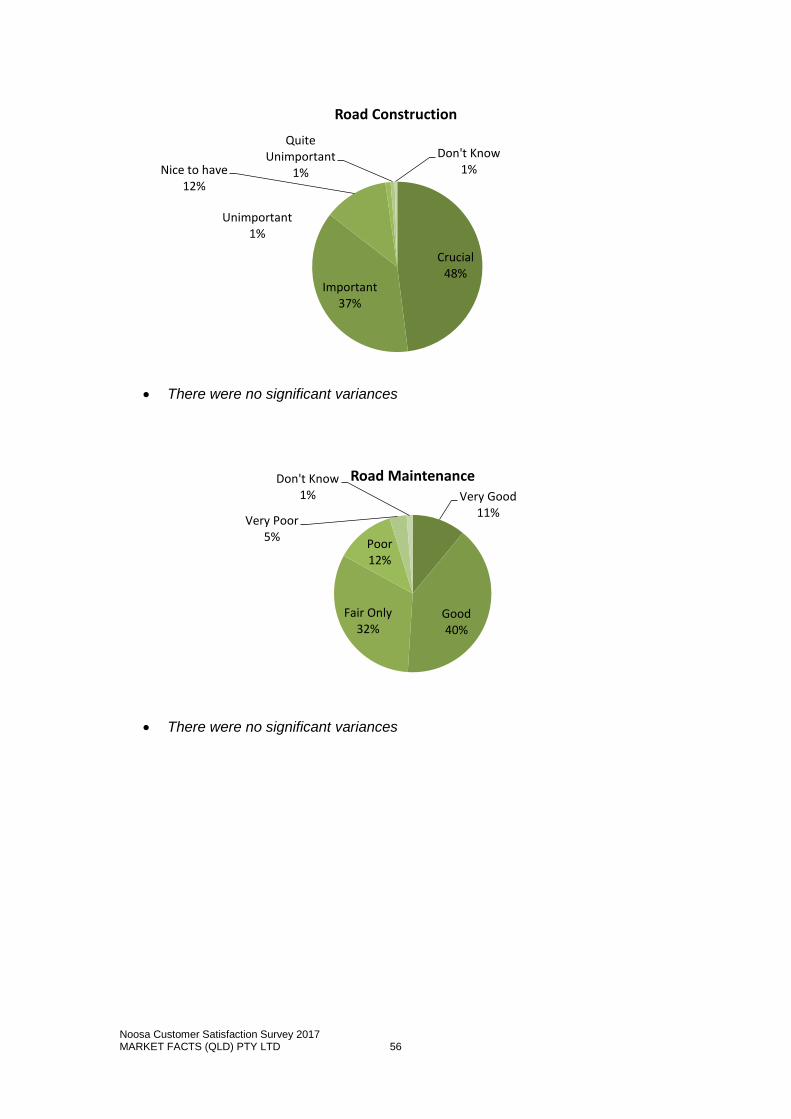
Road Construction 400 5 11.5% 43.8% 28.5% 8.8% 5.0% 2.5% 0.0% 3.49 3.54
Road Maintenance 400 7 11.0% 40.0% 32.0% 12.3% 3.5% 1.3% 0.0% 3.43 3.52
Footpaths, Kerbing & Guttering
400 6
11.3% 38.0% 31.5% 6.3% 5.8% 7.3% 0.0% 3.46 3.49
Street Lighting 400 4= 14.3% 36.5% 30.0% 4.0% 4.3% 11.0% 0.0% 3.59 3.57
Traffic Management 400 3 18.0% 39.3% 25.3% 9.0% 4.5% 4.0% 0.0% 3.60 3.71
Parking Facilities 400 9 6.3% 25.3% 33.8% 22.0% 8.5% 4.3% 0.0% 2.99 3.72
Public Transport 400 8 6.8% 25.3% 22.8% 15.0% 9.0% 21.3% 0.0% 3.07 3.79
Drainage & Flood Mitigation
400 4=
12.8% 47.8% 22.8% 6.0% 5.8% 5.0% 0.0% 3.59 3.54
Waste Management 400 1 31.8% 46.8% 16.8% 2.3% 1.5% 1.0% 0.0% 4.06 3.60
Community Health 400 2 9.3% 42.5% 25.3% 4.5% 2.3% 16.3% 0.0% 3.62 3.61
AVERAGE FOR THEME AS A WHOLE
3.49 3.63
The average performance rating for this Theme is 3.49. The top performers were:
Waste Management (4.06)
Community Health (3.62) The poorest performing area was Parking Facilities (2.99). Significant variances from the sample averages are also shown, below each graph, for each responsibility area.
Noosa Customer Satisfaction Survey 2017 MARKET FACTS (QLD) PTY LTD 56
There were no significant variances
There were no significant variances
Crucial 48%
Important 37%
Nice to have 12%
Unimportant1%
Quite Unimportant
1%
Don't Know1%
Road Construction
Very Good 11%
Good 40%
Fair Only 32%
Poor 12%
Very Poor 5%
Don't Know1%
Road Maintenance
Noosa Customer Satisfaction Survey 2017 MARKET FACTS (QLD) PTY LTD 57
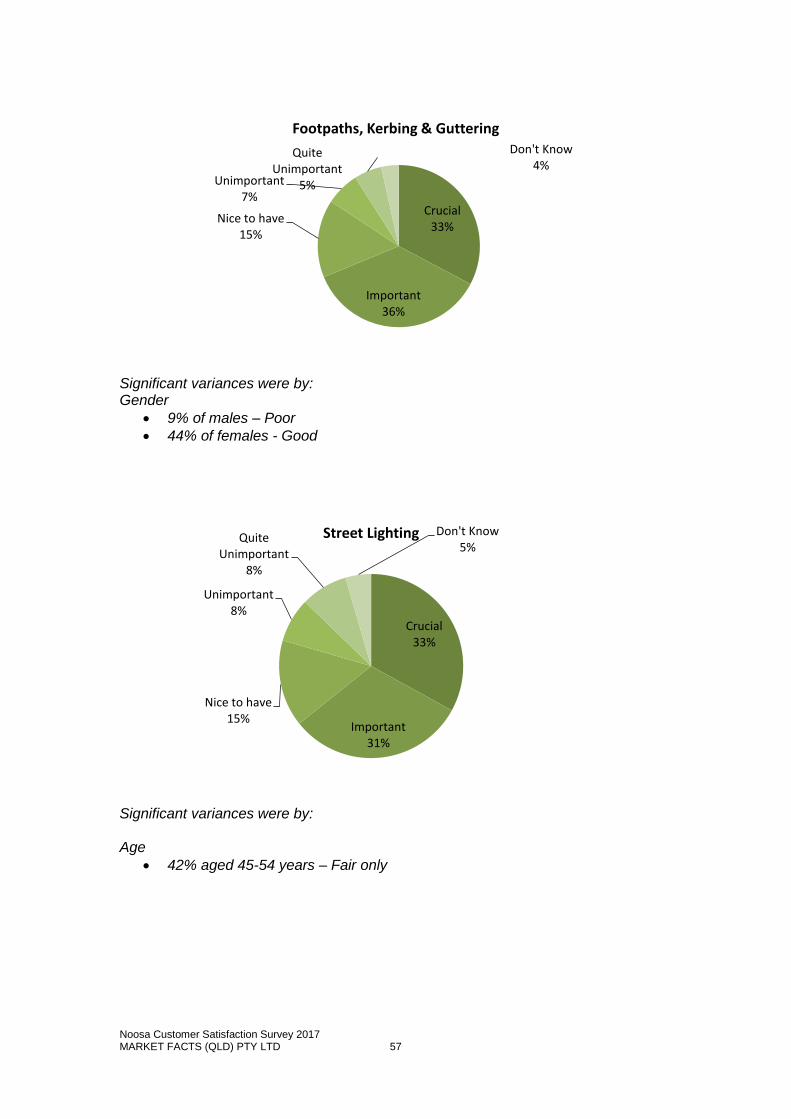
Significant variances were by: Gender
9% of males – Poor
44% of females - Good
Significant variances were by: Age
42% aged 45-54 years – Fair only
Crucial 33%
Important 36%
Nice to have 15%
Unimportant7%
Quite Unimportant
5%
Don't Know4%
Footpaths, Kerbing & Guttering
Crucial 33%
Important 31%
Nice to have 15%
Unimportant8%
Quite Unimportant
8%
Don't Know5%
Street Lighting

Noosa Customer Satisfaction Survey 2017 MARKET FACTS (QLD) PTY LTD 58
Significant variances were by: Age
10% aged 45-54 years – Very poor
Home Ownership
39% of renters – Fair only
Significant variances were by: Age
48% aged 45-54 years – Fair only
Home Ownership
48% of renters – Fair only
Crucial 42%
Important 40%
Nice to have 11%
Unimportant2%
Quite Unimportant
2%
Don't Know3%
Parking Facilities

Noosa Customer Satisfaction Survey 2017 MARKET FACTS (QLD) PTY LTD 59
Significant variances were by: Age
17% aged 35-44 years – Very good
25% aged 55-64 - Poor
30% aged 45-54 years - Fair only Home Ownership
15% of renters – Very good
Significant variances were by: Gender
8% of males – Very poor
54% of females - Good Age
15% aged 35-44 years - Poor
13% aged 45-54 years - Poor
11% aged 55-64 years – Very poor
Very Good 6%
Good 27%
Fair Only 36%
Poor 8%
Very Poor 7%
Don't Know16%
Public Transport
Crucial 52%
Important 34%
Nice to have 8%
Unimportant2%
Quite Unimportant
3%
Don't Know
1%
Drainage & Flood Mitigation

Noosa Customer Satisfaction Survey 2017 MARKET FACTS (QLD) PTY LTD 60
Significant variances were by: Age
27% aged 45-54 years – Fair only
8% aged 45-54 years - Poor
Significant variances were by: Age
6% aged 55-64 years – Very poor
Crucial 58%
Important 33%
Nice to have 6%
Unimportant2%
Don't Know1%
Waste Management
Crucial 48%
Important 36%
Nice to have 12%
Unimportant2%
Don't Know2%
Community Health

Noosa Customer Satisfaction Survey 2017 MARKET FACTS (QLD) PTY LTD 61
Theme 2: Community Lifestyle Services PERFORMANCE
TOTAL RANK Very Good
Good Fair Only
Poor Very Poor
Don't Know
Not App.
Mean 2017
LGAQ Mean 2015
Parks, Playgrounds & Public Amenities
400 3
20.5% 52.0% 20.0% 2.8% 1.0% 3.8% 0.0% 3.92 3.72
Environmental Controls 400 6 17.0% 42.5% 24.5% 5.8% 2.5% 7.8% 0.0% 3.71 3.23
Environmental Protection & Conservation
400
5
19.5% 42.8% 24.8% 5.3% 2.8% 5.0% 0.0% 3.75 3.24
Heritage Protection 400 8= 10.5% 40.0% 28.8% 5.3% 0.8% 14.8% 0.0% 3.64 3.28
Sporting & Recreational Facilities
400 2
16.8% 54.3% 18.3% 1.5% 0.3% 9.0% 0.0% 3.94 3.78
Cultural & Entertainment Facilities
400 8=
11.3% 45.8% 28.5% 7.3% 0.8% 6.5% 0.0% 3.64 3.66
Libraries & Other Information Access
400 1
34.0% 45.0% 13.8% 2.3% 0.5% 4.5% 0.0% 4.15 4.04
Community Safety 400 4 13.3% 50.8% 24.5% 3.3% 0.0% 8.3% 0.0% 3.81 3.37
Community Service 400 7 11.8% 43.3% 31.5% 2.8% 1.3% 9.5% 0.0% 3.68 3.39
Pet/Animal Control 400 10 10.8% 50.5% 25.8% 6.5% 3.0% 3.5% 0.0% 3.62 3.07
Shopping Facilities 400 9 13.8% 47.8% 25.3% 6.8% 3.5% 3.0% 0.0% 3.63 3.21
Community Development
400 11
9.0% 42.5% 34.5% 4.5% 1.0% 8.5% 0.0% 3.59 3.31
AVERAGE FOR THEME AS A WHOLE
3.76 3.44
The average performance rating for this Theme is 3.76. The top performers were:
Libraries & Other Information Access (4.15)
Parks, Playgrounds & Public Amenities (3.92) The poorest performing area was Pet and Animal Control (3.62). Significant variances from the sample averages are also shown, below each graph, for each responsibility area.

Noosa Customer Satisfaction Survey 2017 MARKET FACTS (QLD) PTY LTD 62
Significant variances were by: Gender
25% of females – Very good
Significant variances were by: Gender
29% of males – Fair only
Very Good 20%
Good 52%
Fair Only 20%
Poor 3%
Very Poor 1%
Don't Know4%
Parks, Playgrounds & Public Amenities
Very Good 17%
Good 42%
Fair Only 24%
Poor 6%
Very Poor 3%
Don't Know8%
Environmental Controls
Noosa Customer Satisfaction Survey 2017 MARKET FACTS (QLD) PTY LTD 63
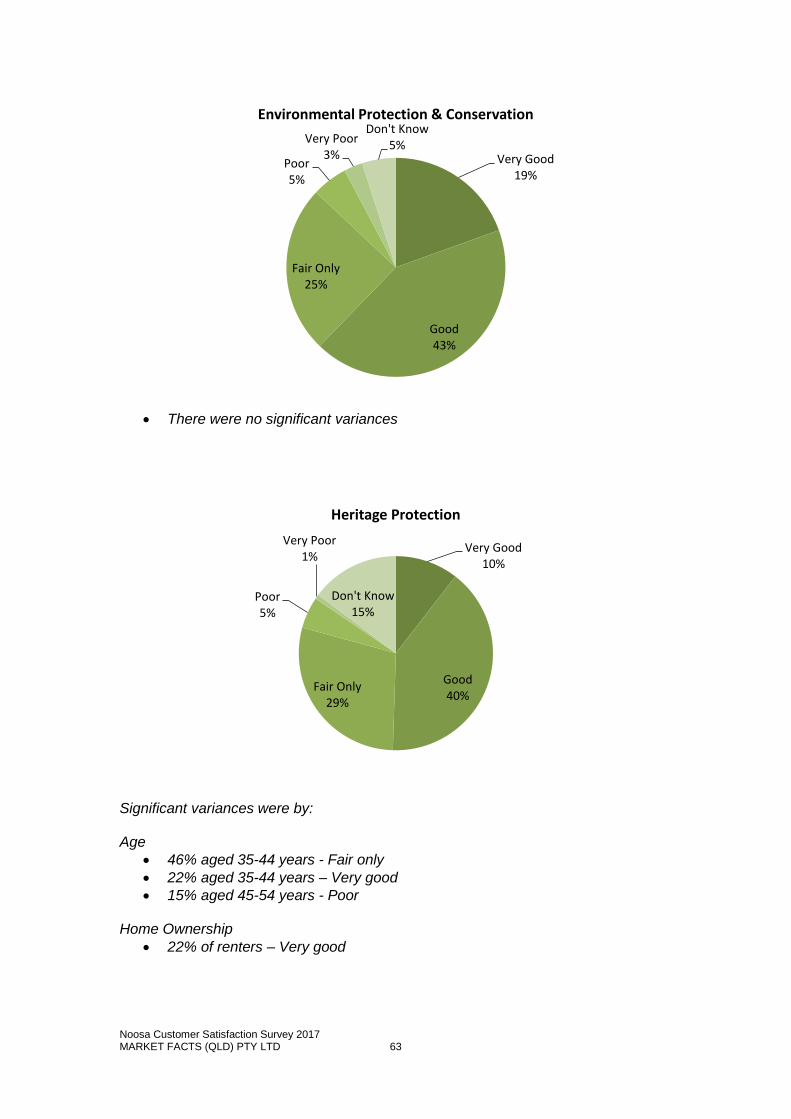
There were no significant variances
Significant variances were by: Age
46% aged 35-44 years - Fair only
22% aged 35-44 years – Very good
15% aged 45-54 years - Poor
Home Ownership
22% of renters – Very good
Very Good 19%
Good 43%
Fair Only 25%
Poor 5%
Very Poor 3%
Don't Know5%
Environmental Protection & Conservation
Very Good 10%
Good 40%
Fair Only 29%
Poor 5%
Very Poor 1%
Don't Know15%
Heritage Protection

Noosa Customer Satisfaction Survey 2017 MARKET FACTS (QLD) PTY LTD 64
Significant variances were by: Age
37% aged 35-44 years – Fair only
2% aged 35-44 years – Very poor
There were no significant variances
Very Good 17%
Good 54%
Fair Only 18%
Poor 2%
Don't Know9%
Sporting & Recreational Facilities
Very Good 11%
Good 46%
Fair Only 29%
Poor 7%
Very Poor 1%
Don't Know7%
Cultural & Entertainment Facilities

Noosa Customer Satisfaction Survey 2017 MARKET FACTS (QLD) PTY LTD 65
Significant variances were by:
Home Ownership
26% of renters – Fair only
Significant variances were by: Gender
17% of males – Very good Age
37% aged 45-54 years – Fair only
10% aged 55-64 years - Poor
Very Good 34%
Good 45%
Fair Only 14%
Poor 2%
Very Poor 1% Don't Know
5%
Libraries & Other Information Access
Very Good 13%
Good 51%
Fair Only 25%
Poor 3%
Don't Know8%
Community Safety

Noosa Customer Satisfaction Survey 2017 MARKET FACTS (QLD) PTY LTD 66
Significant variances were by: Age
49% aged 35-44 years – Fair only
5% aged 45-54 years – Very poor
6% aged 55-64 years - Poor
Significant variances were by: Age
8% aged 45-54 years – Very poor
Home Ownership
39% of renters – Fair only
Very Good 12%
Good 43%
Fair Only 32%
Poor 3%
Very Poor 1% Don't Know
9%
Community Service
Very Good 11%
Good 50%
Fair Only 26%
Poor 6%
Very Poor 3%
Don't Know
4%
Pet/Animal Control

Noosa Customer Satisfaction Survey 2017 MARKET FACTS (QLD) PTY LTD 67
Significant variances were by: Age
7% aged 55-64 years – Very poor
Significant variances were by: Gender
2% of males – Very poor Age
49% aged 35-44 years – Fair only
10% aged 45-54 years - Poor
4% aged 55-64 years – Very Poor
Home Ownership
54% of renters – Fair only
Very Good 14%
Good 48%
Fair Only 25%
Poor 7%
Very Poor 3% Don't Know
3%
Shopping Facilities
Very Good 9%
Good 42%
Fair Only 34%
Poor 5%
Very Poor 1%
Don't Know9%
Community Development

Noosa Customer Satisfaction Survey 2017 MARKET FACTS (QLD) PTY LTD 68
Theme 3: Managing the Shire PERFORMANCE
TOTAL RANK Very
Good Good Fair
Only Poor Very
Poor Don't Know
Not Applicable
Mean 2017
LGAQ 2015
Town Planning 400 6 15.3% 41.3% 24.5% 11.5% 1.0% 6.5% 0.0% 3.62 3.54
Building Control 400 4 16.3% 42.8% 23.0% 9.8% 1.0% 7.3% 0.0% 3.68 3.57
Economic Development & Local Employment
400
8
4.3% 28.3% 40.0% 13.3% 3.0% 11.3% 0.0% 3.20 3.46
Development of Tourism
400 2
18.8% 49.5% 22.3% 3.5% 2.0% 4.0% 0.0% 3.83 3.46
Financial Management
401 3
16.3% 35.5% 28.0% 2.5% 1.8% 16.0% 0.3% 3.74 3.56
Revenue-raising 400 5 11.0% 43.0% 27.3% 4.5% 1.8% 12.5% 0.0% 3.65 3.57
Staff Management 400 7 7.0% 37.3% 21.5% 4.3% 2.0% 28.0% 0.0% 3.60 3.57
Disaster Management
400 1
18.8% 48.3% 18.5% 1.8% 1.5% 11.3% 0.0% 3.91 3.57
AVERAGE FOR THEME AS A WHOLE
3.65 3.53
The average performance rating for this Theme is 3.65. The top performers were:
Disaster Management (3.91)
Development of Tourism (3.83)
Financial Management (3.74) The poorest performing areas were Economic Development & Local Employment (3.20). Significant variances from the sample averages are also shown, below each graph, for each responsibility area.

Noosa Customer Satisfaction Survey 2017 MARKET FACTS (QLD) PTY LTD 69
Significant variances were by: Gender
15% of males – Poor Age
22% aged 45-54 years - Poor
Home Ownership
13% of home owners – Poor
Very Good 7%
Good 48%
Fair Only 29%
Poor 7%
Very Poor 4%
Don't Know5%
Town Planning
Noosa Customer Satisfaction Survey 2017 MARKET FACTS (QLD) PTY LTD 70
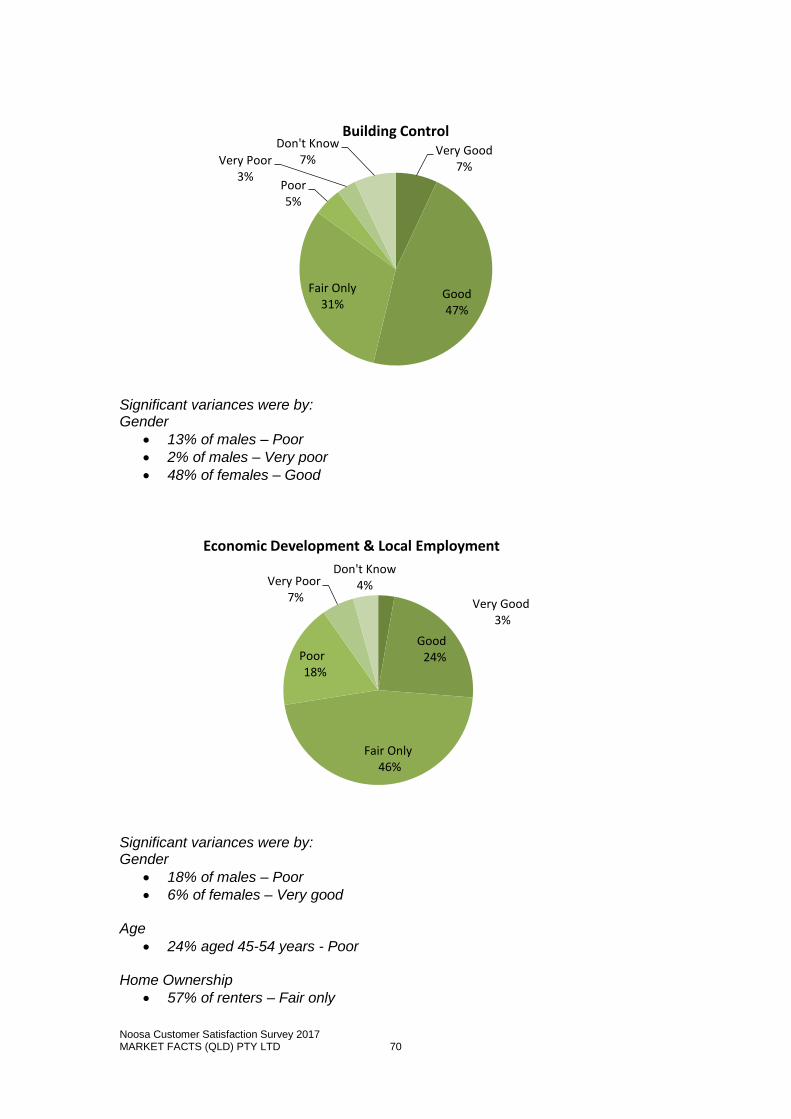
Significant variances were by: Gender
13% of males – Poor
2% of males – Very poor
48% of females – Good
Significant variances were by: Gender
18% of males – Poor
6% of females – Very good Age
24% aged 45-54 years - Poor
Home Ownership
57% of renters – Fair only
Very Good 7%
Good 47%
Fair Only 31%
Poor 5%
Very Poor 3%
Don't Know7%
Building Control
Very Good 3%
Good 24%
Fair Only 46%
Poor 18%
Very Poor 7%
Don't Know4%
Economic Development & Local Employment

Noosa Customer Satisfaction Survey 2017 MARKET FACTS (QLD) PTY LTD 71
Significant variances were by: Age
9% aged 45-54 years - Poor
Significant variances were by: Age
42% aged 35-44 years – Fair only
9% aged 45-54 years - Poor
4% aged 55-64 years – Very Poor
42% aged 65 years and over – Good
23% aged 65 years and over – Very good
Very Good 8%
Good 35%
Fair Only 40%
Poor 9%
Very Poor 3%
Don't Know5%
Development of Tourism
Very Good 6%
Good 34%
Fair Only 35%
Poor 10%
Very Poor 4% Don't
Know11%
Financial Management
Noosa Customer Satisfaction Survey 2017 MARKET FACTS (QLD) PTY LTD 72
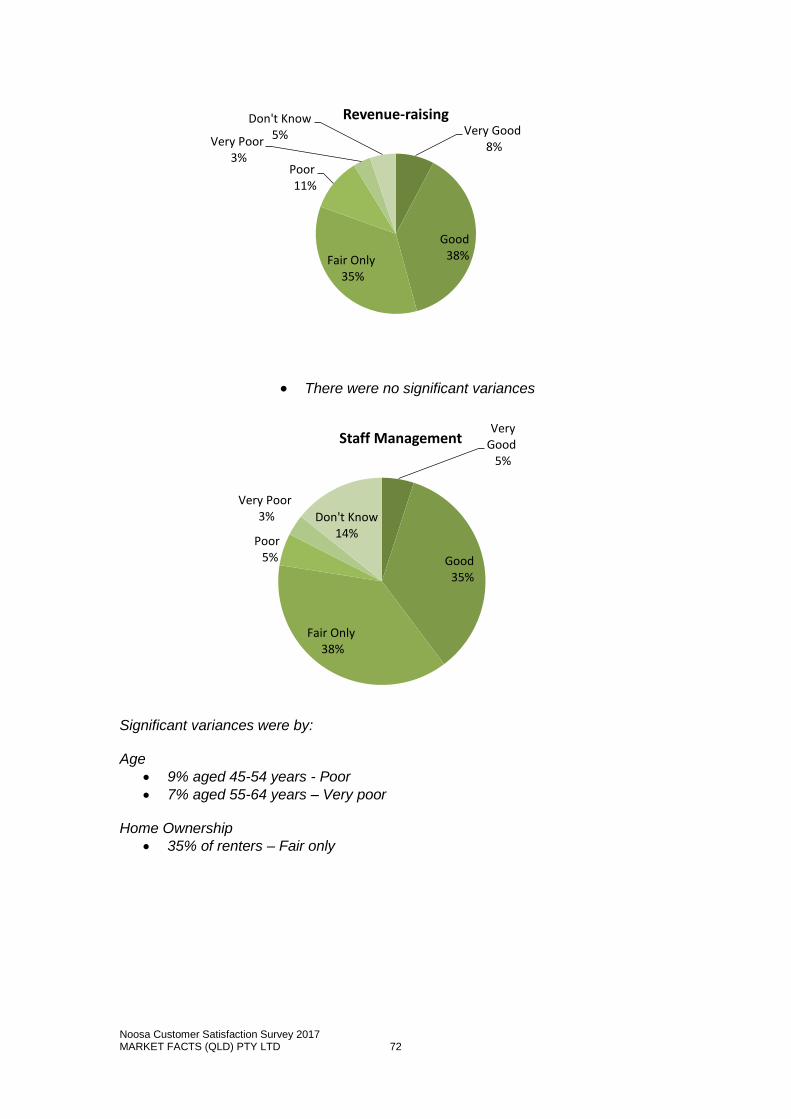
There were no significant variances
Significant variances were by: Age
9% aged 45-54 years - Poor
7% aged 55-64 years – Very poor
Home Ownership
35% of renters – Fair only
Very Good 8%
Good 38%Fair Only
35%
Poor 11%
Very Poor 3%
Don't Know5%
Revenue-raising
Very Good
5%
Good 35%
Fair Only 38%
Poor 5%
Very Poor 3% Don't Know
14%
Staff Management

Noosa Customer Satisfaction Survey 2017 MARKET FACTS (QLD) PTY LTD 73
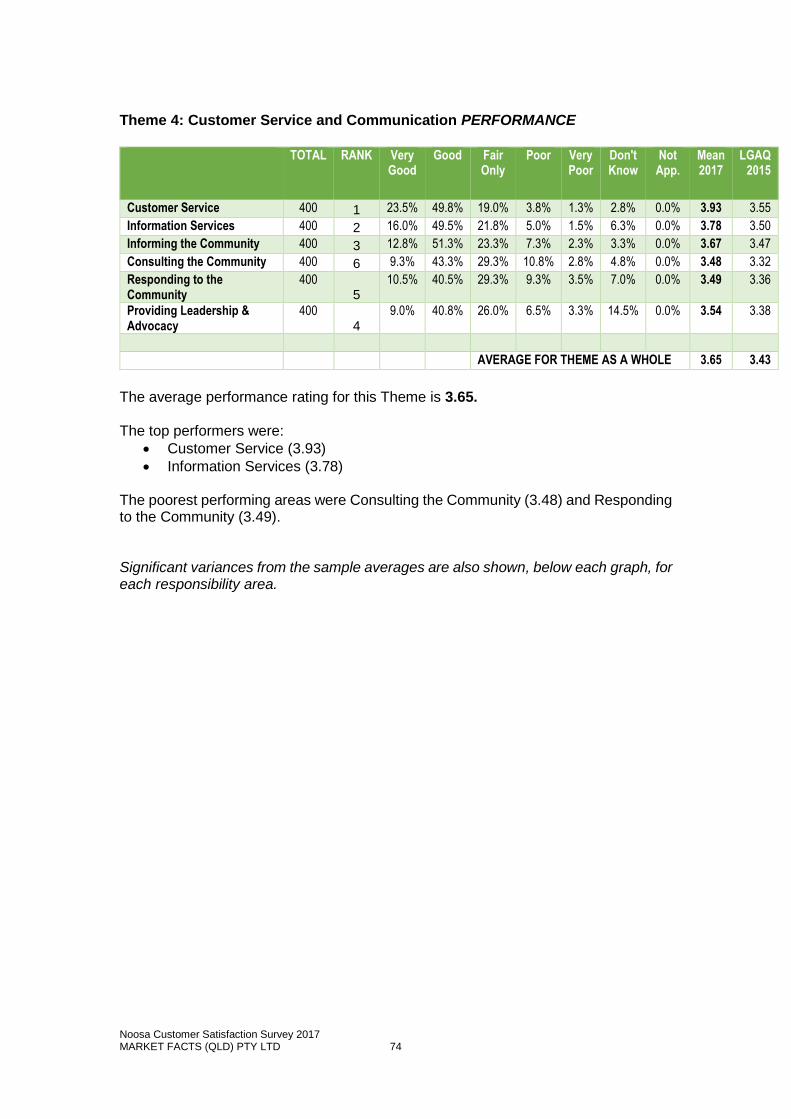
Significant variances were by: Gender
3% of males – Very poor Age
4% aged 55-64 years - Poor
Noosa Customer Satisfaction Survey 2017 MARKET FACTS (QLD) PTY LTD 74
Theme 4: Customer Service and Communication PERFORMANCE
TOTAL RANK Very
Good Good Fair
Only Poor Very
Poor Don't Know
Not App.
Mean 2017
LGAQ 2015
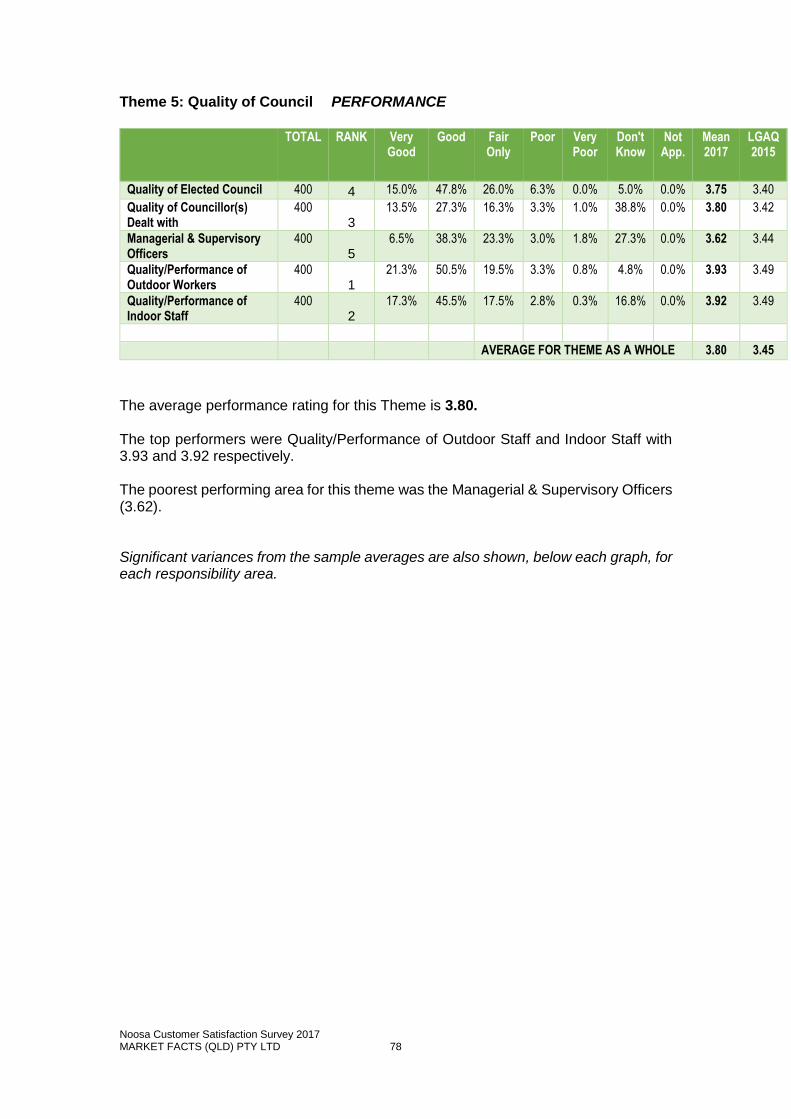
Customer Service 400 1 23.5% 49.8% 19.0% 3.8% 1.3% 2.8% 0.0% 3.93 3.55
Information Services 400 2 16.0% 49.5% 21.8% 5.0% 1.5% 6.3% 0.0% 3.78 3.50
Informing the Community 400 3 12.8% 51.3% 23.3% 7.3% 2.3% 3.3% 0.0% 3.67 3.47
Consulting the Community 400 6 9.3% 43.3% 29.3% 10.8% 2.8% 4.8% 0.0% 3.48 3.32
Responding to the Community
400 5
10.5% 40.5% 29.3% 9.3% 3.5% 7.0% 0.0% 3.49 3.36
Providing Leadership & Advocacy
400 4
9.0% 40.8% 26.0% 6.5% 3.3% 14.5% 0.0% 3.54 3.38
AVERAGE FOR THEME AS A WHOLE 3.65 3.43
The average performance rating for this Theme is 3.65. The top performers were:
Customer Service (3.93)
Information Services (3.78) The poorest performing areas were Consulting the Community (3.48) and Responding to the Community (3.49). Significant variances from the sample averages are also shown, below each graph, for each responsibility area.

Noosa Customer Satisfaction Survey 2017 MARKET FACTS (QLD) PTY LTD 75
Significant variances were by: Age
4% aged 55-64 years – Very poor Home Ownership
35% of renters – Fair only
Significant variances were by: Age
17% aged 35-44 years - Poor
6% aged 55-64 years – Very poor
Very Good 23%
Good 50%
Fair Only 19%
Poor 4%
Very Poor 1%
Don't Know3% Customer Service
Very Good 16%
Good 49%
Fair Only 22%
Poor 5%
Very Poor 2%
Don't Know6%
Information Services

Noosa Customer Satisfaction Survey 2017 MARKET FACTS (QLD) PTY LTD 76
Significant variances were by: Age
16% aged 45-54 years - Poor
7% aged 55-64 years – Very Poor
Significant variances were by: Gender
12% of males – Very good Age
21% aged 45-54 years - Poor
8% aged 55-64 years – Very poor
Home Ownership
12% of home owners – Poor
Very Good 13%
Good 51%
Fair Only 24%
Poor 7%
Very Poor 2%
Don't Know
3%
Informing the Community
Very Good 9%
Good 43%
Fair Only 29%
Poor 11%
Very Poor 3%
Don't Know5% Consulting the Community

Noosa Customer Satisfaction Survey 2017 MARKET FACTS (QLD) PTY LTD 77
Significant variances were by: Age
22% aged 45-54 years - Poor
8% aged 55-64 years – Very Poor
Significant variances were by: Age
13% aged 45-54 years - Poor
8% aged 55-64 years – Very poor
Very Good 10%
Good 41%
Fair Only 29%
Poor 9%
Very Poor 4%
Don't Know7%
Responding to the Community
Very Good 9%
Good 41%Fair Only
26%
Poor 7%
Very Poor 3%
Don't Know15%
Providing Leadership & Advocacy
Noosa Customer Satisfaction Survey 2017 MARKET FACTS (QLD) PTY LTD 78
Theme 5: Quality of Council PERFORMANCE
TOTAL RANK Very
Good Good Fair
Only Poor Very
Poor Don't Know
Not App.
Mean 2017
LGAQ 2015
Quality of Elected Council 400 4 15.0% 47.8% 26.0% 6.3% 0.0% 5.0% 0.0% 3.75 3.40
Quality of Councillor(s) Dealt with
400 3
13.5% 27.3% 16.3% 3.3% 1.0% 38.8% 0.0% 3.80 3.42
Managerial & Supervisory Officers
400 5
6.5% 38.3% 23.3% 3.0% 1.8% 27.3% 0.0% 3.62 3.44
Quality/Performance of Outdoor Workers
400 1
21.3% 50.5% 19.5% 3.3% 0.8% 4.8% 0.0% 3.93 3.49
Quality/Performance of Indoor Staff
400 2
17.3% 45.5% 17.5% 2.8% 0.3% 16.8% 0.0% 3.92 3.49
AVERAGE FOR THEME AS A WHOLE 3.80 3.45
The average performance rating for this Theme is 3.80. The top performers were Quality/Performance of Outdoor Staff and Indoor Staff with 3.93 and 3.92 respectively. The poorest performing area for this theme was the Managerial & Supervisory Officers (3.62). Significant variances from the sample averages are also shown, below each graph, for each responsibility area.

Noosa Customer Satisfaction Survey 2017 MARKET FACTS (QLD) PTY LTD 79
Significant variances were by: Age
39% aged 35-44 years – Fair only
15% aged 45-54 years - Poor
11% aged 55-64 years - Poor
19% aged 65 years and over – Very good
Home Ownership
41% of renters – Fair only
50% of home owners – Good
Significant variances were by: Age
15% aged 35-44 years - Poor
34% aged 65 years and over - Good
Home Ownership
9% of renters – Poor
Very Good 15%
Good 48%
Fair Only 26%
Poor 6%
Don't Know5%
Quality of Elected Council
Very Good 14%
Good 27%
Fair Only 16%
Poor 3%
Very Poor 1%
Don't Know39%
Quality of Councillor(s) Dealt with
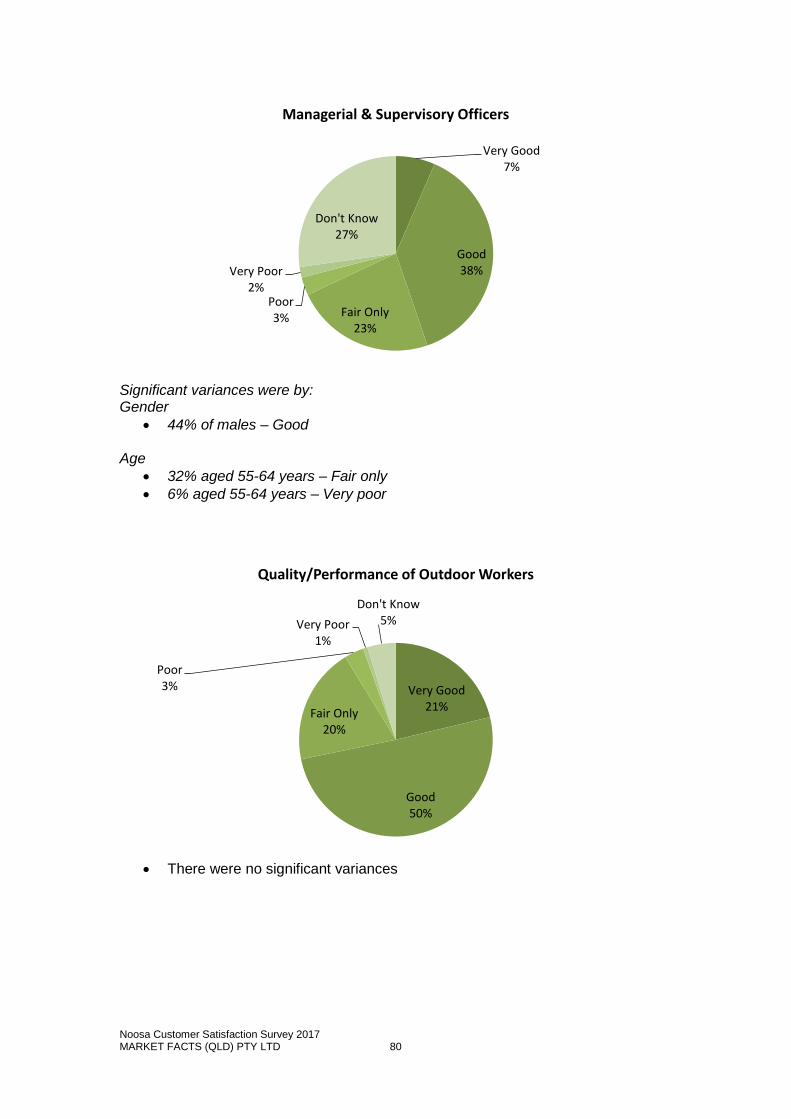
Noosa Customer Satisfaction Survey 2017 MARKET FACTS (QLD) PTY LTD 80
Significant variances were by: Gender
44% of males – Good Age
32% aged 55-64 years – Fair only
6% aged 55-64 years – Very poor
There were no significant variances
Very Good 7%
Good 38%
Fair Only 23%
Poor 3%
Very Poor 2%
Don't Know27%
Managerial & Supervisory Officers
Very Good 21%
Good 50%
Fair Only 20%
Poor 3%
Very Poor 1%
Don't Know5%
Quality/Performance of Outdoor Workers

Noosa Customer Satisfaction Survey 2017 MARKET FACTS (QLD) PTY LTD 81
Significant variances were by: Age
8% aged 45-54 years – Poor

Noosa Customer Satisfaction Survey 2017 MARKET FACTS (QLD) PTY LTD 82
PUBLIC OPINION QUESTIONS – KEY FINDINGS This section of the report presents the key findings of the two public opinion questions. They were asked as ‘open ended questions’ in the survey. However, in order to give a snapshot summary, they are also graphically presented. In this survey, all questions were included in the briefing mail-out sent to each respondent prior to the main telephone interview. Consequently, respondents had time to think about the question, and give a ‘considered’ opinion. They were requested to do just this – even discuss the question with friends and relations – in the briefing letter.
1. Do you or your family have a disaster management plan for a flood or a fire?
Almost a third (60%), as shown graphically below, of respondents have disaster management plan for a flood or fire.
There were no significant variances.

Noosa Customer Satisfaction Survey 2017 MARKET FACTS (QLD) PTY LTD 83
2. During a disaster event, how will you access information? By far, accessing information from the radio, was the most common response with 60% of respondents mentioning this medium. The other most common ways respondents access information during a disaster event were:
TV (35.4%)
Friends/neighbours (27.4%)
Phone / SMS (21.6%)
Significant variances were by:
Gender
11% of females – Facebook
Age
49% aged 35-44 years – web/online
68% aged 65 years and over - Radio
37% aged 65 years and over – Friends/Neighbours
12%% aged 65 years and over – Local Newspaper
Home Ownership
24% of renters – Facebook
15% of renters – Local newspaper

Noosa Customer Satisfaction Survey 2017 MARKET FACTS (QLD) PTY LTD 84
3. Council consistently strives to strike the right balance between providing the best possible services and operating within its financial means. Would you prefer that Council…
The majority (86%) of respondents preferred to ‘leave as is ‘, when trying to strike a balance between providing the best possible service and operating within its financial means.
There were no significant variances

Noosa Customer Satisfaction Survey 2017 MARKET FACTS (QLD) PTY LTD 85
4. Council is constantly striving to communicate well with residents. What would be the method you would choose to seek information from council about a project or an issue?
The most common ways respondents seek information is through:
Council’s Customer service staff (50%),
Council’s web (30%),
Local Newspaper (21.5%)
All other responses are graphically summarised below.
Significant variances were by:
Gender
10% of Males – Newsletter from mayor/councillors
16% of Females – Letterbox drops
Age
15% aged 35-44 years – Newsletter from Mayor/Councillors
40% aged 55-64 years – Council’s website
Home Ownership
13% of renters – Newsletter from Mayor/Councillors
7% of renters – Word of mouth

Noosa Customer Satisfaction Survey 2017 MARKET FACTS (QLD) PTY LTD 86
5. Would you like to register to receive important Council updates using any of the following methods?
a) Online community engagement portal on Council’s website
29% of respondents advised they would like to receive important council updates via the online community engagement portal, as shown graphically below.
Significant variances were by:
Gender
35% of males - Yes
77% of females – No
Age
45% aged 45-54 years - yes
81% aged 65 years and over - no

Noosa Customer Satisfaction Survey 2017 MARKET FACTS (QLD) PTY LTD 87
b) Email
33% of respondents advised they would like to receive important council updates via email communication, as shown graphically below.
Significant variances were by:
Age
43% aged 45-54 years - yes
42% aged 55-64 years - yes
74% aged 65 years and over - no

Noosa Customer Satisfaction Survey 2017 MARKET FACTS (QLD) PTY LTD 88
c) E-Newsletter
35% of respondents advised they would like to receive important council updates via E- Newsletter, as shown graphically below.
Significant variances were by: Age
48% of 55-64 years - yes
73% of 65 years and over - no

Noosa Customer Satisfaction Survey 2017 MARKET FACTS (QLD) PTY LTD 89
d) Rate notice via email
31% of respondents advised they wished to receive important council updates through Rate notice via email, as shown graphically below.
Significant variances were by:
Age
43% aged 55-64 years – yes
77% aged 65 years and over - no
Home Ownership
89% of renters – no
33% of home owners - yes

Noosa Customer Satisfaction Survey 2017 MARKET FACTS (QLD) PTY LTD 90
SUMMARY This 2017 benchmark study for Noosa Shire Council clearly shows the extent to which Council is currently performing and is perceived to be meeting expectations of the community it serves. While this study can be used as a stand-alone report on the situation in Noosa Shire Council, as the community sees it, it can also be compared against an external standard - the 2015 LGAQ State-wide Report of results for Queensland, and Provincial Councils. An update report will provide a comparison to Noosa 2017 results, when the results of the LGAQ 2017 survey results, are released (due August 2017). Obviously, for reviewing performance, up-dating the Corporate Plan, and determining priorities, the most important information is the actual detail in Noosa’s own study. However, taking account of an external measurement criterion is important, as it provides Council with a relative comparison measure of its performance. Overall Performance
An assessment of the overall performance of Council, is obtained at the end of the survey, after all the ratings for Importance and Performance for the 41 individual Areas of Council Responsibility have been obtained – a process which gives respondents plenty of time to review and assess just how well its Council has actually performed, on the ‘things that matter’. In this final question, respondents are asked to provide ratings for ‘Overall Council Performance’. The average of these ratings provides a single number which sums up their attitudes on the whole subject. The result for this survey is 3.82, which translates to almost three quarters of respondents viewing Council’s performance as ‘good’ (55%) and ‘very good’ (17%). It is also 76.4% of the ‘Optimum’ score of 5 which means that Council is generally viewed as being effective in delivering services to the community. A second way of measuring “Overall Performance” is to take the individual Performance ratings for each of the 41 Council Responsibility Areas, add them up after allowing for the relative “perceived Importance” of each of the Areas, and then calculate the result as a percentage of the possible optimum. On this basis (called the Average Total Performance Index), Noosa Shire Council is rated as achieving 73.2%.

Noosa Customer Satisfaction Survey 2017 MARKET FACTS (QLD) PTY LTD 91
COMPARISON OF PERFORMANCE INDICES
Total Performance Index (TPI) for Noosa is 73.2%, and is compared graphically with LGAQ State-wide and Provincial TPIs. (This chart will updated with Queensland wide and Provincial TPI’s from the LGAQ 2017 State-wide survey when available).
The chart above, shows the Noosa TPI (73.2%) for 2017 compared to TPI for the 5 key themes. As can be seen from the chart above, Noosa is well exceeding overall average TPI in 4 out of the 5 areas namely:
Qualities of Council (76.03%)
Customer Service and Communication (72.94%)
Community Lifestyle Services (75.17%)
Managing the Shire (72.31%) For Noosa’s Basic Services and Infrastructure TPI (69.91%), it is only just below Provincial TPI (69.95%) and LGAQ State-wide (71.82%).

Noosa Customer Satisfaction Survey 2017 MARKET FACTS (QLD) PTY LTD 92
Areas Rated as Being ‘Poor’ on Performance
Market Facts believes that Corporate Planning and Continuous Improvement initiatives in Noosa Shire Council should focus on and prioritise those areas of responsibility, which are more important to residents and where Council is seen as being further away from fulfilling expectations (performance ratings). The objective should be to ‘close those gaps’. This can be done by closing the gap between actual Performance and what it would be if it achieved the Optimum Score of ‘5’ (which is not the same as the Importance score) These 7 Responsibility Areas have been selected on the basis that
their Importance rating is at least 3.96 (on the border-line of ‘4’= ‘Important’), and
their Performance is more than 1.5% below Average (where Average Total Performance Index is 73.2%).
These are shown graphically below.
70.7%
69.8%
69.7%
69.6%
68.7%
63.9%
59.7%
50.0% 55.0% 60.0% 65.0% 70.0% 75.0%
Providing Leadership & Advocacy
Road Construction
Responding to the Community
Consulting the community
Road Maintenance
Economic Development/Local Employment
Parking Facilities
Lowest Performers

Noosa Customer Satisfaction Survey 2017 MARKET FACTS (QLD) PTY LTD 93
Areas Rated as Being ‘High’ on Performance
There are 15 Responsibility Areas (out of the total of 41) on which Council performed best in relation to their judged importance. In this case, ‘best’ is defined as having an Importance rating of at least 3.96, and Performance more than 1.5% above Average (73.2%). This list does not include all the Areas where the “gaps are smallest”, as most of these do not have an Importance score above ‘4’ (the border-line between ‘Important’ and ‘Nice to Have’).

Noosa Customer Satisfaction Survey 2017 MARKET FACTS (QLD) PTY LTD 94
Areas of Average Performance
There are only 12 Responsibility Areas (out of the total of 41) on which Council has received an average score which is defined as having:
an Importance rating of at least 3.96 (on the border-line of ‘4’= ‘Important’), and
Performance not more than 1.5% below or above Average (where Average Performance 73.2% - the (calculated) Average Total Performance Index).
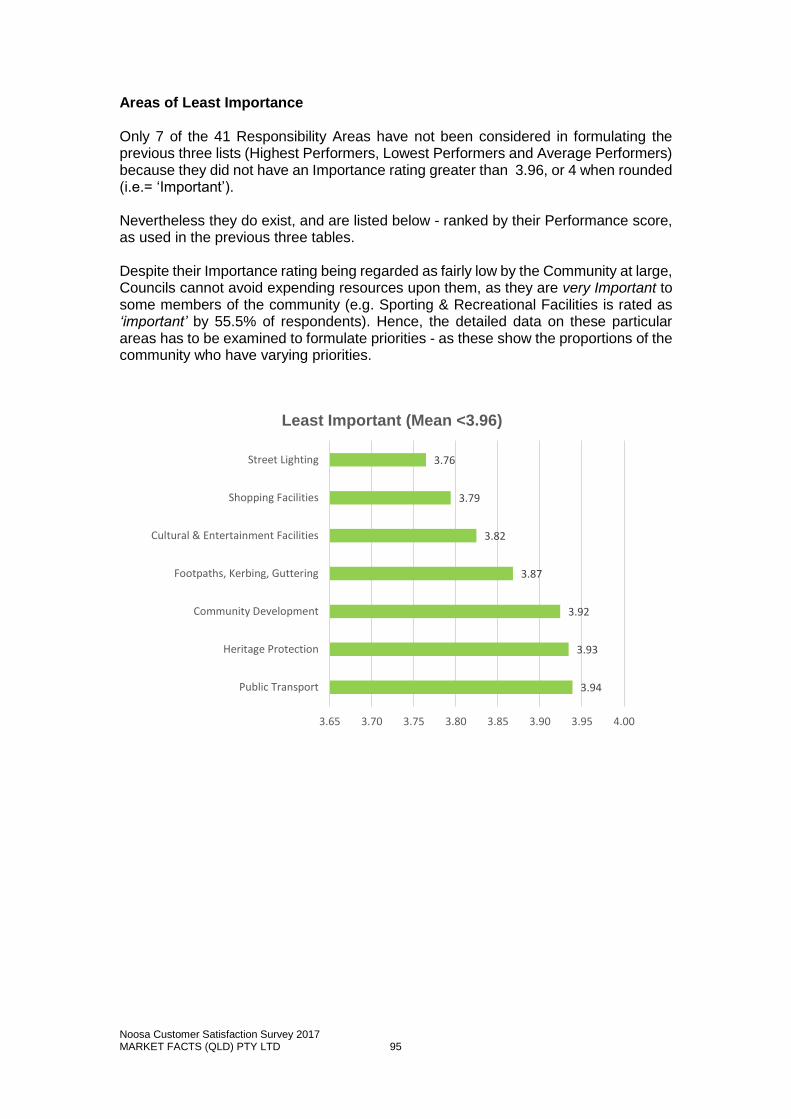
Noosa Customer Satisfaction Survey 2017 MARKET FACTS (QLD) PTY LTD 95
Areas of Least Importance
Only 7 of the 41 Responsibility Areas have not been considered in formulating the previous three lists (Highest Performers, Lowest Performers and Average Performers) because they did not have an Importance rating greater than 3.96, or 4 when rounded (i.e.= ‘Important’). Nevertheless they do exist, and are listed below - ranked by their Performance score, as used in the previous three tables. Despite their Importance rating being regarded as fairly low by the Community at large, Councils cannot avoid expending resources upon them, as they are very Important to some members of the community (e.g. Sporting & Recreational Facilities is rated as ‘important’ by 55.5% of respondents). Hence, the detailed data on these particular areas has to be examined to formulate priorities - as these show the proportions of the community who have varying priorities.
3.94
3.93
3.92
3.87
3.82
3.79
3.76
3.65 3.70 3.75 3.80 3.85 3.90 3.95 4.00
Public Transport
Heritage Protection
Community Development
Footpaths, Kerbing, Guttering
Cultural & Entertainment Facilities
Shopping Facilities
Street Lighting
Least Important (Mean <3.96)

Noosa Customer Satisfaction Survey 2017 MARKET FACTS (QLD) PTY LTD 96
The High Priority Areas
The Responsibility Areas, that have the largest ‘gaps’ between their scores for Performance and their scores for Importance, also appear near the top of the Importance ranking and at the bottom of the Performance ranking. These are the Areas where residents are expressing high levels of dissatisfaction with Performance levels and are awarding strong ‘should try harder’ scores. Performance Improvement Targets The chart overleaf shows a list of targets for improvement where elements have performance ratings 1.5% or more below the average performance assessment of 73.2%, but which also have relatively high (=/>4) levels of importance. There are others close to the cut-off not shown in this figure, although these are noted in the detailed findings.
These elements can be considered as priorities for enhancement of overall performance. Attention to these elements will lead to the greatest overall increase in the weighted performance indices. This 2017 benchmark customer satisfaction survey provides a solid foundation for Noosa Shire Council to review its targets for improving its performance ratings. The results show that Noosa Shire Council is tracking well above it Provincial counterparts, and also for Queensland, in term of overall performance when compared with LGAQ 2015 survey results. This will be further compared later in 2017, when LGAQ State-wide 2017 is available. However, this research will enable future ongoing tracking studies to be undertaken by Noosa Shire Council, to monitor the degree of success it is having in reaching their performance improvement targets.
70.7%
69.8%
69.7%
69.6%
68.7%
63.9%
59.7%
73.20%
0.0% 10.0% 20.0% 30.0% 40.0% 50.0% 60.0% 70.0% 80.0%
Providing Leadership & Advocacy
Road Construction
Responding to the Community
Consulting the community
Road Maintenance
Economic Development/Local Employment
Parking Facilities
OVERALL WEIGHTED PERFORMANCE INDEX
Performance Improvement Targets

Noosa Customer Satisfaction Survey 2017 MARKET FACTS (QLD) PTY LTD 97
APPENDIX
Survey Questionnaire

J2402 Noosa Shire Council 2017 Market Facts (Qld) Pty Ltd Page 98 of 115
NOOSA SHIRE COUNCIL
COMMUNITY SATISFACTION & ATTITUDES SURVEY
2017
Interviewers' Instructions
&
Respondent Contact
Market Facts Ref: J2402
Total Sample n=400

J2402 Noosa Shire Council 2017 Market Facts (Qld) Pty Ltd Page 99 of 115
Stage I FIRST CONTACT
Good morning/ afternoon/ evening, my name is ............ from Market Facts, the Queensland Market Research Company, and I'm ringing on behalf of the NOOSA SHIRE COUNCIL. We're conducting a survey about the sorts of services people expect from their local council and how well they feel the council is doing its job... Are you a permanent resident of your local area, aged 18 years or over? (IF NO, ASK FOR SOMEONE ELSE WHO IS) 1(a) Are you normally fairly interested in discussing local government issues and expressing an opinion about
them? Yes 1 [GO TO 2] No 2 [GO TO 1(b)]
Maybe / Don’t Know/ Not Sure 3 [GO TO 1(b)]
Refuses interview (TERMINATE, TALLY BELOW AND RECORD ON CALL SHEET):
(b) Would you be prepared to express an opinion about the sorts of services you expect from your local council? Yes 1 [GO TO 2] No 2 [GO TO 4] 2(a) Are you an employee of your local council?
Yes 1 No 2 [GO TO 4] (b) Do you feel able to judge how well the local council is doing its job?
Yes 1 No 2 [GO TO 4] (c) Have you been living in this area for at least a year?
Yes 1 No 2 [GO TO 5] Well, we'd be grateful if you would take part in our survey... It involves our posting to you some information on the different types of Council services and then ringing you again to get your opinions of your Council's performance... 3 Are you prepared to take part?
Yes 1 [GO TO Page 2 of this Questionnaire]
No 2 [GO TO 5] 4 Have you been living in this area for at least a year?
Yes 1 No 2 5 Well if you were asked to give your local council a rating on how well they are carrying out their responsibilities
and delivering the services they are supposed to, would you give them a 5 for ‘very good’, a 4 for ‘good’, a 3 for ‘fair only’, a 2 for ‘poor’ or a 1 for ‘very poor’? (TALLY STROKE THE RATING IN THE RELEVANT BOX) THANK AND TERMINATE CONTACT
5
4
3
2
1
Cannot Judge
THANK, AND TERMINATE CONTACT

SCREENING QUESTIONNAIRE - Page 2 And just to make sure we are covering a cross-section of people in our survey ...... 6. Thinking about your neighbourhood, could it be described as.... A built-up area, living close to your neighbours? 1 Park residential (½-1 hectare / 1-2½ acres) 2 Rural residential (more than 1-2 hectare/ 2½-5 acres) 3 A truly rural area, like living on a farm? 4 7. RECORD GENDER Male 1 Female 2 8. What age group are you in? Would you be .........
18 - 24 ? 1 45 - 54 ? 4 25 - 34 ? 2 55 - 64 ? 5 35 - 44 ? 3 65 yrs and over 6 9. What is your present work status? Are you...
Working full-time? 1 Home duties? 4 Working part-time? 2 Retired? 5 Unemployed? 3 Incapacitated? 6 10. Are you renting, or living in your own home?
Renting 1 Own home 2 ENROL RESPONDENTS FOR MAIN SURVEY ■ Write name, address, phone or fax number and preferred re-contact arrangements on “contact sheet’
for use in re-contacting ■ Organise posting / faxing / emailing of letter and attachments.
Thank you for your help. I will be sending your information packet shortly. Please read it through very carefully as our second interview will be all about the conclusions you reach after reading this material. The material we are sending you is not confidential - you can discuss it with any one you like - family, neighbours, friends . . . . The opinions that you give us are confidential, and only I and Market Facts will know what you have said. Goodbye. I’ll talk to you again on the ...............................................[INSERT DATE]

April 2017
Dear .........
Thank you for taking part in our survey on behalf of the NOOSA SHIRE COUNCIL. It is expected to provide valuable input to Council’s review of their Corporate Plans, and their long term Corporate Goals. The primary aim of the survey is to provide information to assist in improving their delivery of services to your local community.
The first two attached sheets list the various Areas of Council Responsibility for you to read and consider - even
discuss with family or friends - in preparation for a further phone contact, in which our interviewer will ask you to
rate Council's performance on all areas where you feel able to form a judgement. Don't worry if there are some areas
you are not familiar with - the interviewer will clarify things further if necessary.
In the interview, we will cover:
1 How important you consider each of those services or responsibilities to be - using a five-point scale, with the
ratings being: Crucial (5), Important (4), Nice to Have (3), Not Very Important (2), Quite Unimportant (1)
[For some of the Areas or Services, Council shares responsibility with State and/or Federal Governments (e.g. Roads) or private operators (e.g. Public Transport). You need to decide how important it is for your Council to get involved to some extent to ensure the service is provided, whether it does the job itself, or organises and/or pressures other levels of government or private enterprise to do it.]
2 How well you believe your Council is performing in those aspects - the five-point scale being:
Very Good (5), Good (4), Fair Only (3), Poor (2), Very Poor (1)
If you were to put your own ratings for each area in the margins before we phone you, it might save some time.
3 The third page of the attachment provides details of most of the final questions we will ask you, right at the end
of the interview. It would be helpful if you would have a think about them, so that you can give us your opinions
and feelings about them.
Thank you for your interest and we look forward to receiving your input at the forthcoming telephone interview,
which I understand has been tentatively arranged for...
...................day, the .............. of ……… at .......... am/pm.
Interviewer’s Name & Phone Number
If you have any queries, please feel free to contact me personally.
Yours sincerely
LESLEY GIBBS
General Manager

J2402 Noosa Shire Council 2017 Market Facts (Qld) Pty Ltd Page 102 of 115
AREAS OF COUNCIL RESPONSIBILITY
THEME (1) Basic Services and Infrastructure
THEME (2) Community Lifestyle Services
Performance Function/Responsibility Examples/Clarification
Importance
Road Construction Constructing new OR upgrading existing roads
Road Maintenance
Repairing potholes and damaged road shoulders; street sweeping and
verge mowing
Footpaths, Kerbing & Guttering Construction and maintenance of safe footpaths, kerbs and gutters
Street Lighting Funding the provision and upkeep of lights on Council streets/roads
Traffic Management
Traffic planning, traffic lights, roundabouts, traffic `calming' and
directional signage
Parking Facilities
Establishing parking policies, parking control, provision of or
assessment of requirement for on and off-street parking
Public Transport Ensuring the provision of an adequate system of public transport
Drainage & Flood Mitigation
Construction and maintenance of open and underground stormwater
drains, levee banks, division channels etc
Waste Management
Garbage collection and disposal, waste minimisation (recycling and
composting), street bins
Community Health
Inspection of restaurants/cafés/shops, mosquito/midge spraying,
cemeteries
Perform
ance Function/Responsibility Examples/Clarification Importanc
e
Parks, Playgrounds & Public
Amenities
Development and maintenance of open space areas, parks, children's play-
grounds and public toilets
Environmental Controls Enforcement of regulations on air, water and noise pollution
Environmental Protection &
Conservation
Tree planting, bushland acquisition, noxious weeds eradication, foreshore
protection, preservation of natural areas
Heritage Protection Preservation of historic buildings, monuments, facilities, artefacts, and
indigenous & other records
Sporting & Recreational Facilities Public swimming pools, sports-fields, land and/or support for clubs & their
facilities
Cultural & Entertainment
Facilities
Civic centre, public halls, art gallery/museum, sound shell, community arts
programs, community festivals
Libraries & Other Information
Access Public libraries (incl. mobiles), Internet access, CD ROM's
Community Safety Safety action plans, safety audits, signage, security patrols & cameras,
beach & pool lifeguards, community education & awareness programs
Community Services
Programs and facilities which meet the needs of a range of stakeholder
groups (such as senior citizens, young people, families, indigenous,
disabled, non-English speaking background)
Pet / Animal Control Registration, impounding of strays, control of feral animals
Shopping Centres Ensuring the provision of adequate shopping facilities to meet the needs and
convenience of local residents
Community Development Working with (& supporting) community organisations and special-interest
groups to develop strong, sustainable & self-reliant communities

J2402 Noosa Shire Council © 2017, Market Facts (Qld) Pty Ltd Page 103 of 115
THEME (3) Managing the Shire
Performance
Function/Responsibility Examples/Clarification Importance
Town Planning
Planning and zoning for the purposes of residential, rural, commercial,
industrial, recreational, open space & public infrastructure development,
rules regarding land usage
Building Control
Development and building approvals & controls, building & plumbing
inspections, swimming pool fencing
Economic Development &
Local Employment
Promoting/supporting increased economic activity and increased local
employment opportunities, attracting investment
Development of Tourism
Area promotion, tourist information facilities, visitor care programs,
caravan parks, promoting/supporting additional tourism activities
Financial Management Responsible, open and accountable management of the Council's finances
Revenue Raising
Establishing fair and equitable rating for residential, rural, commercial and
other sectors; applying a fair and reasonable balance between income from
rates and from user-pays fees and charges
Staff Management
Selection of skilled and qualified staff and ongoing training and personal
development for Council employees
Disaster Management
THEME (4) Customer Services and Communication
THEME (5) Qualities of Council
Performance Function/Responsibility Examples/Clarification Importance
Customer Service
Accessible & adequate facilities for dealing with and responding to
contacts from stakeholders and the general public, handling enquiries /
requests / complaints
Information Services
Maintaining and updating databases on Council facilities & services
including rates & property information, drainage networks, community
services, etc
Informing the Community
Keeping the community informed of Council policies, plans, programs &
activities thru newsletters & other means, advising of community issues
to be debated
Consulting the Community
Ensuring community input into Council policies, plans & programs by
regularly canvassing residents’ opinions & priorities and by maintaining
effective relationships with the broad range of community groups
Responding to the Community
Providing feedback on community input, taking action where appropriate
to implement community priorities, being accessible to all members of the
community including minority groups
Providing Leadership &
Advocacy
Representing local community needs & interests to other spheres of
government (including government authorities) and to other outside
organisations whenever relevant, supporting civic pride & local identity,
promoting accountability & best practice
Performan
ce Function/Responsibility Examples/Clarification Importan
ce
Elected Council (as a whole)
Provides leadership & direction for the community, even-handed,
responsive, open & honest
Councillor(s) you deal with Reliable, dedicated, knowledgeable, helpful, readily accessible
Managerial & Supervisory
Officers
Skilled & capable leaders and managers in control of their
responsibilities and their staff
Outdoor Workers Competent, effective, efficient, get things done
Indoor Staff
Accessible, courteous, helpful, believe in achieving solutions, effective,
efficient, knowledgeable
OVERALL COUNCIL
PERFORMANCE
Delivering a level of services and displaying a quality of performance in
fulfilling all responsibilities, regarded as ‘value for money’ for the rates and
charges you pay

J2402 Noosa Shire Council © 2017, Market Facts (Qld) Pty Ltd Page 104 of 115
SUPPLEMENTARY QUESTIONS 1. Do you or your family have a disaster management plan for a flood or a fire?
Yes 1 No 2
2. During a disaster event, how will you access information?
Local newspaper 1 Radio
2 TV
3
Facebook 4
Friends/neighbours 5 Other (Specify) * ____________________
6. Council consistently strives to strike the right balance between providing the best possible services and
operating within its financial means. Would you prefer that Council…
Provided improved or increased services, at a higher cost to ratepayers (that is, funded through an increase in rates).
1
Reduced services and lowered the cost to ratepayers.
2
Neither a) nor b) - leave things as they are.
3
7. Council is constantly striving to communicate well with residents. What would be the method you would choose to seek information from council about a project or an issue?
Local newspaper 01
Council’s website 02
Social media (Facebook, Twitter etc) 03
Council’s customer service staff 04
E-Newsletters 05
Letterbox drops 06
Email 07
Other (specify) *
5. Would you like to register to receive important Council updates using any of the following methods?
Yes No
On line community engagement portal on Council’s website (Your Say Noosa) 1 2
Email 1 2
E newsletter 1 2
Rate notice via email 1 2
If Yes to Email or E Newsletter, you can go to Noosa Council’s website [email protected] to leave your information.

J2402 Noosa Shire Council © 2017, Market Facts (Qld) Pty Ltd Page 105 of 115
(NOTE: EACH SUCCESSIVE QUESTIONNAIRE IS TO START THE INTERVIEW SEQUENCE WITH
A
DIFFERENT THEME. THEN
■ ROTATE THROUGH ALL THEMES IN SEQUENCE.
■ MARK THEME START POINT ON CONTACT SHEET.
■ USE SAME PRESENTATION, BUT ADAPT THE FUNCTION NAMES AND DESCRIPTIONS
ACCORDINGLY.)
Stage III - INTERVIEW
INTRODUCTION AND PRESENTATION DOCUMENT FOR USE WITH QUESTIONNAIRE
Good morning/ afternoon/ evening, my name is ............ , of Market Facts, the Queensland market research company,
ringing on behalf of the NOOSA SHIRE COUNCIL. Could I please speak to ..............? [RE-INTRODUCE] I want
to ask you some questions now, based on the material we sent you... Have you got it handy? [WAIT OR RING BACK
AS APPROPRIATE. IF MATERIAL NOT READ, STILL PROCEED. IF NOT RECEIVED, CONFIRM CORRECT
ADDRESS/FAX, MAKE NOTATION IN CALL SHEET AND SAY] Alright, my Supervisor will no doubt be in touch
with you about that. [THANK AND TERMINATE]
Importance Rankings The first task is to decide how important are the various responsibilities we listed in the material we posted or faxed
to you. Would you mind looking at the sheet headed AREAS OF COUNCIL RESPONSIBILITY?
Now, in some cases, the Council will have a shared responsibility with State and/or Federal Governments - like for
Roads; or you may think something should be left to Private Enterprise - for example, Public Transport. What you
have to decide, however, is how important it is for your council to get involved to some extent to ensure the service
is provided, whether it does the job itself or arranges that some other level of government or private enterprise does
it. Should the council at least be taking the initiative in that area, if necessary, to see that the service is provided?
To explain the levels of Importance which we've shown in the letter we sent you, ‘crucial’ means that it is a service
or activity that the community must have and that it is vital for the council either to do or to get involved in to make
sure that it is done by someone. ‘Important’ is for something that you certainly expect your council to do or provide,
or else make sure that somebody else provides it. ‘Nice to have’ means just that, as does ‘not very important’. ‘Quite
unimportant’ means unnecessary - something that in any council cut-backs would be the first to go.
Why we say that is because, as you would appreciate, a council, like other forms of government, doesn't have enough
money to do everything that everybody would like it to do. It has to set priorities; so please spread your importance
rankings across the range, having regard to resource limitations.
[START THEME HERE]
Now let's take the first group of responsibilities on your list – BASIC SERVICES AND INFRASTRUCTURE. How
important is it for the Council to be involved here? First of all, ‘Road Construction’... Just looking again at the
explanation alongside that on your sheet - ‘Constructing new or upgrading existing roads’ - just give me its level of
importance in your view... Is it ‘crucial’, ‘important’, ‘nice to have’, ‘not very important’ or ‘quite unimportant’?
[WORK THROUGH ALL ITEMS UNDER ‘Basic Services and Infrastructure’, READING OUT THE
‘Examples/Clarification’ TO THE RIGHT OF EACH RESPONSIBILITY, THEN CIRCLING THE LEVEL OF IMPORTANCE FROM 5 TO 1 FOR EACH ON THE QUESTIONNAIRE.]
Now let's move on to COMMUNITY LIFESTYLE SERVICES... first of all, ‘Parks, Playgrounds and Public
Amenities’ - how important is it for your Council to accept responsibility for that area? Would it be ‘crucial’,
‘important’, ‘nice to have’, ‘not very important’ or ‘quite unimportant’?
[WORK THROUGH ALL ITEMS UNDER ‘Community Lifestyle Services’, READING OUT THE
‘Examples/Clarification’ TO THE RIGHT OF EACH RESPONSIBILITY, THEN CIRCLING THE LEVEL OF IMPORTANCE FROM 5 TO 1 FOR EACH ON THE QUESTIONNAIRE.]

J2402 Noosa Shire Council © 2017, Market Facts (Qld) Pty Ltd Page 106 of 115
Now, moving on to MANAGING THE SHIRE... first of all, ‘Town Planning’ - how important is it for your Council
to accept responsibility for that area? Would it be ‘crucial’, ‘important’, ‘nice to have’, ‘not very important’ or ‘quite
unimportant’?
[WORK THROUGH ALL ITEMS UNDER ‘Managing the Shire’, READING OUT THE ‘Examples/ Clarification’ TO
THE RIGHT OF EACH RESPONSIBILITY, THEN CIRCLING THE LEVEL OF IMPORTANCE FROM 5 TO 1 FOR EACH ON THE QUESTIONNAIRE.] The next aspect of Council Responsibilities relates to its CUSTOMER SERVICES and its COMMUNICATION
with the community... first of all, the responsibility area of ‘Customer Service’ itself - how important is it for your
Council to have accessible & adequate facilities for dealing with and responding to contacts from stakeholders and
the general public, for handling enquiries, requests or complaints? Would it be ‘crucial’, ‘important’, ‘nice to have’,
‘not very important’ or ‘quite unimportant’?
[WORK THROUGH ALL ITEMS UNDER ‘Customer Services and Communication’, READING OUT THE
‘Examples/Clarification’ TO THE RIGHT OF EACH RESPONSIBILITY, THEN CIRCLING THE LEVEL OF IMPORTANCE FROM 5 TO 1 ON THE QUESTIONNAIRE.]
Now when it comes to the QUALITIES OF COUNCIL, you should decide how important it is that the Council has
those qualities or adopts that approach... first of all, the ‘Quality of the Elected Council (as a whole)’ - how important
is it that they provide leadership & direction for the community, be even-handed, responsive, open and honest?
Would it be ‘crucial’, ‘important’, ‘nice to have’, ‘not very important’ or ‘quite unimportant’?
[WORK THROUGH ALL ITEMS UNDER ‘Qualities of Council’, READING OUT THE ‘Examples/Clarification’ TO
THE RIGHT OF EACH RESPONSIBILITY, THEN CIRCLING THE LEVEL OF IMPORTANCE FROM 5 TO 1 FOR EACH ON THE QUESTIONNAIRE.]
Performance Ratings Now we come to the important task of rating your council on its Performance of the responsibilities, which you've
just considered from the point of view of their Importance.
To explain the Rating Points that we've shown in the letter we sent you, please rate the Council on each area of
performance by giving them a ‘very good’ or a ‘good’ or a ‘fair only’ or a ‘poor’ or a ‘very poor’. If you have no
idea of how they are performing in a particular area - either from your own experience or from what you've heard
about them - just say ‘don't know’.
It doesn't matter how important you felt each responsibility was. Now we're thinking about how good a job you think
they're doing in that area.
[NOTE TO INTERVIEWER:
■ START WITH SAME THEME AS YOU USED FOR ‘Importance’ AND THEN ROTATE THROUGH ALL
THEMES IN SEQUENCE. ■ USE SAME PRESENTATION, BUT ADAPT THE FUNCTION NAMES AND DESCRIPTIONS
ACCORDINGLY.]
Now let's start with the BASIC SERVICES AND INFRASTRUCTURE, taking first of all, ‘Road Construction’.
Just looking again at the sheet we sent you headed ‘AREAS OF COUNCIL RESPONSIBILITY’, how good a job
do you think the Council is doing in constructing new roads and streets or upgrading existing ones - say, by sealing
them? Just give them a rating from ‘very good’ to ‘very poor’.
[WORK THROUGH ALL ITEMS UNDER ‘Basic Services and Infrastructure’, ONLY READING OUT THE
‘Examples/Clarification’ FOR EACH IF NECESSARY, GETTING RATINGS AND CIRCLING FROM 5 TO 1 FOR
EACH ON THE QUESTIONNAIRE. FOR A ‘Don't Know’ RATING CIRCLE A ‘nought / zero’.
[THEN DO THE SAME FOR EACH OF THE RESPONSIBILITY AREAS IN EACH ONE OF THE OTHER THEMES.]
OVERALL PERFORMANCE Now we need to make an ‘OVERALL PERFORMANCE’ rating... Just looking at the bottom of the second sheet we
sent you and considering the Council as a whole - both the elected councillors and the employed staff - how would
you rate them for delivering a level of services and displaying a quality of performance in fulfilling all
responsibilities, which you would regard as ‘value for money’ - would you give them a ‘Very Good’, ‘Good’, ‘Fair
only’, ‘Poor’ or ‘Very Poor’ for their Overall Performance? [CIRCLE THE QUESTIONNAIRE FROM 5 TO 1.]

J2402 Noosa Shire Council © 2017, Market Facts (Qld) Pty Ltd Page 107 of 115
DEMOGRAPHICS & SUPPLEMENTARY QUESTIONS [FINALLY, MOVE TO PAGE #16 OF THE QUESTIONNAIRE AND ASK THE REMAINING QUESTIONS DIRECTLY FROM THAT DOCUMENT. CIRCLE / WRITE IN THE RELEVANT ANSWERS.]

J2402 Noosa Shire Council © 2017, Market Facts (Qld) Pty Ltd Page 108 of 115
NOOSA SHIRE COUNCIL COMMUNITY SATISFACTION & ATTITUDES SURVEY J2402 April 2017
CONTACT SHEET - RESPONDENT IDENTIFICATION PAGE
NAME: .....................................................................................................................
NUMBER, STREET: .....................................................................
SUBURB: .....................................................................
POST CODE:.........................................................................................
PHONE NO: .....................................................................
FAX NO: .....................................................................
EMAIL ADDRESS: ………………………………………………….
LOCALITY………………………………………………………….
DATE FIRST CONTACTED: .....................................................................
RE-CONTACT ARRANGEMENTS: .............................................................
DATE INTERVIEWED: .....................................................................
THEME START [circle] 1 2 3 4 5
Field Manager (checked):
(validated):
Data Manager (checked):
(entered):

J2402 Noosa Shire Council © 2017, Market Facts (Qld) Pty Ltd Page 109 of 115
NOOSA SHIRE COUNCIL COMMUNITY SATISFACTION & ATTITUDES SURVEY QUESTIONNAIRE
RATING SHEET- IMPORTANCE OF SERVICES
RANKING
Crucial Important Nice to Have
Un- important
Quite Un- important
Don’t Know
Not App.
1. Basic Services & Infrastructure Road Construction 5 4 3 2 1 9 7
Road Maintenance 5 4 3 2 1 9 7
Footpaths, Kerbing and Guttering 5 4 3 2 1 9 7
Street Lighting 5 4 3 2 1 9 7
Traffic Management 5 4 3 2 1 9 7
Parking Facilities 5 4 3 2 1 9 7
Public Transport 5 4 3 2 1 9 7
Drainage and Flood Mitigation 5 4 3 2 1 9 7
Waste Management 5 4 3 2 1 9 7
Community Health 5 4 3 2 1 9 7
2. Community Lifestyle Services
Parks, Playgrounds and Public Amenities 5 4 3 2 1 9 7
Environmental Controls 5 4 3 2 1 9 7
Environmental Protection and Conservation 5 4 3 2 1 9 7
Heritage Protection 5 4 3 2 1 9 7
Sporting and Recreational Facilities 5 4 3 2 1 9 7
Cultural and Entertainment Facilities 5 4 3 2 1 9 7
Libraries and other Information Access 5 4 3 2 1 9 7
Community Safety 5 4 3 2 1 9 7
Community Service 5 4 3 2 1 9 7
Pet/Animal Control 5 4 3 2 1 9 7
Shopping Facilities 5 4 3 2 1 9 7
Community Development 5 4 3 2 1 9 7

J2402 Noosa Shire Council © 2017, Market Facts (Qld) Pty Ltd Page 110 of 115
RATING SHEET- IMPORTANCE OF SERVICES
RANKING Crucial Important Nice
to Have
Un- important
Quite Un- important
Don’t Know
Not App.
3. Managing the Region
Town Planning 5 4 3 2 1 9 7
Building Control 5 4 3 2 1 9 7
Economic Development/Local Employment 5 4 3 2 1 9 7
Development of Tourism 5 4 3 2 1 9 7
Financial Management 5 4 3 2 1 9 7
Revenue Raising 5 4 3 2 1 9 7
Staff Management 5 4 3 2 1 9 7
Disaster Management 5 4 3 2 1 9 7
4. Customer Services and Communication
Customer Service 5 4 3 2 1 9 7
Information Services 5 4 3 2 1 9 7
Informing the Community 5 4 3 2 1 9 7
Consulting the Community 5 4 3 2 1 9 7
Responding to the Community 5 4 3 2 1 9 7
Providing Leadership & Advocacy 5 4 3 2 1 9 7
5. Qualities of Council
Quality of Elected Council (as a whole) 5 4 3 2 1 9 7
Quality of Councillor(s) Dealt with 5 4 3 2 1 9 7
Managerial and Supervisory Efficiency 5 4 3 2 1 9 7
Quality and Performance of Outdoor Workers 5 4 3 2 1 9 7
Quality and Performance of Indoor Staff 5 4 3 2 1 9 7

J2402 Noosa Shire Council © 2017, Market Facts (Qld) Pty Ltd Page 111 of 115
RATING SHEET - COUNCIL PERFORMANCE
RATING Very Fair Very Don’t Not
1. Basic Services & Infrastructure Good Good Only Poor Poor Know Applic.
Road Construction 5 4 3 2 1 9 7
Road Maintenance 5 4 3 2 1 9 7
Footpaths, Kerbing and Guttering 5 4 3 2 1 9 7
Street Lighting 5 4 3 2 1 9 7
Traffic Management 5 4 3 2 1 9 7
Parking Facilities 5 4 3 2 1 9 7
Public Transport 5 4 3 2 1 9 7
Drainage and Flood Mitigation 5 4 3 2 1 9 7
Waste Management 5 4 3 2 1 9 7
Community Health 5 4 3 2 1 9 7
2. Community Lifestyle Services Parks, Playgrounds and Public Amenities 5 4 3 2 1 9 7
Environmental Controls 5 4 3 2 1 9 7
Environmental Protection and Conservation 5 4 3 2 1 9 7
Heritage Protection 5 4 3 2 1 9 7
Sporting and Recreational Facilities 5 4 3 2 1 9 7
Cultural and Entertainment Facilities 5 4 3 2 1 9 7
Libraries and other Information Access 5 4 3 2 1 9 7
Community Safety 5 4 3 2 1 9 7
Community Service 5 4 3 2 1 9 7
Pet/Animal Control 5 4 3 2 1 9 7
Shopping Facilities 5 4 3 2 1 9 7
Community Development 5 4 3 2 1 9 7

J2402 Noosa Shire Council © 2017, Market Facts (Qld) Pty Ltd Page 112 of 115
RATING SHEET - COUNCIL PERFORMANCE
RATING Very Fair Very Don’t Not
Good Good Only Poor Poor Know Applic.
3. Managing the Shire
Town Planning 5 4 3 2 1 9 7
Building Control 5 4 3 2 1 9 7
Economic Development/Local Employment 5 4 3 2 1 9 7
Development of Tourism 5 4 3 2 1 9 7
Financial Management 5 4 3 2 1 9 7
Revenue Raising 5 4 3 2 1 9 7
Staff Management 5 4 3 2 1 9 7
Disaster Management 5 4 3 2 1 9 7
4. Customer Services and Communication
Customer Service 5 4 3 2 1 9 7
Information Services 5 4 3 2 1 9 7
Informing the Community 5 4 3 2 1 9 7
Consulting the Community 5 4 3 2 1 9 7
Responding to the Community 5 4 3 2 1 9 7
Providing Leadership & Advocacy 5 4 3 2 1 9 7
5. Qualities of Council
Quality of Elected Council (as a whole) 5 4 3 2 1 9 7
Quality of Councillor(s) Dealt with 5 4 3 2 1 9 7
Managerial and Supervisory Efficiency 5 4 3 2 1 9 7
Quality and Performance of Outdoor Workers 5 4 3 2 1 9 7
Quality and Performance of Indoor Staff 5 4 3 2 1 9 7
OVERALL PERFORMANCE RATING 5 4 3 2 1 9 7

J2402 Noosa Shire Council © 2017, Market Facts (Qld) Pty Ltd Page 113 of 115
SUPPLEMENTARY QUESTIONS 1. Do you or your family have a disaster management plan for a flood or a fire?
Yes 1 No 2
2. During a disaster event, how will you access information?
Local newspaper 1 Radio
2 TV
3
Facebook 4
Friends/neighbours 5 Other (Specify) * ____________________
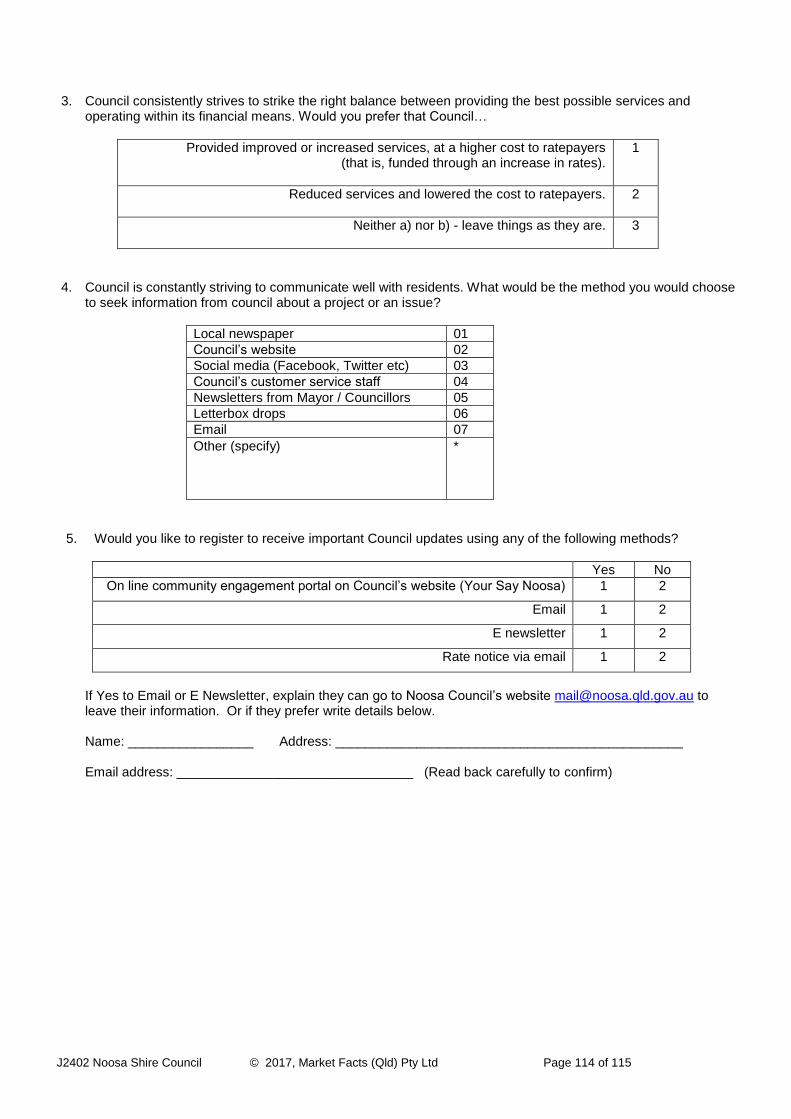
J2402 Noosa Shire Council © 2017, Market Facts (Qld) Pty Ltd Page 114 of 115
3. Council consistently strives to strike the right balance between providing the best possible services and
operating within its financial means. Would you prefer that Council…
Provided improved or increased services, at a higher cost to ratepayers (that is, funded through an increase in rates).
1
Reduced services and lowered the cost to ratepayers.
2
Neither a) nor b) - leave things as they are.
3
4. Council is constantly striving to communicate well with residents. What would be the method you would choose to seek information from council about a project or an issue?
Local newspaper 01
Council’s website 02
Social media (Facebook, Twitter etc) 03
Council’s customer service staff 04
Newsletters from Mayor / Councillors 05
Letterbox drops 06
Email 07
Other (specify) *
5. Would you like to register to receive important Council updates using any of the following methods?
Yes No
On line community engagement portal on Council’s website (Your Say Noosa) 1 2
Email 1 2
E newsletter 1 2
Rate notice via email 1 2
If Yes to Email or E Newsletter, explain they can go to Noosa Council’s website [email protected] to leave their information. Or if they prefer write details below. Name: _________________ Address: _______________________________________________ Email address: ________________________________ (Read back carefully to confirm)

J2402 Noosa Shire Council © 2017, Market Facts (Qld) Pty Ltd Page 115 of 115
And just to double check that we are covering a cross-section of people in our survey ......
a) What is the present occupation of the main income-earner of your household? (PROBE, WRITE ON THE LINE AND THEN CODE BELOW)
………………………………………………………………………………
Manager/Administrator/Professional 1 Para-professional/Trades person 2 Clerical worker/ Sales or Personal Service worker 3 Plant or machine operator/ Driver/ Labourer/ Farm worker 4 Main income-earner not working / No breadwinner 5
b) What is your household situation? Are you... Living alone 1 A single person, sharing accommodation 2 Living as a couple 3 Living as a family (2 parent) 4 Living as a family (1 parent) 5
Thank you very much for assistance.