benchmarking operational maturity for your digital …
TRANSCRIPT
TECH DOSSIER
SPONSORED CONTENT
WHY UNDERSTANDING KEY PERFORMANCE INDICATORS FOR YOUR REAL-TIME OPS MATTERS
BENCHMARKING OPERATIONAL MATURITY FOR YOUR DIGITAL BUSINESS
2BENCHMARKING OPERATIONAL MATURITY FOR YOUR DIGITAL BUSINESS
TABLE OF CONTENTS:Introduction . . . . . . . . . . . . . . . . . . . . . . . . . . . . . . . . . . . . . . . . . . . . . . . . . . . . . . . 2
Understanding a New Model for Maturity . . . . . . . . . . . . . . . . . . . . . . . . . . . . . . . . . . . . . . 3
The Model’s Behavioral Areas of Focus . . . . . . . . . . . . . . . . . . . . . . . . . . . . . . . . . . . . . . . 3
The Model’s Quantitative Metrics . . . . . . . . . . . . . . . . . . . . . . . . . . . . . . . . . . . . . . . . . . 4
Methodology: Grouping Respondents into Maturity Levels . . . . . . . . . . . . . . . . . . . . . . . . . . . . 4
Performance in Key Behavioral Areas . . . . . . . . . . . . . . . . . . . . . . . . . . . . . . . . . . . . . . . . 5
Overall Maturity Results . . . . . . . . . . . . . . . . . . . . . . . . . . . . . . . . . . . . . . . . . . . . . . . . 6
Attributes of the 4 Levels of Real-Time Operations Maturity . . . . . . . . . . . . . . . . . . . . . . . . . . . 7
Quantitative Results: The Benefits of Being Mature . . . . . . . . . . . . . . . . . . . . . . . . . . . . . . . . 8
Best Practices of Mature Organizations . . . . . . . . . . . . . . . . . . . . . . . . . . . . . . . . . . . . . . . 11
Where Organizations Can Improve . . . . . . . . . . . . . . . . . . . . . . . . . . . . . . . . . . . . . . . . . . 11
The Bottom Line . . . . . . . . . . . . . . . . . . . . . . . . . . . . . . . . . . . . . . . . . . . . . . . . . . . . 12
INTRODUCTION For today’s digital organizations, just minutes of downtime can mean thousands or even millions of dollars lost, and customers who go elsewhere . These realities mean IT organizations must maintain and manage infrastructure while rolling out enhancements and upgrades in near real time . It requires today’s IT organizations to move from a traditional IT service management (ITSM) model towards developing more agile and DevOps best practices .
In order to keep up with customer expectations, organizations need the capacity to handle and prioritize real time work at a volume that didn’t exist before today’s always-on society . That’s because this real time work, if not managed well, has a direct, negative impact on an organization’s ability both to make planned operational investments and to innovate . On the flip side, when real time work is managed
well, it gives companies a competitive edge by enabling them to innovate faster, attract and keep talented employees, and make needed investments in scalability and resiliency . But developing this capability is often easier said than done, especially without a solid understanding of how to measure an organization’s real time operations efficiency .
Fortunately, a new model from PagerDuty can help in this regard .
In this report, we will explore the model in depth and explain the importance of finding your organization’s maturity on the spectrum and benchmarking it to that of your peers . With this knowledge, you’ll gain new insights into how your organization can benefit from a more mature approach to managing real-time work .
3BENCHMARKING OPERATIONAL MATURITY FOR YOUR DIGITAL BUSINESS
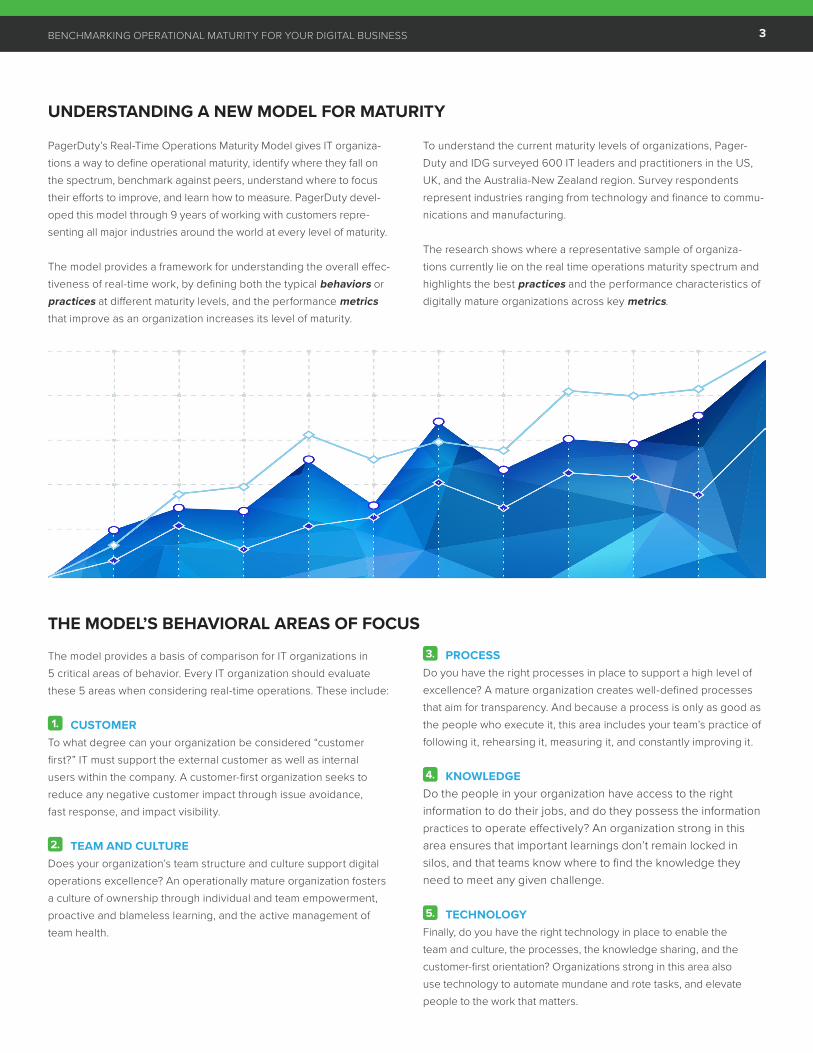
PagerDuty’s Real-Time Operations Maturity Model gives IT organiza-tions a way to define operational maturity, identify where they fall on the spectrum, benchmark against peers, understand where to focus their efforts to improve, and learn how to measure . PagerDuty devel-oped this model through 9 years of working with customers repre-senting all major industries around the world at every level of maturity .
The model provides a framework for understanding the overall effec-tiveness of real-time work, by defining both the typical behaviors or practices at different maturity levels, and the performance metrics that improve as an organization increases its level of maturity .
The model provides a basis of comparison for IT organizations in 5 critical areas of behavior . Every IT organization should evaluate these 5 areas when considering real-time operations . These include:
1. CUSTOMERTo what degree can your organization be considered “customer first?” IT must support the external customer as well as internal users within the company . A customer-first organization seeks to reduce any negative customer impact through issue avoidance, fast response, and impact visibility .
2. TEAM AND CULTUREDoes your organization’s team structure and culture support digital operations excellence? An operationally mature organization fosters a culture of ownership through individual and team empowerment, proactive and blameless learning, and the active management of team health .
3. PROCESSDo you have the right processes in place to support a high level of excellence? A mature organization creates well-defined processes that aim for transparency . And because a process is only as good as the people who execute it, this area includes your team’s practice of following it, rehearsing it, measuring it, and constantly improving it .
4. KNOWLEDGEDo the people in your organization have access to the right information to do their jobs, and do they possess the information practices to operate effectively? An organization strong in this area ensures that important learnings don’t remain locked in silos, and that teams know where to find the knowledge they need to meet any given challenge .
5. TECHNOLOGYFinally, do you have the right technology in place to enable the team and culture, the processes, the knowledge sharing, and the customer-first orientation? Organizations strong in this area also use technology to automate mundane and rote tasks, and elevate people to the work that matters .
UNDERSTANDING A NEW MODEL FOR MATURITY
THE MODEL’S BEHAVIORAL AREAS OF FOCUS
To understand the current maturity levels of organizations, Pager-Duty and IDG surveyed 600 IT leaders and practitioners in the US, UK, and the Australia-New Zealand region . Survey respondents represent industries ranging from technology and finance to commu-nications and manufacturing .
The research shows where a representative sample of organiza-tions currently lie on the real time operations maturity spectrum and highlights the best practices and the performance characteristics of digitally mature organizations across key metrics .

4BENCHMARKING OPERATIONAL MATURITY FOR YOUR DIGITAL BUSINESS
THE MODEL’S QUANTITATIVE METRICSTo evaluate the self-reported standing of organizations in these 5 critical behavioral areas, the survey respondents also answered a series of quantitative questions designed to evaluate their organi-zations’ level of operational maturity according to more objective, quantitative measures . The questions below were designed to reveal metrics in these key areas:
Incident Frequencyn How many customer-impacting major incidents does your
organization respond to per month?n How many non-major customer-facing incidents does your
organization respond to per month?
Incident Response Timesn What is your Mean Time to Acknowledge (MTTA) an incident?n What is your Mean Time to Mobilize (MTTM) to resolve a
major incident?n What is your Mean Time to Resolve (MTTR) for major incidents?
Employee Impact of Incidentsn How often does a typical team member in your organization
get paged after work hours?n What is the average number of responders involved on major
incident resolution?n What is the attrition rate for people on your team that could
be called on to respond to customer-facing issues in real time (annual rate of good employees leaving)?
Technology Effectivenessn What percentage of your alerts auto-resolve before or without a
responder evaluating and fixing the issue, making a notification unnecessary or even unproductive?
n Do you utilize event intelligence to reduce noise by ensuring that only actionable, unique monitoring events become alerts and incidents?
n What percentage of your incidents are resolved with the help of automation such as running a program script or assembling the proper group of responders with the click of a button?
Process Effectivenessn How often do you provide regular updates to stakeholders in
other departments about the progress and status of an ongoing major incident?
n When an incident requires stakeholders to be in the loop, how long after an incident is opened does it take on average to inform stakeholders?
n When you have a major incident, how often do you complete and document a postmortem?
n When postmortems include follow-up tasks, on average, what percentage of these high priority tasks are completed within 3 months?
METHODOLOGY: GROUPING RESPONDENTS INTO MATURITY LEVELS
For all of the questions—both behavioral and quantitative— respondents answered via multiple choice . For the behavioral questions, each multiple choice answer option corresponded with one of the four maturity levels .
We named these 4 levels, with 1 being least mature and 4 being most mature, as follows
Level 1 Reactive
Level 2 Responsive
Level 3 Proactive
Level 4 Preventative
A respondent’s answer to any single behavioral question signifies their organization’s maturity in that area . These results are high-lighted in the section titled “Performance in Key Behavioral Areas” below . However, we also wanted understand how the organizations surveyed behaved overall, and what impact their overall maturity has on their objective operational metrics .
To accomplish this, we bucketed each respondent into one of the four levels of maturity based on their aggregate responses to the behavioral questions . This assignment was done via KMeans clus-tering . In simple terms, KMeans clustering groups items (in this case the respondents) into a predetermined number of clusters (in this case, maturity levels) so that the items in each cluster will be more similar to each other than to those in other clusters . Using this methodology means that a respondent need not score at the highest level of maturity across all behaviors to reach the highest maturity level . Similarly, respondents at the lowest maturity level may score better than the lowest level on individual questions . Typically, however, the majority of answers fall within or close to the model’s maturity levels . These results are shared in the section below titled “Overall Maturity Results .”
After we placed each respondent into a maturity level based on their aggregate behavioral responses, we calculated the average response to each of the quantitative metric questions by maturity grouping . We did this to understand how quantitative operational results were impacted by the respondents’ maturity, namely to answer: “If your practices and behaviors are more mature, what performance benefit to you realize?” These results are highlighted below in “Quantitative Results: The Benefits of Being Mature .”
5BENCHMARKING OPERATIONAL MATURITY FOR YOUR DIGITAL BUSINESS
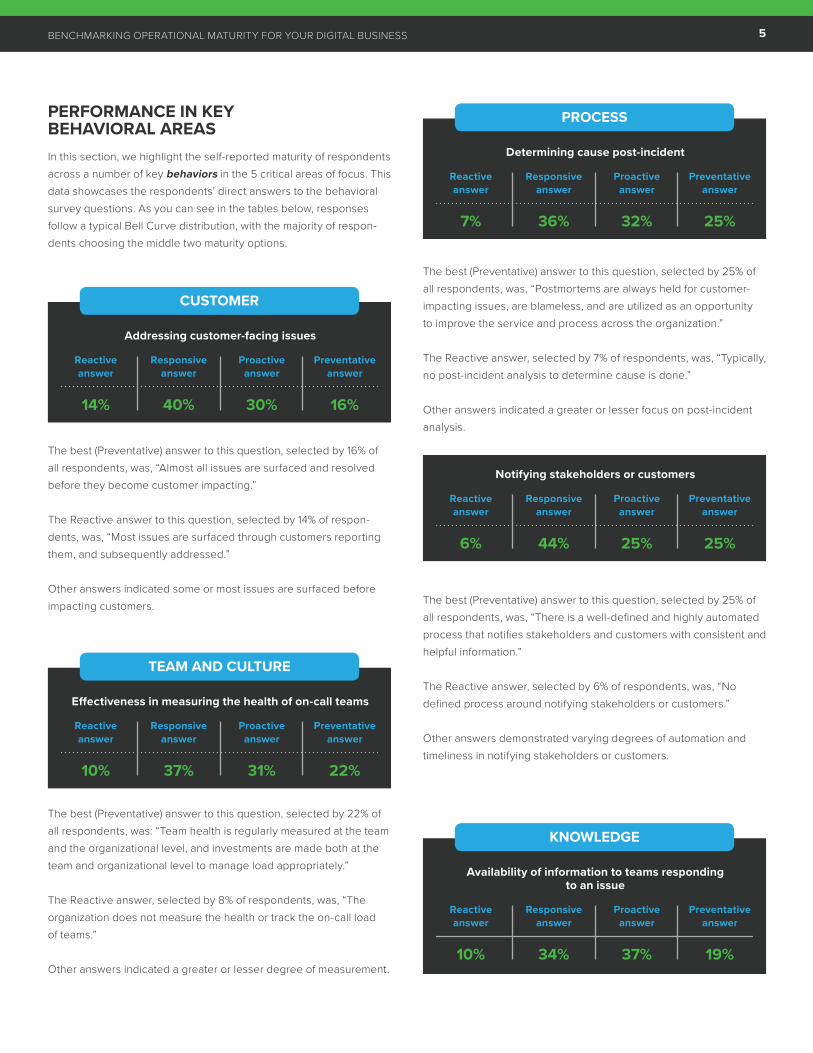
PERFORMANCE IN KEY BEHAVIORAL AREASIn this section, we highlight the self-reported maturity of respondents across a number of key behaviors in the 5 critical areas of focus . This data showcases the respondents’ direct answers to the behavioral survey questions . As you can see in the tables below, responses follow a typical Bell Curve distribution, with the majority of respon-dents choosing the middle two maturity options .
The best (Preventative) answer to this question, selected by 16% of all respondents, was, “Almost all issues are surfaced and resolved before they become customer impacting .”
The Reactive answer to this question, selected by 14% of respon-dents, was, “Most issues are surfaced through customers reporting them, and subsequently addressed .”
Other answers indicated some or most issues are surfaced before impacting customers .
The best (Preventative) answer to this question, selected by 22% of all respondents, was: “Team health is regularly measured at the team and the organizational level, and investments are made both at the team and organizational level to manage load appropriately .”
The Reactive answer, selected by 8% of respondents, was, “The organization does not measure the health or track the on-call load of teams .”
Other answers indicated a greater or lesser degree of measurement .
The best (Preventative) answer to this question, selected by 25% of all respondents, was, “Postmortems are always held for customer- impacting issues, are blameless, and are utilized as an opportunity to improve the service and process across the organization .”
The Reactive answer, selected by 7% of respondents, was, “Typically, no post-incident analysis to determine cause is done .”
Other answers indicated a greater or lesser focus on post-incident analysis .
The best (Preventative) answer to this question, selected by 25% of all respondents, was, “There is a well-defined and highly automated process that notifies stakeholders and customers with consistent and helpful information .”
The Reactive answer, selected by 6% of respondents, was, “No defined process around notifying stakeholders or customers .”
Other answers demonstrated varying degrees of automation and timeliness in notifying stakeholders or customers .
Reactive answer
14%
Responsive answer
40%
Proactive answer
30%
Preventative answer
16%
CUSTOMER
Addressing customer-facing issues
Reactive answer
7%
Responsive answer
36%
Proactive answer
32%
Preventative answer
25%
PROCESS
Determining cause post-incident
Reactive answer
6%
Responsive answer
44%
Proactive answer
25%
Preventative answer
25%
Notifying stakeholders or customers
Reactive answer
10%
Responsive answer
37%
Proactive answer
31%
Preventative answer
22%
TEAM AND CULTURE
Effectiveness in measuring the health of on-call teams
KNOWLEDGE
Availability of information to teams responding to an issue
Reactive answer
10%
Responsive answer
34%
Proactive answer
37%
Preventative answer
19%
6BENCHMARKING OPERATIONAL MATURITY FOR YOUR DIGITAL BUSINESS
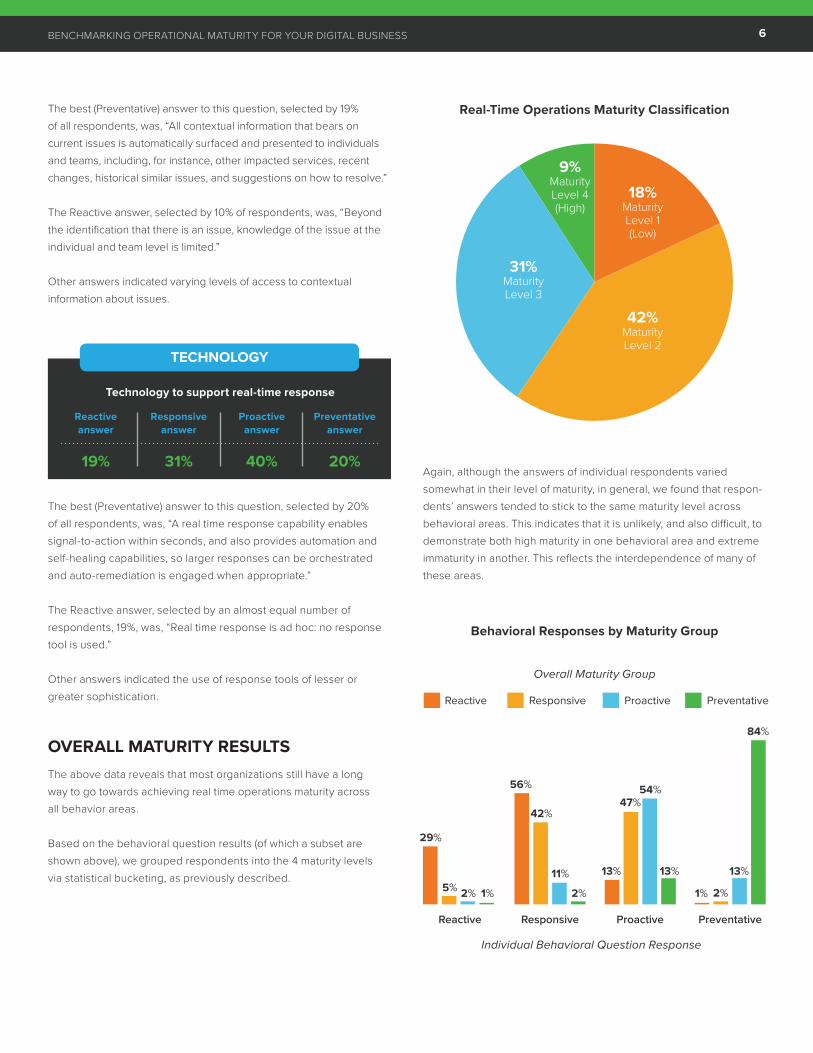
The best (Preventative) answer to this question, selected by 19% of all respondents, was, “All contextual information that bears on current issues is automatically surfaced and presented to individuals and teams, including, for instance, other impacted services, recent changes, historical similar issues, and suggestions on how to resolve .”
The Reactive answer, selected by 10% of respondents, was, “Beyond the identification that there is an issue, knowledge of the issue at the individual and team level is limited .”
Other answers indicated varying levels of access to contextual information about issues .
The best (Preventative) answer to this question, selected by 20% of all respondents, was, “A real time response capability enables signal-to-action within seconds, and also provides automation and self-healing capabilities, so larger responses can be orchestrated and auto-remediation is engaged when appropriate .”
The Reactive answer, selected by an almost equal number of respondents, 19%, was, “Real time response is ad hoc: no response tool is used .”
Other answers indicated the use of response tools of lesser or greater sophistication .
OVERALL MATURITY RESULTSThe above data reveals that most organizations still have a long way to go towards achieving real time operations maturity across all behavior areas .
Based on the behavioral question results (of which a subset are shown above), we grouped respondents into the 4 maturity levels via statistical bucketing, as previously described .
Again, although the answers of individual respondents varied somewhat in their level of maturity, in general, we found that respon-dents’ answers tended to stick to the same maturity level across behavioral areas . This indicates that it is unlikely, and also difficult, to demonstrate both high maturity in one behavioral area and extreme immaturity in another . This reflects the interdependence of many of these areas .
Reactive answer
19%
Responsive answer
31%
Proactive answer
40%
Preventative answer
20%
TECHNOLOGY
Technology to support real-time response
Real-Time Operations Maturity Classification
Behavioral Responses by Maturity Group
Overall Maturity Group
9%Maturity Level 4(High)
18%Maturity Level 1(Low)
42%Maturity Level 2
31%Maturity Level 3
Reactive Responsive Proactive Preventative
29%
56%
42%47%
54%
11% 13% 13%
84%
13%5% 2% 2% 1% 2%1%
Reactive Responsive Proactive Preventative
Individual Behavioral Question Response

7BENCHMARKING OPERATIONAL MATURITY FOR YOUR DIGITAL BUSINESS
ATTRIBUTES OF THE 4 LEVELS OF REAL-TIME OPERATIONS MATURITY
Level 1 Reactive
Reactive organizations find out about most issues through customer tickets . First-line responders often don’t have the skills, knowledge, or authority to resolve or prevent service issues . In addition, the organization has no formal process in place for responding to issues or ensuring monitoring coverage .
In addition, individuals at this organization often have unique siloed knowledge that isn’t available to the entire team . Moreover, they have little or no tooling to aid in managing or facilitating real time work .
This organization has the most room for improvement .
Level 2 Responsive
Responsive companies have practices in place but haven’t mastered using the information they have to improve their outcomes .
This organization surfaces more issues before they impact customers . First-line responders not only have the skills, but also have started acquiring the authority to prevent issues . However, they still lack the information they need to make the best tradeoffs for investing time and resources in resolving incidents .
Responders in this category have begun taking ownership of services and monitoring, tuning their telemetry to reduce unaction-able alerts and ensure coverage . This organization has also begun implementing a process for sharing information so that it doesn’t remain siloed with individuals or teams .
Finally, the Responsive organization has automated more steps in the response process, including auto-detection, notification, and response orchestration—areas to build on for reaching the next level .
Level 3 Proactive
Proactive organizations can uncover more precise details about the impact of an incident, and most issues are surfaced and resolved before customers are aware or affected . These organizations take the information they learn from postmortems and use it to improve services and processes across the organization .
Learnings from past issues are automatically documented and made available, and improvements are quickly implemented .
Proactive organizations have empowered responders with the knowledge and authority to resolve current issues and prevent future service issues . Response processes are well-defined and coordinated and leverage automation to a greater degree .
Level 4 Preventative
The Preventative organization surfaces almost all issues and resolves them before they affect customers .
This organization has fully empowered first-line responders with the knowledge and authority to resolve current issues and prevent future problems . The company also has a regular process for fine-tuning its system monitoring to cover all possible incidents and act quickly and appropriately . As an important enabler of these capabilities, automated tools analyze trends to reduce noise and offer tuning suggestions .
In addition, continuous learning and knowledge sharing help eliminate “pockets” of knowledge that may be out of reach to the larger team .
Key to all these capabilities, the organization has deployed automation throughout the real-time response process for notification, orchestration, communication, context, remediation, and post-resolution learning .
The Preventative organization sits at the highest level of the Real-Time Operations Maturity model . As such, this is the smallest category of organizations and the most difficult level to achieve .

8BENCHMARKING OPERATIONAL MATURITY FOR YOUR DIGITAL BUSINESS
QUANTITATIVE RESULTS: THE BENEFITS OF BEING MATUREIn this section, we compare the quantitative responses of respondents in the different maturity levels to understand how maturity impacts performance across key metrics . We have grouped the quantitative metrics into several related areas below .
1. Incident counts
2. Business and customer impact of incidents
companies . This is likely because more mature companies typically innovate faster than their less mature peers, which means more change and more risk .
Respondents across all maturity levels reported experiencing around 22 total incidents per month .
faster than their immature peers . A higher percentage of mature companies met the ideal target performance across all metrics .
At an average of 7 major incidents per month, this adds up to 14 hours less downtime each month .
Data from the survey shows that regardless of how mature an organization may be, incidents are an unavoidable fact of life for all digital companies . There is very little difference between the number of monthly major and minor incidents between the least and most mature companies . In addition, more of the least mature organiza-tions meet the monthly major incident target than the most mature
Even though immature and mature companies have the same number of incidents, they don’t spend the same amount of time resolving them .
Mature companies acknowledge incidents 7 minutes faster, mobilize responders 11 minutes faster, and resolve incidents a full 2 hours
Metric
Monthly major incidents
Monthly minor incidents
Target
2 or fewer major incidents per month
10 or fewer minor incidents per month
All respondents
7.6 incidents/ month
15.5 incidents/ month
Least mature
6.8 incidents/ month
15.4 incidents/ month
Most mature
8.3 incidents/month
14.6 incidents/ month
Least mature
43%
47%
Most mature
31%
48%
Mean performance of respondents % of respondents meeting target
Metric
MTTA (Mean time to acknowledge)
MTTM (Meantime, to mobilize) for major incidents
MTTR (Mean time to resolve) major incidents
Target
5 minutes or less
15 minutes or less
15 minutes or less
All respondents
20.6 minutes
79.8 minutes
305.7 minutes
Least mature
25.1 minutes
79.6 minutes
404.4 minutes
Most mature
18.6 minutes
68.5 minutes
284.0 minutes
Least mature
9%
12%
11%
Most mature
24%
15%
20%
Mean performance of respondents % of respondents meeting target

9BENCHMARKING OPERATIONAL MATURITY FOR YOUR DIGITAL BUSINESS
3. Manual toil
4. Impact of incidents on the company and employees
n For every 100 alerts, the immature organization creates 59 incidents, 9 of which use automation to reduce responder work . This leaves 50 incidents to be manually managed by responders .
n For every 100 alerts, the mature organization creates 37 inci-dents, 21 of which use automation to reduce responder work . This leaves only 16 incidents to be manually managed by responders .
These practices enable employees to spend more time on innova-tion and less time on repetitive and manual work .
responders likely have a large impact on burnout which can lead to attrition .
On average, even though more mature organizations engage a similar number of people to respond to incidents, they spend less money because they resolve incidents faster . Mature companies also experience savings due to their lower attrition rate .
All organizations could reduce toil by reducing unactionable alerts . However, there is a stark difference between the more mature and the least mature companies when it comes to reducing noise by grouping related alerts and automating resolution where possible .
The data shows that today’s more mature companies create ~40% fewer incidents for every alert, and resolve ~40% more issues with automation versus immature organizations . These small changes compound to make a big difference . To illustrate the impact:
Real time work has a significant impact on the company’s bottom line and its people . Highly mature organizations have a similar (and sometimes worse) performance in relation to after hours incidents and the number of responders involved in an incident . But they also experience a 21% lower employee attrition rate among their on-call responders than the least mature organizations . While this may be a function of many factors, better process and better tooling for on-call
Metric
Share of alerts that are unactionable
Incident to alert ratio
Share of inci-dents resolved with automation
Target
Less than 25% of alerts are unactionable
1 incident : 10 alerts
75%-100% of issues are resolved using some sort of automation
All respondents
26% of alerts
1 incident : 1.7 alerts
34% of issues
Least mature
28% of alerts
1 incident : 1.3 alerts
16% of issues
Most mature
25% of alerts
1 incident : 2.7 alerts
57% of issues
Least mature
48%
0%
0%
Most mature
48%
50%
37%
Metric
After hours page frequency
Mean number of responders on major incidents
Attrition rate of on-call responders
Target
1 day per week or less
4-15, depending on need
0%-10% leave per year
All respondents
2.9 days per week
26.4 responders
22% attrition
Least mature
3.0 days per week
28.2 responders
24% attrition
Most mature
3.2 days per week
31.6 responders
19% attrition
Least mature
24%
60%
11%
Most mature
26%
43%
41%
Mean performance of respondents
Mean performance of respondents
% of respondents meeting target
% of respondents meeting target
10BENCHMARKING OPERATIONAL MATURITY FOR YOUR DIGITAL BUSINESS
REAL-TIME OPERATIONS MATURITY BY TITLE AND REGION
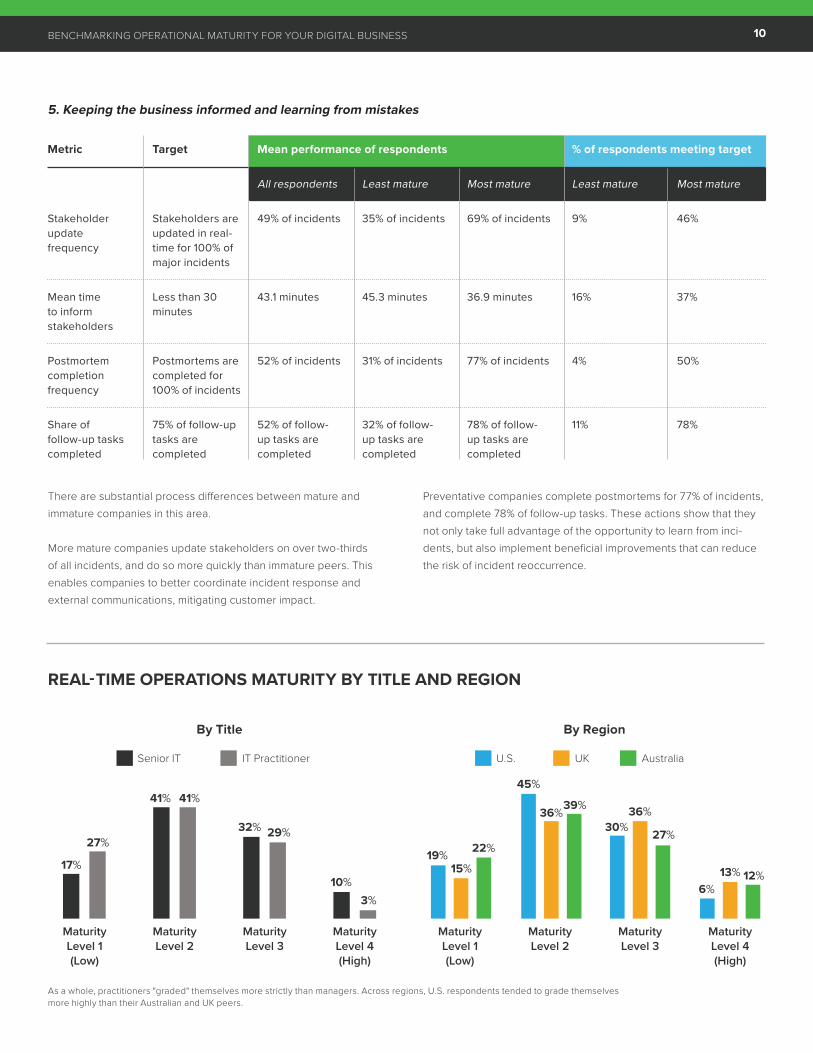
5. Keeping the business informed and learning from mistakes
Preventative companies complete postmortems for 77% of incidents, and complete 78% of follow-up tasks . These actions show that they not only take full advantage of the opportunity to learn from inci-dents, but also implement beneficial improvements that can reduce the risk of incident reoccurrence .
As a whole, practitioners "graded" themselves more strictly than managers . Across regions, U .S . respondents tended to grade themselves more highly than their Australian and UK peers .
There are substantial process differences between mature and immature companies in this area .
More mature companies update stakeholders on over two-thirds of all incidents, and do so more quickly than immature peers . This enables companies to better coordinate incident response and external communications, mitigating customer impact .
Metric
Stakeholder update frequency
Mean time to inform stakeholders
Postmortem completion frequency
Share of follow-up tasks completed
Target
Stakeholders are updated in real-time for 100% of major incidents
Less than 30 minutes
Postmortems are completed for 100% of incidents
75% of follow-up tasks are completed
All respondents
49% of incidents
43.1 minutes
52% of incidents
52% of follow- up tasks are completed
Least mature
35% of incidents
45.3 minutes
31% of incidents
32% of follow- up tasks are completed
Most mature
69% of incidents
36.9 minutes
77% of incidents
78% of follow- up tasks are completed
Least mature
9%
16%
4%
11%
Most mature
46%
37%
50%
78%
Mean performance of respondents % of respondents meeting target
By Title By Region
Maturity Level 1(Low)
Maturity Level 2
Maturity Level 3
Maturity Level 4(High)
Maturity Level 1(Low)
Maturity Level 2
Maturity Level 3
Maturity Level 4(High)
17%
27%
39%36%
45%
19%15%
22%
10%3%
32% 29%
41% 41%
30%36%
27%
6%13% 12%
Senior IT IT Practitioner U .S . UK Australia
11BENCHMARKING OPERATIONAL MATURITY FOR YOUR DIGITAL BUSINESS
6 BEST PRACTICES OF MATURE ORGANIZATIONSIn general, organizations with a high degree of digital operations maturity tend to follow a common set of best practices . Some features of these organizations include:
1 High visibility into incident impact on customersPreventative organizations have tools in place that report the specific customers impacted by incidents .
2 Blameless postmortems for incidentsOpen communications greatly speed the process of finding and addressing the root causes of incidents . Inquiry without blame encourages this kind of communication, which is why “blameless postmortems” qualifies as a defining feature of mature organizations .
3 Teams and individuals are empowered to resolve issuesThe majority (85%) of Preventative organizations maintain this stan-dard . Empowered individuals stay engaged and get results . They also tend to stay with organizations that give them this autonomy .
4 Culture of learning and knowledge sharingThis is a hard mark for most organizations to hit, with just 18% of surveyed organizations reporting strength in this area . However, 81% of Preventative organizations report having such a culture and that it helps prevent siloed individual knowledge .
5 Real-time response process for service issuesThis typically involves a well-defined and coordinated response process for any digital issues (in place for 57% of Preventative versus just 1% of Reactive organizations) .
6 Technology in place to correlate signals and learn from past responseThere’s reason 87% of Preventative organizations report using technology to learn from data on past incidents and responses—whether it’s to generate predictions to catch issues before they impact customers, provide suggestions for remediation, or even to automate fixing current issues . Such technology greatly reduces response time and frees team members up for the important work of meeting the ever-evolving needs of their organization .
WHERE ORGANIZATIONS CAN IMPROVEAs mentioned above, even mature organizations continue to struggle with surfacing and resolving issues before customers feel the pain . This area represents a strong area for improvement at most organizations . In addition, only 15% of all organizations have a mature real time incident response process that coordinates activity across all teams within a company . When it exists, the strategy for coordinated response is typically limited to the areas of operations, develop-ment, and customer support (42%) . However, many issues may benefit from a business response—for example tipping off the sales person at a large customer of potential issues so he or she can proactively reach out .
Many organizations also lack clarity around roles and responsibil-ities . Just 20% report that all members of the response team fully understand their own as well as others' roles and their responsibili-ties during a response . Organizations at a low level of maturity can learn from their more mature peers in their practice of holding blameless postmortems as an opportunity to improve services and processes across their organizations . As mentioned above, only 26% of respondents reported consistently conducting blameless postmortems .
Likewise, while the vast majority of Preventative organizations empower teams and individuals with the knowledge and authority to resolve current issues and prevent future problems, other organi-zations still have room to grow in this area . Only 40% of Proactive organizations do this, and just 24% of organizations overall . But even mature organizations struggle with providing a culture of learning and knowledge sharing that prevents siloed “pockets" of knowledge . Hardly more than a quarter (28%) of Proactive organiza-tions do so, and as mentioned above, just 18% overall can provide this type of environment today .
There’s also room for improvement regarding the management of team health . With the low number of survey respondents reporting that they measure health at the team and organizational level, and at the same time properly manage workloads, employee attrition is an issue . Lower attrition represents a major competitive advan-tage considering the cost of recruiting and training new employees as well as the effect on remaining team members’ workload and morale . Yet, more than one-fifth (21%) of good employees, on average, leave the surveyed organizations annually .
12BENCHMARKING OPERATIONAL MATURITY FOR YOUR DIGITAL BUSINESS
Process-related best practices among more mature organizations include improving communication during service issues, providing response process training (in place at 66% of all organizations), and documenting lessons from major incidents as well as making improvements based on that information . However, only 2% of organizations at the Responsive level of matu-rity have processes in place that automatically surface contextual information for teams and individuals responding to an issue . Addi-tionally, identifying people with specific skills and knowledge to resolve a problem is a manual exercise at most organizations (74%) . Mature organizations have technology in place that supports real time response for digital services issues . Even so, just 21% of respondents report using automation throughout the entire incident lifecycle, for notification, orchestration, communication, context, prediction, remediation and post-resolution learning .
Limitations of this Study As mentioned above, the maturity assessment here is based on self-reported assessments of the respondents’ organizations .
Comparing the behavioral responses to the quantitative responses indicates that many respondents have a more favorable view of their maturity than actual performance based on metrics—which are less subjective—indicate . Therefore, overall maturity across the respondents may be over-stated . Nonetheless, it provides a relative comparison of company maturity levels as well as quantitative impacts of being relatively more mature .
Finally, the benefits of maturity result in less customer downtime and less manual toil, lowering the cost of real time work to the busi-ness, and freeing up your most valuable assets, your employees, to innovate faster .
THE BOTTOM LINENo matter where your organization falls on the Real time Operations Maturity model, measuring key indicators in the 5 critical areas of Customer, Team and Culture, Process, Knowledge, and Technology can put you on the path to success for digital transformation . The model indicates what to measure as you plot your journey .
What’s more, although specific practices are individual to each industry and organization, scoring high on the maturity model shows your organization is heading in the right direction . In addition, it shows that the metrics and measures of your organization will likely improve as you move up the maturity spectrum .
PagerDuty is a platform for real-time operations. It tracks and measures key real-time performance metrics and can help assess your real-time operations maturity. To learn more, contact one of our professionals.
SPONSORED CONTENT
IDG Communications, Inc .