benthic macrofauna and habitat monitoring on the ... · noaa technical report nmfs 86 february 1990...
TRANSCRIPT

NOAA Technical Report NMFS 86 February 1990
Benthic Macrofauna and HabitatMonitoring on the Continental Shelfof the Northeastern United StatesI. Biomass
Frank W. Steimle
U.S. Department of Commerce

NOAA TECHNICAL REPORT NMFS _
The major responsibilities of the National Marine Fisheries Service (NMFS) are to monitor and assess the abundance and geographic distribution of fishery resources, tounderstand and predict fluctuations in the quantity and distribution of these resources, and to establish levels for their optimum use. NMFS is also charged with the developmentand implementation of policies for managing national fishing grounds, development and enforcement of domestic fisheries regulations, surveillance of foreign fishing off UnitedStates coastal waters, and the development and enforcement of international fishery agreements and policies. NMFS also assists the fishing industry through marketing serviceand economic analysis programs, and mortgage insurance and vessel construction subsidies. It collects, analyzes, and publishes statistics on various phases of the industry.
The NOAA Technical Report NMFS series was established in 1983 to replace two subcategories of the Technical Reports series: "Special Scientific Report-Fisheries" and"Circular." The series contains the following types of reports: Scientific investigations that document long-term continuing programs of NMFS; intensive scientific reports onstudies of restricted scope; papers on applied fishery problems; technical reports of general interest intended to aid conservation and management; reports that review in considerable detail and at a high technical level certain broad areas of research; and technical papers originating in economics studies and from management investigations. Sincethis is a formal series, all submitted papers receive peer review and those accepted receive professional editing before publication.
Copies of NOAA Technical Reports NMFS are available free in limited numbers to governmental agencies, both Federal and State. They are also available in exchange forother scientific and technical publications in the marine sciences. Individual copies may be obtained from: U.S. Department of Commerce, National Technical Information Service,5285 Port Royal Road, Springfield, VA 22161. Although the contents have not been copyrighted and may be reprinted entirely, reference to source is appreciated.
48. Widow rockfish: Proceedings of a workshop, Tiburon, California, December11-12, 1980, by William H. Lenarz and Donald R. Gunderson (editors). January 1987,57 p.
49. Reproduction. movement,. and populatIOn dynamics of the southern kingfish,Menticirrhus americanus, in the northwestern Gulf of Mexico, by Stephen M. Hardingand Mark E. Chittenden, Jr. March 1987, 21 p.
50. Preparation of acetate peels of valves from the ocean quahog, Arcrica islandica,
for age determinattons. by John W. Ropes. March 1987,5 p.
51. Status, biology, and ecology of fur seals' Proceedings of an internationalworkshop, Cambridge, England, 23-27 April 1984, by John P. Croxall and RogerL. Gentry (editors). June 1987.212 p.
5:!. Limited access alternatives for the Pacific groundfish fishery, by Daniel D.Huppert (editor). May 1987,45 p.
53. Ecology of east Florida sea tunles: Proceedings of the Cape Canaveral, Florida,sea turtle workshop, Miami, Florida, February 26-27, 1985, by Wayne N. Witzell(convener and editor). May 1987,80 p.
54. Proximate and fatty acid composition of 40 southeastern U.S. finfish species,by Janet A. Gooch, Malcolm B. Hale, Thomas Brown, Jr., James C. Bonnet, CherylG. Brand, and Lloyd W. Reiger. June 1987,23 p.
55. Proximate composition, energy, fatty acid, sodium, and cholesterol content offinfish, shellfish, and their products, by Judith Krzynowek and Jenny Murphy. July1987, 53 p.
56. Some aspects of the ecology of the leatherback tunle Dermochelys coriacea atL.aguna Jolova, Costa Rica, by Harold F. Hirth and Larry H. Ogren. July 1987, 14 p.
57. Food habits and dietary variability of pelagic nekton off Oregon and Washington,1979-1984. by Richard D. Brodeur, Harriet V. Lorz, and William G. Pearcy. July1987, 32 p.
58. Stock assessment of the Gulf menhaden, Brevoorria parronus, fishery, by DouglasS. Vaughan. September 1987, 18 p.
59. Atlantic menhaden, Brevoorria Ivmnnus, purse seine fishery, 1972-84, with abrief discussion of age and size composition of the landings, by Joseph W. Smith,William R. ~icholson, Douglas S. Vaughan, Donnie L. Dudley, and Ethel A. Hall.September 1987, 23 p.
60. Gulf menhaden, BrevoorrlO parronl/s. purse seine fishery, 1974-85, with a briefdiscussion of age and size composition of the landings, by Joseph W. Smith, EldonJ. Levi, Douglas S. Vaughan, and Ethen A. Hall. December 1987, 8 p.
61. Manual for ,tarch gel electrophoresis: A method for the detection of genetic variation, by Paul B. Aebersold, Gary A. Winans, David J. Teel, George B. Milner, andFred M. Utter. December 1987, 19 p.
62. Fishery publication index, 1980-85; Technical memoradum index, 1972-85, byCynthia S. Martin. Shelley E. Arenas, Jacki A. Guffey, and Joni M. Packard.December 1987, 149 p.
63. Stock asse>sment of the Atlantic menhaden, Brevoorria ryrarmus, fishery, byDouglas S. Vaughan and Joseph W. Smith. January 1988, 18 p.
64. illustrated key to penaeoid shrimps of commerce in the Americas, by Isabel PerezFarfante. April 1988, 32 p.
65. History of whaling in and near North Carolina, by Randall R. Reeves and EdwardMitchell. March 1988, 28 p.
66. Atlas and zoogeography of common fishes in the Bering Sea and northeasternPacific, by M. James Allen and Gary B. Smith. April 1988, 151 p.
67. Index numbers and productivity measurement in multispecies fisheries: Anapplication to the Pacific coast trawl fleet, by Dale Squires. July 1988, 34 p.
68. Annotated bibliography II of the hard clam Mereenaria mereenaria, by JL.McHugh and Marjorie W. Sumner. September 1988, 59 p.
69. Environmental quality and aquaculture systems: Proceedings of the thirteenthU.S.-Japan meeting on aquaculture, Mie, Japan, October 24-25, 1984, edited by CarlJ. Sindermann. October 1988, 50 p.
70. New and innovative advances in biology/engineering with potential for use inaquaculture: Proceedings of the fourteenth U.S.-Japan meeting on aquaculture, WoodsHole, Massachusetts, October 16-17, 1985, edited by Albert K. Sparks. November1988, 69 p.
71. Greenland turbot Reinhardrius hippoglossoides of the eastern Bering Sea andAleutian Islands region, by Miles S. Alton, Richard G. Bakkala, Gary E. Walters,and Peter T. Munro. December 1988, 31 p.
72. Age determination methods for northwest Atlantic species, edited by Judy Penttilaand Louise M. Dery. December 1988, 135 p.
73. Marine flora and fauna of the Eastern United States. Mollusca: Cephalopoda.by Michael Vecchione, Clyde F.E. Roper, and Michael J. Sweeney. February 1989,23 p.
74. Proximate composition and fatty acid and cholesterol content of 22 species ofnorthwest Atlantic finfish, by Judith Krzynowek, Jenny Murphy, Richard S. Maney,and Laurie 1. Panunzio. May 1989, 35 p.
75. Codend selection of winter flounder Pseudoplel/rolleeres americanus, by DavidG. Simpson. March 1989, 10 p.
76. Analysis of fish diversion efficiency and survivorship in the fish return systemat San Onofre Nuclear Generating Station, by Milton S. Love, Meenu Sandhu,Jeffrey Stein, Kevin T. Herbinson, Robert H. Moore, Michael Mullin, and John S.Stephens, Jr. April 1989, 16 p.
77. Illustrated key to the genera of free-living marine nematodes of the ordetEnoplida, by Edwin J. Keppner and Armen C. Tarjan. July 1989,26 p.
78. Survey of fishes and water properties of south San Francisco Bay, California,1973-82, by Donald E. Pearson. August 1989, 21 p.
79. Species composition, distribution, and relative abundance of fishes in the COdSta!
habitat off the southeastern United States, by Charles A. Wenner and George RSedberry. July 1989, 49 p.
80. Laboratory guide to early life history stages of northeast Pacific fishes, by AnnC. Matarese, Arthur W. Kendall, Jr., Deborah M. Blood, and Beverly M. Vinter.October 1989, 651 p.

NOAA Technical Report NMFS 86
Benthic Macrofauna and HabitatMonitoring on the Continental Shelfof the Northeastern United States
I. Biomass
Frank W. Steimle
February 1990
~"'~ OF co U.S. DEPARTMENT OF COMMERCEl'"~ Il,f+~ Robert Mosbacher, Secretary
.: 1£ ('\= 1!'l : National Oceanic and Atmospheric Administratione - - iJ John A. Knauss, Under Secretary for Oceans and Atmosphere~ : ~~<l k- ~"'~ National Marine Fisheries Service
.rr~TES Of ~ William W. Fox, Jr., Assistant Administrator for Fisheries

The National Marine Fisheries Service (NMFS) does not approve, recommend
or endorse any proprietary product or proprietary material mentioned in thispublication. No reference shall be made to NMFS, or to this publication furnished
by NMFS, in any advertising or sales promotion which would indicate or imply
that NMFS approves, recommends or endorses any proprietary product or pro
prietary material mentioned herein, or which has as its purpose an intent to causedirectly or indirectly the advertised product to be used or purchased because of
this NMFS publication.
II

CONTENTS
Acknowledgments iv
Introduction 1
Methods 2
Results 3
Chesapeake Bight 4Station 2 4Station 3 4Station 7 5Station 8 6Station 9 7Station 31 7Station 32 8
New York Bight 8Station 11 8Station 12 11Station 13 11Station 17 11Station 33 12Station 16A 12Station 16B 13Station 16C 13Station 15A 13
Southern New England 15Station 18 15Station 34 17Station 36 17Station 19 18Station 20 18Station 37 18
iii
Georges Bank 20Station 22 20Station 23 20Station 24 21
Gulf of Maine 21Station 28 23Station 35 23
Discussion 23
Citations 27

Acknowledgments _
There are many persons who have helped or cooperated in the course ofthis study in one way or another. All my thanks and appreciation to S. andS. Fromm, R. Pikanowski, S. Chang, K. McNulty, D. Radosh, R. Reid,A. Frame, 1. Lindsay, C. Steimle, J. Berrien, J. Rugg, F. Thurberg,R. Terranova, R. Theroux, B. Higgins, and reviewers, and especially toM. Cox for preparing the figures.
IV

Benthic Macrofauna andHabitat Monitoring on theContinental Shelf of theNortheastern United StatesI. Biomass
FRANK W. STEIMLESandy Hook LaboratoryNortheast Fisheries CenterNational Marine Fisheries Service, NOAAHighlands, New Jersey 07732
ABSTRACT
Information on long-term temporal variability of and trends inbenthic community-structure variables, such as biomass, isneeded to estimate the range of normal variability in comparisonwith the effects of environmental change or disturbance. Fisheryresource distribution and population growth will be influencedby such variability. This study examines benthic macrofaunalbiomass and related data collected annually between 1978 and1985 at 27 sites on the continental shelf of the northwesternAtlantic, from North Carolina to the southern Gulf of Maine.The study was expanded at several sites with data from otherstudies collected at the same sites prior to 1978. Results indicatethat although there was interannual and seasonal variability,as expected, biomass levels over the study period showed fewclear trends. Sites exhibiting trends were either in pollutionstressed coastal areas or influenced by the population dynamicsof one or a few species, especially echinoderms.
Introduction _
In the northeastern United States, the basic definition andspatial distribution of benthic communities and dominant taxaare becoming known (Pratt 1973, Wigley and Theroux 1981,Theroux and Grosslein 1987); however, temporal variabilityand trends have received less attention. There have been fewlong-term (>3 years) benthic studies in the northwesternAtlantic and fewer yet that have considered biomass as avariable. Benthic community biomass and production havelong been of interest to fishery ecologists, e.g., Peterson(1918), Blegvad (1928, 1951), and McIntyre (1978), particularly as they relate to the quantity of food available tofishery species and as a primary component in ecosystemmodels. See, for example, Cohen et a1. (1982), Lunz andKendall (1982), and Overholtz and Tyler (1986).
Biomass, as with other benthic community-structure variables, can also be used for environmental monitoring. Forexample, biomass changes have been related to organicenrichment, resulting from eutrophication or waste discharges (Pearson and Rosenberg 1978, Cedarwall andElmgren 1980). Biomass estimates are usually less affectedthan other benthic community-structure variables, e.g.,species richness or numbers of individuals, by sortingefficiency errors. This is because most biomass is fromlarger, more common species (Coleman 1980, Cedarwall andElmgren 1980, Glemarec and Menesguen 1980). Biomassestimates can also be influenced by other factors such as theintermittent occurrence of rare, large individuals of certainspecies. As noted by Coull (1985), long-term data sets maybe necessary, in themselves, to propose credible hypotheses.Wolfe et al. (1987) and Lewin (1986) also noted that longterm studies are less likely to miss infrequent, but important, perturbations in the ecosystem.
This report summarizes and provides a preliminaryanalysis of the range of temporal variability and possibletrends in wet weight biomass for 27 sites, well distributedon the northeastern continental shelf of the United States.These were monitored during 1978-85 as part of NOAA'sNortheast Monitoring Program (Reid et al. 1987). This reportalso includes results from earlier studies at some of the samesites. This long-term data set augments the extensive, earlierspatial distribution studies of the area by Wigley and Theroux(1981), Steimle (1985), and Theroux and Grosslein (1987).Analysis of other community-structure variables (numericalabundance, species composition, and richness) is beingprepared, with a more rigorous statistical analysis of habitatrelationships.

y.
72°
.}/ ... (
mlm-i~~o so 100 tSO 200Kl.OMElERS
42
40°
38°
Figure 1Location of benthic sampling sites on continental shelf, northeastern United States.
Methods _
The benthic samples used in this analysis were collected during quarterly and annual surveys between 1978 and 1985(Reid et al. 1987); sampling locations are shown in Figure1. All samples were collected with a 0.1-m2 SmithMcIntyre grab which provides for a 16-cm maximumhernicylindrical penetration of the sediment. Five grabsamples were collected at each site per survey, except as footnoted in figure captions. Gaps in the data sets were the resultof samples not being collected or processed. Samples collected before December 1979 were sieved through 1.0-mmmesh screens and thereafter through 0.5-mm screens. Aftersieving, samples were fixed immediately in a 10% bufferedformalin-sea water solution and transferred within 3 days toa 70% ethyl or isopropyl alcohol/5% glycerin preservative.After storage for at least 6 months, samples were sorted,specimens identified to species and enumerated, and eachtaxon weighed on a electronic balance to I-mg accuracy,following a 3-minute blot-drying on absorbent paper toweling. No attempt was made to adjust for weight changes(possibly ±15 %) resulting from fixation and preservation(Mills et al. 1982). It is assumed the 6-month delay in processing would make such change relatively consistent.
2
Biomass estimates for the standing stock of benthic organisms based on wet weight are subject to other potential errorsor biases. Many of these problems are due to the variablecontribution to biomass of water and inorganic material (shelland ash), which can vary for each taxonomic group orspecies. Other changes can be caused by the processing ofthe samples, i.e., weight changes caused by the preservation media, as noted before, or losses to evaporation duringthe weighing. Improvements can be made to the estimatesby using ash-free dry weight values or energy equivalentsfor, at the least, dominant species or groups. These conversions can reduce some of the variability in the data becausewater and inorganic components are mostly eliminated andonly the variable of primary importance, that related to thequantity oforganic energy in the benthic sample, is presented.This makes the benthic data readily applicable in developing energy-based models or budgets for use in fisheryecology. Because the benthic samples used in this study wereto be archived, a nondestructive approach was taken, i.e.,use of energy equivalents. The energy equivalency valuesfrom Steimle and Terranova (1985) were used, with 1 Kj= 0.239 Kcal.

The occurrence, in samples, of a few larger organisms canobscure basic information or patterns in overall benthicmonitoring data (Buchanan et al. 1978). To address this, thebiomass of individual organisms weighing more than 1.0 gand occurring in less than 50% of the grab samples in a collection were noted but excluded in the analysis of the data.This also makes the data more relevant to prey-predator considerations since these large, megafaunal organisms are onlyinfrequently used as prey.
To evaluate the possible sources of variability in the data,some factors that can substantially influence results or interpretation are presented: sediment grain size and total organiccarbon (TOC), station location precision, population dynamics ofdominant species, and general environmental or habitatcharacteristics for each site, including common benthicpredators found at each site. The sediment TOC (total organiccarbon) data (mg/g dry weight) were determined for 1978-80samples by chromate oxidation, for 1981-82 samples bycombustion in a furnace, and for 1983 samples by infraredanalysis. The sediment PCB (polychlorinated biphenyl) andPAH (polycyclic aromatic hydrocarbon) data were fromBoehm (1983), the mean sediment trace-metal data from Reidet al. (1987); these data are dry weight values. The hydrography was from Ingham (1982), and sediment topography(i.e., ridge and swale) was based on Swift (1975). Data onpotential benthic predators common at each site were drawnfrom records ofconcurrent trawl collections made at the samesites as the benthic samples; these records contained noteson species collected and relative abundance. Stomach contents were examined from a representative sampling ofdemersal fish species and lobsters in the trawl collections.
During the study, it became readily apparent that biomasslevels or trends at several sites appeared to be highly influenced by the population dynamics of one or a few species,especially echinoderms, a factor noted in other benthic studies(Warwick 1980). To evaluate this factor, the echinodermsat several sites, where they dominated the biomass, weremeasured to provide size-frequency distributions. Thesedistributions can characterize the structure (number ofcohorts and approximate ages) and dynamics (frequency ofrecruitment and approximate growth rates) of populations.In the case of the sand dollar Echinarachnius parma, thisled to a separate study which included production estimates(Steimle 1990).
An analysis of the significance of the change in December1979 of sieve mesh size from 1.0 to 0.5 mm was conductedfor two surveys, January and July 1982, by sieving each grabsample through both screen sizes.
Many of the sites monitored during the 1978-85 periodwere originally selected because there was informationavailable from earlier studies, e.g., at stations 15A (R. Swartzand F. Cole, U.S. EPA, Corvallis, OR 97330), 18 (Steimle1982), 16A and B (Steimle 1985), 28 (Maurer 1982), andthree sites from Wigley and Theroux (1981) and Therouxand Grosslein (1987), that were within a kilometer of stations 8, 22, and 32. The biomass data from these studies havebeen included in the results and any differences in methods
3
or location noted. The biomass data are presented as linegraphs instead of histograms, to enhance the definition ofpossible long-term patterns. It is understood that this makesassumptions about the biomass dynamics of the communitybetween collections, which can be separated by as much asa year. The graphs were interrupted if there were intercollection gaps of more than a year. The results of two studiesthat collected benthic biomass data bimonthly at stations 31and 32 (Howe and Leathem 1984) and near stations 16A-C(Steimle 1990) show that biomass levels at a site can be eitherrelatively stable at the bimonthly sampling intensity, disregarding an odd pulse of added biomass, or highly variable.Because the original sampling design was not plannedspecifically for biomass analysis, and considering thestatistical intractability of benthic data from small samplesizes, detailed statistical analysis was considered unwarrantedor of dubious value. Linear regressions were calculated,however, for the mean biomass-over-time data for stationswith an apparent trend, assuming equal seasonal contributions, and then tested for a significant difference of the slopefrom zero.
Results _
Analysis of the significance of change in screen size from1.0 to 0.5 mm in December 1979 (Table 1) indicates the0.5-rom screen contributed, on average, an additional 4%to total biomass, although this did go as high as 13 %. Thislow contribution is consistent with the results of previousstudies on the importance of screen size to biomass, e.g.,Reish (1959). Thus, differences in screen size are not considered a major factor in evaluating biomass variability.
A comparison of the mean summer-to-winter biomassvalues at each site during 1978-83, when seasonal collections were available, shows a majority (20/27) of the sitesdid have higher mean summer values (Table 2). In general,the mean summer biomass levels averaged about 30% higherthan the winter levels (Table 2). Energy equivalents showedabout the same average summer increase (28 %).
The biomass results for each site (Figs. 2-28) show minorto considerable long-term variability. The results are presented below in regional groups of stations along withavailable and relevant environmental information. Thisapproach is used because each station can be consideredunique, to some degree, due to substantial spatial isolation;thus individual treatment is warranted. The error bars foreach mean biomass value on Figures 2-28 represent onestandard deviation (SD), as indicated on the vertical axislegend. For economy of space, some wide error bars arebroken with the actual SD value given in parentheses at thetop of the bar.

Table 1Significance to total benthic macrofaunal biomass of using O.5-mmsieve mesh compared with using l.o-mm mesh for winter (January)and summer (July) 1982 collections. This is based on biomassretained on the O.5-mm mesh that passed through the l.o-mm mesh,percent of total biomass this represented, and dominant taxa
retained on the O.5-mm sieve.
Winter Summer
Site Biomass Dominant Biomass Dominantno. (g/m2
) % Total taxa (g/m2) % Total taxa
2 0.70 2.36 P,A 2.00 8.20 P.B3 0.46 1.57 P 3.68 7.39 P,B7 3.84 4.71 P 1.86 1.65 P,A8 1.19 3.70 P 0.82 1.39 P9 1.94 3.43 P 1.29 2.13 P11 1.71 1.01 P,A,B 0.86 1.33 P12 2.79 2.58 P,A 1.46 1.99 P,A13 2.26 1.31 A,P 1.40 0.04 P15A 1.44 0.63 P,A 1.90 1.11 AP16A 1.27 2.29 P 2.58 1.68 P16B 0.28 2.90 B 2.04 6.02 P16C 4.91 11.88 P,B 0.88 1.87 P17 0.41 0.10 P 0.62 0.04 P18 8.55 4.10 A,B 10.94 2.14 A,B,P19 2.27 3.64 P,A 1.17 0.37 P,A20 0.74 1.43 P,O 5.44 10.47 022 1.83 9.12 A,P 1.61 4.30 P,A23 1.17 1.52 A,P 3.97 1.03 A24 0.13 5.40 P 0.13 4.29 P,A28 0.70 0.97 P,O33 7.32 6.48 P,A 4.18 7.29 P34 4.25 6.27 B 3.18 2.03 B,P35 3.56 3.84 P 23.22 13.07 P36 3.13 5.11 B 2.84 3.96 B,P37 2.45 6.88 A,P 3.87 12.26 P
x 2.37 3.73 3.41 4.00SD 2.12 2.81 4.77 3.86
P polychaete, A amphipod, 8 bivalve, 0 ophiuroid
Chesapeake Bight
The southernmost area, the Chesapeake Bight, containedseven stations: 2, 3, 7, 8, 9, 31, and 32 (Fig. 1). Data atstations 2,31, and 32 were discontinuous; however, the otherstations had biomass levels that ranged mostly between 20and 120 g/m2, with polychaetes, molluscs, and echinodermsthe dominant groups.
Station 2 This station was located off Virginia Beach, VA(Fig. 1) and actually included two sites. The initial site wasabandoned after a year because of a navigational safetyproblem; the second site (lat. 36°49.8'N, long. 75°50.3'W)was 5 km south of the original. Both sites were about 15 mdeep with medium sand at the initial site and fine to siltyfine sand at the fmal site. Both also had relatively low levelsof trace metals, e.g., <10 ppm dry weight (DW) lead. Thesites were also in the coastal-active hydrographic band thatcan be influenced by the Chesapeake Bay plume and shore-
4
Table 2Comparison of mean benthic biomass (g/m2) for 1978-83 summer
and winter collections at each site, estimated energy values(Kcal/m2
), and mean Kcal:B ratios.
Biomass Energy Kcal:BSiteno. Summer Winter Summer Winter Summer Winter
2 40.5 14.0 27.5 11.7 0.68 0.843 43.3 24.3 34.0 20.0 0.78 0.827 74.7 78.0 57.3 55.7 0.77 0.718 50.0 34.3 33.0 24.7 0.66 0.729 75.7 51.1 60.0 40.0 0.79 0.8611 90.0 183.3 65.7 126.7 0.73 0.6912 63.3 70.3 55.0 58.0 0.87 0.8313 247.7 179.7 184.7 142.7 0.75 0.7915A 91.0 249.3 64.3 168.7 0.71 0.6816A 79.7 46.0 76.3 41.0 0.96 0.8916B 33.0 41.0 34.3 37.3 1.04 0.9116C 52.7 22.7 46.7 20.0 0.89 0.8817 605.7 329.0 399.0 218.3 0.66 0.6618 191.0 167.3 165.0 171.3 0.86 1.0219 252.0 64.0 197.3 62.0 0.78 0.9720 83.0 64.0 59.7 44.3 0.72 0.6922 38.4 21.5 40.6 22.8 1.06 1.0623 62.0 37.8 56.6 35.3 0.91 0.9324 24.6 4.5 20.0 4.3 0.81 0.9428 55.0 45.3 41.0 34.7 0.75 0.7731 21.5 8.0 17.5 7.0 0.81 0.8832 37.0 14.0 27.0 13.0 0.73 0.9333 105.0 122.7 97.7 115.7 0.93 0.9434 142.7 97.7 100.7 73.0 0.71 0.7535 154.7 80.0 137.7 70.7 0.89 0.8836 74.7 79.0 55.0 62.5 0.74 0.7937 44.3 37.0 40.7 36.5 0.92 0.99
x 104.9 80.2 81.3 63.6 0.81 0.84
zone upwellings. The few collections made at the initial site(Fig. 2a) are not reliable in any discussion of trends. Therewas less than an order of magnitude in mean biomass variability at the second site; this appeared to be related toseasonal factors. The species that generally dominated thebiomass were the polychaete Glycera americana, and themolluscs Pandora gouldiana, Tellina agilis, Ensis directus,and Ilynassa trivittata. Trawls made at both sites indicatedthe benthic predators present were weakfish Cynoscionregalis, croaker Micropogon undulatus, young summerflounder Paralichthys dentatus, northern searobin Prionotuscarolinus, windowpane Scophthalmus aquosus, and spottedhake Urophycis regia. Various amphipods, decapods Cancersp., Ovalipes sp., Crangon septemspinosus), and the razorclam Ensis directus, were the benthic prey commonly eaten,although nonbenthic mysid shrimp and small fish were mostimportant to some species.
Station 3 This station was located south of the previousstation, off the Virginia-North Carolina border (lat. 36°34'N,long. 75°48'W, Fig. 1), near a coastal, shoal-retreat massifin 20 m with fine-sand sediments which contained <0.4 ppbPCBs, 12 ppt PAHs, and low levels of trace metals. The

Figure 2Benthic macrofauna! biomass levels atstation 2. (a) Only four grab samplesavailable; (b) residua! biomass wasmostly tunicates; (c) one 9.9-g Pagurussp. excluded; (d) severa! Encope emarginata (12.0 g) excluded; and (e) oneMellita quinquiesperforata (8.4 g) andone Eupleura caudata (1.2 g) excluded•
e
• POLYCHAETES
~ MOLLUSCS
lIlIII CRUSTACEANS
[] ECHINODERMS
o Residual
d
2/82 8/82 12/82 7/83
®a
7/8011/8012/79 7/84 ~
~nr--......t-:-.-"'..-_-..-:.._-.~--'l-.;->-J.1..------....L:-.~-.~-~~-:LI.-~-~ .•..L~----l..---_1]
IX 0 1J21
,...C\l '3E .c, (J) 100...... ,..til +til ......
Cll E ~o Cl
iIi~c: _Cll Q)
~~
,...C\J '3E .c,(J)...... ,..til +til ......
Cll E ~o Cl
iIi~c:Cll Q)~ ~
100
o
• POLYCHAETES
~ MOLLUSCS
lIlIII CRUSTACEANS
[] ECHINODERMS
o Residual
10n9 7/80 11/80 7/81 2/82 8/82 12/82 7/83 7/84
~e· ~EClCl 50~L.---------·_-.l._·_-··_--_-_-_·-'-"·-_·_---'-__---J -J~05~...N.: j :~.-.~~~~.-.~:~.-.~:~.-.~~~~.-.:~.-----~:. ~~.~~:~~.~~: t 'oJ
IX 1J21
Figure 3Benthic macrofauna! biomass levelsat station 3. (a) Only two grabsamples available; (b) one Neveritaduplicata (6.8 g) excluded; and (c)mostly E. parma.
site was also in a coastal-active band, but only marginallyinfluenced by the Chesapeake plume. The mean macrofaunalbiomass levels were relatively stable and ranged from 16.3to 82.2 g/m2 , with seasonal fluctuations apparently responsible for most of the 1978-82 variability (Fig. 3). Biomasswas dominated by the polychaetes Glyeera dibranehiata andSpiophanes bombyx, and the molluscs Ensis direetus and llynassa trivittata. An expansion of the Atlantic jackknife E.direetus population was the source of the 1982-83 biomassincrease. As with the previous station, potentially importantbenthic predators were windowpane, summer flounder, andspotted hake. These predators ate predominately Ovalipescrabs, Crangon shrimp, jackknife clam (Ensis), mysids, orsmall fish.
5
Station 7 This station (lat. 36°47.5'N, long. 75°11.7'W)was on the continental shelf off Virginia (Fig. 1) in 33 mof water. Sediments were medium sand in a ridge and swalearea, with low levels of trace metals. Hydrography of thesite may be influenced by the development of seasonal,coastal fronts. The mean macrofaunal biomass at this siteranged from 19.4 to 114.4 g/m2, without any clear trendsbut with an increase between 1980 and 1982 caused by increases in several groups (Fig. 4). Species making major contributions to the biomass were the polychaetes Nephtys pietaand Spiophanes bombyx, the molluscs Ensis direetus andTellina agiUs, and the sand dollar Eehinaraehnius parma.The influence of seasonal factors was not evident. Potentiallyimportant benthic predators collected here were the northern

200
......C\I 'ciE .o,C/)..........(/) +(/) .......tll -
~ ~ 100iii ~c:tll Q) Q)
:E ~
• POLYCHAETES
Il§ MOLLUSCS
ITIlIl CRUSTACEANS
El ECHINODERMS
o Residual
~ 5' " , ; ~ ,
~~ j ----..---t-------t------:------: Ao Cl A---- .' . . . . --.... E 0 . .
IX
12/79 7/8011/80 7/81 2/82 8/8212/82 7/83 7/84
Figure 4Benthic macrofauna! biomass levels atstation 7. (a) Only four grab samplesavailable and one AsteriDs forbesi (12.2g) excluded•
Figure 5Benthic macrofauna! biomass levels at station 8. (a) Data from a single grab; and (b)residua! biomass mostly the anthozoan Epizoanthus sp.
7/83
• POLYCHAETES
Il§ MOLLUSCS
ITIlIl CRUSTACEANS
[] ECHINODERMS
o Residual
2/82 8/82 12/827/8011/80 7/816/64 12/79 ~
.. ~ 5j r5 .......(!)Cn....~g.g: A A···t.. · ·t A t A.... 1; 0 L __----'.=----_-_-_-_--_-....;.:.~_~_~_-_-_--_-_-__--_-_-_-'_.:.=:._:-:..--.--.;-:.-----.------' 0 I.¢
......N 'ciE .o,C/)..........
(/) + 100(/) .......tll -g ~iii Q)
c: ~tll a;~~
searobin, scup Stenotomus chrysops, black sea bass Centropristis striata, spotted hake, red hake Urophysis chuss, andhorseshoe (Limulus) and calico (Ovalipes) crabs. The rockcrab Cancer irroratus was a common prey of the fish, alongwith various polychaetes and amphipods.
Station 8 This station (lat. 36°40.7'N, long. 74°45.l'W)was on the outer shelf, 80 m in depth, off Virginia (Fig. 1)in a ridge and swale area, with medium sand and low tracemetals. The site was possibly influenced by the shelf-slopewater-mass front and the "cold pool, " as defined by Ingham(1982). Dominant species contributing to the biomass werethe bivalves Astarte spp., the sea star Astropecten americana,
6

Figure 6Benthic macrofaunal biomass levels at station 9. (a) This collection might have beenoff station by 2 km; (b) several Arctica islandica (240.5 g) excluded; (c) several AstaT1e sp.(21.4 g), Buccinium undaJum (49.8 g),Aphrodite hastala (10.0 g), and A. islandica(11.9 g) excluded; (d) one A. islandica (23.0g) and one AstaT1e sp. (10.3 g) excluded; and(e) one AstaT1e castanea (10.1 g) excluded.
• POLYCHAETES
ffil MOLLUSCS
IIlIIJ CRUSTACEANS
[] ECHINODERMS
o Residual
a
200
o7/8011180 7/81 2/82 8/8212/82 7/83 7/84 ~
~15j t;;;'!"",,"Ct""C"t:::cctc'" ~50!IX 0 '-- -=- --...J~
1%
the polychaete Onuphis sp., and the anemone Epizoanthussp. The mean biomass levels were relatively constant overthe study period, ranging from 28.0 to 59.8 g/m2 , withsome suggestion of seasonal fluctuations (Fig. 5). Potentially important predators found at the site were the spotted hake,sea robins, scup, Cancer crabs, and others to a lesser extent.Amphipods Ampelisca agassizi and Unciola sp., polychaetesLumbrineris sp. and Ophelia denticulata, and decapodsCancer and Crangon were the most common prey eaten bythe fish.
Station 9 This station (lat. 38°17.3'N, long. 74°17.7'W)was in a former sewage-sludge disposal area (Fig. 1), usedfrom 1973 to 1980. Sediments were medium sand in a ridgeand swale area where <2.1 ppb PCBs, 26 ppt PARs, andlow levels of trace metals were measured. The site was 50 mdeep and could have been in the region influenced by the"cold pool." Biomass was primarily dominated by the sanddollar Echinarachnius parma and several megafaunal molluscs (Arctica islandica and Astarte spp.) that were excludedfrom the data summarized in Figure 6. Mean biomass levelswere fairly constant, ranging from 48.5 to 70.9 g/m2, withsome seasonal influence evident to 1982. Potentially important predators at the site were the little skate Raja erinacea,windowpane, red hake, Cancer crabs, and other less frequently occurring species. Polychaetes, as well as Cancerand Crangon, were important prey.
Station 31 This station (lat. 38°44.8'N, long. 75°01'W)was just below the mouth of Delaware Bay (Fig. 1), 25 mdeep, and in the coastal-active band influenced by the Bayplume and coastal upwellings. Some summer hypoxia hasbeen reported in the area. It was in a coastal ridge and swalearea and had medium-to-fine sandy sediments with TOClevels more variable than usually found (Fig. 7). There weremoderate trace-metal levels, e.g., 6-17 ppm lead, as well.The species that dominated the biomass were mostly molluscs, including Ensis directus, Nucula annulata, TellinaagiUs, and Ilynassa trivittata, with patches of blue musselMytilus edulis in 1980. Mean biomass levels for this stationwere irregular with an order of magnitude change between1980-81 (7.6-132 g/m2) and 1983-85 (72.9-1535.3 g/m2)
collection periods (Fig. 7). This change was primarilybecause of population dynamics of the small nut clam Nuculaannulata that often contributed over 1 kilogram of biomassper grab sample. The small predatory mudsnail I. trivittatabecame abundant in 1984, possibly in response to this largeforage base and perhaps a reasonable explanation for someof the overall decline in biomass levels ofNucula thereafter.Other, larger, potentially important benthic predators collected at the site included windowpane, silver hake Merluccius bilinearis, spotted hake, horseshoe crabs, and severalless common species. Benthic prey commonly eaten by thefish were Cancer, Crangon, amphipods (e.g., Unciola sp.),and polychaetes such as Pherusa affinis.
7

100
.....C\l ~
E qo,UJ~ ,....en +en~
«l -E .s::.o ~
iii ~ 50c: _«l Q)
~3:
a
b
• POLYCHAETES
~ MOLLUSCS
[]llI] CRUSTACEANS
El ECHINODERMS 2000
o Residual
1000
10/79 3/807/8011/804/81 9/81 2/82 7/8212/82 7/8312/83o 0
7/8411/84 6/85 ~
..... 3: 20,.---L._ ___�._LU...J---,a----~___I...L_.L..L..l..._l'___ __'_____L.__ ___'__ __'_________'__..L____'____,_1 0 ~.0 N~~ WU'O~ ~
I- E 0.1..---....-.:...:....;.,;--==---------------=""-------------.......00IX I~
Figure 7Benthic macrofaunal biomass levels at station 31. (a) 1980-81 data from Howe and Leathem (1984); and (b) one holothurian
Sclerodactyla briarus (51.8 g) excluded. Note change in scale after 1982.
Station 32 This station (lat. 38°31.4'N, long. 74°7.7'W)was farther below the mouth of Delaware Bay than the previous site (Fig. 1) and was shallower, 15 m, but with verysimilar hydrographic characteristics. It was also in a coastalridge and swale zone with coarse-to-medium sands and lowtrace-metal levels. The dominant species of the biomass werethe bivalve molluscs Spisula solidissma and Tellina agilis anda mix of polychaete species. Mean biomass levels were lowbut fairly stable in the early collections (3.9-15.3 g/m2).
This was punctuated by an odd pulse (52.8 g/m2) of E.parma in July 1980 (Fig. 8), possibly reflecting some sampling error. The biomass was more variable (9.3-57.7g/m2) in later collections, but summer increases were clear.Commonly collected benthic predators included the spottedhake, a variety of skates and rays, sea robins, young summerflounder, horseshoe, and other crabs. Decapods, especiallyCancer, Crangon, and Ovalipes, were the most common preyfound in the fish stomachs examined.
New York Bight
The next set of nine stations was in the New York Bight withstations 11, 12, and 13 on the shelf, stations 17 and 15A incoastal waters, and stations 33 and 16A-C in the submerged
8
Hudson Shelf Valley (Fig. 1). On the shelf, the mean biomasslevels usually ranged between 50 and 200 g/m2, highlyvariable at the coastal sites (because of sand dollar populations), and about 100 g/m2 in the Hudson Shelf Valley.
Station 11 This station (lat. 38°44.6'N, long. 74°02.l'W)was midshelf off Delaware (Fig. I) in 50 m of water, withfine-sand sediments and low trace metals, in an area that canbe affected by the "cold pool." During the study period,mean biomass levels of the site were highly affected bypopulation dynamics of Echinarachnius parma (Fig. 9),which will be discussed later. The mollusc biomass was duepartly to the occurrence, in several collections, of Cyclocardia borealis and Astarte spp. Potentially important predatorsoccurring at the site included four-spot flounder Paralichthysoblongus, little skate, yellowtail flounder Limanda ferruginea, windowpane, black sea bass, sea robins, red andspotted hake, Cancer crabs, and a variety of less commonspecies. Common fish prey were Cancer crabs, Crangon,polychaetes, amphipods, e.g., Ampelisca sp., and the rhynchocoel Cerebratulus.

0..1..-.........--"'--
I
~
ba
I
"CQ)N>.'iiictil
ocI
• POLYCHAETES
~ MOLLUSCS
IT!llI CRUSTACEANS
[] ECHINODERMS
o Residual"(\J 3E .Olen'-' ,...II) +II) '-'
tll -E .co .21 50
iii~c: _tll OJ
~ ~
10/79 3/80 7/8012/804/81 9/81 2/82 8/8212/82 7/83 12/83 7/8411/84 6/85 ~
;ge ~E~ 5ol_-=-__---=':.:!!'~':..='~ ' _'_'_'..:..'--==='- ---"15
0:(!)~.'V OJ' l __ ····A ··.A A t _.' ------e -- e------- --'tf-_ ----e---
IX I~
Figure 8Benthic macrofaunal biomass levels at station 32. (a) 1980-81 data from Howe and Leathem (1984); and (b) one
Neverita duplicata (28.4 g) excluded.
400
• POLYCHAETES
~ MOLLUSCS
"300 IT!llI CRUSTACEANS
(\j ~ aE q [] ECHINODERMSOlen o Residual'-' ,...II) +II) '-' 200tll -E .c
Cl C0 'wiii ~c: -(\l OJOJ~ 100
~
o..I..-...----......---f"I-12/79 7/8011/80 7/81 2/82 8/8212/82 7/83 7/84
Figure 9Benthic macrofaunal biomass levels at station 11. (a) This collection might have been otT station by 2 km andincludes only three grab samples; (b) one Cancer sp. (66.0 g) excluded; (c) one Arctica islandica (107.0 g) excluded;
and (d) one Aphrodite hastata (2.1 g) and an unidentified bivalve (4.9 g) excluded.
9

200
.s:::.Cl
'03 1003:-OJ3:
......N 3E .t5l(J)
'" ....en +en '"tllEoiiic:tllOJ~
400
...... ......C\l
Q 300E0, (J)
'" ....en +en '"tll -E .s:::.
Cl0 '03 200iii 3:c: -tllOJ OJ
~ 3:100
• POLYCHAETES
~ MOLLUSCS
[J]]ll CRUSTACEANS
[] ECHINODERMS
o Residual
12/79
a
(218)
1
b
d
Figure 10Benthic macrofaunal biomass levels at station12. (a) One Cancer irroralus (3.2 g) excluded;(b) one Astropecten amculaJa (2.9 g) excluded;(c) one Astarte castanea (12.2 g) excluded, thehigh variance due to many small Cyclocardiaborealis in one sample; and (d) one Arctica islondica (11.5 g) excluded, high variance as above.
• POLYCHAETES
~ MOLLUSCS
[J]]ll CRUSTACEANS
[] ECHINODERMS
o Residual
10/79 7/8011/80 7/81 2/82 8/82 11/82 7/84
Figure 11Benthic macrofaunal biomasslevels at station 13. (a) Onlythree grab samples available;and (b) high variance becauseof several small Arctica islondka and Cyclocardia borealis intwo samples; the meanbiomass of the remaining threesamples was 210 g·m2•
10

Station 12 This station (lat. 38°6.3'N, long. 73°0.7'W)was on the outer shelf off Delaware (Fig. 1) in 70 m, withmedium sands containing low levels of trace metals. It couldalso have been affected by the "cold pool" and the shelfslope water-mass front. Figure 10 shows polychaetes generally important to the overall mean biomass (with no particularspecies dominant), as well as molluscs, mainly Astarte spp.and Cyclocardia. Predators collected here were four-spotflounder, red hake, scup, little skate, sea robins, Cancercrabs, and less common species. The fish ate various polychaetes, including Ninoe sp., along with ampeliscid amphipods and Cancer.
Station 13 This station (lat. 39°20A'N, long. 72°58.9'W)was in an area on the outer shelf (Fig. 1) and was monitoredbecause it lies in the subsurface "Baltimore CanyonTrough", considered to have potential oil or gas reserves.It was 65 m deep with low trace metals, medium sand, inor near the "cold pool" and the shelf-slope water-mass front.Molluscs dominated this site (Fig. 11), again mainly Astarte
spp. and Cyclocardia. Although not an overall major contributor, the amphipod Ampelisca agassizi was conspicuousin the samples. With the exception of the last two collections (the first biased by a high biomass cluster of thedominant bivalves in two grabs), the mean biomass wasrelatively consistent, averaging just under 200 g/m2 . Potentially important predators collected here were basically thesame as at station 12, but also included yellowtail flounderand silver hake. Decapods (Cancer, Crangon, and Dichelopandalus) were important food for the hakes and four-spotflounder, while polychaetes Scalibregma and Lumbrinerisand amphipods Ampelisca and Unciola were important toyellowtail and scup.
Station 17 This station (lat. 39°35.8'N, long. 73°54.2'W)was in the area off New Jersey (Fig. 1) defaunated by anexceptional anoxia event in 1976 (Steimle and Radosh 1979).The depth was 20 m with medium-to-coarse sand and lowtrace metals, in a coastal ridge and swale area, possibly influenced by upwellings and seasonal fronts. The highly
(281)
I(350)
J
1::Cl'iii;:: 200
'"'N ~
E qc,C/)
-;;; + 300en .......tilEoiiic:til Qj~ ;::
400
500
100
• POLYCHAETES
ml MOLLUSCS
[]lj]] CRUSTACEANS
El ECHINODERMSo Residual (330)
I
o12/79 718011/80 7181 2/82 8/8212/82 7183 8/84 6/85 9/85 '"'
'"'00: ......;:::= 5j 5<ll
IX~: 0 __..;;.... ..._ ... --"""'e-_=-_--=-_._...._.·-·-·-·-----------....J~O~·..~~::....~~:.• :"-' .~~·J·~ ..;-··.l:-.":~-L·.:t::.·.:~~::.:.-· ."'......... t .:IJZf
Figure 12Benthic macrofaunal biomass levels at station 17. (a) Seven Spisula solidissima (148.0 g) from one sample excluded; and
(b) only two grab samples analyzed.
11

• POLYCHAETES
lI§ MOLLUSCS
rnm CRUSTACEANS
[] ECHINODERMS
o Residual
200
......C\l ~E qc,f/)
...... ....(fl +(fl ......as -E .r:. aCl0 'Qjiii 3: 100c: - bas Q)Q)
3:~
o3: 12/79 7/80 11/80 7/81 2/82 8/8212/82 7/83 8/84 8/85 9/85 ......
.. Cl 1OJ ~ -------- .---~ .- ~ / .------~ 110~~.00 .g; .. ... «... . . . . ..... . . ..... . . . . . .... v,f-I~ 0 '--_-_.._.._._.._._.._._._._..... z - 0 CJ
1J/1
Figure 13Benthic macrofaunal biomass levels at station 33. (a) Two Pilar morrhuanus (28.3 g) and one Asterias vulgarus (49 g)excluded; (b) two Havelockia scabra (6.4 g) excluded; (c) one Arctica islandica (66.5 g) excluded; and (d) only two grab
samples analyzed.
variable biomass at this site was dominated by Echinarachnius parma (Fig. 12). Major predators were black sea bass,yellowtail, four-spot flounder, windowpane, sea robins, scup,and spotted hake. Benthic prey found in their stomachs included the tentacular crowns of the burrowing anemoneCeriantheopsis americanus, some Crangon, Cancer, a variety of amphipods, polychaetes, and the ribbon wormCerebratulus, but not E. parma.
Station 33 This station (lat. 40 0 01.4'N, long. 73°25.6'W)was in the Hudson Shelf Valley (Fig. 1) that traverses theshelf from the mouth of New York Harbor to the HudsonCanyon on the slope. The site was 62 m deep with silty, finesands possibly reflecting a depositional environment. Boehm(1983) found low levels (6-9 ppb) of PCBs and moderatelevels (about 490 ppt) of PAHs in these sediments. Thispossibly reflects some downvalley transport from the highlycontaminated waste-disposal areas just outside the Harbor(Boehm 1983). This site could be influenced by intrusionsof outer shelf waters. The mean biomass here (Fig. 13) wasdominated by polychaetes, with Nephtys incisa conspicuous;the amphipod Ampelisca agassizi and several molluscs werealso important. The overall biomass levels appear relatively
stable (57.9-142.0 g/m2), although there may have been adecline since 1981 (Fig. 13). A variety of predators werecommonly found, including little skate; four-spot and yellowtail flounders, and winter flounder Pseudopleuronectesamericanus; red and silver hake; scup; windowpane; oceanpout Macrozoarces americanus; Cancer crabs; and Americanlobster Homarus americanus. These predators ate a varietyof benthos, particularly Dichelopandalus by the hakes andfour-spot flounder; the nut clam Nucula sp. by lobsters;and polychaetes Pherusa and Lumbrineris, ampeliscidamphipods, and Ceriantheopsis by winter and yellowtailflounders.
Station 16A This station (lat. 40 0 25'N, long. 73°44'W)was at the northwest edge of a sewage-sludge disposal siteon a shoulder of the upper Hudson Shelf Valley (Fig. 1).The site contained medium sand in about 25 m of water. PCBvalues of about 2.2 ppm have been measured in the sediments, as well as relatively high trace-metal levels, e.g., leadabove 25 ppm. Besides waste disposal, the site can be influenced by the Hudson-Raritan plume and occasional seasonalhypoxia. Mean biomass was relatively low «50 g/m2) andconsisted mostly of polychaetes (Fig. 14), including a mix
12

200.,---------------------------------------,
6/85 9/858/84o
8/73 12/79 7/80 11/80 7/81 2/82 8/82 11/82 7/83 11/83
.....~10C' I I I I I I I I
.!,OJ: ~~~-_.---.0......... • ....----. ' ,~ I~ 0 ,~:.-· ..:":"·~·:·-·-.:t·,. ..~ .. :"~~· ····· ~'>.....
.....C\j ~
E qoW...., ..-l/J +l/J
....,til :E 100E OJ0 '(jjiii ~c: a;til(l)
~::iE a
• POLYCHAETES
~ MOLLUSCS
IllIIl CRUSTACEANS
ffi] ECHINODERMS
o Residual
Figure 14Benthic macrofaunal biomass levels at station 16A. (a) Only four grab samples available; (b) residual biomass was mostly anthozoans
and rhynchocoels; (c) one Pilar morrhuana (4.6 g) excluded; and (d) only two grab samples analyzed.
of common sandy-habitat species, e.g., Nephtys picta,ubiquitous types such as Spiophanes bombyx, and the stresstolerant Capitella capitata. The burrowing anemone Ceriantheopsis americana and the rhynchocoel Cerebratulus wereother major contributors. The aberrant value for August 1982was mostly that of the easily fragmented, large, predatoryrhynchocoel. Other predators found at this site were essentially the same as for station 33 with the major prey consisting of Pherusa, Ceriantheopsis, and Dichelopandalus.
Station 16B This station (lat. 40 0 25'N, long. 73°46'W)was in the Christiaensen Basin of the upper Hudson ShelfValley (Fig. 1). The site was 27 m deep and in silty-fine sandscontaining>150 ppb PCBs, >7000 ppt PAHs, and very highlevels of trace metals, e.g., up to 175 ppm lead. It was alsoin the coastal-active band, influenced by the Hudson-Raritanplume and seasonally recurrent hypoxia. Polychaetes wereagain the dominant taxon (Fig. 15). There appeared to betwo basic community groups which dominated the biomass:a Capitella-Cerebratulus group and a CeriantheopsisNephtys incisa-Nucula proxima group. These two groupscould alternately dominate the biomass in separate grabs ina collection. Potentially important predators were the sameas at stations 16A and 17, and predation on many benthicspecies has been previously reported (Steimle 1985). Therelatively low recent biomass levels here suggest a declining trend since 1973; however, most of the 1973 biomasswas that of the nut clam, Nucula proxima. The sediment TOC
13
levels were irregular, but this seems to have had little effecton biomass levels.
Station 16C This station (lat. 400 25'N, long. 73°52'W)was located north of the New York Harbor dredge-spoildisposal area (Fig. 1). The site contained mixed sands in22 m depths of a coastal ridge and swale area possibly influenced by the distribution of dredge spoils during or afterdisposal. Less than 0.4 ppm PCBs were measured in thesesediments, but trace-metal levels were relatively high, similarto station 16A. The site was also in the coastal-active bandinfluenced by the Hudson-Raritan plume, upwellings, andseasonally recurrent hypoxia. The benthos had relatively low,mean biomass (Fig. 16) but with more diversity, e.g., a mixof polychaetes and the northern dwarf tellin Tellina agilisbeing the major contributors. Overall biomass levels suggest a gradual increase during 1980-82, but a decline since.The peak in biomass in 1980 (Fig. 16) appeared to be relatedto a concurrent peak in sediment TOC, the cause of whichis unknown but could be a manifestation of some samplingerror. Potential predators were similar to those found at theother stations in the area.

200
-.t=Ol'Qj
5: 100
o
(135)
J
b
• POLYCHAETES
IHJ MOLLUSCS
!IIIll CRUSTACEANS
[] ECHINODERMS
o Residual
c
8/73 12/79 7/8011/80 7/81 2/82 9/8212/82 7/8312/83 8/84 6/859/65 .....
~~25C~~---~~--~~~-~-=-=-=-~·-~-~--~-~--~---~-~~10~"""'" ", '" ,........... No ~ ! --------., ", 'A' £ ~", ,'~ ~~":. en~ ~ 0 r----.'-'-''-'-'_..-....-.~-'+...::.:...._'<-._.-..-·------·....:·....:'--------------------'-0 cj
IX IJ21
Figure 15Benthic macrofaunal biomass levels at station 16B. (a) Only four grab samples available; (b) most residual biomass was anthozoans,
rhynchocoels, and phoronids; and (c) only two grab samples analyzed•
100a b
• POLYCHAETES
IHJ MOLLUSCS
!IIIll CRUSTACEANS
[] ECHINODERMS
o Residual
d
8/73 12/79 7/80 11/80 7/81 2/82 8/8212/82 7/83 8/84 6/85 9/85 .....
~~. ~~0l10C:: I ,/'/'\,: : ,~~~~ I I I 1100 (!):~.<~~ , \ .• ~-:-~ '. "'-1t;' ...:~::.:.:~:. .,;' - ·~~t~~--· ..
IX 0 f----''------....s==-==---------------------------1J21
Figure 16Benthic macrofaunal biomass levels at station 16C. (a) Only four grab samples available; (b) one Cancer borealis (91.0 g) excluded;
(c) one Euspira heros (1.3 g) excluded, and only two grab samples analyzed.
14

500 (171)• POLYCHAETES
I ~ MOLLUSCS
[J]]]J CRUSTACEANS400
[] ECHINODERMS
~~ b o ResidualE q
(243»):o,w........... 300C/l +C/l ......
ell -E~ co .-.- Q)
[IJ 3:200c:
ell a;Q)
3::iE
100
o 12/7 5/73 12/73 12/79 7/8011/80 7/81 2/82 8/8212/82 6/859/85 ~
:!:~ 5j 2 ': I I I I I ': !50
:C):UO~ , , >r :PPPPt....t········· ...···········~~~·~ ....~~·~:~·:~~~~· ...I-I~ 0 /I~._....t:!.::-=.:--::-~--=.::-:.:-.:J.~-:.:-.:!-~-:.:-::.--::-:.:-.:.-·!..:.:--:.:-=---::-~·~-=~'-=-__....::..::.I__________ I¢
Figure 17Benthic macrofaunal biomass levels at station ISA. (a) 1972-73 data from R. Swartz and F. Cole (U.S. EPA, CorvaUis, OR 97330) withonly four grabs collected Dec. 1972 and 14 grabs available for Dec. 1973; (b) only four grabs available; (c) one Astarte castanea (11.9 g)
excluded; and (d) only two grab samples analyzed.
Station 15A This station (lat. 40 0 25.6'N, long. 73° 11. 1'W)was located off Fire Island, New York (Fig. 1) with mediumsand sediments containing low trace-metal levels in a coastalridge and swale area and 30 m deep. The site was also inthe coastal-active band, rarely influenced by the HudsonRaritan plume, but possibly subject to coastal upwellings andseasonal fronts. This site, like station 17, was also dominatedby a large population of the sand dollar Echinarachniusparma (Fig. 17). This population appeared to be more persistent than at station 17, being a dominant in 1972-73, witholder cohorts in the population collected in 1979. Meanbiomass levels (Figure 17) generally show late-fall peaks,in contrast to the summer peak seasonal pattern shown bymost other stations in this study. These peaks mostly reflectthe population dynamics (recruitment, growth, and mortality) of E. parma. A variety of predators were collected ~ere,
including windowpane, yellowtail, four-spot, and wmterflounders; little skate; scup; and Cancer crabs. Mysids werean important prey for many of the fish predators, e.g.,yellowtail and windowpane flounders, and scup; however,a variety of polychaetes, (e.g., Lumbrineris), amphipods,(e.g., Ampelisca agassizi and Unciola sp.), and Ceriantheopsis were also very important. Only yellowtail ate E. parmaas a minor diet item.
15
Southern New England
The next group of stations were off southern New Englandand included three sites on the shelf (stations 19, 20, and37) and three in coastal or estuarine areas (stations 18, 34,and 36) (Fig. 1). The deeper shelf sites, stations 20 and 37,had relatively low mean biomass levels «100 g/m2) withhigher levels, to 250 g/m2, at the inshore sites.
Station 18 This station (lat. 41 °13.5'N, long. 71 °5 1.1 'W)was in a 45-m deep bathymetric depression in Block IslandSound (Fig. 1) characterized by silty-very fine sands withmoderately high levels of trace metals (10-20 ppm lead),probably a fine sediment depositional area. The site was influenced by the Long Island Sound plume and was in a coastalmixing front area with strong tidal currents. Several taxa contributed to the biomass here (Fig. 18). Dominant species werethe polychaete Clymenella torquata, the nut clam Nuculaproxima, and the amphipod Ampelisca agassizi. The oceanquahog Arctica islandica was also relatively common, butwas generally excluded from the analysis because of its largesize. Although there was some intercollection variability,overall biomass levels here were relatively stable to 1982(150-220 g/m2), with sampling error probably being the

f
• POLYCHAETES
~ MOLLUSCS
[Jll]] CRUSTACEANS
EJ ECHINODERMS
o Residuale
br--_--J c
400
......~C\I
E Q 300oW..........en +en ......ttl -200E .s::
Cl0 '0>iii ~ ac -ttl Q) 100Q)~~
O..L.-......-.....,,/-
:!:~ 1 0 1,2_
/
J..;_6_9_IL,7-1;/f_
1
:LI1__~-: 7__--JI:L:-__~...J.1/_8-0--7_IL8-1--_----2.J../8
__2 -_-:-~L8-_2_~-:L/_8-2-------7--J/--,841010 ~(!).W~....
c.> CJ> .-- ----1- -- .. ,'£'"g E £ £ £ £.. .£
IX 0I¢
Figure 18Benthic macrofaunal biomass levels at station 18. (a) Based on three grab samples (Steimle 1982); (b) one Mercenariilmercenariil (210.0 g) excluded; (c) one Arctica islandica (440.0 g) excluded; (d) one A. islandica (53.6 g) excluded; (e)one A. islandica (186.1 g) excluded; and (f) one each Aphrodite hastaJa (3.3 g), A. islandica (357.1 g), and Caudina arenaJa
(4.6 g) excluded•
12/79 7/8011/80 7181 2/82 8/8212/82 7/83 7/84 6/85 ~
~~ 20
1~ ' _ £ £ t t I i10:(;~
o Cl .---------.- --------. ------. ----- ---
I- EIX 0 l- 0 I¢
300.....
C'J c;E .oW..........en +en ......ttl -E .s:: 200o Cliii '0>c ~ttl Q) Q)
~ ~
100
o
• POLYCHAETES
~ MOLLUSCS
[Jll]] CRUSTACEANS
EJ ECHINODERMS
o Residual
a
cd
a
Figure 19Benthic macrofatmal biomass levels at station 34. (a) Residual biomass was mostly ceriantharian anemones; (b) one Mercenariilmercenariil (17.6 g) excluded; (c) one Havelockia scabra (2.2 g) and Caudina arenata (3.0 g) excluded; and (d) only three
grab samples analyzed.
16

• POLYCHAETES
fIll MOLLUSCS
mm CRUSTACEANS
OJ ECHINODERMS
o Residual
(31»):
a
c
7/8011/80 7/81 2/82 8/8212/82 7/83 7/84 6/85 ~
~ n,..--1:,--~-~.---.!.:,--~-~~-.--.~--.:...J.~_~~_._._~_-.~_.:.L...I~-._.-~_-.~---'.i'-.--.~-~:'-'__.1...- ----'-- -----1.----,[ ~
IX 0 1Jl5
Figure 20Benthic macrofauna! biomass levels at station 36. (a) Residual biomass mostly ceriantharian anemones;(b) one Busycon canaliculatum (16.5 g) and one Mercenaria mercenaria (57.2 g) excluded; and
(c) an unusually large collection of Leptocheirus pinguis.
cause of the November 1980 aberrant collection (it was extremely difficult to maintain the position of the researchvessel in the strong tidal flows). The potentially importantpredators were the same inshore group found as far southas station 17, i.e., little skate, windowpane, winter flounder,and red and spotted hake, among others. Several amphipods,Ampelisca sp., Leptocheirus pinguis, and Unciola sp., weremajor prey for most fish species here, but the polychaetesNephtys incisa and Pherusa, Cancer crabs, and Crangonwere also important.
Station 34 This 32-m station (lat. 41 °24'N, long. 71 °25'W)was at the mouth of Narragansett Bay (Fig. 1) in silty mudswith moderate levels of trace metals, similar to the laststation. The site was in a coastal-active area influenced bythe Bay plume and upwellings. The biomass here wasdominated by polychaetes (mainly Nephtys incisa early onand Clymenella torquata later) and molluscs (mainly Nuculaproxima). It was relatively stable until 1982 when an overall
17
increase was evident involving the same species. Seasonalfluctuations appeared to be a major source of variability untilseasonal collections ceased in 1983 (Fig. 19). Among thetypical group of inshore predators, defined previously andfound here, there was a more abundant lobster population.A wide variety of prey were found in the fish stomachs examined here, which included several common polychaetes:Pherusa, N. incisa, and Lumhrineris; ampeliscid amphipods,Cancer, Crangon, Ceriantheopsis, and a few small bivalves,e.g., Nucula.
Station 36 This station (lat. 41 °29'N, long. 70 0 53'W), inlower Buzzards Bay (Fig. 1), was 23 m deep and in siltymud with up to 540 ppb PCBs and 560 ppt PAHs, probablyfrom nearby New Bedford Harbor. The mean biomass levelsranged from 61.2 to 173.8 g/m2 (Fig. 20) with thepolychaete Nephtys incisa, the nut clam Nucula proxima, andthe anemone Ceriantheopsis americanus being the dominantspecies. The increase in 1985 was due to large contributions

400..--------------- ---,
......C\l ~E q 300o,rn.........II) +II) ......
Cll 1: 200E Cl~ '(jj
c: 3:~ ~ '100
o
b
• POLYCHAETES
IHl MOLLUSCS
[[[Ill CRUSTACEANS
D ECHINODERMS
o Residual
e
f
9/78 12/79 7/8011/80 7/81 2/82 8/8212/82 7/84 ~
~g. ~E~ 101
~~.---.-------.--- __ 1'. I !'00~. l;-.- - .:.:•..:~~..~~ -. ~~~~ ~_1.... . '-'
IX 0 -----------IJZJ
Figure 21Benthic macrofauna! biolllUllevels at station 19. (a) Only three grabs sampled; (b) one Arctica islandica (300.0 g) excluded;(c) several Astarte sp. (180.0 g) excluded; (d) two A. islandica (520.7 g) excluded; (e) one A. islandica 038.0 g) excluded;
and (f) two A. islandica 057.7 g) excluded.
by the amphipod Leptocheirus pinguis and the bamboo wormAsychis elongata. Spider crabs Libinia emarginata, alongwith scup, winter flounder, and black seabass, were the common predators. Commonly consumed prey were similar tothe last two inshore stations (18 and 34).
Station 19 This station (lat. 40 0 41.4'N, long. 71°21'W)was on the shelf off Rhode Island (Fig. 1) in 62 m of waterwith medium-to-fine sand sediments and low trace-metallevels, probably in the "cold pool." The overall biomasslevels (Fig. 21) were relatively consistent and ranged from33.1 to 185.6 g/m2 • Seasonal fluctuations appeared to be amajor source of variability. The species which dominatedthis biomass were small ocean quahogs Arctica islandica(larger individuals were collected but excluded) and the amphipod Ampelisca agassizi. Predators collected includedyellowtail flounder, silver and red hakes, among other lesscommon species. A. agassizi was an important diet item formost predators, as well as the commonly co-occurring amphipod species Leptocheirus and Unciola, the ubiquitous Cancerand Crangon, and glycerid and lumbrinerid polychaetes.
Station 20 This station (lat. 40 0 15.2'N, long. 70 0 49.l'W)was on the outer shelf south of Rhode Island (Fig. 1) at adepth of 120 m in sandy silt with moderate levels of tracemetals, at the edge of the depositional "Mud Patch" to theeast. It may be influenced by the "cold pool" and the shelfslope water mass front. Biomass levels, which rangedbetween 50 and 100 g/m2 , suggest no obvious trends. Thebrittlestar Amphioplus abdita was the dominant species andthe source of most of the intercollection variability, with the
18
bivalve Lucinoma sp. also occasionally being important (Fig.22). Potential predators included silver, red, and white hake;four-spot flounder; and Cancer crabs, among others. Onlya few fish stomachs were examined, and they suggest variouspolychaetes and Crangon may be significant prey.
Station 37 This station (lat. 40 0 29.7'N, long. 70 0 12.2'W)was also midshelf, south of Nantucket Shoals in an area calledthe "Mud Patch" (Fig. 1), an extensive silty area, 60 m deep,with sandy silt sediments that contained up to 8 ppb PCBsand 150 ppt PAHs. It could have been affected by the "coldpool" and the shelf-slope water mass front. Benthic collections suggested fairly low but stable levels, between 35.4and 51.5 g/m2 (Fig. 23). Polychaetes were the dominanttaxa, especially Ninoe nigripes, along with the amphipodAmpelisca agassizi. The ocean pout Macrozoarces americanus led the list of potential predators, which also includedred and silver hakes; Cancer crabs; and the four-spot andyellowtail flounders and witch flounder Glyptocephaluscynoglossus. Polychaetes, especially Pherusa, Nephtys sp.,Glycera sp., and Lumbrineris, were important in the dietsof many of the fish species common here, but A. agassizi,Cancer, Crangon, and Dichelopandalus were also commonlyconsumed.

100
..... ...,NE qC,rn
....... ....Ul +Ul .......eu -E .s::.
Cl0 '(jjiii ~c 50eu -Q)Q)~~
(54.8>1 • POLYCHAETES
~ MOLLUSCS
!IIlIl CRUSTACEANS
EJ ECHINODERMS
o Residual
12/79 7/8011/80 7/81 2/82 8/8212/82 7/84 7/83 ~
~ 201' I I , , , , 110 .......i:n~=... Cl 1--------.---.------- •------. .•.•
....... Cl . . • . . . . •• ••• . • ••. . . . -----1.. ,.•0....... . _ ........•......
g ~ L 0 e"IX 0
1JZ1
Figure 22Benthic macrofaunal biomass levels at station 20. (a) This collection might have been off station by 2 km;
and (b) one Cancer sp. (13.0 g) excluded.
100....---------------------------.,
..... ...,NE qC,rn
....... ....Ul +Ul .......eu - 50E .s::.
Cl0 '(jjiii ~c: -euQ)
Q)
~ ~
o
"0• POLYCHAETES
~ MOLLUSCS
'" !IIlIl CRUSTACEANS.cc0 OJ ECHINODERMS-'" o Residual!II
0
C0
a 0
'"=00
!II
~
I"0
'"!II:0
"0z
7/8011/80 7/81 2/828/8212/82 7/83 7/84 6/85 ~
.. ~201' I I I! I 1100~:~....N•....... Cl -1- .0....... ......... . '-'~-.~:.',"" .... .-- ----
o ~ . ------.-~IX 0 L..- _
1JZ1
Figure 23Benthic macrofaunal biomass levels at station 37. (a) Residual biomass mostly rhynchocoels and cerianthariananemones; (b) one holothurian Molpadia oolitica (20.0 g) excluded; (c) another M. oolitica (15.8 g) excluded;
and (d) one Caudina arenata (16.9 g) excluded.
19

• POLYCHAETES
~ MOLLUSCS
!llIII CRUSTACEANS
EJ ECHINODERMS
o Residual
c
Station Location "b"Station Location "a"
100.----------~------------------___,
1><
0.L~l;JJ~~~ii7i/ij7i9i9/-7-9J--7/80 11/80 7181 2/82 8/8212/82 7184 ~7/63 1-4...J/7_8_9....J/L78 ~----'- ....JL_-'-__~__-'-_---'-_~ "'-, 10 '-'
=gl-e ~~ 5
0
[1 :' I 'e---e" e---e 10 1J15<.!JCn~.:::;:' :-:- ~'.:. ;.:.-<..........-- .------e
,.....C\I ~
E qc,C/)'-' ,....III +gJ ::: 50E ~ ao Cl
iii ~c«l (1) (1)
~ ~
Figure 24Benthic macrofaunal biomass levels at station 22. (a) One grab sample only; (b) only three grab samples available for 1978-79 collections,
except Sept. 1978; and (c) one Cancer irroratus (8.4 g) excluded.
Georges Bank
The next three stations (22, 23, and 24) were on GeorgesBank (Fig. 1) and had relatively low «50 g/m2) meanbiomass levels. The only exception occurred at station 23because of sand dollar E. parma population dynamics.
Station 22 This station on southern Georges Bank (Fig. 1),was moved in 1980 from lat. 40 0 21.5'N, long. 68°29'W(station 22a), to lat. 40 0 30'N, long. 68°0<)'W (station 22b).Both sites were 110 m deep with medium sand at the initialsite and very fine sand, with near undetectable PCB and PAHlevels, at the second site. The shelf-slope front and "coldpool" could have affected both sites. Biomass levels at bothsites were about equal, 16 to 49 g/m2 , with the second siteshowing seasonal variability (Fig. 24). The dominant specieswere the tube-dwelling amphipod Ampelisca agassizi and thepolychaete Ninoe gayheadi. The predator guild was similarto that found at the last two sites, with at least the ubiquitousCancer and Pagurus commonly eaten.
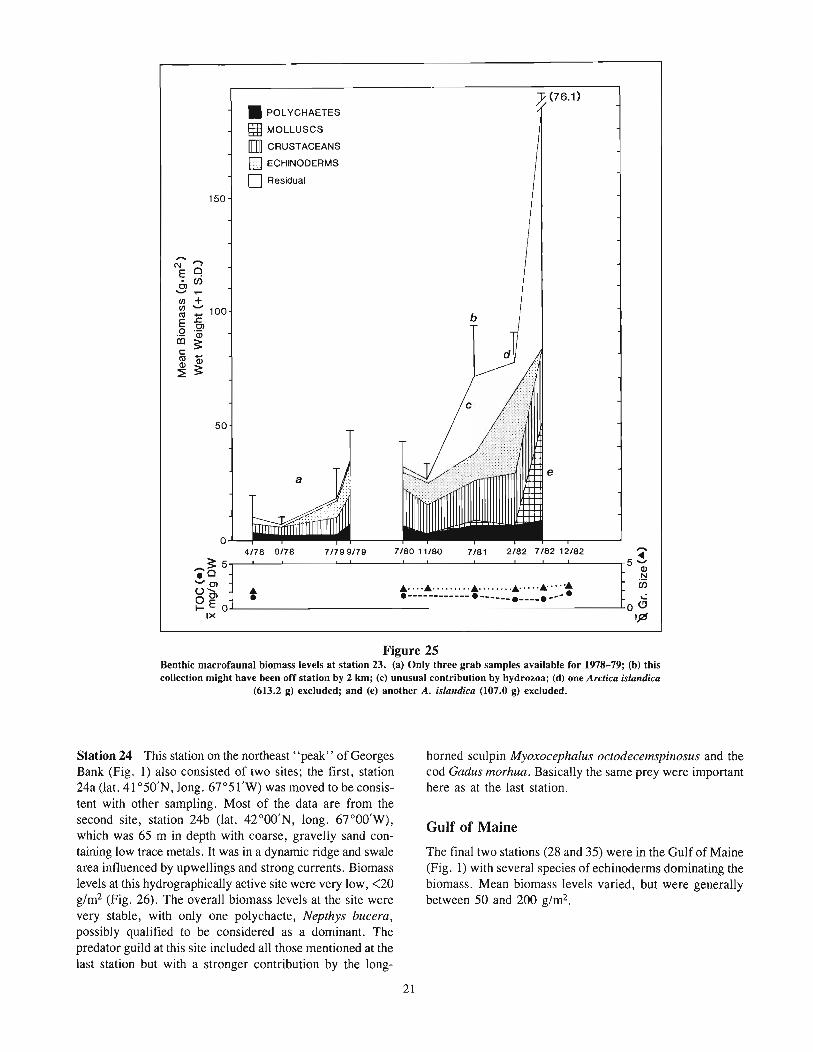
Station 23 This central Georges Bank (Fig. 1) station waslocated (1at. 40 0 58'N, long. 67°33'W) in 70 m with mediumto-fine sand and low trace metals, in a ridge and swale area.Ridges were typically 5-15 m in amplitude and 150-175 mapart. The site could have been in the central Bank mixingarea with strong tidal currents. Biomass levels here wereunusual in that they showed a notable increasing trend after1980, from <40 to >70 g/m2 (Fig. 25). The increased levelsin July 1981 were partly the result of a large quantity ofepifaunal hydrozoans being collected; however, some of theincrease can be attributed to the amphipod Byblis serrata andthe sand doil?lr Echinarachnius parma, with the razor clamSiliqua squama adding to levels in July 1982. Yellowtailflounder was a common predator collected at the site, alongwith little skate, red and silver hake, ocean pout, haddockMelanogrammus aeglefinus, winter flounder, and others. Themost common prey found in the stomachs examined were,again, the Ampelisca-Leptocheirus-Unciola group of amphipods, the Nephtys incisa-Pherusa polychaete group, and thedecapod group, Cancer-Crangon-Pagurus-Dichelopandalus.Winter flounder was the only species to use the hydroids asfood, possibly ingesting them secondarily while feeding onother species hiding within the colonies.
20
• POLYCHAETES
~ MOLLUSCS
lIIIll CRUSTACEANS
El ECHINODERMS
o Residual
~ (76.1)
150
2/82 7/82 12/82
b
7/81718011/80, ,
7/799/790
4/78 9/78
~rj ...•f-E OIX
,...C\I ~
E qc,C/).........l/l +l/l ::: 100III .r:;E 01
~ '0>c: ;:III 03~ ;:
50
Figure 25Benthic macrofaunal biomass levels at station 23. (a) Only three grab samples available for 1978-79; (b) thiscollection might have been off station by 2 km; (c) unusual contribution by hydrozoa; (d) one Arctica islandica
(613.2 g) excluded; and (e) another A. islandica (107.0 g) excluded.
Station 24 This station on the northeast "peak" of GeorgesBank (Fig. 1) also consisted of two sites; the first, station24a (lat. 41 °50'N, long. 67°51'W) was moved to be consistent with other sampling. Most of the data are from thesecond site, station 24b (lat. 42°00'N, long. 67°00'W),which was 65 m in depth with coarse, gravelly sand containing low trace metals. It was in a dynamic ridge and swalearea influenced by upwellings and strong currents. Biomasslevels at this hydrographically active site were very low, <20g/m2 (Fig. 26). The overall biomass levels at the site werevery stable, with only one polychaete, Nepthys bucera,possibly qualified to be considered as a dominant. Thepredator guild at this site included all those mentioned at thelast station but with a stronger contribution by the long-
horned sculpin Myoxocephalus octodecemspinosus and thecod Gadus morhua. Basically the same prey were importanthere as at the last station.
Gulf of Maine
The final two stations (28 and 35) were in the Gulf of Maine(Fig. 1) with several species of echinoderms dominating thebiomass. Mean biomass levels varied, but were generallybetween 50 and 200 g/m2•
21

Figure 26Benthic macrofauna! biomass levels at station 24. (a)Only two grab samples available Apr. 1978-Sept. 1979;and (b) mean biomass of thiscollection was 5.8 g' m2 ifthe unusual sample of Echinarachnius parma wereexcluded.
• POLYCHAETES
~ MOLLUSCS
lIIlIl CRUSTACEANS
[] ECHINODERMS
D Residual
Station 24b
b
(11 B)Station 24a
9/79,1,2/79 7/8011/80 7181 2/82 7/8212/82 7/83 ~
'----=
=-----__"-=-"=:=..::.'='==:~_'~'~_!50 ......Cl~.4... . .4. ~... _.-- M"__ --_. -- -
IfZJ
100
04/78 9/78
~rj .4.I-EO •
IX
.......~C\l
E Q0lC/)...... ....en +en ......ro -E ..c
OJ0 'miii 5:c - 50ro (1)(1)
5:~
Figure 27Benthic macrofaunal biomasslevels at station 28. (a) Datafrom a single grab sample (D.
Maurer 1982) at the same location; (b) one Arctica islandica(10.7 g) excluded; and (c) oneAstarte borealis (12.0 g) excluded.
(31.6)• POLYCHAETES
~ MOLLUSCS
lIIlIl CRUSTACEANS
100 [] ECHINODERMS
o Residual
O............V.,L
....... 05: 20[1/77,~~~2J...~7_9 1_1J...~8_0 7..L~_8_1__2.J.~8_2 1_2J...~8_2__7/L8_3 7...L~84110 ~• • (1)
~,! 0 __._-_-_-_-_-_--_-_-_-_--_-_._-_-_.. -_._:-_.-._1_~_.-._":-_.•_-_...._~_.._~_~:._.-_..; JIfZJ
.......~C\l
E Q0lC/)...... ....en +en ......ro -E ..c
OJ0 'miii 5: 50c -ro (1)(1)
5:~
22

300
,...C\J ciE .OlC/)'-' ,....
C/) +c/)'-'E1: 200o Ol[is ~Ct1l Q)~ ~
100
o
• POLYCHAETES
ffil MOLLUSCS
lllIll CRUSTACEANS
[J ECHINODERMS
o Residual
12/79 7/80 11/80 7/81 2/82 8/82 12/82 7/84 6/85,...
~ge I~EOl: 200IL'..J..~~..~.~..~.~..~.M~:~'.~~:~~~~~~:~~~_._~_..._._.~_~_...._.~.'~''''~~~~~~~~~~~~~~~:~~~~~~~~:~I 0
10
~:Q)...!:l.'oJ -------', ._ - _e'e -- e e----- e--
IfZJ
Figure 28Benthic macrofaunal biomass levels at station 35. (a) One Molpadia oolitica (16.2 g) excluded.
Station 28 This 60-m deep station (lat. 41°50.6'N, long.69°30'W) was in the southwest Gulf of Maine (Fig. 1) withsilty-clay sediments and moderately high trace-metal levels.The collection sequence here was incomplete (Fig. 27) butsuggests a general increase between 1977 «10 g/m2) and1980-83 (67-122 g/m2). It is obvious that most of this increase was due to echinoderms, primarily two species: theurchin Brisaster jragi/is and a brittlestar Ophiura sp. Basedon a cursory size-frequency distribution analysis, the majorbiomass contribution of each of these species was from oldercohorts, although there was evidence of new Ophiura recruitment almost every year. These recruitments either did notsurvive to the next collection or had limited growth, as sizefrequency modal progressions were not evident. Predatorscollected at this site included the American plaice Hippoglossoides platessoides, cod, silver hake, and little skate.Predation data were not available from this station.
Station 35 This station (lat. 42°19'N, long. 70 0 36'W) wasin Massachusetts Bay (Fig. 1) at 60 m in a postglacial depositional area near a mixed waste-disposal site, the "FoulGrounds;" sediments were silt with up to 30 ppb PCBs and1200 ppt PAHs. The site was in, or near, an area whereseasonal fronts develop; a general warming trend has been
23
noted in the Gulf of Maine for the last decade. Biomasslevels, 100-250 g/m2, did not suggest any pattern or trend,except polychaete seasonality (Fig. 28). Most of the biomasscame from polychaetes, with Spio filicornis prominent, andthe echinoderms Ctenodiscus crispatus and Molpadiaoolitica. Predators trawled at this site included Americanplaice, cod, red and silver hakes, and witch, winter, andyellowtail flounders. Ophuroids (brittlestars) were importantprey to cod and plaice, pandalid shrimp to the hakes, andpolychaetes, e.g., sabellids and nereids, to the other flounder.
Discussion _
These results suggest several general conclusions: (1) therewas considerable interannual variability in the biomass dataat most sites, as might be expected, but within ranges previously reported for each area; (2) the range of variabilitydiffered at each site and seasonal patterns of fluctuation wereoften evident; (3) with only a few exceptions, the generaltendency of the mean biomass, within the time frame andsampling scale involved, did not usually suggest any clearincreasing or decreasing trends; (4) the population dynamicsof one or a few species were found to be important in the

explanation of some of the variability and apparent trends;and (5) the relationship of the biomass levels to other environmental factors, e.g., sediment type or quality, couldnot be fully evaluated with the available data. These conclusions or general observations and several others are expandedupon below and, although the relationships may be tentativeat this time, they are noted to suggest hypotheses that couldbe explored in the future.
Seasonal cycles of benthic community biomass levels area common, if not normal, pattern described frequently (seeBeukema 1974, Buchanan et a1. 1978, Glemarec andMenesguen 1980). Seasonal fluctuations were evident atmany of the sites, e.g. stations 3, 9, 32, 19, and 22 (Figs.3,6, 8,21, and 24) with biomass peaks generally occurringin the summer. Some sites that did not show higher meansummer values were dominated by sand dollar Echinarachnius parma populations, whose relatively long life-span, 7+yrs (Steimle 1990), can mask much of the seasonal fluctuations of other species with generally shorter or annual lifecycles.
Review of Figures 2-28 also suggests that biomass levelsat most of the sites appeared to be either relatively constant(considering normal seasonal fluctuations and disregardinga few unusual collections), demonstrated no clear increasing or decreasing trends, or the data were too irregular. Somedispersed sites, e.g., stations 12, 23, 34, 36, and 28 (Figs.10, 19,20,25, and 27), had biomass levels that did suggestoverall long-term increasing trends. This was supported by{-tests indicating the slopes were significantly different atp<0.05. These trends were frequently related to the population dynamics or growth of one or a few dominant species,e.g., sand dollars at station 23, or possibly to nearbyeutrophic estuarine enrichment, e.g., stations 34 and 36. Adecreasing trend was suggested at stations 16B, 16C, and33 (Figs. 13, 15, and 16), and to a lesser degree at stations11, 24b, and 26 (Figs. 9, 24. and 26). The {-tests indicatedthat the trends at stations 16B and 33 were significant atp<0.05. Stations 16B and possibly 33 were in an area considered to be variably affected by pollution from varioussources. No strong reason can be suggested for the declineat the other sites, although the population dynamics of E.parma are involved at station 11. The remaining sites, 31and 32 (Figs. 7 and 8), had collection periods that were eithertoo brief in duration, discontinuous, or too variable to suggest trends.
Although mean sediment grain size and TOC are only twoof many sediment variables, they can be important to benthic community structure. The sediment data, summarizedalso in Figures 2-28, despite being incomplete or discontinuous, suggest these two variables were relatively stableat most sites. When a sedimentary change was evident,possibly because of sampling error, there was seldom asignificant, consistent, concomitant response in biomass. Theproximity of many sites, e.g., stations 7, 8, 17, and 15A,near or in ridge and swale areas suggest a source of someof the variability in the data at these sites. Schaffner andBoesch (1982) have demonstrated how benthic community
24
structure can vary significantly relative to location on sandridges, slopes, or swales. It is possible that these submergedsand dunes might move, thus besides the possible variabilitycaused by minor shifts in sample location in a ridge and swaleenvironment, future monitoring at these sites needs to takeinto account the potential natural changes that may occur atprecise, fixed locations to accurately interpret any later community changes. Generally, the dominant species found atany site were consistent with the major habitat-relatedcommunity types defined by Pratt (1973), considering thesecommunities are usually not discrete but occur in a variablecontinuum (Mills 1969).
Hydrographic conditions at a site can potentially influencebenthic communities, but information on the significance ofthis factor in the study area is mostly lacking. These factorsare most likely to be important in coastal areas rather thanoffshore. For example, although it is not well documented,it is very probable that estuarine plumes influence coastalbenthic communities and these plumes can vary in volume,particulate load, or distribution over time. Chronic seasonalhypoxia is one possibly plume-related problem that can beimportant to benthic communities in some coastal areas, e.g.,along the New Jersey and Delaware coast (Reid et al. 1987).Benthic community changes at plume-influenced sites shouldbe evaluated against any major changes in the plumes, e.g.,excessive freshwater runoff and particulate load due to majorstorm events in the drainage area. The influence of thevariable, coastal-active band is also not well studied, althougha variety of physical and chemical stresses are features ofthis band. The potential occurrence and influence of shifting water mass fronts at several sites cannot be truly assessedin the data presented here. These fronts have been shownto be important to the shelf benthic community in at leastone study (Magnuson et a1. 1981). Likewise, the influenceof the variably configured, semipermanent "cold pool"cannot be assessed at the sites likely to be affected, although low temperatures are known to be important tobenthic communities (Buchanan et al. 1978). Tidal velocitygradients also can be important (Creutzberg 1984), but thesignificance of this and other hydrographic factors to thebenthic community have not yet been evaluated in the studyarea.
The influence of anthropogenic activities on benthic biomass levels are reported frequently (Pearson and Rosenberg1978, Cedarwall and Elmgren 1980, Steimle 1985, Pearsonand Barnett 1987). The sediments at several stations weremoderately to highly contaminated by trace metals or toxicorganic chemicals, e.g., stations 31,33, 18,34,20,28,36,37, 16A-C, and 35. There may be a suggestion of an effectfrom this contamination in some of the data examined in thisstudy, i.e., at stations 33 and 16B. The declining trends atthese two New York Bight apex stations are possibly aresponse to the increase in sewage sludge disposal after 1979,although the actual increase in sewage sludge solids isreported to be only 5% (Reid et a1. 1987). The biomass dataat other contaminated stations, even those near other dumpsites, e.g., station 35 in Massachusetts Bay and station 9 at

the former dumpsite off Delaware, do not show any clearresponse. However, this may be because there is inadequateinformation about these sites, e.g., pre-impact data, orsuitable control areas. Alteration of other benthic communitystructure variables was reported for the former Delawaredumpsite (Lear and O'Malley 1983).
Several studies have demonstrated the influence of predators on benthic fauna (McIntyre 1978, Berge 1980, Persson1981, Choat 1982, Arntz and Rumohr 1986). The predatoroccurrence summaries presented for each site are only grossindicators of the potential predation pressures at any site.Although the predator groups were typical of what wouldbe expected at any site and vary with season and populationdynamics of the species involved (Grosslein and Azarovitz1982), the limited data on diets at the sites is inadequate todiscuss any more than crude linkages between predators andthe benthic community. However, the data are consistent withseveral more comprehensive studies in the region (Langtonand Bowman 1980, 1981; Sedberry 1983). Overall, thedietary data discussed here, and generally supported by otherstudies mentioned above, suggest that despite the diversityin most benthic communities, much of the diet consists quantitatively of a limited number of benthic prey species. Theseare generally characterized as being common at the sedimentsurface and relatively large or conspicuous, e.g., the tubedwelling amphipods Ampelisca, Leptocheirus, Unciola, thepolychaetes Nephtys, Pherusa, Lumbrineris, the tube-dwelling anemone Ceriantheopsis, and especially the smallerdecapods such as small Cancer, Crangon, Pagurus, andDichelopandalus. These motile decapods are most likely notwell-sampled in either grab or trawl collections and theiroverall abundance and biomass underestimated. Molluscs andechinoderms are not generally consumed, despite theiravailability, although some predators do eat them as arelatively common or predominant prey. This suggests thatfish-predation influences to the benthic community, althoughvariable, are relatively selective. There also is an intermediatetrophic level involved, i.e., many of the "prime" prey listedabove (especially the decapod crustaceans) are themselvespredators of smaller organisms, at least being omnivores(Commito and Ambrose 1984). What this would mean tobenthic biomass levels and trends can only be speculation.For example, the low predation pressure on echinoderms andsubsurface dwellers, such as most molluscs and manypolychaetes, may explain why trends can be relatively stablesince these species tend to be the dominant biomass components. However, in terms of value to fishery resources,the prime prey types listed above must be either very productive or more abundant than their apparent low occurrencein grab or trawl collections would suggest.
Energy equivalents of the benthic biomass are not presented since they closely parallel the biomass-level patternsat each site, differing proportionally by the variable meanKcal/g ratios defined for each site (Table 2). It had been anticipated that the energy in the benthic pool would be moreconservative, with less variability, since it should reflect thebasic primary production and distribution characteristics of
25
an area; it should also remove some of the variability causedby the water or shell content of the biomass. However, thiswas not evident; some sites had higher winter energyequivalents that moderated seasonal differences, but othersites had higher summer equivalents. The minor overallseasonal difference in energy equivalents, 0.81 to 0.84, isprobably not significant. Because the energy equivalents varybetween benthic groups (Steimle and Terranova 1985), theproportional contribution of the groups to mean estimatedenergy levels of each site changed from that defined by theoriginal biomass data. Higher energy-equivalent polychaetes(1.09 Kcal/g wet wt) and crustaceans (1.29 Kcal/g wet wt)increased their share of the total, while lower-equivalentmolluscs (0.37 Kcal/g wet wt) and echinoderms (0.48 Kcal/gwet wt) declined. The overall means, 0.81-0.84 Kcal/g, witha median of 0.82 Kcal/g, were consistent with an earlier 0.8Kcal/g estimate (Steimle and Terranova 1985), based onWigley and Theroux's (1981) summer data. This suggests,if only wet-weight benthic macrofauna biomass data areavailable for the northeast continental shelf, the use of the0.8 Kcal/g conversion will provide a reasonable (±25%)estimate of the energy pool. If specific areas or communitiesare to be considered, then the site-specific data of Table 2could be used to refine the estimate.
It is apparent that the biomass, at almost all sites, wasdominated by three groups: molluscs, polychaetes, andechinoderms, with cerianthiid anemones and crustaceansoccasionally being important. This dominance is similar tothe results of Wigley and Theroux (1981) for the MiddleAtlantic Bight, although they show a higher proportion ofmolluscs than generally found in this study. This differenceis probably because many of the megafaunal species excludedin the present analysis were molluscs. Molluscs and polychaetes were notable contributors to the biomass at almostall sites, with polychaetes being particularly abundant insiltier sites, e.g., stations l6A-C, 33, 34, 35, 36, and 37.These sites are all near estuaries or in coastal areas, exceptstation 37 (the "Mud Patch" off Nantucket). In some cases,this dominance may reflect some anthropogenic influence assuggested for other areas (Reise 1982). The echinodermswere dominated by a few species, e.g., Echinarachniusparma on Georges Bank and at several Middle Atlantic Bightsites, and brittlestars or holothurians on deeper areas ofGeorges Bank and in the Gulf of Maine basins. The dominant taxa were generally stable in their proportional contribution to the overall biomass at each site. Exceptions occurredwhen a community was influenced by the population dynamics of a particularly dominant species, such as the brittlestarAmphioplus at station 20 or E. parma at several sites.
The separate study of the population dynamics of Echinarachnius parma (Steimle 1990), focusing on four stations (11,17, 15A, and 23), provided insight on how the recruitment,survival, and growth of this species can greatly influencebiomass trends. For example, at station 11 there were substantial annual recruitments in 1980-82. This is evident inthe station's biomass (Fig. 9) as the expansion of the echinoderm biomass component (almost entirely the recruitment

and growth of these E. parma cohorts) after July 1980, witha peak in early 1982. The subsequent decline occurred asrecruitment was reduced or ceased in 1983-84 and mortality outpaced growth. At station 17, there were only tworecruitments, one in 1976 after the anoxia event defaunatedthe area, and the second in 1978 (Fig. 12). These tworecruitments constitute the entire echinoderm population inFigure 12. This sand dollar population was not growing anyfaster than at the other stations. It also could have beer. subject to a lower mortality because most nonfish predators orcompetitors were also removed from the area by the anoxicconditions. The average life span of this species appears tobe about 8 years in this area (Steimle 1990), and it can beanticipated that unless there is new recruitment the role ofthis species at the site will diminish and other taxa shouldincrease, as they may be inhibited by the dense E. parmapopulation. At station 15A, E. parma has been a persistentpart of the community since at least the early 1970s (Fig.17). There have been annual recruitments between 1978 and1982 (Steimle 1990) evident as winter/spring peaks to 1982(Fig. 17). The growth of a dominant 1978 cohort is re~pon
sible for the 1983 biomass peak, and mortality in this cohortis the cause of the subsequent decline. At station 23 a situation similar to station 17 was evident with no sand dollarpopulation evident in the community studied until recruitments occurred between 1978 and 1982, the last collectionthere. The cohorts at this Georges Bank station appeared tohave a lower survival than at the other three sites studied,since the population did not expand via these frequent recruitments and their expected growth, as they did elsewhere. Thismay be related to Collie's (1987) observation of preferential feeding by yellowtail flounder on <12 mm E. parma onGeorges Bank. Much of the gradual increase in communitybiomass after 1978 (Fig. 25) was the result of these recruitments and their growth.
In the discussion of biomass variability at each site, theinfluence on the biomass from population dynamics of onlya few echinoderm species was considered. There are otherspecies that need to be considered, e.g., molluscs, as suggested by Nucula and Ilyanassa at station 31. They wouldbe expected to produce results similar to that of the echinoderms. Several bivalve molluscs are commercially harvestedwhich also affects their abundance and population dynamics.Population dynamics of dominant species should be examinedas part of any interpretive monitoring program (Pearson andBarnett 1987). Life-history summaries (Caracciolo andSteimle 1983) and studies of some dominant species (Steimle1990) are becoming available and should be used or considered in evaluating the relative status or trending of acommunity. The importance of biological interactions tolong-term community stability is well known (Gray 1977).Some community change can be expected, because of theseinteractions and natural environmental factors, including achange to significantly different or alternate communities.The definition and understanding of these natural fluctuations or changes are extremely important in detecting andunderstanding anthropogenic effects.
26
The mean biomass ranges found at the sites from the 1970sand 1980s were generally consistent with the values reportedfor nearby stations or areas by Wigley and Theroux (1981)and Theroux and Grosslein (1987), based on extensive collections in the late 1950s and early 1960s. The only notableexception was the recent data for Buzzards Bay, MA (station 34, Fig. 19), which was generally above 100 g/m2 ,
compared with the Wigley and Theroux (1981) value of<25 g/m:! for this area. The number of sites monitored inthe present survey were a small fraction (about 3%) of theearlier 1950s-60s studies; there were small differences inthe methods involved. Other comparisons between the conclusions of these two earlier surveys and the recent seriessuggest little difference in overall shelf faunal composition(bivalves, polychaetes, and echinoderms as biomass dominants), bathymetric trends (general inverse relationship), andother relationships.
There have been relatively few subtidal benthic macrofaunal studies that have included long-term biomass data, andthese were mostly for European waters as reviewed by Pearson and Barnett (1987). There also have been other studies,again in the same areas, that have examined relatively limiteddata sets separated by several decades (Pearson and Barnett1987). These studies were often for the purpose of attempting to define changes in the benthic community that couldbe related to pollution, especially organic enrichment. Insome cases, changes were found that appeared to supportthat relationship (Cedarwall and Elmgren 1980, Pearson etal. 1985). But these studies are not without the possibilityof alternate interpretation because of a number of confounding factors. These can include differences in methods or otherenvironmental variables other than pollution, includingchanges in the demersal fish populations in the area over theperiod being compared (Persson 1981). In other cases, a clearbenthic biomass response to pollution was evident (Pearsonand Rosenberg 1978). In general, these other long-termstudies show results or conclusions similar to those described in this paper: (1) Seasonal biomass fluctuations wereusually evident as late summer-early fall peaks, with latewinter-early spring lows (Buchanan et al. 1978); (2) biomasslevels and trends can be significantly influenced by thepopulation dynamics of a few larger, long-lived species, frequently echinoderms and molluscs (Pearson et al. 1985);(3) there can be substantial interannual variability in theamplitude of the biomass ranges (Blegvad 1951); and(4) cause-and-effect relationships of any changes or trendsare usually difficult to determine with reasonable confidencebecause of the usually large variety of additional factors thatcan be involved and need to be monitored (Buchanan et al.1978). In interpreting causal relationships, the types andlevels of change which are significant for resource management purposes need to be defined (Green 1984, Duinker andBeanlands 1986). The changes of significance are likely tobe, as McIntyre (1978) states, either a major qualitativealteration in the biomass or a shift to a new population structure which has significance to predators. Experiments orstudies are needed to defme the term "major" and determine

what benthic population structures are of importance tofishery resources.
Because the sites examined were not in rocky habitats, thecommunities associated with these habitats are not discussedhere or in Wigley and Theroux (1981). These habitats andtheir epifauna are important to fisheries, but almost nothinghas been done in the Northeast to quantify the potential foragevalue of the community or its natural variability or production for comparison with non-rocky bottom areas. This isespecially important because of the recent interest and increased use of artificial reef habitats as fishery-enhancementor habitat-loss mitigation tools.
In summary, long-term benthic macrofaunal biomass datafrom a number of sites on the continental shelf of the northeastern United States showed little evidence of clear temporal trends. It appears that most sites had relatively stablebiomass levels, although there were seasonal and annualvariability. The population dynamics of a few species, suchas the sand dollar Echinarachnius parma, were a major factor in variability at several sites. Preliminary examinationsof other potential causes of variability were inconclusivebecause of inadequate data but suggested a number of information deficiencies that should be explored in the future. Thisstudy demonstrates the need for caution in using limited benthic biomass data to characterize a station or area, since thisvariable is dynamic.
Citations _
Arntz, W.E., and H. Rumohr1986 Fluctuations of benthic macrofauna during succession and in an
established community. Meeresforschung 31 :97-114.Berge, J.A.
1980 Methods for biological monitoring in communities of subtidalsediments. Helgol. Meersunters. 33:495-506.
Beukema, J.J.1974 Seasonal changes of the macrofauna of a tidal flat area in the
Dutch Wadden Sea. Neth. J. Sea Res. 8:94-107.Blegvad, H.
1928 Quantitative investigations of the bottom invertebrates in Limfjord 1910-1927 with special reference to plaice-food. Rep. Dan.BioI. Stn. 34:34-52.
1951 Fluctuations in the amounts of food animals of the bottom ofthe Lirnfjord in 1928-1950. Rep. Dan. BioI. Stn. 53:3-15.
Boehm, P.1983 Chemical contaminants in Northeast United States marine
sediments. NOAA Tech. Rep. NOS 99, Natl. Oceanic Atmos.Admin., Natl. Ocean Serv., Rockville, MD 20852, 82 p.
Buchanan, J.B., M. Sheader, and P.F. Kingston1978 Sources of variability in the benthic macrofauna off the south
Northumberland coast, 1971-1976. J. Mar. BioI. Assoc. U.K.58:191-209.
Caracciolo, J., and F.W. Steimle1983 An atlas of the distribution and abundance of dominant benthic
invertebrates in the New York Bight apex, with reviews of their lifehistories. NOAA Tech. Rep. NMFS SSRF-776, Natl. OceanicAtmos. Admin., Natl. Mar. Fish. Serv., Seattle, WA 98115-0070,58 p.
Cedarwall, H., and R. Elmgren1980 Biomass increase of benthic macrofauna demonstrates eutrophica
tion of the Baltic Sea. Ophelia, Suppl. 1:287-304.
27
Choat, J.H.1982 Fish feeding and the structure of benthic commuDitIes in
temperate waters. Annu. Rev. Ecol. Syst. 13:423-449.Cohen, E.B., M.D. Grosslein, M.P. Sissenwine, F. Steimle, and W.R.
Wright1982 Energy budget of Georges Bank. In Mercer, M.C. (ed.),
Multispecies approaches to fishery management advice, p.95-107. Can. Spec. Publ. Fish Aquat. Sci. 59.
Coleman, N.1980 More on sorting benthic samples. Mar. Pollut. Bull. 11:
150-152.Collie, J .S.
1987 Food selection by yellowtail flounder (Limandajerruginea) onGeorges Bank. Can. J. Fish. Aquat. Sci. 44:357-367.
Commito, J.A., and W.G. Ambrose, Jr.1984 Predatory infauna and trophic complexity in soft-bottom com
munities. In Gibbs, P.E. (ed.), Proc. 19th Euro. Mar. BioI. Symp.,p. 323-333. Cambridge Univ. Press.
Coull, B.C.1985 The use of long-term biological data to generate testable
hypotheses. Estuaries 8:84-92.Creutzberg, F.
1984 A persistent chlorophyll a maximum coinciding with an enrichedbenthic zone. In Gibbs, P.E. (ed.), Proc. 19th Euro. Mar. BioI.Symp., p. 97-108. Cambridge Univ. Press.
Duinker, P.N., and G.E. Beanlands1986 The significance of environmental impacts: An exploration of
the concept. Environ. Manage. 10:1-10.Glemarec, M., and A. Menesguen
1980 Functioning of a muddy sand ecosystem: Seasonal fluctuationsof different trophic levels and difficulties in estimating productionof the dominant macrofauna species.In Tenore, K.R., and B.C. Coull(eds.), Marine benthic dynamics, p. 49-68. Univ. South CarolinaPress, Columbia.
Gray, J.S.1977 The stability of benthic ecosystems. Helgol. Meersunters.
30:427-444.Green, R.
1984 Statistical and nonstatistical considerations for environmentalmonitoring studies. Environ. Monit. Assess. 4:293-301.
Grosslein, M.D., and T.R. Azarovitz1982 Fish distribution. MESA New York Bight Atlas, Monogr.
15. NY Sea Grant Inst., Albany, 182 p.Howe, S., and W. Leathem
1984 Secondary production of benthic macrofauna at three stationsof Delaware Bay and coastal Delaware. NOAA Tech. Memo.NMFS-F/NEC-32, Northeast Fish. Cent., Natl. Mar. Fish. Serv.,NOAA, Woods Hole, MA 02543, 62 p.
Ingham, M.C. (editor)1982 Summary of the physical oceanographic processes and features
pertinent to pollution distribution in the coastal and offshore watersof the northeastern United States, Virginia to Maine. NOAA Tech.Memo. NMFS-F/NEC-17, Northeast Fish. Cent., Natl. Mar. Fish.Serv., NOAA, Woods Hole, MA 02543, 166 p.
Langton, R.W., and R.E. Bowman1980 Food of fifteen Northwest Atlantic Gadiform fishes. NOAA
Tech. Rep. NMFS SSRF-740, Natl. Oceanic Atmos. Admin., Natl.Mar. Fish. Serv., Seattle, WA 98115-0070, 23 p.
1981 Food of eight Northwest Atlantic Pleuronectiform fishes. NOAATech. Rep. NMFS SSRF-749, Natl. Oceanic Atmos. Admin., Natl.Mar. Fish Serv., Seattle WA 98116-0070, 16 p.
Lear, D.W., and M.L. O'Malley1983 Effects of sewage sludge dumping on continental shelf benthos.
In Duedall, I.W., et al. (eds.), Wastes in the ocean, Vol. I, p.293-311. J. Wiley, NY.
Lewin, R.1986 How unusual are unusual events? Science (Wash. DC)
233: 1385.

Lunz, J.D., and D.R. Kendall1982 Benthic resources assessment technique, a method for quanti
fying the effects of benthic changes on fish resources. In Proc. Oceans'82 Conf., p. 1024-1027. Mar. Techol. Soc., Counc. Ocean Eng.,Inst. Electrical and Electronics Engineers, Wash. DC 20006.
Magnuson, J.J., C.L. Harrington, D.J. Steward, and G.N. Herbst1981 Responses of macrofauna to short-term dynamics of the Gulf
Stream front on the continental shelf. In Richards, F.A. (ed.), Coastalupwelling, p. 441-448. Am. Geophys. Union, Wash. DC 20009.
Maurer, D.1982 Review of benthic invertebrates of Georges Bank in relation to
gas and oil exploration with emphasis on management implications.Unpubl. rep. to Northeast Fish. Cent., Natl. Mar. Fish. Serv ..NOAA, Woods Hole, MA 02543, 329 p.
McIntyre, A.D.1978 The benthos of the western North Sea. Rapp. P.-V. Reun.
Cons. Int. Explor. Mer 172:405-417.Mills, E.L.
1969 The community concept in marine zoology, with comments oncontinua and instability in some marine communities: A review.J. Fish. Res. Board Can. 26:1415-1428.
Mills, E.L., K. Pittman, and B. Munroe1982 Effect of preservation on the weight of marine benthic inver
tebrates. Can. J. Fish. Aquat. Sci. 39:221-224.Overhoitz, W.J., and A.V. Tyler
1986 An exploratory simulation model of competition and predationin a demersal fish assemblage on Georges Bank. Trans. Am. Fish.Soc. 115:805-817.
Pearson, T.H., and P.R.D. Barnett1987 Long-term changes in benthic populations in some west Euro
pean coastal areas. Estuaries 10:220-226.Pearson, T.H., and R. Rosenberg
1978 Macrobenthic succession in relation to organic enrichment andpollution of the marine environment. Oceanogr. Mar. BioI. Annu.Rev. 16:229-311.
Pearson, T.H., A.B. Josefson, and R. Rosenberg1985. Petersen's benthic stations revisited. 1. Is the Kattegatt becom
ing eutrophic? J. Exp. Mar. BioI. Ecol. 92:157-206.Persson, L.E.
1981 Were macrobenthic changes induced by thinning out of flatfishstocks in the Baltic proper? Ophelia 20: 137-152.
Petersen, C.G.J.1918 The sea bottom and its production of fish-food. Rep. Dan. BioI.
StD. 25: 1-62.Pratt, S.
1973 Benthic fauna. In Coastal and offshore environmental inventory,Cape Hatteras to Nantucket Shoals, Chap. 5. Univ. Rhode Island,Kingston, 70 p.
Reid, R.N., M.C. Ingham, and J.B. Pearce (editors)1987 NOAA's Northeast Monitoring Program (NEMP): A report on
progress of the first five years (1979-84) and a plan for the future.NOAA Tech. Memo. NMFS-F/NEC-44, Northeast Fish. Cent., Nat!.Mar. Fish. Serv., NOAA, Woods Hole, MA 02543, 138 p.
Reise, K.1982 Long-term changes in the macrobenthic invertebrate fauna of
the Wadden Sea: Are the polychaetes about to take over? Neth. J.Sea Res. 16:29-36.
Reish, D.J.1959 A discussion of the importance of the screen size in washing
quantitative marine bottom samples. Ecology 40:307-309.Schaffner, L.C., and D.F. Boesch
1982 Spatial and temporal resource use by dominant benthic amphipoda(Ampeliscidae and Corophiidae) on the Middle Atlantic Bight outercontinental shelf. Mar. Ecol. Prog. Ser. 9:231-243.
28
Sedberry, G.R.1983 Food habits and trophic relationships of a community of fishes
on the outer continental shelf. NOAA Tech. Rep. NMFS SSRF-773,Natl. Oceanic Atmos. Admin., Natl. Mar. Fish. Serv., Seattle, WA98115-0070, 56 p.
Steimle, F.W.1982 The benthic macroinvertebrates of the Block Island Sound.
Estuarine Coastal Shelf Sd. 15: 1-16.1985 Biomass and estimated productivity of the benthic macrofauna
in the New York Bight: A stressed coastal area. Estuarine CoastalShelf Sci. 21 :539-554.
1990 Population dynamics, growth, and production estimates for thesand dollar Echinarachnius parma. Fish. Bull., U.S. 88(1).
Steimle, F.W., and D. Radosh1979 Effects on the benthic invertebrate community. In Swanson, L.,
and C. Sindermann (eds.), Oxygen depletion and associated benthicmortalities in the New York Bight, 1976, p. 281-293. NOAA Prof.Pap. II, Sandy Hook Lab., Northeast Fish. Cent., Highlands, NJ07732.
Steimle, F.W., and R.J. Terranova1985 Energy equivalents of marine organisms from the continental
shelf of the temperate Northwest Atlantic. J. Northwest Atl. Fish.Sci. 6:117-124.
Swift, D.J.P.1975 Tidal sand ridges and shoal retreat massifs. Mar. Geol. 18:
105-134.Theroux, R.B., and M.D. Grosslein
1987 Benthic fauna. In Backus, R.H. (ed.), Georges Bank, p. 283-295.MIT Press, Cambridge, MA.
Warwick, R.M.1980 Population dynamics and secondary production of benthos. In
Tenore, K.R., and B.C. Coull (eds.), Marine benthic dynamics, p.1-24. Univ. S. Carolina Press, Columbia.
Wigley, R., and R.B. Theroux1981 Macrobenthic invertebrate fauna of the Middle Atlantic Bight
region-Faunal composition and quantitative distribution. U.S. Dep.Int., Geol. Surv. Prof. Pap. 529-N, Woods Hole Oceanogr. Inst.,Woods Hole, MA 02543, 198 p.
Wolfe, D.A., M.A. Champ, D.A. Flemer, and A.J. Mearns1987 Long-term biological data sets: Their role in research, monitor
ing, and management of estuarine and coastal marine systems.Estuaries 10:181-193.