effects on benthic macrofauna from pumped flows in … · effects on benthic macrofauna from pumped...
TRANSCRIPT
Effects on Benthic Macrofauna from Pumped Flows in Rincon Bayou
Annual Report
CBBEP Publication – 110
Project Number –1517
August 2015
Prepared by:
Dr. Paul A. Montagna, Principal Investigator
Harte Research Institute for Gulf of Mexico Studies
Texas A&M University-Corpus Christi
6300 Ocean Dr., Unit 5869
Corpus Christi, Texas 78412
Phone: 361-825-2040
Email: [email protected]
Submitted to:
Coastal Bend Bays & Estuaries Program
615 N. Upper Broadway, Suite 1200
Corpus Christi, TX 78401
The views expressed herein are those of the authors and do not necessarily reflect the views of CBBEP or other
organizations that may have provided funding for this project.

Effects on Benthic Macrofauna from Pumped Flows in Rincon Bayou
Principal Investigator:
Dr. Paul A. Montagna
Co-Authors:
Meredith Herdener
Harte Research Institute for Gulf of Mexico Studies
Texas A&M University - Corpus Christi
6300 Ocean Drive, Unit 5869
Corpus Christi, Texas 78412
Phone: 361-825-2040
Email: [email protected]
Final report submitted to:
Coastal Bend Bays & Estuaries Program, Inc.
615 N. Upper Broadway, Suite 1200
Corpus Christi, TX 78401
CBBEP Project Number 1517
August 2015

Cite as:
Montagna, P.A. and M. Herdener. 2015. Effects on Benthic Macrofauna from
Pumped Flows in Rincon Bayou. Final Report to the Coastal Bend Bays &
Estuaries Program for Project # 1517. Harte Research Institute, Texas A&M
University-Corpus Christi, Corpus Christi, Texas, 20 pp.
i
Abstract
Decreased inflow due to damming of the Nueces and Frio Rivers has resulted in
increasing salinity in Nueces Bay and caused Rincon Bayou to become a reverse estuary
disturbing the overall hydrology of the adjacent Corpus Christi Bay. Adaptive management to
perform hydrological restoration began in 1994 and continues today. The objectives of the
present study are to determine to what extent salinity fluctuates within Rincon Bayou and what
effects these fluctuations have on estuary health. Benthic macrofauna are ideal indicators of
ecological effects because of their relative immobility and longevity in contrast with plankton of
comparable size. Archived samples were analyzed as well as new samples collected from the
upper Rincon Bayou near Corpus Christi, TX. One historical station (466C) was sampled
biweekly. Conductivity, temperature, and salinity were monitored continuously. Additional
water column measurements were taken during sampling events. Macrofauna biomass,
abundance, and diversity were recorded and analyzed. High inflow reduces salinity and
introduces nutrients. Large and haphazard salinity fluctuations result in an often disturbed
system populated by pioneer species, such as chironomid larvae and Streblospio benedicti,
during especially low and high salinity periods. These results indicate that further changes need
to be made to the Rincon Bayou restoration and management programs in order to reestablish a
reasonably undisturbed ecosystem.

ii
Table of Contents
Abstract ............................................................................................................................................ i
List of Figures ................................................................................................................................ iii
List of Tables ................................................................................................................................. iv
Introduction ..................................................................................................................................... 1
Materials and Methods .................................................................................................................... 3
Site Description ......................................................................................................................................... 3
Sampling Methods ..................................................................................................................................... 4
Archived Samples ...................................................................................................................................... 4
New Samples ............................................................................................................................................. 4
Data Analysis ............................................................................................................................................ 5
Results ............................................................................................................................................. 7
Discussion ..................................................................................................................................... 15
Recommendation ..................................................................................................................................... 16
Literature Cited ............................................................................................................................. 18

iii
List of Figures
Figure 1. Map of study area. ........................................................................................................... 3
Figure 2. Salinity change in grab samples at Station C over the study period. Red dots are when
biomass was measured at the species level, blue circles when biomass measured at taxa
level. .................................................................................................................................... 8
Figure 3. Time series data at Station C with salinity as black line. A) Abundance, B) Biomass, C)
Diversity, D) Evenness. ...................................................................................................... 9
Figure 4. Multidimensional scaling plot of community structure change over time at station C.
Symbol labels are months. ................................................................................................ 12
Figure 5. ABC curves for three salinity ranges. A) wet, B) average, and C) dry. ........................ 13

iv
List of Tables
Table 1. Archived samples at Station C analyzed for the current study. ........................................ 4
Table 2. Sampling periods and protocol differences for archived and new samples. ..................... 5
Table 3. Summary of all hydrographic grab measurements at Station C from January 2009 to
April 2015. .......................................................................................................................... 7
Table 4. Salinity parameters at Station C during three ranked periods. ......................................... 8
Table 5. Summary of the mean benthic parameters over 74 sampling periods at all stations. ..... 11
Table 6. Correlations between physical and biological variables over 74 sampling periods. Bold
values are significant at the 0.05 level. Abbreviations as in Table 5. .............................. 11
Table 7. Species contributions to abundance for three salinity ranks used in ABC analysis. ...... 14
Table 8. Species contributions to biomass for three salinity ranks used in ABC analysis. .......... 14
1
Introduction
The Wesley Seale Dam was built on the Nueces River in 1958 and the Choke Canyon
Dam was built on the Frio River in 1982 (Montagna et al. 2002). Stream flow to the Nueces
River has decreased by 99% since the building of the Wesley Seale Dam and by an additional
55% since the construction of the Choke Canyon Dam (Asquith et al. 1997, Irlbeck and Ward
2000, Ward et al. 2002). Decreased flow has increased salinity in Nueces Bay and Rincon
Bayou resulting in a reverse estuary, where salinity is higher upstream than downstream,
disturbing the overall hydrology of the estuary (Palmer et al. 2002). The Nueces Overflow
Channel was built in 1995 by the U.S. Bureau of Reclamation in an effort to restore ecological
value to the bayou by allowing increased freshwater inflows to the area (Montagna et al. 2002).
The channel was closed in 2000, but reopened in 2002 (Palmer et al. 2002).
The effects on benthos of the altered freshwater inflows via the channel reached six
kilometers downstream, but failed to affect restoration in the lower reaches of the bayou or in
Nueces Bay (Palmer et al. 2002). However, within the affected area, organismal response to
moderate inflow was positive, producing higher abundance, diversity, and biomass of benthic
macrofauna (Montagna et al. 2002). Following floods, pioneer species, such as Streblospio
benedicti, were found in high abundance (Palmer et al. 2002; Ritter et al. 2005). The presence of
pioneer species indicates that Rincon Bayou is likely an area of high disturbance following
floods (Connell and Slayter 1977). In fact, Rincon Bayou is likely in a constant state of early to
intermediate succession because of the highly variable environmental conditions (Ritter et al.
2005).
It is possible that reducing the great fluctuation in flow could help improve the ecological
state of Rincon Bayou. To improve hydrological conditions in Rincon Bayou, a pipeline and
pumping station was completed in fall 2008, but first used in 2009, from the Calallen Pool to
Rincon Bayou. The pumping facilitates additional freshwater inflows that do not depend upon
overflow from the Calallen Dam (Adams and Tunnell 2010). The salinity and benthos were
monitored for one year after initial pumping began, but that study was during relatively wet
periods; average salinity was 17 psu from between 28 September 2009 and 11 August 2010
(Barajas 2011). Because salinity did not vary much during this study period, there was little
correlation between abundance and species composition to salinity (Barajas 2011). Thus, it is
not known what optimal pumping strategy would improve the ecology of Rincon Bayou and the
surrounding systems.
The purpose of the current study is to determine the effects of salinity changes on benthic
macrofauna. Salinity decreases within days when the river flows or pumping begins (Adams and
Tunnell 2010, Barajas 2011), so salinity is a proxy for inflow. Macrofauna are ideal indicator
organisms of habitat quality because of to their relative immobility and longevity in contrast with
plankton of comparable size (Diaz et al. 2004). New samples were collected for one year from
the upper Rincon Bayou and added to a time series of archived samples. The relationship

2
between salinity and benthic metrics were analyzed to determine the effects of salinity changes
on the abundance, biomass and diversity of benthic macrofauna. Biomass was measured at the
species level so that species-specific responses could be observed and evaluated.

3
Materials and Methods
Site Description
The study took place in Rincon Bayou near Corpus Christi, Texas, USA. Rincon Bayou
flows east from the Nueces River to Nueces Bay and is the main stem of the Nueces Marsh. The
two main sources of freshwater input to Rincon Bayou are the Nueces River Overflow channel
and the Calallen pump station that pumps water from the Calallen Pool directly into Rincon
Bayou. The historical station, C (27.89878° N, -97.60417° W) sampled since 1994 (Montagna et
al. 2002), was sampled for this study (Fig. 1). Station C is near to the pump outfall and overflow
channel in the upper Rincon Bayou and has been shown to be the most affected by previous
attempts to restore freshwater inflow to the area (Palmer and Montagna 2002). Station C is also
known as 466C (Montagna et al. 2009). The site is surrounded by dense shrubbery and grasses
that grow to the shoreline. Clay and mud dominate the substrate at all stations.
Figure 1. Map of study area.

4
Sampling Methods
Macrofauna samples were collected using a 6.7-cm diameter benthic core (area=35.23
cm2). Three replicates were taken by hand at each station. The cores were divided into 0-3 cm
and 3-10 cm vertical sections and preserved in 10% buffered formalin. Samples were washed
through a 500 micron steel sieve and sorted under a dissecting microscope to the lowest
taxonomic level possible. Specimens were stored in 75% ethanol until biomass measurements
were performed. Organisms were then placed on pre-weighed aluminum pans and dried in an
oven for a minimum of 24 hours at 55 °C. Organism weight was recorded to the nearest 0.01
mg. Specimens weighing less were assigned a weight of 0.01 mg. Mollusk shells were
dissolved in 1 N HCL prior to biomass measurements.
Archived Samples
Archived benthic samples from previous collections in Rincon Bayou were used in
addition to new samples collected during the present study period. A total of 21 archived
samples (i.e., 3 replicates for 7 sampling dates) were processed (Table 1). These samples were
analyzed using the method above.
Table 1. Archived samples at Station C analyzed for the current study.
Date Station
May 2010 C
June 2010 C
January 2011 C
April 2011 C
July 2011 C
July 2012 C
October 2012 C
New Samples
Samples were taken biweekly from 25 October 2013 through 27 April 2015 at station C.
Benthic samples have been collected at different sampling frequencies since 1994 (Table 2). The
original method was to take samples quarterly and measure biomass by major taxa level only
(Montagna et al. 2002). For the purposes of the current study, biomass was measured at the
species level, or lowest taxonomic level possible. This species level biomass measurement was
performed on the archived samples (Table 1) and samples collected since October 2012.
5
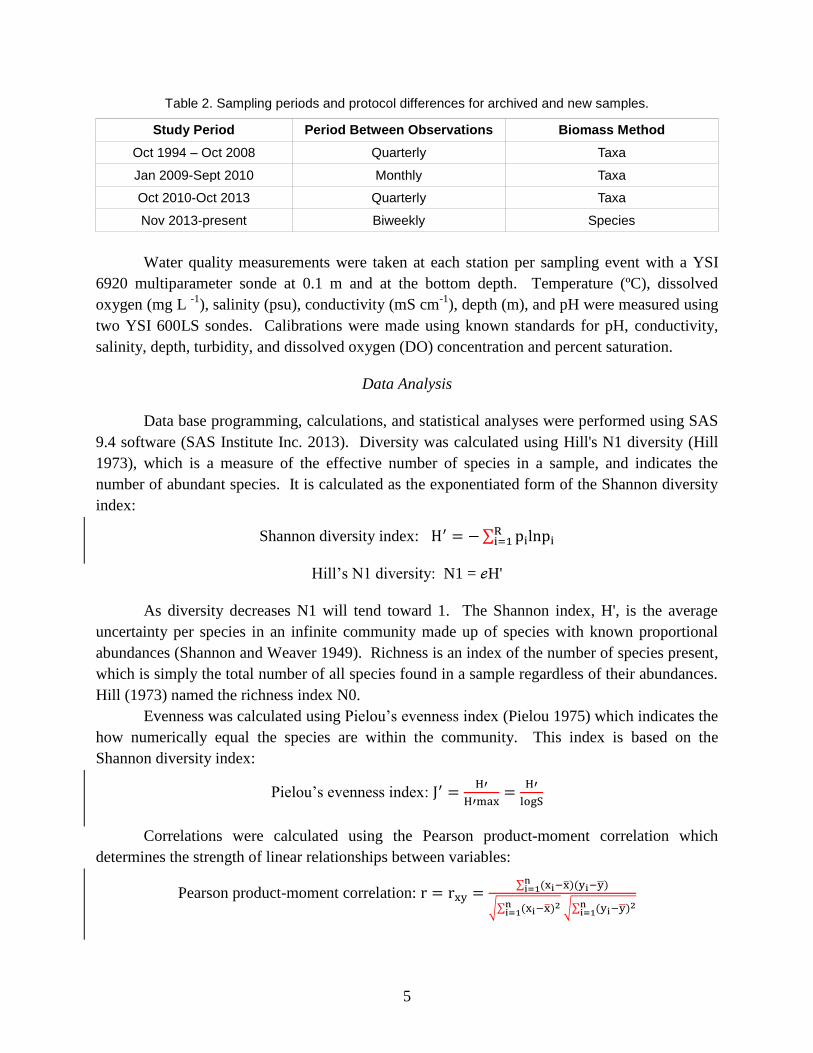
Table 2. Sampling periods and protocol differences for archived and new samples.
Study Period Period Between Observations Biomass Method
Oct 1994 – Oct 2008 Quarterly Taxa
Jan 2009-Sept 2010 Monthly Taxa
Oct 2010-Oct 2013 Quarterly Taxa
Nov 2013-present Biweekly Species
Water quality measurements were taken at each station per sampling event with a YSI
6920 multiparameter sonde at 0.1 m and at the bottom depth. Temperature (ºC), dissolved
oxygen (mg L -1
), salinity (psu), conductivity (mS cm-1
), depth (m), and pH were measured using
two YSI 600LS sondes. Calibrations were made using known standards for pH, conductivity,
salinity, depth, turbidity, and dissolved oxygen (DO) concentration and percent saturation.
Data Analysis
Data base programming, calculations, and statistical analyses were performed using SAS
9.4 software (SAS Institute Inc. 2013). Diversity was calculated using Hill's N1 diversity (Hill
1973), which is a measure of the effective number of species in a sample, and indicates the
number of abundant species. It is calculated as the exponentiated form of the Shannon diversity
index:
Shannon diversity index:
Hill’s N1 diversity: N1 = ℯH'
As diversity decreases N1 will tend toward 1. The Shannon index, H', is the average
uncertainty per species in an infinite community made up of species with known proportional
abundances (Shannon and Weaver 1949). Richness is an index of the number of species present,
which is simply the total number of all species found in a sample regardless of their abundances.
Hill (1973) named the richness index N0.
Evenness was calculated using Pielou’s evenness index (Pielou 1975) which indicates the
how numerically equal the species are within the community. This index is based on the
Shannon diversity index:
Pielou’s evenness index:
Correlations were calculated using the Pearson product-moment correlation which
determines the strength of linear relationships between variables:
Pearson product-moment correlation:

6
PROC CORR was used to calculate the Pearson product-moment correlation coefficients
and probabilities for Hill’s N1 diversity, Pielou’s evenness index, biomass, and abundance.
The abundance/biomass comparison (ABC) method was used to assess community
response during different salinity periods. This method allows for the comparison of ranked
species abundance and biomass versus an environmental variable, such as salinity, despite
differing units of measurement (Clarke & Warwick 1994). Only the species specific biomass
data could be used. First the salinity data for the entire period from January 2009 to April 2015
was classified into three periods representing wet, average, and dry conditions, using PROC
RANK. Then the overall average abundance and biomass was calculated for each species for
each period. The cumulative abundance and biomass were then ranked by species dominance
using SAS programming and PROC RANK. The ABC plots for each salinity period were
created using PROC SGPLOT.
Benthic community structure of macrofauna species was analyzed in PRIMER-e software
by non-metric multidmensional scaling (MDS) and cluster analysis using a Bray-Curtis
similarity matrix (Clarke and Warwick 1994). Prior to analysis, the data was natural logarithm
transformed. Log transformations improve the performance of the analysis by decreasing the
weight of the dominant species. MDS was used to compare numbers of individuals of each
species for each station-date combination. The distance between station-date combinations can
be related to community similarities or differences between different stations. Cluster analysis
determines how much each station-date combination resembles each other based on species
abundances. The percent resemblance can then displayed on the MDS plot to elucidate grouping
of station-date combinations. The group average cluster mode was used for the cluster analysis.
7
Results
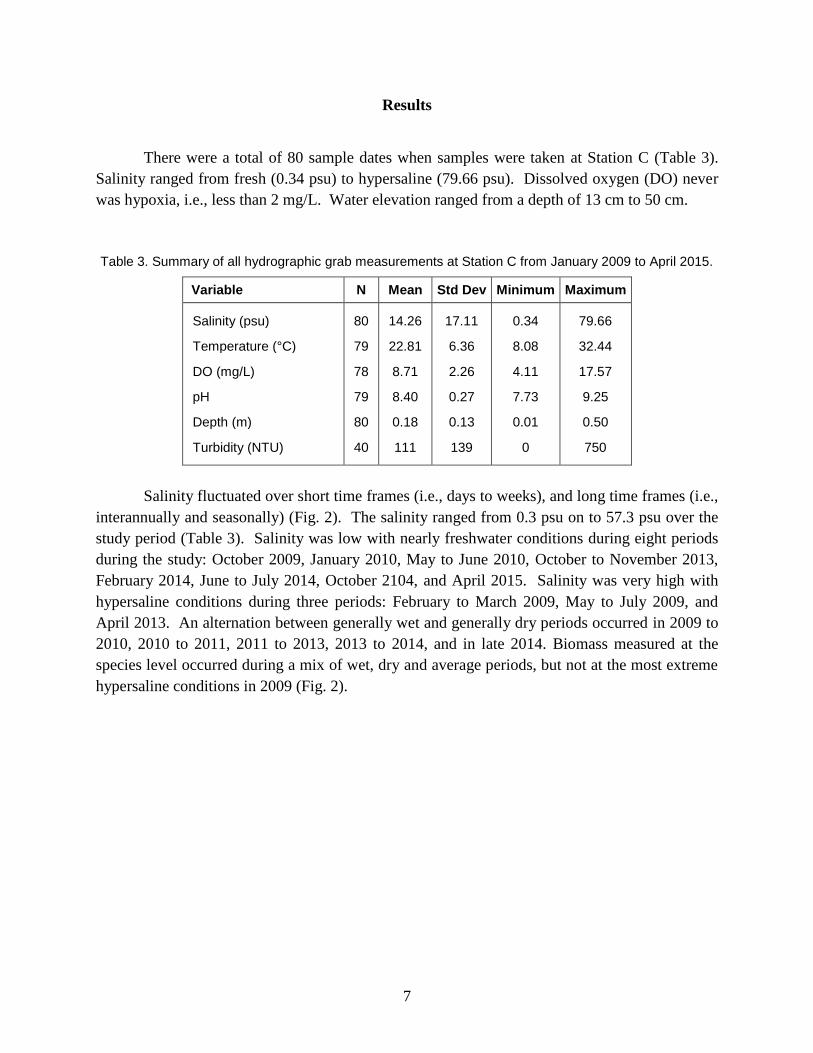
There were a total of 80 sample dates when samples were taken at Station C (Table 3).
Salinity ranged from fresh (0.34 psu) to hypersaline (79.66 psu). Dissolved oxygen (DO) never
was hypoxia, i.e., less than 2 mg/L. Water elevation ranged from a depth of 13 cm to 50 cm.
Table 3. Summary of all hydrographic grab measurements at Station C from January 2009 to April 2015.
Variable N Mean Std Dev Minimum Maximum
Salinity (psu)
Temperature (°C)
DO (mg/L)
pH
Depth (m)
Turbidity (NTU)
80
79
78
79
80
40
14.26
22.81
8.71
8.40
0.18
111
17.11
6.36
2.26
0.27
0.13
139
0.34
8.08
4.11
7.73
0.01
0
79.66
32.44
17.57
9.25
0.50
750
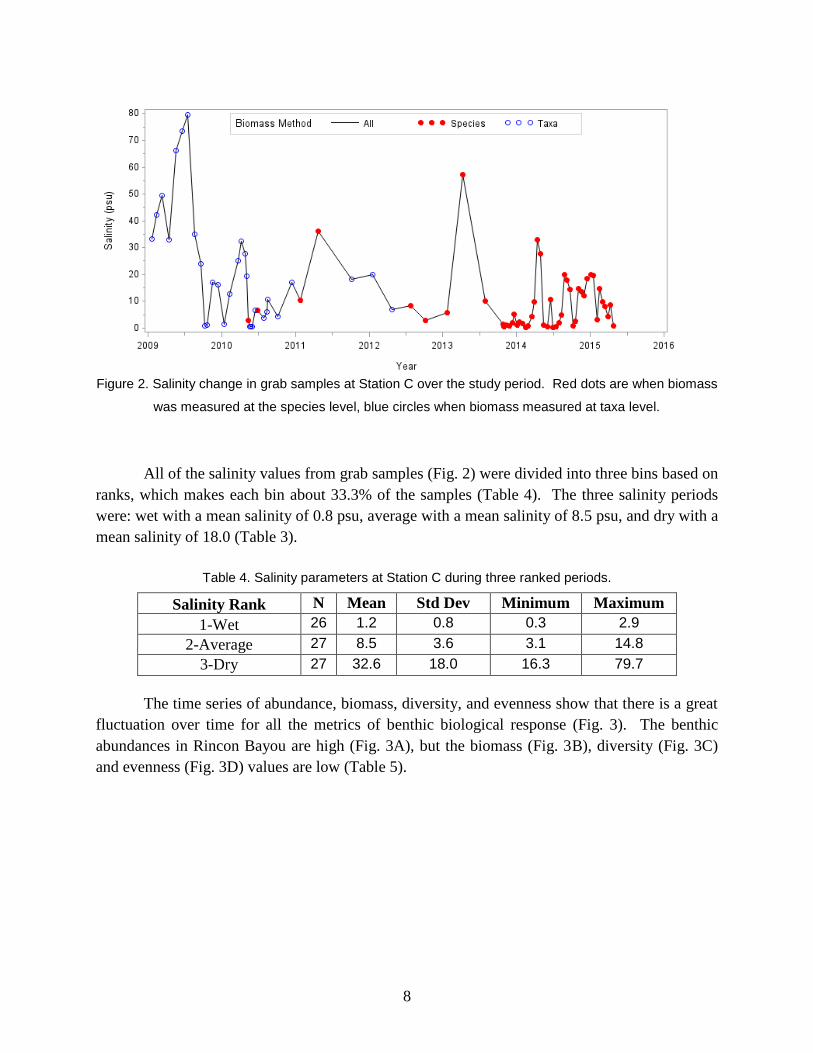
Salinity fluctuated over short time frames (i.e., days to weeks), and long time frames (i.e.,
interannually and seasonally) (Fig. 2). The salinity ranged from 0.3 psu on to 57.3 psu over the
study period (Table 3). Salinity was low with nearly freshwater conditions during eight periods
during the study: October 2009, January 2010, May to June 2010, October to November 2013,
February 2014, June to July 2014, October 2104, and April 2015. Salinity was very high with
hypersaline conditions during three periods: February to March 2009, May to July 2009, and
April 2013. An alternation between generally wet and generally dry periods occurred in 2009 to
2010, 2010 to 2011, 2011 to 2013, 2013 to 2014, and in late 2014. Biomass measured at the
species level occurred during a mix of wet, dry and average periods, but not at the most extreme
hypersaline conditions in 2009 (Fig. 2).
8
Figure 2. Salinity change in grab samples at Station C over the study period. Red dots are when biomass
was measured at the species level, blue circles when biomass measured at taxa level.
All of the salinity values from grab samples (Fig. 2) were divided into three bins based on
ranks, which makes each bin about 33.3% of the samples (Table 4). The three salinity periods
were: wet with a mean salinity of 0.8 psu, average with a mean salinity of 8.5 psu, and dry with a
mean salinity of 18.0 (Table 3).
Table 4. Salinity parameters at Station C during three ranked periods.
Salinity Rank N Mean Std Dev Minimum Maximum
1-Wet 26 1.2 0.8 0.3 2.9
2-Average 27 8.5 3.6 3.1 14.8
3-Dry 27 32.6 18.0 16.3 79.7
The time series of abundance, biomass, diversity, and evenness show that there is a great
fluctuation over time for all the metrics of benthic biological response (Fig. 3). The benthic
abundances in Rincon Bayou are high (Fig. 3A), but the biomass (Fig. 3B), diversity (Fig. 3C)
and evenness (Fig. 3D) values are low (Table 5).

9
A)
B)
Figure 3. Time series data at Station C with salinity as black line. A) Abundance, B) Biomass, C)
Diversity, D) Evenness.

10
C)
D)
Figure 3. Continued. Time series data at Station C with salinity as a black line. A) Abundance, B)
Biomass, C) Diversity, D) Evenness.
11
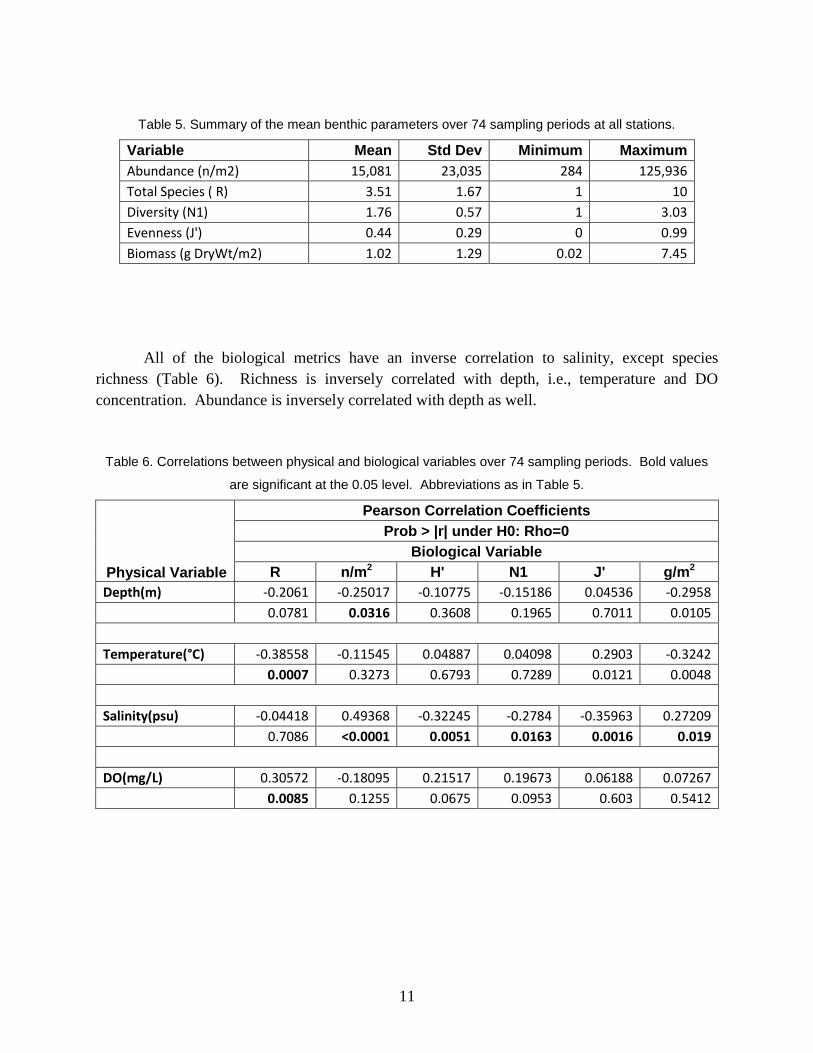
Table 5. Summary of the mean benthic parameters over 74 sampling periods at all stations.
Variable Mean Std Dev Minimum Maximum
Abundance (n/m2) 15,081 23,035 284 125,936
Total Species ( R) 3.51 1.67 1 10
Diversity (N1) 1.76 0.57 1 3.03
Evenness (J') 0.44 0.29 0 0.99
Biomass (g DryWt/m2) 1.02 1.29 0.02 7.45
All of the biological metrics have an inverse correlation to salinity, except species
richness (Table 6). Richness is inversely correlated with depth, i.e., temperature and DO
concentration. Abundance is inversely correlated with depth as well.
Table 6. Correlations between physical and biological variables over 74 sampling periods. Bold values
are significant at the 0.05 level. Abbreviations as in Table 5.
Physical Variable
Pearson Correlation Coefficients
Prob > |r| under H0: Rho=0
Biological Variable
R n/m2 H' N1 J' g/m2
Depth(m) -0.2061 -0.25017 -0.10775 -0.15186 0.04536 -0.2958
0.0781 0.0316 0.3608 0.1965 0.7011 0.0105
Temperature(°C) -0.38558 -0.11545 0.04887 0.04098 0.2903 -0.3242
0.0007 0.3273 0.6793 0.7289 0.0121 0.0048
Salinity(psu) -0.04418 0.49368 -0.32245 -0.2784 -0.35963 0.27209
0.7086 <0.0001 0.0051 0.0163 0.0016 0.019
DO(mg/L) 0.30572 -0.18095 0.21517 0.19673 0.06188 0.07267
0.0085 0.1255 0.0675 0.0953 0.603 0.5412

12
Community structure at station C changed over time (Fig. 4). Community structure is
similar to the 60 level in most of the years, such as 2009, 2013, 2014, and 2015. These were
predominantly high salinity years (Fig. 2). When abrupt salinity changes occur there is abrupt
community structure change, such as between August (symbol lower left) and September
(symbol upper right) when salinity decreased by 44.8 psu. The year 2015 is the most variable
because symbols are scattered over the entire MDS space. The spring 2015 is largely in the
lower right, the summer moves to the center, the fall moves to the top.
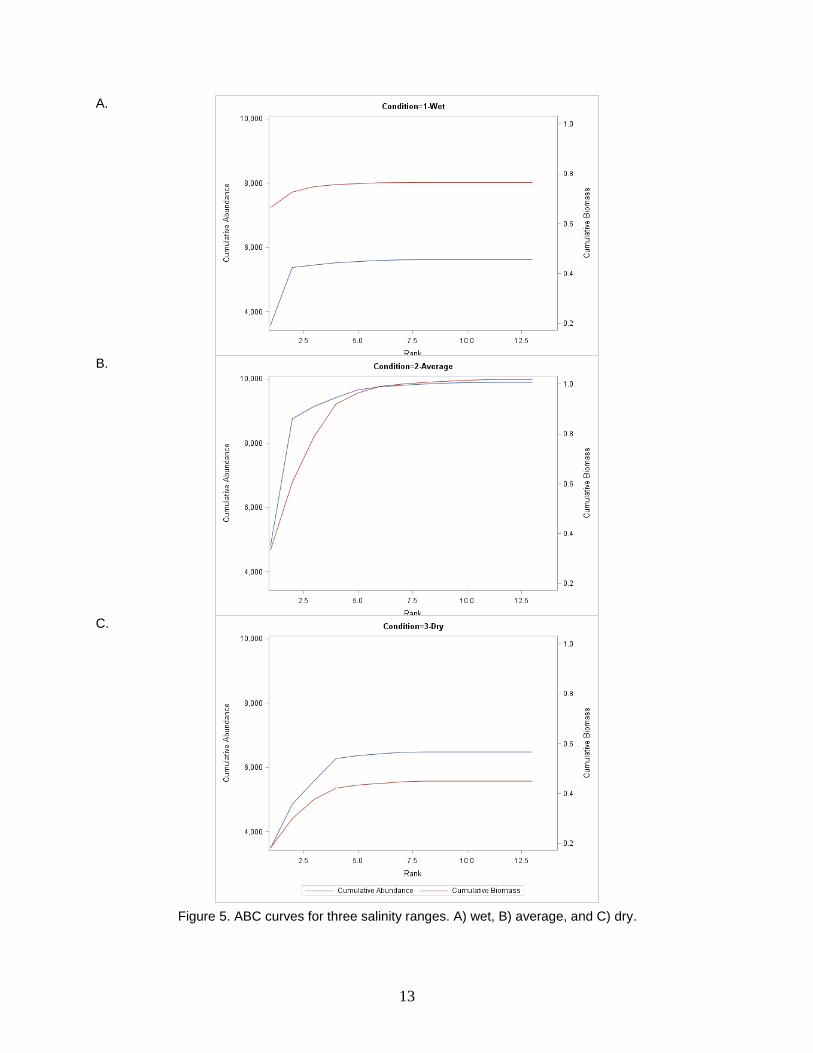
The ABC method was applied to three salinity groups, which roughly correlate to dry,
average, and wet periods (Table 4). In low salinity or wet conditions, abundance levels are
higher than biomass (Fig. 4). In average, midrange salinity, conditions both abundance and
biomass are high. Dry, high salinity, conditions appear to mirror wet conditions with much
higher abundance than biomass.
Non-metric MDSTransform: Square root
Resemblance: S17 Bray-Curtis similarity
Similarity40
60
Year2009
2010
2011
2012
2013
2014
2015
1 2
34
5
6
7
8
9
1011
12
1
23
4
4
5
566
7
810
1
4
10 1
47
10
14
7
1010
11
1112
12
1
112
2
3
3
4
4
5
6 6
6
7
78 8
9
9
10
10
11
11
1212
11
2
2 33
3
4
4
2D Stress: 0.11
Figure 4. Multidimensional scaling plot of community structure change over time at station C. Symbol
labels are months.
13
A. B. C.
Figure 5. ABC curves for three salinity ranges. A) wet, B) average, and C) dry.
14
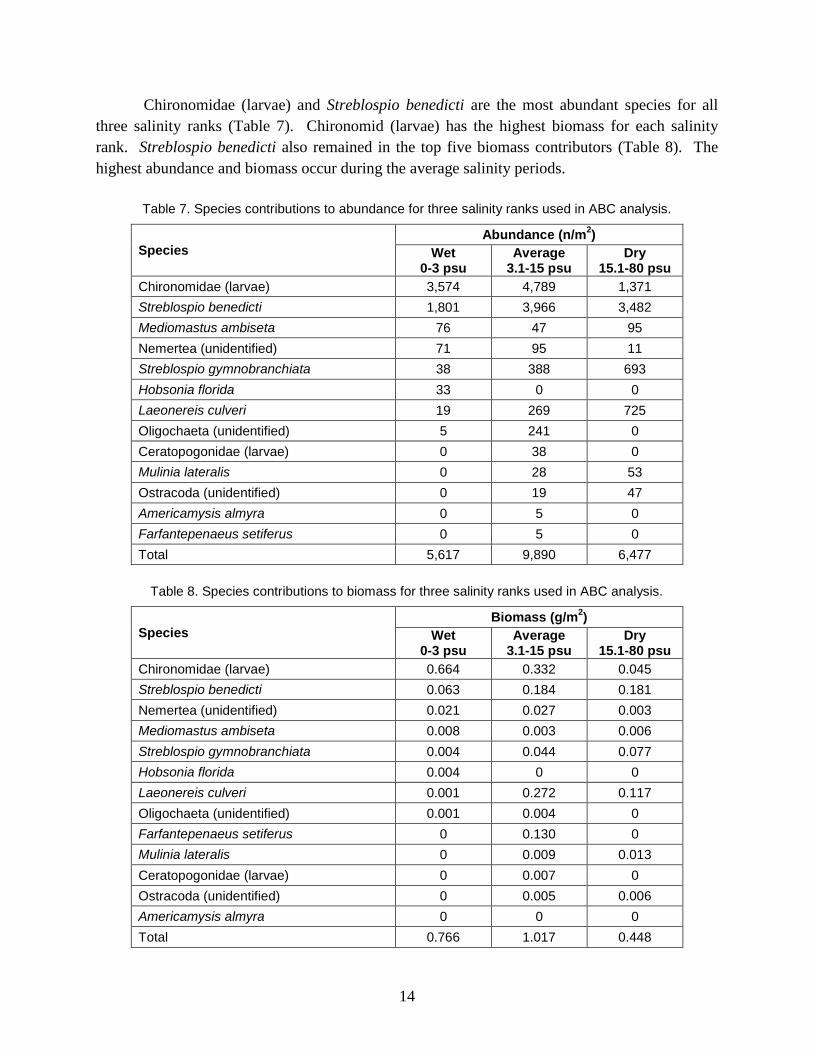
Chironomidae (larvae) and Streblospio benedicti are the most abundant species for all
three salinity ranks (Table 7). Chironomid (larvae) has the highest biomass for each salinity
rank. Streblospio benedicti also remained in the top five biomass contributors (Table 8). The
highest abundance and biomass occur during the average salinity periods.
Table 7. Species contributions to abundance for three salinity ranks used in ABC analysis.
Species
Abundance (n/m2)
Wet 0-3 psu
Average 3.1-15 psu
Dry 15.1-80 psu
Chironomidae (larvae) 3,574 4,789 1,371
Streblospio benedicti 1,801 3,966 3,482
Mediomastus ambiseta 76 47 95
Nemertea (unidentified) 71 95 11
Streblospio gymnobranchiata 38 388 693
Hobsonia florida 33 0 0
Laeonereis culveri 19 269 725
Oligochaeta (unidentified) 5 241 0
Ceratopogonidae (larvae) 0 38 0
Mulinia lateralis 0 28 53
Ostracoda (unidentified) 0 19 47
Americamysis almyra 0 5 0
Farfantepenaeus setiferus 0 5 0
Total 5,617 9,890 6,477
Table 8. Species contributions to biomass for three salinity ranks used in ABC analysis.
Species
Biomass (g/m2)
Wet 0-3 psu
Average 3.1-15 psu
Dry 15.1-80 psu
Chironomidae (larvae) 0.664 0.332 0.045
Streblospio benedicti 0.063 0.184 0.181
Nemertea (unidentified) 0.021 0.027 0.003
Mediomastus ambiseta 0.008 0.003 0.006
Streblospio gymnobranchiata 0.004 0.044 0.077
Hobsonia florida 0.004 0 0
Laeonereis culveri 0.001 0.272 0.117
Oligochaeta (unidentified) 0.001 0.004 0
Farfantepenaeus setiferus 0 0.130 0
Mulinia lateralis 0 0.009 0.013
Ceratopogonidae (larvae) 0 0.007 0
Ostracoda (unidentified) 0 0.005 0.006
Americamysis almyra 0 0 0
Total 0.766 1.017 0.448

15
Discussion
Disturbance and stress events can cause changes in the diversity of existent communities
(Menge & Sutherland 1987). By changing the species composition of a community, the
ecological diversity and functionality of a system can be affected. Organisms have a specific
range of conditions in which they can be successful, surviving and reproducing; as
environmental parameters change only some organisms will survive. Natural and anthropogenic
events can result in physical and/or physiological disturbance or stress. Systems can be affected
by more than one disturbance and/or stress at a time, or sequentially, or by one disturbance or
stress in succession (McFarland et al. 2013). Multiple disturbances or stresses can complicate
the effects beyond that of a single stressor. In Rincon Bayou, salinity fluctuations were seen
throughout the duration of the study period. Salinity variance has been characterized as a
disturbance in Texas estuaries (Van Diggelin, 2014), so the wide range of salinity observed in
the current study is possibly causing a disturbance within the benthic macrofaunal community.
Organisms that are mobile (i.e., mobile epifauna, nekton, and plankton) are likely to migrate
from the area resulting in a lower diversity following a disturbance. Sessile organisms and
infauna, unable to leave the affected area, remain. Sessile organisms will suffer severe mortality
if they are not adapted to a sufficiently broad range of salinity conditions to survive. Their
inability to retreat from the disturbance puts sessile organisms at a higher risk of being affected
by a disturbance event (Menge & Sutherland 1987).
Benthic invertebrates have been used as indicators of estuarine health in the Texas
Coastal Bend area for over two decades (Mannino and Montagna 1997, Kim and Montagna
2009, Montagna and Palmer 2011, Palmer et al. 2011, Pollack et al. 2011). Numerous studies
have shown benthic invertebrates are ideal indicators of freshwater inflow effects because of
their sessile nature (Kalke and Montagna, 1991; Montagna and Yoon, 1991; Montagna and
Kalke, 1992). Benthic macrofaunal communities respond to long term hydrological cycles (e.g.
droughts) with reduced integrity just as they respond to reduced freshwater inflow on shorter
time scales (MacKay et al., 2010; Palmer et al., 2011, Palmer and Montagna 2015).
Reduced diversity and an increase in smaller pioneering species is an indicator of early
stages of disturbance (Rhoades et al. 1976, Pearson and Rosenberg and 1978). Thus one would
expect that a graphical representation where species rank (i.e., dominance) is related to high
biomass would also represent the early stages of succession, and this is what the abundance,
biomass comparison (ABC) method attempts to portray (Clarke and Warwick 1994). The ABC
graph is a combination of two k-dominance curves, biomass and abundance, in which the log of
species rank is plotted against cumulative ranked abundance or biomass, expressed as a
percentage of the total abundance or biomass. The ABC method, therefore, provides a greater
depth of understanding than a simple diversity index by retaining species specific data (Clarke
1987). In the current study, the ABC plots showed higher abundance than biomass at both low
and high salinity ranges indicating the presence of pioneer species (Fig. 6) (Warwick 1986).
Species contributions to both biomass and abundance indicate two known pioneer species,
16
Streblospio benedicti and Chironomid (larvae). While Chironomids dominate Station C during
low and average salinity periods, S. benedicti dominates during average and high salinity
periods. These are the same pioneer species seen in other studies of inflow restoration to Rincon
Bayou (Palmer 2002, Ritter et al. 2005).
While the ABC method can be helpful in clarifying diversity data, it cannot be relied
upon as the sole analysis. Dominance curves rely heavily on the ranking of the most dominant
species and may fail to accurately represent secondary and succeeding dominant species. An
example of this can be seen in Table 5 and Table 6 where the dominant species do not match
between abundance and biomass. Other computations, such as those suggested by Clarke
(1990), are available to correct such oversights. However, because the total number of species in
Rincon Bayou is so low, all the species were used in the ABC analyses presented here.
Areas affected by high frequencies of disturbance are likely to have low diversity as a
result of being consistently dominated by pioneer species (Sousa 1979, Ritter et al. 2005,
McFarland et al. 2013, Teuber et al. 2013). The Intermediate Disturbance Hypothesis (IDH)
predicts the effects of disturbance frequency on system will be a bell-like curve where species
diversity changes with differing frequencies of disturbance (Teuber et al. 2013, Sousa 1979). It
has been shown that frequent salinity disturbances in Rincon Bayou caused domination by
pioneer species, Streblospio benedicti and Chironomid (larvae), adapted to a wider range of
salinities than other species within the system (Ritter et al. 2005).
The current study proves the usefulness of species specific biomass data in assessing
estuary health. In contrast, past benthic studies in Rincon Bayou assessed biomass by major taxa
only. Future studies should endeavor to create longer time series of biomass data to capture
more interannual variability. This could inform changes to the Rincon Bayou inflow
management and restoration programs.
Recommendation
By Texas law, beneficial inflow means a salinity, nutrient, and sediment loading regime
that adequately maintains an ecologically sound environment in the receiving bay and estuary
system that is necessary for the maintenance of productivity of economically important and
ecologically characteristic sport and estuarine life upon which such fish and shellfish are
dependent (Texas Water Code §11.147(a)). In Rincon Bayou, inflow is partially dependent on
pumped inflows required by the 2001 Agreed Order from the Texas Commission on
Environmental Quality. This agreement requires the city of Corpus Christi to “pass through”
inflows no less than 151,000 acre-feet to the Nueces Estuary each year (TCEQ 1995). However,
monthly inflows required are dependent on season, rainfall, stored levels of the reservoir system,
and salinity levels in Nueces Bay (Montagna et al. 2009). The pump system has been active
since 2009, but it is used during high inflow periods only because that is when pass-throughs are
required. This means that pumped flows in addition to natural flooding enter Rincon Bayou and
lower salinities even further than they would have naturally. It also means that there is no relief
when salinities are high and the fresh water is needed the most. It is clear from this study that

17
the large swings from fresh to hypersaline conditions maintains this habitat in a constant
disturbed state with negative consequences on the community. Therefore we have two
recommendations to ameliorate the disturbed state of the community: 1) pump when salinities
are high, i.e., over 25 psu, and 2) use one pump only to move the fresh water into Rincon Bayou
in a slow trickle rather than a flood. These changes to the pumping paradigm should improve
environmental conditions in Rincon Bayou.
18
Literature Cited
Adams, J.S., and J. Tunnell. 2010. Rincon Bayou salinity monitoring. Final report submitted to
the Coastal Bend Bays & Estuaries Program for project number 0921, Coastal Bend Bays
& Estuaries Program, Publication No. CBBEP-66, 18 pp.
Alpkem Corporation. 1993. Orthophosphate. Alpkem Corporation, Wilsonville, Oregon.
Asquith. W.H., J.G. Mosier, and P.W. Bush. 1997. Status, trends and changes in freshwater
inflows to bay systems in the Corpus Christi Bay National Estuary Program study area
(CBBEP Publication No. CCBNEP-17). Retrieved from
http://www.cbbep.org/publications/virtuallibrary/CC17.pdf .
Clarke, K.R. 1990. Comparisons of dominance curves. Journal of Experimental Marine Biology
and Ecology 138:143-157.
Clarke, K. R., and R.M. Warwick. 1994. Change in marine communities: An approach to
statistical analysis and interpretation. Bournemouth, United Kingdom: National
Environments Research Council, UK.
Connell, J.H., and R.O. Slatyer. 1977. Mechanisms of succession in natural communities and
their role in community stability and organization. American Naturalist 111: 1119–1144.
Diaz, R.J., M. Solan, and R.M. Valente. 2004. A review of approaches for classifying benthic
habitats and evaluating habitat quality. Journal of Environmental Management 73:165–
181.
Eichenberg, T., and J. Archer. 1987. The federal consistency doctrine: Coastal zone management
and “New Federalism.” Ecology Law Quarterly 14:9–68.
Irlbeck, M.J., and G.H. Ward. 2000. Analysis of the historic flow regime of the Nueces River
into the upper Nueces Delta, and of the potential restoration value of the Rincon Bayou
Demonstration Project, Volume II, Appendix B. In Bureau of Reclamation, Concluding
Report: Rincon Bayou Demonstration Project. U.S. Department of the Interior, Bureau of
Reclamation, Austin, Texas.
Kalke, R. D. and P. A. Montagna. 1991. The effect of freshwater inflow on macrobenthos in the
Lavaca River Delta and Upper Lavaca Bay, Texas. Contributions in Marine Science 32:
49–71.
Kim, H., and P.A. Montagna. 2009. Implications of Colorado River (Texas, USA) freshwater
inflow to benthic ecosystem dynamics: a modeling study. Estuarine, Coastal and Shelf
Science 83: 491–504.
MacKay, F., D. Cyrus, and K. L. Russell .2010. Macrobenthic invertebrate responses to
prolonged drought in South Africa’s largest estuarine lake complex. Estuarine, Coastal
and Shelf Science 86: 553–567.
Mannino, A., and P.A. Montagna. 1997. Small-scale spatial variation of macrobenthic
community structure. Estuaries 20: 159-173.

19
McFarland, J.W., M.P. Waldrop, and M. Haw. 2013. Extreme CO2 disturbance and the
resilience of soil microbial communities. Soil Biology & Biochemistry 65: 274-286.
Menge, B.A., and J.P. Sutherland 1987. Community regulation: variation in disturbance,
competition, and predation in relation to environmental stress and recruitment. The
American Naturalist 130: 730-757.
Montagna, P.A, E.M. Hill, and B. Moulton. 2009. Role of science-based and adaptive
management in allocating environmental flows to the Nueces Estuary, Texas, USA. In:
Ecosystems and Sustainable Development VII, Brebbia, C.A. and E. Tiezzi (eds.), 559-
570. Southampton, UK: WIT Press.
Montagna, P. A., and R. D. Kalke. 1992. The effect of freshwater inflow on meiofaunal and
macrofaunal populations in the Guadalupe and Nueces Estuaries, Texas. Estuaries 15:
307–326.
Montagna, P.A., R.D. Kalke, and C. Ritter. 2002. Effect of restored freshwater inflow on
macrofauna and meiofauna in Upper Rincon Bayou, Texas, USA. Estuaries 25: 1436-
1447.
Montagna, P. A., and T. A. Palmer. 2011. Effect of Freshwater Inflow on macrobenthos
productivity in the Guadalupe Estuary. Final report. Texas Water Development Board.
Montagna, P. A. and W. B. Yoon. 1991. The effect of freshwater inflow on meiofaunal
consumption of sediment bacteria and microphytobenthos in San Antonio Bay, Texas,
USA. Estuarine, Coastal and Shelf Science 33:529–547.
Palmer, T.A., P.A. Montagna, and R.D. Kalke. 2002. Downstream effects of restored freshwater
inflow to Rincon Bayou, Nueces Delta, Texas, USA. Estuaries and Coasts 25: 1448-
1456.
Palmer, T.A., and P.A. Montagna. 2015. Impacts of droughts and low flows on estuarine water
quality and benthic fauna. Hydrobiologia 753: 111–129.
Palmer, T.A., P.A. Montagna, J.B. Pollack, R.D. Kalke and H. DeYoe. 2011. The role of
freshwater inflow in lagoons, rivers, and bays. Hydrobiologia 667: 49-67.
Pearson, T.H., and R. Rosenberg. 1978. Macrobenthic succession in relation to organic
enrichment and pollution of the marine environment. Oceanography and Marine Biology
Annual Reviews 16: 229–311.
Pollack, J., T. A. Palmer, P. A. Montagna. 2011. Long-term trends in the response of benthic
macrofauna to climate variability in the Lavaca-Colorado Estuary, Texas. Marine
Ecology Progress Series 436: 67–80.
Rhoads, D.C., McCall, P.L., Yingst, J.Y., 1978. Disturbance and production on the estuarine
seafloor. American Scientist 66: 577– 586.
Ritter, C, P.A. Montagna, and S. Applebaum. 2005. Short-term succession dynamics of
macrobenthos in a salinity-stressed estuary. Journal of Experimental Marine Biology and
Ecology 323: 57-69.
20
SAS Institute Inc. 2010. SAS/GRAPH® 9.2: Statistical Graphics Procedures Guide, Second
Edition. Cary, NC: SAS Institute Inc.
SAS Institute Inc. 2013. SAS/STAT® 13.1 User’s Guide. Cary, NC: SAS Institute Inc.
Van Diggelen, A.D. 2014. Is Salinity Variability a Benthic Disturbance. M.S. Thesis, Texas
A&M University-Corpus Christi. 80 pp.
Ward, G.H., M.J. Irlbeck, and P.A. Montagna. 2002. Experimental river diversion for marsh
enhancement. Estuaries 25: 1416-1425.
Warwick, R. M., 1986. A new method for detecting pollution effects on marine macrobenthic
communities. Marine Biology 92: 551-562.