bernard yannou, romain farel, françois cluzel
TRANSCRIPT

HAL Id: hal-01144434https://hal.archives-ouvertes.fr/hal-01144434
Submitted on 21 Apr 2015
HAL is a multi-disciplinary open accessarchive for the deposit and dissemination of sci-entific research documents, whether they are pub-lished or not. The documents may come fromteaching and research institutions in France orabroad, or from public or private research centers.
L’archive ouverte pluridisciplinaire HAL, estdestinée au dépôt et à la diffusion de documentsscientifiques de niveau recherche, publiés ou non,émanant des établissements d’enseignement et derecherche français ou étrangers, des laboratoirespublics ou privés.
The DSM Value Bucket ToolBernard Yannou, Romain Farel, François Cluzel
To cite this version:Bernard Yannou, Romain Farel, François Cluzel. The DSM Value Bucket Tool. International Con-ference on Research into Design - ICoRD’15, Jan 2015, Bangalore, India. pp.49-61, �10.1007/978-81-322-2229-3_5�. �hal-01144434�

1
The DSM Value Bucket tool
Bernard Yannou1*, Romain Farel2 and François Cluzel1
1 Ecole Centrale Paris, Laboratoire Genie Industriel, Chatenay-Malabry, France
2 Paris Saclay Efficacité Énergétique (PS2E), Saclay, France
Abstract: The Dependency Structure Modelling Value Bucket (DSM-VB) tool is integrated to Radical
Innovation Design (RID) methodology for exploring the front end of innovation in need seeker mode.
The determination of value buckets has been automated by matrix representations of dependencies
between problems or pain points, usage situations and existing solutions. Three matrices are built along
the problem setting stage of a RID process. The first matrix expresses which problems occur during
usage scenarios, the second how much existing solutions cover problems and the third how much
existing solutions are useful in usage situations. Combining these three matrices results in a matrix of
value buckets as being the combinations of important problems occurring during characteristic usage
situations and for which few existing solutions are useful or efficient. This outcome allows to perform
focused creativity workshops and to result in “blue ocean” innovations with high likelihood to be
successful on the market.
Keywords: Radical Innovation Design, RID methodology, front end of innovation, need seeker
innovation, value bucket, dependency structure modelling
1 Introduction
The Dependency Structure Modelling Value Bucket (DSM-VB) is a tool integrated in the Radical
Innovation Design (RID) methodology. RID is a structured process for exploring the front end of
innovation in need seeker mode. Indeed, the problem setting stage starts with re-expressing the ideal
need to set the issue playground – for usefully thinking in the box - in which two worlds are addressed:
the world of problems or pain points and the world of situations or usage scenarios. The two spaces –
problems and usage scenarios - are populated with real world situations. For this purpose, some
modeling techniques as causal graph representations and persona method are used. Then, a first “ideal
performances matrix” of the DSM-value-bucket tool allows to cross problems with usage scenarios to
express in which usage situations people are subject to pains. Next, existing design solutions –
commercial solutions or patents - are identified and their coverage of the two spaces is modeled. Here
the DSM-value-bucket tool proposes to represent the coverage effectiveness and efficiency of both
problems and usage scenarios by two appropriate matrices: the Solution-Problem matrix and the Usage-
Solution matrix. Multiplying both matrices allow to come up with the likelihood for the existing solutions
to satisfactorily answer to one problem arising during one usage scenario. Subtracting this matrix with
the “ideal performances matrix” results in a final “value buckets” matrix highlighting which problem is
worthy to be addressed in an innovation project. The last step of the RID problem setting stage is to
select a subset of opportunistic value buckets to further address in the problem solving stage, so as to
ensure to perform radical innovation on “blue ocean” – i.e. not yet explored – usage and problem
situations. The DSM value bucket tool has been successfully applied on more than 20 company
innovation projects for 5 years. In this paper, the DSM value bucket tool is illustrated on the search for
radical innovations for a handitennis wheelchair of a champion. Two important value buckets are
detected as determining to improve the likelihood to win of the champion. It is then showed that creativity
workshops starting from these two value buckets have led to several convincing innovations. The DSM
* Contact author
E-mail: [email protected]

2
value bucket tool opens the way of automating the radical usage-driven innovations along with a
systematic investigation and representation of problems or pain points and usage scenarios.
2 Exploring the front end of innovation
Boston Consulting Group has stipulated that firms follow at least one of three innovation strategies:
Need Seeker, Market Reader, Technology Driver, depending on the focus put on the customer, the
market or the technology. Booz and Company (see [1]) defines them as follow:
Need Seekers, such as Apple (US), Dyson (UK) and Oxylane (France), make a point of
engaging customers directly to generate new ideas. They develop new products and
services based on superior end-user understanding.
Market Readers, such as Hyundai, Caterpillar and Loréal, use a variety of means to generate
ideas by closely monitoring their markets, customers, and competitors, focusing largely on
creating value through incremental innovations.
Technology Drivers, such as Google and Bosch, depend heavily on their internal
technological capabilities to develop new products and services.
After a recent Booz and Company study (see [1]), following a Need Seekers strategy offers the greatest
potential for superior performance in the long term. These companies are effective at both the ideation
and conversion stages of innovation and they consistently outperform financially.
Being predominantly Need Seeker is not easy; it can be made by two ways:
- Using lead-users (see von Hippel [2]), their insightful refreshing ideas and dreams and their
testimonies on usage and pain points. This is the case of Oxylane company in France –sport
equipment and outdoor-.
- Having a visionary leader like Steve Jobs (Apple) or James Dyson (Dyson), the company growth
and the number of product references being limited by the imagination and control power of a
single brain.
There is thus a need for a methodology investigating growth territories or strategic value niches for
generating disruptive innovations beyond current customer expectations and in a cooperative and
multidisciplinary manner and a secure way. After Motte et al [3], it can be done thanks to an adapted
organization and special methodologies and processes. In terms of organization, Millier [4] insists on
the necessity to manage antagonism and balance between exploration and exploitation of new idea
territories. Christensen [5, 6] say with different words that for succeeding disruptive innovations,
companies must not put too much emphasis on customers' current needs, and work on how to adopt
new technologies or business models that will meet customers' unstated or future needs. In terms of
methodology, Christensen [5, 6] proposes the jobs-to-be-done concept and defines it as “a framework
which is a tool for evaluating the circumstances that arise in customers’ lives. Customers rarely make
buying decisions around what the “average” customer in their category may do — but they often buy
things because they find themselves with a problem that they need to solve. With an understanding of
the “job” for which customers find themselves “hiring” a product or service, companies can more
accurately develop and market products well-tailored to what customers are already trying to do.” For
this and other works on innovations, Clayton Christensen has been designated as the most influential
management thinker in the world (see The Washington Post paper [7]). Ulwick [8] has extended it in a
principle of design-outcomes segmentation instead of a conventional a priori customer segmentation.
Inspired by these ideas, Yannou et al [9] and He et al [10] have adapted this user-centered perspective
to model the market demand model in a design engineering platform through the representation of usage
contexts. It has been called the Usage Context Based Design (UCBD). Next, Yannou et al [11] have
proposed the Design by Usage Coverage Simulation principle for evaluating with coverage indicators
how much a new product or product family [12] may cover in a dominant way a number of usage
scenarios characteristics of the targeted user/consumer group. Proceeding that way, they show that
innovative designs may be proved to be dominant –i.e. ranked first because performing better- on a
subspace of usage situations; these designs are then naturally in a “blue ocean” (after Kim and
Mauborgne [13]) which is almost a guaranty of success when launching an innovative offer.
Beyond design analysis, these principles have been applied to be the core principle of an innovation
methodology in need seeker mode, namely Radical Innovation Design® (RID).

3
3 The RID methodology and process
Albert Einstein said “If I had an hour to solve a problem and my life depended on the solution, I would
spend the first 55 minutes determining the proper question to ask, for once I know the proper question,
I could solve the problem in less than five minutes.” Following that maxim, Yannou et al [14] structured
the RID process in two macro stages of problem setting (see Figure 1) and problem solving (see Figure
2). Radical Innovation Design® is a methodology because it is based on 1) structuring principles 2) a
stage-and-gate process (see also [15-17]) very detailed in the early problem setting like Cooper
suggested in [18], 3) a list of 9 expected templated deliverables along the process, 4) two computerized
tools such as the DSM-Value-Bucket tool described in the present paper and the UIPC-monitor tool [19],
5) already several successes in company contexts since after RID innovation projects with 20
companies, several innovations are being to be launched on the market.
The goal of RID methodology is to maximize the potential value creation inside a legitimate design
perimeter called ideal need. RID is a systematic exploration/exploitation process of value creation
opportunities through a series of stages making the inventory of usage situations (or scenarios) and
pain points (or problems) users may live. RID uses at the same time 3 perspectives:
- The perspective of an economist: design is considered as a probabilistic theory of value
creation,
- The perspective of an industrial designer: design starts with the know-how for observing
users – their usages, pain points, needs…- and inventing new usages,
- The perspective of a design engineer: knowing how to measure utilities to create, gather
evidences and bring serious proofs of concept using the most adequate technologies.
Yannou et al showed in [14] that the more the design team completes the successive RID deliverables,
especially in problem setting, the most likely the innovation outcome is to be successfully launched on
the market. To that aim, they use a monitoring with four proofs to consolidate along the design process:
Utility, Innovation, Profitability and Concept, this is the UIPC model described in [20].
The problem setting starts with the reframing of the initial idea submitted by the innovation project
initiator into an ideal need. Let us start with the example of need seeker innovation on the wheelchair of
a handitennis champion – example free of confidentiality rights -. It has been the actual innovation
project initiated by a 22 year old handicapped female student who is nearly ranked 30th in the world
ranking and who wants to win in Rio-2016 Paralympic Games. She came with the initial idea of “to
lighten at most her handitennis wheelchair”. Such a goal would have led to a carbon fiber high tech
wheelchair. Making lighter the wheelchair is not an objective in itself; it has been reframed into the
following ideal need: “to be performing on every tennis point in every game situation.” This ideal need is
a “box perimeter” inside which investigation must be pursued at its extreme limit. Contrarily to most of
people about creativity, the authors do not believe that “thinking outside the box” is the must, but it is
more efficient to “thinking inside the box, providing the box is large enough and well defined.”
Continuing with RID process, two worlds are investigated concurrently within the ideal need perimeter
(see Figure 1):
- The world of problems. It consists in inventorying, quantifying and causally ordering the
miscellaneous pain points, counter-performances, dissatisfactions, needs, that users may
experiment.
- The world of situations. It consists in inventorying, qualifying and sizing the usage situations
that users live and in which problems occur with more or less intensity.
Defining the real world consists in building a causal graph (of problems) and a usage scenarios space
of characteristic usage situations (see Figure 1). Next, as existing solutions may partly cover problems
in usage situations, a covered causality graph and a covered usage scenario spaces are derived from
the careful analysis of the conditions (usage scenarios) and effectiveness/efficiency of service delivery
(problems/pain points more or less relieved). Next, in the final targeting stage of problem setting, a list
of weighed value buckets are derived as being the combinations of important problems occurring during
very characteristic (frequent) usage situations and for which few existing solutions exist or are really
effective/efficient. From this list of value buckets, a perimeter of ambition is defined by the project team,
including a) a subset of relevant value buckets, b) other (problems x usage-situations) currently covered
by existing situations but that consumers consider as “must have”, c) these previous choices being
compatible between them and with the present offer portfolio and customer segmentation of the
company (represented by “business logics” in Figure 1).

4
Figure 1 The problem setting macro-stage of Radical Innovation Design® methodology
Figure 2 The problem solving macro-stage of Radical Innovation Design® methodology
4 Building and covering the causal graph of problems and the usage scenarios space for the handitennis wheelchair
The determination of value buckets has been partly automated by a matrix representation of
dependencies between problems, usage situations and existing solutions and by a computational
mechanism leading to the DSM-Value-Bucket tool. This approach and tool may be affiliated to
Dependency Structure Modelling approaches [21].
In Figure 3, the causal graph is represented as causal paths leading to point loss problem and it is
further graphically covered by four existing solutions. Here, some modeling techniques of causal graph
representations are borrowed from the system dynamics practice (see for instance [22]). For simplicity,
we only retain 4 problems out of 16, namely: time loss (moving), injury of the racquet hand, loss of ball
power and extended tiredness during the match.
In Figure 4, a graphical tessellation of typical usage situations during a match is represented. Proximity
of two usage situations means a high probability of time precedence (or in other cases, proximity of user
types). For simplicity, we only retain 4 usage scenarios out of 8, namely: serve, shot in move, ball
receiving and start moving to hit ball.
Practically, a pre-screening of problems is made and a first version of the causal graph of problems
sketched. Next, the list of typical usage situations is established and for each usage situation an
observation protocol is designed and followed to get a deep understanding of the pains/problems

5
possibly occurring in this usage situation, for measuring them (frequency, repeatability, importance,
consequences) and carrying out a root cause analysis. It goes far beyond the classical personas method
storyboarding usage situations with weak rationale of the situation representativity and no
measurements of pain points. For instance, here, the serve situation has been carefully studied:
gestures have been recorded and analyzed, ball speed has been measured as well as serve accuracy,
ability to serve aces, double faults rate. In addition, it has been observed that a back and forth translation
as well as a rotational twist of the wheelchair occurred during the serve. It is obviously due to the
translational freedom of the four wheels and the rotational freedom of the two caster wheels. An
additional investigation in root causes led to experiment the gains to block the four wheels during serve
(+30% in ball speed) or to only block the rotation of caster wheels (+20% in ball speed).
Figure 3 The covered causality graph for the handitennis wheelchair issue (see Figure 1)
Figure 4 The covered usage scenarios space for the handitennis wheelchair issue (see Figure 1)
5 The DSM Value Bucket mechanics
The determination of value buckets has been automated by matrix representations of dependencies
between problems, usage scenarios and existing solutions. Three matrices A, B and C are built along
the problem setting stage of a RID process described in previous sections. The first matrix A (see Figure
5) expresses which problems occur during usage scenarios, the second matrix B how much existing
6
solutions cover problems and the third matrix C how much existing solutions are useful in usage
situations. Combining these three matrices results in a matrix E of value buckets as being the
combinations of important problems occurring during characteristic usage situations and for which few
existing solutions are useful or efficient.
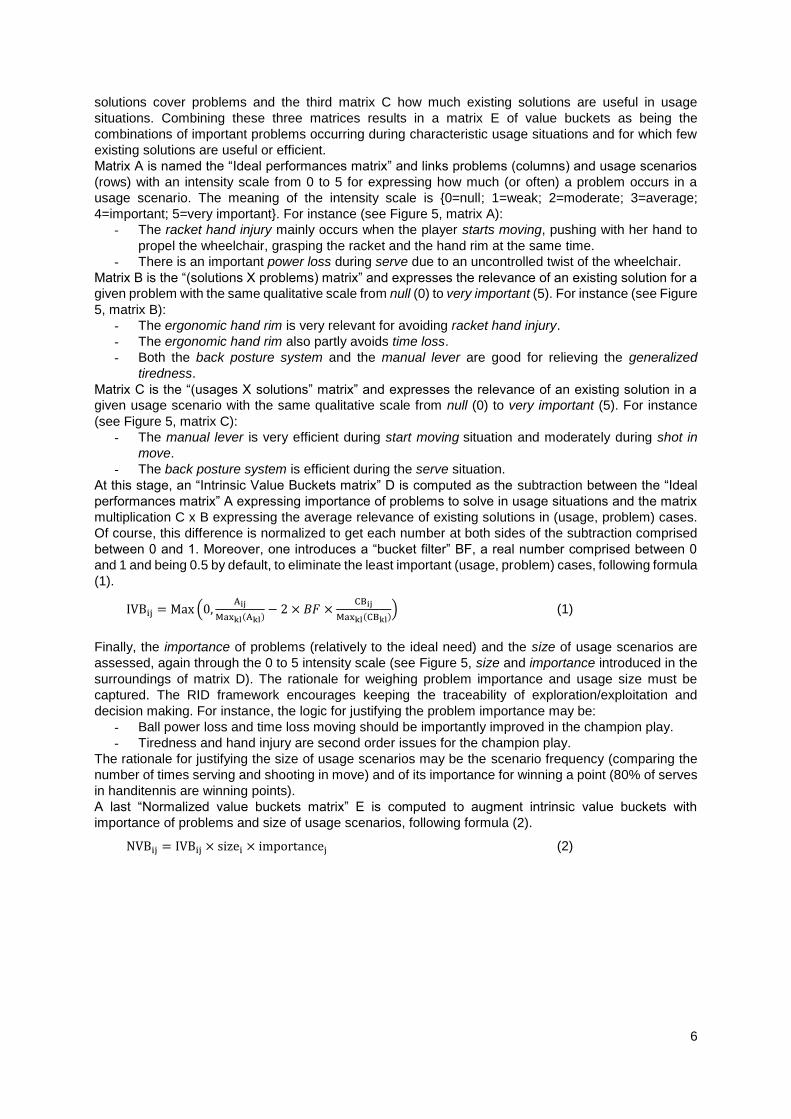
Matrix A is named the “Ideal performances matrix” and links problems (columns) and usage scenarios
(rows) with an intensity scale from 0 to 5 for expressing how much (or often) a problem occurs in a
usage scenario. The meaning of the intensity scale is {0=null; 1=weak; 2=moderate; 3=average;
4=important; 5=very important}. For instance (see Figure 5, matrix A):
- The racket hand injury mainly occurs when the player starts moving, pushing with her hand to
propel the wheelchair, grasping the racket and the hand rim at the same time.
- There is an important power loss during serve due to an uncontrolled twist of the wheelchair.
Matrix B is the “(solutions X problems) matrix” and expresses the relevance of an existing solution for a
given problem with the same qualitative scale from null (0) to very important (5). For instance (see Figure
5, matrix B):
- The ergonomic hand rim is very relevant for avoiding racket hand injury.
- The ergonomic hand rim also partly avoids time loss.
- Both the back posture system and the manual lever are good for relieving the generalized
tiredness.
Matrix C is the “(usages X solutions” matrix” and expresses the relevance of an existing solution in a
given usage scenario with the same qualitative scale from null (0) to very important (5). For instance
(see Figure 5, matrix C):
- The manual lever is very efficient during start moving situation and moderately during shot in
move.
- The back posture system is efficient during the serve situation.
At this stage, an “Intrinsic Value Buckets matrix” D is computed as the subtraction between the “Ideal
performances matrix” A expressing importance of problems to solve in usage situations and the matrix
multiplication C x B expressing the average relevance of existing solutions in (usage, problem) cases.
Of course, this difference is normalized to get each number at both sides of the subtraction comprised
between 0 and 1. Moreover, one introduces a “bucket filter” BF, a real number comprised between 0
and 1 and being 0.5 by default, to eliminate the least important (usage, problem) cases, following formula
(1).
IVBij = Max (0,Aij
Maxkl(Akl)− 2 × 𝐵𝐹 ×
CBij
Maxkl(CBkl)) (1)
Finally, the importance of problems (relatively to the ideal need) and the size of usage scenarios are
assessed, again through the 0 to 5 intensity scale (see Figure 5, size and importance introduced in the
surroundings of matrix D). The rationale for weighing problem importance and usage size must be
captured. The RID framework encourages keeping the traceability of exploration/exploitation and
decision making. For instance, the logic for justifying the problem importance may be:
- Ball power loss and time loss moving should be importantly improved in the champion play.
- Tiredness and hand injury are second order issues for the champion play.
The rationale for justifying the size of usage scenarios may be the scenario frequency (comparing the
number of times serving and shooting in move) and of its importance for winning a point (80% of serves
in handitennis are winning points).
A last “Normalized value buckets matrix” E is computed to augment intrinsic value buckets with
importance of problems and size of usage scenarios, following formula (2).
NVBij = IVBij × sizei × importancej (2)
7
Figure 5 The DSM Value Bucket data streaming and computation mechanics (refer to Figure 1)
Two important value buckets are revealed for the handitennis wheelchair project; their matrix
coordinates are (1,2) and (3,2) (see Figure 5). The designer team is asked to verbally interpret them
and they come up with these natural justifications:
- Value bucket #1 (1,2): The loss of power during serve is partly due to the (observed) wheelchair
twist.
- Value bucket #2 (3,2): The champion player is late on the position for receiving the ball, and
consequently she returns the ball with power loss; this is due to her right hand grasping the
tennis racket and at the same time moving the wheel.
6 Validation and discussion
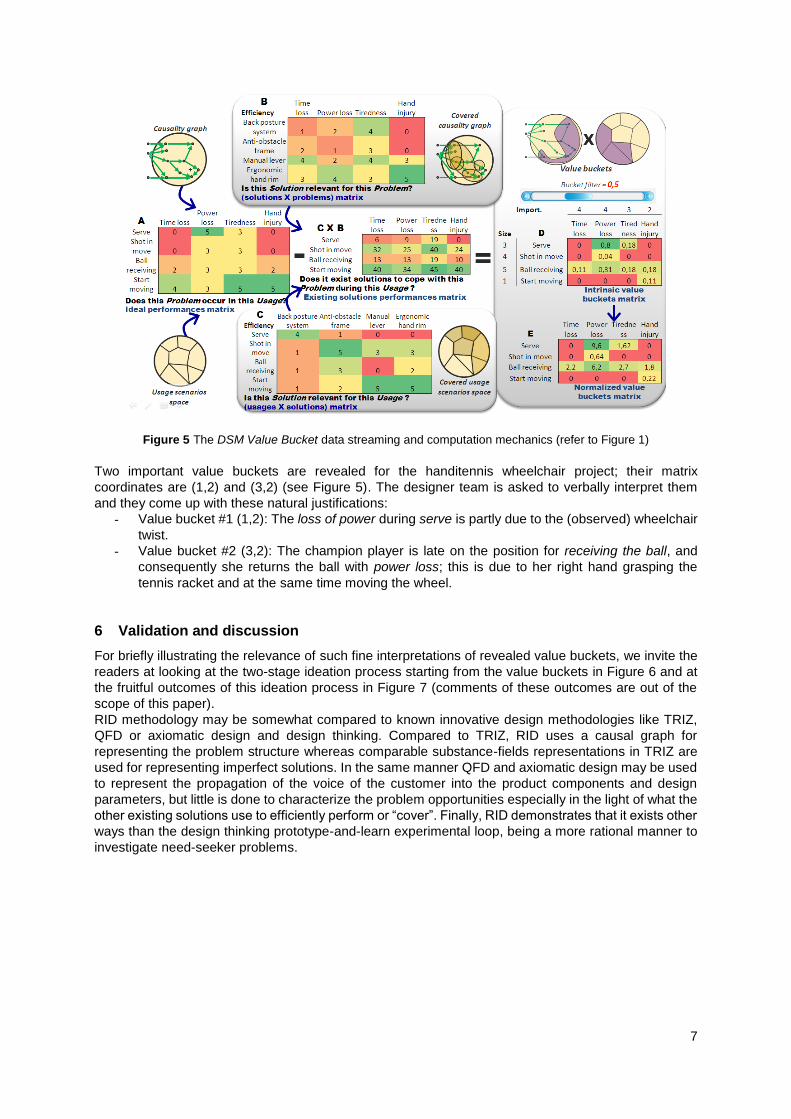
For briefly illustrating the relevance of such fine interpretations of revealed value buckets, we invite the
readers at looking at the two-stage ideation process starting from the value buckets in Figure 6 and at
the fruitful outcomes of this ideation process in Figure 7 (comments of these outcomes are out of the
scope of this paper).
RID methodology may be somewhat compared to known innovative design methodologies like TRIZ,
QFD or axiomatic design and design thinking. Compared to TRIZ, RID uses a causal graph for
representing the problem structure whereas comparable substance-fields representations in TRIZ are
used for representing imperfect solutions. In the same manner QFD and axiomatic design may be used
to represent the propagation of the voice of the customer into the product components and design
parameters, but little is done to characterize the problem opportunities especially in the light of what the
other existing solutions use to efficiently perform or “cover”. Finally, RID demonstrates that it exists other
ways than the design thinking prototype-and-learn experimental loop, being a more rational manner to
investigate need-seeker problems.
8
Figure 6 The two-stage ideation process starting from the value buckets included in the perimeter of ambition
(refer to Figure 2)
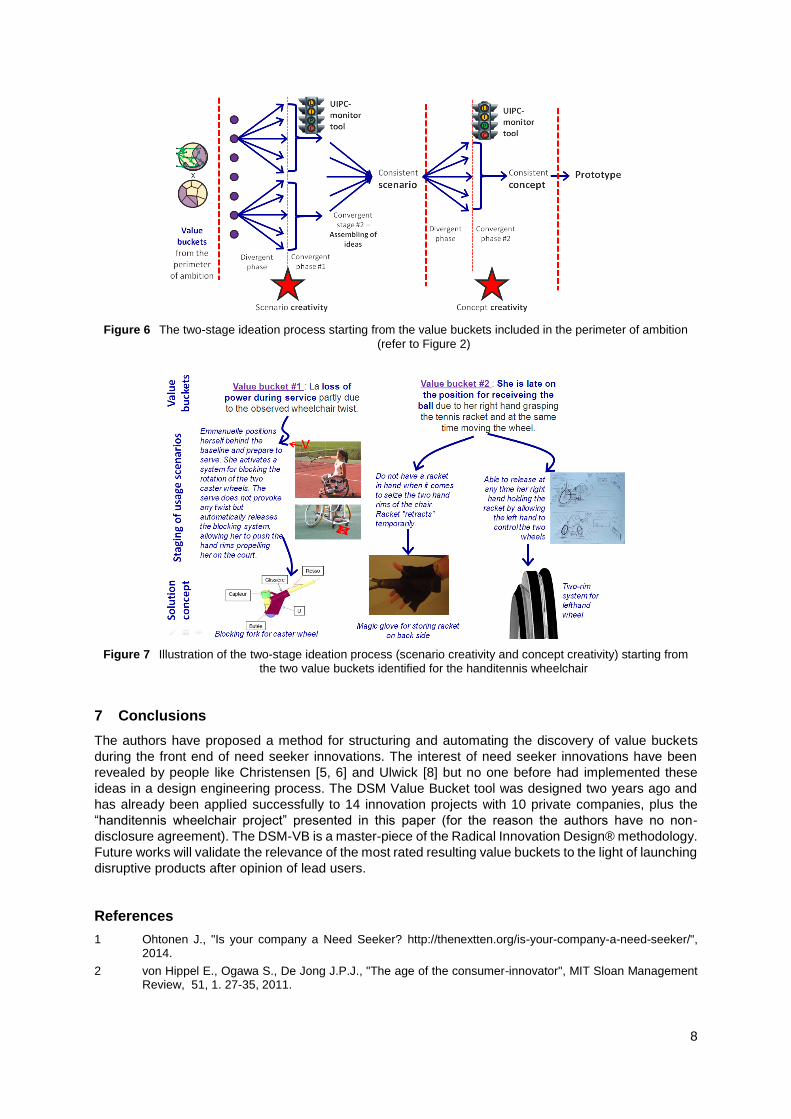
Figure 7 Illustration of the two-stage ideation process (scenario creativity and concept creativity) starting from
the two value buckets identified for the handitennis wheelchair
7 Conclusions
The authors have proposed a method for structuring and automating the discovery of value buckets
during the front end of need seeker innovations. The interest of need seeker innovations have been
revealed by people like Christensen [5, 6] and Ulwick [8] but no one before had implemented these
ideas in a design engineering process. The DSM Value Bucket tool was designed two years ago and
has already been applied successfully to 14 innovation projects with 10 private companies, plus the
“handitennis wheelchair project” presented in this paper (for the reason the authors have no non-
disclosure agreement). The DSM-VB is a master-piece of the Radical Innovation Design® methodology.
Future works will validate the relevance of the most rated resulting value buckets to the light of launching
disruptive products after opinion of lead users.
References
1 Ohtonen J., "Is your company a Need Seeker? http://thenextten.org/is-your-company-a-need-seeker/", 2014.
2 von Hippel E., Ogawa S., De Jong J.P.J., "The age of the consumer-innovator", MIT Sloan Management Review, 51, 1. 27-35, 2011.

9
3 Motte D., Yannou B., Bjärnemo R., "The specificities of radical innovation", Proceedings of ICoRD. Bangalore, India, January 10-12, 2011.
4 Millier P., "Marketing The Unknown: Developing Market Strategies For Technical Innovations", John Wiley&sons, New-York, 1999.
5 Christensen C., "The Innovator's Solution: Creating and Sustaining Successful Growth", Harvard Business School Press, 2003.
6 Christensen C., "The Innovator's Dilemma: The Revolutionary Book That Will Change the Way You Do Business", HarperBusiness, 2011.
7 McGregor J., "The world’s most influential management thinker?, http://www.washingtonpost.com/blogs/on-leadership/wp/2013/11/12/the-worlds-most-influential-management-thinker/", in The Washington Post, 2013.
8 Ulwick A., "What Customers Want: Using Outcome-Driven Innovation to Create Breakthrough Products and Services", McGraw-Hill, 2005.
9 Yannou B., Chen W., Wang J., Hoyle C., Drayer M., Rianantsoa N., Alizon F., Mathieu J.-P., "Usage Coverage Model For Choice Modeling: Principles", IDETC. San Diego, CA, August 30 - September 02, 2009.
10 He L., Chen W., Hoyle C., Yannou B., "Choice modeling for usage context-based design", Journal of Mechanical Design, 134, 3. 2012.
11 Yannou B., Yvars P.-A., Hoyle C., Chen W., "Set-based design by simulation of usage scenario coverage", Journal of Engineering Design, 24, 8. 575-603, 2013.
12 Wang J., Yannou B., Alizon F., Yvars P.-A., "A Usage Coverage-Based Approach for Assessing Product Family Design", Engineering With Computers, 29, 4. 449-465, 2013.
13 Kim C.W., Mauborgne R., "Blue ocean strategy - How to create uncontested market space and make the competition irrelevant", Harvard Business School press, Boston, USA/MA, 2005.
14 Yannou B., Jankovic M., Leroy Y., Okudan Kremer G.E., "Observations from radical innovation projects considering the company context", Journal of Mechanical Design, 135, 2. 2013.
15 Cooper R.G., "A process model for industrial new product development", IEEE Trans Eng Manag, 30, 2-11, 1983.
16 Cooper R.G., "Stage-gate system: A new tool for managing new products", Business Horizons, May-June, 44-55, 1990.
17 Cooper R.G., "Winning at new products: accelerating the process from idea to launch", 3rd edition, Basic Books, Cambridge, 2001.
18 Cooper R.G., "Predevelopment activities determine new product success", Industrial Marketing Management, 17, 237-248, 1988.
19 Yannou B., Farel R., "The UIPC monitor tool", Proceedings of to be submitted to ICDC. Bangalore, India, Jan 12-14, 2015.
20 Yannou B., Zimmer B., Farel R., Jankovic M., Stal Le Cardinal J., "Proofs of Utility, Innovation, Profitability and Concept for innovation selection", ICED, Seoul, Korea, 2013.
21 Eppinger S.D., Browning T.R., "Design Structure Matrix Methods and Applications", MIT Press, Cambridge, 2012.
22 Schaffernicht M., "Causality and diagrams for system dynamics", in 50th International Conference of the System Dynamics Society, Boston, 2007.