bernstein energy drivers of decline rates in mature hydrocarbon
TRANSCRIPT
BernsteinResearch.com European/Russian Oil & Gas – April 2012
Bernstein EnergyDrivers of Decline Rates in Mature Hydrocarbon Basins & The Need for Enhanced Oil Recovery
April 2012
See Disclosure Appendix of this publication for important disclosures and analyst certifications
Oswald Clint PhD, ACASenior Research Analyst
[email protected]+44 20 7959 5089
Iain Pyle, CFA, ACASenior Research Associate
[email protected]+44 20 7170 0564
Rob WestResearch Associate
[email protected]+44 20 7170 0589
Oswald Clint PhD, ACASenior Research Analyst
European Oil & Gas
+ (44) 20 7170 5089
Rob WestResearch Associate
European Oil & Gas
+ (44) 20 7170 0589
BernsteinResearch.com European/Russian Oil & Gas – April 2012
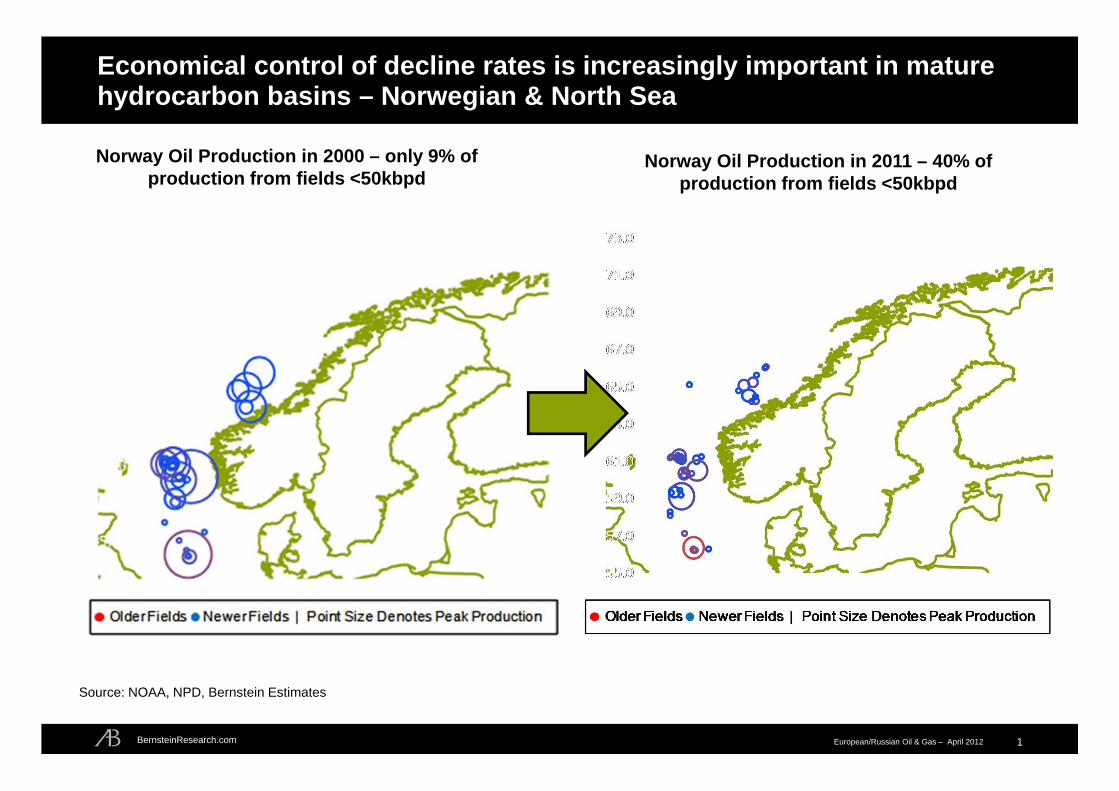
Economical control of decline rates is increasingly important in mature hydrocarbon basins – Norwegian & North Sea
1
Norway Oil Production in 2000 – only 9% of production from fields <50kbpd
Norway Oil Production in 2011 – 40% of production from fields <50kbpd
Source: NOAA, NPD, Bernstein Estimates

BernsteinResearch.com European/Russian Oil & Gas – April 2012
Economical control of decline rates is increasingly important in mature hydrocarbon basins – U.K. North Sea
2
UK North Sea Oil Production in 1995 – only 11% of production from fields <5kbpd
UK North Sea Oil Production in 2011 – 42% of production from fields <5kbpd
Source: NOAA, DECC, Bernstein Estimates

BernsteinResearch.com European/Russian Oil & Gas – April 2012
Median y-o-y changes in production have averaged -12.2% and -9.3% in the UK and Norway, with -21.7% average natural declines in both basins
3
2.4%
-7.6%-12.2%
-24.6%
-12.2%
-20.1%-21.7%
-29.7%
-40%
-30%
-20%
-10%
0%
10%
20%
0% 10% 20% 30% 40% 50% 60% 70% 80% 90% 100%
y-o-
y C
hang
e in
Fie
ld P
rodu
ctio
n (%
)
Percentile
All Data All Declining Fields with No New Wells Drilled Quartiles Mean Average
Benefits arising from field ramp‐up, infrastructure ramp‐up, EOR, reservoir management and new well completions
3.9%
-4.6%-9.3%
-20.4%
-11.0%
-20.4%-21.7% -30.6%
-40%
-30%
-20%
-10%
0%
10%
20%
0% 10% 20% 30% 40% 50% 60% 70% 80% 90% 100%
y-o-
y C
hang
e in
Fie
ld P
rodu
ctio
n (%
)
PercentileAll Data All Declining Fields with No New Wells Drilled Quartiles Mean Average
Benefits arising from field ramp‐up, infrastructure ramp‐up, EOR, reservoir management and new well completions
UK North Sea
•240 oil fields• Monthly production data since first oil in the basin•Median y-o-y change in production = -12.2% • Mean Average Natural decline rates of -21.7%
Norwegian Offshore Sector
•83 oil fields• 3700 development wellbores• Monthly production data since first oil in the basin•Median y-o-y change in production = -9.3% • Mean Average Natural decline rates of -21.7%
Source: NPD, DECC, Bernstein Estimates
UK
Norway
BernsteinResearch.com European/Russian Oil & Gas – April 2012
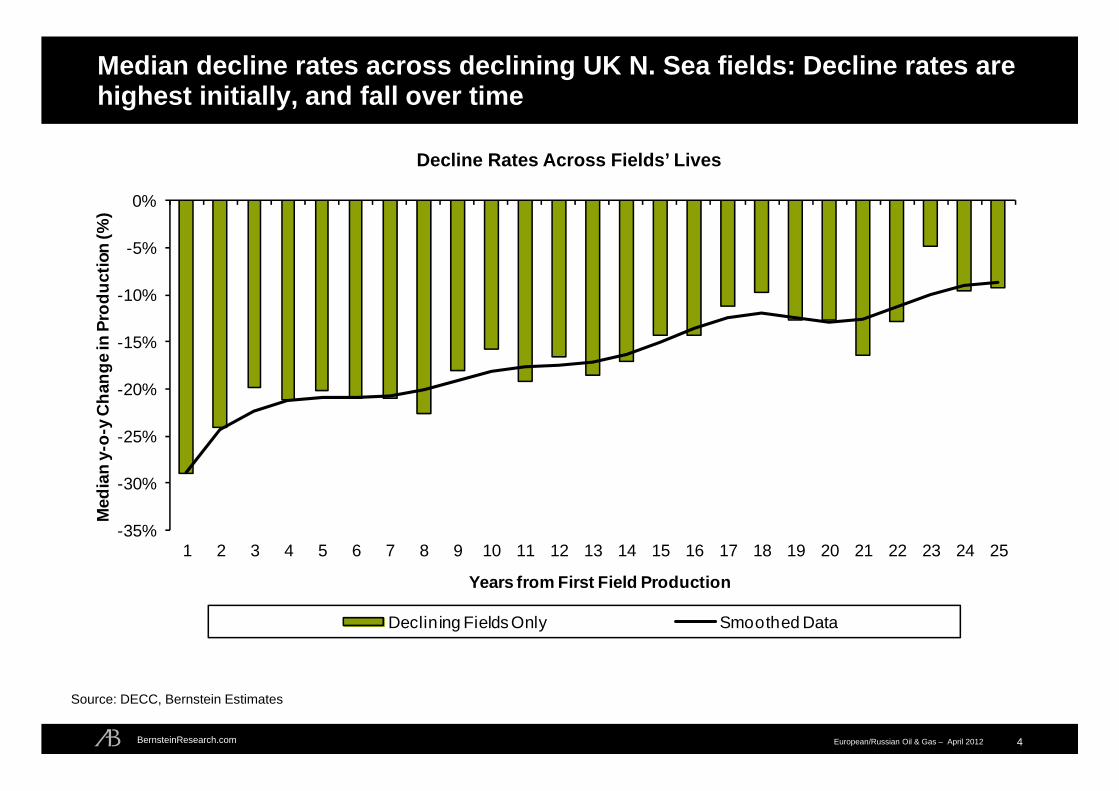
Median decline rates across declining UK N. Sea fields: Decline rates are highest initially, and fall over time
4
Source: DECC, Bernstein Estimates
-35%
-30%
-25%
-20%
-15%
-10%
-5%
0%
1 2 3 4 5 6 7 8 9 10 11 12 13 14 15 16 17 18 19 20 21 22 23 24 25
Med
ian
y-o-
y C
hang
e in
Pro
duct
ion
(%)
Years from First Field Production
Declining Fields Only Smoothed Data
Decline Rates Across Fields’ Lives
BernsteinResearch.com European/Russian Oil & Gas – April 2012
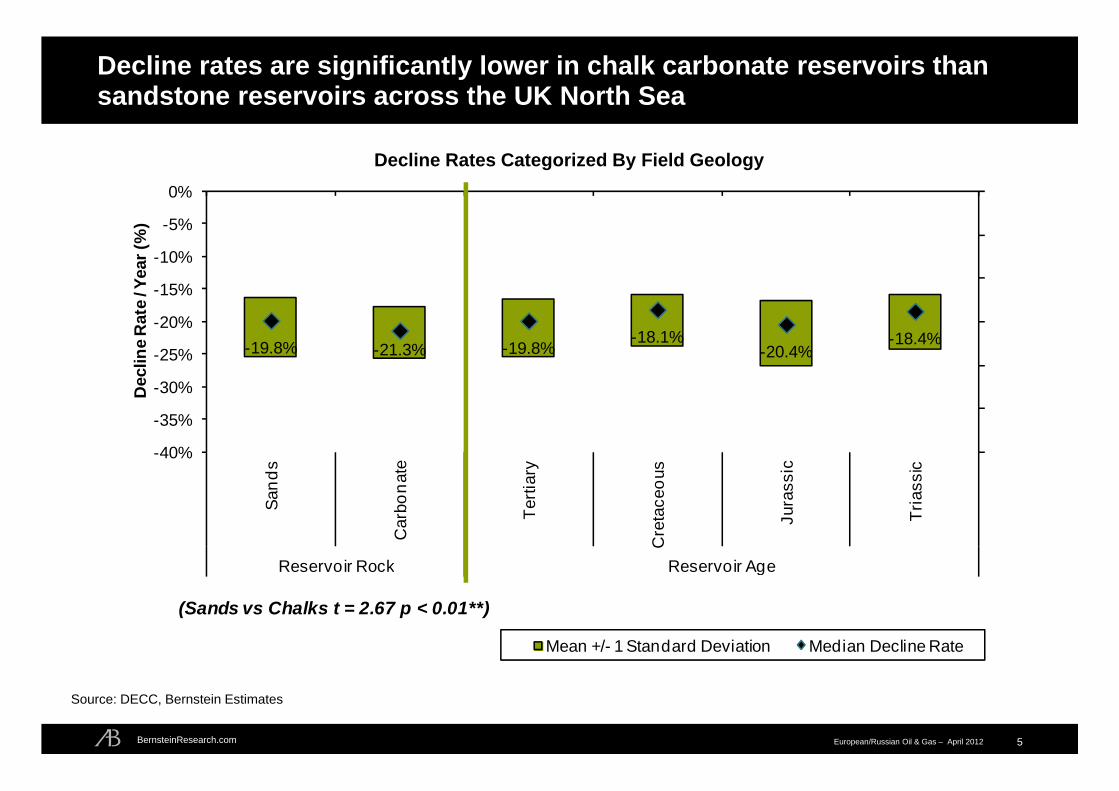
Decline rates are significantly lower in chalk carbonate reservoirs than sandstone reservoirs across the UK North Sea
5
Source: DECC, Bernstein Estimates
-19.8% -21.3% -19.8%-18.1%
-20.4%-18.4%
50%
60%
70%
80%
90%
100%
110%
-40%
-35%
-30%
-25%
-20%
-15%
-10%
-5%
0%
Sand
s
Car
bona
te
Terti
ary
Cre
tace
ous
Jura
ssic
Tria
ssic
Reservoir Rock Reservoir Age
Dec
line
Rat
e / Y
ear (
%)
Mean +/- 1 Standard Deviation Median Decline Rate
(Sands vs Chalks t = 2.67 p < 0.01**)
Decline Rates Categorized By Field Geology

BernsteinResearch.com European/Russian Oil & Gas – April 2012
“Just drill more wells” – the simplest approach to slowing decline rates
6
-15%
-10%
-5%
0%
5%
10%
15%
0 1 2 3 4 5+A
vera
ge O
il P
rodu
ctio
n (A
ll fie
lds,
y-
o-y
%)
New Wells Completed In Calendar Year
-15%
-10%
-5%
0%
5%
10%
15%
0 1 2 3 4 5+
Ave
rage
Cha
nge
in O
il P
rodu
ctio
n
(All
Fiel
ds y
-o-y
%)
New Wells Completed In Calendar YearSource: NPD, DECC, Bernstein Estimates
0
10
20
30
40
50
60
70
80
1985
1987
1989
1991
1993
1995
1997
1999
2001
2003
2005
2007
2009
Cum
ulat
ive
Dev
elop
men
t Wel
ls D
rille
d Pe
r Fie
ld
Norway (All Fields)UK (Oil Fields)
Wells Per Field in Norway & the UK y-o-y production -vs- the number of new production wells completed
UK
Norway
BernsteinResearch.com European/Russian Oil & Gas – April 2012
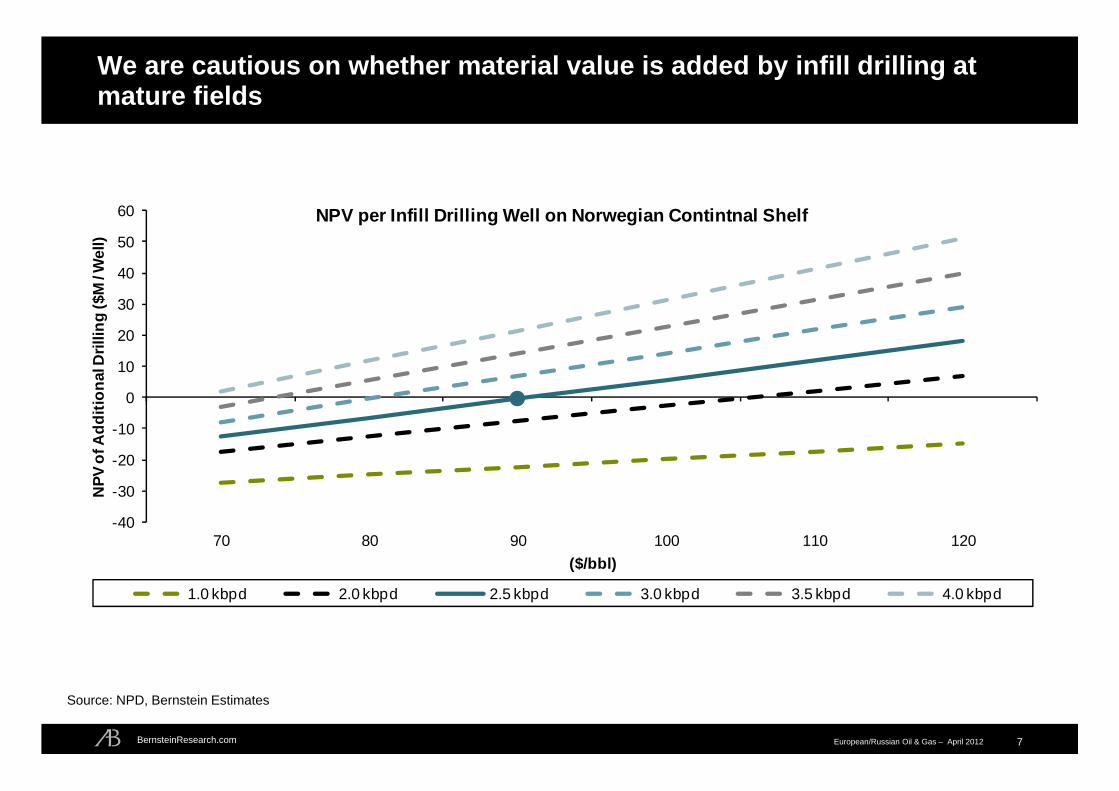
We are cautious on whether material value is added by infill drilling at mature fields
7
-40
-30
-20
-10
0
10
20
30
40
50
60
70 80 90 100 110 120
NPV
of A
dditi
onal
Dril
ling
($M
/ Wel
l)
($/bbl)
NPV per Infill Drilling Well on Norwegian Contintnal Shelf
1.0 kbpd 2.0 kbpd 2.5 kbpd 3.0 kbpd 3.5 kbpd 4.0 kbpd
Source: NPD, Bernstein Estimates
BernsteinResearch.com European/Russian Oil & Gas – April 2012
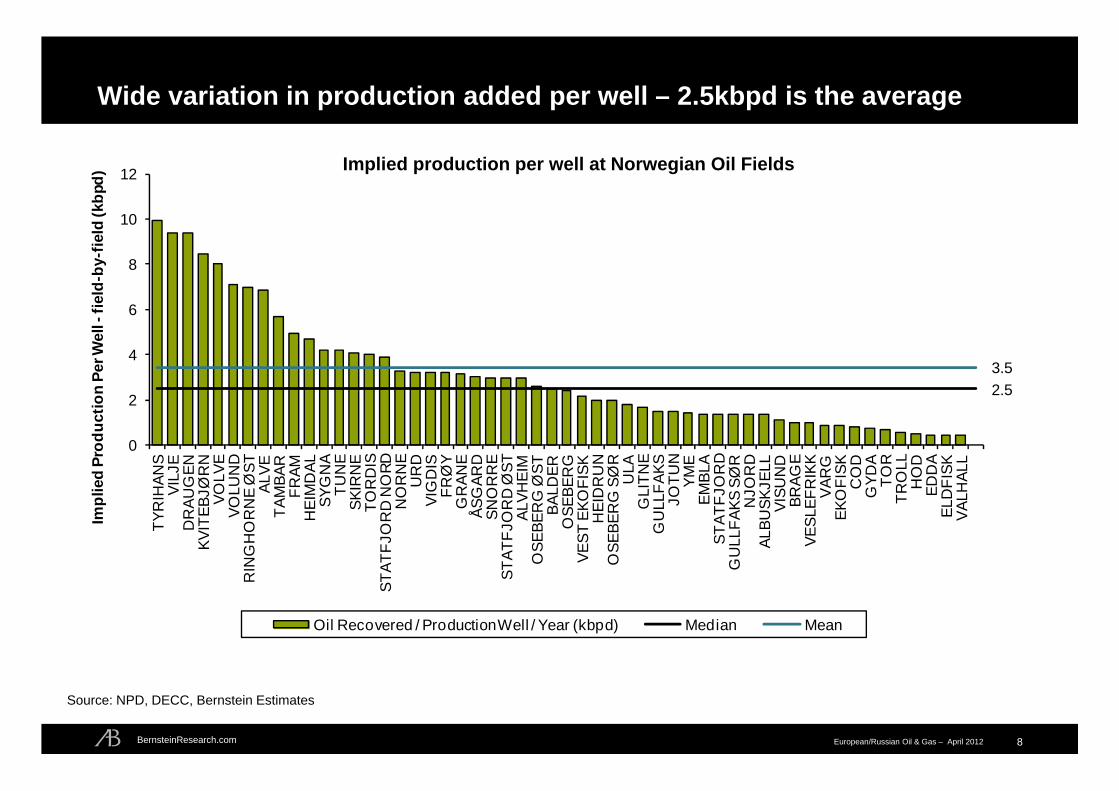
Wide variation in production added per well – 2.5kbpd is the average
8
2.53.5
0
2
4
6
8
10
12TY
RIH
ANS
VILJ
ED
RAU
GEN
KVIT
EBJØ
RN
VOLV
EVO
LUN
DR
ING
HO
RN
E Ø
STAL
VETA
MBA
RFR
AMH
EIM
DAL
SYG
NA
TUN
ESK
IRN
ETO
RD
ISST
ATFJ
OR
D N
ORD
NO
RN
EU
RD
VIG
DIS
FRØ
YG
RAN
EÅS
GAR
DSN
OR
RE
STAT
FJO
RD
ØST
ALVH
EIM
OSE
BER
G Ø
STBA
LDER
OSE
BER
GVE
ST E
KOFI
SKH
EID
RU
NO
SEBE
RG
SØ
RU
LAG
LITN
EG
ULL
FAKS
JOTU
NYM
EEM
BLA
STAT
FJO
RD
GU
LLFA
KS S
ØR
NJO
RD
ALBU
SKJE
LLVI
SUN
DBR
AGE
VESL
EFR
IKK
VAR
GEK
OFI
SKC
OD
GYD
ATO
RTR
OLL
HO
DED
DA
ELD
FISK
VALH
ALL
Impl
ied
Prod
uctio
n Pe
r Wel
l -fie
ld-b
y-fie
ld (k
bpd)
Oil Recovered / Production Well / Year (kbpd) Median Mean
Source: NPD, DECC, Bernstein Estimates
Implied production per well at Norwegian Oil Fields

BernsteinResearch.com European/Russian Oil & Gas – April 2012
The past five years have seen an acceleration in production from smaller fields – how does this change the economics of infill drilling?
9
0%
10%
20%
30%
40%
50%
60%
Jan-85 May-87 Sep-89 Jan-92 May-94 Sep-96 Jan-99 May-01 Sep-03 Jan-06 May-08 Sep-10
Prop
ortio
n of
Pro
duct
ion
From
Fie
lds
Belo
w
Each
Thr
esho
ld
Proportion of Fields Producing Below Threshold Values
60kbpd 50kbpd 40kbpd 30kbpd 20kbpd 10kbpdThreshold:
Source: NPD, Bernstein Estimates

BernsteinResearch.com European/Russian Oil & Gas – April 2012
Reliance on infill drilling increases vulnerability to rising rig rates
10
0
50
100
150
200
250
300
350
400
450
500
0
50
100
150
200
250
1995 1996 1997 1998 1999 2000 2001 2002 2003 2004 2005 2006 2007 2008 2009 2010 2011
Nor
th S
ea R
ig R
ate
(Tho
usan
ds D
olla
rs / D
ay)
Nor
way
-N
umbe
r of D
evel
opm
ent W
ells
Dril
led
Norway Development Wells Drilled Y-o-Y Change in Rig Rate
Norway – New Development Wells Drilled versus Rig Rates
Source: DECC, ODS-Petrodata, Bernstein Estimates

BernsteinResearch.com European/Russian Oil & Gas – April 2012
The difficulty of economical EOR is exacerbated by the UK higher supplementary tax rate - Are Operators Just Shutting Down?
11
0
2
4
6
8
10
12
14
16
18
20
0
2
4
6
8
10
12
14
Jan-96 Oct-97 Jul-99 Apr-01 Jan-03 Oct-04 Jul-06 Apr-08 Jan-10
NB
P G
as P
rice
($/m
cf)
Shut
In +
Shu
t Dow
n C
apac
ity (T
TM, B
cfd)
Capacity Shut Iin Capacity Shut Down Production UK NPNatural Gas Prices ($/mcf)
Source: DECC, Bernstein Estimates
UK North Sea Gas Production, Shut Ins and Shut Downs -vs- the NBP Gas Price

BernsteinResearch.com European/Russian Oil & Gas – April 2012
Injection wells reduce the decline rates at UK and Norwegian fields, with effects well beyond the years they are initially drilled
12
Effect of Injection Wells on Field Decline Rates
-12.5%
-10.8%
-6.3%
-8.6%
-14.0%
-12.0%
-10.0%
-8.0%
-6.0%
-4.0%
-2.0%
0.0%
Norway UK (Water Injection Only)
Med
ian
y-o-
y C
hang
e in
Fie
ld P
rodu
ctio
n (%
)
Fields With No Injection Fields With Injection Wells
Source: NPD, DECC, Bernstein Estimates
BernsteinResearch.com European/Russian Oil & Gas – April 2012
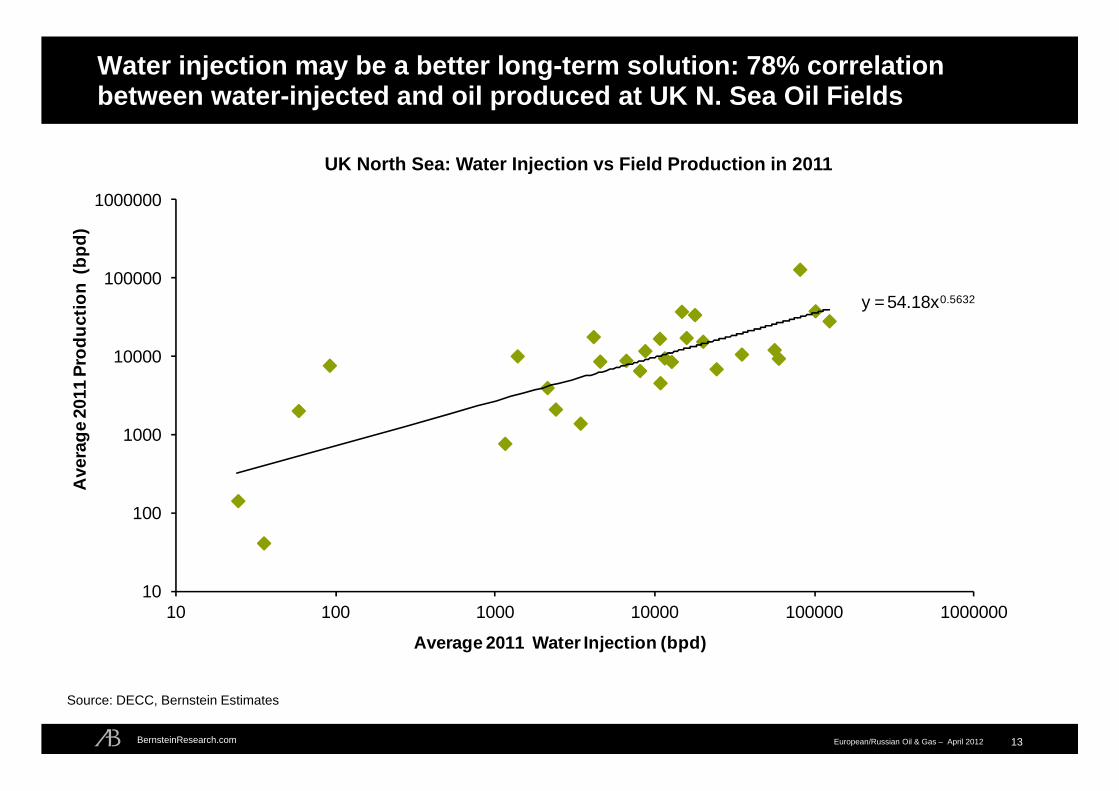
Water injection may be a better long-term solution: 78% correlation between water-injected and oil produced at UK N. Sea Oil Fields
13
y = 54.18x0.5632
10
100
1000
10000
100000
1000000
10 100 1000 10000 100000 1000000
Ave
rage
201
1 Pr
oduc
tion
(bpd
)
Average 2011 Water Injection (bpd)
UK North Sea: Water Injection vs Field Production in 2011
Source: DECC, Bernstein Estimates
BernsteinResearch.com European/Russian Oil & Gas – April 2012
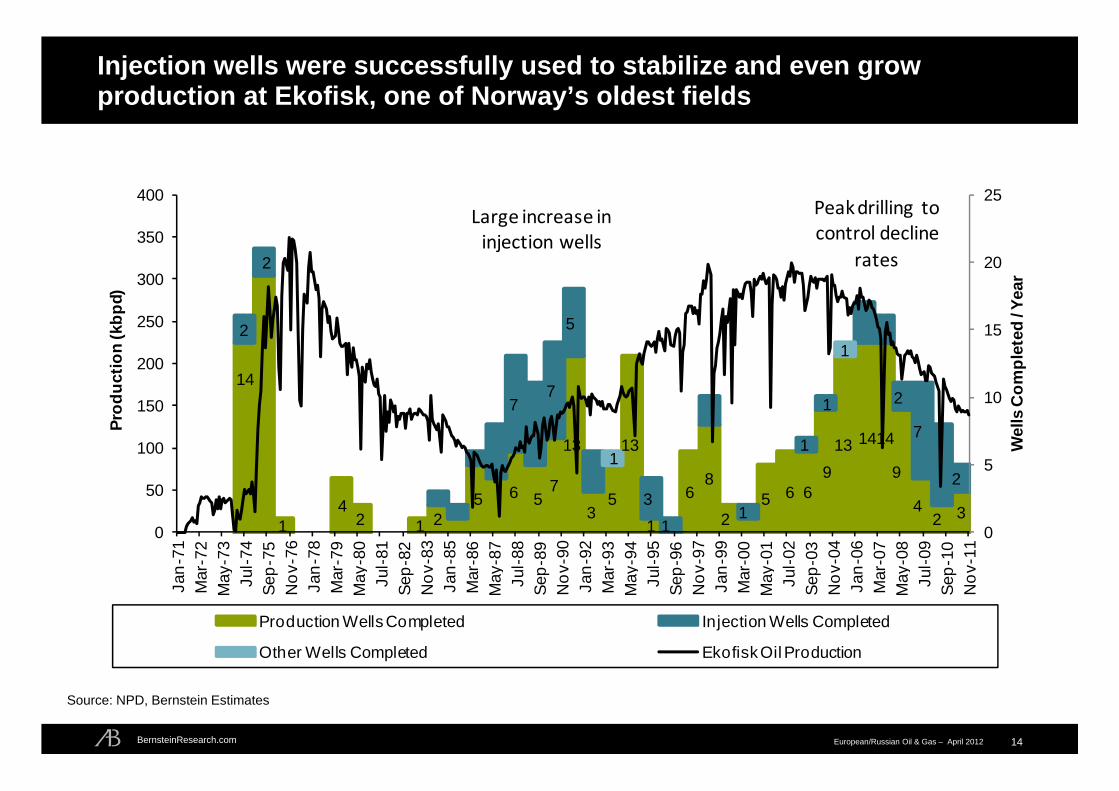
Injection wells were successfully used to stabilize and even grow production at Ekofisk, one of Norway’s oldest fields
14
14
14
2 1 25 6 5
7
13
35
13
1
68
25 6 6
913 1414
9
42 3
2
2
77
5
31
1
1
1 2
7
21
1
0
5
10
15
20
25
0
50
100
150
200
250
300
350
400Ja
n-71
Mar
-72
Ma y
-73
Jul-7
4Se
p-75
Nov
-76
Jan-
78M
ar-7
9M
a y-8
0Ju
l-81
Sep-
82N
ov-8
3Ja
n-85
Mar
-86
Ma y
-87
Jul-8
8Se
p-89
Nov
-90
Jan-
92M
ar-9
3M
a y-9
4Ju
l-95
Sep-
96N
ov-9
7Ja
n-99
Mar
-00
Ma y
-01
Jul-0
2Se
p-03
Nov
-04
Jan-
06M
ar-0
7M
a y-0
8Ju
l-09
Sep-
10N
ov-1
1
Wel
ls C
ompl
eted
/ Yea
r
Prod
uctio
n (k
bpd)
Production Wells Completed Injection Wells Completed
Other Wells Completed Ekofisk Oil Production
Large increase in injection wells
Peak drilling to control decline
rates
Source: NPD, Bernstein Estimates

BernsteinResearch.com European/Russian Oil & Gas – April 2012
We expect faster oil production declines out to 2016, based on our analysis of decline rates
15
-1,000
-500
0
500
1,000
1,500
2,000
2,500
3,000
3,500
2011 2012 2013 2014 2015 2016 2017 2018
UK
+ N
orw
ay N
orth
Se\
a Pr
oduc
tion
(kbp
d)
New Project Growth Existing Project GrowthNatural Declines SCBIEA DECC + NPDWood Mackenzie (includes Condensate)
UK + Norway Total Oil Production (kbpd)
Source: NPD, IEA, DECC, Company Reports, Wood MacKenzie, Bernstein Estimates
BernsteinResearch.com European/Russian Oil & Gas – April 2012 16
Disclosure Appendix
SRO REQUIRED DISCLOSURES
References to "Bernstein" relate to Sanford C. Bernstein & Co., LLC, Sanford C. Bernstein Limited, and Sanford C. Bernstein, a unit of AllianceBernstein Hong Kong Limited, collectively.
Bernstein analysts are compensated based on aggregate contributions to the research franchise as measured by account penetration, productivity and proactivity of investment ideas. No analysts are compensated based on performance in, or contributions to, generating investment banking revenues.
Bernstein rates stocks based on forecasts of relative performance for the next 6-12 months versus the S&P 500 for stocks listed on the U.S. and Canadian exchanges, versus the MSCI Pan Europe Index for stocks listed on the European exchanges (except for Russian companies), versus the MSCI Emerging Markets Index for Russian companies and stocks listed on emerging markets exchanges outside of the Asia Pacific region, and versus the MSCI Asia Pacific ex-Japan Index for stocks listed on the Asian (ex-Japan) exchanges - unless otherwise specified. We have three categories of ratings:
Outperform: Stock will outpace the market index by more than 15 pp in the year ahead.
Market-Perform: Stock will perform in line with the market index to within +/-15 pp in the year ahead.
Underperform: Stock will trail the performance of the market index by more than 15 pp in the year ahead.
Not Rated: The stock Rating, Target Price and estimates (if any) have been suspended temporarily.
As of 02/03/2011, Bernstein's ratings were distributed as follows: Outperform - 42.9% (1.6% banking clients) ; Market-Perform - 49.4% (1.4% banking clients); Underperform - 7.7% (0.0% banking clients); Not Rated - 0.0% (0.0% banking clients). The numbers in parentheses represent the percentage of companies in each category to whom Bernstein provided investment banking services within the last twelve (12) months.
David Vos maintains a long position in Cadaogan Petroleum (CAD.LN)
Accounts over which Bernstein and/or their affiliates exercise investment discretion own more than 1% of the outstanding common stock of the following companies BG/.LN / BG Group PLC, PMO.LN / Premier Oil PLC, TLW.LN / Tullow Oil PLC, BP / BP PLC, BP/.LN / BP PLC, FP.FP / TotalFinaElf SA, TOT / Total SA, RDS/A / Royal Dutch Shell PLC, RDS/B / Royal Dutch Shell PLC, RDSA.LN / Royal Dutch Shell PLC, RDSA.NA / Royal Dutch Shell PLC, RDSB.LN / Royal Dutch Shell PLC, RDSB.NA / Royal Dutch Shell PLC.
The following companies are or during the past twelve (12) months were clients of Bernstein, which provided non-investment banking-securities related services and received compensation for such services BG/.LN / BG Group PLC, BP / BP PLC, BP/.LN / BP PLC, FP.FP / TotalFinaElf SA, TOT / Total SA.
In the next three (3) months, Bernstein or an affiliate expects to receive or intends to seek compensation for investment banking services from OGZD.LI / Gazprom OAO, LKOD.LI / LUKOIL, ROSN.LI / Rosneft Oil Co, NVTK.LI / NovaTek OAO, SGGD.LI / Surgutneftegaz, BG/.LN / BG Group PLC, CNE.LN / Cairn Energy PLC, GALP.PL / Galp Energia SGPS SA, PMO.LN / Premier Oil PLC, TLW.LN / Tullow Oil PLC, BP / BP PLC, BP/.LN / BP PLC, E / ENI SpA, EAD.FP / European Aeronautic Defense, ENI.IM / ENI SpA, FP.FP / TotalFinaElf SA, TOT / Total SA, RDS/A / Royal Dutch Shell PLC, RDS/B / Royal Dutch Shell PLC, RDSA.LN / Royal Dutch Shell PLC, RDSA.NA / Royal Dutch Shell PLC, RDSB.LN / Royal Dutch Shell PLC, RDSB.NA / Royal Dutch Shell PLC.
This research publication covers six or more companies. For price chart disclosures, please visit www.bernsteinresearch.com, you can also write to either: Sanford C. Bernstein & Co. LLC, Director of Compliance, 1345 Avenue of the Americas, New York, N.Y. 10105 or Sanford C. Bernstein Limited, Director of Compliance, Devonshire House, One Mayfair Place, London W1J 8SB, United Kingdom; or Sanford C. Bernstein, a unit of AllianceBernstein Hong Kong Limited, Director of Compliance, Suite 3401, 34th Floor, One IFC, One Harbour View Street, Central, Hong Kong.

BernsteinResearch.com European/Russian Oil & Gas – April 2012 17
12-Month Rating History as of 02/06/2011
Ticker Rating Changes BG/.LN O (IC) 01/22/09 BP M (IC) 08/03/10 O (DC) 08/02/10 O (RC) 05/10/10 M (RC) 03/03/09 BP/.LN M (IC) 08/03/10 O (DC) 08/02/10 O (RC) 05/10/10 M (RC) 03/03/09 CNE.LN O (IC) 01/22/09 E O (IC) 08/03/10 O (DC) 08/02/10 O (RC) 11/21/08 EAD.FP O (RC) 12/17/09 ENI.IM O (IC) 08/03/10 O (DC) 08/02/10 O (RC) 11/21/08 FP.FP O (IC) 08/03/10 M (DC) 08/02/10 M (RC) 02/16/10 O (IC) 05/30/03 GALP.PL O (RC) 05/26/10 M (IC) 01/22/09 LKOD.LI U (IC) 01/15/09 NVTK.LI O (IC) 01/15/09 OGZD.LI O (RC) 07/16/09 PMO.LN O (RC) 02/19/10 M (IC) 01/22/09 RDS/A O (IC) 08/03/10 O (DC) 08/02/10 O (RC) 02/16/10 M (RC) 03/16/09 RDS/B O (IC) 08/03/10 O (DC) 08/02/10 O (RC) 02/16/10 M (RC) 03/16/09 RDSA.LN O (IC) 08/03/10 O (DC) 08/02/10 O (RC) 02/16/10 M (RC) 03/16/09 RDSA.NA O (IC) 08/03/10 O (DC) 08/02/10 O (RC) 02/16/10 M (RC) 03/16/09 RDSB.LN O (IC) 08/03/10 O (DC) 08/02/10 O (RC) 02/16/10 M (RC) 03/16/09 RDSB.NA O (IC) 08/03/10 O (DC) 08/02/10 O (RC) 02/16/10 M (RC) 03/16/09 ROSN.LI U (IC) 01/15/09 SGGD.LI U (IC) 01/15/09 STL.NO M (IC) 01/22/09 TLW.LN O (IC) 01/22/09 TOT O (IC) 08/03/10 M (DC) 08/02/10 M (RC) 02/16/10 O (IC) 05/30/03 Rating Guide: O - Outperform, M - Market-Perform, U - Underperform, N - Not Rated Rating Actions: IC - Initiated Coverage, DC - Dropped Coverage, RC - Rating Change
OTHER DISCLOSURES
A price movement of a security which may be temporary will not necessarily trigger a recommendation change. Bernstein will advise as and when coverage of securities commences and ceases. Bernstein has no policy or standard as to the frequency of any updates or changes to its coverage policies. Although the definition and application of these methods are based on generally accepted industry practices and models, please note that there is a range of reasonable variations within these models. The application of models typically depends on forecasts of a range of economic variables, which may include, but not limited to, interest rates, exchange rates, earnings, cash flows and risk factors that are subject to uncertainty and also may change over time. Any valuation is dependent upon the subjective opinion of the analysts carrying out this valuation.
This document may not be passed on to any person in the United Kingdom (i) who is a retail client (ii) unless that person or entity qualifies as an authorised person or exempt person within the meaning of section 19 of the UK Financial Services and Markets Act 2000 (the "Act"), or qualifies as a person to whom the financial promotion restriction imposed by the Act does not apply by virtue of the Financial Services and Markets Act 2000 (Financial Promotion) Order 2005, or is a person classified as an "professional client" for the purposes of the Conduct of Business Rules of the Financial Services Authority.
To our readers in the United States: Sanford C. Bernstein & Co., LLC is distributing this publication in the United States and accepts responsibility for its contents. Any U.S. person receiving this publication
BernsteinResearch.com European/Russian Oil & Gas – April 2012
and wishing to effect securities transactions in any security discussed herein should do so only through Sanford C. Bernstein & Co., LLC.
To our readers in the United Kingdom: This publication has been issued or approved for issue in the United Kingdom by Sanford C. Bernstein Limited, authorised and regulated by the Financial Services Authority and located at Devonshire House, 1 Mayfair Place, London W1J 8SB, +44 (0)20-7170-5000.
To our readers in member states of the EEA: This publication is being distributed in the EEA by Sanford C. Bernstein Limited, which is authorised and regulated in the United Kingdom by the Financial Services Authority and holds a passport under the Investment Services Directive.
To our readers in Hong Kong: This publication is being issued in Hong Kong by Sanford C. Bernstein, a unit of AllianceBernstein Hong Kong Limited. AllianceBernstein Hong Kong Limited is regulated by the Hong Kong Securities and Futures Commission.
To our readers in Australia: Sanford C. Bernstein & Co., LLC and Sanford C. Bernstein Limited are exempt from the requirement to hold an Australian financial services licence under the Corporations Act 2001 in respect of the provision of the following financial services to wholesale clients: providing financial product advice; dealing in a financial product; making a market for a financial product; and providing a custodial or depository service.
Sanford C. Bernstein & Co., LLC, Sanford C. Bernstein Limited and AllianceBernstein Hong Kong Limited are regulated by, respectively, the Securities and Exchange Commission under U.S. laws, by the Financial Services Authority under U.K. laws, and by the Hong Kong Securities and Futures Commission under Hong Kong laws, all of which differ from Australian laws.
One or more of the officers, directors, or employees of Sanford C. Bernstein & Co., LLC, Sanford C. Bernstein Limited, Sanford C. Bernstein, a unit of AllianceBernstein Hong Kong Limited, and/or their affiliates may at any time hold, increase or decrease positions in securities of any company mentioned herein.
Bernstein or its affiliates may provide investment management or other services to the pension or profit sharing plans, or employees of any company mentioned herein, and may give advice to others as to investments in such companies. These entities may effect transactions that are similar to or different from those recommended herein.
Bernstein Research Publications are disseminated to our customers through posting on the firm's password protected website, www.bernsteinresearch.com. Additionally, Bernstein Research Publications are available through email, postal mail and commercial research portals. If you wish to alter your current distribution method, please contact your salesperson for details.
Bernstein and/or its affiliates do and seek to do business with companies covered in its research publications. As a result, investors should be aware that Bernstein and/or its affiliates may have a conflict of interest that could affect the objectivity of this publication. Investors should consider this publication as only a single factor in making their investment decisions.
This publication has been published and distributed in accordance with Bernstein's policy for management of conflicts of interest in investment research, a copy of which is available from Sanford C. Bernstein & Co., LLC, Director of Compliance, 1345 Avenue of the Americas, New York, N.Y. 10105, Sanford C. Bernstein Limited, Director of Compliance, Devonshire House, One Mayfair Place, LondonW1J 8SB, United Kingdom, or Sanford C. Bernstein, a unit of AllianceBernstein Hong Kong Limited, Director of Compliance, Suite 3401, 34th Floor, One IFC, One Harbour View Street, Central, Hong Kong.
CERTIFICATIONS
I/(we), Oswald Clint, Ph.D., ACA, Senior Analyst(s)/Analyst(s), certify that all of the views expressed in this publication accurately reflect my/(our) personal views about any and all of the subject securities or issuers and that no part of my/(our) compensation was, is, or will be, directly or indirectly, related to the specific recommendations or views in this publication.
Copyright 2011, Sanford C. Bernstein & Co., LLC, Sanford C. Bernstein Limited, and AllianceBernstein Hong Kong Limited, subsidiaries of AllianceBernstein L.P. ~ 1345 Avenue of the Americas ~ NY, NY 10105 ~ 212/756-4400. All rights reserved.
This publication is not directed to, or intended for distribution to or use by, any person or entity who is a citizen or resident of, or located in any locality, state, country or other jurisdiction where such distribution, publication, availability or use would be contrary to law or regulation or which would subject Bernstein or any of their subsidiaries or affiliates to any registration or licensing requirement within such jurisdiction. This publication is based upon public sources we believe to be reliable, but no representation is made by us that the publication is accurate or complete. We do not undertake to advise you of any change in the reported information or in the opinions herein. This publication was prepared and issued by Bernstein for distribution to eligible counterparties or professional clients. This publication is not an offer to buy or sell any security, and it does not constitute investment, legal or tax advice. The investments referred to herein may not be suitable for you. Investors must make their own investment decisions in consultation with their professional advisors in light of their specific circumstances. The value of investments may fluctuate, and investments that are denominated in foreign currencies may fluctuate in value as a result of exposure to exchange rate movements. Information about past performance of an investment is not necessarily a guide to, indicator of, or assurance of, future performance.