best practice management of risks in projects
DESCRIPTION
Best Practice Management of Risks in ProjectsTRANSCRIPT

BEST PRACTICE MANAGEMENT OF RISK IN PROJECTS – FOR ACES VICTORIA
Presented by Colin Cropley

OUTLINE OF PRESENTATION
Risk Management: what is it and why is it needed?
Effective Risk Management is instigated top down and practised bottom up
Importance of Risk Management Standard
Principles, Management Framework & Process
The Risk Management Process in detail
Problems inherent in Risk Management
Qualitative versus Quantitative Risk Analysis
The case for Integrated Cost & Schedule Risk Analysis (IRA)
Software we have developed to support the methodology:RI2, IRD & IRL
Project Examples of use of IRA22-Jun-11 2Best Practice Management of Risk - ACES Victoria - 21Jun11

INTRODUCTION TO PROJECT RISK MANAGEMENT
Two of the most fundamental uncertainties when proposing a project are how long it will take and how much it will cost
Deterministic methods of planning and estimating do not reveal how likely a project is to be completed within the planned time or cost
There are two different approaches to addressing these basic questions:
Top down – comparisons with other similar projects
Bottom up – sum the uncertain cost and time elements of the project
The top down approach is handled very well by Independent Project Analysis, Inc (IPA) which started in 1987 and has a world database of >13,000 projects from >200 companies. It benchmarks against these.
This presentation is about the bottom up approach using the latest developments in Risk Analysis based on the Monte Carlo method
BUT FIRST, we need to look more generally at Risk Management22-Jun-11 3Best Practice Management of Risk - ACES Victoria - 21Jun11

LESSON ON SUCCESSFUL PROJECT MANAGEMENT
John Bertrand - first successful skipper of an America’s Cup challenger against the New York Yacht Club in 132 years, in 1983.
An engineer who treated the cup challenge as a project
The America’s Cup was a technology competition as well as a yachting match race between 2 nations.
In his book “Born to Win” he asserted that to be successful, you must be able to do something twice – once in your mind and then in reality

OUTCOME OF SUCCESSFUL PROJECT PLANNING: RACE 7 26 SEPTEMBER 1983
THE KEY TO SUCCESSFUL PROJECT MANAGEMENT: DOING IT TWICE
If the project is thoroughly planned, so that it unfolds mostly as it has been visualised, there are few surprises and it is likely to be completed without serious problems
Because projects are almost never completed as they were originally planned, good planning is about visualising what could change and having a response plan to deal with it
This kind of planning is called Risk Management
RISK MANAGEMENT STANDARD – GUIDE TO ENLIGHTENMENT
Australia pioneered the field of Risk Management (apt considering our leading position as the world’s heaviest gamblers)
The first Risk Management Standard in the world was AS/NZS 4360:1995
Further versions brought out in 1999 and 2004
New version released in 2009 was supported by ISO – known as AS/NZS ISO 31000:2009
ISO 31000 is concise and memorable, starting with the definition of risk:Risk is “effect of uncertainty on objectives”
Three elements to ISO 31000:
11 Principles to ensure RM is embedded in decision making of the organisation
RM Framework to integrate with Management Processes of the organisation
RM Process defining the sequence of risk management (same as in AS4360)
RISK ANALYSIS FUNDAMENTAL CONCEPTS
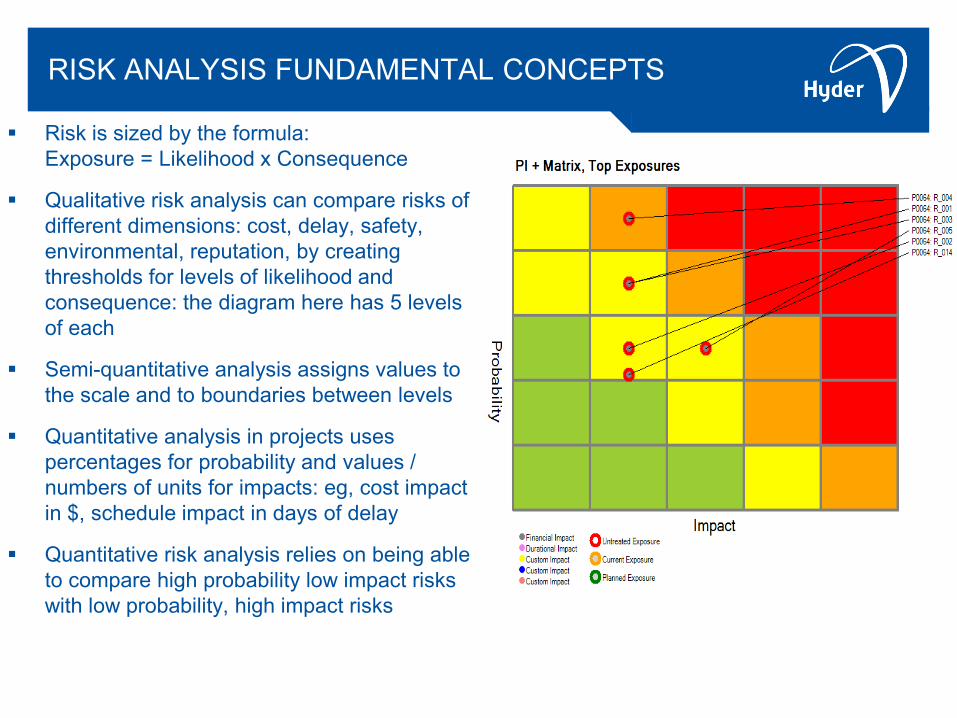
Risk is sized by the formula: Exposure = Likelihood x Consequence
Qualitative risk analysis can compare risks of different dimensions: cost, delay, safety, environmental, reputation, by creating thresholds for levels of likelihood and consequence: the diagram here has 5 levels of each
Semi-quantitative analysis assigns values to the scale and to boundaries between levels
Quantitative analysis in projects uses percentages for probability and values / numbers of units for impacts: eg, cost impact in $, schedule impact in days of delay
Quantitative risk analysis relies on being able to compare high probability low impact risks with low probability, high impact risks

THE STANDARD’S RISK MANAGEMENT PROCESS
The process starts with Setting the Context including importance of the project to the organisation
Risks are identified, analysed and evaluated using qualitative risk analysis (QalRA)
More accurate evaluation can be made using quantitative risk analysis (QnRA), including assessments of the overall effect of the risks on the project
This applies the highest risks to a time &/or cost model of the project
The analysis can help determine if and what further treatments should be applied to the highest risks
RISK ASSESSMENT
IDENTIFY RISKS
ANALYSE RISKS
EVALUATE RISKS
TREAT RISKS
MONITOR
&
REVIEW
ESTABLISH CONTEXT
Process
Defined
In
AS/NZS
ISO 31000:2009
Risk Management
Standard
COMMUNICATE
&
CONSULT
22/06/2011 9Risk Management Seminar Sydney 16Feb11
PROBLEMS WITH RISK MANAGEMENT
There is an intriguing tension in risk analysis and management
Risk is uncertain and is in the future, so we depend on opinions to identify what may happen – an essentially subjective approach
This opens the process to the problem of individual risk attitudes:
Some are risk-tolerant, even risk seeking
Some are risk-intolerant, even risk-averse
Other issues arise from our subjectivity in assessment / rating of risks
We are trying to achieve as objective an outcome as possible in forecasting the project outcome after treatment (mitigation) of risks
We can attempt to minimise personal biases by agreeing thresholds and using groups to “normalise” judgments, but other influences then arise with questions of rank and the loudest voices also potential issues
QUALITATIVE VS. QUANTITATIVE RISK ANALYSIS
Risk Analysis in projects aims to identify and scale risks that could affect the objectives. Mostly this involves Qualitative Risk Analysis (QalRA), which assesses risks individually and ranks them, but cannot measure overall risk
Quantitative Risk Analysis (QnRA) provides numerical estimates of the overall effect of risk on project objectives, usually cost and time, and enables the estimation of contingency reserves (PMI Practice Standard for Project Risk Management)
When risks are quantified, corrective actions can be planned & implemented and key project decisions taken with greater confidence in their realism
22-Jun-11 11Risk Management Seminar Sydney 16Feb11
WHEN IS QNRA USEFUL?
Quantitative risk analysis can be helpful when:
Realistic cost estimates and/or time models (schedules) of the project have been developed
Project time schedules are fully linked and responsive
Comprehensive risk registers have been prepared that include realistic assessments of probabilities and time and cost impacts of the risks
Three point estimates (optimistic, likely and pessimistic) of all uncertain cost and time estimates can be obtained from experienced project stakeholders
<<Quick demonstration>>22/06/2011 12Risk Management Seminar Sydney 16Feb11
WHEN IS QNRA NOT USEFUL?
Where no schedule or cost model exists (yet) Not all risks and uncertainties can be neatly defined
for quantitative analysis: Where projects have stakeholders with conflicting objectives,
risk treatments may involve protracted negotiations and compromises
Solutions may not be optimal, but just “fit for purpose”
Political or other risks may not have quantifiable cost or time impacts
Where organisational and social complexity is high, QalRA may be preferable to resolve differences22/06/2011 13Risk Management Seminar Sydney 16Feb11

WHEN MONTE CARLO METHOD IS THE BEST BET
Major projects usually follow a systematic path:
1. Concept Phase (do we have a viable project idea?)
2. Pre-feasibility Study (which alternatives work best?)
3. Feasibility Study (what is required for best alternative?)
4. Financial closure and commitment to project
5. Execution (of the project and hopefully not the team…)
6. Benefits realisation / production of deliverables
Quantitative tools well suited to these phases are:
Decision Tree Analysis – Phases 2, 3 (early) & perhaps 1
Monte Carlo – Phases 2 to 5 and perhaps 1 22/06/2011 14Risk Management Seminar Sydney 16Feb11
DEVELOPMENT OF MONTE CARLO TOOLS
The Monte Carlo method (MCM) is a mathematical technique for producing random outcomes
Developed out of the Manhattan Project, MCM is applied widely in simulating random events, especially on computers
For QnRA, MCM was used in spreadsheet environments (e.g., @Risk, Crystal Ball) in the 1980s
MCM was applied to the critical path method in the 1990s
Early tools were limited in capabilities and sometimes unstable
Some practitioners recommended small schedule sizes for project modelling due to tool limitations and MCM modelling constraints (independence of variables and central limit theory)
State of the art software largely overcomes these problems22/06/2011 15Risk Management Seminar Sydney 16Feb11

STATE OF THE ART MCM TOOLS: PRA® & RI2™
Pertmaster, a UK-developed project planning application was adapted to be a Monte Carlo based Schedule Risk Analysis (SRA) tool in the late 1990s.
Subsequently bought in 2006 by Primavera Systems, Inc (in turn acquired by Oracle at the beginning of 2009) and renamed Primavera Risk Analysis, PRA has the fastest critical path method engine, coded in Assembler (machine language) which enables it to handle far larger schedules and run the most simulations in the shortest time compared with other tools (e.g., @Risk for Project, Intaver Risky Projects, Predict! Risk Analyzer, ARM)
Its focus has been widened to enable Cost Risk Analysis (CRA) and most importantly, Integrated Cost and Schedule Risk Analysis, using an added Risk Register to map risk events into the cost-loaded schedule
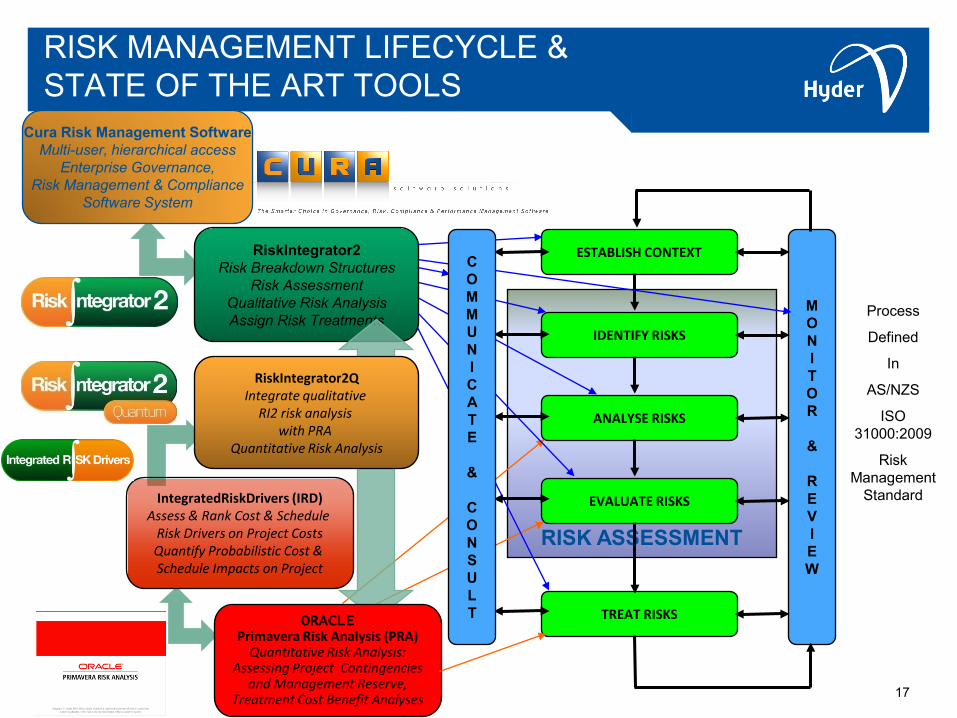
Hyder Risk Management Group has developed its own stand-alone risk management database, RiskIntegrator2, which interfaces with PRA, with more powerful risk mapping capabilities than the PRA Risk Register, plus IntegratedRiskDrivers (IRD), which extends and automates the power of PRA
RI2Q also interfaces with Cura enterprise risk management system enabling QnRA results to be returned to the enterprise risk register, all as shown next:
22-Jun-11 16Risk Management Seminar Sydney 16Feb11
RISK ASSESSMENT
RiskIntegrator2Risk Breakdown Structures
Risk AssessmentQualitative Risk AnalysisAssign Risk Treatments
RISK MANAGEMENT LIFECYCLE & STATE OF THE ART TOOLS
ORACLEPrimavera Risk Analysis (PRA)
Quantitative Risk Analysis:Assessing Project Contingencies
and Management Reserve,Treatment Cost Benefit Analyses
RiskIntegrator2QIntegrate qualitative
RI2 risk analysis with PRA
Quantitative Risk Analysis
IntegratedRiskDrivers (IRD)Assess & Rank Cost & Schedule
Risk Drivers on Project CostsQuantify Probabilistic Cost & Schedule Impacts on Project
IDENTIFY RISKS
ANALYSE RISKS
EVALUATE RISKS
TREAT RISKS
MONITOR
&
REVIEW
ESTABLISH CONTEXT
Process
Defined
In
AS/NZS
ISO 31000:2009
Risk Management
Standard
Cura Risk Management SoftwareMulti-user, hierarchical access
Enterprise Governance,Risk Management & Compliance
Software System
COMMUNICATE
&
CONSULT
17

MCM PROBLEMS & PRA SOLUTIONS: CONVERGENCE
As noted earlier, MCM assumes that every uncertain variable is independent of every other. When working with larger and more detailed schedules, this leads to unrealistically narrow distributions due to the Central Limit Theorem (CLT)
In simple terms, as larger schedules with shorter duration tasks are modelled, the distribution converges toward a normal distribution with narrower range (smaller variance/standard deviation)
The probability density functions and cumulative density functions at right illustrate this. The red curves could represent the “realistic uncertainty” and the blue curves the effect of the CLT
This has serious consequences if a four year project is forecast to have only two weeks difference between P10 and P90 when it should be at least 4 months!
The solution is to fix the false assumption of independent activities by application of correlation: the extent to which groups of tasks are related to each other
22-Jun-11 18Risk Management Seminar Sydney 16Feb11
MCM PROBLEMS & PRA SOLUTIONS: CORRELATION & RISK FACTORS
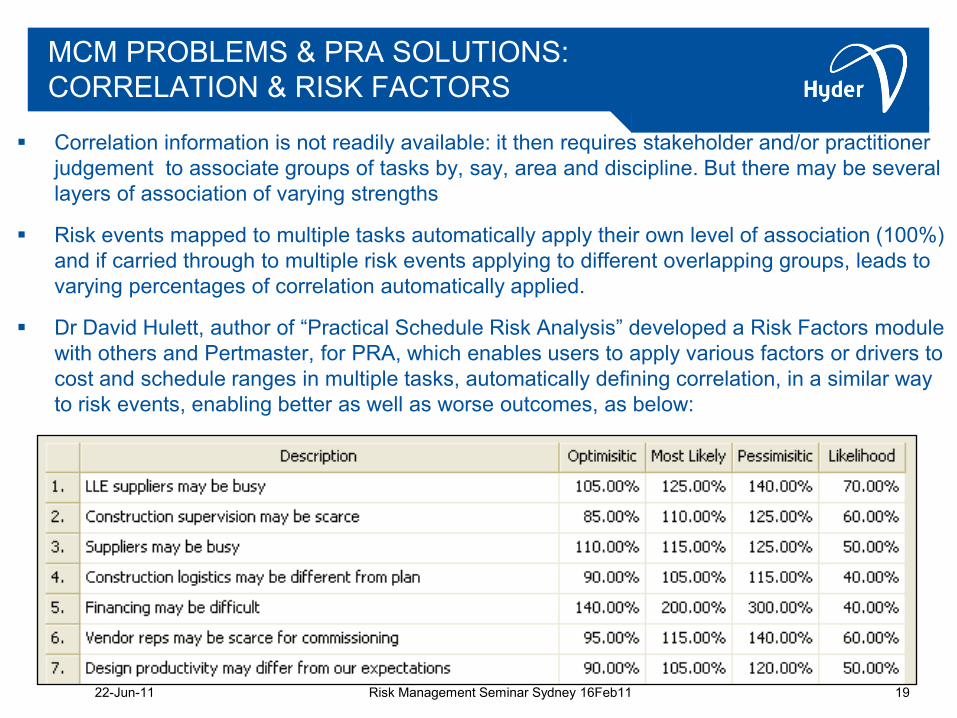
Correlation information is not readily available: it then requires stakeholder and/or practitioner judgement to associate groups of tasks by, say, area and discipline. But there may be several layers of association of varying strengths
Risk events mapped to multiple tasks automatically apply their own level of association (100%) and if carried through to multiple risk events applying to different overlapping groups, leads to varying percentages of correlation automatically applied.
Dr David Hulett, author of “Practical Schedule Risk Analysis” developed a Risk Factors module with others and Pertmaster, for PRA, which enables users to apply various factors or drivers to cost and schedule ranges in multiple tasks, automatically defining correlation, in a similar way to risk events, enabling better as well as worse outcomes, as below:
22-Jun-11 19Risk Management Seminar Sydney 16Feb11
PRA SOLUTIONS: RISK FACTORS & INTEGRATED RISK DRIVERS
There are some problems with the PRA Risk Factors Module:
Risk Factors Module doesn’t socialise well with some other PRA features
Importantly, not all uncertainty and risks can be ascribed to Risk Factors
So estimating & assigning correlation is hard to exclude entirely
Hyder Risk Group is developing its IntegratedRiskDrivers (IRD) applet that works with PRA to do the following:
Rank all contributors to project cost uncertainty, whether cost ranges, duration ranges or risk events, by Multivariate Analysis of Variance (MANOVA)
Automate the analysis of each contributor (including all risk tasks from the one risk event) by removing them and repeating the simulation without them to calculate their probabilistic contributions
Automate the reporting of these22-Jun-11 20Risk Management Seminar Sydney 16Feb11
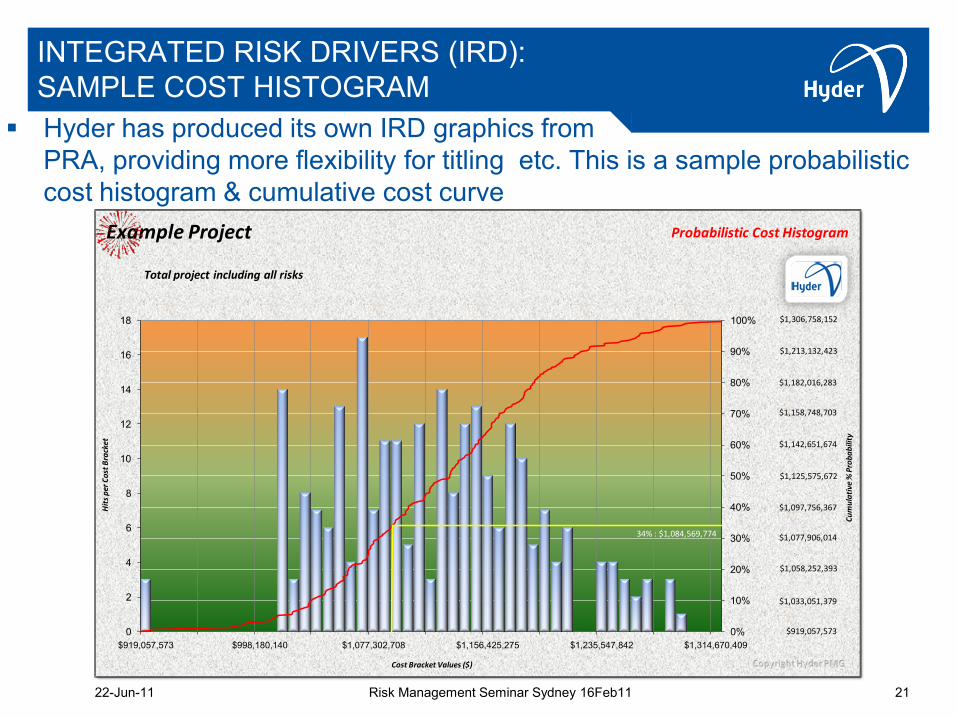
INTEGRATED RISK DRIVERS (IRD):SAMPLE COST HISTOGRAM
Hyder has produced its own IRD graphics from PRA, providing more flexibility for titling etc. This is a sample probabilistic cost histogram & cumulative cost curve
22-Jun-11 21Risk Management Seminar Sydney 16Feb11
0%
10%
20%
30%
40%
50%
60%
70%
80%
90%
100%
0
2
4
6
8
10
12
14
16
18
$919,057,573 $998,180,140 $1,077,302,708 $1,156,425,275 $1,235,547,842 $1,314,670,409
Probabilistic Cost HistogramExample Project
$1,306,758,152
$1,213,132,423
$1,182,016,283
$1,158,748,703
$1,142,651,674
$1,125,575,672
$1,097,756,367
$1,077,906,014
$1,058,252,393
$1,033,051,379
$919,057,573
Total project including all risks
Hit
s pe
r Cos
t Bra
cket
Cost Bracket Values ($)
Cum
ulat
ive
% P
roba
bilit
y
34% : $1,084,569,774

INTEGRATED RISK DRIVERS (IRD): SAMPLE COST SENSITIVITIES VS. CALCULATED COST IMPACTS
This is a sample of back-to-back tornadoes ofcost sensitivities (MANOVA measured rankings of influence on project cost) versus actual calculated probabilistic cost impacts (more fundamental)
22-Jun-11 22Risk Management Seminar Sydney 16Feb11
6.7%
11.2%
8.8%
9.8%
10.2%
17.0%
17.6%
19.6%
20.4%
34.0%
$17,761,332
$22,129,155
$27,338,810
$32,172,754
$37,271,237
$43,985,720
$47,800,124
$51,308,555
$56,322,848
$94,749,468
Risk of loss of materials during transit resulting in schedule delay
Mainline engineering contract
Risk of failure during hydrotesting resulting in replacement of mainline section(s)
Risk that archaeological survey will uncover relics resulting in re-routing of pipeline
Mainline valves material supply
Mainline linepipe material supply
Mainline construction spread cost hammock
Risk that linepipe materials may fail quality tests resulting in extensive rewelding
Risk of industrial disputes over wages resulting in work stoppage during construction period
Risk that mainline spread may be flooded, resulting in equipment damage & delays
Cost Standard Deviation vs. Cost Correlation Tornado
Example Project
Pipeline Engineering / Procurement / Construction Cost Drivers
Cost Correlation Ranking Impact on Standard Deviation of Target Cost
Cost Correlation Ranking Based on MANOVA Technique

PRA SOLUTIONS: AUTOMATING ASSIGNMENT OF COSTS TO TASKS & FIXED / VARIABLE COST SPLITS
Once a working cost-loaded schedule model is developed, the temptation to keep loading revised cost estimates seems to be irresistible, right up to final submission of the Bankable Feasibility Study Report and beyond
In addition, contractual arrangements and changes may change the proportions of costs subject to schedule risk; i.e. ratios of “fixed” (time-independent, but still uncertain) costs to variable (time-dependent and possibly still rate-uncertain) costs
So one of the most valuable productivity enhancers our programmer-risk consultant has done is to create a macro-driven spreadsheet tool for loading revised estimates into a schedule and changing the % splits between fixed and variable costs for individual tasks or groups of tasks
22-Jun-11 23Risk Management Seminar Sydney 16Feb11

CHALLENGES: 1) THE UNKNOWN UNKNOWNS
In the famous words of Donald Rumsfeld “There are things we don’t know we do not know and every year we identify a few more of these”. He could have added “at the expense of some projects somewhere…”
The described QnRA methodology assumes that if we can comprehensively describe the riskiness of a project in time and cost, we will be ready to deal with not just the risks we have identified, but also ones we have not!
This is not just because we will have made adequate time and cost provisions for the reasonably foreseeable risks, but also:
The comprehensive inclusion of risk events represents project riskiness, and:
Through adoption of our ISO 31000 Principles, we will have prepared our management system to be responsive to new risks and issues as they arise
We can certainly say that we will be better prepared to protect our project value than if we had not implemented our risk management system and made our comprehensive cost and schedule risk analysis!
22-Jun-11 24Risk Management Seminar Sydney 16Feb11
CHALLENGES: 2) LOW PROBABILITY HIGH IMPACT RISKS
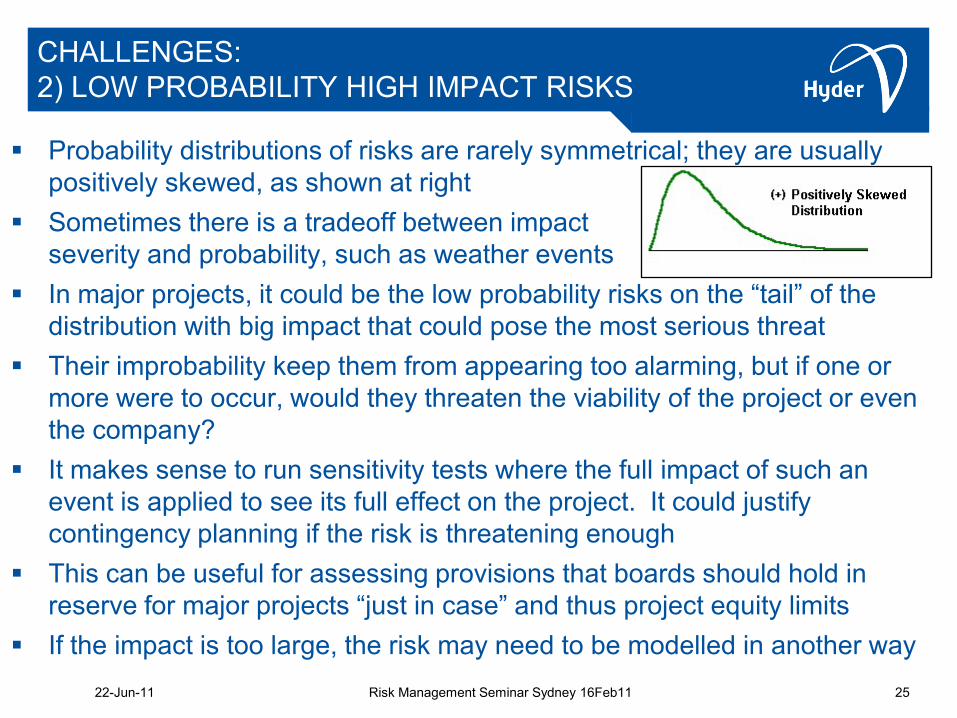
Probability distributions of risks are rarely symmetrical; they are usually positively skewed, as shown at right
Sometimes there is a tradeoff between impact severity and probability, such as weather events
In major projects, it could be the low probability risks on the “tail” of the distribution with big impact that could pose the most serious threat
Their improbability keep them from appearing too alarming, but if one or more were to occur, would they threaten the viability of the project or even the company?
It makes sense to run sensitivity tests where the full impact of such an event is applied to see its full effect on the project. It could justify contingency planning if the risk is threatening enough
This can be useful for assessing provisions that boards should hold in reserve for major projects “just in case” and thus project equity limits
If the impact is too large, the risk may need to be modelled in another way22-Jun-11 25Risk Management Seminar Sydney 16Feb11
CHALLENGES: 3.1) MANAGEMENT RESERVE
One of the difficulties of major projects is using the schedule and the budget as project team drivers, to “stretch” them to produce the best outcomes, but not to discourage them because they become unattainable targets
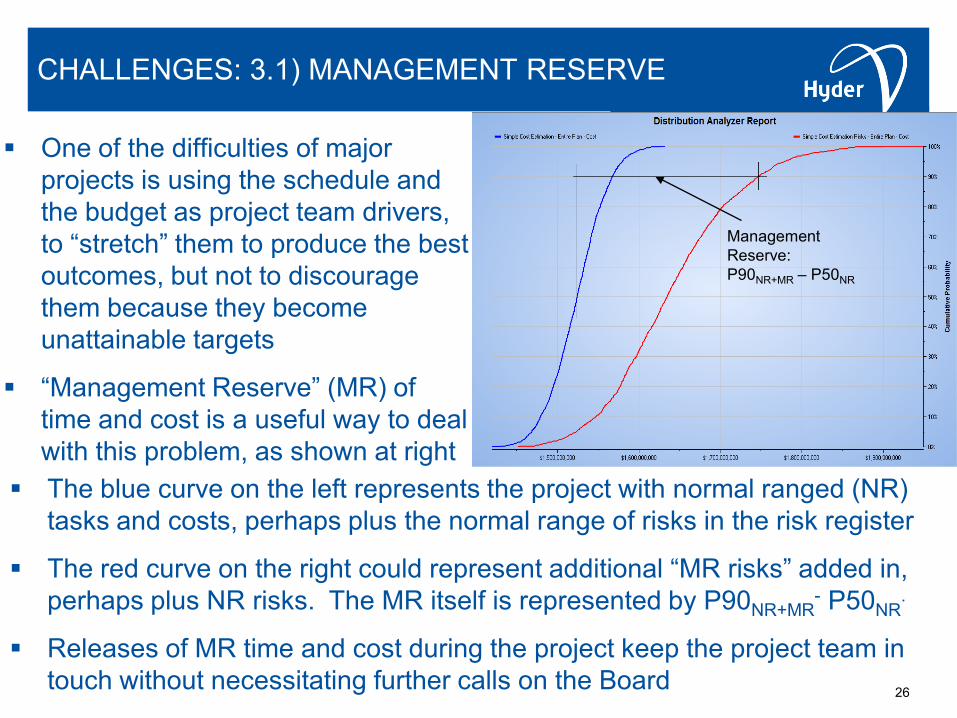
“Management Reserve” (MR) of time and cost is a useful way to deal with this problem, as shown at right
26
The blue curve on the left represents the project with normal ranged (NR) tasks and costs, perhaps plus the normal range of risks in the risk register
The red curve on the right could represent additional “MR risks” added in, perhaps plus NR risks. The MR itself is represented by P90NR+MR
- P50NR.
Releases of MR time and cost during the project keep the project team in touch without necessitating further calls on the Board
Management Reserve: P90NR+MR – P50NR

CHALLENGES: 3.2) ESTIMATING MANAGEMENT RESERVE
The real challenge of Management Reserve is getting it right: One Project Management website(http://pmsecrets.blogspot.com/2008/01/contingency-reserve-vs-
management.html) distinguishes between contingency reserve and Management Reserve thus: “Contingency reserve - This is your fund for ‘known-unknowns’ or the sum of all
your risks’ expected values.” Management reserve - This is for the ‘unknown-unknowns’ – you don’t know
about the risks until they happen. This may be derived using a percentage of the overall project budget.”
But how do you know what percentage of the budget is enough? With increasing project size and complexity, the size of required MR seems to
increase due to factors such as inter-dependencies of systems, contagion and disruption effects and political / country risks where applicable.
As in many things, defining the influences and sources of complexity is a start to better scaling of the requirement. We recommend scaling MR by identifying risks that affect the project holistically and/or externally. Business risks, political risks and “breakdown of contract” risks may be relevant examples
2722-Jun-11 Risk Management Seminar Sydney 16Feb11
CHALLENGES: 4) EARLY CONTRACTOR INVOLVEMENT & CONVERSION TO EPC CONTRACTS
In large projects, there seems to be a trend toward the project owner selecting one or more contractors who then work with the owner in an open book way to define the project
At a point where the design is advanced enough for the parties to agree that the project scope, quality, time and cost have been sufficiently defined, the books are “closed” and the contractor(s) proceed on a lump sum or perhaps fixed fee plus incentives basis
From an Integrated Time & Cost Risk Analysis (IRA) perspective, the probabilistic cost distribution at this point becomes much narrower, even though the time distribution may still appear relatively unchanged
The contractor appears to have accepted the delay risk, but is this really the case? Perhaps, to a point, usually defined by the contractor’s insurer
So beyond the limit of contractor risk appetite for delay, the prudent project owner should factor in MR cost risk and seek to model that probabilistically
2822-Jun-11 Risk Management Seminar Sydney 16Feb11
PROJECT EXAMPLES: 1) OFFSHORE PLATFORM ENHANCEMENT AND OVERLAPPING DRILLING
An offshore/onshore gas and condensate project was planned to extend the life of the field by drilling extra wells and installing accommodation on the previously unmanned platform to reduce the cost of maintenance and comply with changed regulations
The accommodation modules were to be shipped with the drilling & construction support barge on a special marine transport vessel
The IRA risk workshopping showed that the owner assigned substantial schedule risk to the accommodation modules, but the project costs were dominated by the D&CS barge daily charter rates
When the IRA analysis showed that the chartering of the barge would be delayed 75% of the simulation times by late delivery of the accommodation modules, the owner instructed that the modules be shipped separately if they were later than the barge charter start date
This required that a macro be written to model interrupting drilling instead of drilling after the modules were installed and changed the expected cost/time profile of the project
The project was subsequently reconfigured to be done a different way2922-Jun-11 Risk Management Seminar Sydney 16Feb11
PROJECT EXAMPLES: 2) DEEP SEA MINING VENTURE
Hyder was engaged for IRA services on a novel mining project in PNG waters to mine rich metalliferous nodules from deep volcanic rifts in the sea bed off New Ireland. Proprietary remote-controlled mining machines are to be lowered to the sea bed and the removed ore is to be slurry-pumped to the surface, dewatered into a barge and taken to Rabaul Harbour for consolidating for pickup by freighters taking the ore to concentrators in Asia.
The consolidation in Rabaul Harbour was only an interim measure for three years until a processing barge could be built, funded by production
However, Rabaul Harbour is built in an active volcano caldera and has a history of volcanic activity, including smothering half of Rabaul in volcanic ash in 1994.
The board of the project owners requested that a risk workshop be held to examine the safety of operating in Rabaul Harbour for three years plus the establishment time for setting up the facilities
Volcanic and marine experts were invited along with company representatives, and the various volcanic events assessed that could threaten lives, safety or the facilities. Sufficient data existed for reasonable forecasting to be possible of event frequencies. It was possible to conclude that it would be acceptably safe to operate for the period.
3022-Jun-11 Risk Management Seminar Sydney 16Feb11
PROJECT EXAMPLES: 3) COAL SEAM GAS LNG PROJECTS
Hyder was engaged by Santos for QRA services on the Gladstone LNG Project, which were completed last November, 14 months after commencement
Hyder was originally asked to provide Schedule Risk Analysis services as part of a governance role on the project, starting in September 2009
In January/February, Hyder created a summary schedule model of the main elements of the complete project scope and provided a SRA report incorporating all the schedule risks identified in workshops
Arising from this, the GLNG Project Management Team asked Hyder to incorporate the project estimate and produce an Integrated Cost & Schedule Risk Analysis. An initial IRA was performed during April/May and a report provided
Thereafter, Hyder was requested to continue producing IRAs through to submission of the Decision Support Package for Financial Investment Decision (FID), as part of the project team. Hyder’s report was made available to the partners to assist them to decide whether to approve the project. Another company from the UK was asked to fill the governance role from which we had been taken, producing their independent IRA report.
In January, Santos announced the $16bn two-train GLNG project was to proceed Hyder is still providing Risk Management and QRA Services to Origin Energy for the Upstream
scope of the APLNG Project
3122-Jun-11 Risk Management Seminar Sydney 16Feb11

32
THANKS FOR YOUR INTEREST - QUESTIONS?
www.hyderpmg.comwww.hyderconsulting.com