best practices in transportation procurement bringing · pdf filebest practices in...
TRANSCRIPT
Best Practices in Transportation Procurement
Bringing the Paper Savings to Reality
Moderator:
• Paul Page – Editorial Director, The Journal of Commerce
Speakers:
• Gary Girotti - Vice President, Transportation Practice, CHAINalytics LLC
• Joe Lombardo - Group Manager, Transportation, Nestle USA
• Paul Bacon - Product Manager, Transportation Bid Collaboration, i2 Technologies

Who is Chainalytics?
• Chainalytics formed in 2001 (HQ in Atlanta, GA)
– 50 FTEs in US and India
– Experience of over 400 engagements
• Supply Chain Analysis Focused In:
– Supply Chain Design
– Transportation Sourcing & Operations Improvement
– Inventory & Portfolio Planning
• Transportation Procurement Experience
– 100+ Transportation bids over the past 7 years
• All industries, All modes
– Technology Expertise
• Chainalytics has experts on staff for all the major technology vendors
– Access to our proprietary TL Benchmarking product (MBBC)
• Current MBBC model includes $12B in freight spend refreshed every 6 months
• Much more the just rate comparison. MBBC determines the cost drivers that determine rates
Supply Chain
Analytics
Infrastructure
Planning
Portfolio
Management
Inventory
Planning
Transportation
Planning
Transportation
Operations
Transportation
Sourcing
2

Guiding Principals to Transportation Procurement
• Transportation is not a commodity – it is a service
– The subjective aspect of the quality of the service needs to be included in the analysis
– Shippers should consider all costs (direct and indirect) when trading-off soft aspects
• A transportation procurement event is as much a relationship management
process as a pricing event
– The outcome of a typical event is a non-binding agreement
• Shippers do not guarantee volume and carriers do not guarantee they will take the
volume tendered
– As such, the procurement event must be looked at as part of a continual process of
relationship management with your service providers
• Going to market, or market testing your rates, should be a healthy part of
the relationship management process
– Carriers’ networks change as much, if not more than, the average shippers’ networks
– These events should be well communicated, regularly scheduled, and fair
3

Procurement Best Practices:Procurement Life Cycle
Data
4

Procurement Best Practices:Procurement Life Cycle
Data
5
These areas
get all the
focus
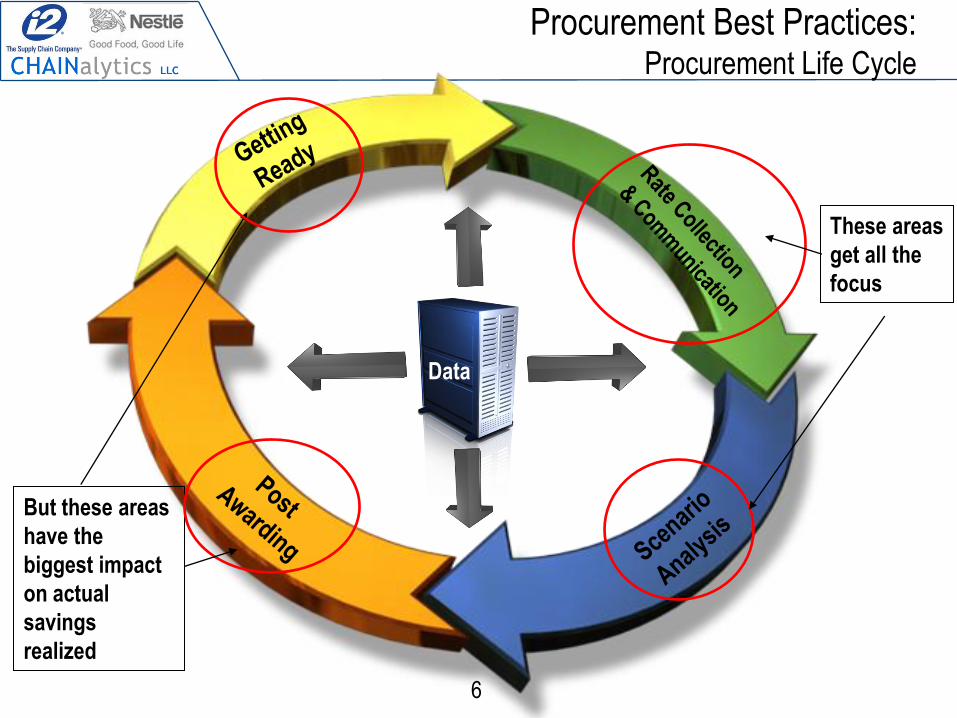
Procurement Best Practices:Procurement Life Cycle
Data
6
These areas
get all the
focus
But these areas
have the
biggest impact
on actual
savings
realized

LHD Capacity Predictions
Balanced
Somewhat
Available
Easily
Available
Jun 2009
Balanced
Somewhat
Available
Easily
Available
12%
2%
4%
30%
52%
Dec 2009
Balanced
Somewhat
Available
Easily
Available
Somewhat
Tight
37%
11%
2%
2%
9%
16%
9%
7%
7%
Jun 2010
Balanced
Somewhat
Available
Easily
Available
Somewhat
Tight
Very Tight
2%
7%2%
13%
15%17%
11%
15%
11%
7%
Dec 2010
12%
82%
6%
18%
46%
25%
11%
7%
28%
43%
20%
2%
Survey responses from 46 for LHD transportation
procurement directors managing over $10B in spend7

Procurement Savings 2008 - 2009
0%
5%
10%
15%
20%
25%
30%
35%
Retail Retail Beverage Mfg
CPG Mfg Packaging Mfg
Packaging Mfg
Food Mfg Food Mfg Food Mfg Food Mfg Food Mfg Food Mfg PharmaYear 2008 2008 2008 2008 2008 2008 2008 2008 2009 2009 2009 2009 2009
Mode TL TL/IM TL Ref TL/IM TL LTL LTL TL TL Ref TL/IM TL/IM TL Ref LTL
Spend ($MM) 38$ 75$ 40$ 230$ 19$ 10$ 0.6$ 38$ 54$ 160$ 49$ 176$ 8$
Average 15% savings
Individual procurement events have yielded significantly
greater rate reductions than the average
8

Rate Savings and Fewer Carriers
0%
2%
4%
6%
8%
10%
12%
14%
16%
18%
0
10
20
30
40
50
60
70
80
90
100
Food Mfg Food Mfg Food Mfg Retailer Food Mfg Food Mfg
Pe
rce
nta
ge S
avin
gs
Nu
mb
er
of
Car
rie
rsCarrier Rationalization & Savings in Recent Procurement Events
Baseline Carriers Awarded Carriers Savings %
Given the unprecedented level of change in carrier and shipper
networks, now is the time realign carrier relationships
9


NUSA Transportation Overview
• Logistics Planning for ~300 Facilities
– Nestle Factories
– Nestle Distribution Centers
– 3rd Party Warehouses
– Co Pack and Co Manufacturing
Vendors
– Supplier Vendors (Inbound)
• Divisions
– Confection & Snacks
– Beverage
– Emerging Markets
– Healthcare
– Infant Nutrition
– Prepared Foods
– Professional
– Refrigerated Pasta & Cookie
Dough
11

NUSA Transportation Overview
• Temperatures
– Ambient (Dry)
– Temperature Controlled (Cool)
– Refrigerated
– Frozen
• Modes
– Truckload/Stop Truck
– Less Than Truckload (LTL)
– Rail
– Intermodal
– Parcel
– Air
– Tanker
– Ocean
– Pool
12

What does Nestle look for in a Carrier and 3PL?
• Reliability
• Repeatable excellence
• Value and cost savings
• Expertise and knowledge base
• Problem solving ability
• Continuous improvement
• Support
• Positive culture
• Strong management
• Technology focus
• Global capabilities
13

2009 RFP Goals
• Reduce carrier base
• Move to larger asset based carriers
• Grow business with a diversity supplier (3PL)
• Move to SmartWay carriers
• Increase EDI carriers
• Savings
• Incumbent focus - only 1 new carrier added
• Eliminate protective service charge
• Temperature based FSC program
14
i2 Transportation Bid Collaboration

Who is i2?
• A leading provider of next-generation “best-of-
breed” supply chain management solutions
– Visibility
– Planning
• A proven track record to solve the most complex
supply chain problems
• Industry-focused solution domain expertise
– Transportation
– Retail
– Consumer industries
– AAIM (Automotive, Aerospace and Defense,
Industrial, and Metals)
– High Technology
• i2 has the advanced and mature intellectual
properties for supply chain management
• i2’s supply-chain business process platform is
based on service-oriented architecture (SOA)
i2 Technologies Corporate Offices Dallas, Texas
16
– Collaboration
– Execution/Control

i2 Transportation Customers
17

Transportation Bid Collaboration Overview
• Engagement Management
– Flexible modeling capabilities allow different modes to be handled through one
unified application
• Carrier Management & Bidding
– Bid spreadsheet download/upload
– Combinatorial bidding & conditional discounts
– Bid validation
– Visibility into carrier progress
– Automated and ad hoc messaging capabilities
• Optimization & Analysis
– Most powerful constraint based optimization engine available
– Constraints (awarding, selection, price, capacity, etc.)
– Speed & scalability (largest to date 65K lanes & 1.8 million bids)
18
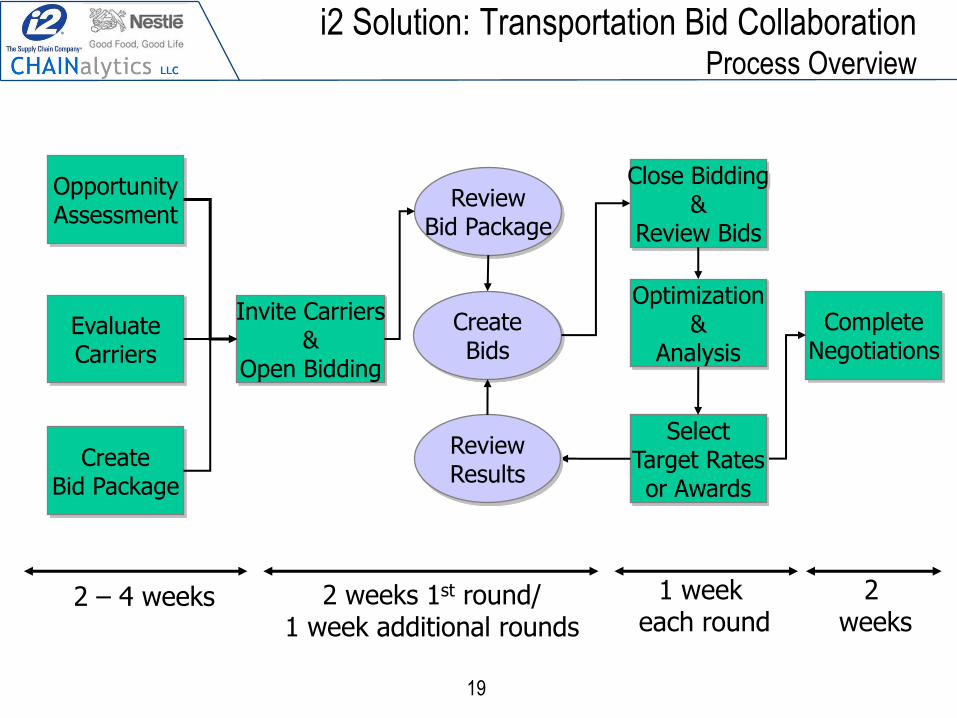
2 – 4 weeks 2 weeks 1st round/1 week additional rounds
CompleteNegotiations
2 weeks
CreateBid Package
EvaluateCarriers
OpportunityAssessment
ReviewBid Package
Invite Carriers&
Open Bidding
CreateBids
Optimization&
Analysis
SelectTarget Rates or Awards
1 week each round
i2 Solution: Transportation Bid CollaborationProcess Overview
ReviewResults
Close Bidding&
Review Bids
19

TBC Engagement Management Provides
Flexibility and Control
One Application for All Engagements
Flexible Service Hierarchy
20

TBC Carrier Bidding Saves Time & Money
Bid Validation
Conditional Discounts
21

TBC Optimization & AnalysisAchieves Accurate and Executable Results
Scenario Builder
Scenario Reports
22

Analyzing Transportation CostsReducing costs during the freight procurement process
23 Source: META Group

Why Transportation Bid Collaboration?
• Web-based solution
• Supports multiple modes
– Truckload, Intermodal, Less-Than-Truckload, Ocean, and Air
• Industry leading solution provider
– Active client participation in product roadmap
– 15 plus years supporting transportation industry
– Supporting Consumer Goods, Hi-Tech, Food/Beverage, Manufacturing,
Grocery, Retail, Healthcare & Auto
– 40 plus TBC customers
• Over $1B in transportation spend bid for 2009
• Average savings of 15.9% in 2009
24

Nestlé USA Bid Results

2009 Nestlé USA Bid Results
Dry Truckload
• Savings exceeded targets
• 35 carriers invited
• 18 carriers awarded, 19 with Nestlé Fleet– New Carriers - 0
– Brokers - 3
– EDI - 8
– SmartWay - 10
• 26 Scenarios run
Temp Control TL/IM• Savings met expectation
• 70 carriers invited
• 37 carriers awarded, 38 including Nestlé Fleet– New Carriers - 1
– Brokers – 4
– Intermodal - 5
– EDI - 26
– SmartWay - 28
• 33 scenarios run
The process took about 16 weeks from beginning of data
collection until new awards went into effect
26

Best Practices and Learnings
• The central tenant of carrier relationships, is treat your carriers fairly– If you negotiate an 18 month rate agreement - stick to it
– Two rounds of bidding is fine as long as you give the carrier some information between rounds
– Communicate as much as you can to the carriers:
• About your problem areas
• About what you are looking for as far as services
• About how your operations behave
• The carrier market is very soft, so carriers are willing to be aggressive on price - but also look for other value added services– Reporting, trailer pool management, EDI communication
– Make a credible case to support your FSC program and stick to it
– The escalator should be relative to the fuel efficiency of the average truck plus allowance for empty miles
• Do not assume, look at the numbers– This is where the optimization engine is very powerful in helping you understand the
cost of the operation constraints you impose
27

Achieving the Projected Savings
The keys to obtaining the projected savings are:
1. If the rate is too good to be true, it likely is not true– Benchmark so you know where the market is, and what is true
– If you do not know the carrier, be very careful in counting savings
– Chainalytics typically estimates• A carrier new to the network needs to beat the incumbents by 3-4% to make
the switch worthwhile
• A carrier new to the lane or locations needs to beat the incumbents by 2-3% to make the switch worthwhile
2. Monitor to the plan– The results of a bid is just a plan of what you expect to do
– Have a process that monthly/quarterly monitors actual activity to the plan• Ensure plan changes are tracked for carrier failures, implementation errors,
network changes, new lanes, etc.
3. Maintain regular and structured communications with suppliers– Regular performance reviews, promotional forecasts, new lane awards, etc.
28

Q&A