best survey 2010 city report: helsinki benchmarking in european service of public transport
TRANSCRIPT

BEST Survey 2010City report: Helsinki
Benchmarking in European Service of public Transport

BEST 2010
BEST City report 20102
Content
1. About the survey
2. How to read the graphs
3. Results Results per index in 2010, 2009, 2008 and
2007
Satisfaction per city/region 2005 – 2010 with:
Traffic supply
Reliability
Information
Staff behaviour
Security and safety
Comfort
Perception of social image 2005 - 2010
Perception of value for money 2005 - 2010
Citizens stated loyalty to public transport 2005 - 2010
4. Quality indicators impact on overall citizen satisfaction 2010
5. Results per subgroup
6. Background information Gender
Age
Life situation
PT travel frequency

BEST 2010
3
About the survey
The following cities participated in the BEST 2010 survey:
Stockholm
Oslo
Helsinki (with additional questions)
Copenhagen
Vienna
Geneva (with additional questions)
For all cities 1.000 residents in defined areas have been interviewed. An additional 600 interviews where conducted in Helsinki in 2010. All interviews have been done by telephone.
The fieldwork was conducted between March 1st and March 14th 2010.
Results from the survey have been weighted with respect to sex and age to match the profile in each area.
In 2010 the special topic was transfers. Five questions related to this topic was added to the questionnaire. The results is to be found in a separate report.
BEST City report 2010
BEST 2010
BEST City report 20104
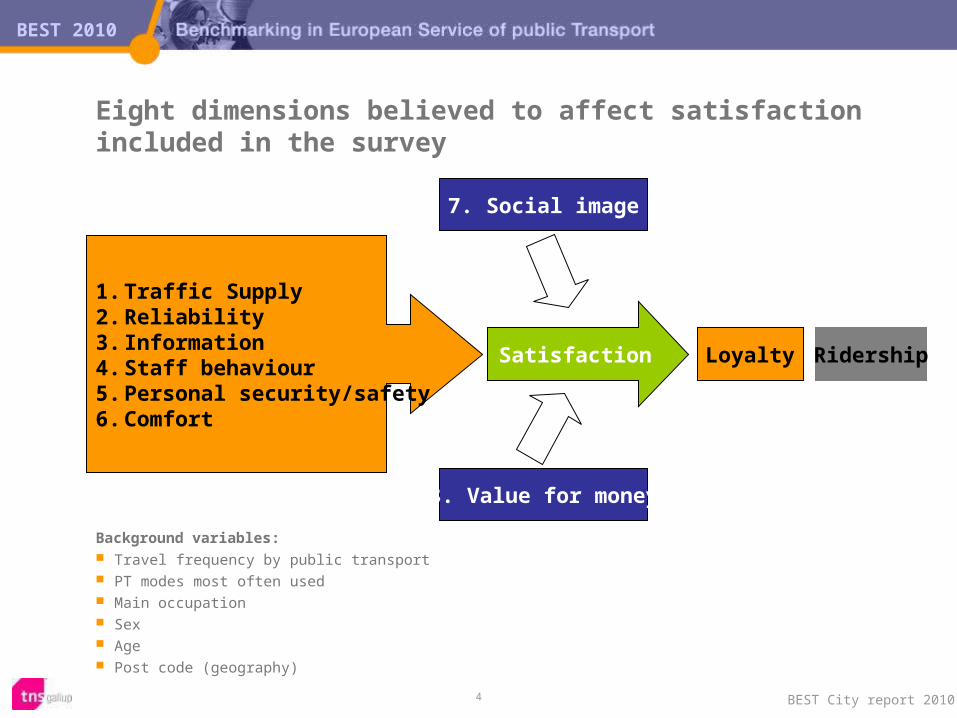
Eight dimensions believed to affect satisfaction included in the survey
Background variables: Travel frequency by public transport PT modes most often used Main occupation Sex Age Post code (geography)
Loyalty
8. Value for money
7. Social image
Satisfaction
1. Traffic Supply2. Reliability3. Information4. Staff behaviour5. Personal security/safety6. Comfort
Ridership

BEST 2010
BEST City report 2010
Response rates
Response rates are calculated as follows:
YEAR 2001 2002 2003 2004 2005 2006 2007 2008 2009 2010
Copenhagen 38 % 54 % 55 % 56 % 53 % 39 % 40 % 32 % 37 % 34 %
Geneva 50 % 47 % 50 % 49 % 47 % 56 % 43 % 40 % 38 %
Helsinki 41 % 49 % 45 % 47 % 40 % 37 % 32 % 26 % 30 % 36 %
Oslo 37 % 44 % 48 % 45 % 40 % 39 % 28 % 27 % 28 % 27 %
Stockholm 50 % 64 % 56 % 60 % 56 % 50 % 64 % 51 % 62 % 64 %
Vienna 39 % 57 % 58 % 61 % 58 % 58 % 54 % 46 % 43 % 16 %
5
BEST Survey response rate =
Number of completed interviews
(Total sample ÷ telephone numbers not in use / not in target group)

BEST 2010
BEST City report 20106
Sampling Sampling procedures varies from country to country. In Norway, Denmark and Finland samples are drawn from
databases covering both mobile and fixed line telephones. In Sweden and Switzerland samples are drawn from fixed
line telephones. In all instances it is estimated that approximately 85-95%
of the adult population in all included countries can be reached by telephone.
The primary sampling unit varies across countries (see table on right hand side).
The secondary sampling unit for fixed line phone numbers are the person in the household who last had a birthday. For mobile telephone numbers the secondary sampling unit are the individuals uses the particular mobile phone.
There are no single, clear answer to what the best sampling method and procedure is. In case of the BEST survey there is little reason to believe that there should be a strong correlation between attitudes towards the public transport system and telephone usage, fixed line or mobile.
From Norway and other countries we know that there is a relatively strong correlation between age and mobile subscription. The younger people are the more likely they are to be using mobile telephones. In the BEST survey the completed data are weighted with respect to age, and hence adjusted for this possible skewness.
City Sample base and primary sampling unit
Stockholm Fixed line sample, household primary sampling unit
Oslo Fixed line and mobile sample, phone number primary sampling unit
HelsinkiFixed line and mobile sample, phone number primary sampling unit, priority to mobile telephone numbers
Copenhagen Fixed line and mobile sample, phone number primary sampling unit
Vienna Fixed line and mobile sample, phone number primary sampling unit
Geneva Fixed line sample, household primary sampling unit

BEST 2010
BEST City report 20107
Mobile interviews*
City % mobile interviews 2008 % mobile interviews 2009 % mobile interviews 2010
Stockholm 2,5%** 2,3%** 2,1%**
Oslo 40% 39% 44%
Helsinki 82% 96% 98%
Copenhagen 25% 35% 36%
Vienna 7% 9% 44%
Geneva 0% 0% 0%
* Share of interviews conducted with respondents using a mobile phone
** If mobile callback requested by respondent only

BEST 2010
BEST City report 20108
How to read the graphs
Time series
4449 47
51
58 58
0
20
40
60
80
100
2001 2002 2003 2004 2005 2006
CITIZEN SATISFACTION
<TOTAL BASE: NNN>
The graphs show the proportion of the respondents who agrees (partially agrees or fully agrees) to the different statements in blue columns. The red columns shows the proportion who disagrees (hardly agrees or not agree at all) to the statements.
Respondents with a neutral position are not displayed in the graphs.
The graphs also include results from previous surveys, shown in the table to the right as the proportion of the respondents who agrees to the statement in question.
BEST 2006
10 Citizens Satisfaction Survey 2006
BEST Survey 2007Citizen satisfaction
80
79
76
73
67
66
58
-5
-3
-3
-6
-10
-10
-11
Vienna
Helsinki
Prague
Berlin
Stockholm
Oslo
Copenhagen
Partially/Fully agree Hardly/Don't agree at all<TOTAL BASE: NNN>
5852585658
4751585866
6764666567
..637373
..80.76
8078768179
7875757480
20032004200520062007
Development per index in the different cities are also shown as time lines.
All graphs are standard PowerPoint-graphs where different categories can be hidden and value labels displayed at ones own preference.

Results 2010Helsinki

BEST 2010
BEST City report 201010
Helsinki Indices 2010
-6
-12
-21
-28
-12
-8
-11
-3
-24
-6
77
67
56
46
59
76
62
87
51
80
CITIZEN SATISFACTION
TRAFFIC SUPPLY
RELIABILITY
INFORMATION
STAFF BEHAVIOUR
SECURITY AND SAFETY
COMFORT
SOCIAL IMAGE
VALUE FOR MONEY
LOYALTY
Hardly/Don't agree at all Partially/Fully agree
2010 2009 2008 2007 2006
77 82 76 79 81
67 68 65 66 67
56 68 64 64 72
46 52 49 48 57
59 58 54 57 59
76 74 72 71 72
62 62 63 63 63
87 89 84 86 82
51 51 47 49 50
80 81 80 78 75

Helsinki 2010
Quality dimensions

BEST 2010
BEST City report 201012
-12
-17
-14
-4
-14
-8
-11
-14
-17
67
63
66
83
55
85
70
50
63
TRAFFIC SUPPLY
PT is good for school_work trips
PT is good for leisure trips
PT is good for trips in the city centre
PT is good for trips outside the citycentre
Nearest stop is close to where I live
Travel time on PT is reasonable
Waiting time is short at transfers
I am satisfied with the number ofdepartures
Hardly/Don't agree at all Partially/Fully agree
Helsinki Traffic supply
2010 2009 2008 2007 2006
67 68 65 66 67
63 68 66 68 65
66 65 63 65 65
83 87 81 83 84
55 54 48 50 50
85 90 87 88 89
70 68 66 70 70
50 47 45 43 49
63 62 60 63 62

BEST 2010
BEST City report 201013
-21 56Reliability
Hardly/Don't agree at all Partially/Fully agree
2010 2009 2008 2007 2006
56 68 64 64 72
Helsinki Reliability

BEST 2010
BEST City report 201014
Helsinki Information
-28
-7
-43
-34
46
78
24
35
INFORMATION
It is easy to get the information neededwhen planning a trip
Information is good when trafficproblems occure
Information is good in stops andterminals
Hardly/Don't agree at all Partially/Fully agree
2010 2009 2008 2007 2006
46 52 49 48 57
78 82 78 77 80
24 25 23 22 33
35 46 44 44 -

BEST 2010
BEST City report 201015
Helsinki Staff behaviour
-12
-15
-9
59
51
66
STAFF BEHAVIOUR
Staff answers my questions correctly
Staff behaves nicely and correctly
Hardly/Don't agree at all Partially/Fully agree
2010 2009 2008 2007 2006
59 58 54 57 59
51 49 48 51 53
66 66 60 62 65

BEST 2010
BEST City report 201016
Helsinki Security and safety
-8
-10
-9
-5
76
69
74
86
SECURITY AND SAFETY
I feel secure at stations and bus stops
I feel secure on board busses and trains
I am not afraid of traffic accidents whenusing PT
Hardly/Don't agree at all Partially/Fully agree
2010 2009 2008 2007 2006
76 74 72 71 72
69 65 65 64 64
74 69 67 66 67
86 87 83 84 84

BEST 2010
BEST City report 201017
Helsinki Comfort
-11
-8
-10
-9
-24
-5
62
63
60
66
40
81
COMFORT
PT travel is comfortable
Transfers are easy
Busses and trains are modern
Busses and trains are clean
I normally get a seat when travel with PT
Hardly/Don't agree at all Partially/Fully agree
2010 2009 2008 2007 2006
62 62 63 63 63
63 63 72 71 66
60 61 57 59 57
66 70 70 68 70
40 38 41 40 45
81 78 76 75 76

BEST 2010
BEST City report 201018
-3
-5
-3
-1
87
75
92
93
SOCIAL IMAGE
More people will travel with PT in thefuture
PT is good for the environment
PT is beneficial to society
Hardly/Don't agree at all Partially/Fully agree
Helsinki Social Image
2010 2009 2008 2007 2006
87 89 84 86 82
75 79 68 68 62
92 93 92 93 90
93 94 93 95 93

BEST 2010
BEST City report 201019
Helsinki Value for money
-24
-15
-33
51
61
42
VALUE FOR MONEY
PT gives good value for money
PT fares are reasonable
Hardly/Don't agree at all Partially/Fully agree
2010 2009 2008 2007 2006
51 51 47 49 50
61 61 57 60 60
42 41 37 37 40

BEST 2010
BEST City report 201020
-6 80Loyalty
Hardly/Don't agree at all Partially/Fully agree
2010 2009 2008 2007 2006
80 81 80 78 75
Helsinki Loyalty
Impact on satisfaction
Indicators impact on citizen satisfaction

How is the most important areas for improvements determined?
Traffic supply Nearest stop is close to where I live Waiting time is short at transfers I am satisfied with the number of departures
Reliability Capability to run on schedule
Information It is easy to get the information needed when
planning a trip Information is good when traffic problems occur
Staff behaviour Staff answers my questions correctly Staff behaves nicely and correctly
Security and safety I feel secure at stations and bus stops I feel secure on board busses and trains I am not afraid of traffic accidents when using
PT Comfort
Transfers are easy Busses and trains are modern Busses and trains are clean I normally get a seat when travel with PT
Description of the analysis: The indicators shown to the left have been
used to determine the impact they have on citizens over all satisfaction.
The selected indicators have been chosen as they are independent of each other and describes different phenomenon. I.e. ‘Travel time’ is not included as this element is a function of and covered through ‘Nearest stop is close to where I live’, ‘Number of departures’ and Waiting time is short at transfers’.
As such the indicators included are thought to be the ones who are possible to influence and describes the most concrete properties of the public transport system.
Price has not been included in this analysis, as the perception of price most often is a function of the perception of other properties.
A stepwise regression method has been used in the analysis.
On the following slide the five indicators with strongest significant impact on satisfaction are listed in ranked order for all participating cities in 2010.
Overall satisfaction
with PT
22

BEST 2010
BEST City report 201023
Impact on satisfaction - Helsinki
The busses and trains are modern
I am satisfied with the number of departures
Transfers are easy
It is easy to get the in-formation needed when
planning a trip
Public transport mostly runs on schedule
I feel secure on board busses and trains
Nearest stop is close to where I live
0.21
0.19
0.19
0.13
0.08
0.08
0.07
I am satisfied with the number of departures
Transfers are easy
The busses and trains are clean
Waiting time is short at transfers
Public transport mostly runs on schedule
The staff behaves nicely and correctly
The information is good when traffic problems
occurIt is easy to get the in-formation needed when
planning a tripI normally get a seat
when I travel with public transport
I am not afraid of traffic accidents when using
public transportNearest stop is close to
where I live
0.19
0.15
0.12
0.09
0.08
0.06
0.06
0.06
0.06
0.06
0.05
I am satisfied with the number of departures
Transfers are easy
Public transport mostly runs on schedule
I am not afraid of traffic accidents when using pub-
lic transport
The busses and trains are clean
Nearest stop is close to where I live
It is easy to get the informa-tion needed when planning a
trip
I normally get a seat when I travel with public transport
The staff answers my ques-tions correctly
0.23
0.19
0.14
0.10
0.08
0.06
0.06
0.06
0.05
2009 20102008
When studying these results please keep in mind that the internal ranking of the different elements in each year is of prime interest. Comparison of the estimated effects across years must be done cautiously and interpreted as indications of differences.

Helsinki 2010
Appendix

Helsinki 2010
Citizen satisfaction in subgroups

BEST 2010
BEST City report 201026
Helsinki Citizen satisfaction- Subgroups
77
7778
7873
7887
90
8484
7254
49
8668
7364
74
648485
7573
9386
8384
-6
-6-5
-3-7-5-4
-7
-5-5-4
-11-21
-5-6-7-8-6
-8-3-4
-6-6-5
-1-5
-11
Total
ManWoman
16 - 2425 - 4445 - 6465 - 79
80 +
DailyA few times per week
A few times perLess than monthly
Never
Helsinki Espoo
Vantaa Kirkkonummi
Kerava
TrainTramMetro
BusBus, trainBus, tram
Bus, metroBus, metro, tramBus, metro, tram,
Partially/Fully agree
Hardly/Don't agree at all<TOTAL BASE: 1572>

Helsinki 2010
Traffic supply in subgroups

BEST 2010
BEST City report 201028
Helsinki Traffic supply - Subgroups
67
6668
6764
6776
80
7270
6551
35
7361
6456
65
5975
736564
76737474
-12
-12-12
-12-15
-12-8-7
-10-10
-13-24
-20
-9-16
-13-20
-12
-16-9-8
-13-15
-9-11
-9-9
Total
ManWoman
16 - 2425 - 4445 - 6465 - 79
80 +
DailyA few times per week
A few times perLess than monthly
Never
Helsinki Espoo
Vantaa Kirkkonummi
Kerava
TrainTramMetro
BusBus, trainBus, tram
Bus, metroBus, metro, tramBus, metro, tram,
Partially/Fully agree
Hardly/Don't agree at all

BEST 2010
BEST City report 201029
Helsinki Good for work/school trips - Subgroups
<TOTAL BASE: 1414>
63
6265
6759
6276
90
7570
4737
24
7257
6143
54
4556
7462
5980
6985
75
-17
-16-17
-16-20
-16-5
-11-11
-23-36
-38
-12-22
-14-31
-19
-24-23
-5-17
-21-9
-12-6
-8
Total
ManWoman
16 - 2425 - 4445 - 6465 - 79
80 +
DailyA few times per week
A few times perLess than monthly
Never
Helsinki Espoo
Vantaa Kirkkonummi
Kerava
TrainTramMetro
BusBus, trainBus, tram
Bus, metroBus, metro, tramBus, metro, tram,
Partially/Fully agree
Hardly/Don't agree at all

BEST 2010
BEST City report 201030
Helsinki PT is good for leisure trips - Subgroups
<TOTAL BASE: 1558>
66
6469
7161
6480
90
7271
6445
28
7754
6056
61
5681
726363
757372
79
-14
-16-13
-11-19
-14-9
-5
-11-11
-14-33
-39
-9-21
-16-26
-15
-19-11-10
-15-16
-11-9
-12-13
Total
ManWoman
16 - 2425 - 4445 - 6465 - 79
80 +
DailyA few times per week
A few times perLess than monthly
Never
Helsinki Espoo
Vantaa Kirkkonummi
Kerava
TrainTramMetro
BusBus, trainBus, tram
Bus, metroBus, metro, tramBus, metro, tram,
Partially/Fully agree
Hardly/Don't agree at all

BEST 2010
BEST City report 201031
Helsinki PT is good for trips in the city centre - Subgroups
<TOTAL BASE: 1488>
83
8185
7785
8189
75
828786
7647
8583
8083
77
7985
928281
8688
8285
-4
-5-3
-4-3
-6-1
-4-3-4-5
-4-6
-2-1
-3
-5-4-3-3-2
-5-7
-10-2
Total
ManWoman
16 - 2425 - 4445 - 6465 - 79
80 +
DailyA few times per week
A few times perLess than monthly
Never
Helsinki Espoo
Vantaa Kirkkonummi
Kerava
TrainTramMetro
BusBus, trainBus, tram
Bus, metroBus, metro, tramBus, metro, tram,
Partially/Fully agree
Hardly/Don't agree at all

BEST 2010
BEST City report 201032
Helsinki PT is good for trips outside the city centre - Subgroups
<TOTAL BASE: 1500>
55
5356
5648
5860
85
595454
4425
5751
5846
53
4559
4255
5267
6161
53
-14
-14-14
-16-17
-13-10-10
-13-15
-12-22
-25
-13-15-15
-17-14
-15-14
-17-14
-16-11
-15-13-11
Total
ManWoman
16 - 2425 - 4445 - 6465 - 79
80 +
DailyA few times per week
A few times perLess than monthly
Never
Helsinki Espoo
Vantaa Kirkkonummi
Kerava
TrainTramMetro
BusBus, trainBus, tram
Bus, metroBus, metro, tramBus, metro, tram,
Partially/Fully agree
Hardly/Don't agree at all

BEST 2010
BEST City report 201033
Helsinki Nearest stop is close to where I live - Subgroups
<TOTAL BASE: 1595>
85
8486
8785
838889
9284
8269
66
918385
6382
7390
9787
8493
918789
-8
-9-8
-7-8
-10-8
-11
-4-8
-10-20
-17
-5-7
-11-26
-8
-13-4-2
-8-8
-5-7-5-6
Total
ManWoman
16 - 2425 - 4445 - 6465 - 79
80 +
DailyA few times per week
A few times perLess than monthly
Never
Helsinki Espoo
Vantaa Kirkkonummi
Kerava
TrainTramMetro
BusBus, trainBus, tram
Bus, metroBus, metro, tramBus, metro, tram,
Partially/Fully agree
Hardly/Don't agree at all
BEST 2010
BEST City report 201034
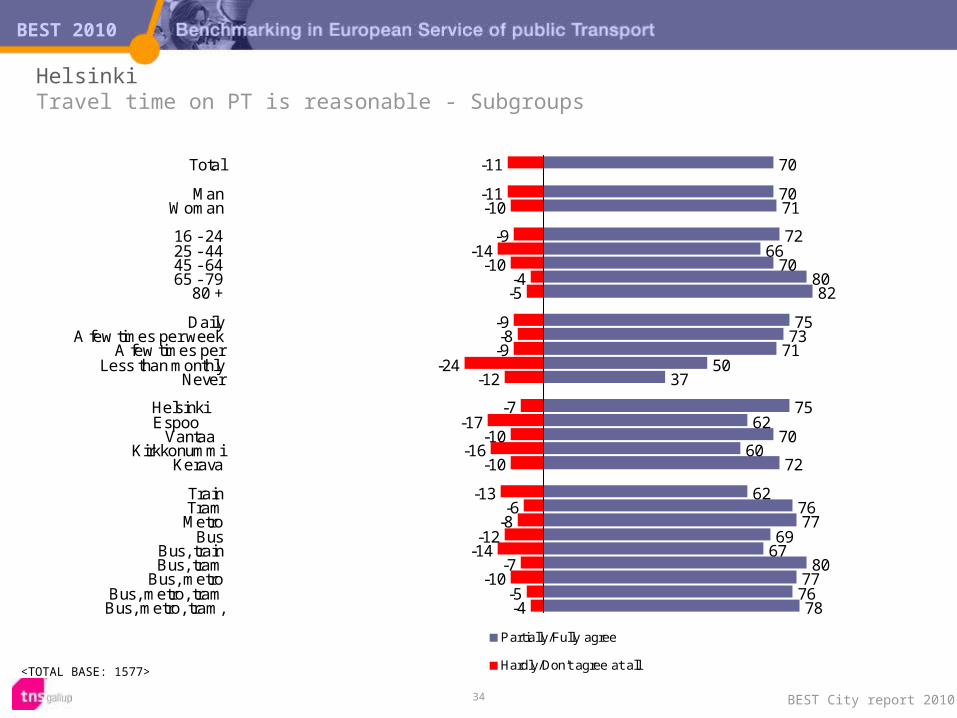
Helsinki Travel time on PT is reasonable - Subgroups
<TOTAL BASE: 1577>
70
7071
7266
708082
7573
7150
37
7562
7060
72
627677
6967
80777678
-11
-11-10
-9-14
-10-4-5
-9-8-9
-24-12
-7-17
-10-16
-10
-13-6
-8-12
-14-7
-10-5-4
Total
ManWoman
16 - 2425 - 4445 - 6465 - 79
80 +
DailyA few times per week
A few times perLess than monthly
Never
Helsinki Espoo
Vantaa Kirkkonummi
Kerava
TrainTramMetro
BusBus, trainBus, tram
Bus, metroBus, metro, tramBus, metro, tram,
Partially/Fully agree
Hardly/Don't agree at all

BEST 2010
BEST City report 201035
Helsinki I am satisfied with the number of departures - Subgroups
<TOTAL BASE: 1561>
50
4852
484850
5757
5455
4632
25
5548
4242
51
4469
5640
4958
5657
70
-14
-13-14
-14-16
-13-9
-10
-13-11
-14-22
-6
-12-14
-19-14-12
-16-7
-11-17-17
-13-12
-6-10
Total
ManWoman
16 - 2425 - 4445 - 6465 - 79
80 +
DailyA few times per week
A few times perLess than monthly
Never
Helsinki Espoo
Vantaa Kirkkonummi
Kerava
TrainTramMetro
BusBus, trainBus, tram
Bus, metroBus, metro, tramBus, metro, tram,
Partially/Fully agree
Hardly/Don't agree at all

BEST 2010
BEST City report 201036
Helsinki Waiting time is short at transfers - Subgroups
<TOTAL BASE: 1488>
63
6462
5660
6475
73
6665
6349
14
7249
5951
65
6279
655859
717171
59
-17
-15-20
-18-19-18
-14-11
-15-17-17
-28-23
-13-24
-19-29
-15
-18-7-8
-19-22
-14-15-13
-16
Total
ManWoman
16 - 2425 - 4445 - 6465 - 79
80 +
DailyA few times per week
A few times perLess than monthly
Never
Helsinki Espoo
Vantaa Kirkkonummi
Kerava
TrainTramMetro
BusBus, trainBus, tram
Bus, metroBus, metro, tramBus, metro, tram,
Partially/Fully agree
Hardly/Don't agree at all

Helsinki 2010
Reliability in subgroups

BEST 2010
BEST City report 201038
Helsinki Reliability - Subgroups
56
5358
4048
6276
80
5361
5756
39
6151
564848
4374
4956
4775
626466
-21
-24-19
-32-26
-17-9
-4
-25-16
-19-23
-28
-17-25
-20-25
-32
-36-8
-17-22
-27-8
-15-12
-15
Total
ManWoman
16 - 2425 - 4445 - 6465 - 79
80 +
DailyA few times per week
A few times perLess than monthly
Never
Helsinki Espoo
Vantaa Kirkkonummi
Kerava
TrainTramMetro
BusBus, trainBus, tram
Bus, metroBus, metro, tramBus, metro, tram,
Partially/Fully agree
Liggende stolpediagram 4Hardly/Don't agree at all

Helsinki 2010
Information in subgroups

BEST 2010
BEST City report 201040
Helsinki Information - Subgroups
46
4448
494445
5160
4850
4241
36
494546
4239
3753
3945
4357
5050
55
-28
-30-26
-21-32
-29-23
-17
-27-25
-30-31
-43
-25-30
-27-31
-35
-35-18
-31-26
-32-17
-25-23-24
Total
ManWoman
16 - 2425 - 4445 - 6465 - 79
80 +
DailyA few times per week
A few times perLess than monthly
Never
Helsinki Espoo
Vantaa Kirkkonummi
Kerava
TrainTramMetro
BusBus, trainBus, tram
Bus, metroBus, metro, tramBus, metro, tram,
Partially/Fully agree
Hardly/Don't agree at all

BEST 2010
BEST City report 201041
Helsinki It is easy to get the information needed when planning a trip - Subgroups
<TOTAL BASE: 1565>
78
7581
8381
7475
90
8377
7471
68
8075
8277
70
6884
637979
8682
8588
-7
-9-6
-5-7
-9-9
-5-7-8
-14-16
-6-9-8-6
-9
-10-6
-10-7-7-5
-9-4-4
Total
ManWoman
16 - 2425 - 4445 - 6465 - 79
80 +
DailyA few times per week
A few times perLess than monthly
Never
Helsinki Espoo
Vantaa Kirkkonummi
Kerava
TrainTramMetro
BusBus, trainBus, tram
Bus, metroBus, metro, tramBus, metro, tram,
Partially/Fully agree
Hardly/Don't agree at all

BEST 2010
BEST City report 201042
Helsinki Information is good when traffic problems occure - Subgroups
<TOTAL BASE: 1463>
24
2325
302123
2732
2628
1717
25
2725
2016
19
1629
222121
3524
2235
-43
-47-40
-33-48-46
-39-33
-41-42
-47-47
-65
-39-45
-42-53-54
-53-26
-46-42
-52-26
-37-37
-44
Total
ManWoman
16 - 2425 - 4445 - 6465 - 79
80 +
DailyA few times per week
A few times perLess than monthly
Never
Helsinki Espoo
Vantaa Kirkkonummi
Kerava
TrainTramMetro
BusBus, trainBus, tram
Bus, metroBus, metro, tramBus, metro, tram,
Partially/Fully agree
Hardly/Don't agree at all

BEST 2010
BEST City report 201043
Helsinki Information is good in stops and terminals - Subgroups
<TOTAL BASE: NNN>
35
3435
3229
3648
56
3443
3231
7
383534
3126
2544
3334
2848
434141
-34
-35-32
-27-41
-34-23
-18
-35-28
-37-35
-53
-31-36-34
-36-44
-45-22
-37-32
-40-22
-31-29
-25
Total
ManWoman
16 - 2425 - 4445 - 6465 - 79
80 +
DailyA few times per week
A few times perLess than monthly
Never
Helsinki Espoo
Vantaa Kirkkonummi
Kerava
TrainTramMetro
BusBus, trainBus, tram
Bus, metroBus, metro, tramBus, metro, tram,
Partially/Fully agree
Hardly/Don't agree at all

Helsinki 2010
Staff behaviour in subgroups

BEST 2010
BEST City report 201045
Helsinki Staff behaviour - Subgroups
59
5859
5953
6167
72
5861
5954
47
565554
6977
6360
5254
6362
5351
54
-12
-12-12
-13-14
-10-12
-14
-12-13
-10-14-15
-13-14-14
-6-6
-9-12-13
-15-9
-11-14
-17-16
Total
ManWoman
16 - 2425 - 4445 - 6465 - 79
80 +
DailyA few times per week
A few times perLess than monthly
Never
Helsinki Espoo
Vantaa Kirkkonummi
Kerava
TrainTramMetro
BusBus, trainBus, tram
Bus, metroBus, metro, tramBus, metro, tram,
Partially/Fully agree
Hardly/Don't agree at all

BEST 2010
BEST City report 201046
Helsinki Staff answers my questions correctly - Subgroups
<TOTAL BASE: 1472>
51
5349
5446
5354
58
505453
4842
4847
4465
72
5850
4745
5651
474446
-15
-14-17
-13-16-14
-18-23
-15-17
-13-18-19
-16-17
-19-8-8
-11-15
-19-17
-11-14
-18-24
-18
Total
ManWoman
16 - 2425 - 4445 - 6465 - 79
80 +
DailyA few times per week
A few times perLess than monthly
Never
Helsinki Espoo
Vantaa Kirkkonummi
Kerava
TrainTramMetro
BusBus, trainBus, tram
Bus, metroBus, metro, tramBus, metro, tram,
Partially/Fully agree
Hardly/Don't agree at all

BEST 2010
BEST City report 201047
Helsinki Staff behaves nicely and correctly - Subgroups
<TOTAL BASE: 1565>
66
6269
6359
6878
83
6768
6560
52
636263
7382
6769
5763
7072
5957
61
-9
-10-8
-13-11
-6-6-6
-10-9-7
-11-11
-10-10-10
-5-4
-8-9-8
-12-6
-8-9-9
-15
Total
ManWoman
16 - 2425 - 4445 - 6465 - 79
80 +
DailyA few times per week
A few times perLess than monthly
Never
Helsinki Espoo
Vantaa Kirkkonummi
Kerava
TrainTramMetro
BusBus, trainBus, tram
Bus, metroBus, metro, tramBus, metro, tram,
Partially/Fully agree
Hardly/Don't agree at all
Helsinki 2010
Security and safety in subgroups

BEST 2010
BEST City report 201049
Helsinki Security and safety - Subgroups
76
8074
807575
8369
7878
747070
7872
767676
7380
7474
7882
797776
-8
-7-9
-7-10
-7-7-8
-7-6
-9-11
-17
-7-11
-7-6
-9
-9-8-6
-9-6-6-6
-9-5
Total
ManWoman
16 - 2425 - 4445 - 6465 - 79
80 +
DailyA few times per week
A few times perLess than monthly
Never
Helsinki Espoo
Vantaa Kirkkonummi
Kerava
TrainTramMetro
BusBus, trainBus, tram
Bus, metroBus, metro, tramBus, metro, tram,
Partially/Fully agree
Hardly/Don't agree at all

BEST 2010
BEST City report 201050
Helsinki I feel secure at stations and bus stops - Subgroups
<TOTAL BASE: 1583>
69
7465
7269
6575
59
7270
6663
60
7361
716766
6075
7169
6776
7473
69
-10
-8-12
-10-11
-9-11
-15
-9-7
-12-13
-20
-8-15
-8-7
-14
-12-11
-6-10
-9-8-6
-10-7
Total
ManWoman
16 - 2425 - 4445 - 6465 - 79
80 +
DailyA few times per week
A few times perLess than monthly
Never
Helsinki Espoo
Vantaa Kirkkonummi
Kerava
TrainTramMetro
BusBus, trainBus, tram
Bus, metroBus, metro, tramBus, metro, tram,
Partially/Fully agree
Hardly/Don't agree at all

BEST 2010
BEST City report 201051
Helsinki I feel secure on board busses and trains - Subgroups
<TOTAL BASE: 1583>
74
7871
777273
8162
7678
7168
66
757274
7772
6978
6473
7879
767273
-9
-7-10
-8-11
-7-9
-4
-8-5
-11-13
-22
-8-11
-8-8
-10
-10-8
-4-10
-5-8-8
-10-5
Total
ManWoman
16 - 2425 - 4445 - 6465 - 79
80 +
DailyA few times per week
A few times perLess than monthly
Never
Helsinki Espoo
Vantaa Kirkkonummi
Kerava
TrainTramMetro
BusBus, trainBus, tram
Bus, metroBus, metro, tramBus, metro, tram,
Partially/Fully agree
Hardly/Don't agree at all

BEST 2010
BEST City report 201052
Helsinki I am not afraid of traffic accidents when using PT - Subgroups
<TOTAL BASE: 1585>
86
8785
9083
8693
87
888786
8084
87858484
90
898786
8089
9289
8487
-5
-5-5
-3-8
-4-2
-6
-5-6-4
-6-10
-4-7-6
-3-3
-4-4
-9-6-4-3-4
-6-5
Total
ManWoman
16 - 2425 - 4445 - 6465 - 79
80 +
DailyA few times per week
A few times perLess than monthly
Never
Helsinki Espoo
Vantaa Kirkkonummi
Kerava
TrainTramMetro
BusBus, trainBus, tram
Bus, metroBus, metro, tramBus, metro, tram,
Partially/Fully agree
Hardly/Don't agree at all

Helsinki 2010
Comfort in subgroups

BEST 2010
BEST City report 201054
Helsinki Comfort - Subgroups
62
6162
6157
6373
81
6463
6153
42
65585857
63
5772
576160
7163
6667
-11
-10-12
-10-14
-10-8-9
-11-10-10
-17-17
-10-12-12-13
-10
-12-8
-11-12-12
-9-11-11
-9
Total
ManWoman
16 - 2425 - 4445 - 6465 - 79
80 +
DailyA few times per week
A few times perLess than monthly
Never
Helsinki Espoo
Vantaa Kirkkonummi
Kerava
TrainTramMetro
BusBus, trainBus, tram
Bus, metroBus, metro, tramBus, metro, tram,
Partially/Fully agree
Hardly/Don't agree at all
BEST 2010
BEST City report 201055
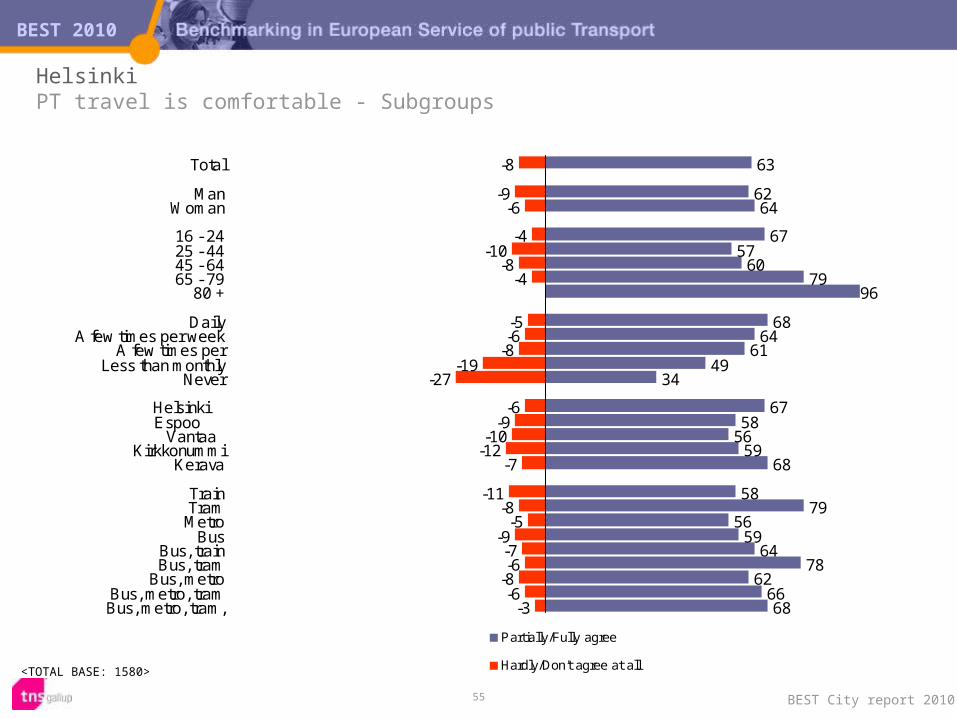
Helsinki PT travel is comfortable - Subgroups
<TOTAL BASE: 1580>
63
6264
6757
6079
96
6864
6149
34
6758
5659
68
5879
5659
6478
626668
-8
-9-6
-4-10
-8-4
-5-6
-8-19
-27
-6-9
-10-12
-7
-11-8
-5-9-7-6
-8-6
-3
Total
ManWoman
16 - 2425 - 4445 - 6465 - 79
80 +
DailyA few times per week
A few times perLess than monthly
Never
Helsinki Espoo
Vantaa Kirkkonummi
Kerava
TrainTramMetro
BusBus, trainBus, tram
Bus, metroBus, metro, tramBus, metro, tram,
Partially/Fully agree
Hardly/Don't agree at all

BEST 2010
BEST City report 201056
Helsinki Transfers are easy - Subgroups
<TOTAL BASE: 1512>
60
5762
6153
607274
6962
5037
31
6854
5050
54
5170
7354
5275
6472
68
-10
-10-10
-8-13
-9-7
-9
-7-9
-11-22
-6
-7-11-12
-14-11
-12-4
-6-12-13
-7-12
-6-4
Total
ManWoman
16 - 2425 - 4445 - 6465 - 79
80 +
DailyA few times per week
A few times perLess than monthly
Never
Helsinki Espoo
Vantaa Kirkkonummi
Kerava
TrainTramMetro
BusBus, trainBus, tram
Bus, metroBus, metro, tramBus, metro, tram,
Partially/Fully agree
Hardly/Don't agree at all

BEST 2010
BEST City report 201057
Helsinki Busses and trains are modern - Subgroups
<TOTAL BASE: 1590>
66
6468
6761
6875
71
6666
7260
46
6966
6256
72
6174
6168
6469
6574
77
-9
-9-8
-9-11
-8-5
-9
-10-8
-5-12-11
-10-6
-9-12
-5
-10-6
-13-9-9-8-8-7-7
Total
ManWoman
16 - 2425 - 4445 - 6465 - 79
80 +
DailyA few times per week
A few times perLess than monthly
Never
Helsinki Espoo
Vantaa Kirkkonummi
Kerava
TrainTramMetro
BusBus, trainBus, tram
Bus, metroBus, metro, tramBus, metro, tram,
Partially/Fully agree
Hardly/Don't agree at all

BEST 2010
BEST City report 201058
Helsinki Busses and trains are clean - Subgroups
<TOTAL BASE: 1581>
40
4634
3335
4349
71
384142
4026
4235
3938
42
3947
263938
4842
3540
-24
-19-27
-27-27
-22-18-17
-26-20-20
-25-38
-22-28
-25-25
-19
-22-16
-27-24-25
-21-22
-31-27
Total
ManWoman
16 - 2425 - 4445 - 6465 - 79
80 +
DailyA few times per week
A few times perLess than monthly
Never
Helsinki Espoo
Vantaa Kirkkonummi
Kerava
TrainTramMetro
BusBus, trainBus, tram
Bus, metroBus, metro, tramBus, metro, tram,
Partially/Fully agree
Hardly/Don't agree at all

BEST 2010
BEST City report 201059
Helsinki I normally get a seat when travel with PT - Subgroups
<TOTAL BASE: 1579>
81
7883
797980
8991
81818079
71
8275
8581
79
7392
6785
8386
808180
-5
-5-6
-3-7-5-3
-9
-6-5-4
-6-5
-5-6-4-4
-7
-5-4-5-4-4
-6-3
-6-2
Total
ManWoman
16 - 2425 - 4445 - 6465 - 79
80 +
DailyA few times per week
A few times perLess than monthly
Never
Helsinki Espoo
Vantaa Kirkkonummi
Kerava
TrainTramMetro
BusBus, trainBus, tram
Bus, metroBus, metro, tramBus, metro, tram,
Partially/Fully agree
Hardly/Don't agree at all

Helsinki 2010
Social image in subgroups

BEST 2010
BEST City report 201061
Helsinki Social image - Subgroups
87
8490
8984
8791
89
9088
847981
8885858786
8493
8184
879191
9486
-3
-5-2
-2-4-4-2-1
-2-3-4
-7-9
-3-4-4-4-3
-6-1
-4-4-3-2-1-2-3
Total
ManWoman
16 - 2425 - 4445 - 6465 - 79
80 +
DailyA few times per week
A few times perLess than monthly
Never
Helsinki Espoo
Vantaa Kirkkonummi
Kerava
TrainTramMetro
BusBus, trainBus, tram
Bus, metroBus, metro, tramBus, metro, tram,
Partially/Fully agree
Hardly/Don't agree at all

BEST 2010
BEST City report 201062
Helsinki More people will travel with PT in the future - Subgroups
<TOTAL BASE: 1561>
75
7377
8070
768080
8178
6962
68
7971707273
7484
667172
8383
9172
-5
-6-5
-4-6-6-4
-3-4
-6-11
-23
-5-5
-7-8
-5
-7-4
-6-6-6
-3-4-2-3
Total
ManWoman
16 - 2425 - 4445 - 6465 - 79
80 +
DailyA few times per week
A few times perLess than monthly
Never
Helsinki Espoo
Vantaa Kirkkonummi
Kerava
TrainTramMetro
BusBus, trainBus, tram
Bus, metroBus, metro, tramBus, metro, tram,
Partially/Fully agree
Hardly/Don't agree at all

BEST 2010
BEST City report 201063
Helsinki PT is good for the environment - Subgroups
<TOTAL BASE: 1594>
92
8796
929191
9792
958991
8691
9291929393
8898
8790
93939794
92
-3
-6-1
-2-4-3-2
-4
-1-6-4
-6-5
-3-5-3-4-2
-7
-1-4-2-3-1
-3-6
Total
ManWoman
16 - 2425 - 4445 - 6465 - 79
80 +
DailyA few times per week
A few times perLess than monthly
Never
Helsinki Espoo
Vantaa Kirkkonummi
Kerava
TrainTramMetro
BusBus, trainBus, tram
Bus, metroBus, metro, tramBus, metro, tram,
Partially/Fully agree
Hardly/Don't agree at all

BEST 2010
BEST City report 201064
Helsinki PT is beneficial to society - Subgroups
<TOTAL BASE: 1591>
93
9096
9492939794
9596
9288
83
94939295
92
9198
9091
9596
939694
-1
-3
-2-2-1
-1-3-4
-2-1-1-1-1
-4
-5-2-1-1
Total
ManWoman
16 - 2425 - 4445 - 6465 - 79
80 +
DailyA few times per week
A few times perLess than monthly
Never
Helsinki Espoo
Vantaa Kirkkonummi
Kerava
TrainTramMetro
BusBus, trainBus, tram
Bus, metroBus, metro, tramBus, metro, tram,
Partially/Fully agree
Hardly/Don't agree at all

Helsinki 2010
Value for money in subgroups

BEST 2010
BEST City report 201066
Helsinki Value for money - Subgroups
51
4854
4248
5364
72
565049
4238
6242
364646
4575
544646
6950
5454
-24
-26-22
-29-25-23
-17-11
-20-24-25
-35-30
-16-30
-33-29-29
-28-11
-23-26
-29-12
-25-16
-23
Total
ManWoman
16 - 2425 - 4445 - 6465 - 79
80 +
DailyA few times per week
A few times perLess than monthly
Never
Helsinki Espoo
Vantaa Kirkkonummi
Kerava
TrainTramMetro
BusBus, trainBus, tram
Bus, metroBus, metro, tramBus, metro, tram,
Partially/Fully agree
Hardly/Don't agree at all

BEST 2010
BEST City report 201067
Helsinki PT gives good value for money - Subgroups
<TOTAL BASE: 1579>
61
5664
5556
6273
82
6760
5648
46
7351
445454
5283
595556
7859
6866
-15
-17-13
-14-17-15
-11-9
-10-15
-17-28
-23
-9-19
-22-19-20
-19-7
-13-15
-19-6
-14-8
-18
Total
ManWoman
16 - 2425 - 4445 - 6465 - 79
80 +
DailyA few times per week
A few times perLess than monthly
Never
Helsinki Espoo
Vantaa Kirkkonummi
Kerava
TrainTramMetro
BusBus, trainBus, tram
Bus, metroBus, metro, tramBus, metro, tram,
Partially/Fully agree
Hardly/Don't agree at all

BEST 2010
BEST City report 201068
Helsinki PT fares are reasonable - Subgroups
<TOTAL BASE: 1577>
42
3944
2840
4454
62
454042
3630
5234
273837
3766
483736
6042
4041
-33
-35-31
-45-33-31
-23-13
-30-33-33
-42-38
-24-40
-44-39-38
-37-14
-33-37
-39-18
-37-24
-29
Total
ManWoman
16 - 2425 - 4445 - 6465 - 79
80 +
DailyA few times per week
A few times perLess than monthly
Never
Helsinki Espoo
Vantaa Kirkkonummi
Kerava
TrainTramMetro
BusBus, trainBus, tram
Bus, metroBus, metro, tramBus, metro, tram,
Partially/Fully agree
Hardly/Don't agree at all

Helsinki 2010
Loyalty in subgroups

BEST 2010
BEST City report 201070
Helsinki Loyalty - Subgroups
80
7584
8074
819091
8980
7456
71
8771
7577
72
678890
7774
9184
9185
-6
-7-4
-3-8-6
-3-3
-3-4
-7-13
-19
-4-6
-8-6
-10
-12-4
-6-6-5
-2-4-4-4
Total
ManWoman
16 - 2425 - 4445 - 6465 - 79
80 +
DailyA few times per week
A few times perLess than monthly
Never
Helsinki Espoo
Vantaa Kirkkonummi
Kerava
TrainTramMetro
BusBus, trainBus, tram
Bus, metroBus, metro, tramBus, metro, tram,
Partially/Fully agree
Hardly/Don't agree at all

Helsinki 2010
Background information

BEST 2010
BEST City report 201072
Public transport travel frequency – Helsinki 2010
44
37
49
69
44
40
24
37
44
56
76
25
37
24
22
21
17
19
20
37
38
15
22
17
35
31
20
25
17
8
21
25
26
19
24
8
4
27
20
11
14
11
5
15
14
11
7
15
13
2
12
11
1
2
1
1
1
2
1
2
1
1
1
1
Total
Man
Woman
16 - 24
25 - 44
45 - 64
65 - 79
80 +
Working, fulltime
Working part time
Student
Retired
Others
Daily
A few times per week
A few times per month
Less than monthly
Never

BEST 2010
BEST City report 201073
Life situation – Helsinki 2010
53
57
50
29
76
62
4
54
38
60
65
70
5
4
6
2
6
6
1
6
5
2
5
4
14
13
11
63
6
21
10
2
8
21
21
25
25
95
100
13
37
29
22
14
7
5
8
6
10
6
1
6
10
7
6
5
Total
Man
Woman
16 - 24
25 - 44
45 - 64
65 - 79
80 +
Daily
A few times per week
A few times per month
Less than monthly
Never
Working, fulltime
Working part time
Student
Retired
Others

For more information and other reports see our web site http://best2005.net or https://report.scandinfo.se/best/