better data, better business: the top 5 recruitment kpis · the top 5 recruitment kpis ......
TRANSCRIPT

BETTER DATA, BETTER BUSINESS: THE TOP 5 RECRUITMENT KPIs
COPYRIGHT © 2012, BULLHORN + INSIGHTSQUARED, ALL RIGHTS RESERVED.
Jointly written by:

1 ComputerWorld, 7/6/11. From March 2010 Forrester report. 921 North American & European IT software decision-makers surveyed. Organizations with up to 999 employees2 BusinessWire via MarketWatch, 12/6/11. From a Nucleus Research analytics study
2
Companies today are increasingly competing in a data-centric world. “Big Data,” meaning the ability to digest large amounts of data from various sources, was a very hot topic in 2011 and will be again in 2012. Yet only 21% of small & midsized businesses have deployed Business Intelligence (BI) technology, according to a recent Forrester report1.
This means that there is a large opportunity for your business to leap-frog the competition by making data intelligence a priority. In fact, a Nucleus Research study in 2011 showed that business analytics applications returned $10.66 for every dollar spent2. Yes, that’s a ten-fold revenue benefit by employing analytics to drive your business.
So how can your recruiting or staffing company start reaping the benefits of a data-centric business?
Tracking key performance indicators (KPIs) in your business is a great place to start. Most companies know that they need to measure KPIs, but determining which ones are most meaningful can often be a difficult task.
Staffing and recruiting KPIs are particularly challenging, as there are so many potential data points that can be measured. Some firms track emails sent obsessively, while others track placements as the end-all-be-all metric, and still others only focus on revenue. And some…don’t quite know what to track, so they track everything or nothing at all.
If each company could track only five KPIs, what would they be? Here are the five KPI’s that work best for staffing and recruiting firms.
1. Data Quality Score2. Activity Conversion Ratios3. Percent of “Actionable” Goal4. Expected Value of Pipeline5. Employee Value
Understanding these five KPIs and knowing how to apply them will get your business focused on the data that will boost your revenue and profitability.
1. Data Quality Score
Why It Matters: You can’t run a business analytically unless you have high
quality data. Making data quality a KPI will ensure that the building blocks for
any trending, modeling and calculations will be correct.
What To Do: Calculate your data quality score and see how “clean” your
data is. If your score is below 90%, make correcting data errors a priority
for your company.

Incorrect data is worse for your business than no data at all because it can lead you to depend on false conclusions. So, your first priority should be to make sure your data is clean and stays that way. Most of the data that a staffing firm relies upon has a single major flaw — it is almost always entered by human hands. Once you add a human element to the data entry process it is subject to two failure points that can drive your data quality down.
• Typos: Wrong data, wrong field, one too many zeros.
• Null Value Fields: Not all fields are filled in. Perhaps it is due tounavailable information, or because the field is overlooked or simply because our inclination is to fill in the least number of fields possible.
Data quality starts at the Job Order. Monetary values, like placement value, are connected to the Job Order, which makes it a useful metric for measuring your data quality score: the percent of Job Orders with correct data.
What is a good Data Quality Score? It depends on where you are in your life cycle of implementing data quality metrics. Most staffing & recruiting firms are under 50% quality score when they start, which
means fewer than 50% of the Job Orders (and other data entry fields) have all of the required data points correctly filled in. Once your business takes on the initiative to track data quality in Job Orders, you’ll see rapid improvement — most staffing businesses achieve 70% by the end of the third month. As data quality becomes ingrained in the business culture it’s not uncommon to see top performing companies above 90%.
When it comes to your business, though, even a 90% Score can be low. A near 100% Data Quality Score is possible and achievable to provide you with greater confidence in your data-driven decisions.
3
A data quality trend graph like the one above, tracked over the past 90 days, will help your employees stay on top of errors and give management the high-level view to see whether there has been a recent spike in poor data quality which could lead to bad business decisions.
Data Quality Score Defined
Data Quality Score = (# Job Orders with clean data) trailing 90 days
(Total # Job Orders) trailing 90 days
Data Quality Score can be calculated for any date range but is most useful when done on a rolling date window, for example all Job Orders created in the last 90 days. The rolling window indicates whether your data is getting better or worse over time.

4
2. Activity Conversion Ratios
Why It Matters: Tracking the ratios between certain key activities can tell you
the quality of your efforts. Peaks and valleys in activity ratio trends can indicate
wasted effort toward a goal.
What To Do: Ratios are easily calculated with simple division. However, the
more challenging part is choosing which ratios to track and how to group ratios
to certain time frames with a process called cohorting.
Activity Ratios Defined
Activity Ratios = (# of Activity A) / (# of Activity B), cohorted by Job Order
Cohorting means the grouping by a particularly defined set.
In this section’s example, the activities were grouped by the job order the activities were done upon. It tells a business “what was the quality of activity on job orders created last month?”
Conversely, a non-cohorted ratio does not group the activity in the same way. A non-cohorted ratio answers the question “what was the quality of activity done last week?” even if the sendout and interviews in the ratio were on two different job orders. Non-cohorted ratios are useful for short-term analysis, to track activity for recruiting teams; cohorted ratios are useful for long-term analysis, and are great for sales-centric analysis.
Tracking the quantity of submissions or sendouts on a job order will tell you how much activity is happening, but often the quality is overlooked.Quality matters. For example, a rookie recruiter may be doing more than enough activity (such as emails, phone calls, interviews) but ultimately not closing any placements.
How does a business measure activity quality? The Activity Conversion Ratio is instrumental to knowing the direction of your business. Knowing how many times one activity is done compared to another shows you if there is a large disparity in effort to conversions.
Once you calculate your activity ratios, you can trend them over a period of time to see whether you are becoming more or less efficient in your conversion process. If you are trending lower, then you know you are on the right track and your process is becoming more efficient. As the ratios increase, quality is suffering at the expense of quantity.

5
In this trend graph of activity ratios over a quarter, interview to placement peaked at 20:1 and has trended downward into December.
Knowing how to calculate an activity ratio is important, but the business needs to narrow down which ratios to track as well. Determining which activity ratios best describe how efficiently your employees are closing conversions is generally fairly simple. Consider both the sales and recruiting side of the business and choose no more than three ratios for each.
The three to ideally track for the recruiters are:
• Submission to Sendout• Sendout to Interview• Interview to Placement
Tracking these ratio trends should show you the direction of your efficiency.
Three metrics to ideally track for your sales team are:
• Calls to client meeting• Client meetings to Jobs• Sendout to Placement
Once your business determines a) what activity ratios to track, and b) how to calculate these ratios, you will have a powerful KPI to measure the health of your company. The first time you calculate these ratios, let them establish your baseline. Your business efforts moving forward should strive to improve upon this baseline.

Percent of Goal is a standard metric of success in every industry. Without it, there is no reliable way to track individual and team performance against expectations and no standardized way to measure performance over time. The key is choosing the most “actionable” goal that your employees can use as a real-world benchmark.
Here is an example scenario:
It takes ACME Recruiters 8 sendouts (or client submissions) to generate 3 interviews, and 3 interviews for every one placement. If the ultimate goal is 4 placements per recruiter per month, then working backwards:
4 placements * 3 interviews = 12 interviews12 interviews * 8 sendouts = 96 sendouts
ACME is paying commission on the 4 placements, so that goal is clear in everyone’s mind. However, to focus their team on behavior that leads to the desired end result, ACME should consider making
the 96 sendouts the actionable goal to work toward. The goal of 96 sendouts is also called a leading indicator.
If ACME finds that they are not hitting the leading indicator goals, they can presume that they will also miss their ultimate goal of 4 placements as well. As the business tracks, for example, how the sendouts trend across a month, it can make early adjustments to improve the chances of hitting its goals.
Over the course of the designated calendar period, individuals and the team should move closer to 100% of goal. Leading indicator goals are more directly controllable by employees and thus they feel able to hit their goals if they put in direct effort.
6
3. Percent of “Actionable” Goal (aka Leading Indicator Goal)
Why It Matters: There are many goals a company can track, but it is
important to only track the goals that an employee can take action upon.
For example, placements are the desired goal, but the actionable goal that
leads to placements would be sendouts. Once the actionable goals are
determined, the business can focus on these to drive the right activity.
What To Do: Determine what actionable goals are the leading indicators of
desired goals. Once you know the historical activity ratios of actionable goals to
desired goals, you can calculate where to set actionable goals for each employee.
Percent of Actionable Goal Defined
To calculate this KPI:
Percent of Goal = (actual quantity) / (goal quantity), in calendar period
7
4. Expected Value (EV) of Pipeline
Why It Matters: Sales timelines can often be lengthy. The Expected Value
of Pipeline can help you forecast the revenue that is expected to come in
months down the line so you can better project the direction of your business.
What To Do: Calculate 1) the potential value of filling all open job orders,
2) the likelihood of doing so, then multiply them together. The second part,
called Fill Probability, can be a complicated metric to determine but is well
worth the effort.
It’s always important to know where and when your next piece of revenue is coming from, especially if your sales timeline is lengthy. Understanding and using the Expected Value of Pipeline will give you new insight into forecasting that goes above and beyond simply weighting the probability of close and adding up the resulting deal value.
Your business should have a good idea of what your Expected Pipeline Value is in the coming months, and turning this into a KPI can give your business an edge. In staffing and recruiting, measuring your expected pipeline value combines the two biggest drivers of your financial performance:
1) the potential value of filling all openJob Orders, and
2) the likelihood of doing so.
Many firms only measure the first part, but this is not a true reflection of the health of the
business. Taking into account that some Job Orders have a higher and lower probability of closing will change the perception of the health of your revenue pipeline.
There are many factors that impact fill probability, the most significant predictors being the close rate and age of the Job Order. If historically, the business fills 30% of Job Orders, that implies there is a 30% close rate for Job Orders. Likewise, if the sales cycle is typically 30-45 days and a Job Order is 60 days old, then the fill probability is lower due to the age of the order.
Fill probability can be estimated with varying levels of sophistication, and there are advanced algorithms that can address many factors. Some example factors to include are:
• Average close rate of theassigned salesperson
• Average close rate of that
client’s previous job orders• Age of the job order• Stage of the job order• Recent activity on the job order
(Note: There are always exceptions. There may be a very good reason that a placement has been open for 60 days, but in aggregate, this formula is an accurate model for your pipeline.)
If you run through this exercise on a regular basis and track the expected value of your pipeline, you will know which direction the value of your pipeline is trending (a huge asset in of itself) and have greater visibility into the future of your business.
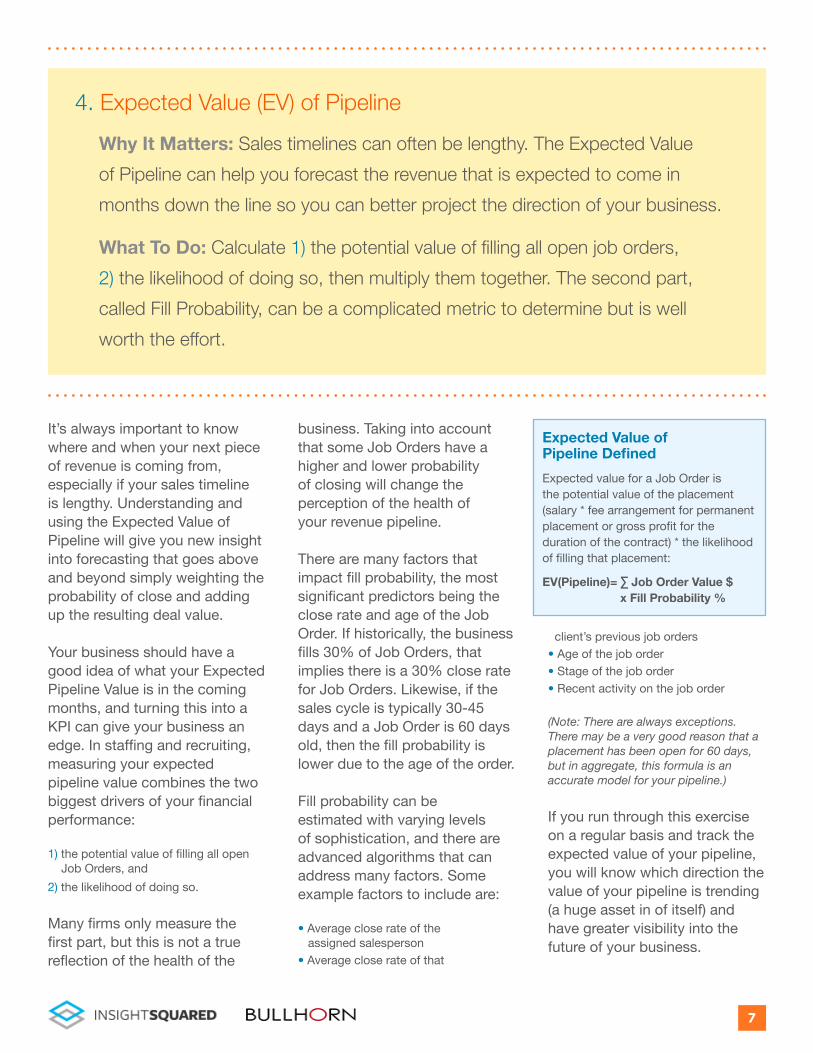
Expected Value of Pipeline Defined
Expected value for a Job Order is the potential value of the placement (salary * fee arrangement for permanent placement or gross profit for the duration of the contract) * the likelihood of filling that placement:
EV(Pipeline)= ∑ Job Order Value $ x Fill Probability %

Measuring your sales team by dollars sold is a standard and effective metric for all businesses. This is a no-nonsense, bottom line metric that quantifies the productivity for each sales person, and the health of your pipeline when taken in aggregate.
However, the dollar value of a placement is also an excellent way to track recruiter performance. Let’s examine how.
If your business allocates, for example, 50% of the value generated by each placement to the recruiter, you will be able to track how much value is added to your business by any employee in the company, not just Sales. Thus, your employee dashboard should show, at a glance, the annualized bookings of each recruiter.
Employee Dashboard that tracks average annualized value produced by each employee.
The trailing 12-month window gives you an annual value for easy comparison against each employee’s salary, but without having to wait for a year-end calculation.
For rookie employees, who have little history to draw from, create an apples-to-apples comparison by annualizing their value. For example, if an
employee has only worked for 9 months, create an annualized 12-month score by multiplying their placement value by 12/9ths.
The weight of Employee Monetary Values on the action items in your business will vary greatly depending on how each company hires and manages their team, but there are a couple standard industry benchmarks to measure against:
• Most estimated monetary values are at 2 - 5x salary ofthe employee;
• Estimated monetary values of $160K - $200K for bothsales and recruiter is not uncommon in the industry.
Knowing how well each employee is doing is key to your business, but how do many businesses really employ this metric as a KPI? Keeping track of the employee monetary value of an employee is a pulse on your business as a whole, informing you of stumbling blocks in landing placements or that hiring needs to change.
8
5. Employee Value (in Dollars)
Why It Matters: The annualized booking revenue of a recruiter is a good way
to measure individual employee performance. This informs you of necessary
changes to goals, how rookies compare to veterans, and serves as a pulse on
the health of your employees as a whole.
What To Do: Keep a running employee dashboard with booking revenue
trailing 12 months. Attributing split revenue will depend on individual companies.
There are industry averages to use as benchmarks.
Employee Value Defined
To calculate this KPI:
Employee Monetary Value = Sum of (attributed placement splits), trailing 12 months

9
Next steps: Like any company with a lot of moving pieces, recruiting & staffing companies generate a lot of data. Understanding and using these 5 KPIs will help you best focus on what will move the needle the most to generate revenue more efficiently and to run your business with greater insight.Capturing the necessary data and creating & maintaining the right reports to use these KPIs isn’t easy without the right investment in technology.
To make the most of these KPIs you need a great applicant tracking system to ensure that your workflow and process can be easily managed and followed, as that lays the foundation for data quality, combined with analytics technology to make these KPIs easy to see and act upon.
Adding InsightSquared to your ATS and CRM can quickly provide these KPIs and additional analytics, to help you get the most out of Bullhorn. InsightSquared for Bullhorn:
• Scrubs your data automatically, notifying you of any data entry errors to help keep your data quality at 100%.• Automatically tracks the actionable goals important to recruiters and salespeople: Job Orders, Internal Submissions,
Sendouts, Interviews, and Placements.• Displays activity ratios at the click of a button.• Shows expected value of pipeline over time, by client, or by employee. And advanced filtering options show Job Orders
by client, by team, or contract versus permanent.• Provides daily email summaries of employee activity, and an online employee dashboard, that aggregates important stats
and activities.

About InsightSquared
InsightSquared is the #1 Salesforce Analytics product for small and midsize businesses (SMB). Unlike legacy business intelligence platforms, InsightSquared can be deployed affordably in less than a day without any integration costs and comes preloaded with reports that real business people can use. Hundreds of companies and thousands of users around the world use InsightSquared’s award-winning analytics to maximize sales performance, increase team productivity and close more deals. Based in Cambridge, Mass., InsightSquared was recently named one of the “Best Places to Work in Massachusetts” by the Boston Business Journal. For more information, visit www.insightsquared.com.
#1 for Staffing Analytics
10 Must-Ask Performance Questions for Staffing and Recruiting
To download a free copy of any of InsightSquared’s ebooks, visit http://www.insightsquared.com/resources/e-books.